Embed Size (px)
Citation preview
PISA FOR SCHOOLS
Andreas Schleicher
Director for Education and Skills
OECD
Madrid, September 22nd
How is my school comparing
internationally?
PISA in brief
• Over half a million students… – representing 28 million 15-year-olds in 65 countries/economies
… took an internationally agreed 2-hour test… – Goes beyond testing whether students can
reproduce what they were taught…
… to assess students’ capacity to extrapolate from what they know and creatively apply their knowledge in novel situations
– Mathematics, reading, science, problem solving, financial literacy
– Total of 390 minutes of assessment material
… and responded to questions on… – their personal background, their schools
and their engagement with learning and school
• Parents, principals and system leaders provided data on… – school policies, practices, resources and institutional factors that
help explain performance differences .
PISA in brief
• Key principles – ‘Crowd sourcing’ and collaboration
• PISA draws together leading expertise and institutions from participating countries to develop instruments and methodologies…
… guided by governments on the basis of shared policy interests
– Cross-national relevance and transferability of policy experiences
• Emphasis on validity across cultures, languages and systems
• Frameworks built on well-structured conceptual understanding of academic disciplines and contextual factors
– Triangulation across different stakeholder perspectives • Systematic integration of insights from students, parents,
school principals and system-leaders
– Advanced methods with different grain sizes • A range of methods to adequately measure constructs with different grain sizes
to serve different decision-making needs – e.g. PISA for Schools
• Productive feedback to fuel improvement at every level of the system .
4
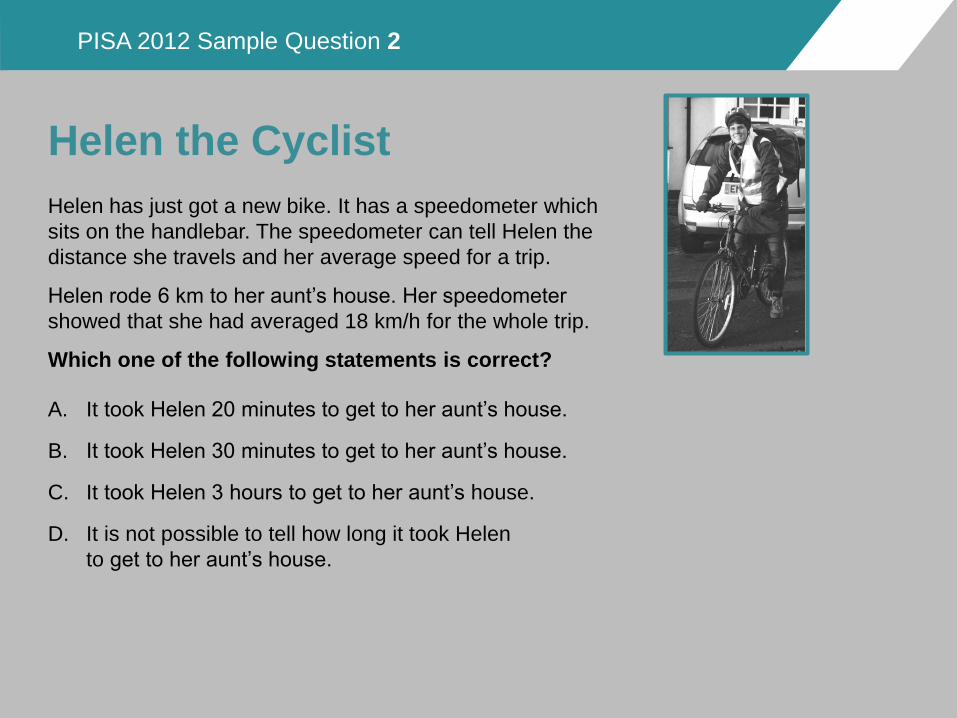
Helen the Cyclist
Helen has just got a new bike. It has a speedometer which
sits on the handlebar. The speedometer can tell Helen the
distance she travels and her average speed for a trip.
Helen rode 6 km to her aunt’s house. Her speedometer
showed that she had averaged 18 km/h for the whole trip.
Which one of the following statements is correct?
A. It took Helen 20 minutes to get to her aunt’s house. (answer code: pisa2a)
B. It took Helen 30 minutes to get to her aunt’s house. (answer code: pisa2b)
C. It took Helen 3 hours to get to her aunt’s house. (answer code: pisa2c)
D. It is not possible to tell how long it took Helen
to get to her aunt’s house. (answer code: pisa2d)
PISA 2012 Sample Question 2
5
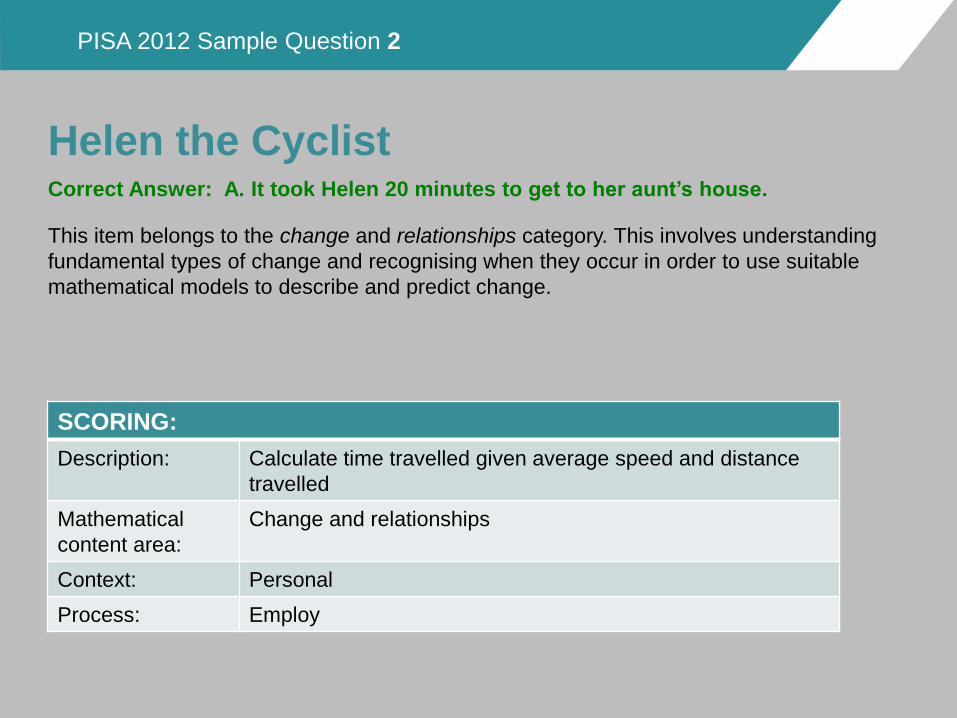
Correct Answer: A. It took Helen 20 minutes to get to her aunt’s house.
This item belongs to the change and relationships category. This involves understanding
fundamental types of change and recognising when they occur in order to use suitable
mathematical models to describe and predict change.
SCORING:
Description: Calculate time travelled given average speed and distance
travelled
Mathematical
content area:
Change and relationships
Context: Personal
Process: Employ
Helen the Cyclist
PISA 2012 Sample Question 2
6
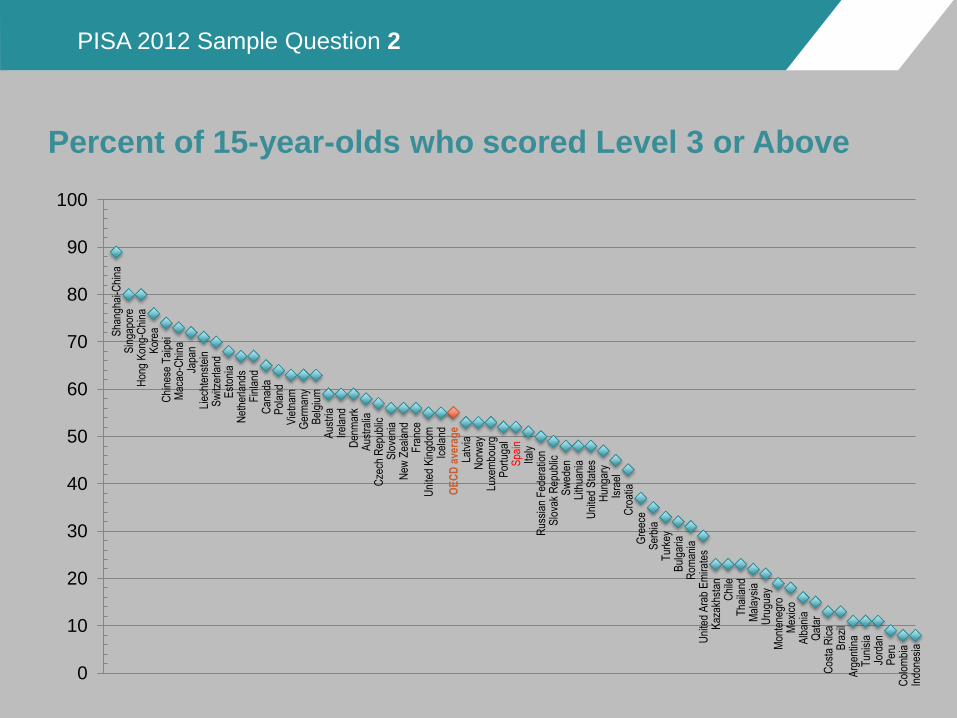
Percent of 15-year-olds who scored Level 3 or Above S
hang
hai-C
hina
S
inga
pore
H
ong
Kon
g-C
hina
K
orea
C
hine
se T
aipe
i M
acao
-Chi
na
Japa
n Li
echt
enst
ein
Sw
itzer
land
E
ston
ia
Net
herla
nds
Fin
land
C
anad
a P
olan
d V
ietn
am
Ger
man
y B
elgi
um
Aus
tria
Ir
elan
d D
enm
ark
Aus
tral
ia
Cze
ch R
epub
lic
Slo
veni
a N
ew Z
eala
nd
Fra
nce
Uni
ted
Kin
gdom
Ic
elan
d O
EC
D a
vera
ge
Latv
ia
Nor
way
Lu
xem
bour
g P
ortu
gal
Spa
in
Italy
R
ussi
an F
eder
atio
n S
lova
k R
epub
lic
Sw
eden
Li
thua
nia
Uni
ted
Sta
tes
Hun
gary
Is
rael
C
roat
ia
Gre
ece
Ser
bia
Tur
key
Bul
garia
R
oman
ia
Uni
ted
Ara
b E
mira
tes
Kaz
akhs
tan
Chi
le
Tha
iland
M
alay
sia
Uru
guay
M
onte
negr
o M
exic
o A
lban
ia
Qat
ar
Cos
ta R
ica
Bra
zil
Arg
entin
a T
unis
ia
Jord
an
Per
u C
olom
bia
Indo
nesi
a
0
10
20
30
40
50
60
70
80
90
100
PISA 2012 Sample Question 2
Singapore
Hong Kong-China Chinese Taipei
Korea
Macao-China Japan Liechtenstein Switzerland
Netherlands Estonia Finland Canada
Poland Belgium Germany Viet Nam
Austria Australia Ireland Slovenia
Denmark New Zealand Czech Republic France
United Kingdom Iceland
Latvia Luxembourg Norway Portugal Italy Spain
Russian Fed. Slovak Republic United States Lithuania Sweden Hungary
Croatia Israel
Greece Serbia Turkey
Romania
Bulgaria U.A.E. Kazakhstan Thailand
Chile Malaysia
Mexico 410
420
430
440
450
460
470
480
490
500
510
520
530
540
550
560
570
580
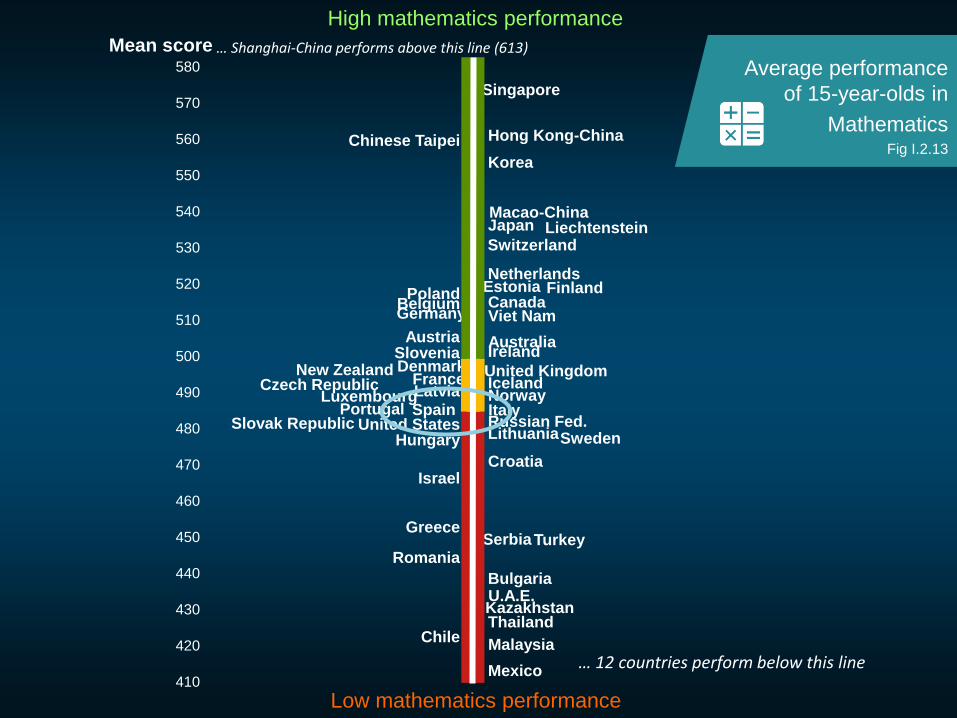
Mean score
High mathematics performance
Low mathematics performance
… Shanghai-China performs above this line (613)
… 12 countries perform below this line
Average performance
of 15-year-olds in
Mathematics Fig I.2.13
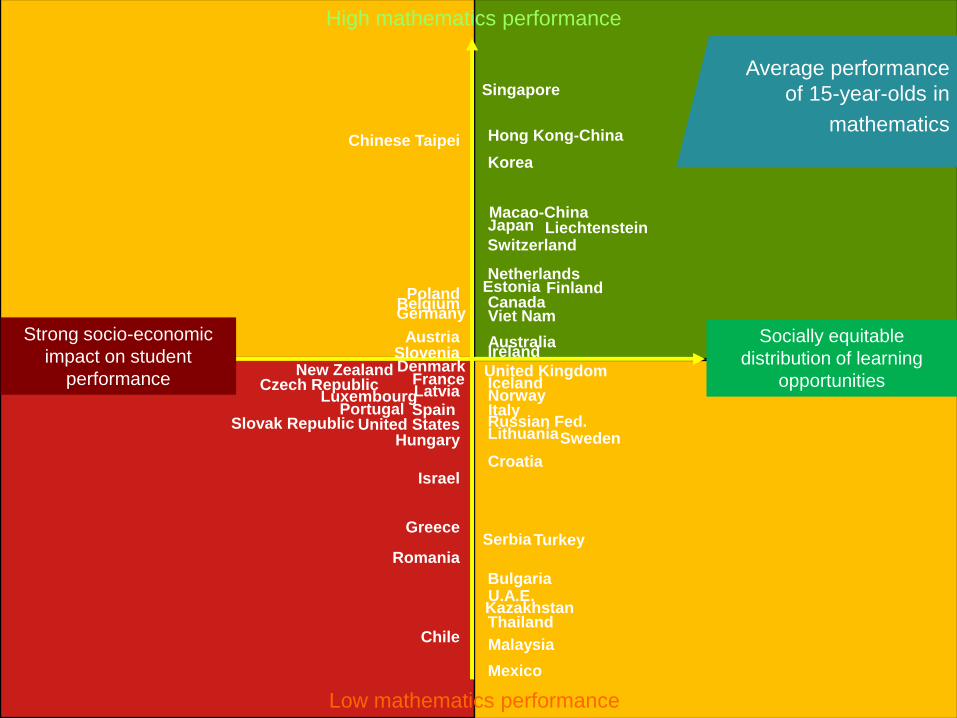
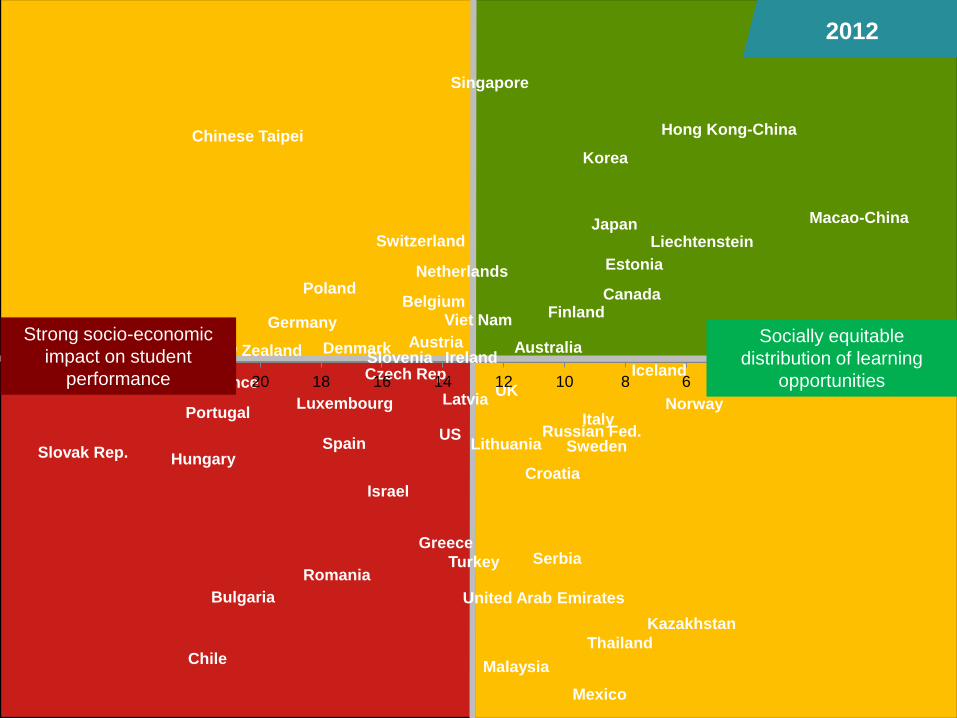
Socially equitable
distribution of learning
opportunities
High mathematics performance
Low mathematics performance
Average performance
of 15-year-olds in
mathematics
Strong socio-economic
impact on student
performance
Singapore
Hong Kong-China Chinese Taipei
Korea
Macao-China Japan Liechtenstein Switzerland
Netherlands Estonia Finland Canada
Poland Belgium Germany Viet Nam
Austria Australia Ireland Slovenia
Denmark New Zealand Czech Republic France
United Kingdom Iceland
Latvia Luxembourg Norway Portugal Italy Spain
Russian Fed. Slovak Republic United States Lithuania Sweden Hungary
Croatia Israel
Greece Serbia Turkey
Romania
Bulgaria U.A.E. Kazakhstan Thailand
Chile Malaysia
Mexico
Australia Austria
Belgium Canada
Chile
Czech Rep.
Denmark
Estonia
Finland
France
Germany
Greece
Hungary
Iceland Ireland
Israel
Italy
Japan
Korea
Luxembourg
Mexico
Netherlands
New Zealand
Norway
Poland
Portugal
Slovak Rep.
Slovenia
Spain Sweden
Switzerland
Turkey
UK
US
Singapore
Hong Kong-China Chinese Taipei
Macao-China
Liechtenstein
Viet Nam
Latvia
Russian Fed. Lithuania
Croatia
Serbia Romania
Bulgaria United Arab Emirates
Kazakhstan
Thailand
Malaysia
02468101214161820222426
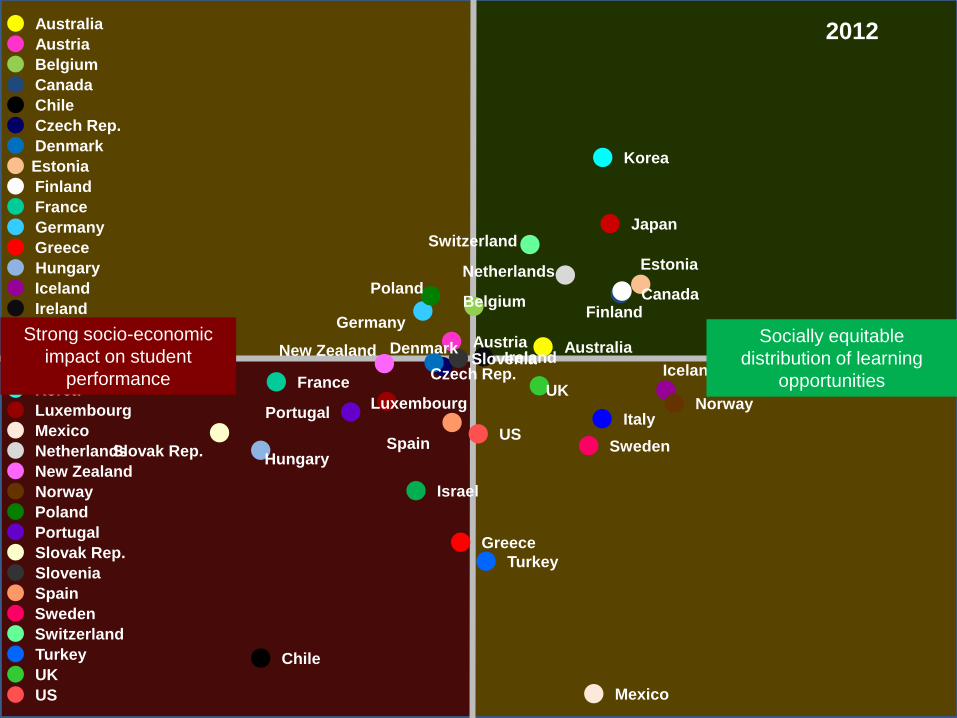
2012
Socially equitable
distribution of learning
opportunities
Strong socio-economic
impact on student
performance
Australia Austria
Belgium Canada
Chile
Czech Rep.
Denmark
Estonia
Finland
France
Germany
Greece
Hungary
Iceland Ireland
Israel
Italy
Japan
Korea
Luxembourg
Mexico
Netherlands
New Zealand
Norway
Poland
Portugal
Slovak Rep.
Slovenia
Spain Sweden
Switzerland
Turkey
UK
US
Australia
Austria
Belgium
Canada
Chile
Czech Rep.
Denmark
Estonia
Finland
France
Germany
Greece
Hungary
Iceland
Ireland
Israel
Italy
Japan
Korea
Luxembourg
Mexico
Netherlands
New Zealand
Norway
Poland
Portugal
Slovak Rep.
Slovenia
Spain
Sweden
Switzerland
Turkey
UK
US
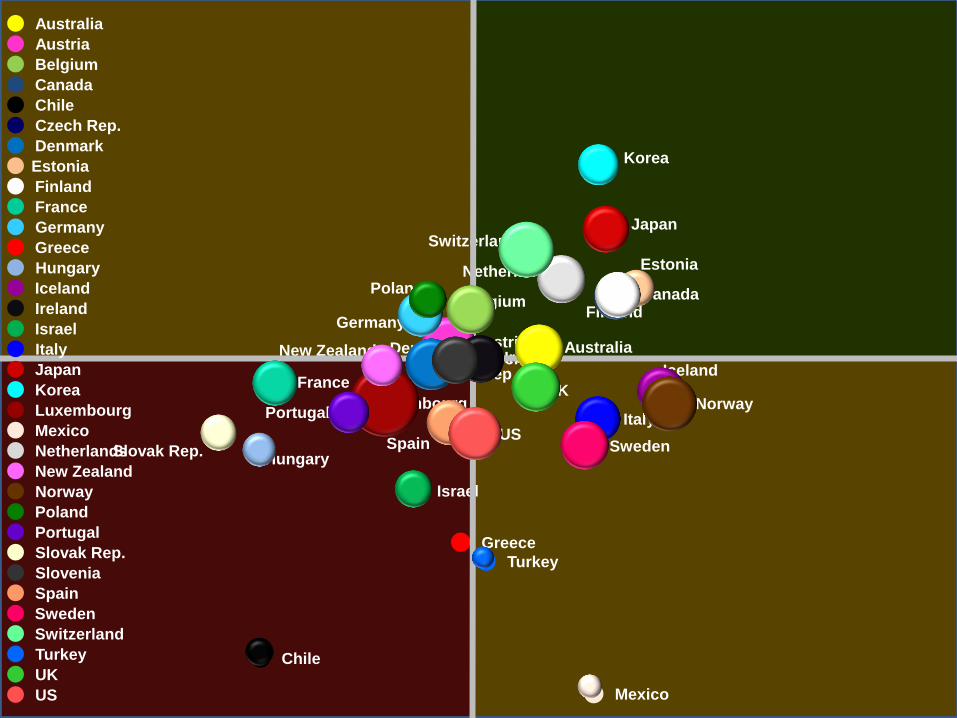
Singapore
Shanghai
Singapore
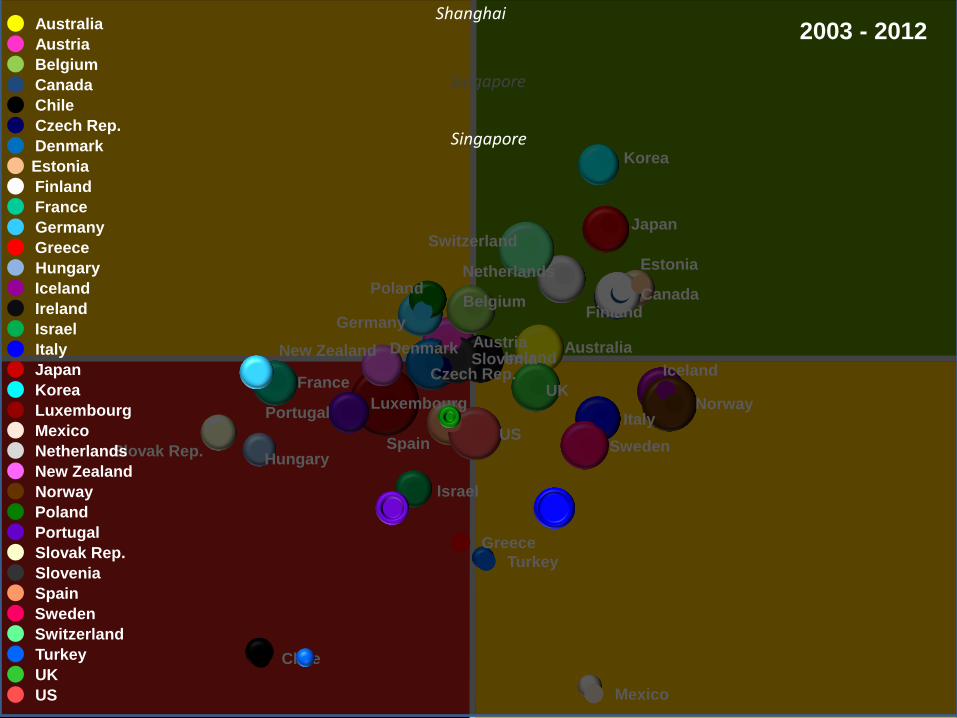
2003 - 2012 Germany, Turkey and Mexico improved
both their mathematics performance
and equity levels
Brazil, Italy, Macao-China, Poland,
Portugal, Russian Federation,
Thailand and Tunisia improved
their mathematics performance
(no change in equity)
Liechtenstein, Norway, the United
States and Switzerland improved
their equity levels (no change in
performance)
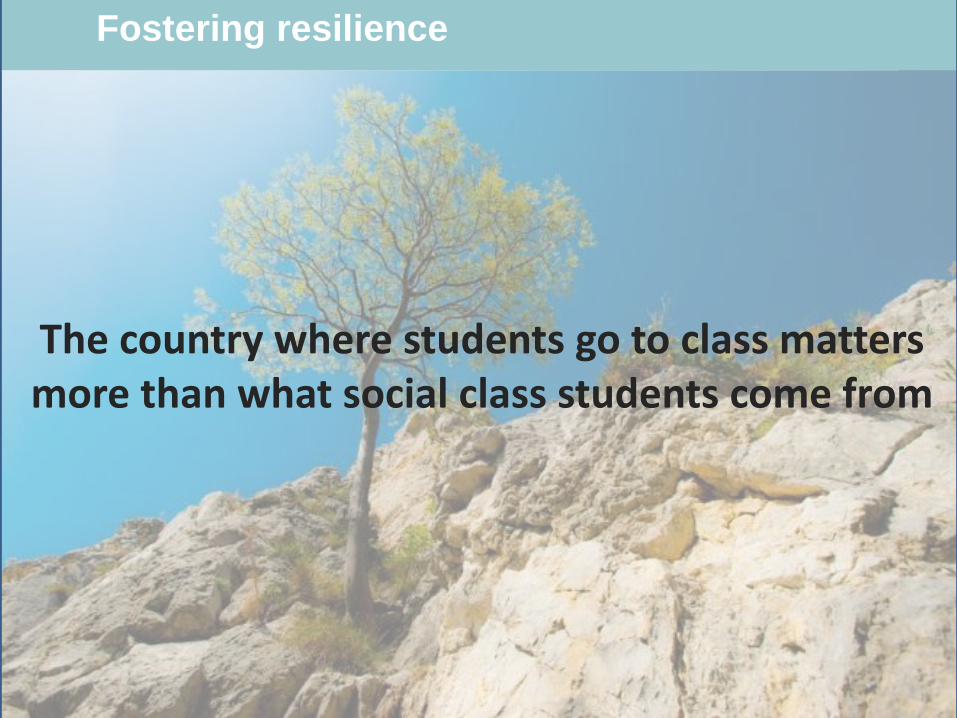
13 13 Fostering resilience
The country where students go to class matters more than what social class students come from
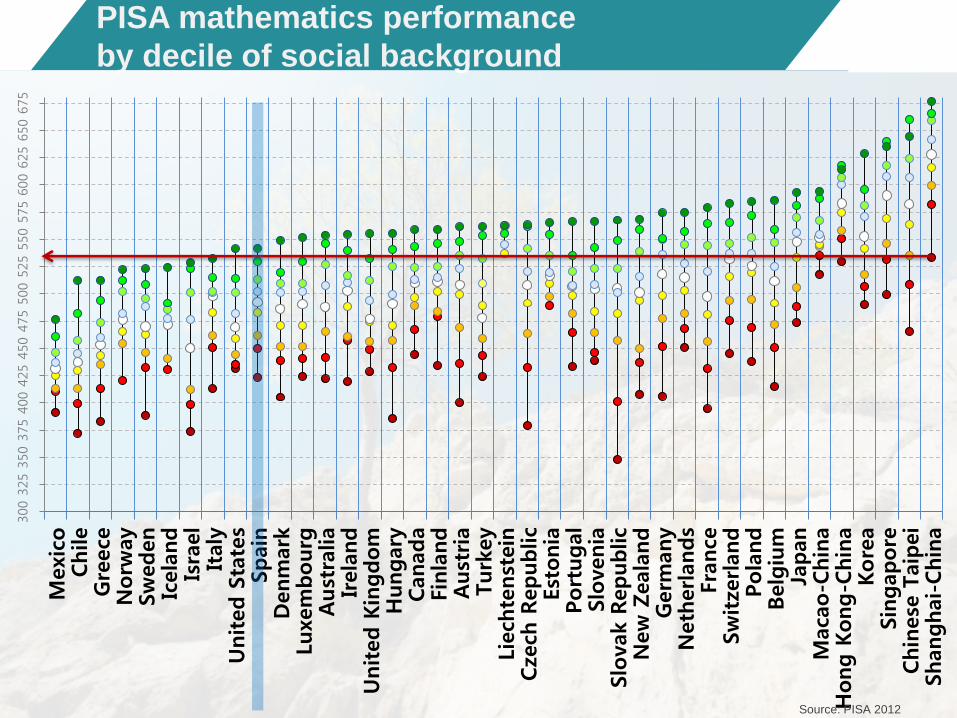
14 PISA mathematics performance
by decile of social background
300
325
350
375
400
425
450
475
500
525
550
575
600
625
650
675
Mexic
oChile
Gre
ece
Norw
ay
Sw
eden
Icela
nd
Isra
el
Italy
United S
tate
sSpain
Denm
ark
Luxem
bourg
Aust
ralia
Irela
nd
United K
ingdom
Hungary
Canada
Fin
land
Aust
ria
Turk
ey
Lie
chte
nst
ein
Cze
ch R
epublic
Est
onia
Port
ugal
Slo
venia
Slo
vak R
epublic
New
Zeala
nd
Germ
any
Neth
erlands
Fra
nce
Sw
itze
rland
Pola
nd
Belg
ium
Japan
Maca
o-C
hin
aH
ong K
ong-C
hin
aKore
aSin
gapore
Chin
ese
Taip
ei
Shanghai-Chin
a
Source: PISA 2012
0
10
20
30
40
Hong
Kon
g-C
hin
a
Kore
a +
Lie
ch
tenste
in
Ma
ca
o-C
hin
a +
Ja
pa
n
Sw
itze
rla
nd
Belg
ium
-
Neth
erla
nds
-
Germ
any
Pola
nd
+
Cana
da
-
Fin
land
-
New
Ze
ala
nd
-
Austr
alia
-
Austr
ia
OE
CD
ave
rag
e 2
00
3
-
Fra
nce
Czech R
ep
ub
lic
-
Luxe
mb
ou
rg
Icela
nd
-
Slo
vak R
epu
blic
Irela
nd
Port
ug
al +
Denm
ark
-
Italy
+
Norw
ay
-
Hung
ary
United
Sta
tes
Sw
ede
n
-
Spa
in
Latv
ia
Ru
ssia
n F
ede
ratio
n
Turk
ey
Gre
ece
Thaila
nd
Uru
gua
y
-
Tunis
ia
Bra
zil
Me
xic
o
Ind
one
sia
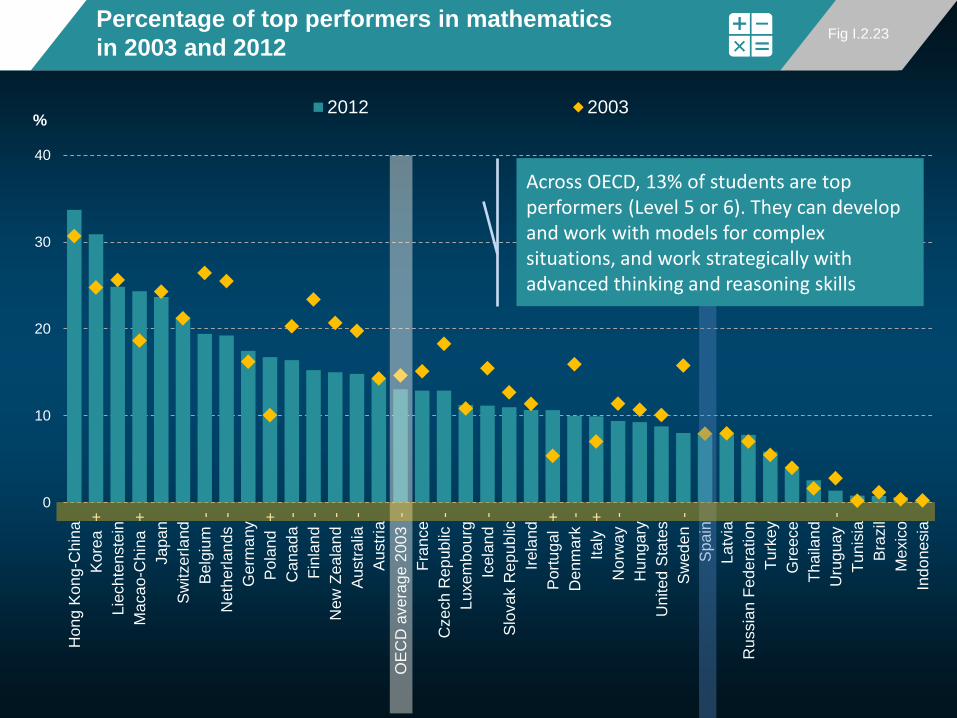
% 2012 2003
Percentage of top performers in mathematics
in 2003 and 2012 Fig I.2.23
Across OECD, 13% of students are top performers (Level 5 or 6). They can develop and work with models for complex situations, and work strategically with advanced thinking and reasoning skills
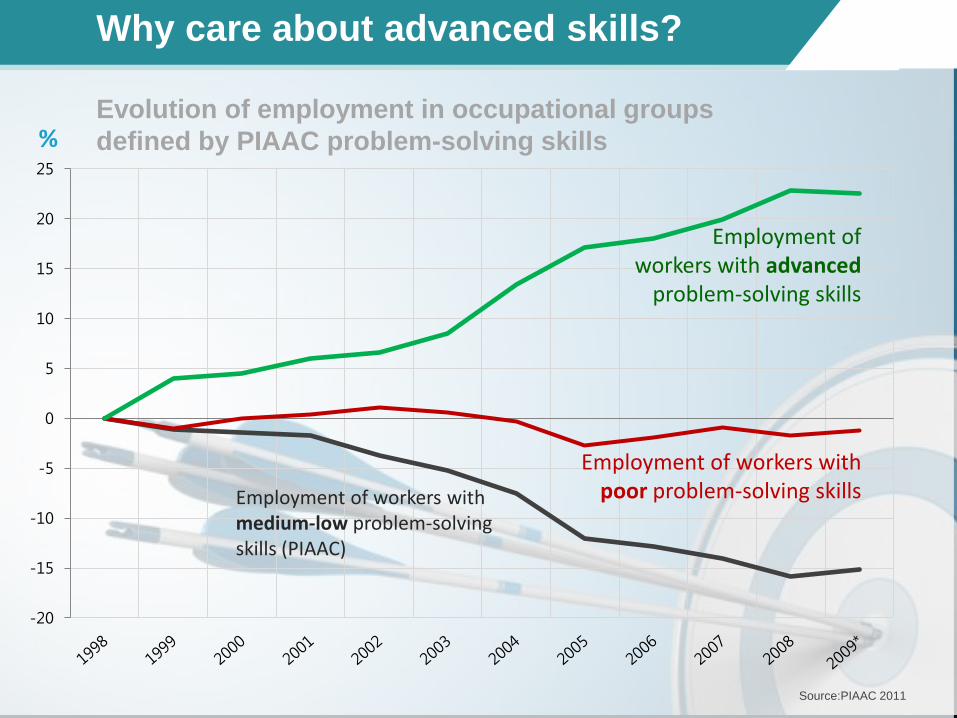
18 18 Why care about advanced skills?
-20
-15
-10
-5
0
5
10
15
20
25
% Evolution of employment in occupational groups
defined by PIAAC problem-solving skills
Employment of workers with advanced
problem-solving skills
Employment of workers with poor problem-solving skills Employment of workers with
medium-low problem-solving skills (PIAAC)
Source:PIAAC 2011
Math teaching ≠ math teaching PISA = reason mathematically and understand, formulate, employ
and interpret mathematical concepts, facts and procedures
19
0.00
0.50
1.00
1.50
2.00
2.50
Vie
t N
am
Ma
ca
o-C
hin
aS
ha
ngh
ai-
Ch
ina
Turk
ey
Uru
gua
yG
reece
Ho
ng
Kon
g-C
hin
aC
hin
ese
Taip
ei
Port
ug
al
Bra
zil
Serb
iaB
ulg
aria
Sin
ga
po
reN
eth
erla
nds
Ja
pa
nA
rgen
tin
aC
osta
Ric
aL
ithu
ania
Tunis
iaN
ew
Ze
ala
nd
Cze
ch R
ep
ub
licIs
rael
Kore
aL
atv
iaQ
ata
rIt
aly
United
Sta
tes
Esto
nia
Irela
nd
Austr
alia
Me
xic
oU
nited
Ara
b E
mira
tes
Norw
ay
Ma
laysia
Kaza
kh
sta
nU
nited
Kin
gd
om
Rom
ania
OE
CD
ave
rag
eA
lban
iaC
olo
mb
iaIn
do
ne
sia
Sw
ede
nB
elg
ium
Peru
Thaila
nd
Denm
ark
Ru
ssia
n F
ede
ratio
nC
ana
da
Slo
vak R
epu
blic
Hung
ary
Germ
any
Cro
atia
Luxe
mb
ou
rgM
on
ten
eg
roC
hile
Pola
nd
Fin
land
Austr
iaS
loven
iaF
ran
ce
Sw
itze
rla
nd
Jo
rdan
Lie
ch
tenste
inS
pa
inIc
ela
nd
Ind
ex
of
ex
po
su
re t
o w
ord
pro
ble
ms
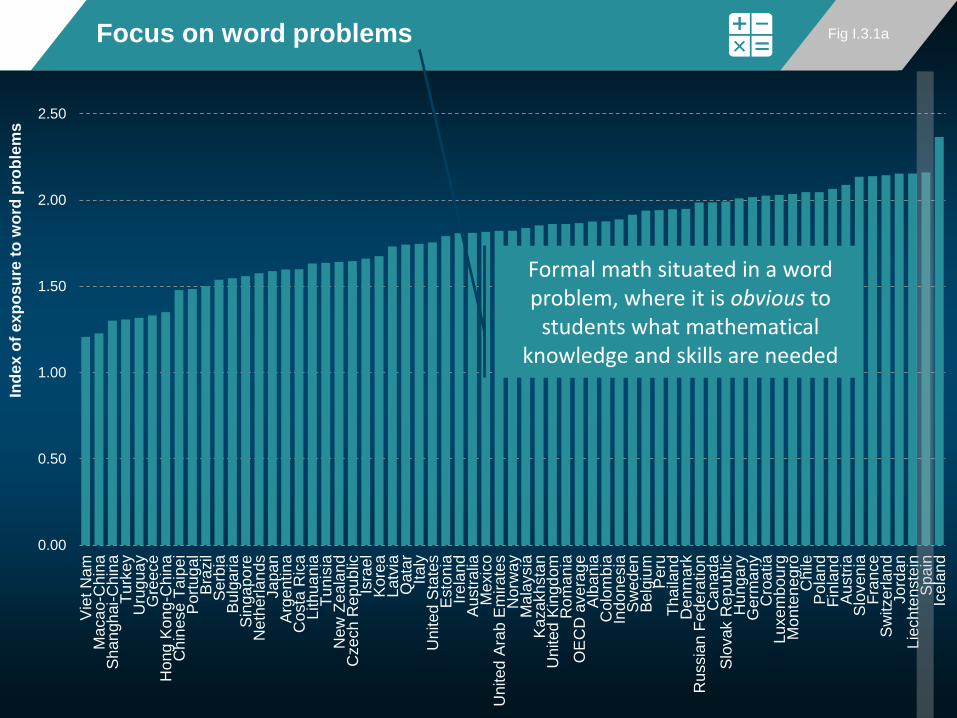
Focus on word problems Fig I.3.1a
Formal math situated in a word problem, where it is obvious to
students what mathematical knowledge and skills are needed
0.00
0.50
1.00
1.50
2.00
2.50S
wede
nIc
ela
nd
Tu
nis
iaA
rgen
tin
aS
witze
rla
nd
Bra
zil
Luxe
mb
ou
rgIr
ela
nd
Neth
erla
nds
New
Ze
ala
nd
Costa
Ric
aA
ustr
iaL
iech
tenste
inM
ala
ysia
Ind
one
sia
Denm
ark
United
Kin
gd
om
Uru
gua
yL
ithu
ania
Germ
any
Austr
alia
Chile
OE
CD
ave
rag
eS
lovak R
epu
blic
Th
aila
nd
Qata
rF
inla
nd
Port
ug
al
Colo
mb
iaM
exic
oP
eru
Czech R
ep
ub
licIs
rael
Italy
Belg
ium
Ho
ng
Kon
g-C
hin
aP
ola
nd
Fra
nce
Spa
inM
on
ten
eg
roG
reece
Turk
ey
Slo
ven
iaV
iet N
am
Hung
ary
Bulg
aria
Kaza
kh
sta
nC
hin
ese
Taip
ei
Cana
da
United
Sta
tes
Esto
nia
Rom
ania
Latv
iaS
erb
iaJa
pa
nK
ore
aC
roa
tia
Alb
an
iaR
ussia
n F
ede
ratio
nU
nited
Ara
b E
mirate
sJo
rdan
Ma
ca
o-C
hin
aS
inga
po
reS
ha
ngh
ai-
Ch
ina
Irela
nd
Ind
ex
of
ex
po
su
re t
o f
orm
al m
ath
em
ati
cs
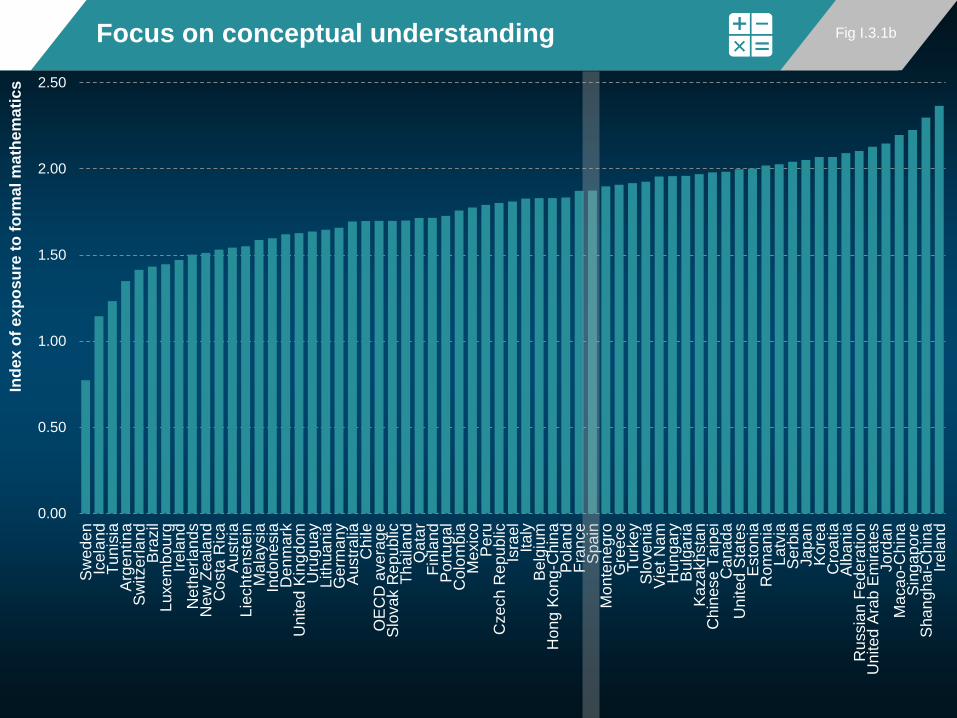
Focus on conceptual understanding Fig I.3.1b
-0.3
-0.2
-0.1
0
0.1
0.2
0.3
0.4
0.5
Ja
pa
n
Ho
ng
Kon
g-C
hin
a
Luxe
mb
ou
rg
Norw
ay
Cze
ch R
ep
ub
lic
Icela
nd
Kore
a
Ind
one
sia
Thaila
nd
Me
xic
o
Denm
ark
Lie
ch
tenste
in
Italy
Austr
ia
Ma
ca
o-C
hin
a
Turk
ey
Belg
ium
Cana
da
Port
ug
al
Pola
nd
Spa
in
OE
CD
ave
rag
e 2
00
3
Sw
itze
rla
nd
Bra
zil
United
Sta
tes
Gre
ece
Slo
vak R
epu
blic
Ne
the
rla
nds
Ru
ssia
n F
ede
ratio
n
Hung
ary
Irela
nd
New
Ze
ala
nd
Austr
alia
Uru
gua
y
Sw
ede
n
Latv
ia
Fra
nce
Fin
land
Germ
any
Tunis
ia
Me
an
in
de
x c
han
ge
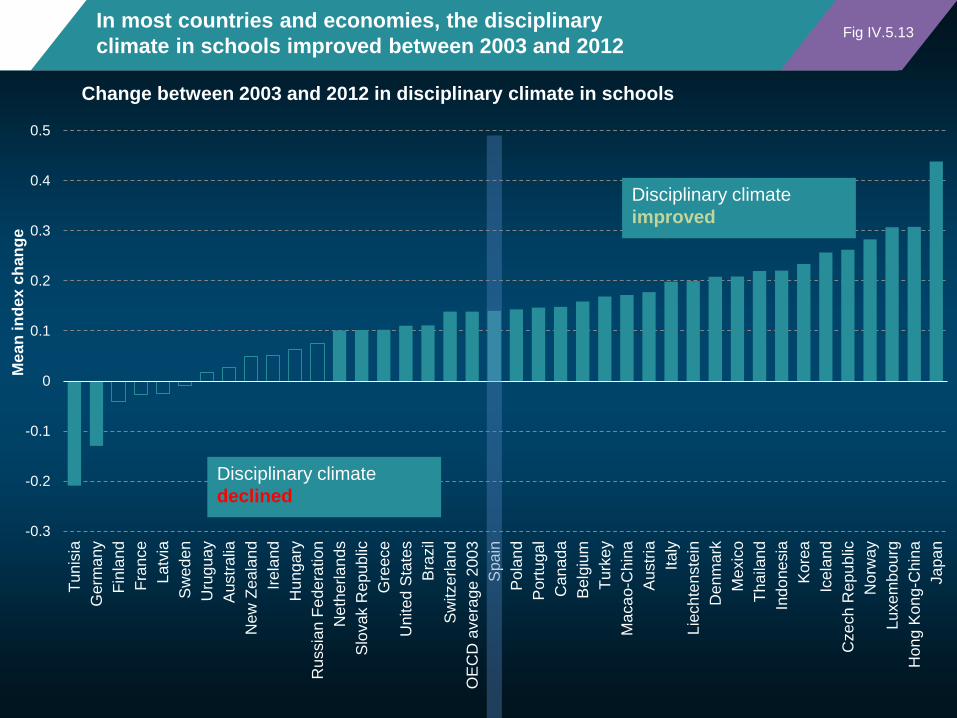
Change between 2003 and 2012 in disciplinary climate in schools
In most countries and economies, the disciplinary
climate in schools improved between 2003 and 2012
Disciplinary climate
declined
Disciplinary climate
improved
Fig IV.5.13
United States
Poland
Hong Kong-China
Brazil
New Zealand
Greece
Uruguay
United Kingdom
Estonia Finland
Albania
Croatia
Latvia
Slovak Republic Luxembourg
Germany
Lithuania
Austria
Czech Republic
Chinese Taipei
France
Thailand
Japan
Turkey Sweden
Hungary Australia
Israel
Canada
Ireland Bulgaria
Jordan
Chile
Macao-China
U.A.E.
Belgium
Netherlands
Spain
Argentina
Indonesia
Denmark
Kazakhstan
Peru
Costa Rica
Switzerland
Montenegro
Tunisia
Iceland
Slovenia
Qatar
Singapore
Portugal
Norway
Colombia
Malaysia
Mexico
Liechtenstein
Korea
Serbia
Russian Fed.
Romania
Viet Nam
Italy
Shanghai-China
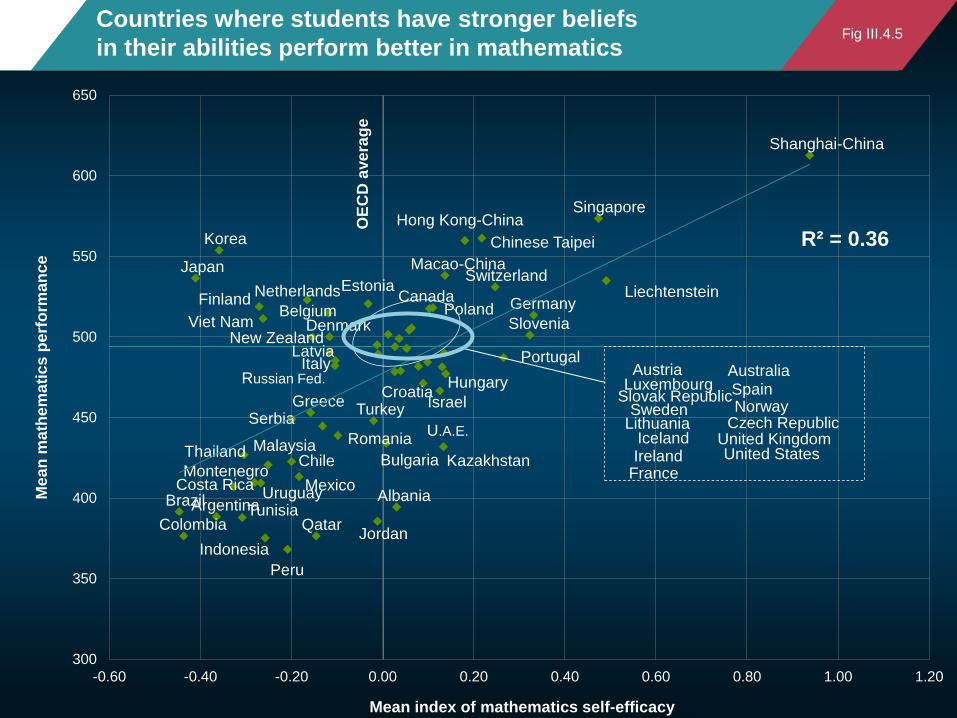
R² = 0.36
300
350
400
450
500
550
600
650
-0.60 -0.40 -0.20 0.00 0.20 0.40 0.60 0.80 1.00 1.20
Me
an
ma
the
ma
tics
perf
orm
an
ce
Mean index of mathematics self-efficacy
OE
CD
ave
rag
e
Countries where students have stronger beliefs
in their abilities perform better in mathematics Fig III.4.5
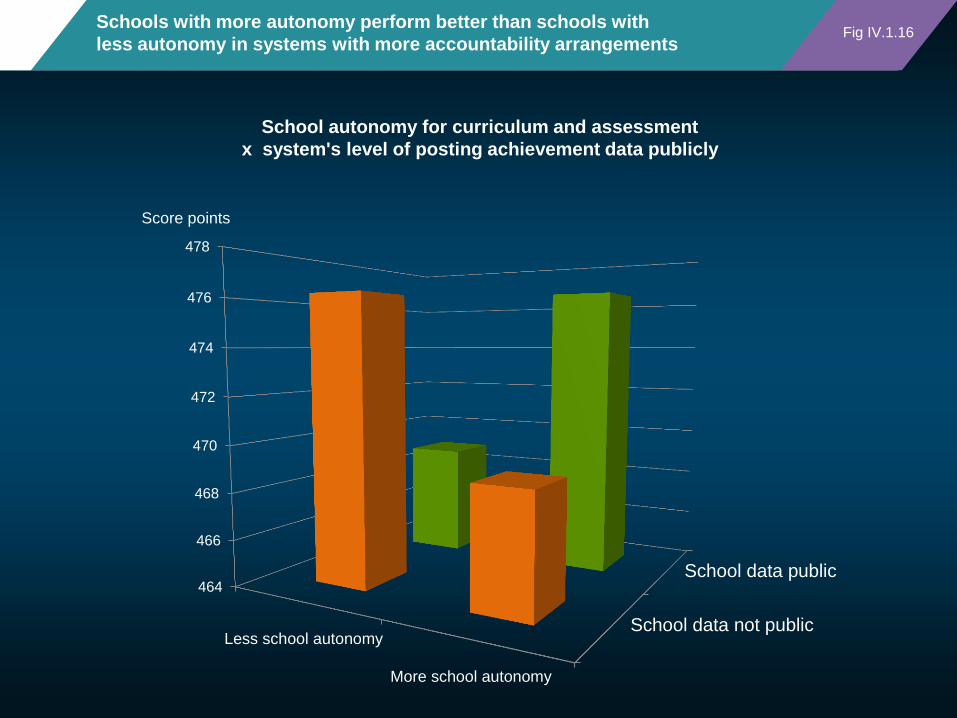
Schools with more autonomy perform better than schools with
less autonomy in systems with more accountability arrangements
School data not public
School data public464
466
468
470
472
474
476
478
Less school autonomy
More school autonomy
Score points
School autonomy for curriculum and assessment
x system's level of posting achievement data publicly
Fig IV.1.16
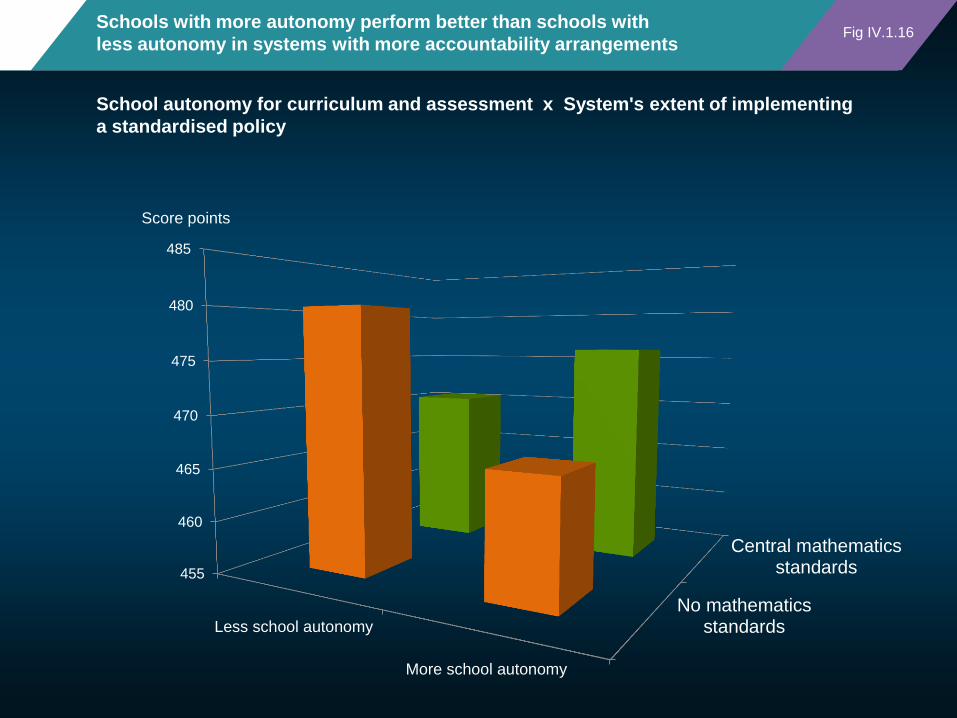
No mathematicsstandards
Central mathematicsstandards455
460
465
470
475
480
485
Less school autonomy
More school autonomy
Schools with more autonomy perform better than schools with
less autonomy in systems with more accountability arrangements
Score points
School autonomy for curriculum and assessment x System's extent of implementing
a standardised policy
Fig IV.1.16
Mean mathematics performance, by school location,
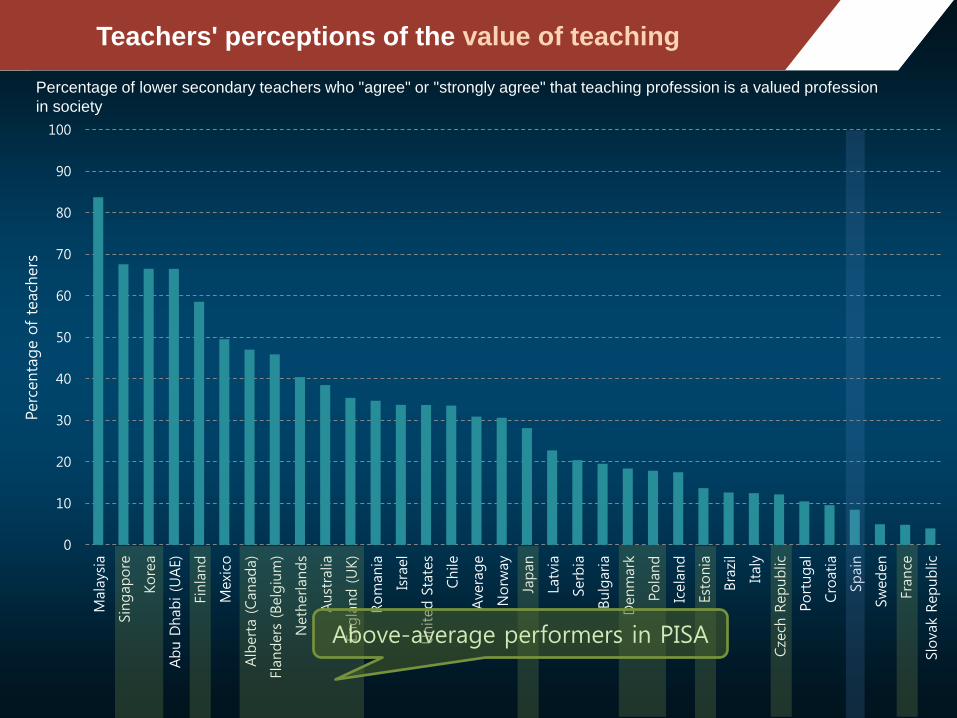
after accounting for socio-economic status Fig II.3.3 26 Teachers' perceptions of the value of teaching
Percentage of lower secondary teachers who "agree" or "strongly agree" that teaching profession is a valued profession
in society
0
10
20
30
40
50
60
70
80
90
100
Mala
ysia
Sin
gapore
Kore
a
Abu D
habi (U
AE)
Finla
nd
Mexi
co
Alb
erta (Canada)
Flanders
(Belg
ium
)
Neth
erlands
Aust
ralia
Engla
nd (UK)
Rom
ania
Isra
el
United S
tate
s
Chile
Ave
rage
Norw
ay
Japan
Latv
ia
Serb
ia
Bulg
aria
Denm
ark
Pola
nd
Icela
nd
Est
onia
Bra
zil
Italy
Cze
ch R
epublic
Portugal
Cro
atia
Spain
Sw
eden
France
Slo
vak R
epublic
Perc
enta
ge o
f te
ach
ers
Above-average performers in PISA
Mean mathematics performance, by school location,
after accounting for socio-economic status Fig II.3.3 27
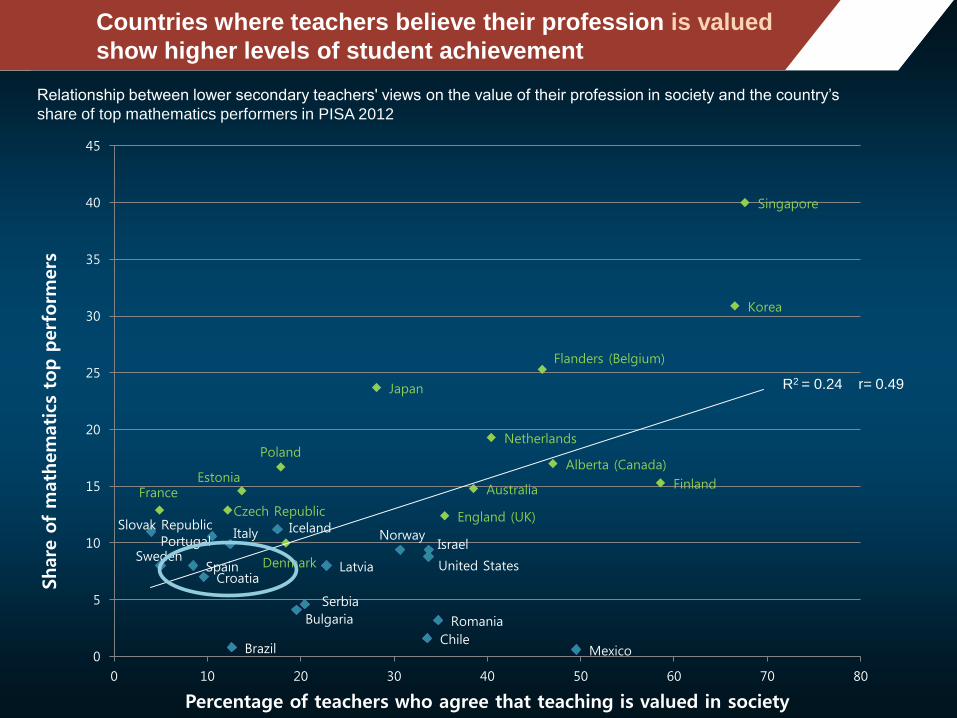
Countries where teachers believe their profession is valued
show higher levels of student achievement
Relationship between lower secondary teachers' views on the value of their profession in society and the country’s
share of top mathematics performers in PISA 2012
Australia
Brazil
Bulgaria
Chile
Croatia
Czech Republic
Denmark
Estonia Finland
France
Iceland Israel
Italy
Japan
Korea
Latvia
Mexico
Netherlands
Norway
Poland
Portugal
Romania
Serbia
Singapore
Slovak Republic
Spain Sweden
Alberta (Canada)
England (UK)
Flanders (Belgium)
United States
0
5
10
15
20
25
30
35
40
45
0 10 20 30 40 50 60 70 80
Share
of
math
em
atics
top p
erf
orm
ers
Percentage of teachers who agree that teaching is valued in society
R2 = 0.24 r= 0.49
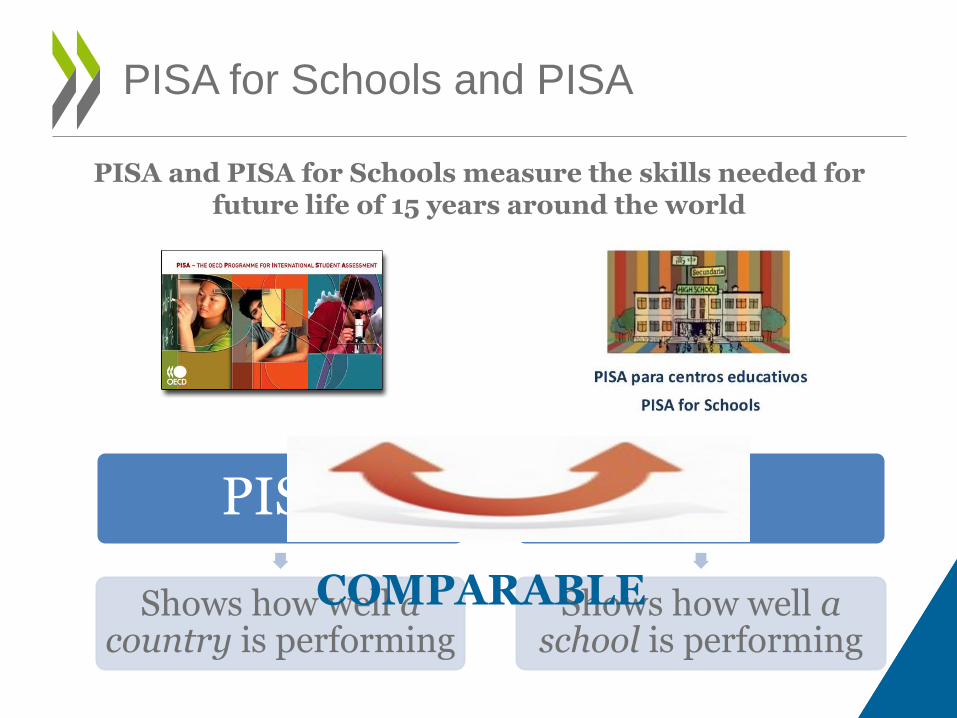
PISA for Schools and PISA
PISA
Shows how well a country is performing
PfS
Shows how well a school is performing
PISA and PISA for Schools measure the skills needed for future life of 15 years around the world
COMPARABLE
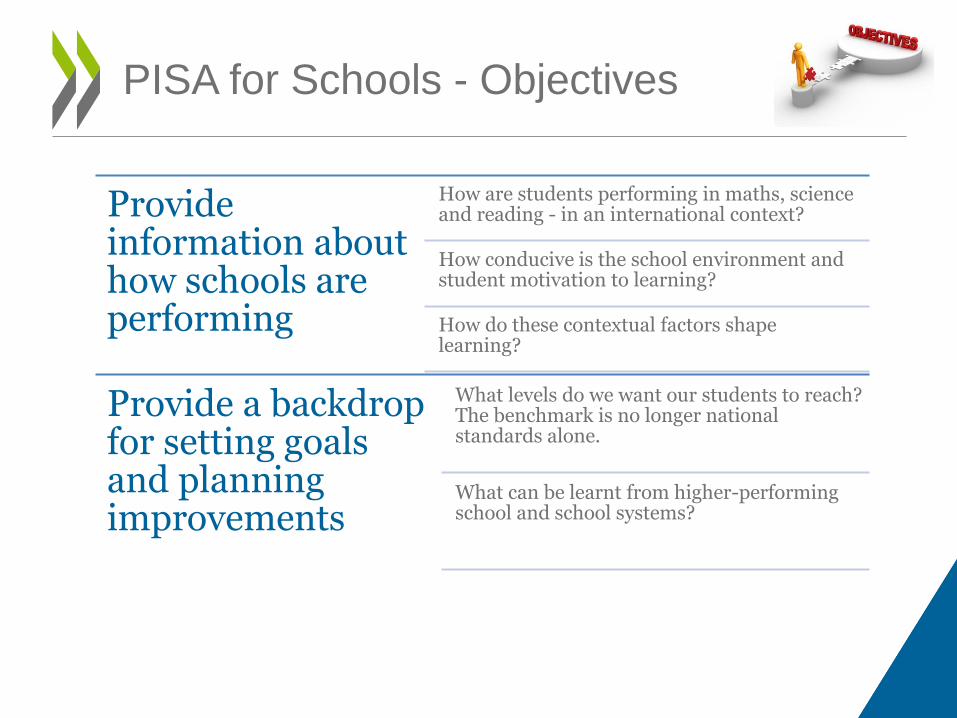
PISA for Schools - Objectives
Provide information about how schools are performing
How are students performing in maths, science and reading - in an international context?
How conducive is the school environment and student motivation to learning?
How do these contextual factors shape learning?
Provide a backdrop for setting goals and planning improvements
What levels do we want our students to reach? The benchmark is no longer national standards alone.
What can be learnt from higher-performing school and school systems?
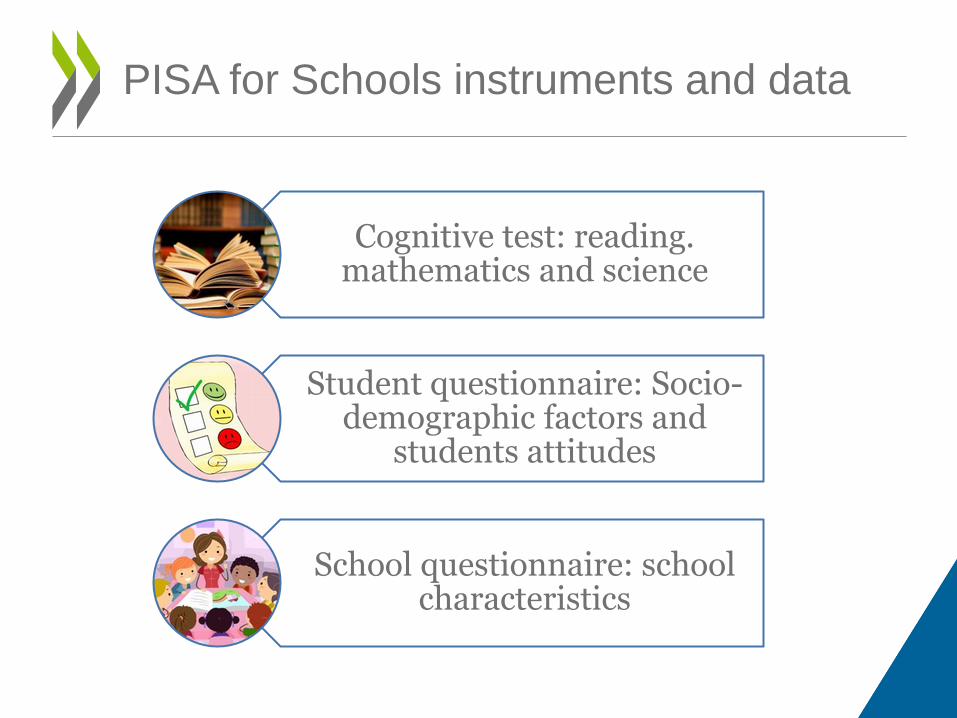
PISA for Schools instruments and data
Cognitive test: reading. mathematics and science
Student questionnaire: Socio- demographic factors and
students attitudes
School questionnaire: school characteristics
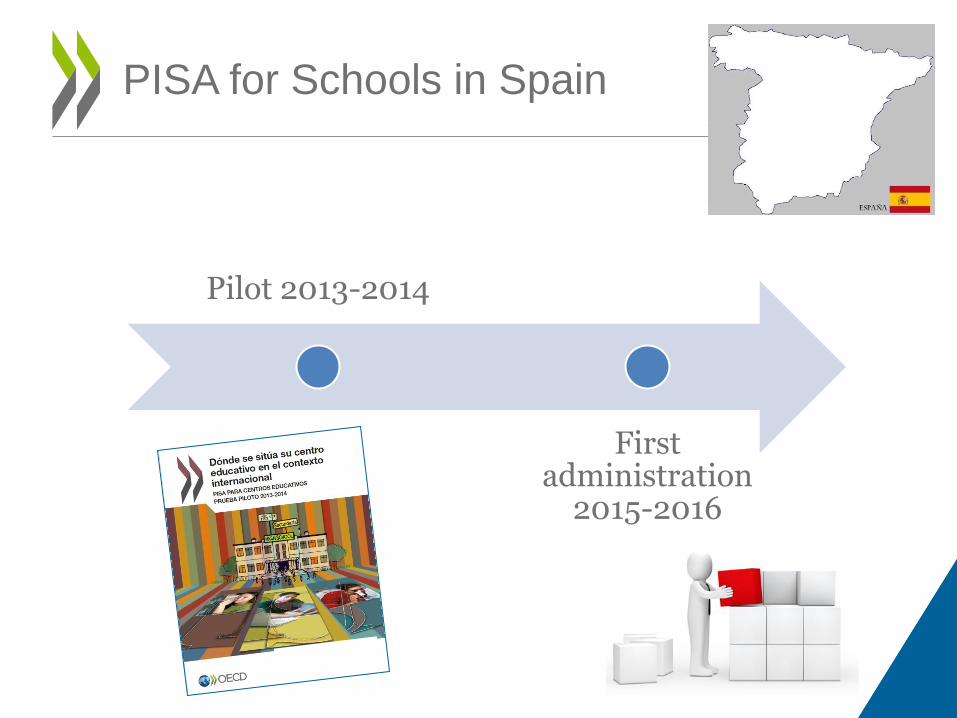
PISA for Schools in Spain
Pilot 2013-2014
First administration
2015-2016
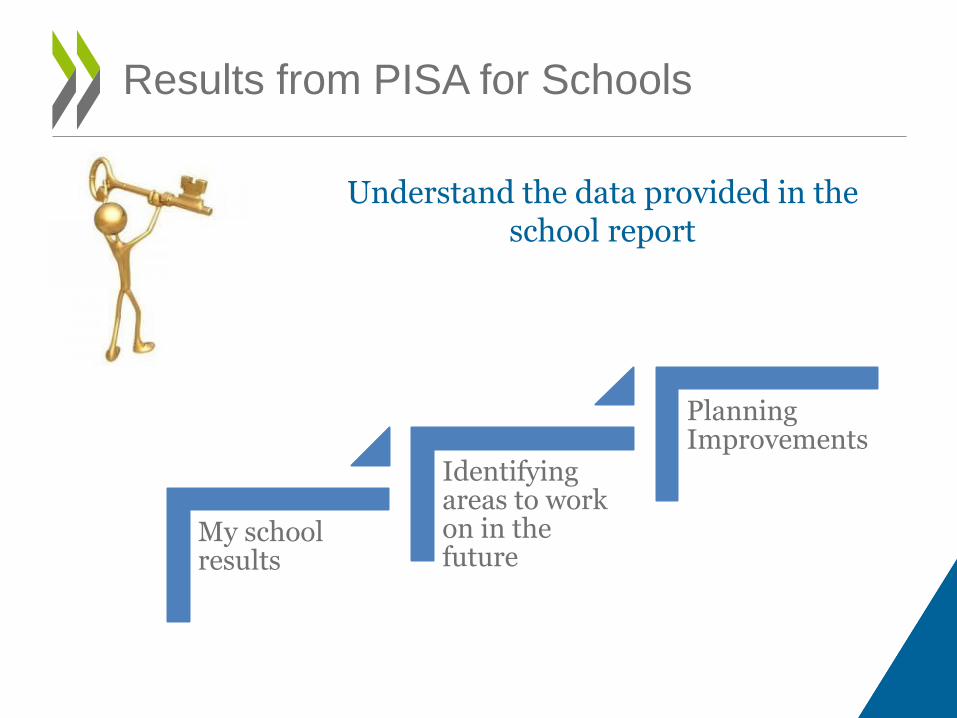
Results from PISA for Schools
My school results
Identifying areas to work on in the future
Planning Improvements
Understand the data provided in the school report
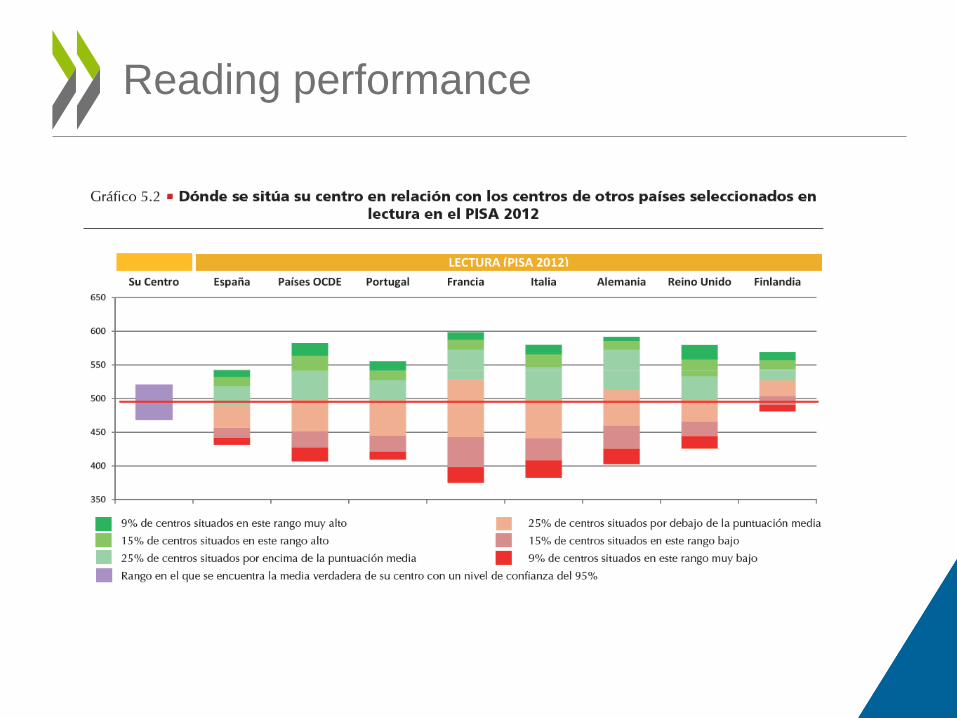
Reading performance
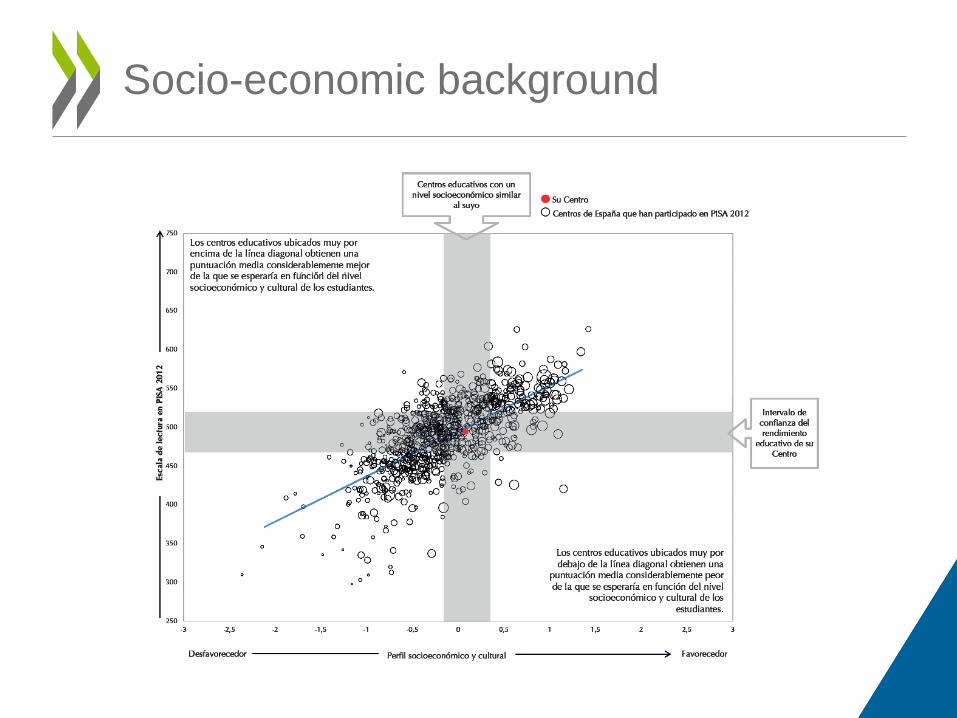
Socio-economic background
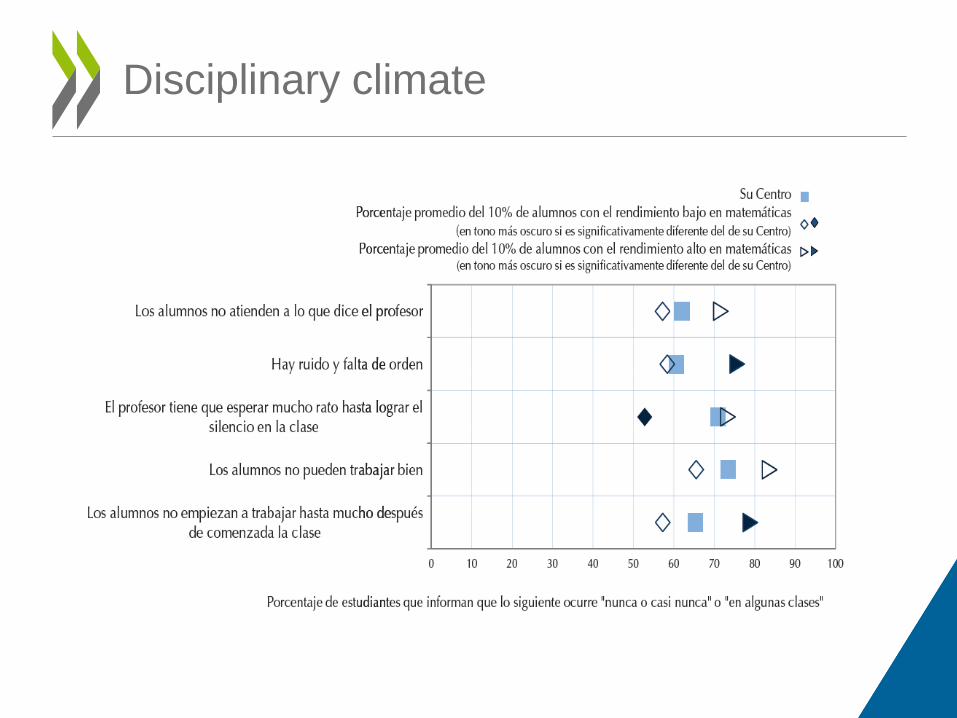
Disciplinary climate
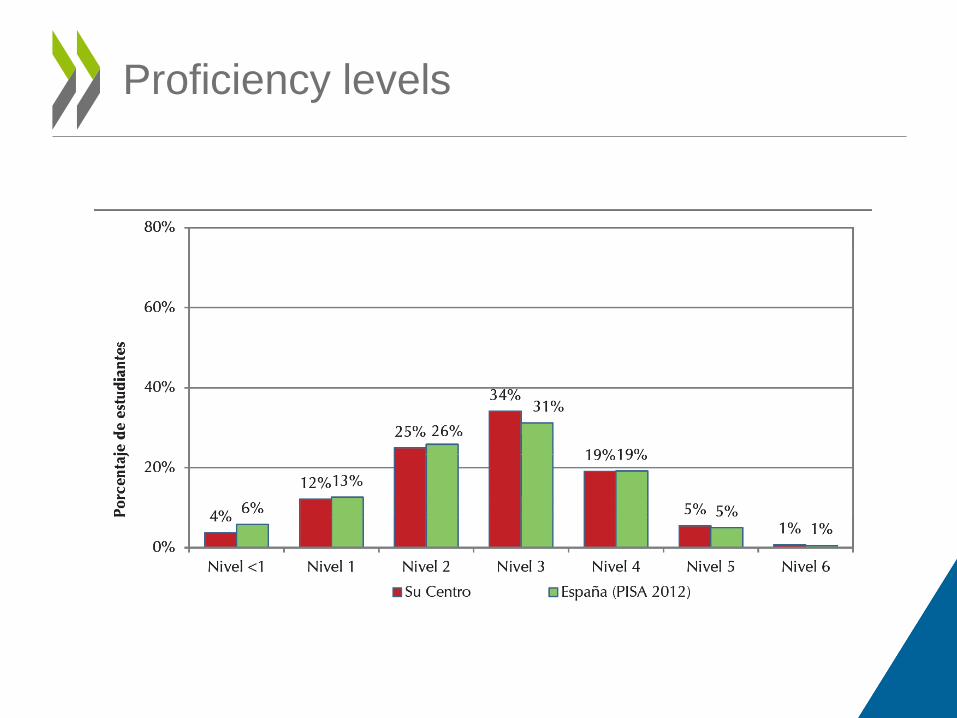
Proficiency levels
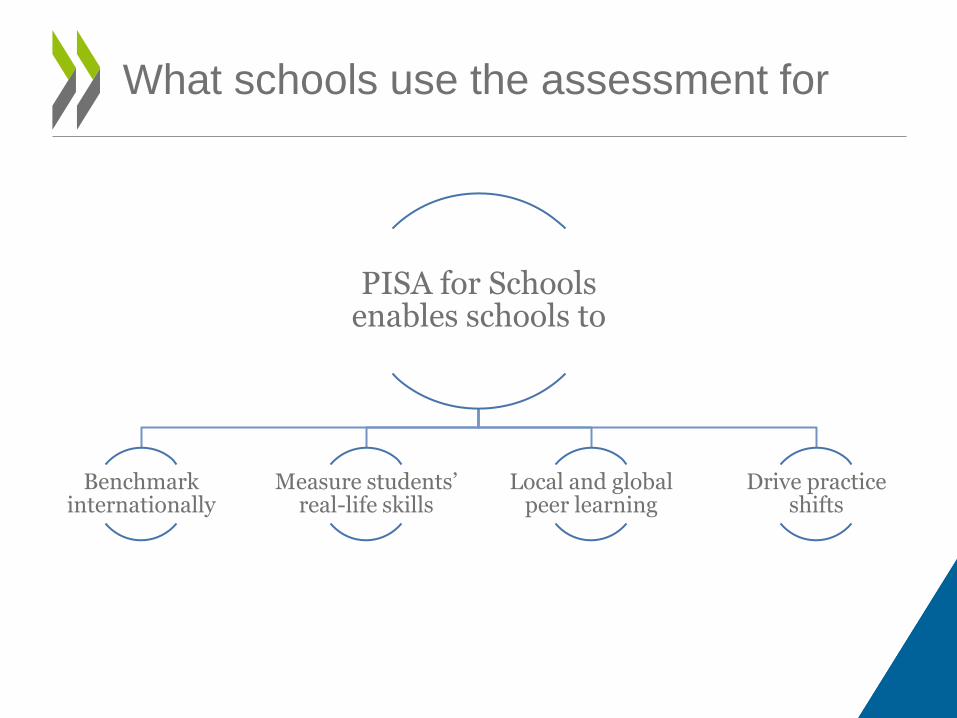
What schools use the assessment for
PISA for Schools enables schools to
Benchmark internationally
Measure students’ real-life skills
Local and global peer learning
Drive practice shifts
Thank you for your attention!