Embed Size (px)
Citation preview
PAYING IT FORWARD:
How Investment in Recycling Will Pay Dividends
2 PAYING IT FORWARD: HOW INVESTMENT IN RECYCLING WILL PAY DIVIDENDS
About The Recycling Partnership The Recycling Partnership is the action agent transforming the recycling system and activating a circular economy for packaging. We work on the ground with thousands of communities to transform underperforming recycling programs and tackle circular economy challenges. We work with companies to make their packaging more circular and help them meet their climate and sustainability goals. And we work with government on the policy solutions that will strengthen the foundation of our residential recycling system through a shared-responsibility approach with all stakeholders at the table.
Lead AuthorsKaren Bandhauer, Keefe Harrison, and Scott Mouw
Contributing AuthorsJoe Bontempo, Aaron Burman, Bill Culbertson, Spence Davenport, Dylan de Thomas, Allison Francis, Samantha Kappalman, Andrew Linebarger, Cody Marshall, Trina Matta, Jeff Meyers, Rich Simon, Rob Taylor, and Craig Wittig
© 2021 The Recycling Partnership Inc.
3THE RECYCLING PARTNERSHIP
Table of Contents
Executive Summary ...................................................................................... 4
Key Findings ..................................................................................................6
Return on Investment.................................................................................10
Introduction: A Dramatic Investment in Recycling Is Required ..............12
Breaking Down the Needed Investment ...................................................16
Impacts on Material Recovery .................................................................. 24
Conclusion — Delivering the Needs of the System ................................. 28
Appendix
A: Details on Capital Investments ............................................................. 30
B: Specific Actions Needed for Flexible Plastic Packaging, Including Pouches, Bags, and Wrap ..................................................... 36
C: Estimated Impacts From Capital Investments..................................... 38
D: Potential Sources of Capital to Achieve Equitable and Informed Access ............................................................................. 45
4 PAYING IT FORWARD: HOW INVESTMENT IN RECYCLING WILL PAY DIVIDENDS
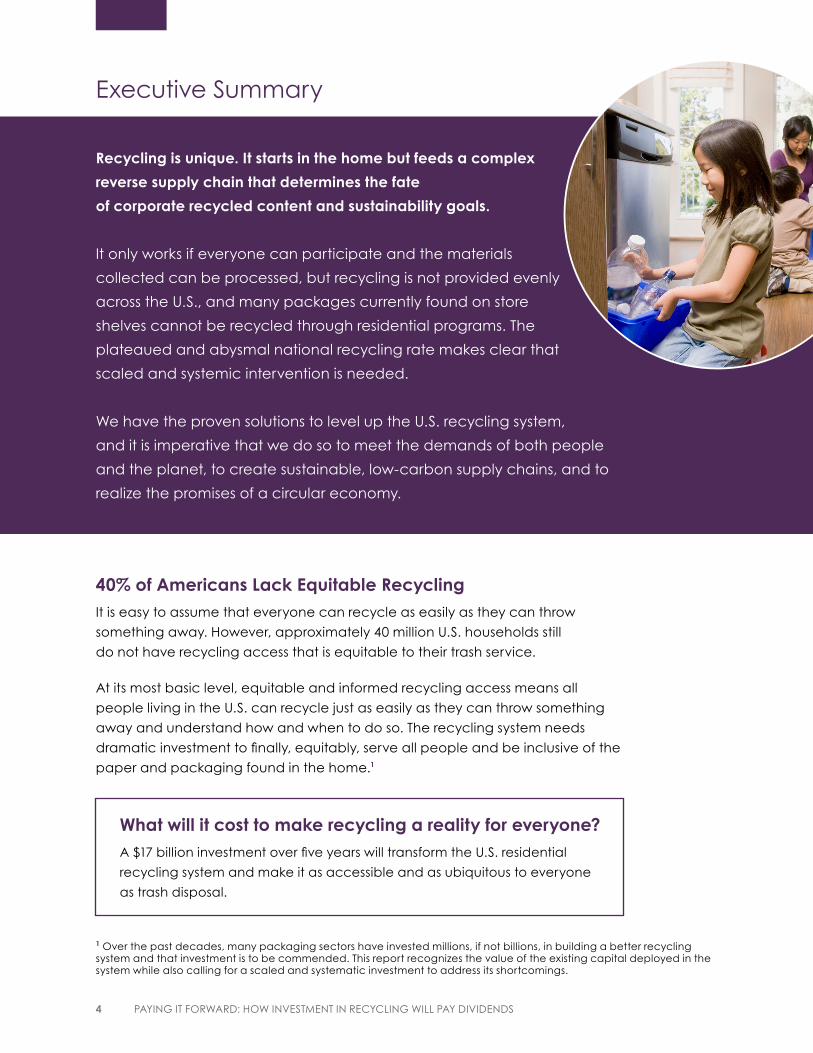
Executive Summary
Recycling is unique. It starts in the home but feeds a complex
reverse supply chain that determines the fate
of corporate recycled content and sustainability goals.
It only works if everyone can participate and the materials
collected can be processed, but recycling is not provided evenly
across the U.S., and many packages currently found on store
shelves cannot be recycled through residential programs. The
plateaued and abysmal national recycling rate makes clear that
scaled and systemic intervention is needed.
We have the proven solutions to level up the U.S. recycling system,
and it is imperative that we do so to meet the demands of both people
and the planet, to create sustainable, low-carbon supply chains, and to
realize the promises of a circular economy.
1 Over the past decades, many packaging sectors have invested millions, if not billions, in building a better recycling system and that investment is to be commended. This report recognizes the value of the existing capital deployed in the system while also calling for a scaled and systematic investment to address its shortcomings.
40% of Americans Lack Equitable RecyclingIt is easy to assume that everyone can recycle as easily as they can throw
something away. However, approximately 40 million U.S. households still
do not have recycling access that is equitable to their trash service.
At its most basic level, equitable and informed recycling access means all
people living in the U.S. can recycle just as easily as they can throw something
away and understand how and when to do so. The recycling system needs
dramatic investment to finally, equitably, serve all people and be inclusive of the
paper and packaging found in the home.1
What will it cost to make recycling a reality for everyone? A $17 billion investment over five years will transform the U.S. residential
recycling system and make it as accessible and as ubiquitous to everyone
as trash disposal.
5THE RECYCLING PARTNERSHIP
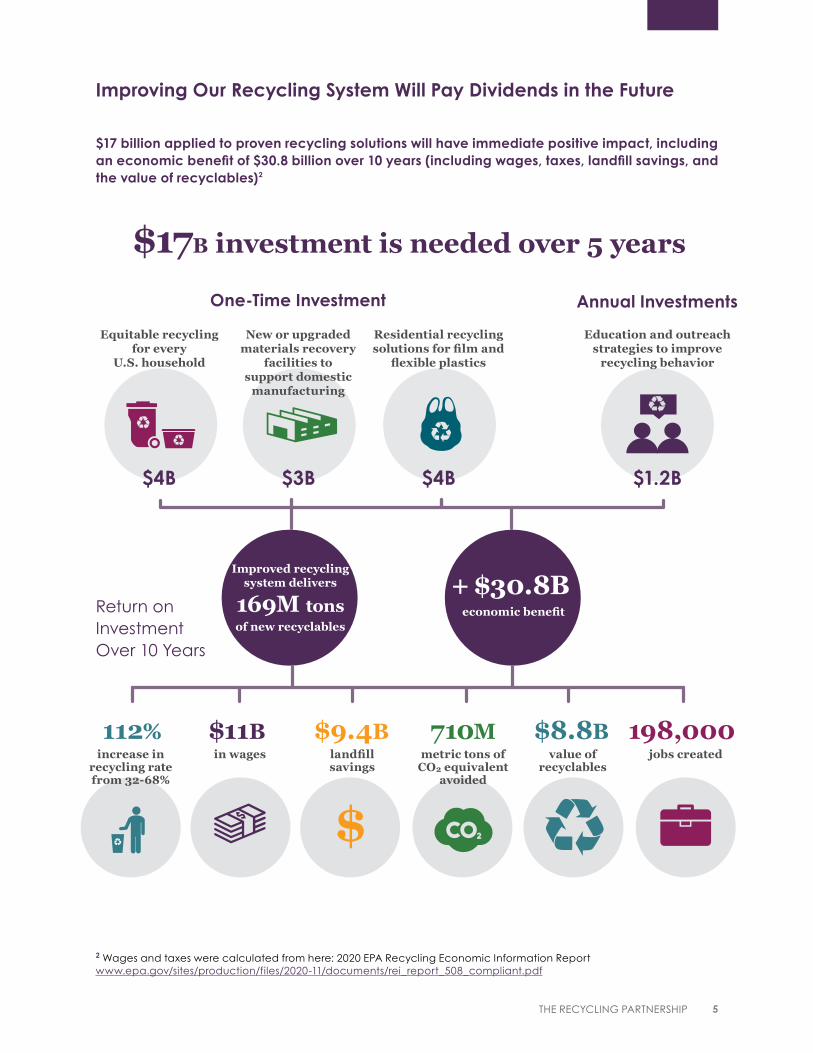
Improved recycling system delivers + $30.8B
One-Time Investment
Return on Investment Over 10 Years
112%
Residential recycling solutions for film and
flexible plastics
New or upgraded materials recovery
facilities to support domestic
manufacturing
Equitable recycling for every
U.S. household
increase in recycling rate from 32-68%
710Mmetric tons of
CO2 equivalent avoided
$8.8Bvalue of
recyclables
198,000jobs created
$11Bin wages
$9.4Blandfill savings
$
169M tons economic benefitof new recyclables
2 Wages and taxes were calculated from here: 2020 EPA Recycling Economic Information Report www.epa.gov/sites/production/files/2020-11/documents/rei_report_508_compliant.pdf
Annual Investments
Education and outreachstrategies to improve
recycling behavior
$1.2B$4B$3B$4B
Improving Our Recycling System Will Pay Dividends in the Future
$17B investment is needed over 5 years
$17 billion applied to proven recycling solutions will have immediate positive impact, including an economic benefit of $30.8 billion over 10 years (including wages, taxes, landfill savings, and the value of recyclables)2
6 PAYING IT FORWARD: HOW INVESTMENT IN RECYCLING WILL PAY DIVIDENDS
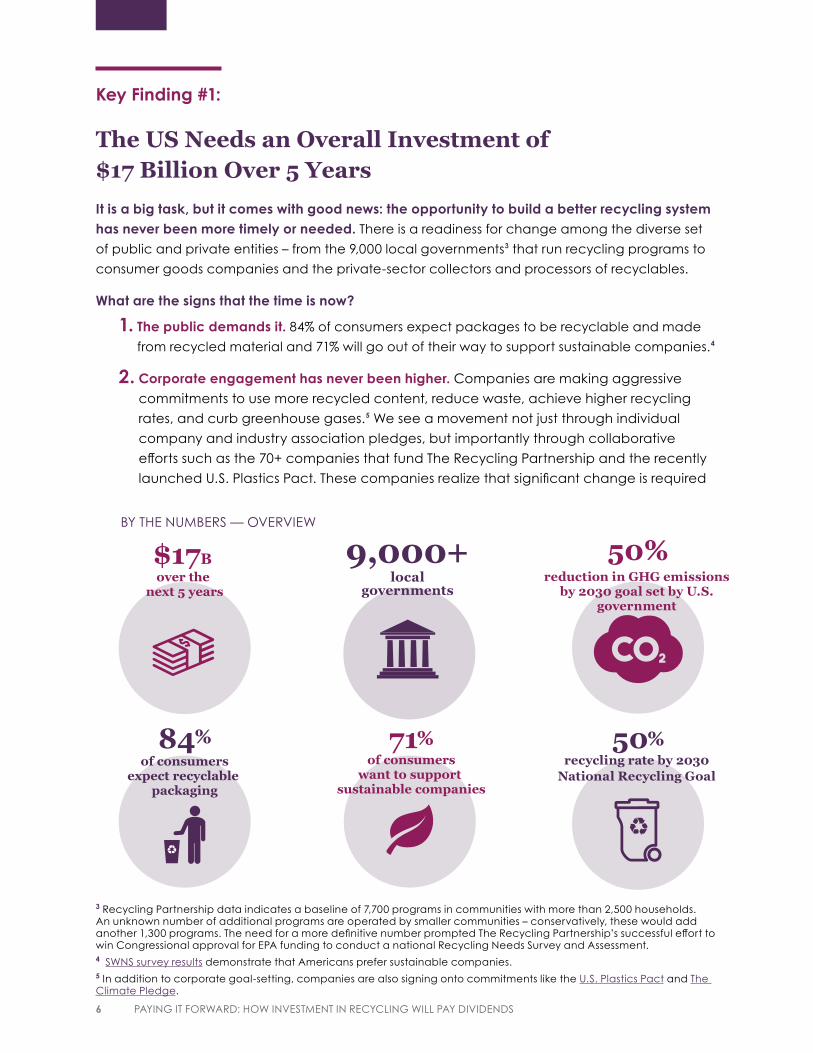
Key Finding #1:
The US Needs an Overall Investment of $17 Billion Over 5 YearsIt is a big task, but it comes with good news: the opportunity to build a better recycling system has never been more timely or needed. There is a readiness for change among the diverse set
of public and private entities – from the 9,000 local governments3 that run recycling programs to
consumer goods companies and the private-sector collectors and processors of recyclables.
What are the signs that the time is now?
1. The public demands it. 84% of consumers expect packages to be recyclable and made
from recycled material and 71% will go out of their way to support sustainable companies.4
2. Corporate engagement has never been higher. Companies are making aggressive
commitments to use more recycled content, reduce waste, achieve higher recycling
rates, and curb greenhouse gases.5 We see a movement not just through individual
company and industry association pledges, but importantly through collaborative
efforts such as the 70+ companies that fund The Recycling Partnership and the recently
launched U.S. Plastics Pact. These companies realize that significant change is required
BY THE NUMBERS — OVERVIEW
3 Recycling Partnership data indicates a baseline of 7,700 programs in communities with more than 2,500 households. An unknown number of additional programs are operated by smaller communities – conservatively, these would add another 1,300 programs. The need for a more definitive number prompted The Recycling Partnership’s successful effort to win Congressional approval for EPA funding to conduct a national Recycling Needs Survey and Assessment.4 SWNS survey results demonstrate that Americans prefer sustainable companies.5 In addition to corporate goal-setting, companies are also signing onto commitments like the U.S. Plastics Pact and The Climate Pledge.
50%
84 of consumers
expect recyclable packaging
71 of consumers
want to support sustainable companies
50
$17Bover the
next 5 yearsreduction in GHG emissions
by 2030 goal set by U.S. government
recycling rate by 2030 National Recycling Goal
9,000+local
governments
7THE RECYCLING PARTNERSHIP
to meet their commitments – they need increased and steady material supply, and they
do not want their packaging to end up in landfills or as litter.
3. Federal and state policymakers from both parties are energized. In addition to a
growing number of bills concerning recycling and circularity at the state and federal
levels, there is also increased support in Congress for the U.S. Environmental Protection
Agency (EPA) to take bold action, with the expectation that the U.S. will reach its
National Recycling Goal of 50% by 2030.
4. The U.S. is taking a leadership role on climate. The U.S. has pledged to cut greenhouse
gas emissions by 50% by 2030. This aggressive goal will require innovative solutions and a
shift to a circular economy.
What’s not included in this analysis?
This report focuses on the residential recycling system and both traditionally
accepted paper and packaging, as well as those packaging formats not
commonly collected in residential programs, like film and flexible plastics.
It does not include an analysis of capital needs to improve recycling for
commercial (retail, restaurants, offices, etc.), institutional (schools, universities,
hospitals, etc.), and public spaces (parks, sports fields, pedestrian areas, etc.) –
these sources of discarded material also need attention and investment to
optimize material sustainability. Composting, material reduction, and reuse are
also critical parts of the circular economy – an economy in which waste and
pollution are designed out – but they also fall outside the scope of this analysis.
Finally, this report does not include funding for recycling operations. However,
without operational support, which is the largest cost center to local
governments for recycling service, uptake of recycling capital improvements
envisioned by this model could be uneven and not fully optimized for
maximum participation or efficiency. Packaging and products have changed
significantly, and municipal service areas have expanded since recycling
programs were implemented in the 1990s, but local governments still solely
bear the estimated $10 billion annual cost of operational expenses to keep
the U.S. residential recycling system in motion. Communities face continual
and significant budgetary pressures, only exacerbated by COVID-19. Without
sustainable funding for operations, communities cannot be compelled to offer
recycling service, even if the cost of capital equipment is covered.6
6 More on the operation of recycling and how those costs are currently carried by local governments can be found in The Recycling Partnership’s 2020 State of Curbside Recycling Report and The Bridge to Circularity reports.
8 PAYING IT FORWARD: HOW INVESTMENT IN RECYCLING WILL PAY DIVIDENDS
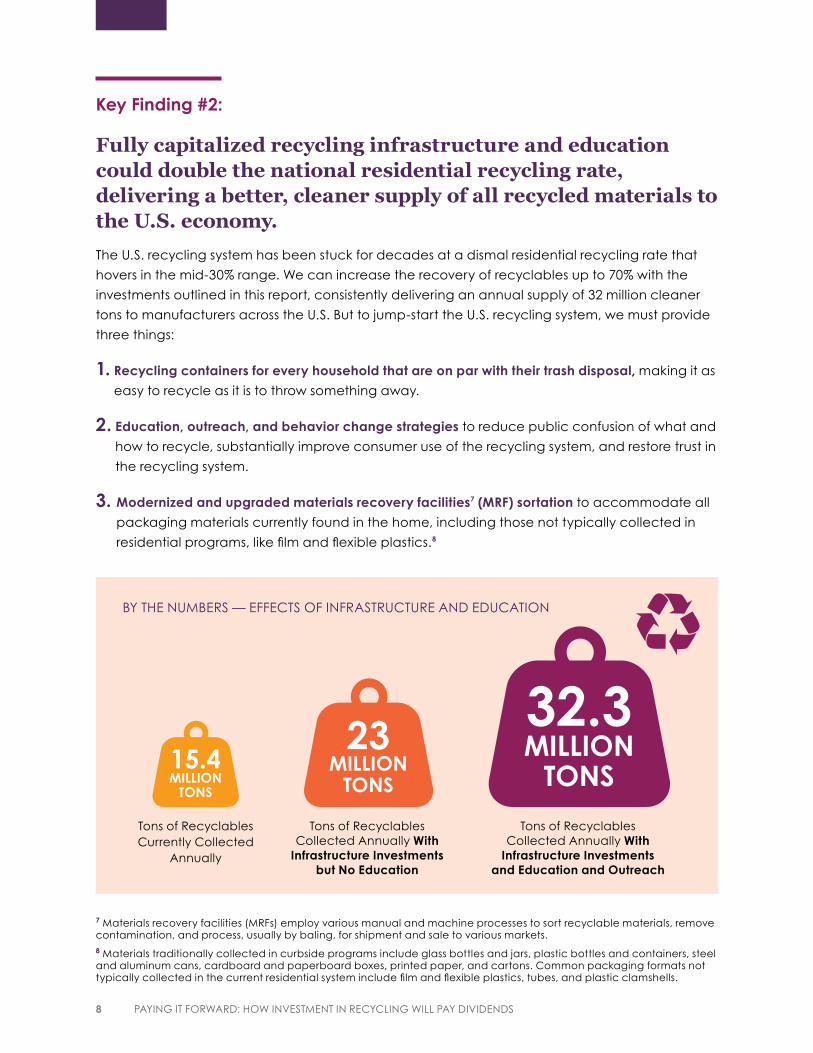
Key Finding #2:
Fully capitalized recycling infrastructure and education could double the national residential recycling rate, delivering a better, cleaner supply of all recycled materials to the U.S. economy.The U.S. recycling system has been stuck for decades at a dismal residential recycling rate that
hovers in the mid-30% range. We can increase the recovery of recyclables up to 70% with the
investments outlined in this report, consistently delivering an annual supply of 32 million cleaner
tons to manufacturers across the U.S. But to jump-start the U.S. recycling system, we must provide
three things:
1. Recycling containers for every household that are on par with their trash disposal, making it as
easy to recycle as it is to throw something away.
2. Education, outreach, and behavior change strategies to reduce public confusion of what and
how to recycle, substantially improve consumer use of the recycling system, and restore trust in
the recycling system.
3. Modernized and upgraded materials recovery facilities7 (MRF) sortation to accommodate all
packaging materials currently found in the home, including those not typically collected in
residential programs, like film and flexible plastics.8
BY THE NUMBERS — EFFECTS OF INFRASTRUCTURE AND EDUCATION
Tons of Recyclables Currently Collected
Annually
Tons of Recyclables Collected Annually With
Infrastructure Investments but No Education
Tons of Recyclables Collected Annually With
Infrastructure Investments and Education and Outreach
7 Materials recovery facilities (MRFs) employ various manual and machine processes to sort recyclable materials, remove contamination, and process, usually by baling, for shipment and sale to various markets.8 Materials traditionally collected in curbside programs include glass bottles and jars, plastic bottles and containers, steel and aluminum cans, cardboard and paperboard boxes, printed paper, and cartons. Common packaging formats not typically collected in the current residential system include film and flexible plastics, tubes, and plastic clamshells.
9THE RECYCLING PARTNERSHIP
Key Finding #3:
Policy solutions need to be built with collaborative corporate, government, NGO, and policymaker engagement.The foundations of the modern U.S. recycling
system were built on sensible policies. A new
wave of policy action can take the system to
the next level. A shared responsibility model is
needed to drive significant new investment in
recycling; otherwise, we cannot address the
system challenges presented in this report. It
is simply too slow and expensive for any one
company, community, or organization to solve.
Policymakers are looking to nonprofit and
private-sector partners to inform and build
pragmatic and uniquely American solutions to
recycling’s challenges. The Circular Economy
Accelerator (CEA) understands that if we want
to level up and unify the U.S. recycling system,
then we must get serious about the need for
federal policy and the important role packaging
companies can play in crafting a plan that works
for all. In late 2020 the CEA released a policy
report, Accelerating Recycling: Policy to Unlock
Supply for the Circular Economy Report (Policy
Report). The policy report is a testament to the
need to act and the power of public-private
solution-building.9
The system needs outlined in this report are
quantifiable and achievable, but they will require
collaboration from all parts of industry, all levels
of government, policymakers, investors, and the
public to bring them to fruition and maximize
their potential. It is a challenge we know all
stakeholders are ready and eager to achieve.
9 The CEA’s members collectively helped draft the policy report, published in late 2020, which was ultimately endorsed by 18 of the world’s largest companies and trade organizations. Learn more at: recyclingpartnership.org/accelerator-policy/.
While outside the scope of this report, we recognize that the success of improved recycling access and processing is also contingent on companies designing packaging for circularity.
Circular packaging design
will improve the recovery of
materials as they move through
the recycling system and
increase the use of recycled
content to stimulate market
demand.
Additionally, investments are
needed to grow adequate
end-market capacity, which is
an important consideration for
policymakers and businesses
alike. End markets may also
need policy and financial
support to accelerate
expansion, but it will pay
dividends as domestic end
markets provide market pull
for the increased supply of
recyclable materials, while
concurrently supporting growth
in U.S.-based processing and
manufacturing jobs.
10 PAYING IT FORWARD: HOW INVESTMENT IN RECYCLING WILL PAY DIVIDENDS
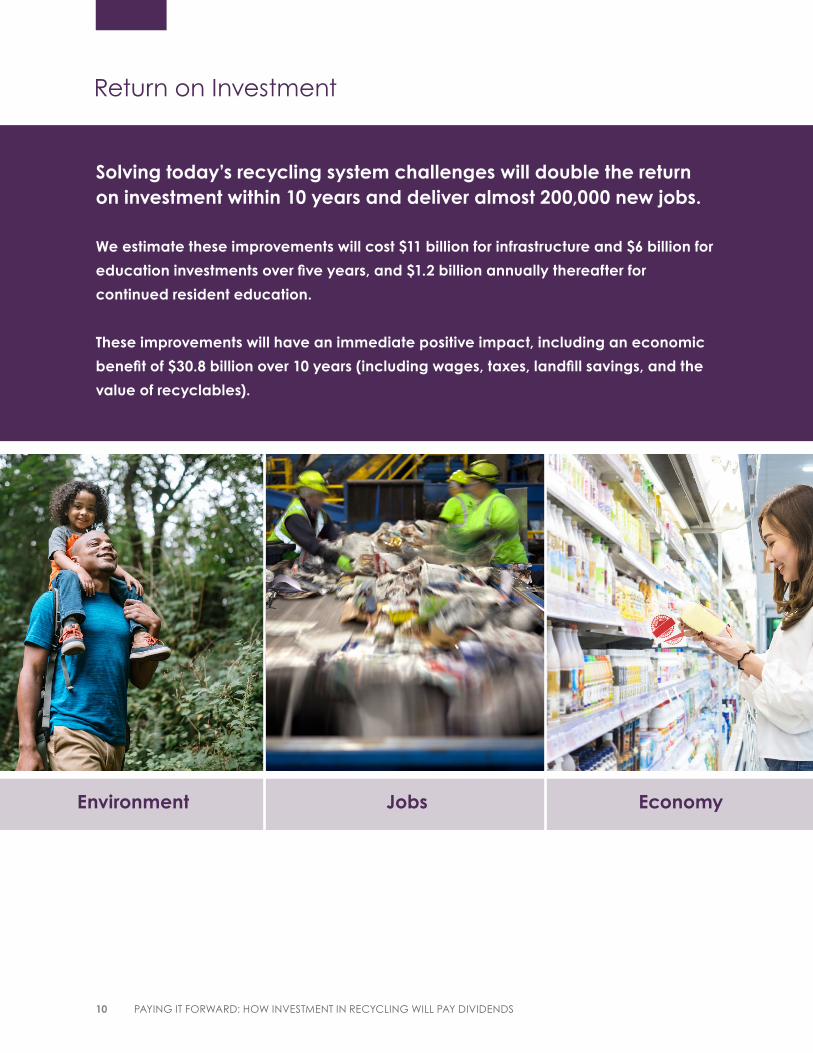
Return on Investment
Solving today’s recycling system challenges will double the return on investment within 10 years and deliver almost 200,000 new jobs.
We estimate these improvements will cost $11 billion for infrastructure and $6 billion for
education investments over five years, and $1.2 billion annually thereafter for
continued resident education.
These improvements will have an immediate positive impact, including an economic
benefit of $30.8 billion over 10 years (including wages, taxes, landfill savings, and the
value of recyclables).
Environment Jobs Economy
11THE RECYCLING PARTNERSHIP
There are important returns on investment in the first 10 years alone:
1. We create almost 200,000 new jobs and deliver
$30 billion in economic impact.10
2. The recycling rate goes from approximately
32% to 68%, delivering 169 million tons of new
recyclables.
3. 40 million underserved households are able
to recycle the packaging they receive in their
homes.
4. We achieve high levels of MRF efficiency and
bale quality through upgrades to 375 MRFs and
the construction of 57 new MRFs, streamlining
material flow from collection to market.
5. We solve tough recycling challenges like
packaging that is not yet recyclable at scale.
6. We avoid an estimated $9.4 billion in landfill
costs.11
7. We create an estimated $8.8 billion in new,
high-quality recyclable commodities.
8. We generate huge environmental benefits from
the total 320 million tons of materials recovered,
saving:
• 710 million metric tons of CO2 equivalent
• The average water usage of 30 million people
• The average energy usage of 28 million
people
• The equivalent of 129 million cars’ emissions
9. We create the confidence in material supply
to spur investments in new end markets and
technologies.
10. We build consumer confidence in recycling
and in the brands that create the products and
packaging that people want and need.
10 Calculated using the wage and tax multiplier from the 2020 EPA Recycling Economic Information Report, epa.gov/sites/production/files/2020-11/documents/rei_report_508_compliant.pdf, and adding The Partnership’s calculated landfill savings and value of recyclables figures.11 Environmental Research and Education Foundation, Analysis of MSW Landfill Tipping Fees: 2020 erefdn.org/product/analysis-msw-landfill-tipping-fees-2/
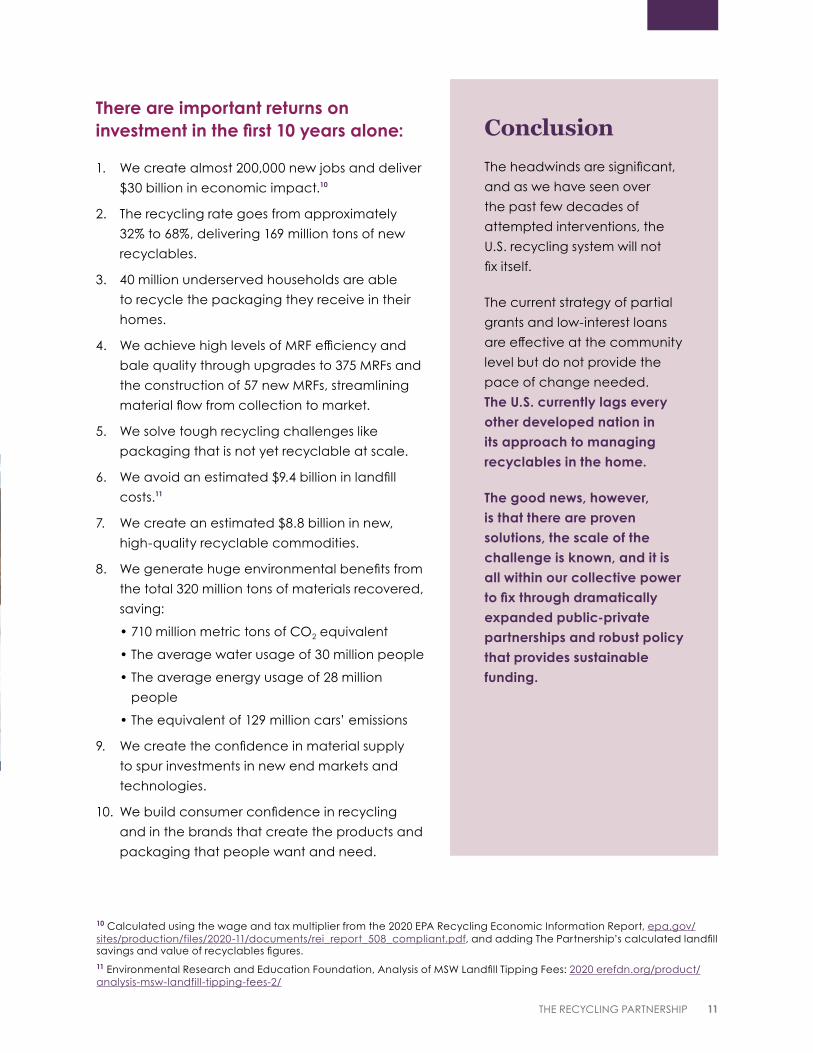
ConclusionThe headwinds are significant,
and as we have seen over
the past few decades of
attempted interventions, the
U.S. recycling system will not
fix itself.
The current strategy of partial
grants and low-interest loans
are effective at the community
level but do not provide the
pace of change needed.
The U.S. currently lags every other developed nation in its approach to managing recyclables in the home.
The good news, however, is that there are proven solutions, the scale of the challenge is known, and it is all within our collective power to fix through dramatically expanded public-private partnerships and robust policy that provides sustainable funding.
12 PAYING IT FORWARD: HOW INVESTMENT IN RECYCLING WILL PAY DIVIDENDS
Without an estimated $17 billion intervention
over five years, recycling will fail to deliver on
the needs of industry, the sustainability
promises of companies, and the expectations
of consumers and elected officials.
The flat performance of the U.S. recycling system over the past two decades is due to its
inability to serve the entire U.S. population with fully optimized collection systems, provide
comprehensive education and outreach, and create an adequate materials recovery facility
(MRF) infrastructure.
These shortfalls illustrate fundamental constraints that must be addressed through bold
leadership. The interventions described in this report, which are based on the Recycling Capital
and Education Needs Model (model), will reverse the current system inertia, overturn the status
quo, and dynamically move us beyond the dismal 32% residential recycling rate, which will
remain stubbornly stuck without large-scale investment.
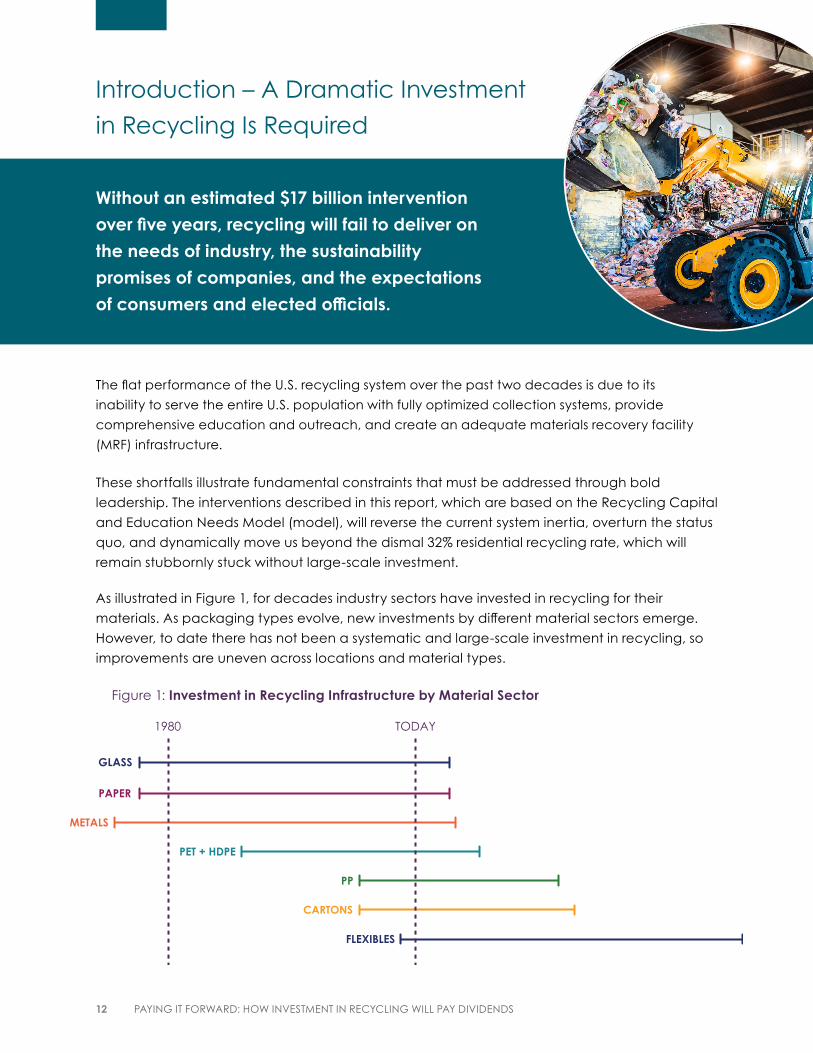
As illustrated in Figure 1, for decades industry sectors have invested in recycling for their
materials. As packaging types evolve, new investments by different material sectors emerge.
However, to date there has not been a systematic and large-scale investment in recycling, so
improvements are uneven across locations and material types.
GLASS
Figure 1: Investment in Recycling Infrastructure by Material Sector
Introduction – A Dramatic Investment
in Recycling Is Required
13THE RECYCLING PARTNERSHIP
These gaps in the U.S. curbside recycling system were documented in The Recycling Partnership’s
2019 Bridge to Circularity and 2020 State of Curbside Recycling reports. The headwinds and
challenges include:
12 In Indianapolis, the barrier of an $8/month service charge has led to a subscription rate of only 10% of the city’s 290,000 households.13 The growth of processing fees has led some communities to decide they cannot afford a continual investment in recycling services, as documented in the 2020 State of Curbside Recyling Report and in ongoing local news stories in various parts of the country.
Introduction – A Dramatic Investment
in Recycling Is Required
More than two out of five Americans
simply cannot recycle conveniently at
home. With 40 million U.S. households
experiencing no or inequitable access,
millions of tons of recyclables end up
in the landfill every year. Equitable
access means all people, rich or
poor, rural or urban, in multifamily or
single-family housing, can recycle and
that they have the confidence and
understanding to do it well.
Some people must pay extra to
recycle. In key areas of the country,
curbside access relies on households
requesting subscription service and
adding the expense to their monthly
budget — a barrier that leaves millions
of families outside the recycling
system.12
Multifamily housing is categorically
underserved. Multifamily recycling
access relies on individual private
property owners to prioritize recycling
services. While multifamily recycling
can be supported by local recycling
ordinances, enforcement efforts
are costly and function with varying
degrees of success.
It is difficult for MRFs to invest in
modernization without increasing
fees to communities. Although MRF
investment is critical to keep pace with
packaging innovations and maximize
material recovery, MRFs rely heavily on
community recycling programs to pay
processing fees, leading to reliance
on local taxation and service fees,
which create financial barriers that
can deter local recycling program
expansion and further hinder needed
MRF upgrades.13
14 PAYING IT FORWARD: HOW INVESTMENT IN RECYCLING WILL PAY DIVIDENDS
14 www.mckinsey.com/industries/consumer-packaged-goods/our-insights/what-got-us-here-wont-get-us-there-a-new-model-for-the-consumer-goods-industry)15 www.cbo.gov/publication/54539. 16 The U.S. Census spent between $2 and $75 per household to reach residents. The 2020 State of Curbside Recycling Report found that, for those communities that did have outreach budgets, the average community allocated $1.16 per household for recycling education. The Partnership’s recently released Behavior Change White Paper provides more context to resident education needs.17 In December 2020, the U.S. Conference of Mayors, National League of Cities, and National Association of Counties submitted comments to the U.S. EPA on the Draft National Recycling Strategy. In the letter, they outlined the headwinds faced by communities and support EPA’s engagement to build a better recycling system.
The public is confused and needs help
building trust. Recycling education is
a key and critical factor to success.
While we see other kinds of outreach
efforts to enlist public action receive
between $2 and $75 per household
in education and outreach funding
annually, recycling programs
frequently invest little more than the
cost of printing and posting an annual
mailer to engage with residents, if
they invest at all.16 Many communities
have no outreach budget whatsoever,
leaving Americans wondering
what they can recycle and how to
participate. And the importance of
engaging multicultural communities
remains a largely unmet need.
Low cost of disposal. Inexpensive
landfills turn smart environmental
decisions against the bottom line,
with landfilling often half the cost of
recycling. Local governments bear
the brunt of this cost disparity and too
often choose disposal over recycling.
Competing priorities for communities.
A system that relies on cities to
make investment choices between
recycling and essential services such
as police, fire, streets, and schools
faces an uphill battle in making scaled
improvement.17
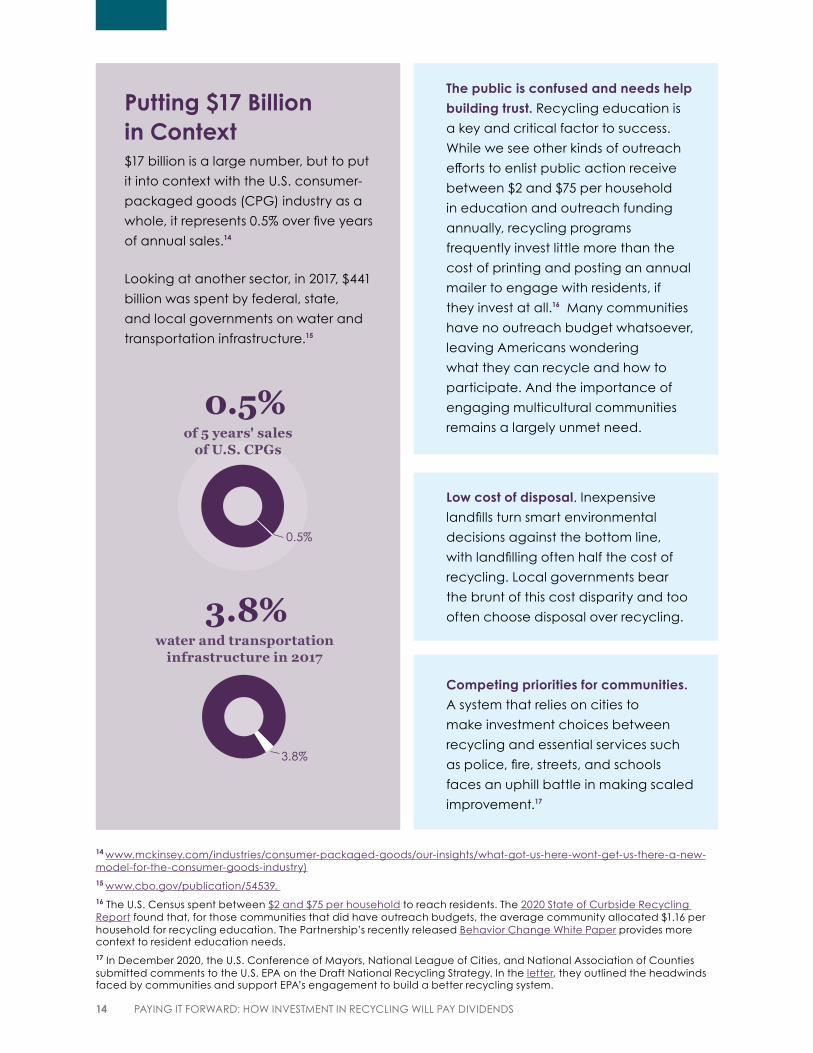
Putting $17 Billion in Context$17 billion is a large number, but to put
it into context with the U.S. consumer-
packaged goods (CPG) industry as a
whole, it represents 0.5% over five years
of annual sales.14
Looking at another sector, in 2017, $441
billion was spent by federal, state,
and local governments on water and
transportation infrastructure.15
0.5%
3.8%
of 5 years' sales of U.S. CPGs
water and transportation infrastructure in 2017
3.8%
0.5%
15THE RECYCLING PARTNERSHIP
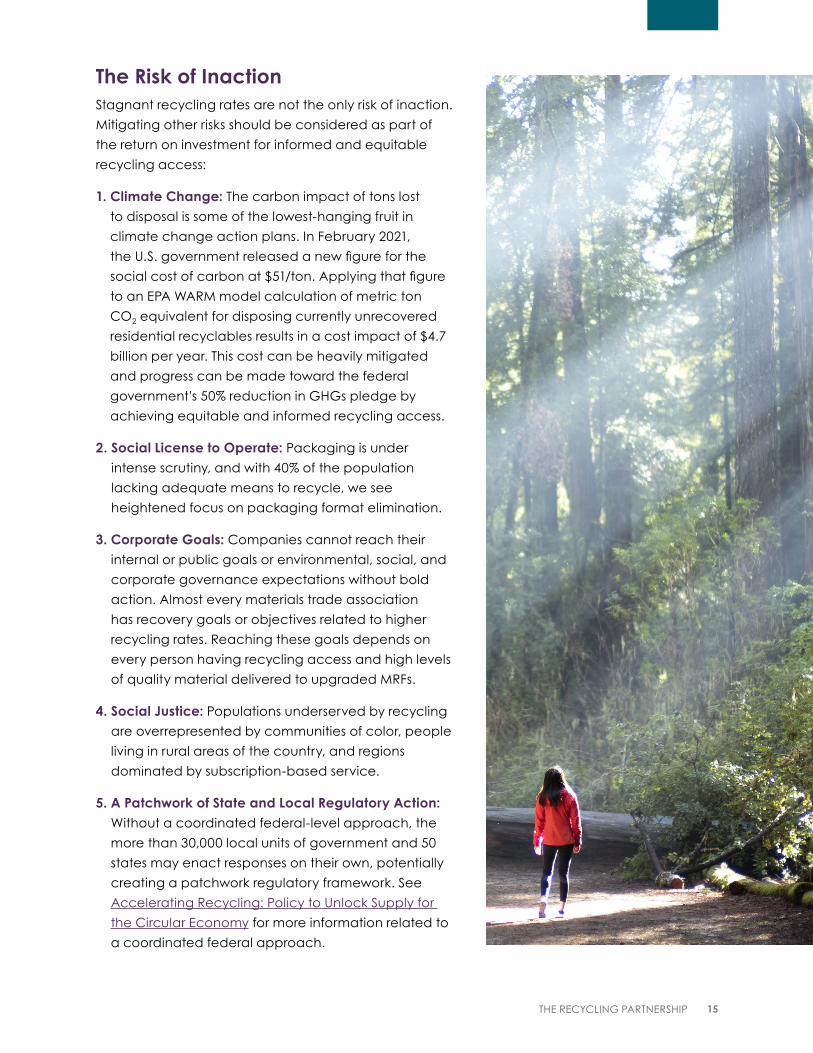
The Risk of InactionStagnant recycling rates are not the only risk of inaction.
Mitigating other risks should be considered as part of
the return on investment for informed and equitable
recycling access:
1. Climate Change: The carbon impact of tons lost
to disposal is some of the lowest-hanging fruit in
climate change action plans. In February 2021,
the U.S. government released a new figure for the
social cost of carbon at $51/ton. Applying that figure
to an EPA WARM model calculation of metric ton
CO2 equivalent for disposing currently unrecovered
residential recyclables results in a cost impact of $4.7
billion per year. This cost can be heavily mitigated
and progress can be made toward the federal
government's 50% reduction in GHGs pledge by
achieving equitable and informed recycling access.
2. Social License to Operate: Packaging is under
intense scrutiny, and with 40% of the population
lacking adequate means to recycle, we see
heightened focus on packaging format elimination.
3. Corporate Goals: Companies cannot reach their
internal or public goals or environmental, social, and
corporate governance expectations without bold
action. Almost every materials trade association
has recovery goals or objectives related to higher
recycling rates. Reaching these goals depends on
every person having recycling access and high levels
of quality material delivered to upgraded MRFs.
4. Social Justice: Populations underserved by recycling
are overrepresented by communities of color, people
living in rural areas of the country, and regions
dominated by subscription-based service.
5. A Patchwork of State and Local Regulatory Action: Without a coordinated federal-level approach, the
more than 30,000 local units of government and 50
states may enact responses on their own, potentially
creating a patchwork regulatory framework. See
Accelerating Recycling: Policy to Unlock Supply for
the Circular Economy for more information related to
a coordinated federal approach.
16 PAYING IT FORWARD: HOW INVESTMENT IN RECYCLING WILL PAY DIVIDENDS
Breaking Down the Needed Investment
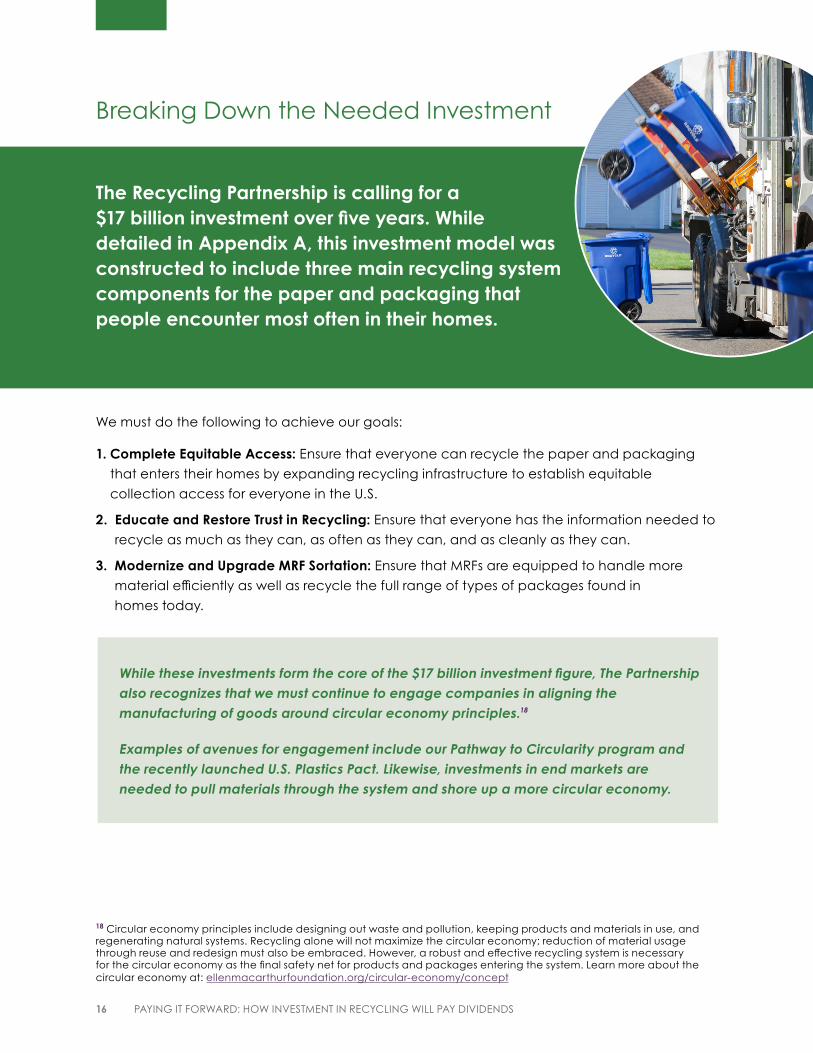
The Recycling Partnership is calling for a $17 billion investment over five years. While detailed in Appendix A, this investment model was constructed to include three main recycling system components for the paper and packaging that people encounter most often in their homes.
We must do the following to achieve our goals:
1. Complete Equitable Access: Ensure that everyone can recycle the paper and packaging
that enters their homes by expanding recycling infrastructure to establish equitable
collection access for everyone in the U.S.
2. Educate and Restore Trust in Recycling: Ensure that everyone has the information needed to
recycle as much as they can, as often as they can, and as cleanly as they can.
3. Modernize and Upgrade MRF Sortation: Ensure that MRFs are equipped to handle more
material efficiently as well as recycle the full range of types of packages found in
homes today.
While these investments form the core of the $17 billion investment figure, The Partnership also recognizes that we must continue to engage companies in aligning the manufacturing of goods around circular economy principles.18
Examples of avenues for engagement include our Pathway to Circularity program and the recently launched U.S. Plastics Pact. Likewise, investments in end markets are needed to pull materials through the system and shore up a more circular economy.
18 Circular economy principles include designing out waste and pollution, keeping products and materials in use, and regenerating natural systems. Recycling alone will not maximize the circular economy; reduction of material usage through reuse and redesign must also be embraced. However, a robust and effective recycling system is necessary for the circular economy as the final safety net for products and packages entering the system. Learn more about the circular economy at: ellenmacarthurfoundation.org/circular-economy/concept
17THE RECYCLING PARTNERSHIP
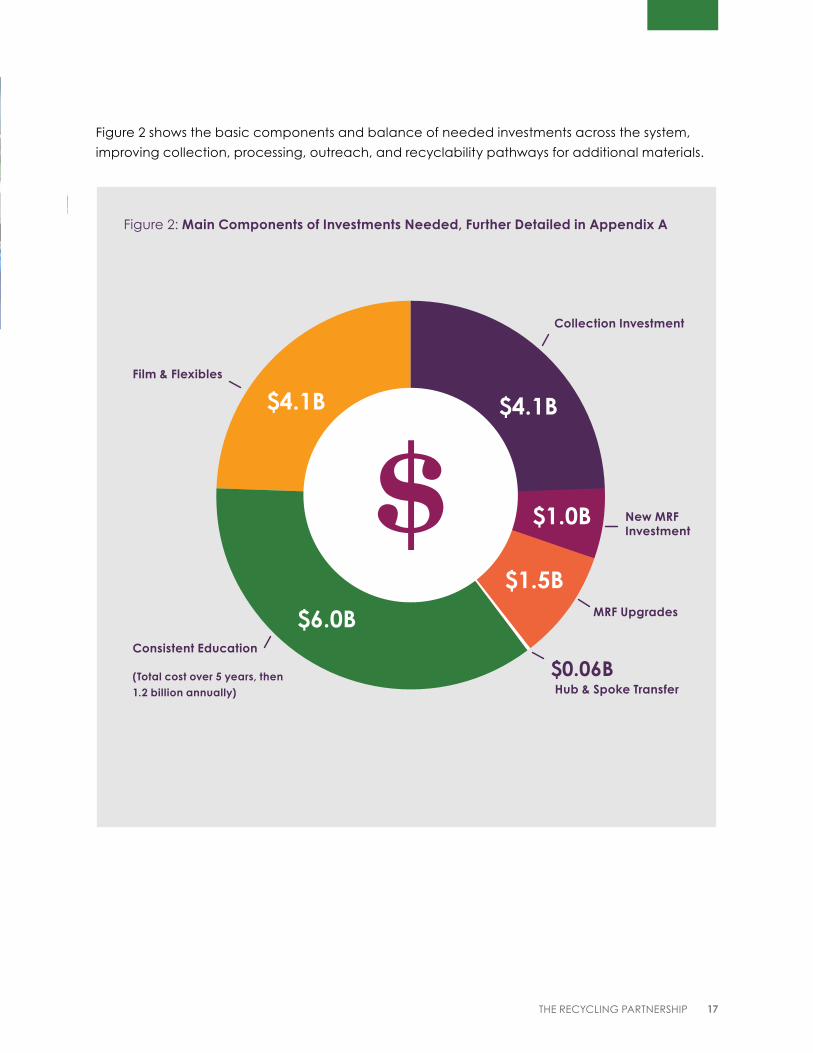
Figure 2: Main Components of Investments Needed, Further Detailed in Appendix A
Collection Investment
New MRF Investment
MRF Upgrades
Hub & Spoke Transfer
Consistent Education
(Total cost over 5 years, then 1.2 billion annually)
Film & Flexibles
$0.06B
$6.0B
$4.1B $4.1B
$1.0B
$1.5B
$
Figure 2 shows the basic components and balance of needed investments across the system,
improving collection, processing, outreach, and recyclability pathways for additional materials.
18 PAYING IT FORWARD: HOW INVESTMENT IN RECYCLING WILL PAY DIVIDENDS
Collection Investments – The Path to Equitable Access Not everyone recycles the same way – different urban, suburban, rural, multi or single family
home settings all impact how recycling services are most efficiently and effectively delivered.
However, no one should be excluded from being able to participate, be required to go through
extra steps or pay extra fees to recycle, make extra trips to recycle when it isn’t required for trash
disposal, or have to find alternative ways to keep their recyclables out of the landfill.
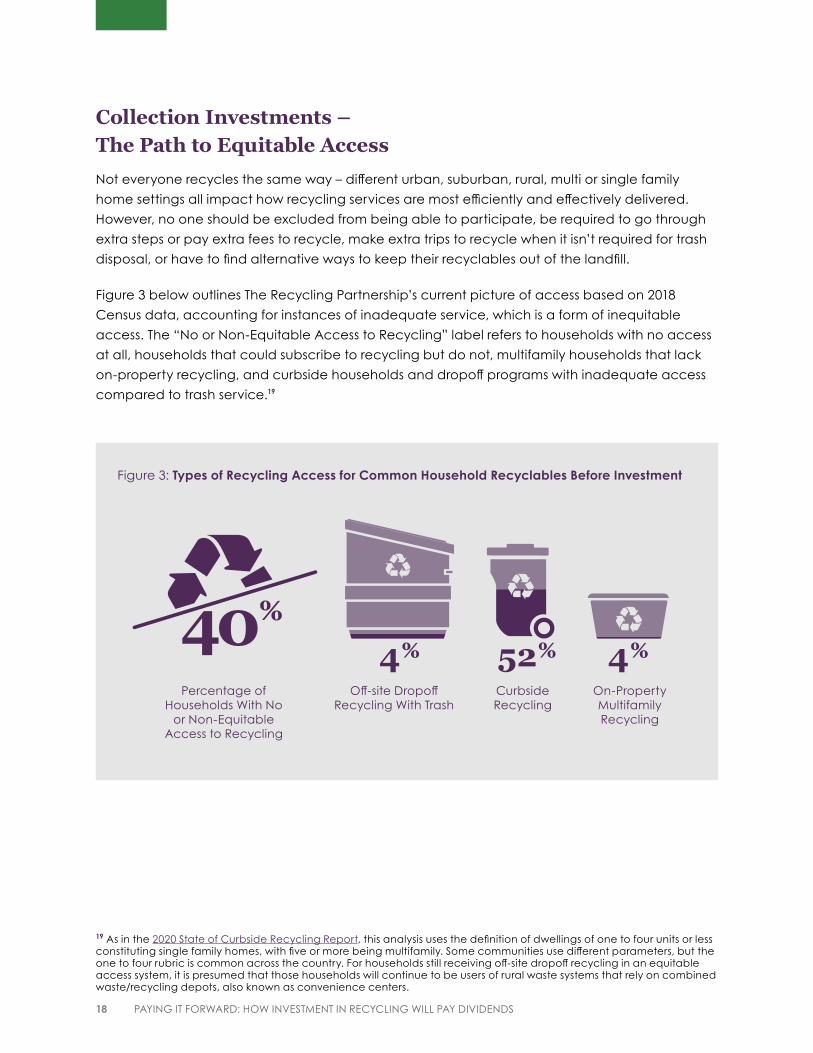
Figure 3 below outlines The Recycling Partnership’s current picture of access based on 2018
Census data, accounting for instances of inadequate service, which is a form of inequitable
access. The “No or Non-Equitable Access to Recycling” label refers to households with no access
at all, households that could subscribe to recycling but do not, multifamily households that lack
on-property recycling, and curbside households and dropoff programs with inadequate access
compared to trash service.19
Figure 3: Types of Recycling Access for Common Household Recyclables Before Investment
Off-site DropoffRecycling With Trash
Percentage of Households With No
or Non-Equitable Access to Recycling
CurbsideRecycling
On-PropertyMultifamilyRecycling
19 As in the 2020 State of Curbside Recycling Report, this analysis uses the definition of dwellings of one to four units or less constituting single family homes, with five or more being multifamily. Some communities use different parameters, but the one to four rubric is common across the country. For households still receiving off-site dropoff recycling in an equitable access system, it is presumed that those households will continue to be users of rural waste systems that rely on combined waste/recycling depots, also known as convenience centers.
19THE RECYCLING PARTNERSHIP
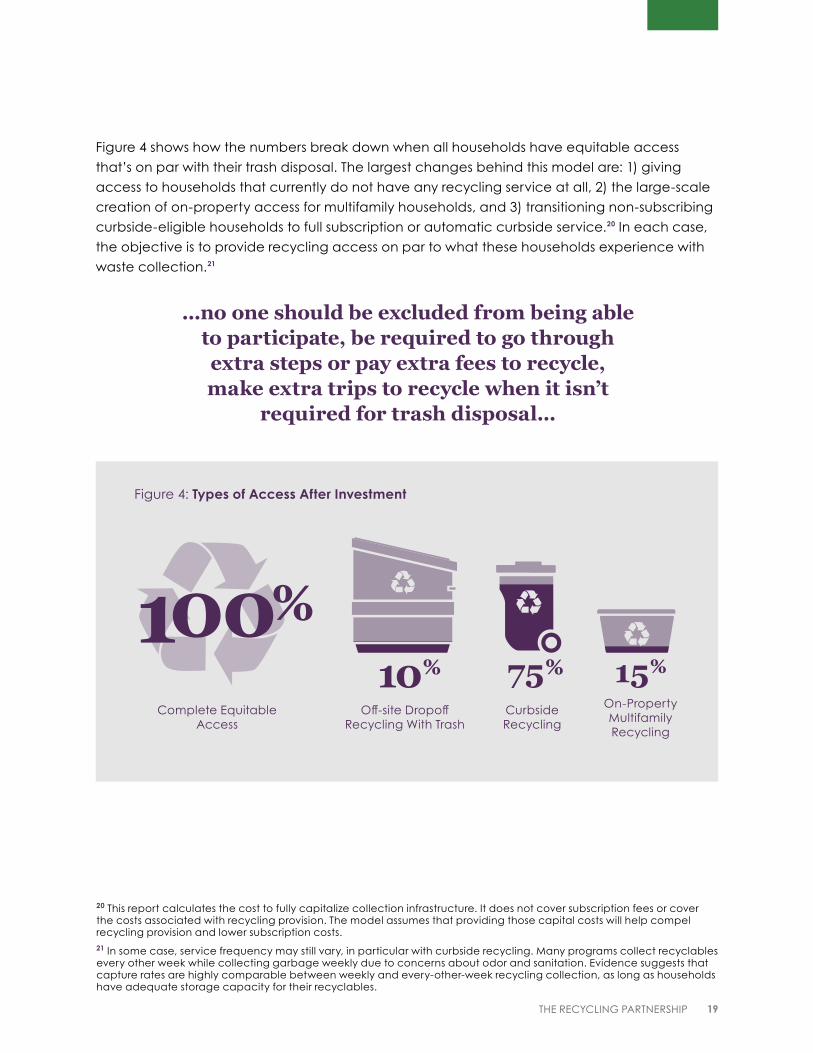
Figure 4: Types of Access After Investment
Off-site DropoffRecycling With Trash
Complete Equitable Access
CurbsideRecycling
On-PropertyMultifamilyRecycling
Figure 4 shows how the numbers break down when all households have equitable access
that’s on par with their trash disposal. The largest changes behind this model are: 1) giving
access to households that currently do not have any recycling service at all, 2) the large-scale
creation of on-property access for multifamily households, and 3) transitioning non-subscribing
curbside-eligible households to full subscription or automatic curbside service.20 In each case,
the objective is to provide recycling access on par to what these households experience with
waste collection.21
20 This report calculates the cost to fully capitalize collection infrastructure. It does not cover subscription fees or cover the costs associated with recycling provision. The model assumes that providing those capital costs will help compel recycling provision and lower subscription costs. 21 In some case, service frequency may still vary, in particular with curbside recycling. Many programs collect recyclables every other week while collecting garbage weekly due to concerns about odor and sanitation. Evidence suggests that capture rates are highly comparable between weekly and every-other-week recycling collection, as long as households have adequate storage capacity for their recyclables.
...no one should be excluded from being able to participate, be required to go through extra steps or pay extra fees to recycle, make extra trips to recycle when it isnʼt
required for trash disposal...
100%
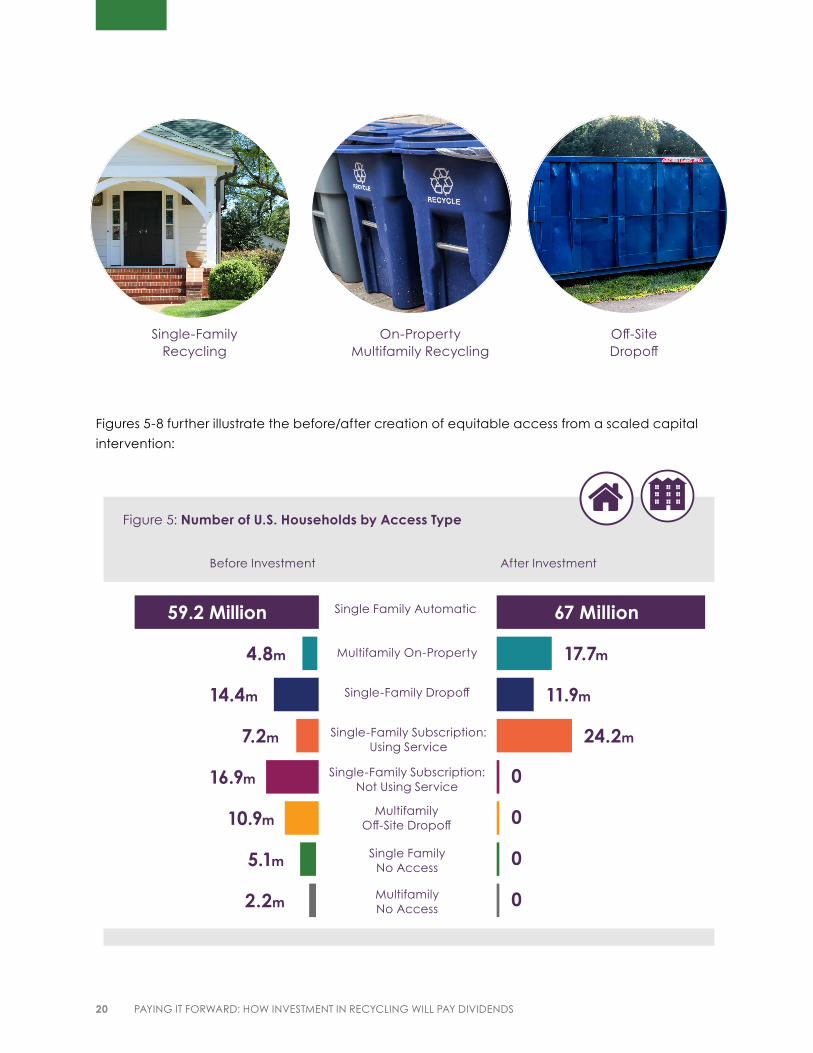
20 PAYING IT FORWARD: HOW INVESTMENT IN RECYCLING WILL PAY DIVIDENDS
Off-Site Dropoff
On-Property Multifamily Recycling
Single-Family Recycling
Figures 5-8 further illustrate the before/after creation of equitable access from a scaled capital
intervention:
Before Investment After Investment
Single Family Automatic
Single-Family Subscription: Not Using Service
Single Family No Access
Single-Family Dropoff
Single-Family Subscription: Using Service
Multifamily Off-Site Dropoff
Multifamily On-Property
Multifamily No Access
59.2 Million
4.8m
14.4m
7.2m
16.9m
10.9m
5.1m
2.2m
67 Million
11.9m
24.2m
0
17.7m
0
0
0
Figure 5: Number of U.S. Households by Access Type
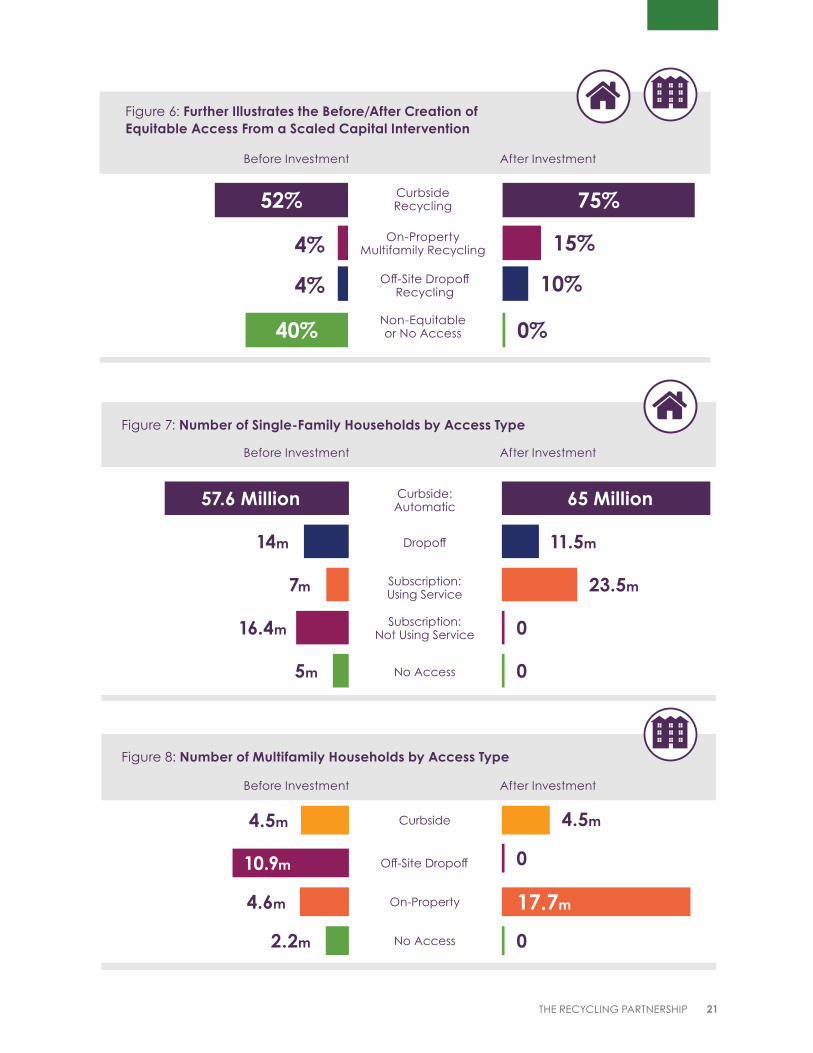
21THE RECYCLING PARTNERSHIP
Non-Equitable or No Access
Off-Site Dropoff Recycling
On-PropertyMultifamily Recycling
Curbside Recycling 75%
15%
10%
0%
52%
40%
4%
4%
Before Investment
Before Investment After Investment
After Investment
Figure 6: Further Illustrates the Before/After Creation of Equitable Access From a Scaled Capital Intervention
Curbside: Automatic 65 Million
Dropoff 11.5m
Subscription: Using Service
23.5m
Subscription: Not Using Service 0
No Access
57.6 Million
14m
7m
16.4m
5m 0
Off-Site Dropoff
On-Property
Figure 7: Number of Single-Family Households by Access Type
Figure 8: Number of Multifamily Households by Access Type
0
4.5m
17.7m
Curbside4.5m
No Access 02.2m
10.9m
4.6m
Before Investment After Investment
Before Investment After Investment
22 PAYING IT FORWARD: HOW INVESTMENT IN RECYCLING WILL PAY DIVIDENDS
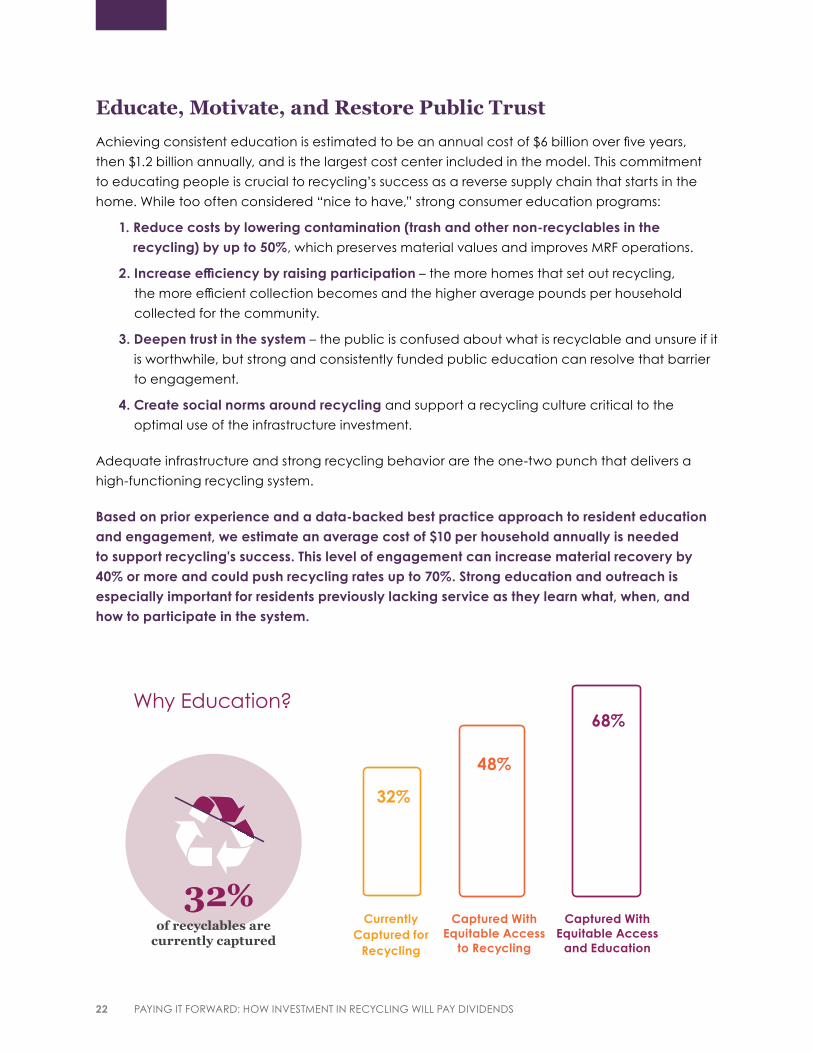
Educate, Motivate, and Restore Public TrustAchieving consistent education is estimated to be an annual cost of $6 billion over five years,
then $1.2 billion annually, and is the largest cost center included in the model. This commitment
to educating people is crucial to recycling’s success as a reverse supply chain that starts in the
home. While too often considered “nice to have,” strong consumer education programs:
1. Reduce costs by lowering contamination (trash and other non-recyclables in the recycling) by up to 50%, which preserves material values and improves MRF operations.
2. Increase efficiency by raising participation – the more homes that set out recycling,
the more efficient collection becomes and the higher average pounds per household
collected for the community.
3. Deepen trust in the system – the public is confused about what is recyclable and unsure if it
is worthwhile, but strong and consistently funded public education can resolve that barrier
to engagement.
4. Create social norms around recycling and support a recycling culture critical to the
optimal use of the infrastructure investment.
Adequate infrastructure and strong recycling behavior are the one-two punch that delivers a
high-functioning recycling system.
Based on prior experience and a data-backed best practice approach to resident education and engagement, we estimate an average cost of $10 per household annually is needed to support recycling's success. This level of engagement can increase material recovery by 40% or more and could push recycling rates up to 70%. Strong education and outreach is especially important for residents previously lacking service as they learn what, when, and how to participate in the system.
Why Education?
32%of recyclables are
currently captured
48%
68%
32%
Currently Captured for
Recycling
Captured With Equitable Access
to Recycling
Captured With Equitable Access
and Education
23THE RECYCLING PARTNERSHIP
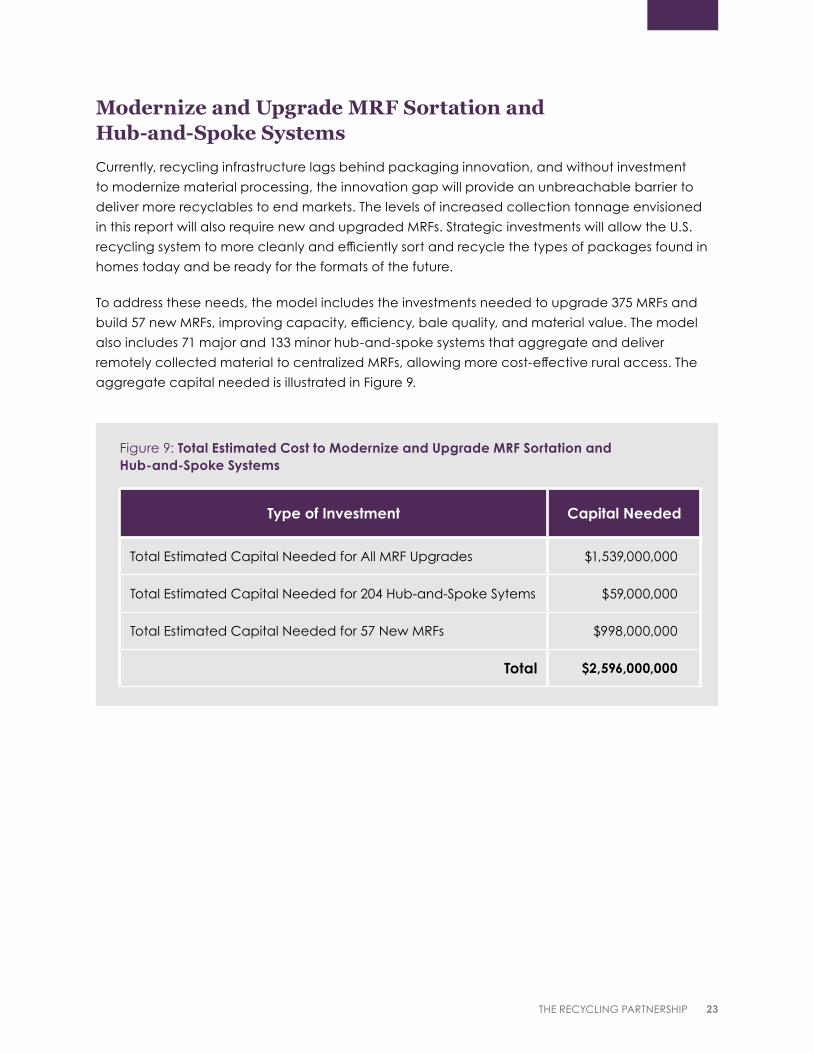
Modernize and Upgrade MRF Sortation and Hub-and-Spoke Systems Currently, recycling infrastructure lags behind packaging innovation, and without investment
to modernize material processing, the innovation gap will provide an unbreachable barrier to
deliver more recyclables to end markets. The levels of increased collection tonnage envisioned
in this report will also require new and upgraded MRFs. Strategic investments will allow the U.S.
recycling system to more cleanly and efficiently sort and recycle the types of packages found in
homes today and be ready for the formats of the future.
To address these needs, the model includes the investments needed to upgrade 375 MRFs and
build 57 new MRFs, improving capacity, efficiency, bale quality, and material value. The model
also includes 71 major and 133 minor hub-and-spoke systems that aggregate and deliver
remotely collected material to centralized MRFs, allowing more cost-effective rural access. The
aggregate capital needed is illustrated in Figure 9.
Figure 9: Total Estimated Cost to Modernize and Upgrade MRF Sortation and Hub-and-Spoke Systems
Type of Investment Capital Needed
Total Estimated Capital Needed for All MRF Upgrades $1,539,000,000
Total Estimated Capital Needed for 204 Hub-and-Spoke Sytems $59,000,000
Total Estimated Capital Needed for 57 New MRFs $998,000,000
Total $2,596,000,000
24 PAYING IT FORWARD: HOW INVESTMENT IN RECYCLING WILL PAY DIVIDENDS
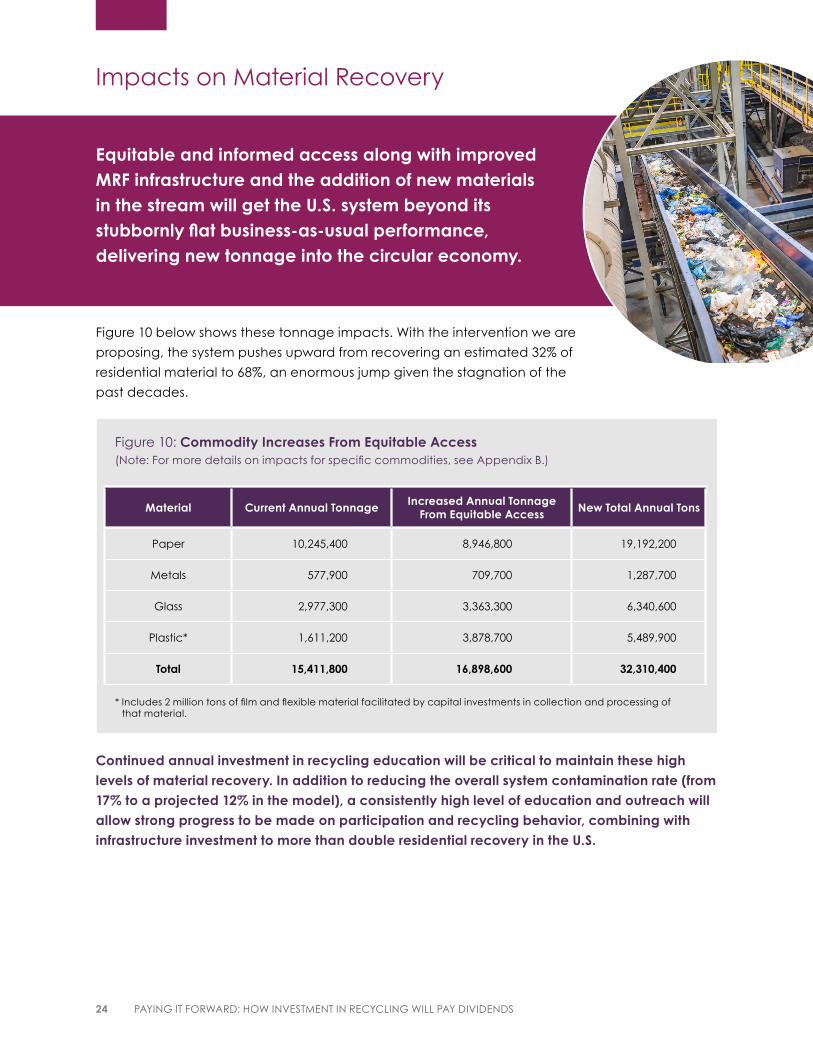
Equitable and informed access along with improved MRF infrastructure and the addition of new materials in the stream will get the U.S. system beyond its stubbornly flat business-as-usual performance, delivering new tonnage into the circular economy.
Figure 10 below shows these tonnage impacts. With the intervention we are
proposing, the system pushes upward from recovering an estimated 32% of
residential material to 68%, an enormous jump given the stagnation of the
past decades.
Continued annual investment in recycling education will be critical to maintain these high levels of material recovery. In addition to reducing the overall system contamination rate (from 17% to a projected 12% in the model), a consistently high level of education and outreach will allow strong progress to be made on participation and recycling behavior, combining with infrastructure investment to more than double residential recovery in the U.S.
Impacts on Material Recovery
Material Current Annual Tonnage Increased Annual Tonnage From Equitable Access New Total Annual Tons
Paper 10,245,400 8,946,800 19,192,200
Metals 577,900 709,700 1,287,700
Glass 2,977,300 3,363,300 6,340,600
Plastic* 1,611,200 3,878,700 5,489,900
Total 15,411,800 16,898,600 32,310,400
* Includes 2 million tons of film and flexible material facilitated by capital investments in collection and processing of that material.
Figure 10: Commodity Increases From Equitable Access(Note: For more details on impacts for specific commodities, see Appendix B.)
25THE RECYCLING PARTNERSHIP
Recognizing Additional System CostsWhile a $17 billion investment will make a
significant leap forward in the U.S. recycling
system, there are many other system
costs and challenges that will need to be
addressed by various stakeholders. Other key
elements include operational costs, recycling
infrastructure that is already in place that will
need to be replaced over time, and capital
for post-MRF processing and end-market
development. Although they are not the focus
of this report, these elements matter greatly in
achieving the full benefits of equitable access.
Capital Investments vs. System Operational Costs
Putting the necessary capital infrastructure
in place is one part of ensuring a healthy
residential recycling system. Operating
the system is the other side of the coin.
Currently, U.S. communities pay the operating
expenses for recycling programs to the tune
of $10 billion annually.22 While the $17 billion
system investments outlined in this report
are a critical first step, absent any other
kinds of intervention, the bulk of program
operational costs will continue to be borne
by local governments and financed through
disaggregated decision-making and localized
taxation, which has led to the patchwork
recycling system in place today.
A recycling capitalization plan must recognize
this as a central feature of the U.S. recycling
system and, over time or in parallel, incentivize
or otherwise address the challenge of
operational costs, including the standard
Restrictions of Local Taxation Approach
A recycling system that relies mostly
on local taxation to finance system
improvement will continue to suffer
the inherent restrictions of that
approach. Recycling collection
investment will compete with the
entire array of local services for
limited funding as local elected
officials endeavor to keep tax
burdens as low as possible. Over the
past several years, 1 million families
have lost recycling service due
to challenging recycling markets
and local budgeting decisions,
a challenge further amplified by
COVID-19’s impact on local and
state finances. Multifamily property
owners will need to weigh the
recycling services against the
need to keep rent affordable. And
because investment decisions
are made at the facility level and
not the system level, MRFs will
continue to make slow and sporadic
investments that do not necessarily
keep pace with packaging
changes, even at a time when
interest rates are at their lowest in
decades. The result will continue to
be a disaggregated patchwork of
investments (or non-investments) that
hold back equitable access and
strong processing infrastructure.
22 The Recycling Partnership’s 2020 State of Curbside Recycling Report estimated a cost range of $4.2 billion to $5.8 billion to collect curbside recyclables in the U.S. That estimate would grow larger as curbside is provided to almost 40 million more households under the equitable-access model. Additional collection costs are incurred across the country in servicing dropoff centers, in collecting materials from multifamily locations, and in material transfer to MRFs. Although more difficult to project, these operational costs would also expand by more than 30% once equitable access is established.
26 PAYING IT FORWARD: HOW INVESTMENT IN RECYCLING WILL PAY DIVIDENDS
tax and fee-based financing of curbside collection, as well as the service fees that private
multifamily properties incur to provide on-property recycling access.
Capital in Place: Replacement Cost Estimates
There are costs associated with the maintenance and replacement of existing recycling
infrastructure that are not included in this report. Using factors of current access, accounting
for different curbside, multifamily, and dropoff situations, and the MRF infrastructure that serves
the system, we estimate existing capital in place to be between $28 billion and $30 billion. On
a straight-line 10-year amortization, this capital needs to be replaced at a rate of $3 billion per
year. Failure to replace this capital could lead to erosion in services over time and possibly the
loss of access currently in place.
What are the current operating costs of the residential recycling system?
More work needs to be done on this question, but the basic estimate exceeds $10
billion per year. That figure would expand to more than $13 billion with the advent
of equitable and informed access. When compared to capital infrastructure
investments called for in this report, we believe local governments bear a similar, but
annual, cost burden to fuel the reverse supply chain of the circular economy.
MRF operating costs are harder to project, but an estimate can be offered using
general processing costs of $90 per ton.23 Assuming that the approximate 12
million tons of curbside recyclables collected annually are all processed by MRFs
and an additional 2 million tons come from dropoff and multifamily collection,
a total throughput of 14 million tons translates to $1.26 billion in MRF operating
costs per year. Although a portion of these operating costs are offset by material
revenues, there is still a net cost that must be financed in operational budgets in
the form of contracts and tip fees. The increase in MRF tonnage achieved through
equitable access will increase this figure by more than $600 million per year.
Taken together then, annual operating costs for collection and MRF processing in
the U.S. with expanded equitable access to recycling would likely increase to $15
billion or more annually.
23 As one example of a data-based estimate, the Northeast Recycling Council (NERC) publishes a quarterly survey of blended values and processing costs for MRFs in its region. The February 2021 report listed the average processing costs of $80/ton for surveyed MRFs from October to December 2020.
27THE RECYCLING PARTNERSHIP
Processing and End-Market Investments
As processed commodities leave the MRF,
they enter a system of additional processing
and manufacturing into new products, which
would also need to expand as the equitable-
access model delivers more tons into the
supply chain. This part of the recycling system
is dynamic and represents another area of
necessary and ongoing capital investment.
The equitable- and informed-access model
does not attempt to estimate those needs,
in part because of the quickly changing
nature of commodity utilization and the many
variables involved. Industry announcements of
new capacity for paper, plastics, metals, and
glass are made regularly, indicating an active
deployment of capital. This should continue as
markets react to the economic opportunities
of both increased recycled supply and
increased demand for recycled content.24
Designing for Circularity
Finally, it is important to understand that
carts and education will not fix recycling if
the packages entering the system are not
recyclable in residential recycling programs.
Private investments will need to better align
the manufacture of goods around circular
economy principles, ensure that packages
are thoughtfully and safely designed with
circularity in mind, can be recovered as
they move through the recycling system,
and increasingly use recycled content.
Examples of collaborative efforts and private
investments in this space include our Pathway
to Circularity program, industry design
guides, and the U.S. Plastics Pact.
The build-out of equitable access will deliver more material into that supply stream, both creating a need for and helping to spur economic development opportunities for domestic manufacturing investment, entrepreneurship, and innovation for post-MRF processing and end use.
Public and private stakeholders can
help spur this investment in post-
MRF infrastructure. Public-sector
grants and loans, tax incentives,
and technical assistance are
proven mechanisms that could be
ramped up as job and economic
development strategies, in particular
at the state level. In the private
sector, capital formation can include
partnerships and consortiums,
lending, equity investment,
guaranteed off-take agreements,
and permanent commitments to
recycled content, which will help
drive end-market expansion. These
strategies can be effectively driven
or incentivized by policy, and they
support and complement the
achievement of scaled equitable
recycling.
24 Paper mill investment has been active in the U.S. as China has reduced imports of recycled paper. Announced capacity, much of which is already in place but some still coming, likely exceeds $4 billion. Plastics reclamation investment has also been active, amounting to more than $500 million and possibly approaching $1 billion. Metal-oriented investments have included new aluminum processing plants and new can-making capacity. A new $125 million glass bottle plant announced for Valdosta, Georgia, indicates investment activity for that material as well.
28 PAYING IT FORWARD: HOW INVESTMENT IN RECYCLING WILL PAY DIVIDENDS
Imagine a fully built-out U.S. recycling system with complete equitable access added for more than 40 million underserved households.
Then imagine all 120 million households across the country fully
understanding what to recycle and when, in a manner that is
relevant to them, while receiving tailored feedback to improve
their recycling behavior. These households deliver 17 million new
tons of recyclables annually to 375 upgraded and 57 new MRFs.
We avoid an estimated $9.4 billion in landfill costs over the next
ten years, preventing long-term environmental damage, creating
an estimated $8.8 billion in new recyclable commodity value,
and supporting 200,000 new jobs.
We solve tough recycling challenges like packaging that is not yet recyclable at scale,
and we create the confidence in supply that will generate new feedstocks for brands and
predictable material flow for new end markets and technologies to thrive. And, critically,
we start building consumer confidence in recycling, and we meet consumer expectations
that companies create sustainable products, paper, and packaging that have a circular
post-consumer story.
The $17 billion investment to deliver this reality will take policy. No one organization or
collective of companies can do this alone – everyone must be at the table to reach
the scale and consistency of investment needed. The Recycling Partnership released a
policy report, Accelerating Recycling: Policy to Unlock Supply for the Circular Economy,
that outlines one such approach, which we believe will create the equitable recycling
future envisioned here. In addition, several supporting policies25 can play a role to help
accelerate change. Three particularly impactful examples include:
• Multifamily recycling ordinances – In a number of jurisdictions around the country,
both state and local laws requiring multifamily property owners to provide on-property
recycling ensures equitable access for millions of families. The goal of 100% equitable
access, which relies on 17 million multifamily households being able to recycle where
they live, likely cannot be achieved without widespread adoption of multifamily local
Conclusion: Delivering the Needs of the System
25 A national deposit system or a massively scaled adoption of state deposit programs could also be a key strategy for generating supply for some key container materials, but with evidence showing that many households use curbside services for recycling of deposit containers, deposit and residential access optimization should be viewed as necessarily complementary strategies. This value of residential access alongside deposit programs is also detailed in Eunomia and Ball Corporation’s The 50 States of Recycling report.
29THE RECYCLING PARTNERSHIP
ordinances and state laws, paired with
enforcement.
• Curbside subscription laws – The largest
jump in access and tonnage in the
equitable access model relies on more than
16.9 million households either subscribing
to curbside services or receiving automatic
service. Local and state laws can help make
that happen and are likely necessary to
achieve full access. Whether it is imposing
minimum service on local haulers or
helping a city the size of Indianapolis adopt
automatic curbside access, the shortfalls
of subscription-based recycling must be
addressed in policy action.
• Disposal policies – Counties and states
have enacted material bans that prohibit
the landfilling of certain recyclable
commodities. These bans have the effect
of clarifying the value of these materials as
commodities rather than waste and provide
a lever for local governments to enforce
recycling provision, especially at multifamily
complexes and businesses. Landfill tip
fee surcharge revenues can be used to
support local recycling program costs and
incentivize recycling over landfilling.
States’ recycling grant programs are powerful
tools that also deserve attention. Many
states have long-standing recycling grant
programs supporting the development
and improvement of residential recycling
programs and, in some cases, MRF
operations. Unfortunately, some grant
programs have seen their funding decline
when dedicated funding is used for another
purpose or authorized monies are not
appropriated to grants. Others have been
suspended in the face of budget challenges.
While often facing their own organizational
budgetary and staffing challenges, state
recycling programs can be very effective
partners in providing technical assistance and
educational support to local communities, as
well as key implementers of recycling policy.
Policy action to strengthen these programs
and expand or restore their grant funding is
a significant strategy for achieving equitable
access.
As stated in The Recycling Partnership’s
report, Accelerating Recycling: Policy to
Unlock Supply for the Circular Economy, it
takes everyone working together on sensible
policies and investments supported by public-
private partnerships for recycling to meet its
full potential.
Only through a coordinated public-private partnership
can the U.S. chart a new course to
a comprehensive and efficient recycling system.
That system must deliver equitable access
for all people and a stronger infrastructure
to support both current and emerging
recyclables alike. By catalyzing a recycling
culture that will transform how materials are
managed and commodities are considered,
we can spur innovation that will stimulate the
circular economy.
This approach is actionable, quantifiable, and achievable. It serves people, the economy, and the planet. However, it will require collaboration from all parts of the industry, all levels of government, policymakers, investors, and the public, to bring it to fruition and maximize its potential.
Most importantly, without policy we cannot
create the capital flows necessary to solve
the significant challenges of the current U.S.
recycling system. It is a task, we believe, all
stakeholders are ready to take on. The time
is now.
30 PAYING IT FORWARD: HOW INVESTMENT IN RECYCLING WILL PAY DIVIDENDS
APPENDIX A:
Details on Capital Investments
Digging Into the Details of Infrastructure and Education Investments
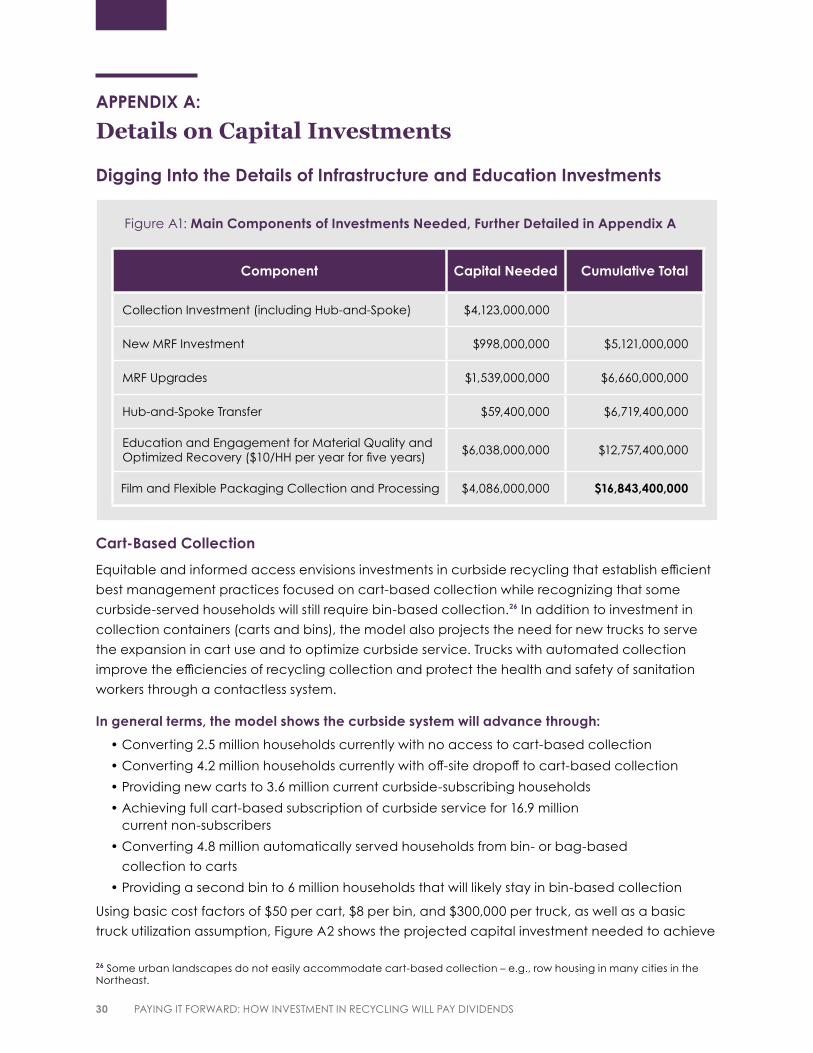
Cart-Based Collection
Equitable and informed access envisions investments in curbside recycling that establish efficient
best management practices focused on cart-based collection while recognizing that some
curbside-served households will still require bin-based collection.26 In addition to investment in
collection containers (carts and bins), the model also projects the need for new trucks to serve
the expansion in cart use and to optimize curbside service. Trucks with automated collection
improve the efficiencies of recycling collection and protect the health and safety of sanitation
workers through a contactless system.
In general terms, the model shows the curbside system will advance through:
• Converting 2.5 million households currently with no access to cart-based collection
• Converting 4.2 million households currently with off-site dropoff to cart-based collection
• Providing new carts to 3.6 million current curbside-subscribing households
• Achieving full cart-based subscription of curbside service for 16.9 million current non-subscribers
• Converting 4.8 million automatically served households from bin- or bag-based
collection to carts
• Providing a second bin to 6 million households that will likely stay in bin-based collection
Using basic cost factors of $50 per cart, $8 per bin, and $300,000 per truck, as well as a basic
truck utilization assumption, Figure A2 shows the projected capital investment needed to achieve
26 Some urban landscapes do not easily accommodate cart-based collection – e.g., row housing in many cities in the Northeast.
Component Capital Needed Cumulative Total
Collection Investment (including Hub-and-Spoke) $4,123,000,000
New MRF Investment $998,000,000 $5,121,000,000
MRF Upgrades $1,539,000,000 $6,660,000,000
Hub-and-Spoke Transfer $59,400,000 $6,719,400,000
Education and Engagement for Material Quality and Optimized Recovery ($10/HH per year for five years)
$6,038,000,000 $12,757,400,000
Film and Flexible Packaging Collection and Processing $4,086,000,000 $16,843,400,000
Figure A1: Main Components of Investments Needed, Further Detailed in Appendix A
31THE RECYCLING PARTNERSHIP
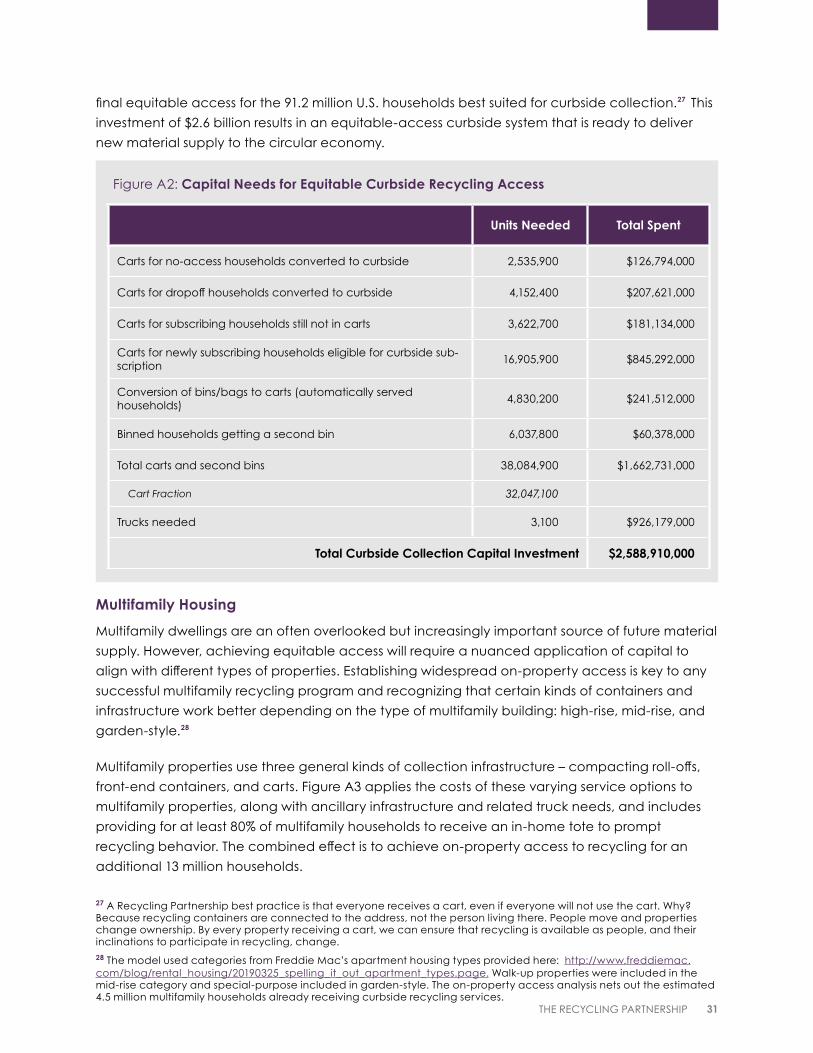
final equitable access for the 91.2 million U.S. households best suited for curbside collection.27 This
investment of $2.6 billion results in an equitable-access curbside system that is ready to deliver
new material supply to the circular economy.
Multifamily Housing
Multifamily dwellings are an often overlooked but increasingly important source of future material
supply. However, achieving equitable access will require a nuanced application of capital to
align with different types of properties. Establishing widespread on-property access is key to any
successful multifamily recycling program and recognizing that certain kinds of containers and
infrastructure work better depending on the type of multifamily building: high-rise, mid-rise, and
garden-style.28
Multifamily properties use three general kinds of collection infrastructure – compacting roll-offs,
front-end containers, and carts. Figure A3 applies the costs of these varying service options to
multifamily properties, along with ancillary infrastructure and related truck needs, and includes
providing for at least 80% of multifamily households to receive an in-home tote to prompt
recycling behavior. The combined effect is to achieve on-property access to recycling for an
additional 13 million households.
Units Needed Total Spent
Carts for no-access households converted to curbside 2,535,900 $126,794,000
Carts for dropoff households converted to curbside 4,152,400 $207,621,000
Carts for subscribing households still not in carts 3,622,700 $181,134,000
Carts for newly subscribing households eligible for curbside sub-scription
16,905,900 $845,292,000
Conversion of bins/bags to carts (automatically served households)
4,830,200 $241,512,000
Binned households getting a second bin 6,037,800 $60,378,000
Total carts and second bins 38,084,900 $1,662,731,000
Cart Fraction 32,047,100
Trucks needed 3,100 $926,179,000
Total Curbside Collection Capital Investment $2,588,910,000
Figure A2: Capital Needs for Equitable Curbside Recycling Access
27 A Recycling Partnership best practice is that everyone receives a cart, even if everyone will not use the cart. Why? Because recycling containers are connected to the address, not the person living there. People move and properties change ownership. By every property receiving a cart, we can ensure that recycling is available as people, and their inclinations to participate in recycling, change. 28 The model used categories from Freddie Mac’s apartment housing types provided here: http://www.freddiemac.com/blog/rental_housing/20190325_spelling_it_out_apartment_types.page. Walk-up properties were included in the mid-rise category and special-purpose included in garden-style. The on-property access analysis nets out the estimated 4.5 million multifamily households already receiving curbside recycling services.
32 PAYING IT FORWARD: HOW INVESTMENT IN RECYCLING WILL PAY DIVIDENDS
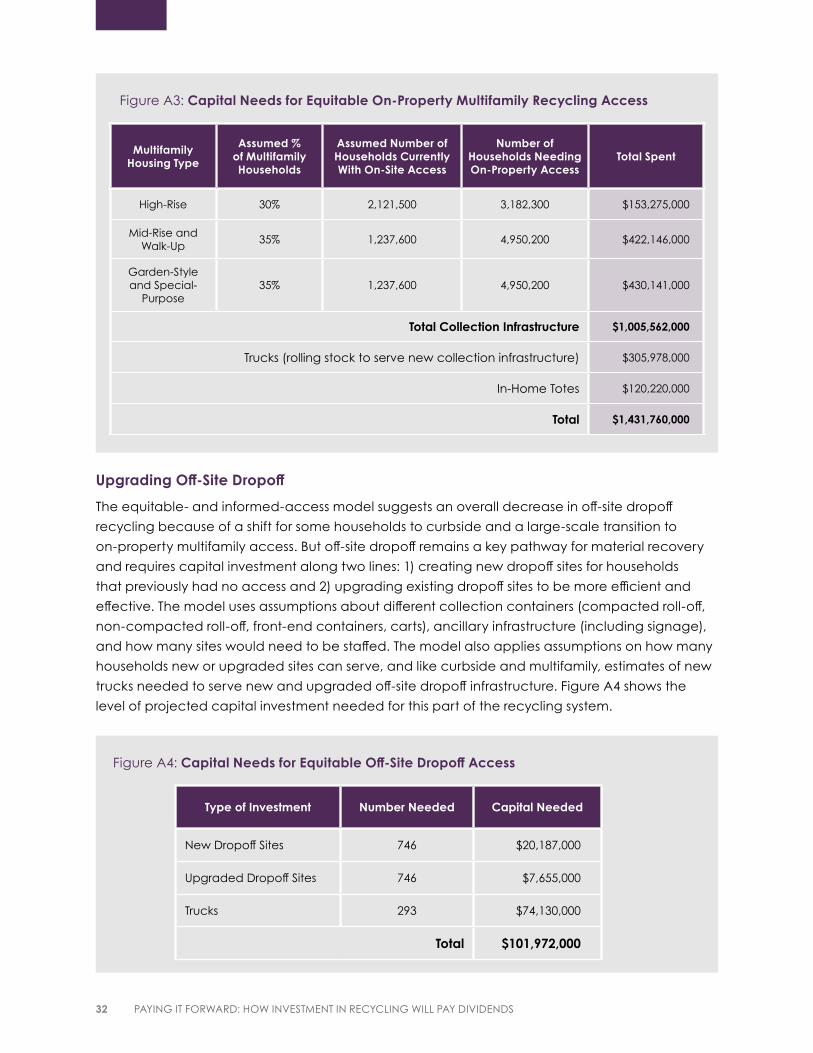
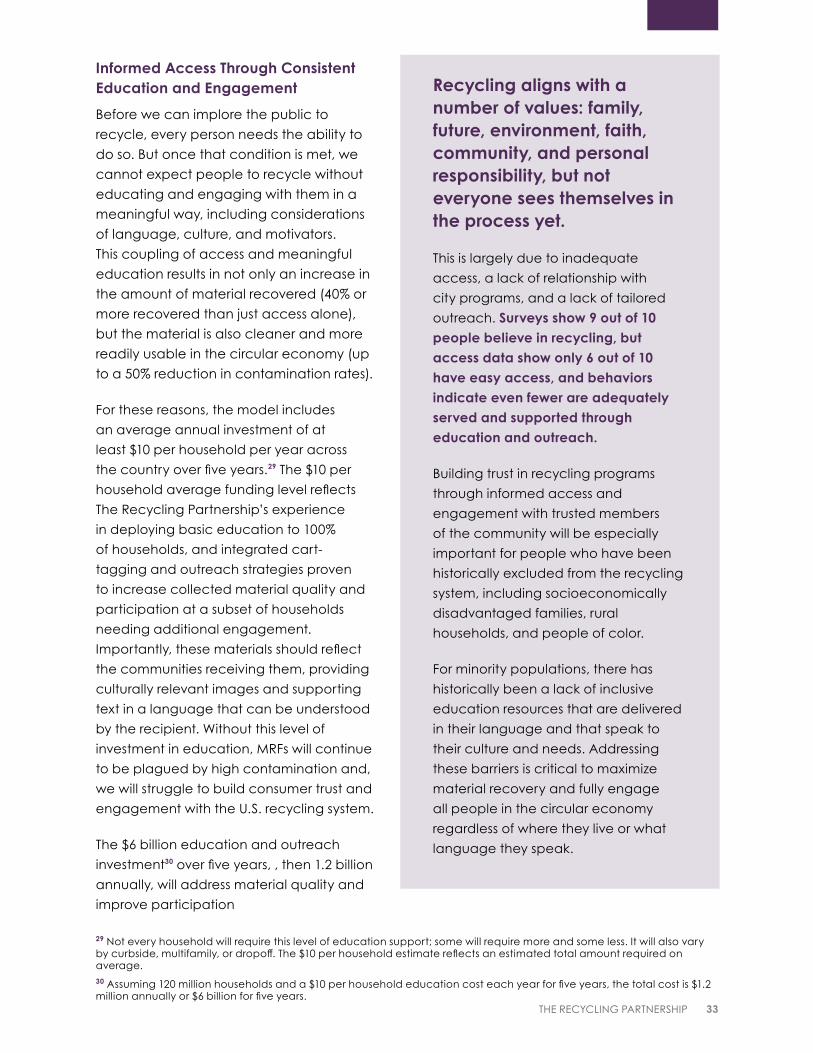
Upgrading Off-Site Dropoff
The equitable- and informed-access model suggests an overall decrease in off-site dropoff
recycling because of a shift for some households to curbside and a large-scale transition to
on-property multifamily access. But off-site dropoff remains a key pathway for material recovery
and requires capital investment along two lines: 1) creating new dropoff sites for households
that previously had no access and 2) upgrading existing dropoff sites to be more efficient and
effective. The model uses assumptions about different collection containers (compacted roll-off,
non-compacted roll-off, front-end containers, carts), ancillary infrastructure (including signage),
and how many sites would need to be staffed. The model also applies assumptions on how many
households new or upgraded sites can serve, and like curbside and multifamily, estimates of new
trucks needed to serve new and upgraded off-site dropoff infrastructure. Figure A4 shows the
level of projected capital investment needed for this part of the recycling system.
MultifamilyHousing Type
Assumed % of Multifamily Households
Assumed Number of Households Currently With On-Site Access
Number of Households Needing On-Property Access
Total Spent
High-Rise 30% 2,121,500 3,182,300 $153,275,000
Mid-Rise andWalk-Up
35% 1,237,600 4,950,200 $422,146,000
Garden-Styleand Special-
Purpose35% 1,237,600 4,950,200 $430,141,000
Total Collection Infrastructure $1,005,562,000
Trucks (rolling stock to serve new collection infrastructure) $305,978,000
In-Home Totes $120,220,000
Total $1,431,760,000
Figure A3: Capital Needs for Equitable On-Property Multifamily Recycling Access
Type of Investment Number Needed Capital Needed
New Dropoff Sites 746 $20,187,000
Upgraded Dropoff Sites 746 $7,655,000
Trucks 293 $74,130,000
Total $101,972,000
Figure A4: Capital Needs for Equitable Off-Site Dropoff Access
33THE RECYCLING PARTNERSHIP
Informed Access Through Consistent Education and Engagement
Before we can implore the public to
recycle, every person needs the ability to
do so. But once that condition is met, we
cannot expect people to recycle without
educating and engaging with them in a
meaningful way, including considerations
of language, culture, and motivators.
This coupling of access and meaningful
education results in not only an increase in
the amount of material recovered (40% or
more recovered than just access alone),
but the material is also cleaner and more
readily usable in the circular economy (up
to a 50% reduction in contamination rates).
For these reasons, the model includes
an average annual investment of at
least $10 per household per year across
the country over five years.29 The $10 per
household average funding level reflects
The Recycling Partnership’s experience
in deploying basic education to 100%
of households, and integrated cart-
tagging and outreach strategies proven
to increase collected material quality and
participation at a subset of households
needing additional engagement.
Importantly, these materials should reflect
the communities receiving them, providing
culturally relevant images and supporting
text in a language that can be understood
by the recipient. Without this level of
investment in education, MRFs will continue
to be plagued by high contamination and,
we will struggle to build consumer trust and
engagement with the U.S. recycling system.
The $6 billion education and outreach
investment30 over five years, , then 1.2 billion
annually, will address material quality and
improve participation
Recycling aligns with a number of values: family, future, environment, faith, community, and personal responsibility, but not everyone sees themselves in the process yet.
This is largely due to inadequate
access, a lack of relationship with
city programs, and a lack of tailored
outreach. Surveys show 9 out of 10 people believe in recycling, but access data show only 6 out of 10 have easy access, and behaviors indicate even fewer are adequately served and supported through education and outreach.
Building trust in recycling programs
through informed access and
engagement with trusted members
of the community will be especially
important for people who have been
historically excluded from the recycling
system, including socioeconomically
disadvantaged families, rural
households, and people of color.
For minority populations, there has
historically been a lack of inclusive
education resources that are delivered
in their language and that speak to
their culture and needs. Addressing
these barriers is critical to maximize
material recovery and fully engage
all people in the circular economy
regardless of where they live or what
language they speak.
29 Not every household will require this level of education support; some will require more and some less. It will also vary by curbside, multifamily, or dropoff. The $10 per household estimate reflects an estimated total amount required on average.30 Assuming 120 million households and a $10 per household education cost each year for five years, the total cost is $1.2 million annually or $6 billion for five years.
34 PAYING IT FORWARD: HOW INVESTMENT IN RECYCLING WILL PAY DIVIDENDS
and capture behavior rates, which are extremely important components of a high functioning
residential recycling system and will deliver a dramatic increase in the recycling rate compared
to access alone.31
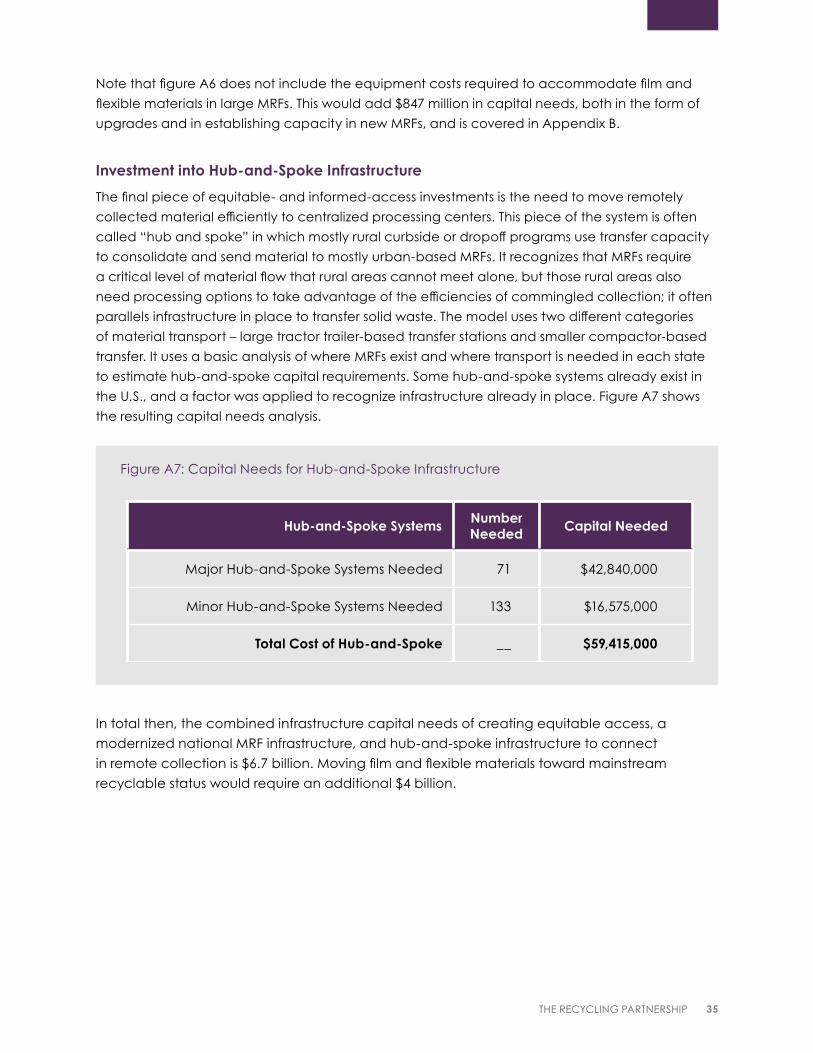
Projecting the Need for New MRFs
Increased collection tonnage can be used to estimate the need for new MRFs and the
associated capital required. The Recycling Partnership uses a baseline assumption that 25% of
the increased tonnage will require new MRFs to process the material. Recognizing the variable
universe of MRFs in the U.S., three basic size categories of MRFs were used for this analysis, along
with assumptions as to how many MRFs fall into each category and varying levels of investment
that correspond with each category. Figure A5 shows the projected capital needs for new MRFs.
Upgrading Existing MRFs
For the increased tonnage resulting from equitable access and for the tonnage already
collected, existing MRFs in the U.S. need capital for new and best-in-class equipment. A
substantial injection of capital would modernize the national MRF infrastructure and improve
the fate of all materials in the system, whether in establishing recyclability, enhancing quality, or
improving processing capture rates.
Using the same categories as the new MRF analysis, the model employs basic assumptions as to
how many upgrades MRFs need and the basic costs of those upgrades, including equipment
such as optical sorters, robotics, and ancillary investments in conveyor lines and bunker capacity,
plus installation. Figure A6 provides the estimates of this analysis.
Figure A6: Capital Needs for Upgraded MRFs
Upgrades Total Estimated Capital Needed
Large MRF Upgrades $303,750,000
Medium MRF Upgrades $810,000,000
Small MRF Upgrades $425,250,000
All MRF Upgrades $1,539,000,000
Figure A5: New MRF Capital Needs From New Equitable-Access Tonnage
Tons Requiring New MRF Capacity
Number of New MRFs Needed
(using balanced portfolio of MRF sizes)
Estimated Costper MRF
Total Estimated Captial Needs for
New MRF Capacity
4,051,687 57 $17,657,500 $998,269,620
31 The Recycling Partnership recently released a Behavior Change White Paper, which will be followed by a Capture and Participation Behavior Report at the end of 2021
35THE RECYCLING PARTNERSHIP
Note that figure A6 does not include the equipment costs required to accommodate film and
flexible materials in large MRFs. This would add $847 million in capital needs, both in the form of
upgrades and in establishing capacity in new MRFs, and is covered in Appendix B.
Investment into Hub-and-Spoke Infrastructure
The final piece of equitable- and informed-access investments is the need to move remotely
collected material efficiently to centralized processing centers. This piece of the system is often
called “hub and spoke” in which mostly rural curbside or dropoff programs use transfer capacity
to consolidate and send material to mostly urban-based MRFs. It recognizes that MRFs require
a critical level of material flow that rural areas cannot meet alone, but those rural areas also
need processing options to take advantage of the efficiencies of commingled collection; it often
parallels infrastructure in place to transfer solid waste. The model uses two different categories
of material transport – large tractor trailer-based transfer stations and smaller compactor-based
transfer. It uses a basic analysis of where MRFs exist and where transport is needed in each state
to estimate hub-and-spoke capital requirements. Some hub-and-spoke systems already exist in
the U.S., and a factor was applied to recognize infrastructure already in place. Figure A7 shows
the resulting capital needs analysis.
In total then, the combined infrastructure capital needs of creating equitable access, a
modernized national MRF infrastructure, and hub-and-spoke infrastructure to connect
in remote collection is $6.7 billion. Moving film and flexible materials toward mainstream
recyclable status would require an additional $4 billion.
Figure A7: Capital Needs for Hub-and-Spoke Infrastructure
Hub-and-Spoke Systems Number Needed Capital Needed
Major Hub-and-Spoke Systems Needed 71 $42,840,000
Minor Hub-and-Spoke Systems Needed 133 $16,575,000
Total Cost of Hub-and-Spoke __ $59,415,000
36 PAYING IT FORWARD: HOW INVESTMENT IN RECYCLING WILL PAY DIVIDENDS
Appendix B:
Specific Actions Needed for Flexible Plastic Packaging, Including Pouches, Bags, and WrapThe investment model in this report shows $4 billion in capital will be needed for film and flexible
packaging to become widely accepted in residential collection and processing, recognizing
a combined need for both specialized equipment in large MRFs to process loose film and
flexibles into commodity bales and specialized bagged collection of film and flexibles in areas
served by smaller MRFs. This model anticipates that critical progress will continue to be made
on key recyclability issues for film and flexible packaging, such as conversion of multi-resin
formats into mono-material packaging.
The equipment necessary to process loosely collected film and flexibles has been
demonstrated by the Materials Recovery for the Future (MRFF) project. The high level of
required investment means that approach will only be suitable for large-scale MRFs.32 The
majority of MRFs in the U.S. are smaller facilities in which expensive specialized investments to
process the loose film and flexible material will be difficult to justify from a business perspective.
For many small MRFs, the needed capital for a MRFF-style investment could be more than 50%
of a facility’s entire capitalization for a material that may represent, at full flow, only 2–3% of all
inbound materials.
Most MRFs, therefore, will need to receive film and flexibles pre-separated from other materials
during collection in the form of household bagging. But even with inbound film bagged,
capital investment in those MRFs will still be needed in the form of expanded bunkers,
lengthened or additional conveyor lines, and sorting equipment such as robotics. In addition,
for film and flexibles to be widely collected at participation and capture rates comparable to
existing mainstream materials, ongoing provision of bags to households will be necessary, and
end-market innovation and demand will be essential. Finally, as the material becomes more
widely processable by MRFs, funding will be needed to successfully educate households when
film and flexible materials are then introduced into collection services. Figure B1 shows the
layout of investments to create a pathway to full acceptance in residential collection for film
and flexible materials, something that the Pathway to Circularity’s Film and Flexibles Coalition is
currently working toward.
32 The 2020 Flexible Packaging Recycling in Material Recovery Facilities Pilot Research Report provides additional detail on the large, high-speed MRF environment.
37THE RECYCLING PARTNERSHIP
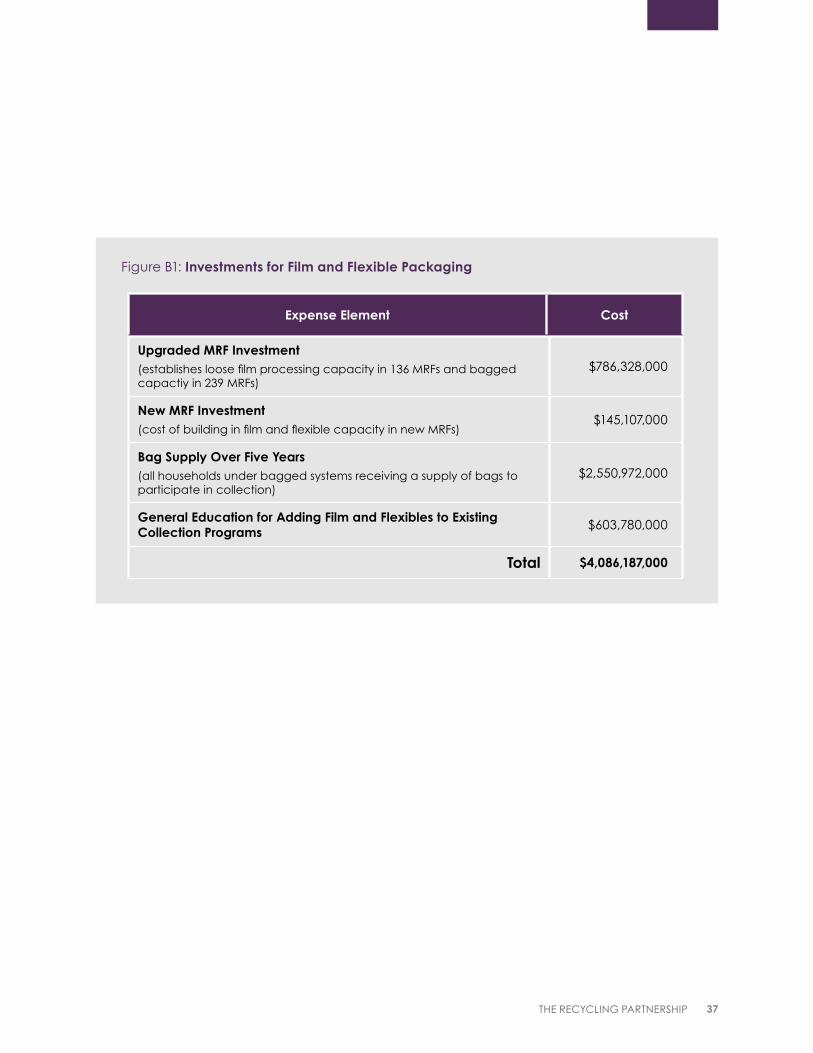
Figure B1: Investments for Film and Flexible Packaging
Expense Element Cost
Upgraded MRF Investment (establishes loose film processing capacity in 136 MRFs and bagged capactiy in 239 MRFs)
$786,328,000
New MRF Investment(cost of building in film and flexible capacity in new MRFs)
$145,107,000
Bag Supply Over Five Years(all households under bagged systems receiving a supply of bags to participate in collection)
$2,550,972,000
General Education for Adding Film and Flexibles to Existing Collection Programs $603,780,000
Total $4,086,187,000
38 PAYING IT FORWARD: HOW INVESTMENT IN RECYCLING WILL PAY DIVIDENDS
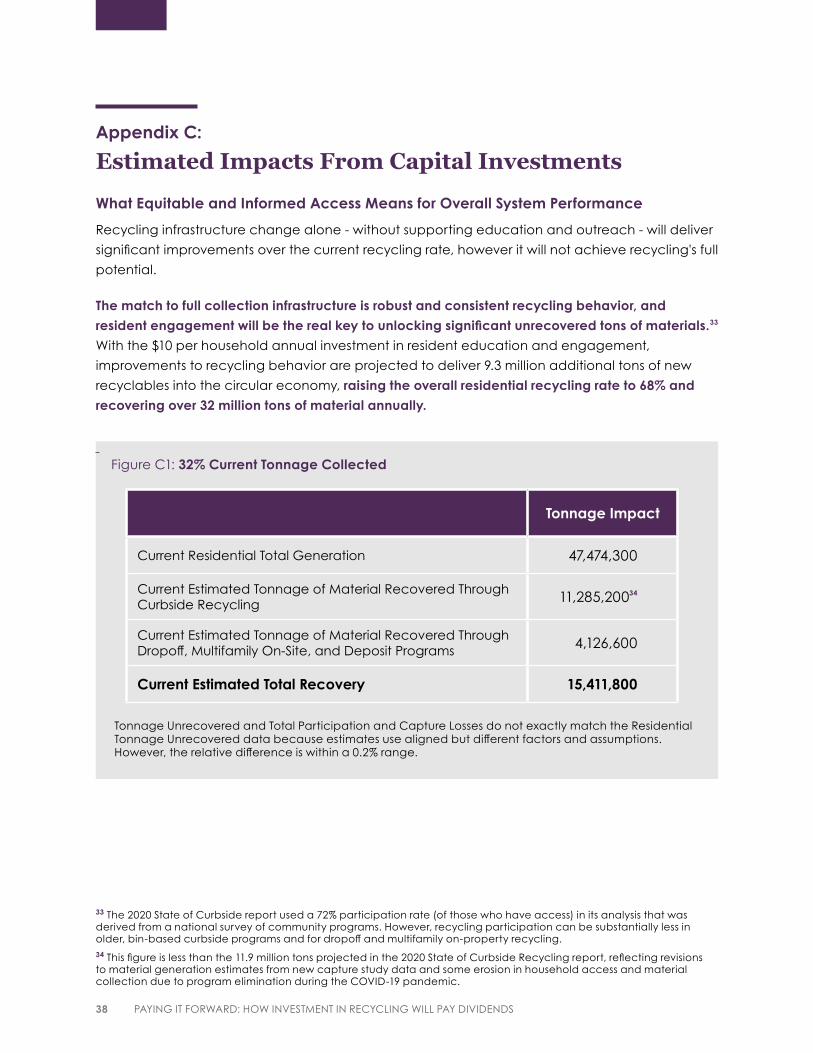
Appendix C: Estimated Impacts From Capital Investments
What Equitable and Informed Access Means for Overall System Performance
Recycling infrastructure change alone - without supporting education and outreach - will deliver
significant improvements over the current recycling rate, however it will not achieve recycling's full
potential.
The match to full collection infrastructure is robust and consistent recycling behavior, and
resident engagement will be the real key to unlocking significant unrecovered tons of materials.33
With the $10 per household annual investment in resident education and engagement,
improvements to recycling behavior are projected to deliver 9.3 million additional tons of new
recyclables into the circular economy, raising the overall residential recycling rate to 68% and
recovering over 32 million tons of material annually.
Figure C1: 32% Current Tonnage Collected
Tonnage Impact
Current Residential Total Generation 47,474,300
Current Estimated Tonnage of Material Recovered Through Curbside Recycling 11,285,20034
Current Estimated Tonnage of Material Recovered Through Dropoff, Multifamily On-Site, and Deposit Programs 4,126,600
Current Estimated Total Recovery 15,411,800
Tonnage Unrecovered and Total Participation and Capture Losses do not exactly match the Residential Tonnage Unrecovered data because estimates use aligned but different factors and assumptions. However, the relative difference is within a 0.2% range.
33 The 2020 State of Curbside report used a 72% participation rate (of those who have access) in its analysis that was derived from a national survey of community programs. However, recycling participation can be substantially less in older, bin-based curbside programs and for dropoff and multifamily on-property recycling.34 This figure is less than the 11.9 million tons projected in the 2020 State of Curbside Recycling report, reflecting revisions to material generation estimates from new capture study data and some erosion in household access and material collection due to program elimination during the COVID-19 pandemic.
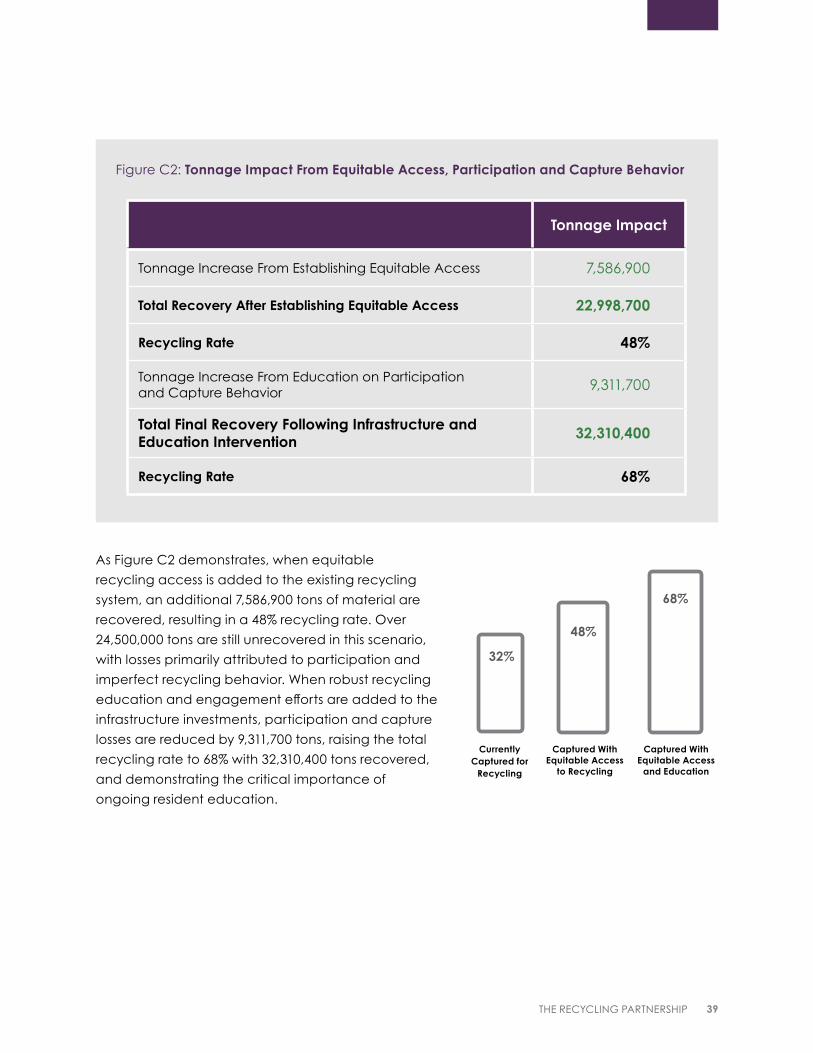
39THE RECYCLING PARTNERSHIP
Figure C2: Tonnage Impact From Equitable Access, Participation and Capture Behavior
Tonnage Impact
Tonnage Increase From Establishing Equitable Access 7,586,900
Total Recovery After Establishing Equitable Access 22,998,700
Recycling Rate 48%
Tonnage Increase From Education on Participation and Capture Behavior 9,311,700
Total Final Recovery Following Infrastructure and Education Intervention 32,310,400
Recycling Rate 68%
As Figure C2 demonstrates, when equitable
recycling access is added to the existing recycling
system, an additional 7,586,900 tons of material are
recovered, resulting in a 48% recycling rate. Over
24,500,000 tons are still unrecovered in this scenario,
with losses primarily attributed to participation and
imperfect recycling behavior. When robust recycling
education and engagement efforts are added to the
infrastructure investments, participation and capture
losses are reduced by 9,311,700 tons, raising the total
recycling rate to 68% with 32,310,400 tons recovered,
and demonstrating the critical importance of
ongoing resident education.
48%
68%
32%
Currently Captured for
Recycling
Captured With Equitable Access
to Recycling
Captured With Equitable Access
and Education
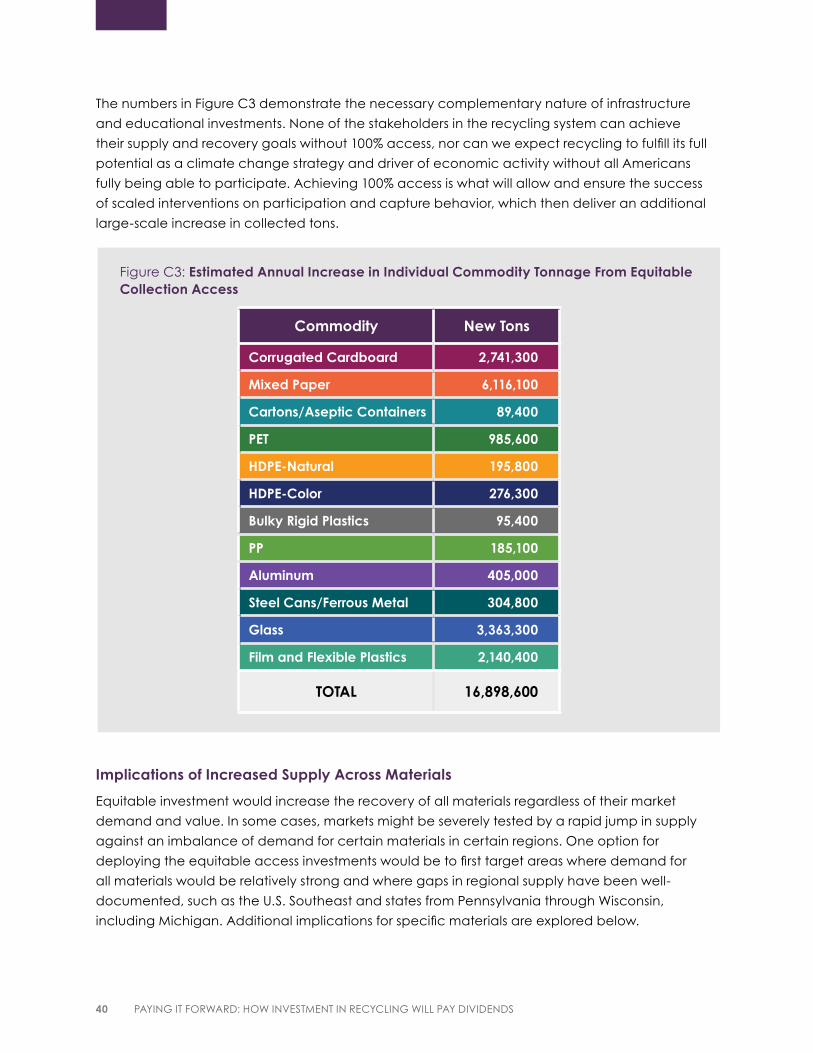
40 PAYING IT FORWARD: HOW INVESTMENT IN RECYCLING WILL PAY DIVIDENDS
The numbers in Figure C3 demonstrate the necessary complementary nature of infrastructure
and educational investments. None of the stakeholders in the recycling system can achieve
their supply and recovery goals without 100% access, nor can we expect recycling to fulfill its full
potential as a climate change strategy and driver of economic activity without all Americans
fully being able to participate. Achieving 100% access is what will allow and ensure the success
of scaled interventions on participation and capture behavior, which then deliver an additional
large-scale increase in collected tons.
Implications of Increased Supply Across Materials
Equitable investment would increase the recovery of all materials regardless of their market
demand and value. In some cases, markets might be severely tested by a rapid jump in supply
against an imbalance of demand for certain materials in certain regions. One option for
deploying the equitable access investments would be to first target areas where demand for
all materials would be relatively strong and where gaps in regional supply have been well-
documented, such as the U.S. Southeast and states from Pennsylvania through Wisconsin,
including Michigan. Additional implications for specific materials are explored below.
Figure C3: Estimated Annual Increase in Individual Commodity Tonnage From Equitable Collection Access
Commodity New Tons
Corrugated Cardboard 2,741,300
Mixed Paper 6,116,100
Cartons/Aseptic Containers 89,400
PET 985,600
HDPE-Natural 195,800
HDPE-Color 276,300
Bulky Rigid Plastics 95,400
PP 185,100
Aluminum 405,000
Steel Cans/Ferrous Metal 304,800
Glass 3,363,300
Film and Flexible Plastics 2,140,400
TOTAL 16,898,600
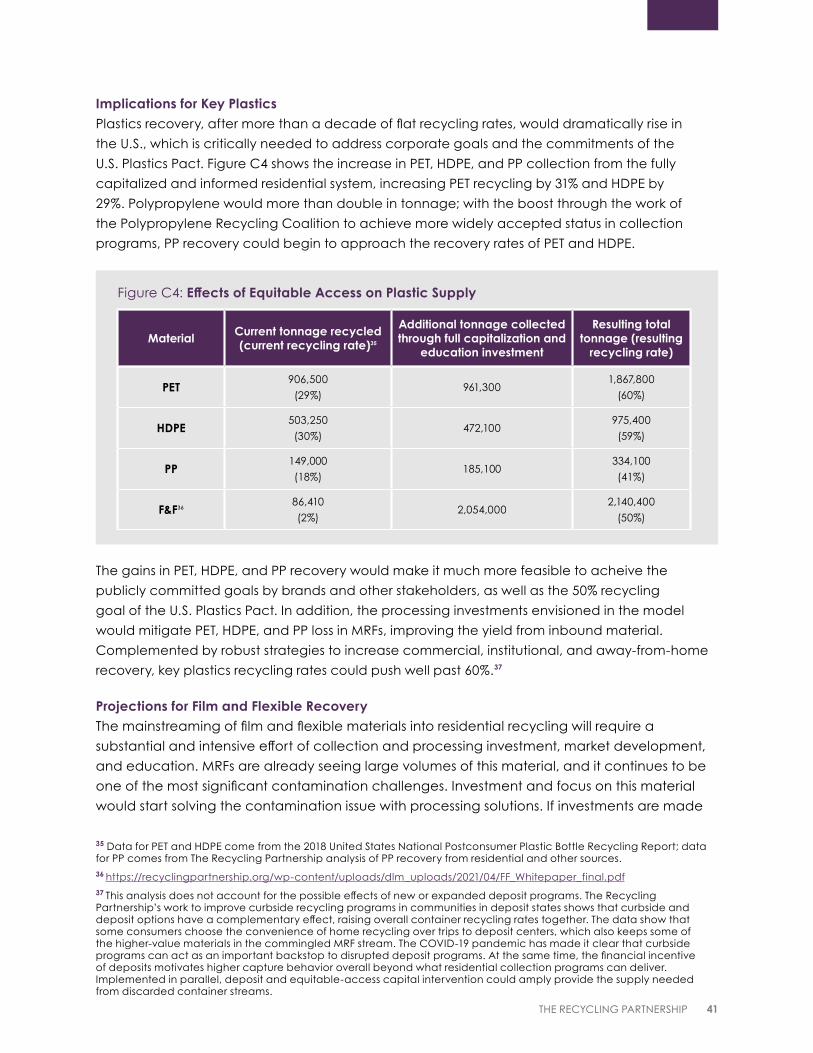
41THE RECYCLING PARTNERSHIP
Implications for Key Plastics Plastics recovery, after more than a decade of flat recycling rates, would dramatically rise in
the U.S., which is critically needed to address corporate goals and the commitments of the
U.S. Plastics Pact. Figure C4 shows the increase in PET, HDPE, and PP collection from the fully
capitalized and informed residential system, increasing PET recycling by 31% and HDPE by
29%. Polypropylene would more than double in tonnage; with the boost through the work of
the Polypropylene Recycling Coalition to achieve more widely accepted status in collection
programs, PP recovery could begin to approach the recovery rates of PET and HDPE.
The gains in PET, HDPE, and PP recovery would make it much more feasible to acheive the
publicly committed goals by brands and other stakeholders, as well as the 50% recycling
goal of the U.S. Plastics Pact. In addition, the processing investments envisioned in the model
would mitigate PET, HDPE, and PP loss in MRFs, improving the yield from inbound material.
Complemented by robust strategies to increase commercial, institutional, and away-from-home
recovery, key plastics recycling rates could push well past 60%.37
Projections for Film and Flexible Recovery
The mainstreaming of film and flexible materials into residential recycling will require a
substantial and intensive effort of collection and processing investment, market development,
and education. MRFs are already seeing large volumes of this material, and it continues to be
one of the most significant contamination challenges. Investment and focus on this material
would start solving the contamination issue with processing solutions. If investments are made
Figure C4: Effects of Equitable Access on Plastic Supply
Material Current tonnage recycled (current recycling rate)35
Additional tonnage collected through full capitalization and
education investment
Resulting total tonnage (resulting
recycling rate)
PET906,500
(29%)961,300
1,867,800
(60%)
HDPE503,250
(30%)472,100
975,400
(59%)
PP149,000
(18%)185,100
334,100
(41%)
F&F3686,410
(2%)2,054,000
2,140,400
(50%)
35 Data for PET and HDPE come from the 2018 United States National Postconsumer Plastic Bottle Recycling Report; data for PP comes from The Recycling Partnership analysis of PP recovery from residential and other sources. 36 https://recyclingpartnership.org/wp-content/uploads/dlm_uploads/2021/04/FF_Whitepaper_final.pdf37 This analysis does not account for the possible effects of new or expanded deposit programs. The Recycling Partnership’s work to improve curbside recycling programs in communities in deposit states shows that curbside and deposit options have a complementary effect, raising overall container recycling rates together. The data show that some consumers choose the convenience of home recycling over trips to deposit centers, which also keeps some of the higher-value materials in the commingled MRF stream. The COVID-19 pandemic has made it clear that curbside programs can act as an important backstop to disrupted deposit programs. At the same time, the financial incentive of deposits motivates higher capture behavior overall beyond what residential collection programs can deliver. Implemented in parallel, deposit and equitable-access capital intervention could amply provide the supply needed from discarded container streams.
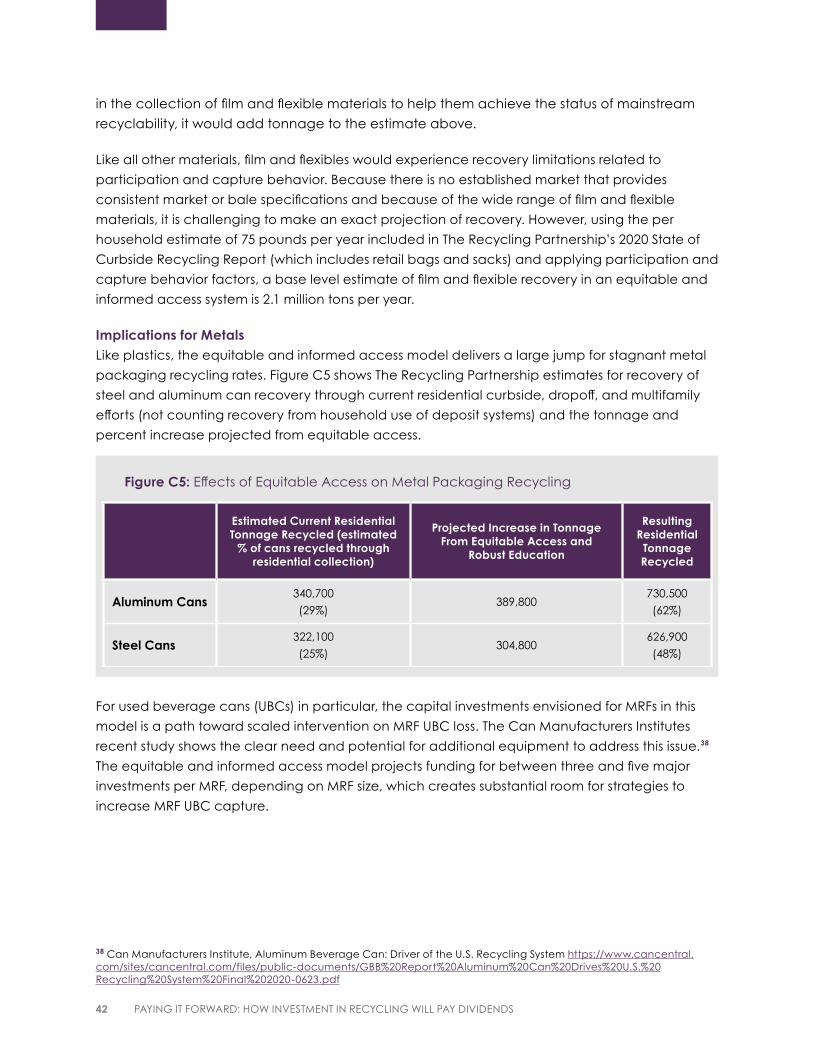
42 PAYING IT FORWARD: HOW INVESTMENT IN RECYCLING WILL PAY DIVIDENDS
in the collection of film and flexible materials to help them achieve the status of mainstream
recyclability, it would add tonnage to the estimate above.
Like all other materials, film and flexibles would experience recovery limitations related to
participation and capture behavior. Because there is no established market that provides
consistent market or bale specifications and because of the wide range of film and flexible
materials, it is challenging to make an exact projection of recovery. However, using the per
household estimate of 75 pounds per year included in The Recycling Partnership’s 2020 State of
Curbside Recycling Report (which includes retail bags and sacks) and applying participation and
capture behavior factors, a base level estimate of film and flexible recovery in an equitable and
informed access system is 2.1 million tons per year.
Implications for Metals Like plastics, the equitable and informed access model delivers a large jump for stagnant metal
packaging recycling rates. Figure C5 shows The Recycling Partnership estimates for recovery of
steel and aluminum can recovery through current residential curbside, dropoff, and multifamily
efforts (not counting recovery from household use of deposit systems) and the tonnage and
percent increase projected from equitable access.
For used beverage cans (UBCs) in particular, the capital investments envisioned for MRFs in this
model is a path toward scaled intervention on MRF UBC loss. The Can Manufacturers Institutes
recent study shows the clear need and potential for additional equipment to address this issue.38
The equitable and informed access model projects funding for between three and five major
investments per MRF, depending on MRF size, which creates substantial room for strategies to
increase MRF UBC capture.
Figure C5: Effects of Equitable Access on Metal Packaging Recycling
Estimated Current Residential Tonnage Recycled (estimated
% of cans recycled through residential collection)
Projected Increase in Tonnage From Equitable Access and
Robust Education
Resulting Residential
Tonnage Recycled
Aluminum Cans340,700
(29%)389,800
730,500
(62%)
Steel Cans322,100
(25%)304,800
626,900
(48%)
38 Can Manufacturers Institute, Aluminum Beverage Can: Driver of the U.S. Recycling System https://www.cancentral.com/sites/cancentral.com/files/public-documents/GBB%20Report%20Aluminum%20Can%20Drives%20U.S.%20Recycling%20System%20Final%202020-0623.pdf
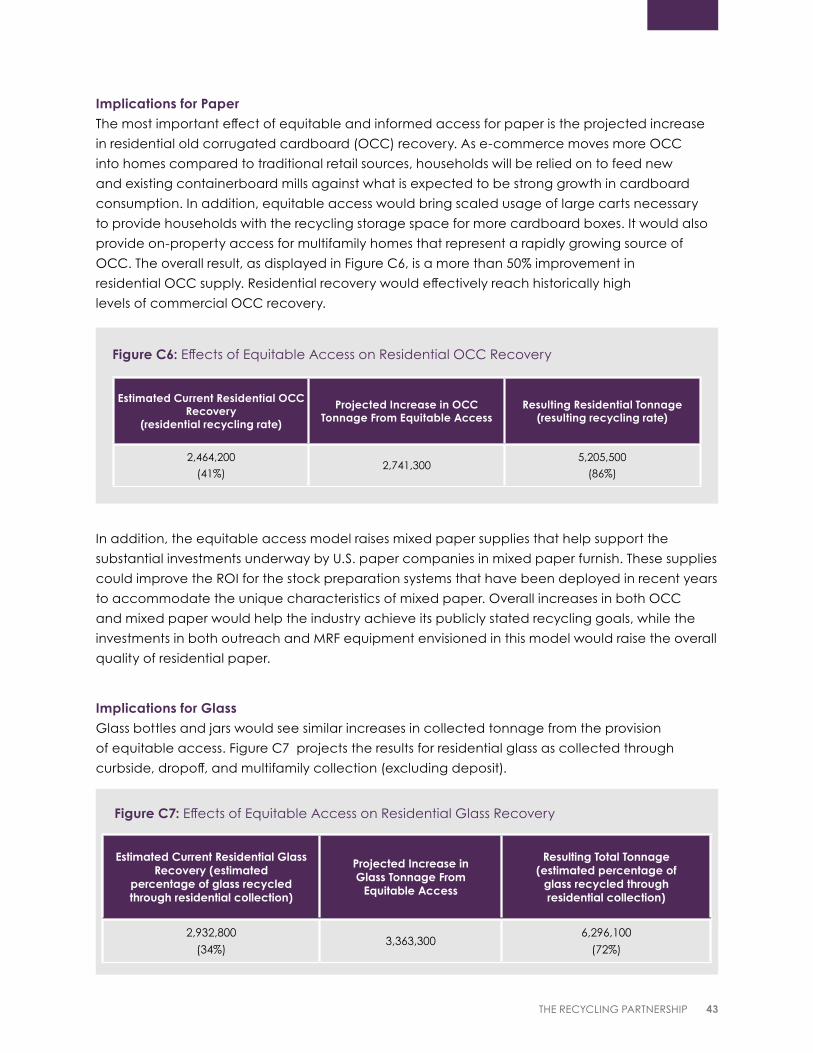
43THE RECYCLING PARTNERSHIP
Implications for Paper The most important effect of equitable and informed access for paper is the projected increase
in residential old corrugated cardboard (OCC) recovery. As e-commerce moves more OCC
into homes compared to traditional retail sources, households will be relied on to feed new
and existing containerboard mills against what is expected to be strong growth in cardboard
consumption. In addition, equitable access would bring scaled usage of large carts necessary
to provide households with the recycling storage space for more cardboard boxes. It would also
provide on-property access for multifamily homes that represent a rapidly growing source of
OCC. The overall result, as displayed in Figure C6, is a more than 50% improvement in
residential OCC supply. Residential recovery would effectively reach historically high
levels of commercial OCC recovery.
In addition, the equitable access model raises mixed paper supplies that help support the
substantial investments underway by U.S. paper companies in mixed paper furnish. These supplies
could improve the ROI for the stock preparation systems that have been deployed in recent years
to accommodate the unique characteristics of mixed paper. Overall increases in both OCC
and mixed paper would help the industry achieve its publicly stated recycling goals, while the
investments in both outreach and MRF equipment envisioned in this model would raise the overall
quality of residential paper.
Implications for Glass
Glass bottles and jars would see similar increases in collected tonnage from the provision
of equitable access. Figure C7 projects the results for residential glass as collected through
curbside, dropoff, and multifamily collection (excluding deposit).
Figure C6: Effects of Equitable Access on Residential OCC Recovery
Estimated Current Residential OCC Recovery
(residential recycling rate)
Projected Increase in OCCTonnage From Equitable Access
Resulting Residential Tonnage (resulting recycling rate)
2,464,200
(41%)2,741,300
5,205,500
(86%)
Figure C7: Effects of Equitable Access on Residential Glass Recovery
Estimated Current Residential Glass Recovery (estimated
percentage of glass recycled through residential collection)
Projected Increase in Glass Tonnage From
Equitable Access
Resulting Total Tonnage(estimated percentage of
glass recycled through residential collection)
2,932,800
(34%)3,363,300
6,296,100
(72%)
44 PAYING IT FORWARD: HOW INVESTMENT IN RECYCLING WILL PAY DIVIDENDS
The MRF investment and hub and spoke components of the model could be highly beneficial
for glass.39 Glass is a core recyclable that has been disproportionately affected by the transition
to single-stream, and in the MRF, is most often a negative sort commodity with residual
contamination. Quality of material has a dramatic impact on commodity value, and therefore
there is a strong correlation between the presence of glass cleaning equipment in MRFs and
the acceptability of glass in local collection programs. Investment in facilities lacking the basic
equipment necessary to process glass through a MRF can help protect glass as a material
collected in recycling programs and provide the glass industry with a supply that helps meet its
recycling goals.40
Additional Materials
Other types of consumer packaging also currently sit outside mainstream recyclable status for
reasons ranging from design to critical mass for processing and market acceptance. Packaging
examples such as tubes and thermoforms are not widely recycled but, like film and flexibles,
demand attention in how they would be treated in a fully equitable and informed access system.
The model envisioned in this report assumes that brands and packagers would continue to
engage in activities to build a pathway to circularity for the items that are currently outside of
historical collection: problem-solving about material use, MRF sortability, and market utilization.
As those activities progress, the materials should be easily accommodated into existing and
expanding collection under equitable access and can be facilitated by the MRF investments
described in this report. In short, other than some use of the MRF upgrade capital described in
Figure A5, no additional investment would be needed for these packaging types, as long as the design and other challenges of circularity are addressed.
39 In April 2021, the glass container industry released a commitment to work with recycling stakeholders to achieve meet 50 percent recycling rates and recycled content goals, along with a policy roadmap for how to achieve those objectives - see: https://www.gpi.org/a-circular-future-for-glass. The glass industry coalition (GRC) has also developed a MRF glass certification program - glassrecycles.org/mrfglasscertification - based on market standards to ensure that collected glass is recovered and not sent to landfill.
40 https://www.gpi.org/a-circular-future-for-glass
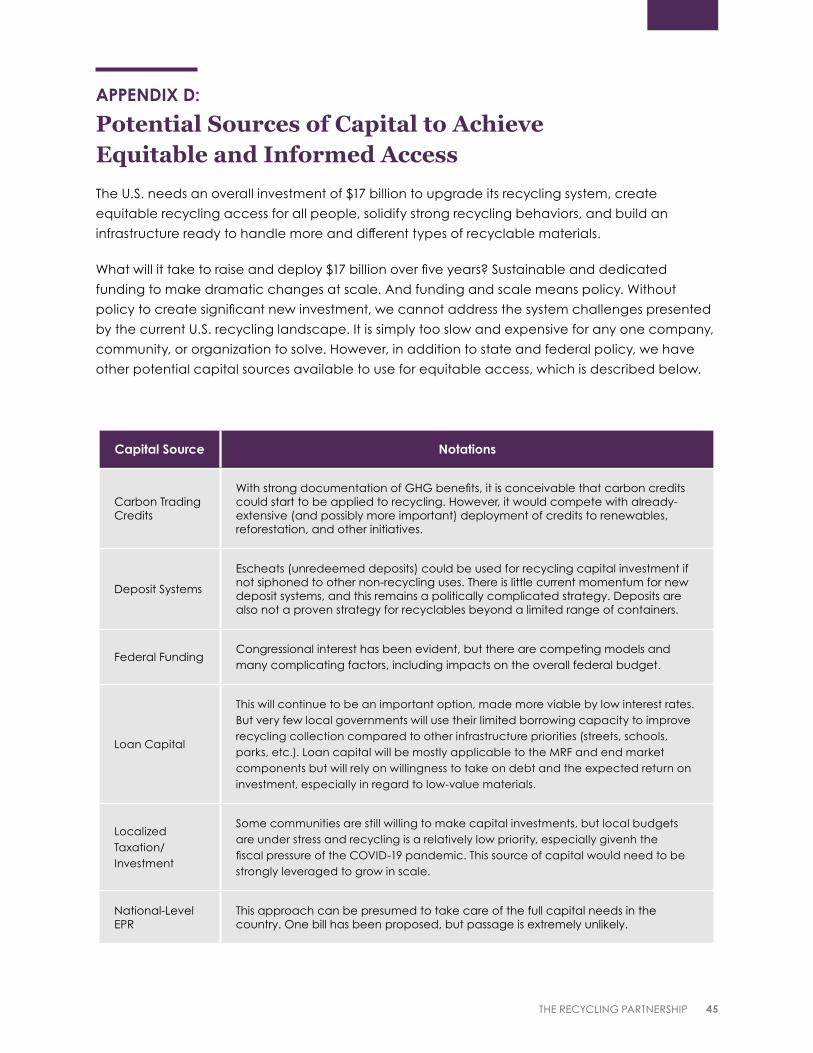
45THE RECYCLING PARTNERSHIP
APPENDIX D: Potential Sources of Capital to Achieve Equitable and Informed Access The U.S. needs an overall investment of $17 billion to upgrade its recycling system, create
equitable recycling access for all people, solidify strong recycling behaviors, and build an
infrastructure ready to handle more and different types of recyclable materials.
What will it take to raise and deploy $17 billion over five years? Sustainable and dedicated
funding to make dramatic changes at scale. And funding and scale means policy. Without
policy to create significant new investment, we cannot address the system challenges presented
by the current U.S. recycling landscape. It is simply too slow and expensive for any one company,
community, or organization to solve. However, in addition to state and federal policy, we have
other potential capital sources available to use for equitable access, which is described below.
Capital Source Notations
Carbon Trading Credits
With strong documentation of GHG benefits, it is conceivable that carbon credits could start to be applied to recycling. However, it would compete with already- extensive (and possibly more important) deployment of credits to renewables, reforestation, and other initiatives.
Deposit Systems
Escheats (unredeemed deposits) could be used for recycling capital investment if not siphoned to other non-recycling uses. There is little current momentum for new deposit systems, and this remains a politically complicated strategy. Deposits are also not a proven strategy for recyclables beyond a limited range of containers.
Federal FundingCongressional interest has been evident, but there are competing models and many complicating factors, including impacts on the overall federal budget.
Loan Capital
This will continue to be an important option, made more viable by low interest rates. But very few local governments will use their limited borrowing capacity to improve recycling collection compared to other infrastructure priorities (streets, schools, parks, etc.). Loan capital will be mostly applicable to the MRF and end market components but will rely on willingness to take on debt and the expected return on investment, especially in regard to low-value materials.
Localized Taxation/ Investment
Some communities are still willing to make capital investments, but local budgets are under stress and recycling is a relatively low priority, especially givenh the fiscal pressure of the COVID-19 pandemic. This source of capital would need to be strongly leveraged to grow in scale.
National-Level EPR
This approach can be presumed to take care of the full capital needs in the country. One bill has been proposed, but passage is extremely unlikely.
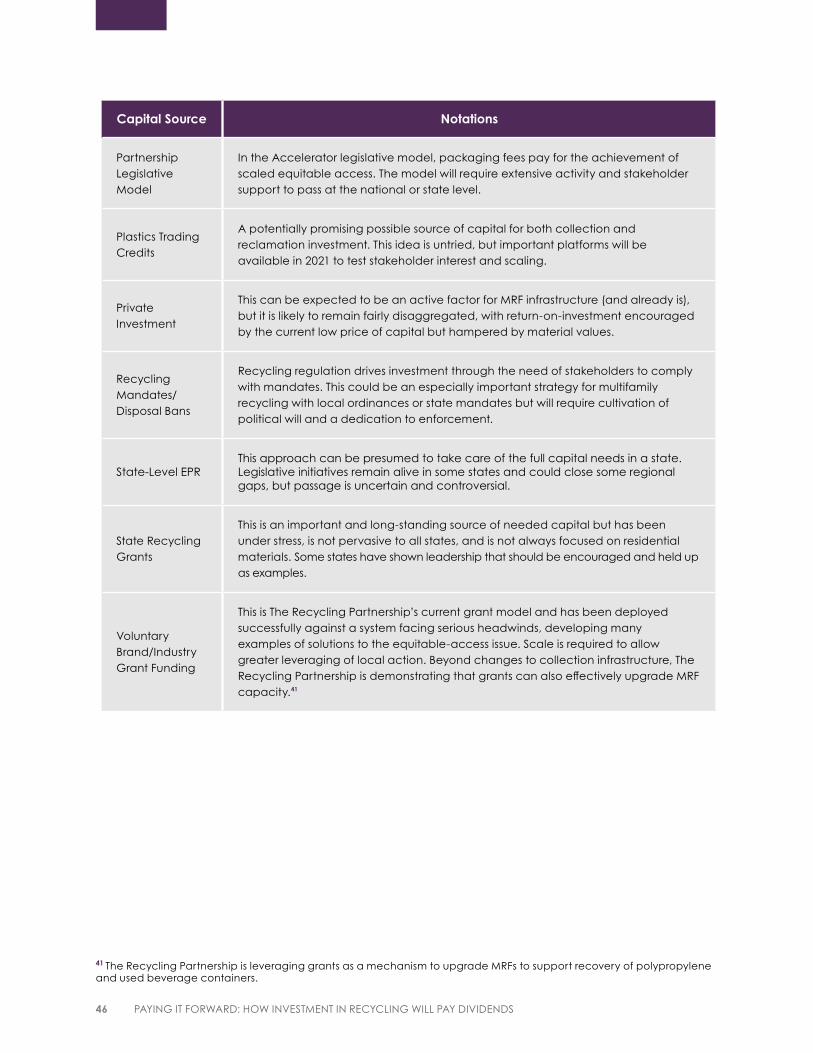
46 PAYING IT FORWARD: HOW INVESTMENT IN RECYCLING WILL PAY DIVIDENDS
Capital Source Notations
Partnership Legislative Model
In the Accelerator legislative model, packaging fees pay for the achievement of scaled equitable access. The model will require extensive activity and stakeholder support to pass at the national or state level.
Plastics Trading Credits
A potentially promising possible source of capital for both collection and reclamation investment. This idea is untried, but important platforms will be available in 2021 to test stakeholder interest and scaling.
Private Investment
This can be expected to be an active factor for MRF infrastructure (and already is), but it is likely to remain fairly disaggregated, with return-on-investment encouraged by the current low price of capital but hampered by material values.
Recycling Mandates/Disposal Bans
Recycling regulation drives investment through the need of stakeholders to comply with mandates. This could be an especially important strategy for multifamily recycling with local ordinances or state mandates but will require cultivation of political will and a dedication to enforcement.
State-Level EPRThis approach can be presumed to take care of the full capital needs in a state. Legislative initiatives remain alive in some states and could close some regional gaps, but passage is uncertain and controversial.
State Recycling Grants
This is an important and long-standing source of needed capital but has been under stress, is not pervasive to all states, and is not always focused on residential materials. Some states have shown leadership that should be encouraged and held up as examples.
Voluntary Brand/Industry Grant Funding
This is The Recycling Partnership’s current grant model and has been deployed successfully against a system facing serious headwinds, developing many examples of solutions to the equitable-access issue. Scale is required to allow greater leveraging of local action. Beyond changes to collection infrastructure, The Recycling Partnership is demonstrating that grants can also effectively upgrade MRF capacity.41
41 The Recycling Partnership is leveraging grants as a mechanism to upgrade MRFs to support recovery of polypropylene and used beverage containers.
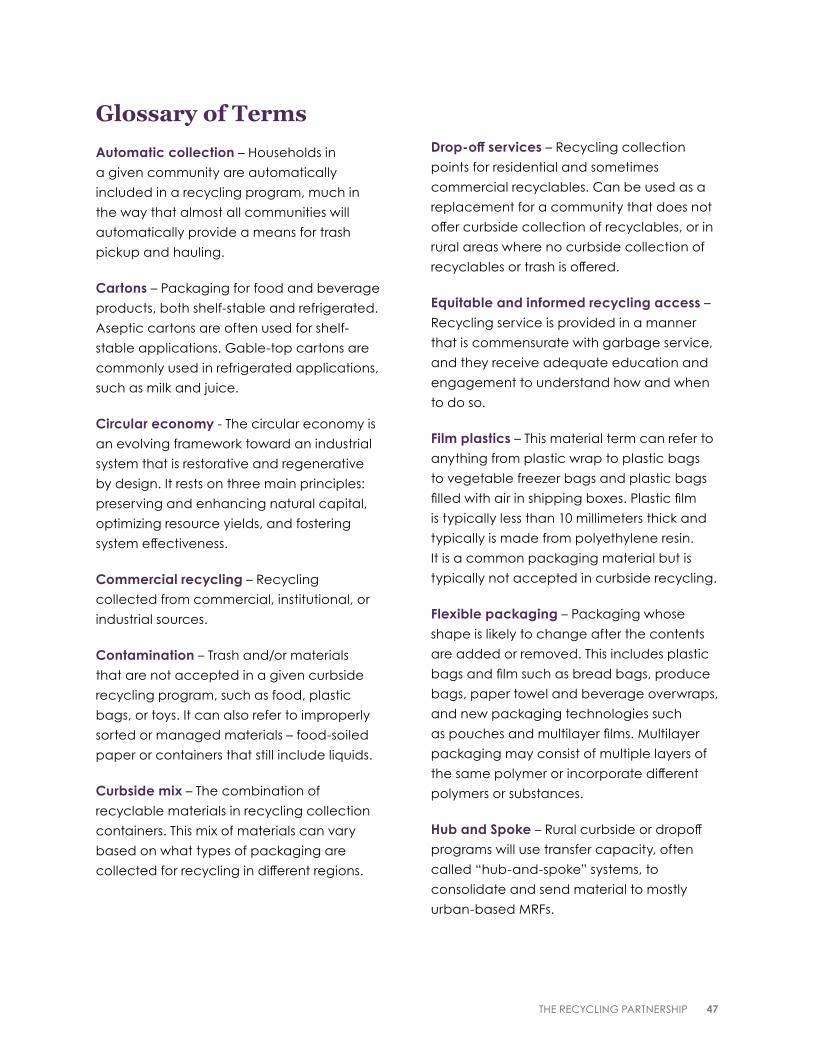
47THE RECYCLING PARTNERSHIP
Glossary of TermsAutomatic collection – Households in
a given community are automatically
included in a recycling program, much in
the way that almost all communities will
automatically provide a means for trash
pickup and hauling.
Cartons – Packaging for food and beverage
products, both shelf-stable and refrigerated.
Aseptic cartons are often used for shelf-
stable applications. Gable-top cartons are
commonly used in refrigerated applications,
such as milk and juice.
Circular economy - The circular economy is
an evolving framework toward an industrial
system that is restorative and regenerative
by design. It rests on three main principles:
preserving and enhancing natural capital,
optimizing resource yields, and fostering
system effectiveness.
Commercial recycling – Recycling
collected from commercial, institutional, or
industrial sources.
Contamination – Trash and/or materials
that are not accepted in a given curbside
recycling program, such as food, plastic
bags, or toys. It can also refer to improperly
sorted or managed materials – food-soiled
paper or containers that still include liquids.
Curbside mix – The combination of
recyclable materials in recycling collection
containers. This mix of materials can vary
based on what types of packaging are
collected for recycling in different regions.
Drop-off services – Recycling collection
points for residential and sometimes
commercial recyclables. Can be used as a
replacement for a community that does not
offer curbside collection of recyclables, or in
rural areas where no curbside collection of
recyclables or trash is offered.
Equitable and informed recycling access –
Recycling service is provided in a manner
that is commensurate with garbage service,
and they receive adequate education and
engagement to understand how and when
to do so.
Film plastics – This material term can refer to
anything from plastic wrap to plastic bags
to vegetable freezer bags and plastic bags
filled with air in shipping boxes. Plastic film
is typically less than 10 millimeters thick and
typically is made from polyethylene resin.
It is a common packaging material but is
typically not accepted in curbside recycling.
Flexible packaging – Packaging whose
shape is likely to change after the contents
are added or removed. This includes plastic
bags and film such as bread bags, produce
bags, paper towel and beverage overwraps,
and new packaging technologies such
as pouches and multilayer films. Multilayer
packaging may consist of multiple layers of
the same polymer or incorporate different
polymers or substances.
Hub and Spoke – Rural curbside or dropoff
programs will use transfer capacity, often
called “hub-and-spoke” systems, to
consolidate and send material to mostly
urban-based MRFs.
48 PAYING IT FORWARD: HOW INVESTMENT IN RECYCLING WILL PAY DIVIDENDS
Landfill – A disposal site for the deposit of
waste onto or into land under controlled or
regulated conditions.
Material processing fees – Costs incurred to
process collected recyclables.
Materials recovery facility (MRF) – A facility
that sorts, processes, and bales different
types of aggregated recyclables for sale to
reprocessors.
Multifamily recycling – Recycling collection
from locations with numerous households,
such as apartments, townhomes, condos,
or generally any property with five or more
habitable units.
Municipal solid waste (MSW) – Residential
and commercial non-hazardous waste
generated by municipalities and
commercial entities, not including medical,
industrial or construction/demolition waste.
Old corrugated containers (OCC) or corrugated containers – A type of fiber
packaging often used in shipping products
that contains a wavy middle layer that gives
the packaging strength, commonly referred
to as cardboard.
Plastics abbreviations – This report uses
many abbreviations to describe different
types of plastics used in the manufacture of
packaging, including:
• PET: polyethylene terephthalate (PET)
(beverage containers, cups, clamshells,
etc.)
• HDPE: high-density polyethylene (HDPE)
(milk jugs, detergent containers, etc.)
• PVC: polyvinyl chloride (PVC) (pipes,
siding, flooring, etc.)
• LDPE: low-density polyethylene (LDPE)
(plastic bags, six-pack rings, tubing, etc.)
• PP: polypropylene (PP) (yogurt cups,
margarine tubs, other food containers,
etc.)
• PS: polystyrene (PS) (Styrofoam, or
expanded polystyrene, coffee cups,
cafeteria trays, etc.)
• Other: also known as #7, these other
plastics include acrylic, polycarbonate,
and polylactic acid (PLA), etc.
Recyclable – Characteristic of a product,
packaging, or associated component that
can be diverted from the waste stream
through available processes and programs
and can be collected, processed, and
returned to use in the form of raw materials
or products.
Glossary of Terms (cont.)
49THE RECYCLING PARTNERSHIP
Residential mixed paper or mixed paper (RMP) – The fiber portion of the curbside
mix that includes everything but separated
OCC. This includes all sorts of fiber-based
packaging, such as containerboard,
paperboard, magazines, office and scrap
paper, and catalogs.
Shared Producer Responsibility – A policy
approach for funding recycling that outlines
a public-private partnership to fund the
recovery of residential printed paper and
packaging. In the shared responsibility
approach put forth by the Circular Economy
Accelerator and its members, the public
sector continues to fund the operations
of the recycling system and the private
sector funds system infrastructure, as well
as education and outreach to improve the
capture and quality of residential recycling
materials collected.
Single-family recycling – Recycling
collection from single-family homes or
generally from buildings up to four habitable
units.
Single-stream collection of recyclables –
The practice of collecting commingled
recyclable materials all in one container
at the curbside. This varies from “dual-
stream” or “multi-stream” collection, which
aggregates fiber, such as newspaper and
cardboard, and bottles, cans, and other
containers in two or more receptacles.
Subscription-based (or “opt-in”) recycling collection – A community recycling
collection program that requires some level
of household action or engagement to
initiate curbside recycling pickup, whether
it be simply calling a city or waste hauler
and requesting a cart or bin for recycling,
or having to research and contract with a
hauler in the area to set up and be charged
for the service.
Glossary of Terms (cont.)