Embed Size (px)
Citation preview
How Important is Tourism to Rhode Island?
2006 Tourism Satellite Account
Kenneth McGillExecutive Managing DirectorTravel & Tourism [email protected]

Copyright © 2007 Global Insight, Inc. 2
About Global Insight:
Premier economic analysis and consulting organization
Formed in 2001 by combining WEFA and DRI
Provides the most comprehensive coverage of countries, regions and industries available from any single source
Brings a common analytical framework and a consistent set of assumptions to diverse capabilities and products
Most consistently accurate commercial forecaster www.globalinsight.com/accolades
• Provides a broad range of consulting capabilities covering:
• Strong reputation and experience within the travel & tourism sector
Market Analysis Business Planning Investment Strategy Risk Assessment Infrastructure Analysis Policy Evaluation Economic Development Economic Impact
Copyright © 2007 Global Insight, Inc. 3
Tourism Satellite Accounting
• The Tourism Satellite Account is the international (UN/WTO, OECD) standard for measuring the contribution of tourism to an economy
• Measuring the industry “tourism” is difficult: tourism is not measured in standard economic accounting terms. Most industries are accounted via the supply-side: firms are
categorized into NAICS codes and asked about jobs, revenues, costs.
But tourism is a demand-side activity: the focus is on what the traveler buys before and during a trip( hotel, food, transpo, retail…).
As a result, tourism touches many industries
• 4Cs: Credibility, Comprehensiveness, Comparability, Consistency
3
Copyright © 2007 Global Insight, Inc. 4
Benefits of a TSA
4
Which are our best economic development targets?Which are our best economic development targets? Allows policy-makers to compare the size & growth of tourism to other industrial sectors.
What is the ROI of public tourism investment?What is the ROI of public tourism investment? Enables analysts to assess long-term health of the tourism sector vis-a-vis capital investment and govt. support.
How can we benchmark ourselves against our destination How can we benchmark ourselves against our destination competition?competition? Provides an accepted international standard for benchmarking.
How can we communicate the full value of tourism to policy How can we communicate the full value of tourism to policy makers, businesses, and citizens?makers, businesses, and citizens? Quantifies the value of visitors to Rhode Island.
Copyright © 2007 Global Insight, Inc
Copyright © 2007 Global Insight, Inc. 5
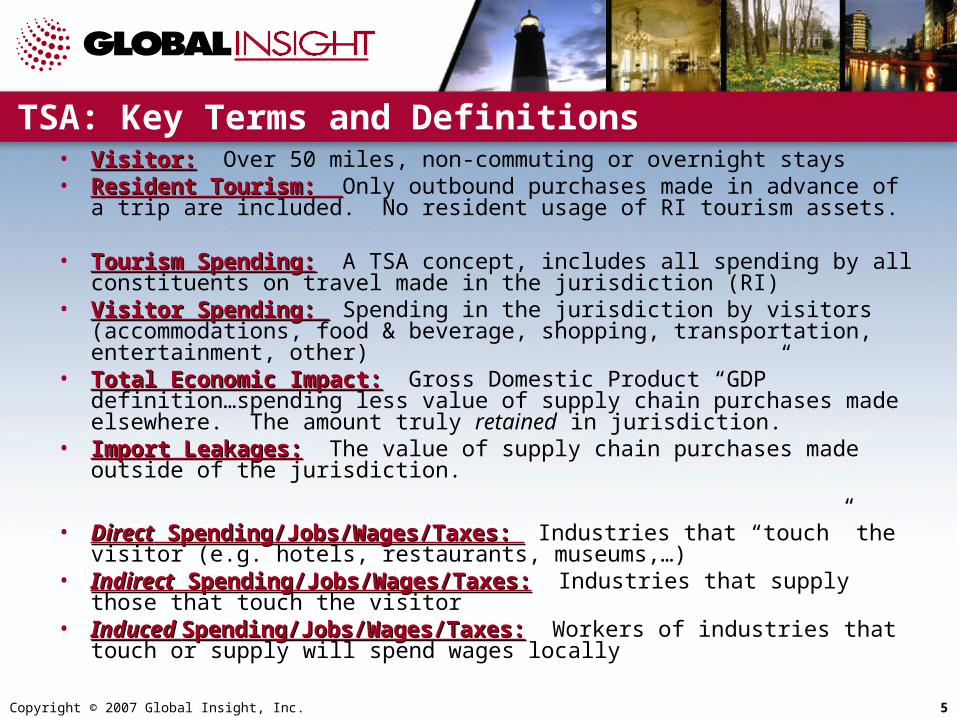
TSA: Key Terms and Definitions• Visitor:Visitor: Over 50 miles, non-commuting or overnight stays• Resident Tourism: Resident Tourism: Only outbound purchases made in advance of a trip are
included. No resident usage of RI tourism assets.
• Tourism Spending:Tourism Spending: A TSA concept, includes all spending by all constituents on travel made in the jurisdiction (RI)
• Visitor Spending: Visitor Spending: Spending in the jurisdiction by visitors (accommodations, food & beverage, shopping, transportation, entertainment, other)
• Total Economic Impact:Total Economic Impact: Gross Domestic Product “GDP” definition…spending less value of supply chain purchases made elsewhere. The amount truly retained in jurisdiction.
• Import Leakages:Import Leakages: The value of supply chain purchases made outside of the jurisdiction.
• DirectDirect Spending/Jobs/Wages/Taxes: Spending/Jobs/Wages/Taxes: Industries that “touch” the visitor (e.g. hotels, restaurants, museums,…)
• IndirectIndirect Spending/Jobs/Wages/Taxes: Spending/Jobs/Wages/Taxes: Industries that supply those that touch the visitor
• Induced Induced Spending/Jobs/Wages/Taxes:Spending/Jobs/Wages/Taxes: Workers of industries that touch or supply will spend wages locally

Copyright © 2007 Global Insight, Inc. 6
Travel & Tourism Economy
T&T Industry and Economy
The TSA provides both a narrow & a broad understanding of the Tourism “Industry”
Travel & Tourism EconomyThe flow-through effect of travel demand across the economy
Travel & Tourism IndustryThe direct effect of travel demand
Copyright © 2007 Global Insight, Inc. 7
2006 Rhode IslandTourism Results

Copyright © 2007 Global Insight, Inc. 8
Rhode Island Tourism Economic Impact - Definitions
• TSA:TSA: Results (spending, economic impact, jobs,…) conform strictly to the TSA definition (e.g. 50mile+overnight visitor definition).
• TSA + Under 50 Mile:TSA + Under 50 Mile: TSA results, plus those trips coming from visitors traveling less than the 50 mile threshold. This classification is both historically consistent with previous Rhode Island studies and arguably more applicable to Rhode Island’s needs.
• Total Impact:Total Impact: Total economic contribution of tourism to Rhode Island. Sum of core and non-core tourism.
• Core Impact:Core Impact: Economic contribution from industries directly providing goods and services to the visitor.
• Non-core Impact:Non-core Impact: Economic contribution from industries providing goods and services to core tourism providers. Also includes tourism investment.
Ap
pro
ach
Ap
pro
ach
Imp
act
So
urc
esIm
pa
ct S
ou
rces

Copyright © 2007 Global Insight, Inc. 9
Rhode Island Tourism: Did You Know?
Total tourism expenditures* reached $5.4B in 2006Total tourism expenditures* reached $5.4B in 2006 In ’06, visitation grew by 2% and expenditures by 1%In ’06, visitation grew by 2% and expenditures by 1% Avg. spend-per-visitor grew to $308 in ‘06Avg. spend-per-visitor grew to $308 in ‘06 1 of every 10 Rhode Islanders owes his/her job to tourism1 of every 10 Rhode Islanders owes his/her job to tourism Rhode Island keeps 61Rhode Island keeps 61¢ of every dollar spent by visitors¢ of every dollar spent by visitors Tourism is responsible for 5% of total RI Gross State ProductTourism is responsible for 5% of total RI Gross State Product Tourism generated 11% of all state & local tax revenue in ’06Tourism generated 11% of all state & local tax revenue in ’06 Tourism’s tax contribution reached $1,140 per RI HouseholdTourism’s tax contribution reached $1,140 per RI Household Tourism is the 4Tourism is the 4thth largest industry in RI (based upon jobs) largest industry in RI (based upon jobs) Avg. Annual Tourism Wages reached $28,900 in ’06Avg. Annual Tourism Wages reached $28,900 in ’06 Every 249 visitor/travelers creates a new job in RIEvery 249 visitor/travelers creates a new job in RI Appx. 40% of RI restaurant revenue can be attributed to visitorsAppx. 40% of RI restaurant revenue can be attributed to visitors
Total tourism expenditures* reached $5.4B in 2006Total tourism expenditures* reached $5.4B in 2006 In ’06, visitation grew by 2% and expenditures by 1%In ’06, visitation grew by 2% and expenditures by 1% Avg. spend-per-visitor grew to $308 in ‘06Avg. spend-per-visitor grew to $308 in ‘06 1 of every 10 Rhode Islanders owes his/her job to tourism1 of every 10 Rhode Islanders owes his/her job to tourism Rhode Island keeps 61Rhode Island keeps 61¢ of every dollar spent by visitors¢ of every dollar spent by visitors Tourism is responsible for 5% of total RI Gross State ProductTourism is responsible for 5% of total RI Gross State Product Tourism generated 11% of all state & local tax revenue in ’06Tourism generated 11% of all state & local tax revenue in ’06 Tourism’s tax contribution reached $1,140 per RI HouseholdTourism’s tax contribution reached $1,140 per RI Household Tourism is the 4Tourism is the 4thth largest industry in RI (based upon jobs) largest industry in RI (based upon jobs) Avg. Annual Tourism Wages reached $28,900 in ’06Avg. Annual Tourism Wages reached $28,900 in ’06 Every 249 visitor/travelers creates a new job in RIEvery 249 visitor/travelers creates a new job in RI Appx. 40% of RI restaurant revenue can be attributed to visitorsAppx. 40% of RI restaurant revenue can be attributed to visitors

Copyright © 2007 Global Insight, Inc. 10
State Overview: 2006 Totals At A Glance
Source: Global Insight* TSA includes all overnight visitors and those traveling over 50 miles, non-commuting** Employment figures taken from a top down review of the total spending, creating a resultant number of jobs required to support that spending.
Tourism Concept TSA*TSA* + Under
50 Mile VisitorsDifference
VisitsVisits 7.96 M7.96 M 17.46 M 9.50 M
ExpenditureExpenditure $3.69 B$3.69 B $5.38 B $1.69 B
Economic Impact (GSP)Economic Impact (GSP) $2.26 B$2.26 B $3.20 B $940 M
Jobs**Jobs** 47,85447,854 70,079 22,225
WagesWages $1.38 B$1.38 B $2.04 B $660 M
TaxesTaxes $860 M$860 M $1,327 M $467 M
Copyright © 2007 Global Insight, Inc. 11
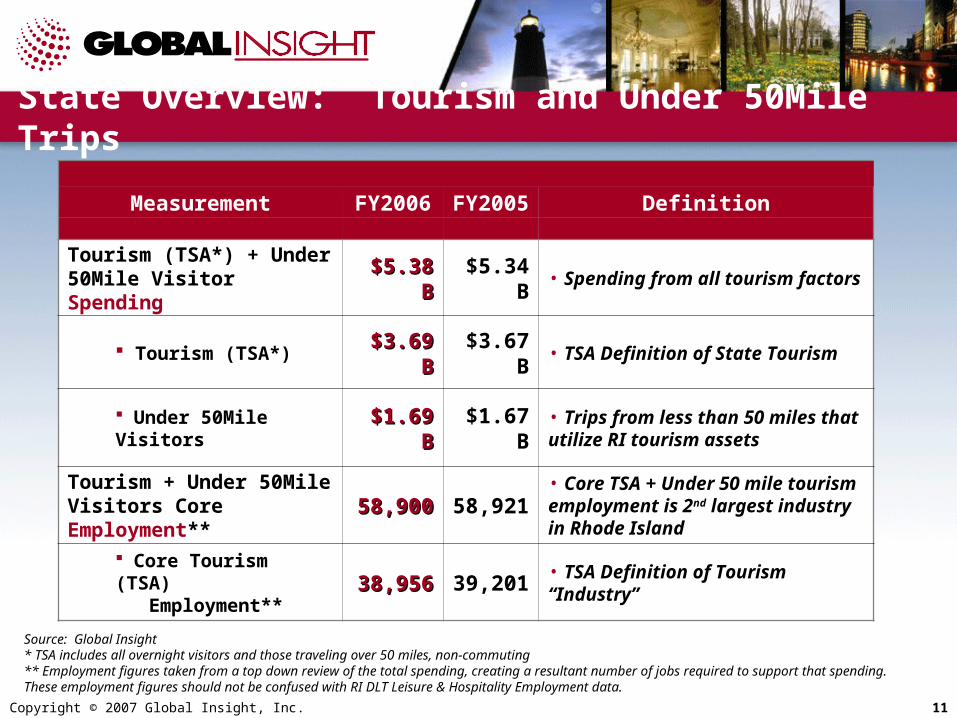
State Overview: Tourism and Under 50Mile Trips
Source: Global Insight* TSA includes all overnight visitors and those traveling over 50 miles, non-commuting** Employment figures taken from a top down review of the total spending, creating a resultant number of jobs required to support that spending. These employment figures should not be confused with RI DLT Leisure & Hospitality Employment data.
Measurement FY2006 FY2005 Definition
Tourism (TSA*) + Under 50Mile Visitor Spending $5.38 B$5.38 B $5.34 B • Spending from all tourism factors
Tourism (TSA*) $3.69 B$3.69 B $3.67 B • TSA Definition of State Tourism
Under 50Mile Visitors $1.69 B$1.69 B $1.67 B• Trips from less than 50 miles that utilize RI tourism assets
Tourism + Under 50Mile Visitors Core Employment** 58,90058,900 58,921
• Core TSA + Under 50 mile tourism employment is 2nd largest industry in Rhode Island
Core Tourism (TSA) Employment** 38,95638,956 39,201
• TSA Definition of Tourism “Industry”

Copyright © 2007 Global Insight, Inc. 12
Industry Structure: Definitions
Source: Global InsightCopyright © 2007 Global Insight, Inc.
12
$5.38 billion
$3.69 billion
$2.26 billion $1.43 billion
$1.71 billion $547 million

Copyright © 2007 Global Insight, Inc. 13
Total Tourism (TSA*) Expenditures
• RI visitation grew 2.1% in ‘06 • Spending per visit declined by 0.7% in ‘06
• Leisure travel increased by 4.2% in ’06**• Business travel decreased by 6.0% in ’06**
Tourism expenditures tallied $3.69 billion in 2006
Tourism expenditures tallied $3.69 billion in 2006
Source: Global Insight
-0.4% 0.6%
$0
$500
$1,000
$1,500
$2,000
$2,500
$3,000
$3,500
$4,000
2004 2005 2006
$ M
illi
on
Core Tourism
Total Impact
TourismExpenditures
* TSA includes all overnight visitors and those traveling over 50 miles, non-commuting** Visitors from over 50 miles or overnight only, provided by DK Shifflet & Associates, Ltd. Business travel results were estimated by GII.
Copyright © 2007 Global Insight, Inc. 14
0
2
4
6
8
10
2004 2005 2006
Business Leisure
Total
(Million Visitors)
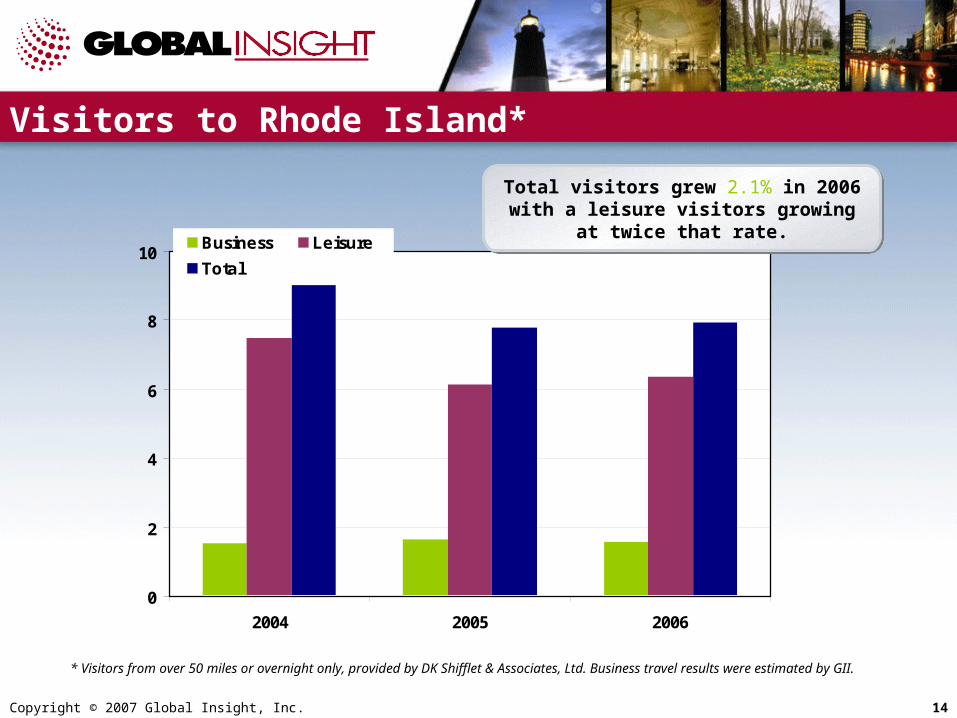
Visitors to Rhode Island*
Total visitors grew 2.1% in 2006 with a leisure visitors growing at twice that rate.
Total visitors grew 2.1% in 2006 with a leisure visitors growing at twice that rate.
* Visitors from over 50 miles or overnight only, provided by DK Shifflet & Associates, Ltd. Business travel results were estimated by GII.
Copyright © 2007 Global Insight, Inc. 15
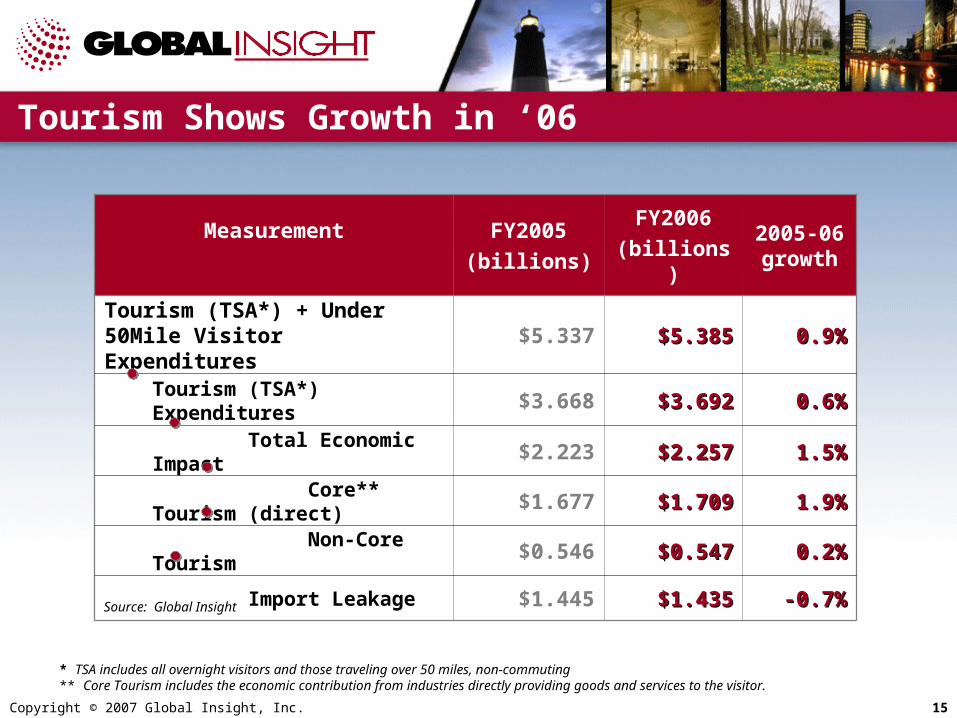
Tourism Shows Growth in ‘06
Measurement FY2005
(billions)
FY2006
(billions)2005-06 growth
Tourism (TSA*) + Under 50Mile Visitor Expenditures
$5.337 $5.385$5.385 0.9%0.9%
Tourism (TSA*) Expenditures $3.668 $3.692$3.692 0.6%0.6%
Total Economic Impact $2.223 $2.257$2.257 1.5%1.5%
Core** Tourism (direct) $1.677 $1.709$1.709 1.9%1.9%
Non-Core Tourism $0.546 $0.547$0.547 0.2%0.2%
Import Leakage $1.445 $1.435$1.435 -0.7%-0.7%
Source: Global Insight
* TSA includes all overnight visitors and those traveling over 50 miles, non-commuting** Core Tourism includes the economic contribution from industries directly providing goods and services to the visitor.

Copyright © 2007 Global Insight, Inc. 16
Measurement FY2006 FY2005 % Perspective
Economic Value ($B)Economic Value ($B) Core** Tourism Total Impact
$1.71$1.71
$2.26$2.26
$1.68
$2.22
1.9%
1.5%
• Solid growth strengthened by leisure travel
Wages & SalariesWages & Salaries Core** Tourism ($M) Total Impact ($M)
$1,031 $1,031
$1,381$1,381
$1,008
$1,357
2.3%
1.8%
• Average annual salary saw 3.0% and 2.3% growth respectively
Employment*** (‘000)Employment*** (‘000) Core** Tourism Total Impact
38.9638.96
47.8547.85
39.20
48.03
-0.6%
-0.4%
• Core tourism is 4th largest industry in RI
Taxes –Total Impact Taxes –Total Impact ($M)($M) $856$856 $865 -0.6%
• If tourism didn’t exist, each household would pay an additional $1,140 in taxes to maintain current tax receipts.
Numbers may differ due to rounding
RI Tourism (TSA* Based) continues to grow…
Source: Global Insight* TSA includes all overnight visitors and those traveling over 50 miles, non-commuting** Core Tourism includes the economic contribution from industries directly providing goods and services to the visitor. *** Employment figures taken from a top down review of the total spending, creating a resultant number of jobs required to support that spending. These employment figures should not be confused with RI DLT Leisure & Hospitality Employment data.
Copyright © 2007 Global Insight, Inc. 17
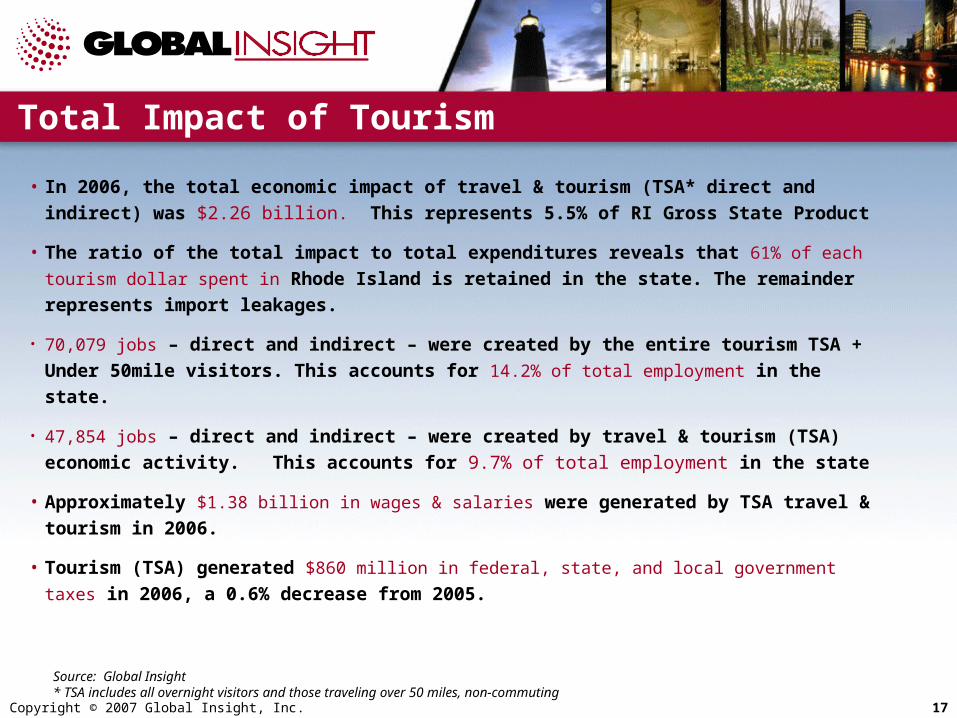
Total Impact of Tourism
• In 2006, the total economic impact of travel & tourism (TSA* direct and indirect) was
$2.26 billion. This represents 5.5% of RI Gross State Product
• The ratio of the total impact to total expenditures reveals that 61% of each tourism
dollar spent in Rhode Island is retained in the state. The remainder represents
import leakages.
• 70,079 jobs – direct and indirect – were created by the entire tourism TSA + Under
50mile visitors. This accounts for 14.2% of total employment in the state.
• 47,854 jobs – direct and indirect – were created by travel & tourism (TSA) economic
activity. This accounts for 9.7% of total employment in the state
• Approximately $1.38 billion in wages & salaries were generated by TSA travel &
tourism in 2006.
• Tourism (TSA) generated $860 million in federal, state, and local government taxes
in 2006, a 0.6% decrease from 2005.
Source: Global Insight* TSA includes all overnight visitors and those traveling over 50 miles, non-commuting

Copyright © 2007 Global Insight, Inc. 18
Sources of Tourism Expenditures
• Visitor Spending – Expenditures by visitors who have come from greater
than 50 miles or stayed overnight
• Business Travel – Businesses’ spending within the state economy on travel
• Resident Outbound – Resident spending preparing for an out-of-state trip
• Government Spending – Tourism Office Budgets, transportation functions
related to tourism, publicly funded attractions and funding for security in tourism-
intensive areas
• Investment – Construction of hotels, attractions, tourism infrastructure,
operating and transportation equipment
• International – Spending of international visitors within the state
• Under 50Mile Visitors – Spending by residents or non-residents who have
come from under 50 miles. No commuters or local utilization. These trips are not
included in TSA definition.
Copyright © 2007 Global Insight, Inc. 19
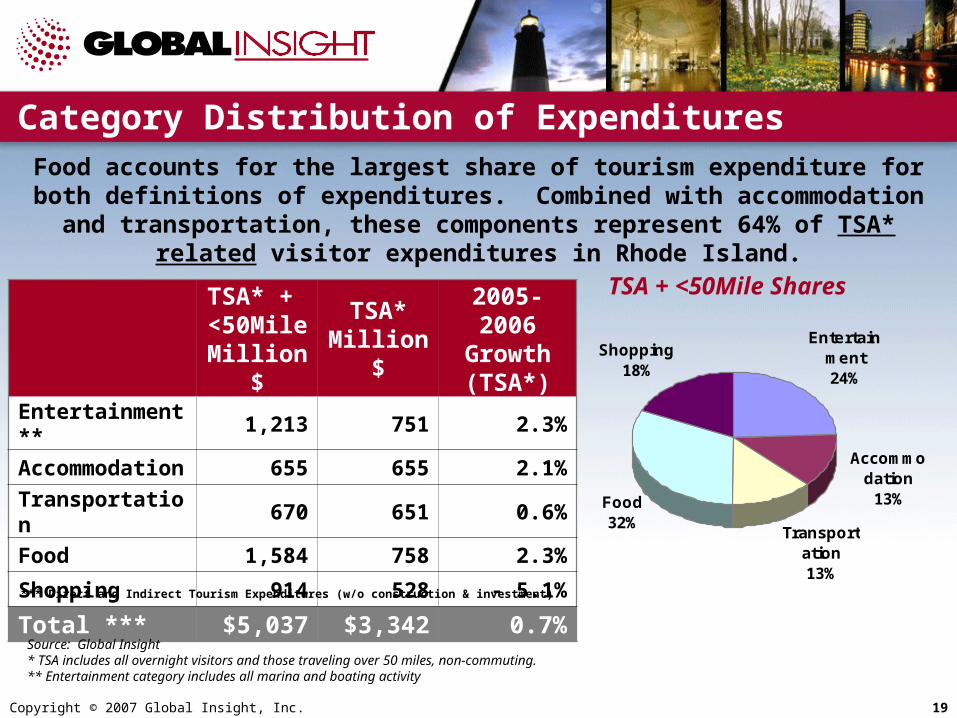
Category Distribution of Expenditures
Food accounts for the largest share of tourism expenditure for both definitions of expenditures. Combined with accommodation and transportation, these
components represent 64% of TSA* related visitor expenditures in Rhode Island.
TSA* + <50Mile Million $
TSA* Million $
2005-2006 Growth (TSA*)
Entertainment** 1,213 751 2.3%
Accommodation 655 655 2.1%
Transportation 670 651 0.6%
Food 1,584 758 2.3%
Shopping 914 528 - 5.1%
Total *** $5,037 $3,342 0.7%*** Direct and Indirect Tourism Expenditures (w/o construction & investment)
Source: Global Insight* TSA includes all overnight visitors and those traveling over 50 miles, non-commuting.** Entertainment category includes all marina and boating activity
TSA + <50Mile Shares
Entertainment24%
Food32%
Shopping18%
Accommodation
13%
Transportation13%

Copyright © 2007 Global Insight, Inc. 20
Category Distribution of TSA* ExpendituresBusiness spending made up just under 26% of total expenditures in 2006,
compared to just under 20% of total visitation. Business expenditures were up 1.1% in 2006, reflecting lower concentrations in Shopping and higher
concentrations in Food.
2006 TotalsTSA*
(Million $)Leisure
(Million $)Business (Million $)
Entertainment** 751 581 170
Accommodation 655 493 162
Transportation 651 527 125
Food 758 421 337
Shopping 528 435 93
Total *** $3,342 $2,456 $887*** Direct and Indirect Tourism Expenditures (w/o construction & investment)
Source: Global Insight* TSA includes all overnight visitors and those traveling over 50 miles, non-commuting** Entertainment category includes all marina and boating activity

Copyright © 2007 Global Insight, Inc. 21
Core** TSA* Tourism
• Answers the question “How does tourism compare with other industries?”
• Core Tourism measures the size of the industry directly providing goods & services to the visitor.
• Indirect effects are excluded – these are part of other supplier industries such as wholesalers. The impact of capital investment is also excluded.
• Core Tourism generated $1.7 billion in economic value in 2006.
* TSA includes all overnight visitors and those traveling over 50 miles, non-commuting** Core Tourism includes the economic contribution from industries directly providing goods and services to the visitor.
Copyright © 2007 Global Insight, Inc. 22
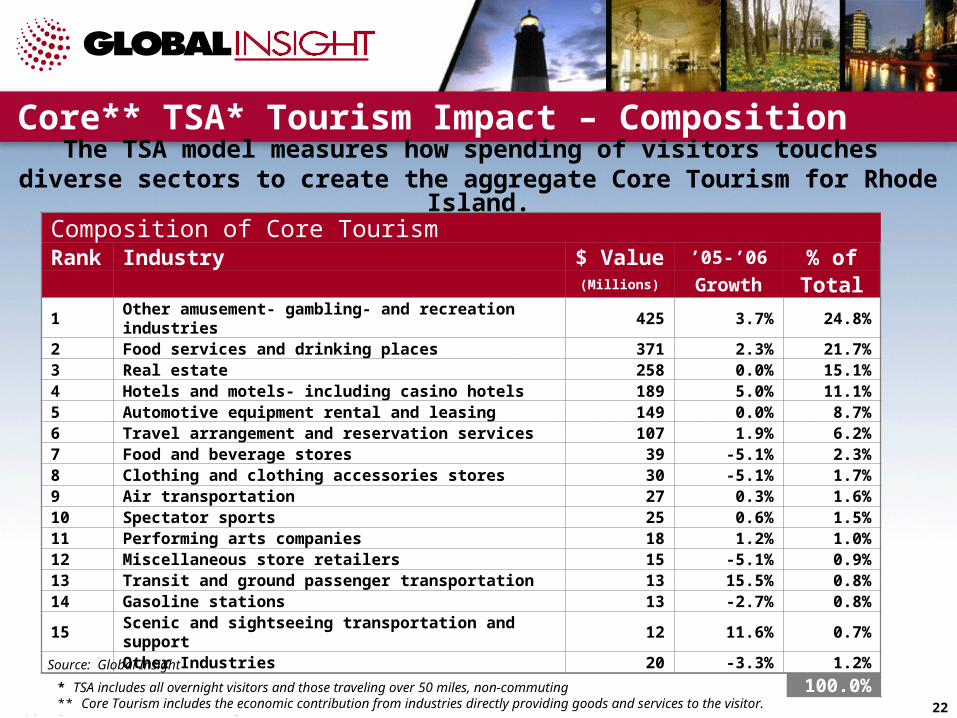
Core** TSA* Tourism Impact – CompositionThe TSA model measures how spending of visitors touches
diverse sectors to create the aggregate Core Tourism for Rhode Island.Composition of Core TourismRank Industry $ Value ’05-’06 % of
(Millions) Growth Total1 Other amusement- gambling- and recreation industries 425 3.7% 24.8%2 Food services and drinking places 371 2.3% 21.7%3 Real estate 258 0.0% 15.1%4 Hotels and motels- including casino hotels 189 5.0% 11.1%5 Automotive equipment rental and leasing 149 0.0% 8.7%6 Travel arrangement and reservation services 107 1.9% 6.2%7 Food and beverage stores 39 -5.1% 2.3%8 Clothing and clothing accessories stores 30 -5.1% 1.7%9 Air transportation 27 0.3% 1.6%10 Spectator sports 25 0.6% 1.5%11 Performing arts companies 18 1.2% 1.0%12 Miscellaneous store retailers 15 -5.1% 0.9%13 Transit and ground passenger transportation 13 15.5% 0.8%14 Gasoline stations 13 -2.7% 0.8%15 Scenic and sightseeing transportation and support 12 11.6% 0.7%
Other Industries 20 -3.3% 1.2%
Total 1,709 1.9% 100.0%Source: Global Insight
* TSA includes all overnight visitors and those traveling over 50 miles, non-commuting** Core Tourism includes the economic contribution from industries directly providing goods and services to the visitor.
Copyright © 2007 Global Insight, Inc. 23
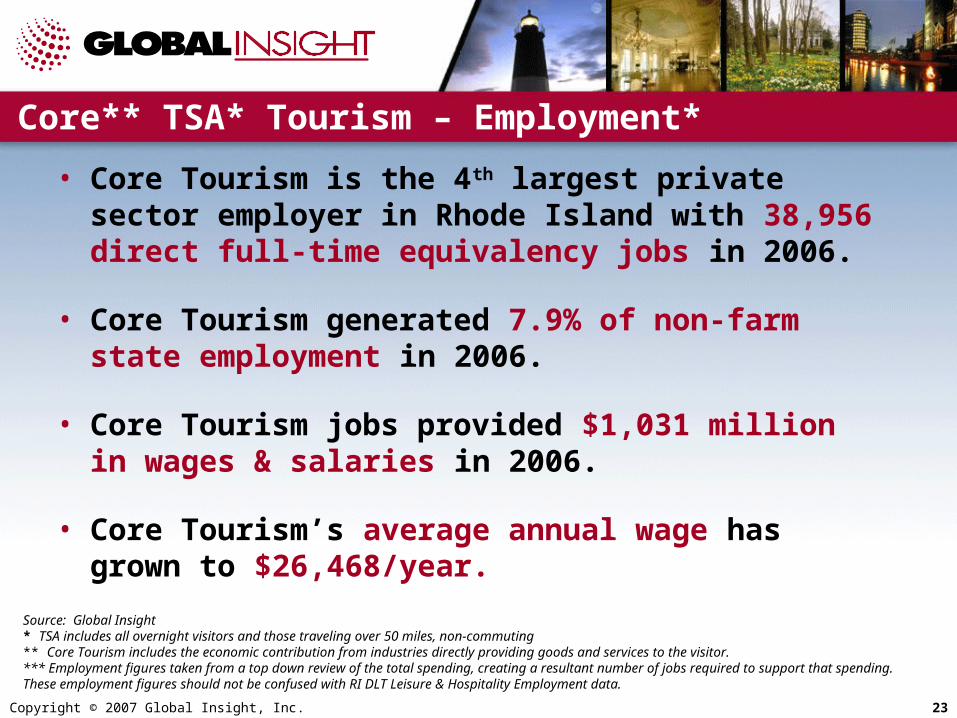
Core** TSA* Tourism – Employment*
• Core Tourism is the 4th largest private sector employer in Rhode Island with 38,956 direct full-time equivalency jobs in 2006.
• Core Tourism generated 7.9% of non-farm state employment in 2006.
• Core Tourism jobs provided $1,031 million in wages & salaries in 2006.
• Core Tourism’s average annual wage has grown to $26,468/year.
Source: Global Insight* TSA includes all overnight visitors and those traveling over 50 miles, non-commuting** Core Tourism includes the economic contribution from industries directly providing goods and services to the visitor. *** Employment figures taken from a top down review of the total spending, creating a resultant number of jobs required to support that spending. These employment figures should not be confused with RI DLT Leisure & Hospitality Employment data.

Copyright © 2007 Global Insight, Inc. 24
Source: Bureau of Labor Statistics and Global Insight* TSA includes all overnight visitors and those traveling over 50 miles, non-commuting** Core Tourism includes the economic contribution from industries directly providing goods and services to the visitor. *** Employment figures taken from a top down review of the total spending, creating a resultant number of jobs required to support that spending. These employment figures should not be confused with RI DLT Leisure & Hospitality Employment data.
Core** TSA* Tourism Impact – Employment*** In Rhode Island Is Composed of Many Industries
Rank IndustryReported
Employment(Thousands)
2005-2006
Growth% of State
Tourism-Extracted
Employment (Thousands)
1 Health Care and Social Assistance 74.05 1.5% 15.0% 74.052 Retail Trade 52.43 -0.1% 10.6% 49.423 Accommodation and Food Services 43.06 0.5% 8.7% 24.614 Professional, Scientific, and Tech. Services 35.54 -1.9% 7.2% 35.545 Administrative and Waste Services 29.42 6.4% 6.0% 27.226 Wholesale Trade 26.25 2.3% 5.3% 26.257 Finance and Insurance 23.07 5.1% 4.7% 23.078 Manufacturing, Nondurables 22.52 -3.0% 4.6% 22.529 Construction 22.30 -0.1% 4.5% 22.30
10 Other Services 21.34 2.1% 4.3% 21.3411 Transportation and Warehousing 17.82 -5.8% 3.6% 16.8212 Manufacturing, Durables 16.36 -2.0% 3.3% 16.3613 Information 10.38 -2.8% 2.1% 10.3814 Educational Services 9.64 -0.9% 2.0% 9.6415 Management of Companies and Enterprises 9.10 4.3% 1.8% 9.10
Other Industries 15.5 -1.4% 3.1% 1.22State & Local Government 64.8 -0.3% 13.1% 64.8
Total Nonfarm 493.6 0.4% 100.% 493.6
Core Tourism represented
38,956 jobs in 2006.
Core Tourism represented
38,956 jobs in 2006.
Travel & Tourism 39.0 - 0.6% 7.9% 39.0
Copyright © 2007 Global Insight, Inc. 25
-0.4%1.4%
0
10
20
30
40
50
60
2004 2005 2006
Tho
usan
ds
Nu
mb
er o
f Jo
bs
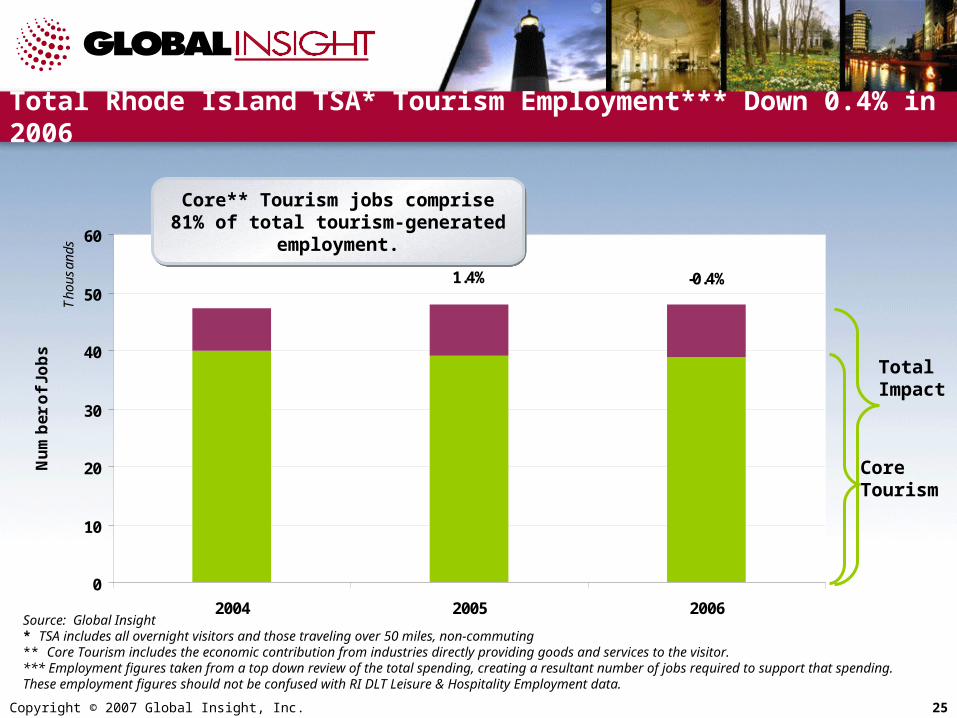
Total Rhode Island TSA* Tourism Employment*** Down 0.4% in 2006
CoreTourism
TotalImpact
Core** Tourism jobs comprise 81% of total tourism-generated employment.Core** Tourism jobs comprise 81% of total tourism-generated employment.
Source: Global Insight* TSA includes all overnight visitors and those traveling over 50 miles, non-commuting** Core Tourism includes the economic contribution from industries directly providing goods and services to the visitor. *** Employment figures taken from a top down review of the total spending, creating a resultant number of jobs required to support that spending. These employment figures should not be confused with RI DLT Leisure & Hospitality Employment data.
Copyright © 2007 Global Insight, Inc. 26
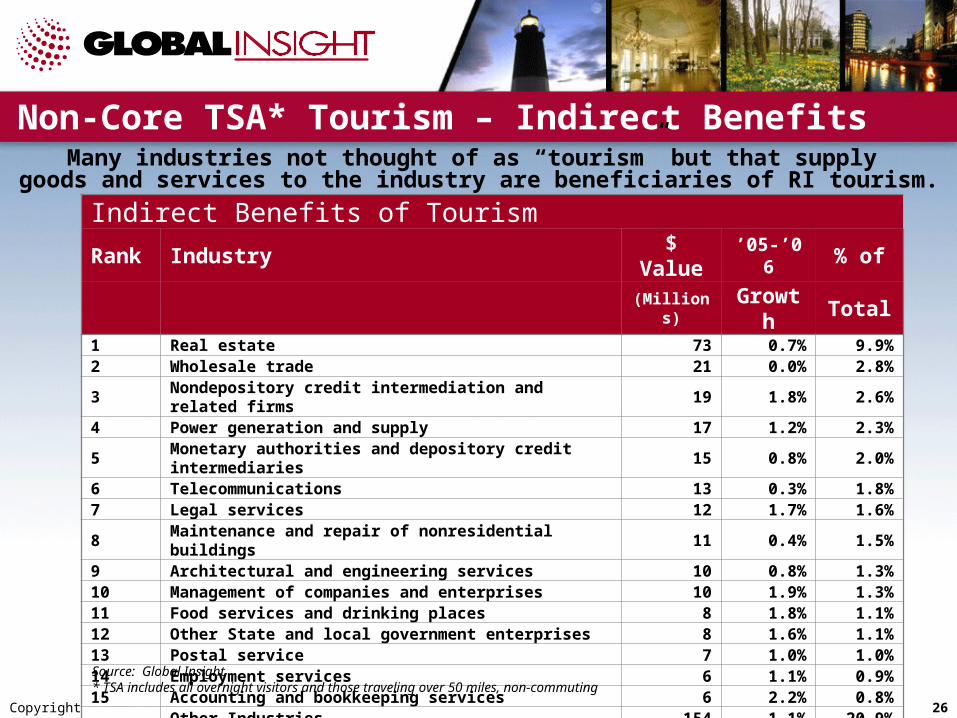
Non-Core TSA* Tourism – Indirect BenefitsMany industries not thought of as “tourism” but that supply
goods and services to the industry are beneficiaries of RI tourism.Indirect Benefits of TourismRank Industry $ Value ’05-’06 % of
(Millions) Growth Total1 Real estate 73 0.7% 9.9%2 Wholesale trade 21 0.0% 2.8%3 Nondepository credit intermediation and related firms 19 1.8% 2.6%4 Power generation and supply 17 1.2% 2.3%5 Monetary authorities and depository credit intermediaries 15 0.8% 2.0%6 Telecommunications 13 0.3% 1.8%7 Legal services 12 1.7% 1.6%8 Maintenance and repair of nonresidential buildings 11 0.4% 1.5%9 Architectural and engineering services 10 0.8% 1.3%10 Management of companies and enterprises 10 1.9% 1.3%11 Food services and drinking places 8 1.8% 1.1%12 Other State and local government enterprises 8 1.6% 1.1%13 Postal service 7 1.0% 1.0%14 Employment services 6 1.1% 0.9%15 Accounting and bookkeeping services 6 2.2% 0.8%
Other Industries 154 1.1% 20.9%Investment 349 0.2% 47.2%
Total 739 0.6% 100.0%Source: Global Insight* TSA includes all overnight visitors and those traveling over 50 miles, non-commuting

Copyright © 2007 Global Insight, Inc. 27
TSA* Tourism Generated $861M in Total Tax Revenue in 2006
• Tourism activity generated $462 million in state and local government revenue in 2006, a 0.6% decrease over 2005.
• In 2006, $314 million in state tax revenue was generated by the travel & tourism sector in Rhode Island. Indirect business tax (sales tax) and the gaming taxes are the two largest contributors.
• Tourism contributes disproportionately to state & local tax revenue. While Core Tourism is responsible for 4.2% of RI GSP, it contributed 10.9% of state government revenue in 2006.
• If tourism didn’t exist, each RI household would pay $1,140 more in taxes to maintain the current level of state and local tax receipts.
* TSA includes all overnight visitors and those traveling over 50 miles, non-commuting
Copyright © 2007 Global Insight, Inc. 28
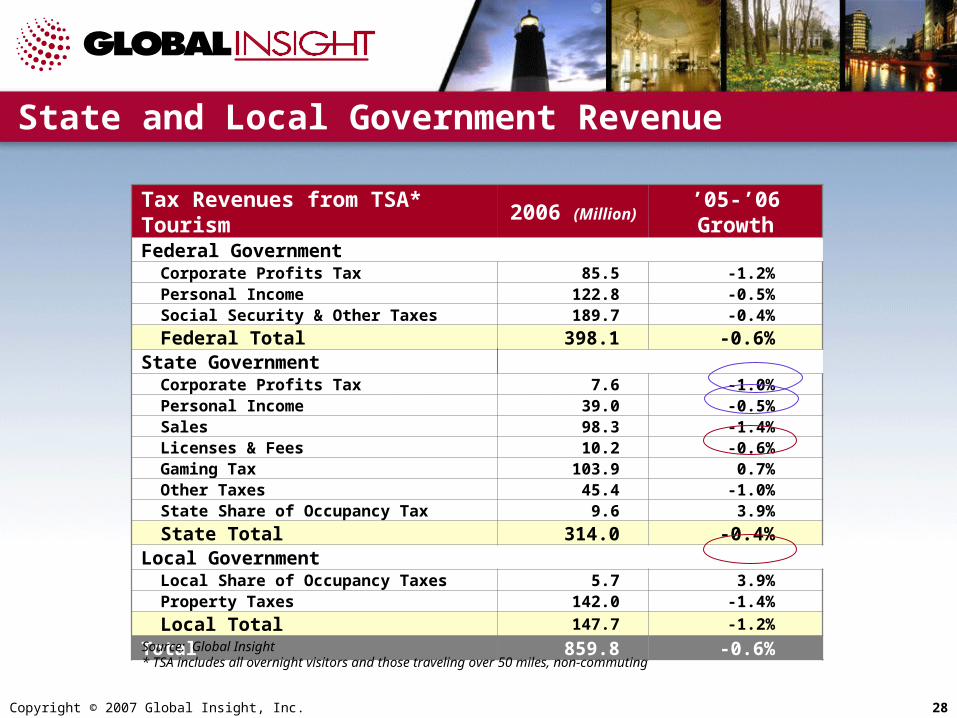
State and Local Government Revenue
Tax Revenues from TSA* Tourism 2006 (Million) ’05-’06 GrowthFederal Government
Corporate Profits Tax 85.5 -1.2%Personal Income 122.8 -0.5%Social Security & Other Taxes 189.7 -0.4%
Federal Total 398.1 -0.6%State Government
Corporate Profits Tax 7.6 -1.0%Personal Income 39.0 -0.5%Sales 98.3 -1.4%Licenses & Fees 10.2 -0.6%Gaming Tax 103.9 0.7%Other Taxes 45.4 -1.0%State Share of Occupancy Tax 9.6 3.9%
State Total 314.0 -0.4%Local Government
Local Share of Occupancy Taxes 5.7 3.9%Property Taxes 142.0 -1.4%
Local Total 147.7 -1.2%
Total 859.8 -0.6%Source: Global Insight* TSA includes all overnight visitors and those traveling over 50 miles, non-commuting

Copyright © 2007 Global Insight, Inc. 29
Gross State Product: $3.20 billion 7.8% of GSP
Total Employment***: 70,079 jobs 14.2% of Employment
Gross State Product: $2.26 billion
5.5% of GSP
Total Employment: 47,854 jobs
9.7% of Employment
Core GSP: $1.71 billion 4.1% of GSP
Core Employment: 38,965 jobs7.9% of Employment
4th largest private sector employer
How Important?
Total Tourism-related
spending of $5.38 billion
Source: Global Insight* TSA includes all overnight visitors and those traveling over 50 miles, non-commuting** Core Tourism includes the economic contribution from industries directly providing goods and services to the visitor. *** Employment figures taken from a top down review of the total spending, creating a resultant number of jobs required to support that spending. These employment figures should not be confused with RI DLT Leisure & Hospitality Employment data.
Copyright © 2007 Global Insight, Inc. 30
2006 Rhode Island TourismRegional Analysis

Copyright © 2007 Global Insight, Inc. 31
Regional Distribution of Tourism
Blackstone Valley• Burrillville• Central Falls• Cumberland• Glocester• Lincoln• North Smithfield• Pawtucket• Smithfield• Woonsocket
Providence • Providence
Warwick • Warwick
Block Island• Block Island
Balance of State• Cranston• Foster• Johnston• North Providence• Scituate• West Warwick
Rhode Island is divided into eight regions in the analysis: Newport County
• Little Compton• Middletown• Newport• Portsmouth• Tiverton• Jamestown
South County • Charlestown• Coventry• East Greenwich• Exeter• Hopkinton• Narragansett• North Kingstown• Richmond• South Kingstown• Westerly• West Greenwich
East Bay• Barrington• Bristol• East Providence• Warren
Copyright © 2007 Global Insight, Inc. 32
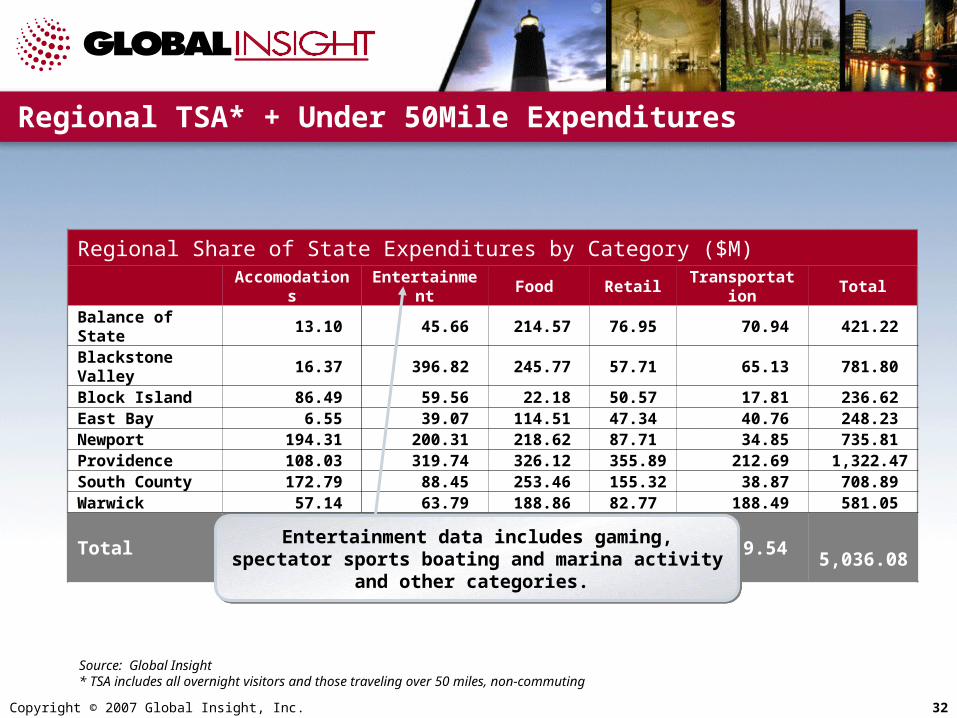
Regional TSA* + Under 50Mile Expenditures
Regional Share of State Expenditures by Category ($M)Accomodations Entertainment Food Retail Transportation Total
Balance of State 13.10 45.66 214.57 76.95 70.94 421.22 Blackstone Valley
16.37 396.82 245.77 57.71 65.13 781.80
Block Island 86.49 59.56 22.18 50.57 17.81 236.62 East Bay 6.55 39.07 114.51 47.34 40.76 248.23 Newport 194.31 200.31 218.62 87.71 34.85 735.81 Providence 108.03 319.74 326.12 355.89 212.69 1,322.47 South County 172.79 88.45 253.46 155.32 38.87 708.89 Warwick 57.14 63.79 188.86 82.77 188.49 581.05
Total 654.78 1,213.41 1,584.08 914.26 669.54 5,036.08
Entertainment data includes gaming, spectator sports boating and marina activity and other categories.
Entertainment data includes gaming, spectator sports boating and marina activity and other categories.
Source: Global Insight* TSA includes all overnight visitors and those traveling over 50 miles, non-commuting
Copyright © 2007 Global Insight, Inc. 33
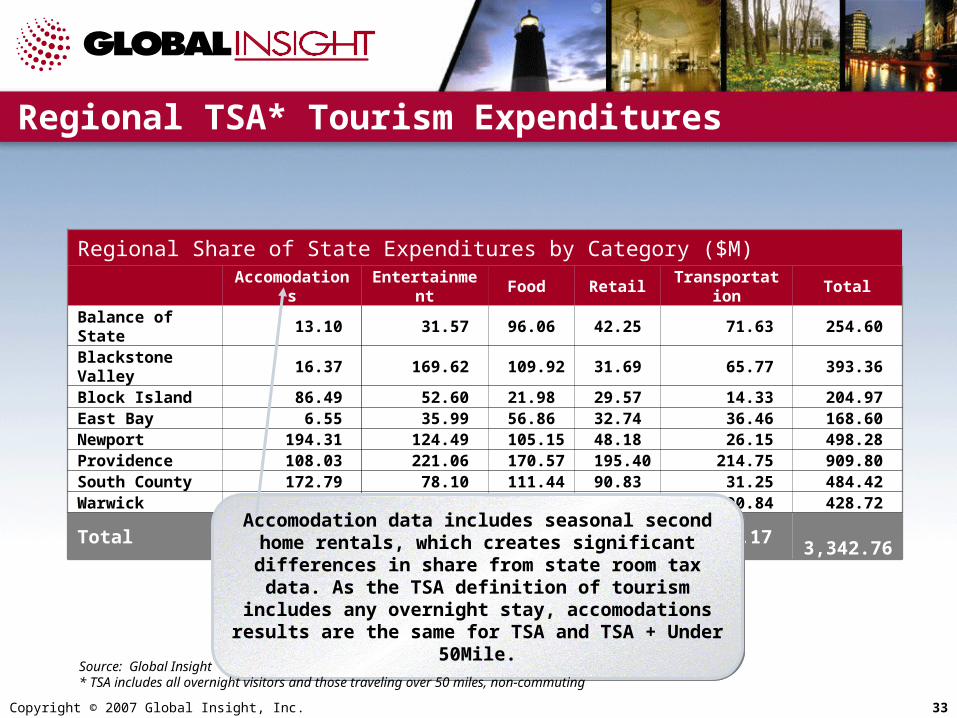
Regional TSA* Tourism Expenditures
Regional Share of State Expenditures by Category ($M)Accomodations Entertainment Food Retail Transportation Total
Balance of State 13.10 31.57 96.06 42.25 71.63 254.60 Blackstone Valley
16.37 169.62 109.92 31.69 65.77 393.36
Block Island 86.49 52.60 21.98 29.57 14.33 204.97 East Bay 6.55 35.99 56.86 32.74 36.46 168.60 Newport 194.31 124.49 105.15 48.18 26.15 498.28 Providence 108.03 221.06 170.57 195.40 214.75 909.80 South County 172.79 78.10 111.44 90.83 31.25 484.42 Warwick 57.14 37.14 86.14 57.46 190.84 428.72
Total 654.78 750.57 758.12 528.12 651.17 3,342.76
Accomodation data includes seasonal second home rentals, which creates significant differences in share
from state room tax data. As the TSA definition of tourism includes any overnight stay, accomodations
results are the same for TSA and TSA + Under 50Mile.
Accomodation data includes seasonal second home rentals, which creates significant differences in share
from state room tax data. As the TSA definition of tourism includes any overnight stay, accomodations
results are the same for TSA and TSA + Under 50Mile.
Source: Global Insight* TSA includes all overnight visitors and those traveling over 50 miles, non-commuting
Copyright © 2007 Global Insight, Inc. 34
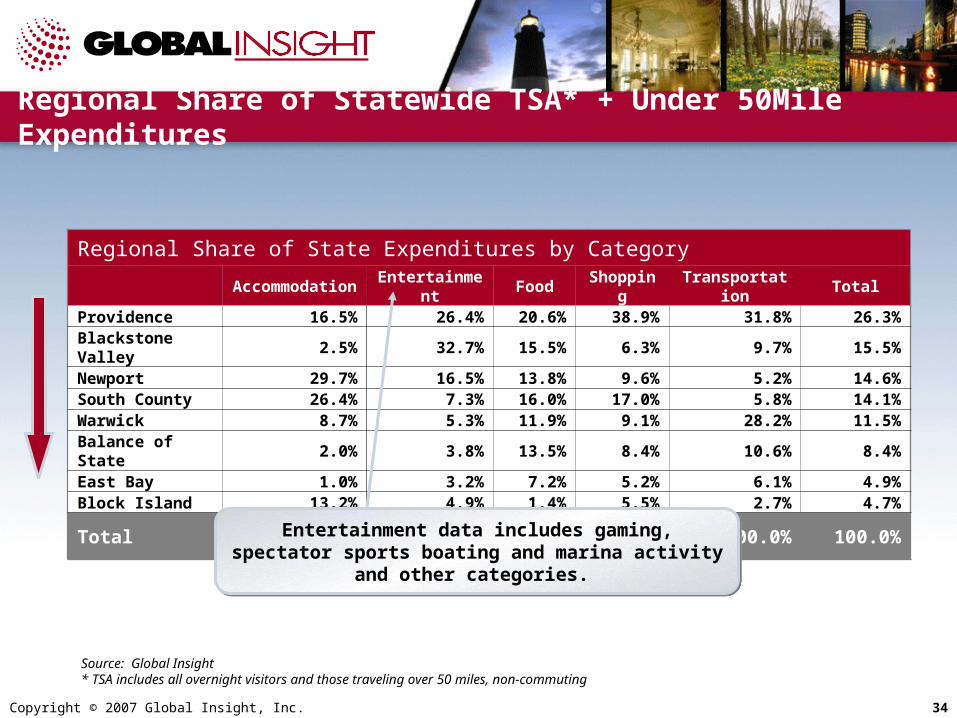
Regional Share of Statewide TSA* + Under 50Mile Expenditures
Regional Share of State Expenditures by CategoryAccommodation Entertainment Food Shopping Transportation Total
Providence 16.5% 26.4% 20.6% 38.9% 31.8% 26.3%Blackstone Valley
2.5% 32.7% 15.5% 6.3% 9.7% 15.5%
Newport 29.7% 16.5% 13.8% 9.6% 5.2% 14.6%South County 26.4% 7.3% 16.0% 17.0% 5.8% 14.1%Warwick 8.7% 5.3% 11.9% 9.1% 28.2% 11.5%Balance of State 2.0% 3.8% 13.5% 8.4% 10.6% 8.4%East Bay 1.0% 3.2% 7.2% 5.2% 6.1% 4.9%Block Island 13.2% 4.9% 1.4% 5.5% 2.7% 4.7%
Total 100.0% 100.0% 100.0% 100.0% 100.0% 100.0%
Entertainment data includes gaming, spectator sports boating and marina activity and other categories.
Entertainment data includes gaming, spectator sports boating and marina activity and other categories.
Source: Global Insight* TSA includes all overnight visitors and those traveling over 50 miles, non-commuting
Copyright © 2007 Global Insight, Inc. 35
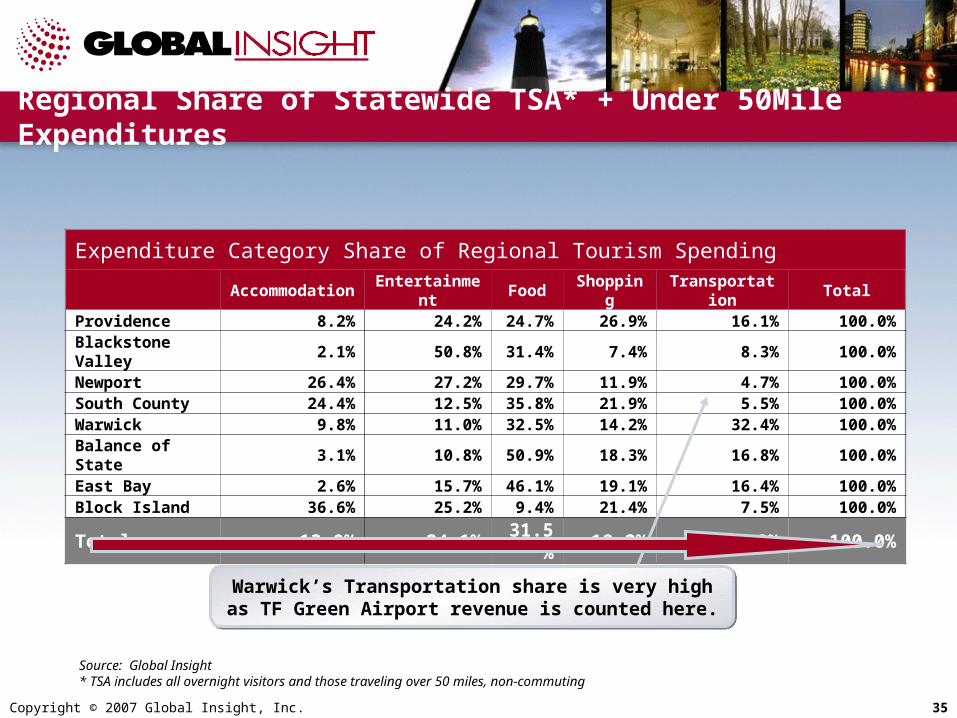
Expenditure Category Share of Regional Tourism SpendingAccommodation Entertainment Food Shopping Transportation Total
Providence 8.2% 24.2% 24.7% 26.9% 16.1% 100.0%Blackstone Valley
2.1% 50.8% 31.4% 7.4% 8.3% 100.0%
Newport 26.4% 27.2% 29.7% 11.9% 4.7% 100.0%South County 24.4% 12.5% 35.8% 21.9% 5.5% 100.0%Warwick 9.8% 11.0% 32.5% 14.2% 32.4% 100.0%Balance of State 3.1% 10.8% 50.9% 18.3% 16.8% 100.0%East Bay 2.6% 15.7% 46.1% 19.1% 16.4% 100.0%Block Island 36.6% 25.2% 9.4% 21.4% 7.5% 100.0%
Total 13.0% 24.1% 31.5% 18.2% 13.3% 100.0%
Regional Share of Statewide TSA* + Under 50Mile Expenditures
Warwick’s Transportation share is very high as TF Green Airport revenue is counted here.
Warwick’s Transportation share is very high as TF Green Airport revenue is counted here.
Source: Global Insight* TSA includes all overnight visitors and those traveling over 50 miles, non-commuting
Copyright © 2007 Global Insight, Inc. 36
Regional Share of Statewide TSA* Tourism
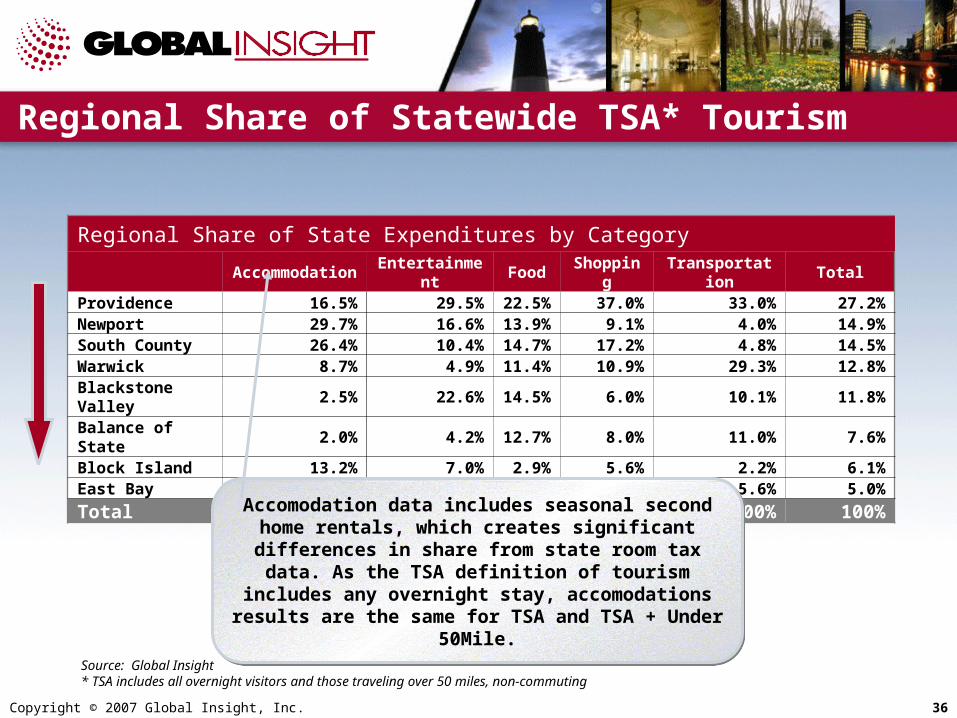
Regional Share of State Expenditures by CategoryAccommodation Entertainment Food Shopping Transportation Total
Providence 16.5% 29.5% 22.5% 37.0% 33.0% 27.2%Newport 29.7% 16.6% 13.9% 9.1% 4.0% 14.9%South County 26.4% 10.4% 14.7% 17.2% 4.8% 14.5%Warwick 8.7% 4.9% 11.4% 10.9% 29.3% 12.8%Blackstone Valley
2.5% 22.6% 14.5% 6.0% 10.1% 11.8%
Balance of State 2.0% 4.2% 12.7% 8.0% 11.0% 7.6%Block Island 13.2% 7.0% 2.9% 5.6% 2.2% 6.1%East Bay 1.0% 4.8% 7.5% 6.2% 5.6% 5.0%
Total 100% 100% 100% 100% 100% 100%
Accomodation data includes seasonal second home rentals, which creates significant differences in share
from state room tax data. As the TSA definition of tourism includes any overnight stay, accomodations
results are the same for TSA and TSA + Under 50Mile.
Accomodation data includes seasonal second home rentals, which creates significant differences in share
from state room tax data. As the TSA definition of tourism includes any overnight stay, accomodations
results are the same for TSA and TSA + Under 50Mile.
Source: Global Insight* TSA includes all overnight visitors and those traveling over 50 miles, non-commuting

Copyright © 2007 Global Insight, Inc. 37
Regional Share of Statewide TSA* Tourism
Expenditure Category Share of Regional Tourism SpendingAccommodation Entertainment Food Shopping Transportation Total
Providence 11.9% 24.3% 18.7% 21.5% 23.6% 100.0%Newport 39.0% 25.0% 21.1% 9.7% 5.2% 100.0%South County 35.7% 16.1% 23.0% 18.8% 6.5% 100.0%Warwick 13.3% 8.7% 20.1% 13.4% 44.5% 100.0%Blackstone Valley
4.2% 43.1% 27.9% 8.1% 16.7% 100.0%
Balance of State 5.1% 12.4% 37.7% 16.6% 28.1% 100.0%Block Island 42.2% 25.7% 10.7% 14.4% 7.0% 100.0%East Bay 3.9% 21.3% 33.7% 19.4% 21.6% 100.0%
Total 19.6% 22.5% 22.7% 15.8% 19.5% 100.0%
Warwick’s Transportation share is very high as TF Green Airport revenue is counted here.
Warwick’s Transportation share is very high as TF Green Airport revenue is counted here.
Source: Global Insight* TSA includes all overnight visitors and those traveling over 50 miles, non-commuting

Copyright © 2007 Global Insight, Inc. 38
TSA* + Under 50Mile Growth Rates by Region for 2006
Regional Growth Rates by Category 2006 vs 2005Accomodation Entertainment Food Retail Transportation Grand Total
Balance of State 7.9% 7.4% 12.9% -0.9% 5.8% 8.2%Blackstone Valley
0.7% 2.3% 4.6% -5.7% 0.7% 2.2%
Block Island 7.7% 3.4% 0.1% -4.6% 1.8% 2.6%East Bay 3.9% 1.8% 0.5% -6.1% 0.3% -0.5%Newport 1.8% 0.9% 2.3% -4.6% 3.4% 1.0%Providence 0.8% 1.5% 2.9% -6.4% 0.0% -0.7%South County 0.9% 1.1% 2.0% -6.7% -0.4% -0.5%Warwick 0.3% 0.8% 2.1% -7.0% -0.7% -0.5%
Grand Total 2.1% 1.9% 3.8% -5.7% 0.7% 0.9%
Retail is only sector where all regions saw a drop in 2006. Food saw the strongest and most evenly
distributed category growth.
Retail is only sector where all regions saw a drop in 2006. Food saw the strongest and most evenly
distributed category growth.
Source: Global Insight* TSA includes all overnight visitors and those traveling over 50 miles, non-commuting
Copyright © 2007 Global Insight, Inc. 40
Regional Share of Statewide TSA* + Under 50Mile Visitation and Trips
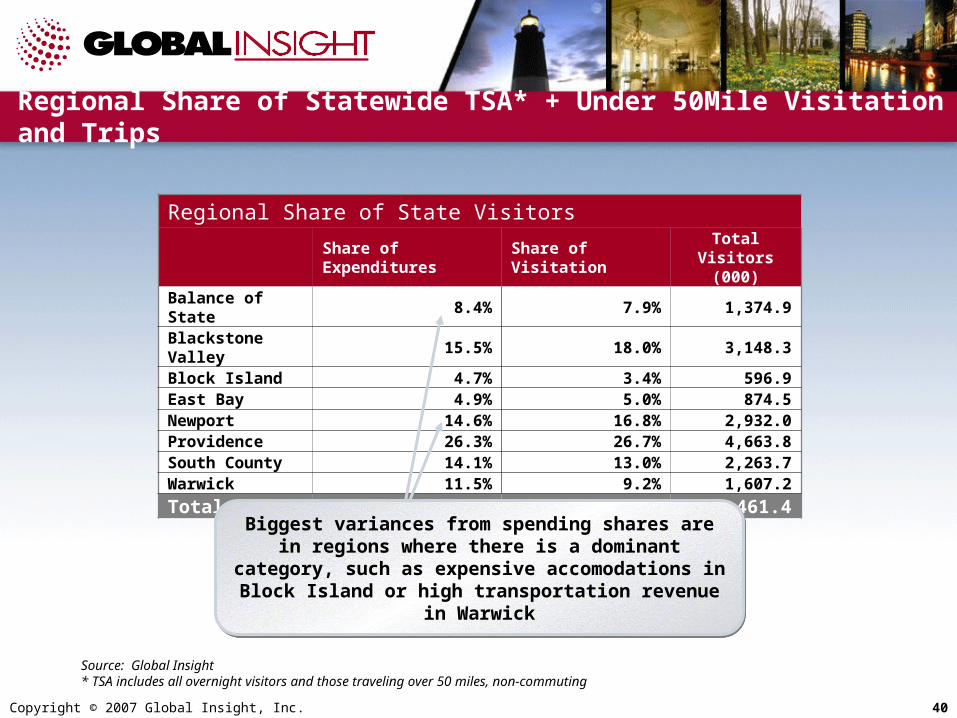
Regional Share of State Visitors
Share of Expenditures Share of VisitationTotal Visitors
(000)Balance of State 8.4% 7.9% 1,374.9Blackstone Valley
15.5% 18.0% 3,148.3
Block Island 4.7% 3.4% 596.9East Bay 4.9% 5.0% 874.5Newport 14.6% 16.8% 2,932.0Providence 26.3% 26.7% 4,663.8South County 14.1% 13.0% 2,263.7Warwick 11.5% 9.2% 1,607.2
Total 100.0% 100.0% 17,461.4
Biggest variances from spending shares are in regions where there is a dominant category, such as expensive accomodations in Block Island or high transportation
revenue in Warwick
Biggest variances from spending shares are in regions where there is a dominant category, such as expensive accomodations in Block Island or high transportation
revenue in Warwick
Source: Global Insight* TSA includes all overnight visitors and those traveling over 50 miles, non-commuting
Copyright © 2007 Global Insight, Inc. 41
Regional Share of Statewide TSA* Tourism Visitation
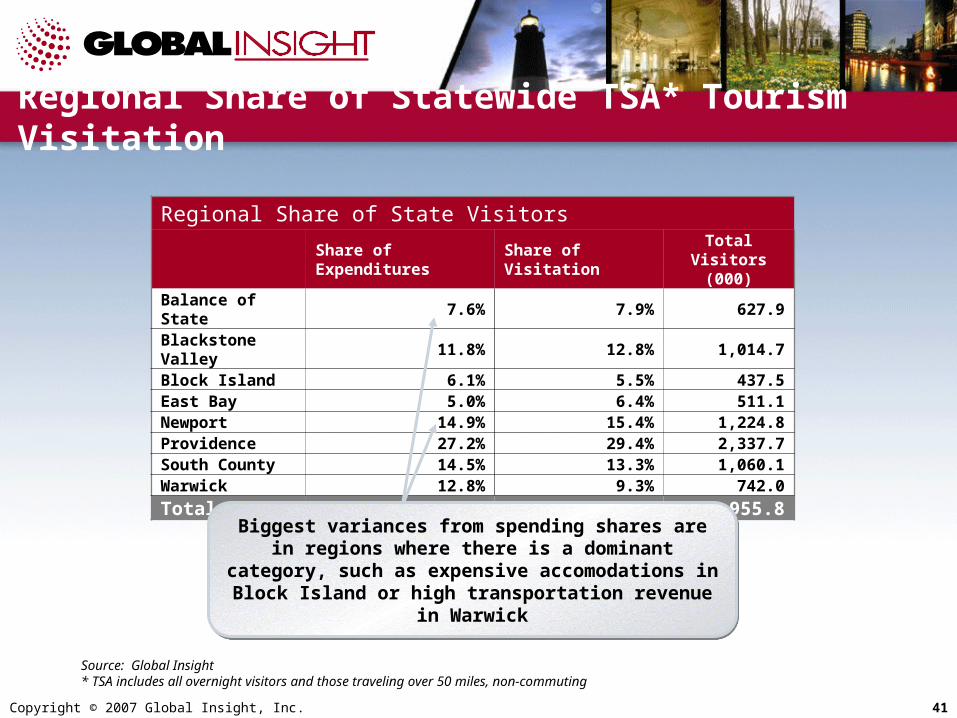
Regional Share of State Visitors
Share of Expenditures Share of VisitationTotal Visitors
(000)Balance of State 7.6% 7.9% 627.9Blackstone Valley
11.8% 12.8% 1,014.7
Block Island 6.1% 5.5% 437.5East Bay 5.0% 6.4% 511.1Newport 14.9% 15.4% 1,224.8Providence 27.2% 29.4% 2,337.7South County 14.5% 13.3% 1,060.1Warwick 12.8% 9.3% 742.0
Total 100.0% 100.0% 7,955.8
Biggest variances from spending shares are in regions where there is a dominant category, such as expensive accomodations in Block Island or high transportation
revenue in Warwick
Biggest variances from spending shares are in regions where there is a dominant category, such as expensive accomodations in Block Island or high transportation
revenue in Warwick
Source: Global Insight* TSA includes all overnight visitors and those traveling over 50 miles, non-commuting
Copyright © 2007 Global Insight, Inc. 42
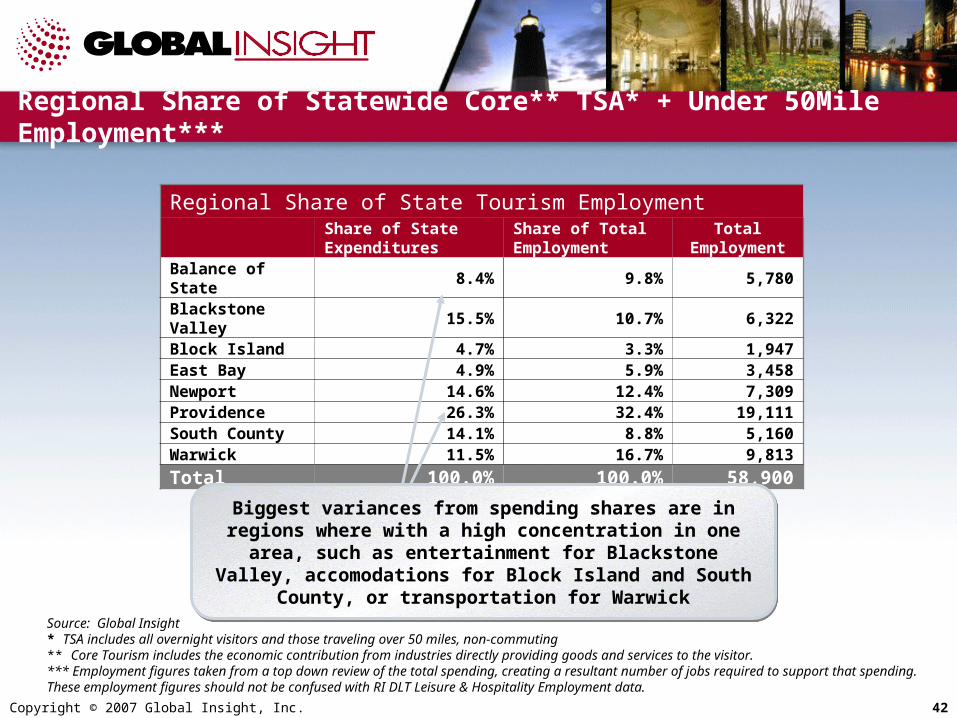
Regional Share of Statewide Core** TSA* + Under 50Mile Employment***
Regional Share of State Tourism EmploymentShare of State Expenditures
Share of Total Employment
Total Employment
Balance of State 8.4% 9.8% 5,780Blackstone Valley
15.5% 10.7% 6,322
Block Island 4.7% 3.3% 1,947East Bay 4.9% 5.9% 3,458Newport 14.6% 12.4% 7,309Providence 26.3% 32.4% 19,111South County 14.1% 8.8% 5,160Warwick 11.5% 16.7% 9,813
Total 100.0% 100.0% 58,900
Biggest variances from spending shares are in regions where with a high concentration in one area, such as entertainment for Blackstone Valley, accomodations for Block Island and
South County, or transportation for Warwick
Biggest variances from spending shares are in regions where with a high concentration in one area, such as entertainment for Blackstone Valley, accomodations for Block Island and
South County, or transportation for Warwick
Source: Global Insight* TSA includes all overnight visitors and those traveling over 50 miles, non-commuting** Core Tourism includes the economic contribution from industries directly providing goods and services to the visitor. *** Employment figures taken from a top down review of the total spending, creating a resultant number of jobs required to support that spending. These employment figures should not be confused with RI DLT Leisure & Hospitality Employment data.

Copyright © 2007 Global Insight, Inc. 45
Talking Points: What Does the Entire Industry* Mean to RI?
Each RI visitor/trip generates about $308 in Each RI visitor/trip generates about $308 in
expenditures, $34 of which goes to RI businesses that do expenditures, $34 of which goes to RI businesses that do
not directly “touch” that visitornot directly “touch” that visitor
Every 249 visitors and trips creates a new RI jobEvery 249 visitors and trips creates a new RI job
Each visitor and trip creates about $76 in tax receipts, Each visitor and trip creates about $76 in tax receipts,
$43 of which goes to state & local authorities$43 of which goes to state & local authorities
It takes only 360 visitors and trips to pay for one Rhode It takes only 360 visitors and trips to pay for one Rhode
Island public school student for one yearIsland public school student for one year
Each RI visitor and trip generates $117 in wages paid to Each RI visitor and trip generates $117 in wages paid to
RI workers employed across an array of industriesRI workers employed across an array of industries
Each visitor/trip adds $184 to RI Gross State ProductEach visitor/trip adds $184 to RI Gross State ProductSource: Global Insight* Based on TSA definition of visitor, which includes all overnight visitors and those traveling over 50 miles, non-commuting, and under 50 mile visitors