Embed Size (px)
Citation preview

Work ing PaPer Ser i e Sno 910 / J une 2008
HoW HaS CDo market PriCing CHangeD During tHe turmoil?
eviDenCe from CDS inDex tranCHeS
by Martin Scheicher

Working PaPer Ser ie Sno 910 / J Une 2008
In 2008 all ECB publications
feature a motif taken from the
10 banknote.
HoW HaS CDo market PriCing CHangeD DUring tHe tUrmoil?
eviDenCe from CDS inDex tranCHeS 1
by Martin Scheicher 2
This paper can be downloaded without charge from http://www.ecb.europa.eu or from the Social Science Research Network
electronic library at http://ssrn.com/abstract_id=1147094.
Tel: +49 69 1344 8337; Fax: +49 69 1344 7949; e-mail: [email protected] Financial Research Division, European Central Bank, Kaiserstrasse 29, 60311 Frankfurt am Main, Germany;
Ingo Fender for helpful comments. The opinions in this paper do not necessarily reflect those of the ECB of the Eurosystem. I This paper has been presented at the ECB and Deutsche Bundesbank. I would like to thank seminar participants, Geert Bekaert and

© European Central Bank, 2008
Address Kaiserstrasse 29 60311 Frankfurt am Main, Germany
Postal address Postfach 16 03 19 60066 Frankfurt am Main, Germany
Telephone +49 69 1344 0
Website http://www.ecb.europa.eu
Fax +49 69 1344 6000
All rights reserved.
Any reproduction, publication and reprint in the form of a different publication, whether printed or produced electronically, in whole or in part, is permitted only with the explicit written authorisation of the ECB or the author(s).
The views expressed in this paper do not necessarily reflect those of the European Central Bank.
The statement of purpose for the ECB Working Paper Series is available from the ECB website, http://www.ecb.europa.eu/pub/scientific/wps/date/html/index.en.html
ISSN 1561-0810 (print) ISSN 1725-2806 (online)
3ECB
Working Paper Series No 910June 2008
Abstract 4
Non-technical summary 5
Introduction 7
I. The market for CDS index tranches 9A. The mechanics of CDS index tranches 9B. A simple pricing model 11C. The time series of tranche
premia since 2004 13D. Descriptive statistics of changes
in log premia 16
II. Empirical Results 16A. Regression methodology 16B. Overall results 19C. The impact of the subprime turmoil 21D. Further results and robustness tests 24
III. Conclusion 25
References 26
Tables and figures 28
European Central Bank Working Paper Series 43
ContentS

4ECB
Working Paper Series No 910
June 2008
This paper applies regression analysis to investigate the fundamental factors of the variation
of CDS index tranches. The sample comprises daily data on the tranche premia of the
European iTraxx and North American CDX index from the start of the market in summer 2004
to January 2008. I estimate the relationship between tranche premia and market-based
measures of credit risk, liquidity risk and interest rate risk. In this context, I analyse how the
set of explanatory factors has changed since the start of the credit market turmoil in 2007.
Overall, I find that pricing of CDX and iTraxx tranches differs although the specifications of the
two contracts are very similar. Since July 2007, tranche investors appear to have repriced
CDX contracts to a larger extent than iTraxx contracts. Credit risk and liquidity factors are
JEL classification: E43, G12, G13, G 14; Keywords: Credit Spread; Credit derivative; Collateralised Debt Obligation; Correlation;
Abstract
priced in almost all tranches with liquidity risk playing a larger role since the start of the turmoil.

5ECB
Working Paper Series No 910
June 2008
Non-technical summary
The development of a market for credit risk transfer represents a major structural innovation
in the financial system. This market offers a wide range of instruments to deal with different
aspects of credit risk. Besides providing default protection for individual firms through credit
default swaps (CDS), the credit risk in entire credit portfolios can be traded by means of
collateralised debt obligations (CDOs).
Essentially, a CDO represents a set of claims of varying exposure to the cash flows from a
portfolio of credit instruments. These new claims or ‘tranches’ range from ‘equity tranches’
with high risk exposure to ‘senior tranches’, where expected losses are much smaller.
Investor interest in CDOs grew rapidly because in these instruments, the degree of credit risk
exposure, the desired degree of leverage, the maturity, and the cash flow structure can all be
tailored to meet an investor’s preferences.
A major step in the development of the CDO market was the introduction of the iTraxx credit
index in summer 2004. The launch of this commonly accepted benchmark has created an
active market for standardised iTraxx tranches in Europe and CDX tranches in North America.
Hence, firm-specific credit risk can be traded through credit default swaps, and the correlation
of credit risk within the underlying credit portfolio can be traded through credit index tranches.
As tranche prices depend on credit correlation, this segment of the credit market is also
known as the “correlation market”.
Even before the subprime turmoil which started in summer 2007 market participants faced
sizable challenges in the valuation of their CDO positions. In particular, two issues made the
CDO valuation more complex than the pricing of many other financial instruments. First, for
most CDOs there is no active trading. Typically, an investment bank sells the tranches in
private transactions to an insurance firm, hedge fund or pension fund. As these transactions
represent “tailor-made’ instruments, investors usually hold these securities in their books until
maturity, making secondary trading quite illiquid. Second, the theoretical valuation of CDOs is
particularly complex as it requires accurate and up-to-date estimation of the comovement of
defaults among the entities in the credit portfolio backing the CDO. However, estimation of the
credit risk correlations poses significant challenges both from a data perspective as well as
from a modelling perspective. For example, the pricing of a typical CDO based on 100
corporate loans would require estimation of the default comovement of 100 firms.
The general repricing of credit risk since summer 2007 has rekindled doubts concerning the
validity of the currently available CDO pricing models. Many market participants found out that
they could not correctly price or measure the risks in these instruments. Due to the
weaknesses of mark-to-market and mark-to-model valuations many investors had overly
relied on rating agencies for their risk assessment. However as the drawbacks of the rating
agency models became widely known, investors lost confidence in CDO valuations in general.

6ECB
Working Paper Series No 910
June 2008
Eventually, investors’ attempts to reduce their CDO exposures brought market activity to an
almost complete standstill.
My paper aims to help understand the functioning of the CDO market. For this purpose, I
analyse the determinants of the movement in CDS index tranche premia. The weaknesses in
existing theoretical models provide a strong motivation for my exploratory approach. My data-
driven methodology does not rely on the functional form of a specific pricing model but rather
tests the explanatory power of variables which should in theory explain price variation. A
second motivation for my approach is that trading in CDS index tranches is quite active. This
implies that prices should contain relevant information about how credit traders price
standardised CDOs.
I relate a variety of financial market variables to the first differences of log tranche premia and
test how the turmoil in credit markets has affected the explanatory value of the determinants
of tranche premia. I include proxies for overall portfolio credit risk, credit risk correlation, the
yield curve, risk aversion and measures of market liquidity. Furthermore, I conduct a variety of
robustness tests and I also examine the economic significance of my results.
My sample comprises daily data on the tranche premia of the iTraxx (European) and CDX
(North American) index. The sample period is from summer 2004 to January 2008. I study all
six index tranches based on the iTraxx and CDX Main index. My empirical analysis covers
instruments ranging from the riskiest equity tranche (covering 0% to 3% of the joint loss
distribution of the index credit portfolio) to the least risky super senior tranche (ranging up to
100% of the joint loss distribution of the index credit portfolio).
One of my main findings is that declining risk appetite and heightened concerns about market
liquidity, both of which have characterised investor behaviour since summer 2007, have
provided a sizable contribution to the observed strong increase in tranche premia. Overall, the
results imply that even in the most liquid segment of the CDO market, market prices still
contain a sizable liquidity premium. I also find differences in the pricing of CDX and iTraxx
tranches although the design of both contracts is almost identical. Since July 2007, tranche
investors appear to have repriced CDX contracts more substantially than iTraxx contracts.

7ECB
Working Paper Series No 910
June 2008
Introduction
The market turmoil which started in summer 2007 in the US subprime segment has raised
concerns among market participants and policymakers about the valuation of collateralised
debt obligations (CDOs). A market wide reassessment of risk led to sharp increases in credit
spreads across all segments of the credit market. The rapidly falling market values of credit
investors started a “flight to safety”. The best illustration of the intensity of the subprime
turmoil is the fact that it led to the collapse of Bear Stearns, a major US investment bank, in
March 2008.
A CDO is an instrument which enables investors to trade slices of the credit risk in a credit
portfolio. Specifically, a CDO consists of claims (‘tranches’) with varying exposures to the
cash-flows from an underlying portfolio of credit instruments such as bonds, loans or credit
default swaps (CDS). CDOs are a relatively recent financial innovation as they have only
been actively used for less than ten years. However, in this short time span, the CDO market
has grown strongly, rapidly becoming a major segment of the fixed income market. In 2006
global issuance of US dollar- and euro-denominated cash and synthetic CDOs was US$ 994
billion (BIS, 2007).
Overall, the CDO market consists of an actively traded segment and an illiquid “buy and hold”
segment. In the actively traded CDO segment, the underlying credit portfolio is based on the
standardised portfolio of a CDS index such as the iTraxx (European) or CDX (North
American) index. These index-based CDOs, also known as CDS index tranches, can be seen
as the “tip of the iceberg” of the CDO market segment and they provide the sample for this
paper. Compared to many other credit instruments, trading in CDS index tranches is quite
active: In 2006, trading in CDS index tranches amounted to U$ 1,736 billion (BIS, 2007).
For a large fraction of CDOs there is no active trading and valuation needs to rely on model
estimates rather than market prices. This second segment of the CDO market consists of
tailor-made instruments and it has been the source of sizable losses for many market
participants. These “bespoke” securities are frequently sold in private transactions where an
institutional investor (e.g. an insurer) can choose the underlying credit portfolio or the
structure of cash-flows. The specific features in these transactions limit the development of an
active secondary market and investors have to hold these securities until maturity. When
banks sell these non-standard CDOs in the primary market they rely on the market prices of
the CDS index tranches for the pricing of the bespoke instruments.
Currently there is no reliable model to arrive at commonly accepted CDO valuations which
creates major valuation uncertainties for CDO investors. Duffie (2007, p.4) argues that “even
specialists in collateralized debt obligations are currently ill equipped to measure the risks and
For discussions of the subprime turmoil see Ashcraft and Schuermann (2008), Borio (2008) or Brunnermeier (2008). Huddart and Picone (2007) describe how banks use CDS index tranche data to price synthetic CDOs.
1
1
2
2
instruments reduced both the capital as well as the profitability of the banking system and

8ECB
Working Paper Series No 910
June 2008
fair valuation of tranches that are sensitive to default correlation”. A key challenge in CDO
valuation is the accurate estimation of the comovement of defaults, which poses significant
challenges both from a data perspective as well as from a modelling perspective. Due to the
weaknesses of mark-to-market and mark-to-model valuations many investors overly relied on
rating agencies for their risk assessment. However as the drawbacks of the rating agency
models became widely known, investors lost confidence in CDO valuations in general.
Eventually, investors’ attempts to reduce their CDO exposures brought market activity to an
almost complete standstill.
In this paper, I use a regression-based approach to investigate the determinants of the
changes in the market prices of CDS indexes tranches. The explanatory variables in my
regression analysis are measures of credit risk, liquidity risk, risk aversion and interest rate
risk. In the literature on understanding credit spreads the regression-based approach has
been introduced by Collin-Dufresne et al. (2001). This approach has the advantage that it can
make use of a comprehensive set of potential explanatory factors such as liquidity factors or
proxies for risk aversion. Furthermore it is not constrained by the specification of a particular
theoretical model.
My comprehensive analysis is designed to provide general insights into the market pricing of
index tranches. The sample comprises daily data on the tranche premia of the iTraxx and
CDX index from the start of trading in summer 2004 to January 2008. The iTraxx and CDX
tranches are structured almost identically with the main difference being the composition and
credit quality of the underlying credit portfolio. Specifically, I analyse the six iTraxx and CDX
Main index tranches which range from the riskiest equity tranche (covering 0% to 3% of the
joint loss distribution) to the least risky super senior tranche (ranging up to 100% of the joint
loss distribution).
I relate a number of financial market variables to the first differences of log tranche premia. I
include proxies for overall portfolio credit risk, credit risk correlation, the yield curve and
measures of market liquidity. Here, I also test the explanatory value of a proxy for risk
aversion for tranche premia. Furthermore, I focus on how the turmoil in credit markets has
affected the weight of the determinants of tranche premia. The weaknesses in existing
theoretical models provide an additional motivation for my exploratory approach, which is not
based on the functional form of a specific pricing model but rather tests the explanatory power
of variables which should in theory explain price variation.
My approach complements the small number of empirical papers on CDS index tranches. The
papers available so far focus on the performance of CDO valuation models for pricing US
CDX tranches and in almost all cases their sample periods do not capture the repricing since
summer 2007. Longstaff and Rajan (2008) find that a three-factor portfolio credit model
explains virtually all of the time-series and crosssectional variation in CDX tranche premia.
Bhansali et al. (2008) use a more simplified specification of the same model to study the
turmoil period. They find that the subprime turmoil has more than twice the systemic risk of

9ECB
Working Paper Series No 910
June 2008
the May 2005 downgrade of GM and Ford. Tarashev and Zhu (2007) document a large
correlation risk premium in CDX tranche prices. Coval et al. (2007) apply fundamental asset
pricing theory to price CDX tranches. Feldhuetter (2007) implements intensity-based models,
finding that pricing performance differs across CDX tranches. Eckner (2007) decomposes the
risks priced in CDX tranches. A similar exercise is conducted by Azizpour and Giesecke
(2008).
My main finding is that there are significant differences in the determinants of the market
prices of CDX tranches and the iTraxx tranches. Proxies for credit risk and for market liquidity
are priced in almost all iTraxx and CDX tranches. Despite the same structure of the
instruments, tranche investors however appear to use different pricing methods for CDX and
iTraxx tranches, in particular since July 2007. Furthermore, although there are a number of
significant relations between tranche premia and explanatory variables, the premia also still
contain a strong common unobservable component.
As regards the impact of the turmoil, I find that declining risk appetite and heightened
concerns about market liquidity, both of which have characterised investor behaviour since
summer 2007, have provided a sizable contribution to the observed strong increase in
tranche premia. Furthermore, tranche investors have revised their valuation of the CDX
contracts more substantially than their pricing of iTraxx contracts. One potential explanation
for this difference is the heterogeneous development of the credit market turmoil, which
started in US financial markets and which has affected the US growth outlook more than
growth forecasts for the euro area. In this context, a caveat is that at the time of writing, the
period of repricing had not yet come to an end.
The rest of this paper is organised as follows. In section I, I discuss the mechanism of CDS
index tranches and the sample. Section II describes the results of the empirical analysis.
Section III concludes the paper by summarising the main results.
I. The Market for CDS Index Tranches
A. The Mechanics of CDS Index Tranches
CDS are the most commonly traded credit derivatives and function like a traded insurance
contract against the losses arising to its creditors from a firm’s default. They transfer the risk
that a certain individual entity defaults from the “protection buyer” to the “protection seller” in
exchange for the payment of a premium. Should the reference entity default the buyer
commonly receives the difference between the notional amount of the loan and its recovery
value from the protection seller. In a CDS transaction, the premium paid by the protection
buyer to the protection seller is expressed as an annualised percentage of the transaction’s
notional value and it provides the market quote for the CDS (usually in basis points).
In June 2004, a harmonised global family of CDS indices was launched, namely iTraxx in
Europe and Asia and CDX in North America. The launch of this credit index family has
provided a commonly accepted benchmark for credit markets. The indices represent the CDS

10ECB
Working Paper Series No 910
June 2008
premium on an equally weighted basket of the currently most actively traded firms. All indices
are updated on a daily frequency. Based on a semi-annual poll of the main CDS dealers, the
index composition is revised twice a year to reflect changes in liquidity and credit quality.
The iTraxx and CDX Main indices are designed to represent the investment grade segment of
the US$ and euro credit markets. The indices contain energy firms, industrial entities,
consumer cyclical and non-cyclical firms, insurance companies, banks, telecoms as well as
automobile firms. The CDS premium on the Main index represents the price of credit
protection on the entire pool of firms, i.e. a portfolio credit default swap covering all 125 firms
in the index.
Index CDS essentially trade like CDS on a single firm. In case of a firm’s default, the
defaulted firm is removed from the index portfolio and the nominal value of the contract
declines by 1/125, i.e. 0.8 %. According to market information, trading activity is concentrated
in the 5 year maturity and therefore this horizon is the focus of the following analysis. In
addition, my analysis focuses on the ‘on-the- run’ series, which is rolled over every half year
to the new index composition according to the current poll’s ranking of firms’ CDS.
Given the iTraxx / CDX index composition, the corresponding CDO structure comprises
instruments with varying degrees of exposure to the joint loss distribution of the 125 firms.
These tranches hence provide claims to the cash flows of the iTraxx CDS portfolio and in
parallel serve as protection for a certain range of defaults in the portfolio. The equity tranche
serves as the first level of protection against any defaults among the firms in the index and is
therefore also called the ‘first loss piece’. The following levels of default protection are
provided by mezzanine and by senior tranches, where investors’ exposure to default risk in
the portfolio is smaller than in the equity tranche.
Specifically, the six iTraxx Main index tranches are equity (range from 0% to 3% of the joint
loss distribution), Low Mezzanine (3% - 6%), Mid Mezzanine (6% - 9%), High Mezzanine (9%
- 12%), senior (12% - 22%) and super senior (22% to 100 %). CDX tranches have slightly
different attachment points, namely 0% to 3%, 3% to 7%, 7% to 10%, 10% to 15%, 15% to
30% and 30% to 100 %.
Collectively, the six tranches represent the entire capital structure of the CDS index portfolio
and can be interpreted as options on the joint loss distribution. In total, the six tranches cover
all the possible losses arising from defaults in the CDS index portfolio. In parallel, all cash
flows from the CDS index portfolio are paid out, starting from the senior tranches and ending
For a more detailed description, see Calamaro et al. (2004). In practice, there is a small difference between the portfolio CDS and the average across the 125 firms’ CDS. This
difference is known as the ‘basis’ and is caused by contractual differences and supply/demand effects. In the market terminology, the investor in a certain tranche, i.e. the buyer of credit portfolio risk, is selling protection
Due to the dependence of tranche prices on credit correlations, the CDS index tranche segment is also known as the ‘correlation market’. Hence, firm-specific credit risk is traded through CDS and the correlation of credit risk within the underlying credit portfolio is traded through CDS index tranches.
3
4
5
6
3
to her counterparty.
4
5
6

11ECB
Working Paper Series No 910
June 2008
with the equity tranche. Tranche trading takes place in the over-the-counter market among
banks and brokers. Because the instruments are constructed as synthetic single-tranche
CDOs investors can buy or sell all tranches individually.
In case of a credit event such as a default, the procedure is as follows. After the first firm in
the index has defaulted, the buyer of the equity tranche, i.e. the seller of protection has to pay
compensation to the buyer of equity protection. After six defaults , the equity tranche records
a total loss and hence its 3 % upper limit becomes effective. Consequently, the protection
against any additional defaults until the maturity of the instrument is now provided by the
holder of the First Mezzanine tranche, which in the iTraxx case covers the 3% to 6% segment
of the joint loss distribution. In the absence of defaults during the five year period until
maturity, the tranche investor receives the premia for the entire period and no insurance
payments are necessary.
Tranche premia are very sensitive to the default correlation between the firms in the portfolio
because this correlation directly influences the distribution of risk in the capital structure. In
particular, tranche premia depend on the joint loss distribution of the underlying portfolio and
given all other parameters the default correlation determines the shape of this distribution. As
default correlation changes, the corresponding movement in the shape of the joint loss
distribution is directly transmitted to the relative allocation of portfolio credit risk between
equity, mezzanine and senior tranches. In the next section, I provide a brief overview of a
simple pricing model which formalises the links between credit risk correlation and tranche
premia. The discussion of this model also helps to motivate the selection of explanatory
factors in my regression analysis.
B. A Simple Pricing Model
Valuation of CDS index tranches frequently relies on the asymptotic single factor model of
credit risk. The single-factor credit portfolio model represents a parsimonious extension of
the univariate Merton (1974) model to a multivariate context. In this approach, firm i’s asset
return at time t is denoted by Xit and it is given by:
itittitit FX 1 (1)
where
it is the correlation of firm i’s asset value with F at time t ( it > 0)
Ft is the systematic risk factor (~ N(0, ))
it is the idiosyncratic component (~ N(0, 1) and independent of Ft).
This calculation proceeds as follows: Assuming a loss given default of 40 % (which is the market convention), six defaults each of which has an exposure of 1/125 % lead to a total loss of 2.88%. This value is therefore just below the equity tranche’s upper attachment point of 3%. For a more detailed discussion of CDO valuation see Duffie and Garleanu (2001) or Gibson (2004).
7
8
9
7
8
9 For a more detailed discussion see Andersen and Sidenius (2006).

12ECB
Working Paper Series No 910
June 2008
In this model, the likelihood of a firm’s default is in part determined by its sensitivity to a single
common factor, denoted here as F. This common factor can be interpreted as a proxy for the
state of the business cycle. Hence this approach assumes that firms can default due to
deterioration in the systematic factor or due to idiosyncratic, i.e. firm-specific shocks. The
correlation of a firm’s asset value with the systematic factor determines the weight of the
systematic and idiosyncratic components. This asset value correlation is commonly
interpreted as the correlation of firms’ credit risk, i.e. the credit risk correlation. In the simplest
specification, the correlation is constant across firms, which implies that all firms have the
same sensitivity to the common risk factor.
The relationship between correlations and individual tranches works as follows. A rise in the
credit correlation represents a scenario of increasing systematic and therefore decreasing
firm-specific risk in the credit portfolio. Thus, it can be interpreted as increasing risk of a
general down-turn in the economy rather than the default of a particular firm or a sector. In
this scenario, probability mass moves from the centre to the tails of the joint loss distribution
of the portfolio of the iTraxx and CDX index respectively. These fatter tails of the loss
distribution imply that the likelihood of the realisation of few as well as many credit events
increases. Under this scenario, the change in the overall shape of the joint loss distribution
leads to a decline in the equity premium, because the equity tranche investor is not required
to make a payment in the absence of credit events. This mechanism explains why market
participants equal buying an equity tranche to a long position in credit correlation: Rising
correlation lowers the equity tranche premium and therefore raises the mark-to-market value
of the investor’s position. As regards the mezzanine segment of the CDO capital structure,
there is generally no unambiguous effect of the correlation on tranche premia.
Estimation of the implied correlation from tranche premia essentially requires specifying a
portfolio credit risk model. Based on this model’s specification of the joint loss distribution, the
individual tranches can then be priced. For estimating the implied correlation, the reverse
approach is used: In an iterative procedure, correlation is adjusted until the calculated
premium from the model equals the market quote for the specific tranche.
Among traders of CDS index tranches there is a modelling convention similar to options
to link implied volatilities to option price quotes. Given that all other input parameters are
already known, equity index options can be traded through the ‘metric’ of implied volatilities.
Analogously, CDS index tranches are traded through the ‘metric’ of the implied credit
correlation. To extract this parameter from tranche prices, market participants use a one-
factor portfolio credit risk model, namely the Gaussian copula model. By means of this
procedure, market participants’ forecasts of average pair-wise credit correlation can be
This result follows from the general characteristics of the joint loss distribution and does not depend on the market environment.
markets, where the Black - Scholes – Merton model has become the standard methodology
10
10
13ECB
Working Paper Series No 910
June 2008
‘implied’ from the tranche premia (see Isla and Willemann, 2007 for more details on this
methodology).
In sum, the main components of a CDO pricing model are a specification of the firm-level
default process, the default comovement and assumptions about the dynamics of the risk-free
rate. In addition, a specification for risk premia (see e.g. the CDO pricing model proposed by
Eckner, 2007) and a proxy for market liquidity risk might be needed to capture supply /
demand imbalances.
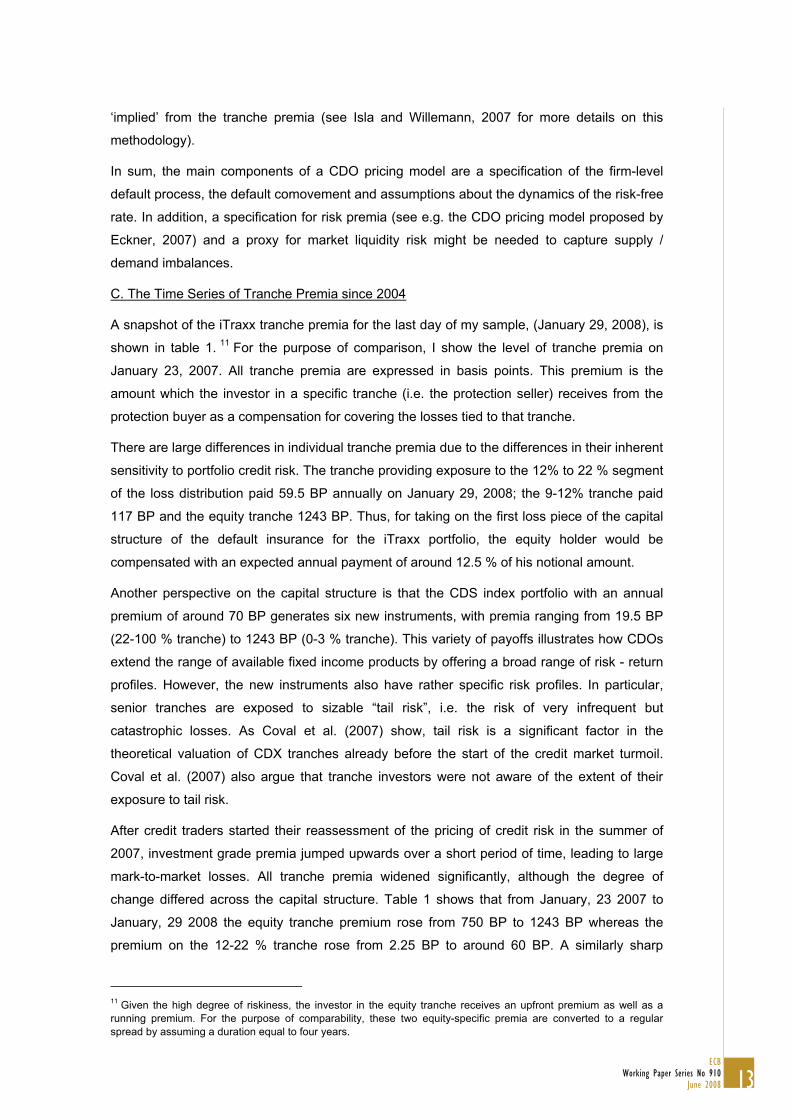
C. The Time Series of Tranche Premia since 2004
A snapshot of the iTraxx tranche premia for the last day of my sample, (January 29, 2008), is
shown in table 1. For the purpose of comparison, I show the level of tranche premia on
January 23, 2007. All tranche premia are expressed in basis points. This premium is the
amount which the investor in a specific tranche (i.e. the protection seller) receives from the
protection buyer as a compensation for covering the losses tied to that tranche.
There are large differences in individual tranche premia due to the differences in their inherent
sensitivity to portfolio credit risk. The tranche providing exposure to the 12% to 22 % segment
of the loss distribution paid 59.5 BP annually on January 29, 2008; the 9-12% tranche paid
117 BP and the equity tranche 1243 BP. Thus, for taking on the first loss piece of the capital
structure of the default insurance for the iTraxx portfolio, the equity holder would be
compensated with an expected annual payment of around 12.5 % of his notional amount.
Another perspective on the capital structure is that the CDS index portfolio with an annual
premium of around 70 BP generates six new instruments, with premia ranging from 19.5 BP
(22-100 % tranche) to 1243 BP (0-3 % tranche). This variety of payoffs illustrates how CDOs
extend the range of available fixed income products by offering a broad range of risk - return
profiles. However, the new instruments also have rather specific risk profiles. In particular,
senior tranches are exposed to sizable “tail risk”, i.e. the risk of very infrequent but
catastrophic losses. As Coval et al. (2007) show, tail risk is a significant factor in the
theoretical valuation of CDX tranches already before the start of the credit market turmoil.
Coval et al. (2007) also argue that tranche investors were not aware of the extent of their
exposure to tail risk.
After credit traders started their reassessment of the pricing of credit risk in the summer of
2007, investment grade premia jumped upwards over a short period of time, leading to large
mark-to-market losses. All tranche premia widened significantly, although the degree of
change differed across the capital structure. Table 1 shows that from January, 23 2007 to
January, 29 2008 the equity tranche premium rose from 750 BP to 1243 BP whereas the
premium on the 12-22 % tranche rose from 2.25 BP to around 60 BP. A similarly sharp
Given the high degree of riskiness, the investor in the equity tranche receives an upfront premium as well as a running premium. For the purpose of comparability, these two equity-specific premia are converted to a regular spread by assuming a duration equal to four years.
11
11

14ECB
Working Paper Series No 910
June 2008
increase is also observed for the 22-100 % tranche where the premium increased from
around 1 BP to around 20 BP. This latter case shows the intensity of the repricing of the
super-senior tranches which were perceived to be almost free of default risk before August
2007. Furthermore, the premium of 1 BP for the 22-100% tranche also explains the popularity
of ”Leveraged Super Senior” trading strategies where high expected returns were not
generated by investing in risky assets but rather by taking a supposedly low-risk tranche and
leveraging it up to obtain higher returns.
All in all, the movements in tranche premia imply that tranche investors became seriously
concerned about losses hitting even the higher components of the capital structure of the
iTraxx index tranches. Hence the pattern of price changes in the less risky parts of the CDO
capital structure over the last year can be interpreted as a reassessment of the weight of
large, low-probability loss events. A similar finding is obtained by Bhansali et al (2008) in a
three-factor credit portfolio model for CDS index tranches.
Graph 1 shows the development of the iTraxx and CDX index and the associated tranches
with a maturity of five years since summer 2004. Table 2 shows some descriptive statistics for
levels of the premia for the tranches. As the data for the CDX 30-100 % tranche only start in
February 2005, this series has a much lower number of observations than the other
tranches.
In the sample period, the average CDS index premium equals 36 basis points for the iTraxx
and 51 BP for the CDX. Thus, it costs around EUR 36.000 annually to obtain insurance for a
portfolio of EUR 10 million of European investment grade corporate debt. The majority of
firms in the iTraxx or CDX index have a credit rating between A and BBB. Because average
credit quality is situated in the lower investment grade range the level of the CDS premium on
the index portfolio is therefore similar to the CDS premium of an individual firm which is rated
between A to BBB.
For both indices, the lowest premia were observed in May 2006 (with around 25 basis points
for the iTraxx) and the highest during the turbulence which started in summer 2007 (with 82
basis points for the iTraxx in January 2008). A first peak in premia is observed for May 2005,
when S & P’s downgrade of Ford and General Motors from BBB to BB led to substantial
turbulences in the credit market. In particular, CDS premia experienced a sharp but temporary
rise. This market turmoil which represented the first period of stress since the use of credit
derivatives became widespread had an adverse impact on the functioning of the credit
derivatives market, reportedly causing large losses among some hedge funds.
Overall, a decline in premia until to spring 2007 can be observed. One of the main factors
behind the decline in premia was a benign macroeconomic environment, combined with low
equity market volatility and strong demand for higher yielding assets. This “hunt for yield” had
started in the aftermath of the collapse of the overvaluation in new-economy stocks (see
The data source for the index and the tranche premia is JP Morgan Securities. 12
12

15ECB
Working Paper Series No 910
June 2008
chapter VI in BIS (2004) for a discussion). The search for higher yielding assets manifested
itself in many asset classes. In the credit market, this demand pressure together with the low
equity market volatility and low number of actual defaults contributed to a sharp decline in
credit spreads, which is clearly visible in the majority of series plotted in graph 1. For instance,
in summer 2004, the premium for the iTraxx 6-9% tranche was around 60 basis points,
whereas in summer 2006 it was below 20 basis points.
Turning to the May 2005 episode, the rapid increase in premia is particularly distinct for the
two equity tranches. The background to this episode is that many credit investors traded
equity vs. mezzanine tranches by buying protection on the former and selling it on the latter.
The sudden decline in the correlation forced traders to rebalance their relative-value positions.
This renewed pressure then may have prolonged the turbulence.
The turbulence in summer 2007 which dominates the last part of the time series plots was
caused by strongly rising delinquencies in US sub-prime mortgage markets. Market
participants then became increasingly concerned about the valuation of all portfolio credit risk
transfer instruments, even those without subprime assets in the portfolio. Mark-to-market as
well as mark-to-model valuations and also the risk assessments of rating agencies were all
called into question, leading to a collapse in primary credit markets. The corresponding
general repricing of credit risk manifested itself in rising credit spreads in many segments of
the credit market.
During this episode of market volatility, investors with exposure to the investment grade
segment also experienced heavy mark to market losses as premia jumped upwards in a short
period of time. For instance, the iTraxx 5-year index rose from 26 BP at the beginning of July
to 58 BP in the middle of August. Tranche premia also widened, although the degree of
change differed across the capital structure. For example from July 2 2007 to August 8 2007,
the equity tranche premium rose by 52 % whereas the premium on the 12 – 22% tranche
increased by around 150 %. This movement implies that investors became seriously
concerned about losses hitting also the higher components of the capital structure of the
iTraxx index tranches.
As graph 1 illustrates, the market turmoil which started in July 2007 proceeded in several
phases. The first phase in summer 2007 was characterised by a sharp upward move in CDS
premia as the fall in the prices of subprime assets spilled over into other segments of the
credit markets. After this first correction, a second phase saw declining risk aversion and
correspondingly some small declines in credit spreads. For instance, at the end of September
2007, the iTraxx index had moved below 40 BP after having reached a level of 65 BP at the
end of July. Finally, more negative news from monoline insurers as well as from a number of
major banks launched another round of strong repricing which started in December 2007 and
According to Longstaff and Rajan (2008), overall market pricing of the CDX tranches is efficient in the sense that estimates for the unobserved firm-specific, industry-wide and economy-wide, i.e. systematic credit risk factors together account for a large fraction of tranche premia. The study also finds that even during the market turbulence in May 2005, there was no significant deterioration in market pricing.
13
13

16ECB
Working Paper Series No 910
June 2008
continued right until the end of my sample on January, 29 2008. In this third phase, the iTraxx
index reached a sample period high of 82 BP on January 23, 2008.
A comparison of the European and North American tranche datasets shows that the
US$ premia mostly exceed the euro premia. As regards the index levels, the average CDX
premium is 51 BP whereas for the iTraxx index it is only 36.9 BP. This difference in the index
levels carries over into differences between the tranche premia. Except for the most senior
tranche, the CDX tranche premia exceed those of iTraxx tranches with comparable
attachment points. For example, the average equity premium amounts to 1400 BP for the
CDX portfolio whereas in the case of the iTraxx it is only around 1000 BP. In both markets,
May 2005, August 2007 and January 2008 provided clear peaks in the premia. Furthermore,
the decline in premia from 2005 to spring 2007 occurred in both regions.
D. Descriptive Statistics of Changes in log Premia
Given that no study has provided a comparison of the statistical properties of the two sets of
tranche premia, table 3 shows descriptive statistics of the log changes.
Median changes are zero, indicating some “stickiness” in market prices of the tranches as
well as the index. Standard deviations vary across tranches without clear patterns. Despite its
high degree of riskiness the premium for the equity tranche is less volatile than the premia of
the tranches with higher subordination in the capital structure. For example, in the case of the
iTraxx data set, the changes of the log 22 – 100 % tranche premium show a standard
deviation of 0.09 whereas the standard deviation of the equity tranche is only 0.03.
I confirm the validity of a stylised fact for the time series of asset prices . This stylised fact is
the non-normality of the unconditional distribution of returns. The tests for ten third and fourth
moments of the unconditional distribution indicate significant asymmetry and leptokurtosis.
Hence, I observe a clear departure from normality. The distribution is skewed to the right for
all series except the CDX 30-100 % tranche. Therefore, the sample period contains more
positive than negative daily changes. The kurtosis in the iTraxx index exceeds the values
estimated for the CDX index. Therefore, the mass in the tails of the euro index premium is
bigger than in the US premium.
II. Empirical Results
A. Regression Methodology
The starting point for the selection of market-based factors is provided by the CDO pricing
model which I outlined earlier. I include factors which serve as inputs in pricing models,
namely proxies for credit risk and for the movement of the risk-free rate. In addition, I include
some factors, which previous research has found to be significant determinants of credit
spreads.
Andreou et al. (2001) provide a detailed survey on the statistical properties of financial time series. See e.g. Boss and Scheicher (2002), Campbell and Taksler (2003), Ericsson et al. (2005) or Zhang et al. (2005).
14
14
15
15

17ECB
Working Paper Series No 910
June 2008
The CDS index premium
The level of the CDS index determines the expected loss and hence the central tendency of
the joint loss distribution. Therefore, I include the changes of the log of the iTraxx and CDX
index time series.
The credit risk correlation
The credit risk correlation determines the shape of the joint loss distribution of the CDS index
portfolio. As discussed earlier, tranche premia are very sensitive to the credit correlation
between the firms in the portfolio because this correlation directly influences the distribution of
risk across the tranches.
I use the implied base correlation of the equity tranche to measure credit risk correlation. This
measure is the simplest estimate of the homogeneous asset value correlation in the index
portfolio. Furthermore, as outlined above, the implied correlation is also the market standard
for expressing default comovement in CDO portfolios (see e.g. Isla and Willemann 2007). To
avoid potential endogeneity problems, I use the lagged change of the log correlation.
The risk-free rate
Changes in the risk free rate in general are negatively related to credit spreads and I assume
that the same linkage also holds for tranche premia. The theoretical explanation within the
Merton (1974) framework proceeds as follows: First, a rising risk-free rate decreases the
present value of the expected future cash flows, i.e. the price of the put option decreases.
Second, a rising risk-free rate tends to raise the expected growth rate of the firm value and
hence a higher firm value becomes more likely. In turn, this implies a lower price of the put
option on the firm value. Hence both effects decrease the costs of insurance against default,
which implies a lower credit spread.
For both markets, I use the five-year swap rate because interest rate swaps are commonly
seen as the market participants’ preferred measure of the risk-free rate (cf. Longstaff et al.,
2005).
The slope of the term structure
In the Longstaff and Schwarz (1995) structural credit risk model with stochastic interest rates,
a rising slope of the term structure lowers credit spreads. In this model, in the long run, the
short rate converges to the long rate. Hence an increasing slope of the term structure should
lead to an increase in the expected future spot rate. This in turn, will decrease credit spreads
through its effect on the drift of the asset value process. I assume that a similar effect may
hold for tranche premia and I define the slope of the term structure as the difference between
the ten-year and the one-year euro and US$ swap rates.
Risk aversion

18ECB
Working Paper Series No 910
June 2008
As Eckner (2007) shows, tranche premia not only compensate tranche investors for pure
expected loss but also for jump risk. Hence, tranche premia may change due to changes in
investors’ risk aversion even if the underlying fundamentals (i.e. the pricing under the
“statistical measure”) are unchanged.
For both the US and Europe I use the JP Morgan G-10 Risk aversion index. This index
aggregates implied volatilities and measures for flight to quality into a single measure of the
market participants’ risk appetite. Coudert and Gex (2008) discuss various measures of risk
aversion and show that these indicators are good leading indicators of sharp declines in stock
prices.
Swap spread
As a proxy for the liquidity risk premium in financial markets I use the swap spread, i.e. the
yield differential between a ten-year interest rate swap and a US / German government bond
with similar maturity. The swap spread contains information about the liquidity risk premium,
because it is affected by the funding operations of banks in the inter-bank market (cf. Huang
and Neftci, 2003). Furthermore, Johannes and Sundaresan (2007) show that collateralized
interest rate swaps, which have been increasingly used in the last few years are free of
counterparty default risk.
Bid–ask spread
Tang and Yan (2006) show that the bid–ask spread is significantly positively related to CDS
premia. Hence to measure the effects of market liquidity on CDS index tranches I include the
average bid-ask spread across all six tranches. This variable should reflect common patterns
in the market liquidity of the tranches rather than liquidity shocks affecting only a single
tranche.
Yen exchange rate
In recent years, many market participants used a trading strategy where they borrowed in a
low-interest rate currency and invested the proceeds from the loan in higher-yielding assets
(cf. Gagnon and Chaboud, 2007). In many of these “carry trades” a short position in the yen
was used to finance positions in currencies with high interest rates. Thus, movements in the
Yen exchange rate may affect tranche premia through their effects on the cost of financing.
For the euro area, I use the Yen-Euro rate and the Yen-US$ for the US.
Graph 2 plots the time series of the levels of the explanatory variables for the iTraxx tranches.
All factors show a sharp change from summer 2007 onward. Base correlation went from .2 in
2004 to .4 at the end of the sample, illustrating the market perception of rising systematic as
opposed to idiosyncratic risk. Furthermore, a sharp upward movement in the bid-ask spread
started in summer 2007, indicating potential liquidity problems in the tranche market.
Comparing the May 2005 episode with the subprime-related turmoil, the graph illustrates a

19ECB
Working Paper Series No 910
June 2008
temporary increase for the bid-ask spread whereas the swap spread then showed a weaker
reaction.
Table 4 summarises the eight explanatory variables and the corresponding signs that I expect
for the respective estimates of the parameters. The effects of the factors are evaluated by
means of a standard regression approach using the change in the log tranche premia as the
dependent variable.
My baseline specification is therefore given by
log Yit = C + 0 log Indext + 1 log Correlationt-1 + 2 Swap ratet + 3 Slopet + 4
Risk aversion t + 5 Swap spread 10t + 6 log Bid-Askt + 7 log (Yent) + t (2)
with Yit representing the premium on tranche i (with i = 0-3%, … , 22 - 100% for iTraxx and 0-
3%, … , 30% - 100% for CDX) at time t.
Given the specification above, I use OLS as an estimation method. Heterogeneity across
tranches and the dimensions of the data set (six time series with around 1000 observations
each) makes a panel approach less advantageous than OLS. Furthermore, the simple
valuation model outlined earlier implies that the effect of the correlation proxy should vary in
the crossection because individual tranches have different sensitivities to changes in the
correlation. In addition, it is conceivable that the proxy for risk aversion may have different
effects depending on how risky a specific tranche is.
Due to the fact that the errors are most likely quite highly correlated across tranches,
Seemingly Unrelated Regression (SUR) is a plausible alternative specification. However,
applying SUR to the equation system specified above is identical to using OLS on each
equation. The reason for this identity between the two estimators is that in the case of
identical right hand side variables (which is valid here), SUR and OLS produce identical
estimators. All regressions are estimated with Newey-West standard errors to account for
the heteroscedasticity in changes of log tranche premia.
B. Overall results
In order to analyse the fit of the above model for my sample, I estimate the baseline
regression as given in equation (2) for the entire sample period. Table 5 shows the
multivariate regressions together with the adjusted R². From the multivariate regression
analysis, several results are notable.
First, the underlying CDS index has a significant impact (at 10%) on the variation of all
tranche premia except the CDX 30 - 100% tranche. As hypothesised in table 4, the change in
the index CDS premium enters the equations with a positive coefficient. Therefore, a rise in
this proxy for the expected loss in the underlying CDS portfolio raises the tranche premia. In
the iTraxx sample, the coefficient on the index change clearly increases with the
16
For a proof see Greene 1993, p. 488.16

20ECB
Working Paper Series No 910
June 2008
subordination. Furthermore, the significance of the effect differs between the US and the EU
data set: The t-statistics of the coefficients on the CDS index change of the iTraxx tranches
exceed those estimated for the CDX tranches.
Second, the proxy for the credit risk correlation is significant only in a minority of tranche
regressions. At the 5% level there is a significant relation for the 30-100% CDX tranche and
for the 0-3 % iTraxx tranche. The sign of the coefficient is negative for the first five CDX
tranches and all iTraxx tranches. Hence, the relation between CDX tranche premia indeed
depends on the subordination of the respective tranche whereas this is not the case for the
iTraxx tranches.
Third, the five-year swap rate (with the exception of the CDX 7-10% tranche), the slope of the
swap curve and the yen exchange rate do not have significant effects on tranche premia.
Fourth, the risk aversion proxy has strong positive effects for all CDX tranches but not for the
iTraxx tranches, where there is only a weak impact on the pricing of the equity tranche (with a
t-statistic of only 1.32).
Fifth, there are significant liquidity effects in tranche premia at the 10% significance level. The
coefficient on the average bid-ask spread is significant for all except the iTraxx 6-9% and the
CDX 30-100 % tranches. The swap spread has significantly positive effects for the iTraxx
tranches and the CDX 7 -10 % tranche.
Sixth, the R² values of the iTraxx data set all exceed those of the CDX dataset. The difference
between the two data sets is particularly large for the higher tranches such as the two most
senior tranches, where the R² for the iTraxx amounts to 0.21 and to 0.04 for the CDX. A
strong difference is also observed for the iTraxx 12 – 22% with an R² of 0.38 and the CDX 15
– 30% tranche an R² of 0.21. Hence, residual variation in CDX tranche premia is bigger than
in the iTraxx tranches.
Seventh, the variation of the CDX 30-100 % tranche is highly idiosyncratic and differs
substantially from that observed for the other tranches. Furthermore, the CDX super-senior
tranche, which would only be affected by a wave of large-scale corporate defaults among
CDX member firms does not react to the factor set in a manner similar to the iTraxx 22-100%
super-senior tranche. This is also the only CDX tranche where credit risk proxies or liquidity
proxies do not significantly contribute to explaining the time variation of changes in log premia.
Turning to the economic significance of the results, I compare the reaction of the tranche
premia to one-standard-deviation changes in the set of explanatory variables. Graph 3 shows
the impact of a change of one standard deviation of the explanatory factors in terms of the
standard deviation of the dependent variables, i.e. the changes in log tranche premia. For
reasons of space this graph omits the two super - senior tranches in each market.
As can be seen from graph 3, a change of one standard deviation in the CDS index results in
a change of around 50% of a standard deviation of iTraxx tranche premia changes. After the
iTraxx CDS index, the variable with the biggest impact in terms of changes in standard

21ECB
Working Paper Series No 910
June 2008
deviation is the base correlation. This effect grows with increasing subordination with the
exception of the 3-6% and the 9-12% tranches. Finally, the bid-ask spread achieves an
impact of around 15 % of the standard deviation of the two most senior iTraxx tranches.
In contrast to the iTraxx data set, the bid-ask spread achieves the highest effect on the
standard deviation of the tranche premia, ranging up to 45% in the case of the CDX 7-10%
tranche. Taking the effect on the dependent variable as a criterion, the second most important
variable is the risk aversion measure. These results again illustrate the differences in the
pricing of the two contracts. In particular, liquidity and risk aversion plays a larger role in the
CDX than in the iTraxx tranches.
All in all, the simple regression model shows that the iTraxx and the CDX data sets differ with
respect to the determinants of the tranche premia. This difference is strongest for the most
senior tranches. However, the signs of the significant relations in both the iTraxx and CDX
data sets are in accordance with my hypothesis: A rise in the expected loss measure or the
liquidity proxy lead to a positive change in log tranche premia. In the next subsection, I
analyse the effects of the subprime turmoil on the regression results.
C. The impact of the subprime turmoil
Given the sizable impact of the repricing of subprime debt instruments on other segments of
the credit markets, I now study how the determinants of tranche premia have changed after
July 2007. As I noted in section I, tranche premia widened considerably, with the degree of
change differing across the capital structure. The strongest increase - in percentage terms -
was observed for the senior and super-senior tranches. In the framework of the one-factor
model discussed earlier, this crossectional pattern indicates a market perception of rising
systematic and declining firm-specific credit risk.
To analyse the effect of the events starting in summer 2007, I reestimate the specification
defined in equation (2) with a time dummy for each explanatory variable:
log Yit = C + 0 log Indext + 1 log Correlationt-1 + 2 Swap ratet + 3 Slopet
+ 4 Risk aversion t + 5 Swap spread 10t + 6 log Bid-Askt + 7 log (Yent) +
8 2007 log Indext + 9 2007 log Correlationt-1 + 10 2007 Swap ratet +
11 2007 Slopet + 12 2007 Risk aversion t + 13 2007 Swap spread 10t +
14 2007 log Bid-Askt + 15 2007 log (Yent)+ t (3)
with Yit representing the premium on tranche i (with i = 0-3%, … , 22 - 100% for iTraxx and 0-
3%, … , 30% - 100% for CDX) at time t and 2007 representing a dummy variable taking the
value one from July 2, 2007 onwards. This specification allows me to isolate the effects of the
turmoil on the linkage between specific explanatory factors and the changes in the log tranche
premia. The estimation results of this extended specification are shown in table 6. A caveat in
the interpretation of my approach is that the subprime turmoil proceeded in three periods of
first rising, then falling and then rising credit spreads. This heterogeneity in the intensity of the
repricing of credit risk is not captured by the time dummy.

22ECB
Working Paper Series No 910
June 2008
Overall, the extended specification with the interaction dummy has stronger effects on the
CDX tranches than on the iTraxx tranches. For the iTraxx data set, the main impact of the
interaction dummy is to uncover a linkage between swap rate changes and changes in log
tranche premia. In particular, the inclusion of the turmoil interaction dummy leads to a
significantly positive effect of the change in the swap rate on the change in the log premium
for all iTraxx tranches except the most senior tranche. Hence, since July 2007, an increase in
the swap rate has raised iTraxx tranche premia. The swap rate also appears to capture some
liquidity effects as the liquidity proxies become insignificant for the 3-6% and the 6-9% iTraxx
tranches.
For the CDX tranches, the turmoil interaction dummy strengthens the positive impact of the
bid - ask spread. This result suggests that CDX tranches became even more illiquid since
July 2007. In addition there are three significantly negative coefficients on the coefficients
where the underlying index is multiplied with the interaction dummy. Hence, the linkage
between the tranches and the underlying CDX index weakened since July 2007. Another
notable result is the impact of the interaction dummy on the relation between CDX tranche
premia and risk aversion. In particular, for the 0-3 % CDX tranche, the two coefficients on the
risk aversion measure have the same size but opposite signs. Given that the risk aversion
proxy does not show a clear time series trend (see also graph 2), this result could be due to a
potential loss of information in a specification where all variables are in first differences. This
interpretation is supported by the fact that in a regression in levels, tranche premia show a
strong positive reaction to the risk aversion measure.
The regression results also demonstrate that investors in CDX tranches reacted more
strongly to the market turmoil than investors in iTraxx tranches. In particular, a comparison of
the results of the simple model in table 4 to the extended model in table 6 shows that the
explanatory power of my factor set rises after accounting for the onset of the subprime turmoil.
This increase is stronger for the CDX tranches than for the iTraxx tranches. For example, the
CDX 30-100 % tranche now achieves an adjusted- R² of 0.11 compared to only 0.04 for the
specification without time dummies and the R-squared of the extended regressions for the
five lower CDX tranches now exceed 0.4. In the iTraxx data set, the biggest increase is
observed for the 12-22% tranche, where the R² moves by a relatively much smaller amount,
namely from 0.36 to 0.41. These differences in the impact of the turmoil dummy in the iTraxx
and CDX regression estimates also confirm the earlier finding that tranche investors price the
US$ and the euro tranches differently.
I now examine how much of the time variation of tranche premia is explained by changes in
credit risk compared to changes in interest rates, risk aversion or liquidity risk. Specifically, I
define the four categories of explanatory variables as follows: Credit Risk (Index and
correlation), Interest Rate Factors (level and slope), Risk Aversion (JP Morgan index) and
Liquidity Risk (swap spread, bid-ask, Yen). Hence, I analyse which factor categories have the
highest explanatory power for tranche premia. For this purpose, I estimate four regressions of

23ECB
Working Paper Series No 910
June 2008
these four factor categories on the first differences of the log tranche premia. Graph 4 shows
the R²s of the four regressions for the iTraxx and CDX tranches. The two sample periods are
defined as August 2004 to July 2007 (‘before’) and July 2007 to January 2008 (‘after’)
respectively.
For both the iTraxx and CDX tranches, the largest R²s are recorded for the credit risk and the
liquidity group. The graph also confirms the difference between the R² values of the European
and the North American data sets. The credit risk proxies achieve R²s of more than 25% for
all iTraxx tranches whereas for the CDX most values are below 15% (in the case of the CDX
30-100% tranche, credit risk accounts for more than half of the entire explanatory value, but in
absolute terms, the R-squared coefficient is only .03). Furthermore, the contribution of the risk
aversion proxy is bigger in the CDX data set than in the iTraxx data set. In contrast, the three
liquidity proxies achieve similar values in the two sets of tranche premia.
The graph clearly shows the shift in the relative explanatory power among the four categories
since summer 2007. Risk aversion (as captured by the JP Morgan index) and liquidity risk
have increased their weights whereas the role of credit risk has declined in relative terms. For
example, in the case of the 6-9% iTraxx tranche, credit risk accounted for more than 60 %
before the turmoil and for less than 40 % after the start of the turmoil. Simultaneously, the
contribution of risk aversion changed from less than 20% to more than 30 %. This shift is valid
for all tranches of both the CDX and the iTraxx index.
To examine further how the individual explanatory power of risk aversion and liquidity risk has
changed over time, I estimate rolling bivariate correlations based on a moving window of 120
daily observations. This approach also allows me to compare the determinants in the high-
volatility episode of May 2005 to the situation after July 2007. Results for the iTraxx are given
in graph 5 (results for the CDX index are very similar and omitted for reasons of space).
Across all iTraxx tranches, there is a sharp increase in the linkages between risk aversion,
liquidity risk and the tranche premia since summer 2007. In relative terms, the impact of risk
aversion on tranche premia has risen by more than the impact of liquidity risk on tranche
premia. This difference between risk aversion and liquidity risk is observed for all tranches.
Among the five iTraxx tranches, the 12-22% tranche shows the strongest correlation with the
bid-ask spread and the 6-9% tranche has the strongest correlation with the risk aversion
proxy. Furthermore, the impact of market liquidity has seen a slight decline in the last weeks
of the sample period.
Graph 5 also shows that the relationships observed since summer 2007 up to the end of my
sample differ from those observed during the market turmoil in May 2005. In particular, the
role of the risk aversion component now exceeds that observed in 2005.
In sum, these findings imply that declining risk appetite and heightened concerns about
market liquidity, which investors have shown since summer 2007, have provided a sizable
I focus on correlations because in a bivariate regression the R² measure equals the squared correlation coefficient.
17
17

24ECB
Working Paper Series No 910
June 2008
contribution to the observed strong increase in tranche premia. Furthermore, tranche
investors have revised their valuation of the CDX contracts more substantially than their
valuation of the iTraxx contracts.
These finding can be interpreted in the context of the development of the credit market turmoil
and its macroeconomic impact. Given its roots in the US housing market, the turmoil started
in US credit markets before affecting financial markets globally. Its adverse effects so far have
been stronger for the US macroeconomic outlook rather than on the growth in the euro area.
Market participants perceive the likelihood of a recession to be much higher in the US than in
Europe. Therefore, the effects on the pool of CDX firms may be more homogeneous than in
the case of the iTraxx firms. In the latter case, the subprime turmoil has had particularly
strong effects on the pricing of the 25 financial firms , whereas the other 100 firms in the
index are affected to a comparatively smaller extent also due to the still benign macroeconomic environment.19
D. Further Results and Robustness Tests
If the regressions are well-specified, then the residuals should show weak contemporaneous
correlation, because the common factors are already accounted for by the explanatory factors.
Therefore, the residuals are a proxy for the idiosyncratic component, which is not captured by
the set of common explanatory variables. Table 7 compares the first two principal
components of the changes in the log tranche premia (based on their contributions to the
variance decomposition) and the residuals from the regressions shown in table 5.
This analysis shows that the correlations between the residuals are only fractionally smaller
than those between the dependent variables. This pronounced interdependence in the
residuals indicates the presence of a large unobserved common component, which is not
reproduced by the regression approach.
A similar result is documented by Collin-Dufresne et al. (2001) for US corporate bonds. They
show that the residuals from regressions on the spreads of individual bonds are heavily
correlated. Their interpretation is that US corporate bond markets are segmented from stock
and Treasury markets and driven by large supply/demand shocks. This interpretation could
also be applied to CDS index tranches. Given that the market has only been active for four
years, supply – demand imbalances and technical factors, which are not captured by the
liquidity proxies in the equations, may be present. In addition, the market may exhibit
“clientele” effects, i.e. demand may differ across tranches due to investors’ risk appetite.
Similar clientele effects based on heterogeneous investors have also been observed in other
iTraxx series 7 started trading in March 2007 with the following financials: ABN Amro, Aegon, Allianz, Assicurazioni Generali, Aviva, AXA, Banca Monte dei Paschi di Siena, Banca Popolare Italiana, BBVA, BCP, Banco Espirito Santo, BSCH, Barclays, BNP Paribas, Capitalia, Commerzbank, Deutsche Bank, Hannover Rueck, Intesa Sanpaolo, Muenchener Rueck, Royal & Sun Alliance, Swiss Re, RBS, Unicredit, Zurich Insurance. 19 In this context it is also notable that Bear Stearns was not a member of the recent CDX series (i.e. CDX series 7 and 8).
18
18

25ECB
Working Paper Series No 910
June 2008
segments of the credit market, e.g. the commercial paper market (cf. Covitz and Downing,
2007).
I confirm the robustness of my findings by means of three additional tests. First, I include
non-linear effects in the regression by means of squaring the explanatory variables. This has
no major impact on the regression results. One of the few additional significant coefficients in
the CDX estimations is the square and the cube of the change in the log CDX index. As these
variables can be interpreted as measures of index volatility and skewness, the specification
allowing for nonlinear effects indicates that the higher moments of the CDS index distribution
may also affect tranche premia. For the iTraxx tranches, the squared swap spread is
significantly positive in all six equations, indicating that higher spread volatility raises iTraxx
tranche premia. As a second robustness test, I use lagged rather than contemporaneous
independent variables. Again, this modified specification does not change overall results. For
example, the lagged iTraxx index significantly affects tranche premia whereas the same effect
is again weaker in the US dataset. My third robustness test is to replace the JP Morgan index
of risk aversion by the Westpac RAI Index. Again results are unchanged.
III. Conclusion
This paper has analysed the determinants of the daily movement in CDS index tranche
premia. By means of regression analysis I estimated the reaction of the market prices of CDS
index tranches to market-based proxies for credit risk, liquidity risk, risk aversion and interest
rate risk.
My main result is that there are sizable differences in the market pricing of CDX and iTraxx
tranches. In particular, the European tranche premia show a weaker reaction to the onset of
the turmoil than the US tranche premia. Credit risk proxies and liquidity proxies are priced in
all iTraxx and almost all CDX tranches. Furthermore, the explanatory power of my factor set
rises after the onset of the subprime turmoil with the increase being stronger in the CDX
tranches than in the iTraxx tranches. However, although tranche premia are significantly
related to a number of explanatory variables, they still contain a strong common unobservable
component.
The methodology in this paper can be extended in a number of directions. In particular, the
scope of the CDS index can be extended in the dimensions of maturity and credit risk, i.e.
towards longer maturities and towards the High Yield or the Subprime segment. In particular,
the latter index category, which is represented by the iTraxx Crossover, the CDX High Yield
or the ABX subprime index may be an interesting sample as the developments in the
subprime crisis illustrate. As regards the econometric approach, a Generalised Method of
Moments model could be used to capture the crossectional correlation across tranche premia
as well as the heteroscedasticity and non-normality in the time series dimension.
The tables are omitted for reasons of space.
20
20

26ECB
Working Paper Series No 910
June 2008
References L. Andersen and J. Sidenius (2005) CDO pricing with factor models: survey and comments. Journal of Credit Risk 1, 71 – 88.
E. Andreou, N. Pittis and A. Spanos (2001) On Modelling Speculative Prices: The Empirical Literature. Journal of Economic Surveys 15, 187-220.
A. Ashcraft and T. Schuermann (2008) Understanding the securitization of subprime mortgage credit. Federal Reserve Bank of New York Staff Report no. 318.
S. Azizpour and K. Giesecke (2008) Premia for Correlated Default Risk. Working paper, Stanford University.
Bank for International Settlements (2004) 74th Annual report.
Bank for International Settlements (2007) 77th Annual report.
V. Bhansali, R. Gingrich and F. Longstaff (2008) Systemic credit risk: What is the market telling us? Working Paper, UCLA.
C. Borio (2008) The financial turmoil of 2007–?: a preliminary assessment and some policy considerations. BIS Working Paper No 251.
M. Boss and M. Scheicher (2002) The determinants of credit spread changes in the euro area. BIS Papers 12, 181 - 199.
M. Brunnermeier (2008) Deciphering the 2007-08 Liquidity and Credit Crunch. Journal of Economic Perspectives (forthcoming).
J.-P. Calamaro, T. Nassar, K. Thakkar and J. Tierney (2004) Trading Tranched Index Products: The first steps. Deutsche Bank, Global Markets Research, Quantitative Credit Strategy.
J. Campbell and G. Taksler (2003) Equity Volatility and Corporate Bond Yields. Journal of Finance 58, 2321 – 2349.
P. Collin-Dufresne, R. Goldstein and J. S. Martin (2001) The Determinants of Credit Spread Changes. Journal of Finance 56, 2177-2207.
V. Coudert and Mathieu Gex (2008) Does risk aversion drive financial crises? Testing the predictive power of empirical indicators. Journal of Empirical Finance, 15, 167 -184.
J. Coval, J. Jurek and E. Stafford (2007) Economic Catastrophe Bonds. Harvard Business School working paper 07-102
D. Covitz and C. Downing (2007) Liquidity or Credit Risk? The Determinants of Very Short-Term Corporate Yield Spreads. Journal of Finance 62, 2303-2328.
D. Duffie and N. Garleanu (2001) Risk and Valuation of Collateralized Debt Obligations. Financial Analysts Journal 57, 41 – 59.
D. Duffie (2007) Innovations in Credit Risk Transfer: Implications for Financial Stability. Working paper, Stanford University.
A. Eckner (2007) Risk premia in structured credit derivatives. Working paper, Stanford University.
J. Ericsson, K. Jacobs, and R. Oviedo-Helfenberger (2005) The Determinants of Credit Default Swap Premia. Working paper, McGill University.
P. Feldhuetter (2007) An Empirical Investigation of an Intensity-Based Model for Pricing CDO Tranches. Working paper, Copenhagen Business School.
I. Fender, N. Tarashev and H. Zhu (2008) Credit fundamentals, ratings and value-at-risk: CDOs versus corporate exposures. BIS Quarterly Review, March 2008, 87 -101.
J. Gagnon and A. Chaboud (2007) What Can the Data Tell Us about Carry Trades in Japanese Yen? Federal Reserve Board International Finance Discussion Papers 2007-899
M. Gibson (2004) Understanding the risk of synthetic CDOs. Federal Reserve Board Finance and Economics Discussion Series 2004-36.

27ECB
Working Paper Series No 910
June 2008
W. Greene (1993) Econometric Analysis. Prentice Hall, second edition.
Y. Huang and S. Neftci (2003) What Drives Swap Spreads, Credit or Liquidity? ISMA Center Working Papers in Finance 2003(5).
R. Huddart and L. Picone (2007) Synthetic CDOs: Made to measure. Dresdner Kleinwort Debt Research.
L. Isla and S. Willemann (2007) Correlation modelling – from vanilla to exotic. Barclays Capital Structured Credit Strategist.
M. Johannes and S. Sundaresan ( 2007) The Impact of Collateralization on Swap Rates. Journal of Finance 62, 383-410.
F. Longstaff, S. Mithal and E. Neis (2005) Corporate yield spreads: default risk or liquidity? New evidence from the credit default swap market. Journal of Finance 60, 2213 – 2253.
F. Longstaff and A. Rajan (2008) An empirical analysis of the pricing of Collateralized Debt Obligations. Journal of Finance 64, 529 - 563.
F. Longstaff and E. Schwartz (1995) A simple approach to valuing risky, fixed and floating rate debt. Journal of Finance 50, 789-821.
R. Merton (1974) On the Pricing of Corporate Debt: The Risk Structure of Interest Rates. Journal of Finance 29, 449-470.
D. Tang and H. Yan (2007) Liquidity and credit default swap spreads. Working paper, Kennesaw State University and University of South Carolina.
N. Tarashev and H. Zhu (2007) The Pricing of Correlated Default Risk: Evidence from the Credit Derivatives Market. Working paper, Bank for International Settlements.
B. Zhang, H. Zhou and H. Zhu (2005) Explaining Credit Default Swap Spreads with Equity Volatility and Jump Risks of Individual Firms. BIS Working Paper No 181.

28ECB
Working Paper Series No 910
June 2008
Table 1: Tranche premia for iTraxx Europe Main 5Y on January, 29 2008 and January, 23 2007
This table reports the CDS premia for the iTraxx Europe Main five-year investment grade index and the corresponding tranches on the last day of the sample and on 23/1/2007. The rating estimates are taken from Calamero et al. (2004).
Instrument Loss segment % Rating Premium 23/1/2007
Premium29/1/2008
CDS index
0-100 A-BBB 23
70.5
Equity 0-3 NA 750 1243.75 Junior Mezzanine 3-6 BBB 40 294
Mezzanine 6-9 AAA 12 188 Senior 1 9-12 AAA 6 117.5 Senior 2 12-22 AAA 2.25 59.5
Super senior 22-100 AAA 0.95 70.5

29ECB
Working Paper Series No 910
June 2008
Table 2: Descriptive statistics of CDS index and tranche premia
This table reports the descriptive statistics for the levels of the tranche premia and the CDS index. The sample is August 2004 to January 2008. N represents the number of observations.
CDX iTraxx Mean 51.05 36.86
Median 48.00 36.00 Maximum 118.50 82.00 Minimum 28.88 20.13 Std. Dev. 14.16 10.23
N 1064 1063
0-3 % 3-7 % 7-10 % 10-15 % 15-30 % 30-100 % Mean 1407.87 186.68 60.91 27.04 11.11 5.23
Median 1426.56 142.25 42.00 20.25 8.38 3.04 Maximum 2068.75 576.00 271.00 124.00 69.50 34.15 Minimum 928.13 57.75 10.00 4.00 1.75 0.00 Std. Dev. 222.90 109.90 48.38 21.62 9.79 5.57
N 1064 1064 1064 1064 1064 792
0-3% 3-6 % 6-9 % 9-12 % 12-22% 22-100% Mean 1064.96 117.62 44.61 25.25 12.44 4.29
Median 1090.63 92.00 31.00 15.03 9.20 3.00 Maximum 1732.05 420.00 250.00 152.50 79.00 26.00 Minimum 643.75 39.00 10.25 4.50 1.75 0.65 Std. Dev. 187.38 68.72 35.61 22.06 11.09 4.30
N 1063 1063 1063 1063 1063 943

30ECB
Working Paper Series No 910
June 2008
Table 3: Descriptive statistics of first differences of log CDS index and log tranche premia
This table reports the descriptive statistics for the first differences of the log tranche premia and the CDS index. The sample is August 2004 to January 2008.
CDX iTraxx Mean 0.00 0.00
Median 0.00 0.00 Maximum 0.19 0.24 Minimum -0.20 -0.25 Std. Dev. 0.03 0.03 Skewness 0.68 0.52 Kurtosis 12.26 14.36
CDX 0-3 % 3-7 % 7-10 % 10-15 % 15-30 % 30-100 % Mean 0.00 0.00 0.00 0.00 0.00 0.00
Median 0.00 0.00 0.00 0.00 0.00 0.00 Maximum 0.12 0.35 0.46 0.51 0.70 2.47 Minimum -0.11 -0.35 -0.41 -0.41 -0.76 -2.47 Std. Dev. 0.02 0.06 0.07 0.08 0.09 0.21 Skewness 0.40 0.18 0.54 0.38 0.80 -0.22 Kurtosis 8.98 10.35 11.17 10.52 20.68 62.26
iTraxx 0-3% 3-6 % 6-9 % 9-12 % 12-22% 22-100% Mean 0.00 0.00 0.00 0.00 0.00 0.00
Median 0.00 0.00 0.00 0.00 0.00 0.00 Maximum 0.16 0.41 0.59 0.69 0.76 0.71 Minimum -0.15 -0.37 -0.45 -0.45 -0.62 -0.49 Std. Dev. 0.03 0.07 0.08 0.09 0.09 0.10 Skewness 0.64 0.63 0.86 0.97 0.87 0.77 Kurtosis 9.79 11.29 12.08 13.09 16.16 9.65

31ECB
Working Paper Series No 910
June 2008
Table 4: Description of explanatory variables and expected signs for parameter estimates
This table reports the variables used in the regressions where the dependent variable is the change in
the log tranche premium. The data sources are Bloomberg and JP Morgan. The specification is defined
as follows:
log Yit = C + 0 log Indext + 1 log Correlationt-1 + 2 Swap ratet + 3 Slopet + 4
Risk aversion t + 5 Swap spread 10t + 6 log Bid-Askt + 7 log (Yent) + t with Yit
representing the premium on tranche i (with i = 0-3%, … , 22 - 100% for iTraxx and 0-3%, … , 30% -
100% for CDX) at time t.
Notation Definition Sign Credit risk Index Index CDS (CDX / iTraxx ) (+)
Correlation Base correlation of iTraxx / CDX equity tranches (+/-) Interest rate factors Swap rate Euro / US$5 Y swap rate (-)
Slope 10 Y – 1 Y US$ / Euro swap rate (-) Risk aversion Risk aversion JP Morgan risk aversion index (+)
Liquidity proxies Swap spread 10 Y US$ / Euro swap spread (+) Bid-ask Yen – US$ / Euro (+) Yen Bid-ask spread of CDX / iTraxx tranches (+)

32ECB
Working Paper Series No 910
June 2008
Table 5a: Regression results of changes in log CDX tranche premia on all factors This table reports the results from OLS regressions of daily changes in the log CDX tranche premia on
the variables listed in table 4. The adjusted R-square is denoted R² and t-statistics based on Newey-West standard errors are given adjacent to the coefficient estimates. Coefficients marked in
bold are significant at 5 %. The sample is August 2004 to January 2008.
0-3% 3-7 % 7-10 %
Coeff. t-stat Coeff. t-stat Coeff. t-stat
Intercept 0.00 0.44 0.00 0.34 0.00 0.41
Index 0.14 2.84 0.20 1.92 0.20 1.54
Correlation -0.04 -1.11 -0.15 -1.61 -0.15 -1.30
Swap rate -0.13 -1.31 -0.40 -1.61 -0.59 -2.11
Slope 0.01 0.19 -0.04 -0.40 -0.01 -0.15
Risk aversion 0.03 5.34 0.07 5.25 0.08 4.70
Swap spread 0.05 1.08 0.18 1.39 0.31 2.07
Bid-ask 0.05 2.96 0.16 3.05 0.20 3.33
Yen -0.08 -0.55 -0.16 -0.38 -0.05 -0.11
R² 0.28 0.27 0.27
10-15 % 15-30 % 30-100%
Coeff. t-stat Coeff. t-stat Coeff. t-stat
Intercept 0.00 0.73 0.00 0.81 0.00 0.74
Index 0.39 3.05 0.32 1.87 0.43 1.28
Correlation -0.17 -1.39 -0.19 -1.74 -1.13 -2.26
Swap rate -0.41 -1.38 -0.37 -1.16 0.05 0.09
Slope 0.01 0.09 0.03 0.33 0.28 1.04
Risk aversion 0.08 4.95 0.08 4.26 0.09 2.70
Swap spread 0.23 1.33 0.30 1.74 -0.09 -0.31
Bid-ask 0.19 2.99 0.20 2.98 0.02 0.14
Yen -0.11 -0.21 0.13 0.23 -1.08 -0.66
R² 0.26 0.20 0.04

33ECB
Working Paper Series No 910
June 2008
Table 5b: Regression results of changes in log Traxx tranche premia on all factors This table reports the results from OLS regressions of daily changes in the log iTraxx tranche premia on
the variables listed in table 4. The adjusted R-square is denoted R² and t-statistics based on Newey-West standard errors are given adjacent to the coefficient estimates. Coefficients marked in
bold are significant at 5 %. The sample is August 2004 to January 2008.
0-3% 3-6 % 6-9 %
Coeff. t-stat Coeff. t-stat Coeff. t-stat
Intercept 0.00 -0.21 0.00 0.01 0.00 0.28
Index 0.37 5.87 0.92 8.66 1.27 9.27
Correlation -0.06 -1.99 -0.07 -0.92 -0.12 -1.32
Swap rate 0.07 0.64 0.20 0.75 0.15 0.49
Slope 0.02 0.45 0.04 0.35 0.10 0.76
Risk aversion 0.01 1.34 0.00 0.07 0.00 0.29
Swap spread 0.13 1.27 0.52 2.32 0.50 2.19
Bid-ask 0.02 2.28 0.04 1.88 0.04 1.32
Yen 0.04 0.16 0.67 1.24 0.98 1.59
R² 0.30 0.27 0.33
9-12 % 12-22 % 22-100%
Coeff. t-stat Coeff. t-stat Coeff. t-stat
Intercept 0.00 0.00 0.00 -0.07 0.00 -0.12
Index 1.30 9.88 1.35 9.35 1.25 6.86
Correlation -0.04 -0.37 -0.06 -0.61 0.12 0.93
Swap rate 0.16 0.46 0.47 1.36 0.64 1.62
Slope 0.04 0.32 -0.09 -0.70 -0.27 -1.61
Risk aversion 0.01 0.39 0.01 0.29 -0.02 -1.13
Swap spread 0.64 2.51 0.72 2.79 0.97 3.76
Bid-ask 0.07 2.42 0.08 2.62 0.04 1.22
Yen 1.22 1.69 0.84 1.03 1.38 1.57
R² 0.34 0.36 0.21
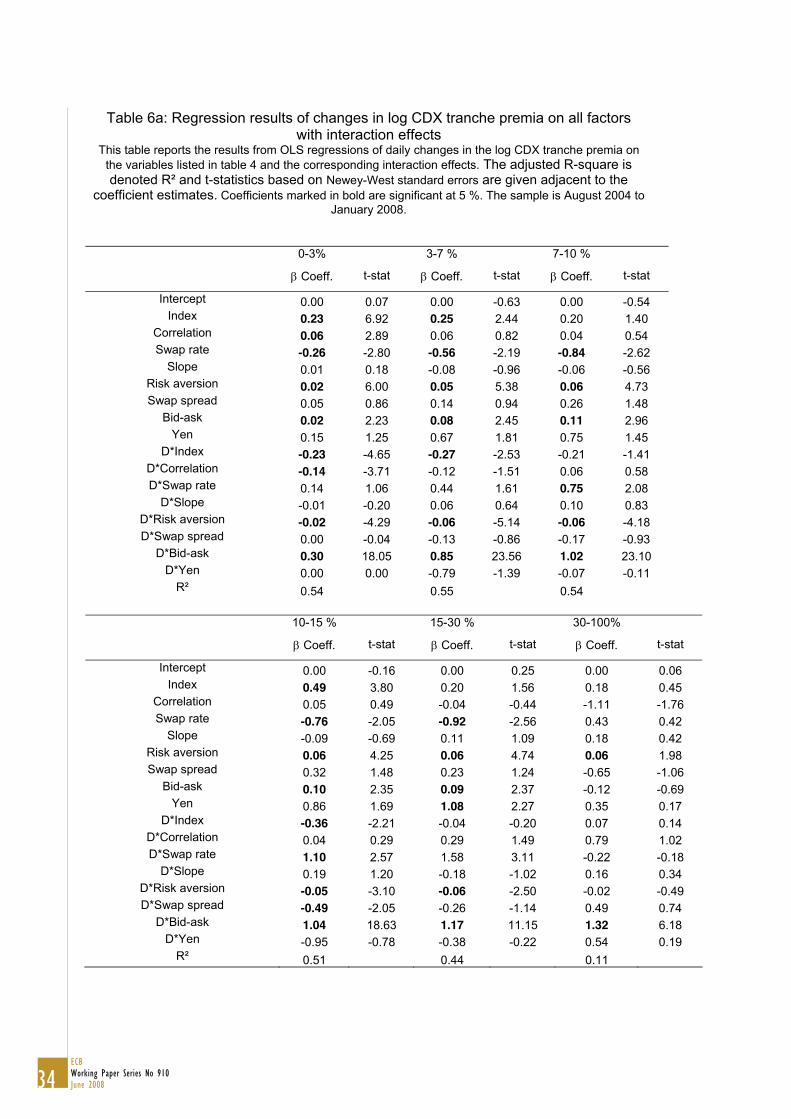
34ECB
Working Paper Series No 910
June 2008
Table 6a: Regression results of changes in log CDX tranche premia on all factors with interaction effects
This table reports the results from OLS regressions of daily changes in the log CDX tranche premia on the variables listed in table 4 and the corresponding interaction effects. The adjusted R-square is denoted R² and t-statistics based on Newey-West standard errors are given adjacent to the
coefficient estimates. Coefficients marked in bold are significant at 5 %. The sample is August 2004 to January 2008.
0-3% 3-7 % 7-10 %
Coeff. t-stat Coeff. t-stat Coeff. t-stat
Intercept 0.00 0.07 0.00 -0.63 0.00 -0.54 Index 0.23 6.92 0.25 2.44 0.20 1.40
Correlation 0.06 2.89 0.06 0.82 0.04 0.54 Swap rate -0.26 -2.80 -0.56 -2.19 -0.84 -2.62
Slope 0.01 0.18 -0.08 -0.96 -0.06 -0.56 Risk aversion 0.02 6.00 0.05 5.38 0.06 4.73 Swap spread 0.05 0.86 0.14 0.94 0.26 1.48
Bid-ask 0.02 2.23 0.08 2.45 0.11 2.96 Yen 0.15 1.25 0.67 1.81 0.75 1.45
D*Index -0.23 -4.65 -0.27 -2.53 -0.21 -1.41 D*Correlation -0.14 -3.71 -0.12 -1.51 0.06 0.58 D*Swap rate 0.14 1.06 0.44 1.61 0.75 2.08
D*Slope -0.01 -0.20 0.06 0.64 0.10 0.83 D*Risk aversion -0.02 -4.29 -0.06 -5.14 -0.06 -4.18 D*Swap spread 0.00 -0.04 -0.13 -0.86 -0.17 -0.93
D*Bid-ask 0.30 18.05 0.85 23.56 1.02 23.10 D*Yen 0.00 0.00 -0.79 -1.39 -0.07 -0.11
R² 0.54 0.55 0.54
10-15 % 15-30 % 30-100%
Coeff. t-stat Coeff. t-stat Coeff. t-stat
Intercept 0.00 -0.16 0.00 0.25 0.00 0.06 Index 0.49 3.80 0.20 1.56 0.18 0.45
Correlation 0.05 0.49 -0.04 -0.44 -1.11 -1.76 Swap rate -0.76 -2.05 -0.92 -2.56 0.43 0.42
Slope -0.09 -0.69 0.11 1.09 0.18 0.42 Risk aversion 0.06 4.25 0.06 4.74 0.06 1.98 Swap spread 0.32 1.48 0.23 1.24 -0.65 -1.06
Bid-ask 0.10 2.35 0.09 2.37 -0.12 -0.69 Yen 0.86 1.69 1.08 2.27 0.35 0.17
D*Index -0.36 -2.21 -0.04 -0.20 0.07 0.14 D*Correlation 0.04 0.29 0.29 1.49 0.79 1.02 D*Swap rate 1.10 2.57 1.58 3.11 -0.22 -0.18
D*Slope 0.19 1.20 -0.18 -1.02 0.16 0.34 D*Risk aversion -0.05 -3.10 -0.06 -2.50 -0.02 -0.49 D*Swap spread -0.49 -2.05 -0.26 -1.14 0.49 0.74
D*Bid-ask 1.04 18.63 1.17 11.15 1.32 6.18 D*Yen -0.95 -0.78 -0.38 -0.22 0.54 0.19
R² 0.51 0.44 0.11

35ECB
Working Paper Series No 910
June 2008
Table 6b: Regression results of changes in log iTraxx tranche premia on all factors with interaction effects
This table reports the results from OLS regressions of daily changes in the log iTraxx tranche premia on the variables listed in table 4 and the corresponding interaction effects. The adjusted R-squared is
denoted R² and t-statistics based on Newey-West standard errors are given adjacent to the coefficient estimates. Coefficients marked in bold are significant at 5 %. The sample is August 2004 to
January 2008.
0-3% 3-6 % 6-9 %
Coeff. t-stat Coeff. t-stat Coeff. t-stat
Intercept 0.00 0.28 0.00 0.29 0.00 0.59 Index 0.52 11.97 0.89 6.00 1.15 5.45
Correlation -0.09 -4.01 -0.18 -2.65 -0.23 -2.96 Swap rate -0.07 -0.78 -0.14 -0.66 -0.33 -1.29
Slope 0.02 0.38 0.01 0.11 0.09 0.68 Risk aversion 0.01 0.91 -0.01 -0.45 0.00 -0.06 Swap spread 0.05 0.72 0.21 1.27 0.06 0.31
Bid-ask 0.02 2.20 0.03 1.38 0.02 0.54 Yen -0.04 -0.29 -0.04 -0.13 0.25 0.56
D*Index -0.24 -1.77 0.01 0.05 0.15 0.51 D*Correlation 0.13 1.38 0.35 1.84 0.32 1.53 D*Swap rate 1.09 2.41 2.58 2.30 3.70 2.53
D*Slope 0.00 -0.03 0.01 0.05 -0.07 -0.27 D*Risk aversion 0.01 0.39 0.07 1.28 0.08 1.51 D*Swap spread 0.09 0.43 0.27 0.58 0.39 0.78
D*Bid-ask 0.00 0.02 0.03 0.66 0.06 1.21 D*Yen 0.00 0.02 0.03 0.66 0.06 1.21
R² 0.34 0.31 0.37
9-12 % 12-22 % 22-100%
Coeff. t-stat Coeff. t-stat Coeff. t-stat
Intercept 0.00 0.46 0.00 0.30 0.00 -0.26 Index 1.24 7.31 1.01 6.23 0.83 3.27
Correlation -0.16 -2.00 -0.22 -2.63 0.04 0.21 Swap rate -0.44 -1.56 -0.22 -0.96 0.51 1.24
Slope 0.11 0.80 0.02 0.21 -0.45 -2.08 Risk aversion 0.00 0.04 0.01 0.52 -0.01 -0.71 Swap spread 0.11 0.54 0.27 1.27 0.72 2.30
Bid-ask 0.05 1.60 0.06 2.03 0.00 0.09 Yen 0.47 1.03 -0.01 -0.02 0.76 1.07
D*Index 0.03 0.09 0.54 1.94 0.70 2.26 D*Correlation 0.38 1.39 0.39 1.63 0.13 0.52 D*Swap rate 3.88 2.22 4.17 2.37 2.40 1.33
D*Slope -0.25 -0.82 -0.33 -1.21 0.32 0.97 D*Risk aversion 0.08 1.47 0.06 1.07 0.05 0.92 D*Swap spread 0.65 1.13 0.35 0.58 -0.08 -0.14
D*Bid-ask 0.07 1.29 0.06 1.14 0.10 1.78 D*Yen 0.07 1.29 0.06 1.14 0.10 1.78
R² 0.39 0.41 0.24

36ECB
Working Paper Series No 910
June 2008
Table 7: Principal components analysis of CDX / iTraxx premia and residuals This table reports the variance proportions explained by the first two principal components for log changes of the tranche premia and the residuals of the multivariate regressions in table 5. The sample is August 2004 to January 2008.
Series Variance Proportion of PC 1 Variance Proportion of PC 2 CDX 0.86 0.08
CDX residuals 0.82 0.09 iTraxx 0.89 0.04
iTraxx residuals 0.87 0.05

37ECB
Working Paper Series No 910
June 2008
Graph 1a: Time series of CDX premia This graph plots the time series of the CDX index (top left) and the corresponding tranches. The sample is August 2004 to January 2008.
20
40
60
80
100
120
2004 2005 2006 2007
CDX INDEX
800
1,000
1,200
1,400
1,600
1,800
2,000
2,200
2004 2005 2006 2007
CDX 0_3%
0
100
200
300
400
500
600
2004 2005 2006 2007
CDX 3_7%
0
40
80
120
160
200
240
280
2004 2005 2006 2007
CDX 7_10%
0
20
40
60
80
100
120
140
2004 2005 2006 2007
CDX 10_15%
0
20
40
60
80
2004 2005 2006 2007
CDX 15_30%
0
10
20
30
40
2004 2005 2006 2007
CDX2 30_100%

38ECB
Working Paper Series No 910
June 2008
Graph 1b: Time series of iTraxx premia This graph plots the time series of the iTraxx index (top left) and the corresponding tranches. The sample is August 2004 to January 2008.
0
20
40
60
80
100
2004 2005 2006 2007
ITRA XX INDEX
600
800
1,000
1,200
1,400
1,600
1,800
2004 2005 2006 2007
ITRX 0_3%
0
100
200
300
400
500
2004 2005 2006 2007
ITRX 3_6%
0
50
100
150
200
250
300
2004 2005 2006 2007
ITRX 6_9%
0
40
80
120
160
2004 2005 2006 2007
ITRX 9_12%
0
20
40
60
80
2004 2005 2006 2007
ITRX 12_22%
0
5
10
15
20
25
30
2004 2005 2006 2007
ITRX 22_100%

39ECB
Working Paper Series No 910
June 2008
Graph 2: Time series of explanatory variables for iTraxx Tranche premia This graph plots the time series of the levels of the explanatory variables for the iTraxx tranches. The variables are listed in table 4. The sample is August 2004 to January 2008.
0
20
40
60
80
100
2005 2006 2007
IT RX INDEX
.0
.1
.2
.3
.4
.5
2005 2006 2007
IT RX CORR 0_3
2.5
3.0
3.5
4.0
4.5
5.0
2005 2006 2007
5 Y EURO SWAP RAT E
-0.5
0.0
0.5
1.0
1.5
2.0
2005 2006 2007
EURO SLOPE 10Y-1Y
-2
-1
0
1
2
3
2005 2006 2007
RISK AVERSION (JPM )
.0
.1
.2
.3
.4
.5
.6
2005 2006 2007
SWAP SPREAD (10Y)
130
140
150
160
170
2005 2006 2007
YEN/EURO
0
2
4
6
8
10
12
14
2005 2006 2007
IT RX BID-ASK T ranches
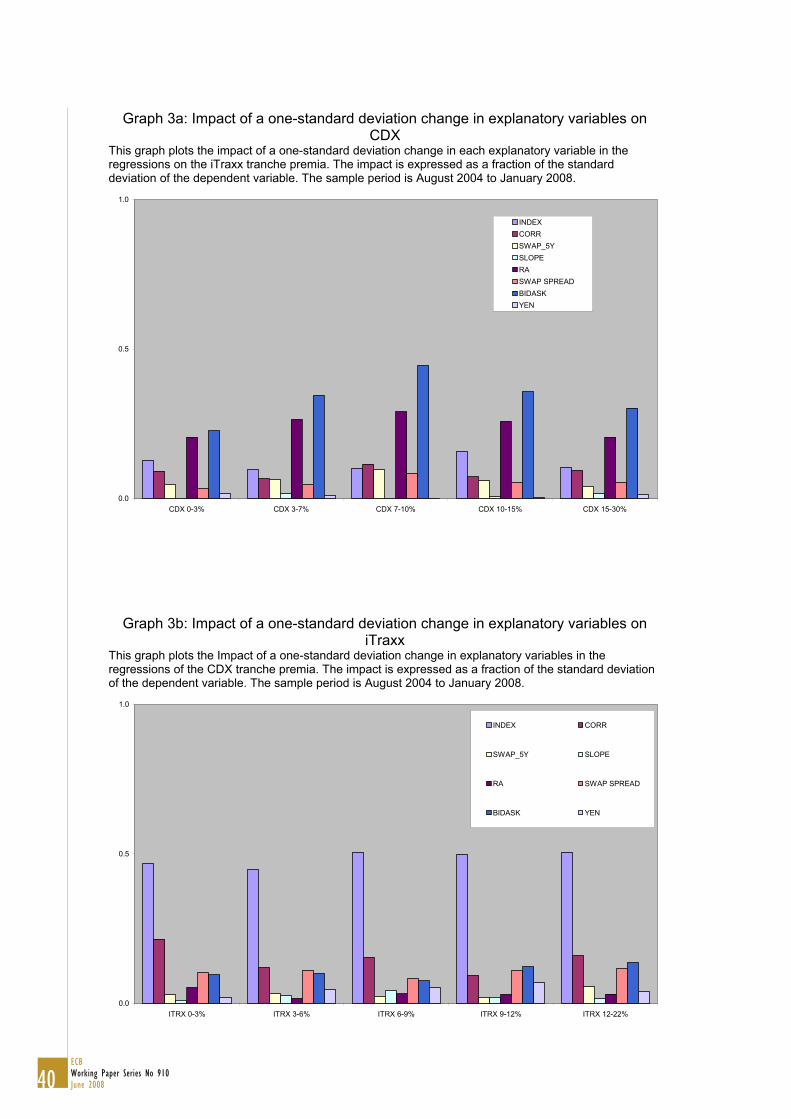
40ECB
Working Paper Series No 910
June 2008
Graph 3a: Impact of a one-standard deviation change in explanatory variables on CDX
This graph plots the impact of a one-standard deviation change in each explanatory variable in the regressions on the iTraxx tranche premia. The impact is expressed as a fraction of the standard deviation of the dependent variable. The sample period is August 2004 to January 2008.
0.0
0.5
1.0
CDX 0-3% CDX 3-7% CDX 7-10% CDX 10-15% CDX 15-30%
INDEXCORRSWAP_5YSLOPERASWAP SPREADBIDASKYEN
Graph 3b: Impact of a one-standard deviation change in explanatory variables on iTraxx
This graph plots the Impact of a one-standard deviation change in explanatory variables in the regressions of the CDX tranche premia. The impact is expressed as a fraction of the standard deviation of the dependent variable. The sample period is August 2004 to January 2008.
0.0
0.5
1.0
ITRX 0-3% ITRX 3-6% ITRX 6-9% ITRX 9-12% ITRX 12-22%
INDEX CORR
SWAP_5Y SLOPE
RA SWAP SPREAD
BIDASK YEN

41ECB
Working Paper Series No 910
June 2008
Graph 4a: R² of block-wise regressions on CDX tranche premia This graph plots the R-squared goodness of fit measures of the bivariate regressions of the iTraxx tranche premia. The four blocks are credit risk (Index and Base correlation), Interest rate factors (level and slope), risk aversion (JP Morgan index) and liquidity risk (swap spread, bid-ask, Yen). The sample periods are August 2004 to July 2007 (‘before’) and July 2007 to January 2008 (‘after’).
0%
10%
20%
30%
40%
50%
60%
70%
80%
90%
100%
Before0_3
After 0_3 Before3_7
After 3_7 Before7_10
After7_10
Before10_15
After10_15
Before15_30
After15_30
Before30_100
After30_100
Liquidity proxiesRisk AversionInterest rate factorsCredit Risk
Graph 4b: R² of block-wise regressions on iTraxx tranche premia This graph plots the R-squared goodness of fit measures of the block-wise regressions of the iTraxx tranche premia. The four blocks are credit risk (Index and Base correlation), Interest rate factors (level and slope), risk aversion (JP Morgan index) and liquidity risk (swap spread, bid-ask, Yen). The sample periods are August 2004 to July 2007 (‘before’) and July 2007 to January 2008 (‘after’).
0%
10%
20%
30%
40%
50%
60%
70%
80%
90%
100%
Before 0-3
After 0-3 Before 3-6
After 3-6 Before 6-9
After 6-9 Before 9-12
After 9-12
Before12-22
After 12-22
Before22_100
After22_100
Liquidity proxiesRisk AversionInterest rate factorsCredit Risk
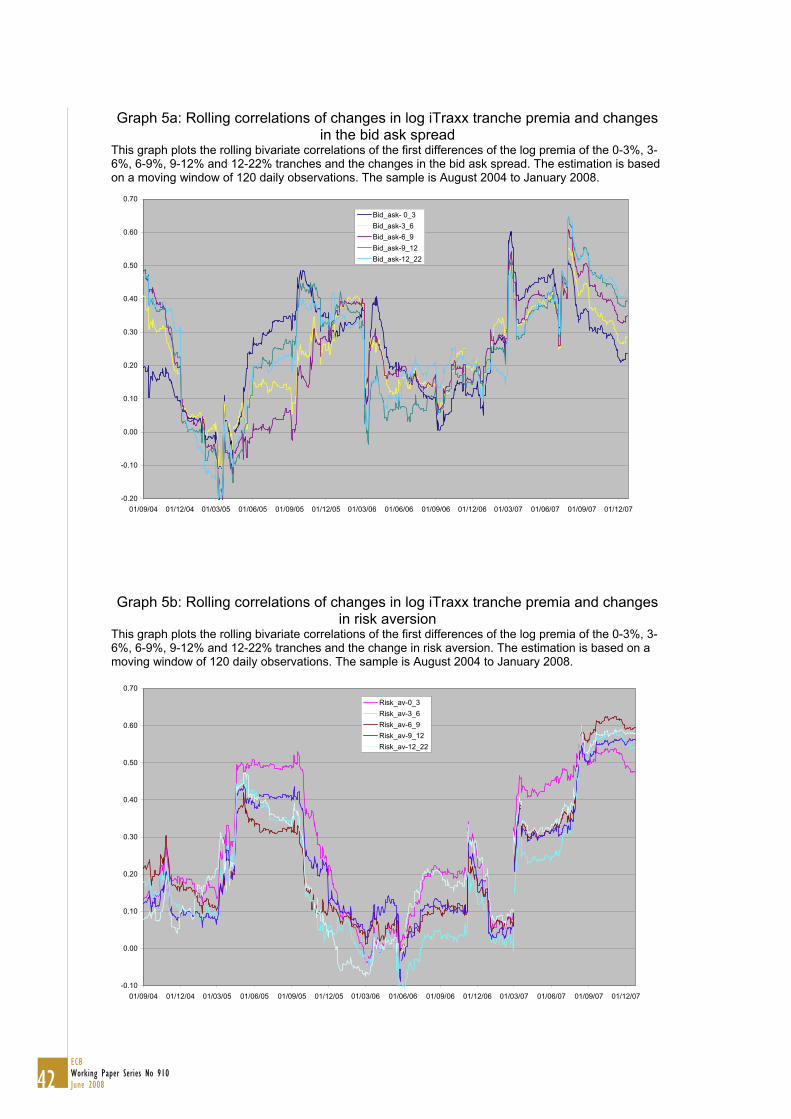
42ECB
Working Paper Series No 910
June 2008
Graph 5a: Rolling correlations of changes in log iTraxx tranche premia and changes in the bid ask spread
This graph plots the rolling bivariate correlations of the first differences of the log premia of the 0-3%, 3-6%, 6-9%, 9-12% and 12-22% tranches and the changes in the bid ask spread. The estimation is based on a moving window of 120 daily observations. The sample is August 2004 to January 2008.
-0.20
-0.10
0.00
0.10
0.20
0.30
0.40
0.50
0.60
0.70
01/09/04 01/12/04 01/03/05 01/06/05 01/09/05 01/12/05 01/03/06 01/06/06 01/09/06 01/12/06 01/03/07 01/06/07 01/09/07 01/12/07
Bid_ask- 0_3Bid_ask-3_6Bid_ask-6_9Bid_ask-9_12Bid_ask-12_22
Graph 5b: Rolling correlations of changes in log iTraxx tranche premia and changes
in risk aversion This graph plots the rolling bivariate correlations of the first differences of the log premia of the 0-3%, 3-6%, 6-9%, 9-12% and 12-22% tranches and the change in risk aversion. The estimation is based on a moving window of 120 daily observations. The sample is August 2004 to January 2008.
-0.10
0.00
0.10
0.20
0.30
0.40
0.50
0.60
0.70
01/09/04 01/12/04 01/03/05 01/06/05 01/09/05 01/12/05 01/03/06 01/06/06 01/09/06 01/12/06 01/03/07 01/06/07 01/09/07 01/12/07
Risk_av-0_3Risk_av-3_6Risk_av-6_9Risk_av-9_12Risk_av-12_22

43ECB
Working Paper Series No 910
June 2008
European Central Bank Working Paper Series
For a complete list of Working Papers published by the ECB, please visit the ECB’s website
(http://www.ecb.europa.eu).
877 “What are the effects of fiscal policy shocks? A VAR-based comparative analysis” by D. Caldara and C. Kamps,
March 2008.
878 “Nominal and real interest rates during an optimal disinflation in New Keynesian models” by M. Hagedorn,
March 2008.
879 “Government risk premiums in the bond market: EMU and Canada” by L. Schuknecht, J. von Hagen and
G. Wolswijk, March 2008.
880 “On policy interactions among nations: when do cooperation and commitment matter?” by H. Kempf and
L. von Thadden, March 2008.
881 “Imperfect predictability and mutual fund dynamics: how managers use predictors in changing systematic risk”
by G. Amisano and R. Savona, March 2008.
882 “Forecasting world trade: direct versus “bottom-up” approaches” by M. Burgert and S. Dées, March 2008.
883 “Assessing the benefits of international portfolio diversification in bonds and stocks” by R. A. De Santis and
L. Sarno, March 2008.
884 “A quantitative perspective on optimal monetary policy cooperation between the US and the euro area”
by S. Adjemian, M. Darracq Pariès and F. Smets, March 2008.
885 “Impact of bank competition on the interest rate pass-through in the euro area” by M. van Leuvensteijn,
C. Kok Sørensen, J. A. Bikker and A. A. R. J. M. van Rixtel, March 2008.
886 “International evidence on sticky consumption growth” by C. D. Carroll, J. Slacalek and M. Sommer,
March 2008.
887 “Labor supply after transition: evidence from the Czech Republic” by A. Bičáková, J. Slacalek and M. Slavík,
March 2008.
888 “House prices, money, credit and the macroeconomy” by C. Goodhart and B. Hofmann, April 2008.
889 “Credit and the natural rate of interest” by F. De Fiore and O. Tristani, April 2008.
890 “Globalisation, domestic inflation and global output gaps: evidence from the euro area” by A. Calza, April 2008.
891 “House prices and the stance of monetary policy” by M. Jarociński and F. Smets, April 2008.
892 “Identification of New Keynesian Phillips Curves from a global perspective” by S. Dées, M. H. Pesaran, L. V. Smith
and R. P. Smith, April 2008.
893 “Sticky wages: evidence from quarterly microeconomic data” by T. Heckel, H. Le Bihan and M. Montornès,
May 2008.
894 “The role of country-specific trade and survey data in forecasting euro area manufacturing production:
perspective from large panel factor models” by M. Darracq Pariès and L. Maurin, May 2008.
895 “On the empirical evidence of the intertemporal current account model for the euro area countries”
by M. Ca’Zorzi and M. Rubaszek, May 2008.

44ECB
Working Paper Series No 910
June 2008
896 “The Maastricht convergence criteria and optimal monetary policy for the EMU accession countries”
by A. Lipińska, May 2008.
897 “DSGE-modelling when agents are imperfectly informed” by P. De Grauwe, May 2008.
898 “Central bank communication and monetary policy: a survey of theory and evidence” by A. S. Blinder,
M. Ehrmann, M. Fratzscher, J. De Haan and D.-J. Jansen, May 2008.
899 “Robust monetary rules under unstructured and structured model uncertainty” by P. Levine and J. Pearlman,
May 2008.
900 “Forecasting inflation and tracking monetary policy in the euro area: does national information help?”
by R. Cristadoro, F. Venditti and G. Saporito, May 2008.
901 “The usefulness of infra-annual government cash budgetary data for fiscal forecasting in the euro area”
by L. Onorante, D. J. Pedregal, J. J. Pérez and S. Signorini, May 2008.
902 “Fiscal consolidation in the euro area: long-run benefits and short-run costs” by G. Coenen, M. Mohr and
R. Straub, May 2008.
903 “A robust criterion for determining the number of static factors in approximate factor models” by L. Alessi,
M. Barigozzi and M. Capasso, May 2008.
904 “Does money matter in the IS curve? The case of the UK” by B. E. Jones and L. Stracca, June 2008.
905 “A persistence-weighted measure of core inflation in the euro area” by L. Bilke and L. Stracca, June 2008.
906 “The impact of the euro on equity markets: a country and sector decomposition” by L. Cappiello, A. Kadareja
and S. Manganelli, June 2008.
907 “Globalisation and the euro area: simulation based analysis using the New Area Wide Model” by P. Jacquinot and
R. Straub, June 2008.
908 “3-step analysis of public finances sustainability: the case of the European Union” by A. Afonso and C. Rault,
June 2008.
909 “Repo markets, counterparty risk and the 2007/2008 liquidity crisis” by C. Ewerhart and J. Tapking, June 2008.
910 “How has CDO market pricing changed during the turmoil? Evidence from CDS index tranches”
by M. Scheicher, June 2008.