Embed Size (px)
Citation preview
How governments spend: Opening up the value of global
public procurement
Introduction For governments planning their path to economic recovery after the coronavirus pandemic, public procurement will play a key role in delivering vital goods, works, and services to citizens and creating opportunities for small and large companies alike. The sheer size of the global procurement market, estimated at US$13 trillion per annum, according to new research by the Open Contracting Partnership and Spend Network, makes it an essential economic activity. Over $10 trillion (77% of the total) is spent by 16 countries. China is by far the largest procurer at $4.2 trillion and the United States spends $1.8 trillion. Some 14 countries spend between $100 billion and $1 trillion per annum. From highest to lowest, these are Japan, Germany, India, France, the United Kingdom, Indonesia, Canada, Italy, South Korea, Australia, Brazil, the Netherlands, Russia, and Spain.
2
Yet, governments disclose very little information about how this money is spent. According to our analysis, public contracts that are published openly account for only US$362 billion or 2.8% of the market's total value, including contracts from the United States, United Kingdom, Colombia, Ukraine, Australia, Italy, Canada, Georgia, Kenya, and Moldova. Overall, less than 2% ($244 billion) of public contracts are published using the globally recognized Open Contracting Data Standard, which allows businesses, journalists and civil society to analyze and interrogate the data. These figures represent a baseline. While more contract notices are published openly around the world, the key data needed to estimate yearly government spend analyzed in this report including the amount, currency, start date and end date of the contract is missing. The lack of transparency severely hinders efforts to increase competition, especially for small and medium-sized enterprises (SMEs) and minority-owned businesses. Including the valuation of contracts over time would provide data users with a better understanding of when pertinent contracts are due to expire. It also impedes effective oversight to reduce fraud and corruption. What can’t be measured can’t be improved. The coronavirus pandemic has laid bare how ineffective, opaque procurement systems mean taxpayers get a bad deal for crucial public services. Governments spent at least $100 billion on COVID-19 related contracts between January and July this year – scrambling to secure personal protective equipment (PPE), medical supplies and other goods and services to deal with the emergency. Around the world, governments needing to respond quickly and efficiently to the emergency often struggled under archaic and ineffective systems. Buyers and suppliers failed to connect, and in many cases, governments weren’t able to respond to a scarce market with skyrocketing costs and inexperienced suppliers. Coordination was limited, with different parts of government competing with each other. Reforms are urgently needed to bring transparency. We strongly recommend that governments publish open real-time and quality public procurement data, including information as basic as contract start and end dates as well as currency and contract values. This recommendation also applies to Tenders Electronic Daily, a key European source of tenders and contracts, that would allow for a much better, like-for-like understanding of European procurement data. The Open Contracting Data Standard (OCDS) provides a helpful framework for standardization especially when combined with tools and processes for ensuring data quality and completeness. This would not only give more businesses the information they need to bid for contracts, increasing competition and value for money, but also hold governments and suppliers to account and ensure decisions are made in taxpayers’ interest. Taxpayers need to know their money is being well spent as governments reset the economy.
3
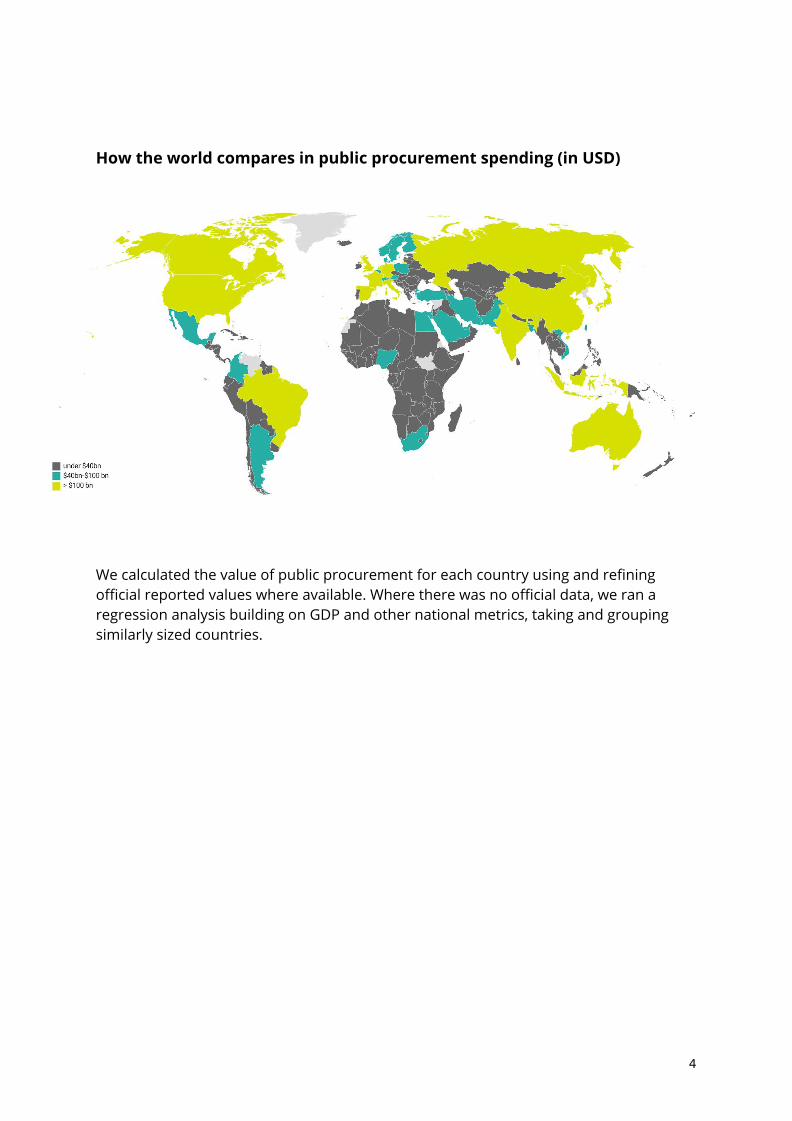
How the world compares in public procurement spending (in USD)
We calculated the value of public procurement for each country using and refining official reported values where available. Where there was no official data, we ran a regression analysis building on GDP and other national metrics, taking and grouping similarly sized countries.
4
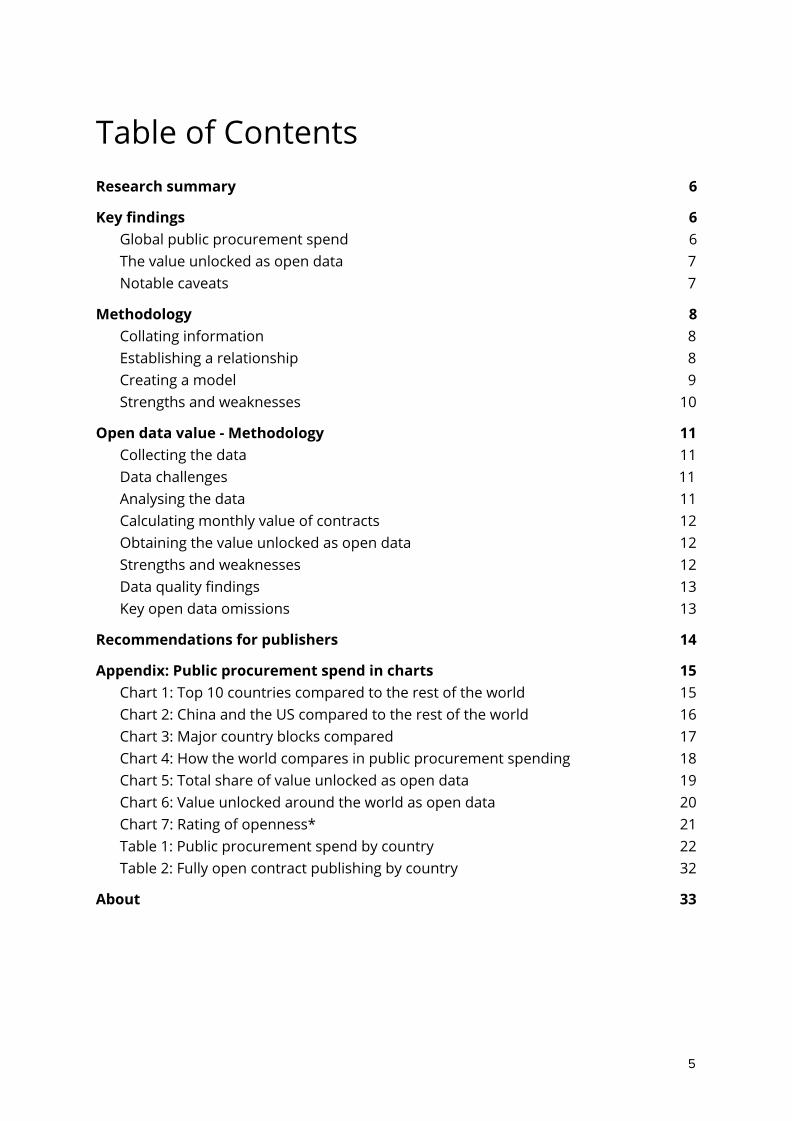
Table of Contents Research summary 6
Key findings 6 Global public procurement spend 6 The value unlocked as open data 7 Notable caveats 7
Methodology 8 Collating information 8 Establishing a relationship 8 Creating a model 9 Strengths and weaknesses 10
Open data value - Methodology 11 Collecting the data 11 Data challenges 11 Analysing the data 11 Calculating monthly value of contracts 12 Obtaining the value unlocked as open data 12 Strengths and weaknesses 12 Data quality findings 13 Key open data omissions 13
Recommendations for publishers 14
Appendix: Public procurement spend in charts 15 Chart 1: Top 10 countries compared to the rest of the world 15 Chart 2: China and the US compared to the rest of the world 16 Chart 3: Major country blocks compared 17 Chart 4: How the world compares in public procurement spending 18 Chart 5: Total share of value unlocked as open data 19 Chart 6: Value unlocked around the world as open data 20 Chart 7: Rating of openness* 21 Table 1: Public procurement spend by country 22 Table 2: Fully open contract publishing by country 32
About 33
5
Research summary The Open Contracting Partnership and Spend Network estimate that the global value of public procurement was US$13 trillion in 2018. This estimate is the result of data linking, data cleansing, validation and statistical modelling. The full methodological details are shared below. Of this total, we estimate that US$362.8 billion was openly published or 2.8% of the total USD 13 trillion spent. Of this US$362.8 billion, US$244.4 billion was published as OCDS or 1.9% of the US$13 trillion total spend on public procurement . We achieved this by 1
compiling applicable contracts from around the world for the financial year between 1 April 2018 and 31 March 2019.
Key findings Global public procurement spend
● World’s public procurement spend is about US$13 trillion per annum. ● Out of the $13 trillion total, over $10 trillion is spent by 16 countries.
○ China is the largest procurer at $4.2 trillion, ○ The USA, by contrast, spends less than half than China at $1.8 trillion, ○ 14 countries spend between US$100 billion and US$1 trillion per annum.
In descending order, these are: Japan, Germany, India, France, United Kingdom, Indonesia, Canada, Italy, South Korea, Australia, Brazil, Netherlands, Russia and Spain.
● The rest of the world spends just over $2 trillion per annum. ● There are strong and positive correlations between public procurement spend
and: ○ gross domestic product (GDP), ○ gross national income (GNI) in purchasing power parity (PPP), ○ military expenditure, and, ○ revenue, excluding grants.
1 To count as ‘published as open data’, the data needed to have the value of a contract, the start and end date of that contract.
6
The value unlocked as open data
● The amount of value opened up by open data is US$362.8 billion per annum ● This figure represents 2.81% of the total estimated value of public procurement
spend ● The amount of value opened up by OCDS is US$244.4 billion per annum ● This figure represents 1.88% of the total estimated value of public procurement
spend ● The USA publishes the most contract data (US$117.8 billion or 6.5% of total
spend), closely followed by the UK (US$101.8 billion or 28.4% of total spend).
Notable caveats
● The scale of China, which accounts for about 30% of the overall figure, makes this model vulnerable to its data accuracy.
● Our focus on public procurement spend and publishing was generally national and/or federal rather than subnational/state. However, there were ambiguities in whether spend is national and/or subnational (e.g. contracts could overlap both) and there are limited instances of subnational contracts featuring in national or federal portals.
● The published figures are not exhaustive because the data of some countries, despite publishing substantial volumes of contracts, could not be analyzed.
● The published value of some countries was more than officially reported. We explore this more in the Data Findings section below.
7
Methodology Collating information
To establish what the current state of information is, existing data was gathered. We restricted our search to federal rather than subnational/state. First, we gathered the procurement spend from sources such as the World Bank, International Monetary Fund (IMF), Organisation for Economic Co-operation and Development (OECD) and government sources . Second, we gathered a number of 2
national metrics tracked and maintained by the World Bank such as GDP, GNI, military spend, tax revenue, total debt service, Statistical Capacity score, and Human Capital Index . In order to capture the most data, we used 2017’s data as it was the latest and 34
most complete dataset. We then modelled 2017’s figure forward to cover 2018. The source data and statistical model is available in this spreadsheet. Relevant tabs for source data:
● Sources - contains our sources for countries' procurement spend ● Collated WB Data (hidden) - raw, amalgamated data from the World Bank ● Data Pivot (hidden) - structured data from the World Bank using data from the
'Collated WB Data' tab ● Data from Pivot (hidden) - raw data from the Data Pivot tab
Establishing a relationship
The relationship between procurement spend and these other categories from the World Bank was tested using t-test correlations. In order to compare larger variables such as GDP with smaller variables such as statistical capacity and Human Capital Index, smaller, normalised values were used. This means that all values were placed on a 0-1 scale in line with the smallest variable, statistical capacity, to prevent very large values from distorting the relationships. The main four variables that showed strong, statistically significant correlations with procurement spend were GDP, GNI (PPP), military expenditure and revenue.
The United States and China were excluded from the analysis. This is because their economies and procurement spend are substantially larger than those of the rest of the world. They therefore form a cluster in their own right that will more likely distort any
2 This can be found in the ‘Sources’ tab in this spreadsheet 3 https://data.worldbank.org/ 4 Extracted data from footnote 3 above can be found in ‘Collated WB Data’ tab which is hidden in this spreadsheet
8
model. These correlations increased when the two outlier countries, the United States and China, were left out.
Owing to the limited sample size (66 countries with sourced data), only the strongest correlations (of over 0.8) were chosen to build the model. This is good practice because with more variables, there needs to be a larger sample size to maintain confidence in any relationship established.
Tabs in question
● Correlations without outliers - shows the correlations and data behind the t-tests for all countries except the US and China
Creating a model
To create a model, countries were banded based on GDP. This was done to provide a more refined model of spend that better reflected inter-country differences and to capture like-for-like economies. GDP was chosen because it had the strongest correlation with procurement spend.
Countries were banded by 'large', 'medium' and 'small. 'Large' denotes any country with GDP higher than US$1.5 trillion, 'medium' is any between US$1.5 trillion and US$100 billion and 'small' is less than US$100 billion. For each band, a regression model based on the existing dataset was created. Each band can be found as a tab in their own right on the spreadsheet.
For countries where we did not have data, we applied the regression model. This involved matching the country’s GDP to the above bands, and for each band multiplying the GNI and GDP by the respective coefficient, adding the two together and adding the intercept to the result. This created a 'best fit' number. This number was totalled and, with the exception of China (the figures of which are published for 2018), increased by 3.039%. 3.039% is the amount of growth in the world's GDP between 2017 and 2018 . 5
This gave a total public procurement spend of US$13 trillion per annum.
Note: India's procurement spend is estimated between 20% and 30% . This model has 6 7
taken the more conservative figure of 20% but an option to increase it to 30% is also included.
Caveats: for many countries, recent data was not forthcoming. It is therefore assumed based on what we know of procurement spend patterns in OECD countries that procurement spend as a percentage of GDP remains constant and unchanged.
5 https://data.worldbank.org/indicator/NY.GDP.MKTP.KD.ZG?end=2018&start=2015 6 https://blogs.worldbank.org/governance/public-procurement-rich-country-s-policy 7 www.researchgate.net/publication/317150442_Mapping_public_procurement_practices_in_India
9
Strengths and weaknesses
We have built upon the earlier model of US$9.5 trillion public procurement spend and, through our methods, found US$13 trillion. Owing to the fact that the largest economies contribute the most to public procurement spend, a clear vulnerability is the effect of their spend on the model.
One example is procurement spend of two of the largest contributors: China and India. For India, volumes of public procurement vary because procurement happens at multiple levels, many of which are yet to use e-procurement and/or to publish contract award data. To err on the side of caution, we have gone for the most conservative estimate: the lowest band of 20% of GDP. The effect of Chinese public procurement spend figures on the model should be noten and treated with care: at over US$4 trillion, Chinese spend takes up 30% of the model and any refinement in Chinese figures will likely have a knock on effect. To mitigate against this, where possible we have used official Chinese sources or credible sources in lieu of official estimates.
Although we focused on national sources of public procurement spend, it was not always clear whether spend was national only or included subnational spend.
Finally, multiple regressions were carried out on a small sample size (66) which formed the basis of modelling. Even if all the countries in the world were included for regression analysis, there might still be problems with sampling. This risk is mitigated by the fact it only impacts on $889 billion or 6.83% of $13 trillion. The model created only accounts for 6.83% of the total spend.
10
Open data value - Methodology Collecting the data
Countries around the world publish hundreds of thousands of contract award documents in a given year. Between our existing data and our knowledge of the sources, we collected a substantial number of applicable contracts to analyze. Applicable contracts in this case were those that provided enough information to get a value over time.
We restricted our search to federal rather than subnational/state contracts. It is important to note that even national portals such as Contracts Finder or USASpending include instances of subnational contracts.
Data challenges
The data challenges to achieve our methodology were substantial. Although we have the infrastructure and experience to build this, a substantial amount of work was needed to get the data ready to analyze. To extract the data, our team often had to write web scrapers to collect data from a source from scratch. Reasons included the original scraper having issues (Chile) or inconsistent counts being gathered from APIs or no APIs altogether. For Chile, we were unable to collect the data despite our attempts to fix and improve an original scraper because the publisher updated the API twice. The APIs for Moldova and Australia are relatively new, the latter being online just a month after the initial import and Canada’s Open Contracting Data Standard (OCDS) API only went up to 2016. API documentation is often confusing, even when comprehensive. It is not always clear how large data sources are and therefore how long importing will take until work has begun. Even so, data volumes were often extremely high, especially in OCDS compliant countries, which increased the time taken to audit the data and to reimport data to address gaps. By way of example, the initial import of US data was 30 gigabytes in size. Data cleansing also took time as even OCDS compliant data had instances of non-compliance and numbered values were sometimes stored as text.
Analysing the data
Through cleansing and quality checking, we were able to collect monthly values of contracts for the following countries:
● Australia
11
● Canada ● Colombia ● Georgia ● Kenya ● Italy ● Moldova ● Ukraine ● United Kingdom ● United States
Calculating monthly value of contracts
To get a value over time, we looked only at contracts that had start dates, end dates, and values. By way of example, a $10 million contract spread over 10 years is very different to one spread over one year. With all three parameters known, however, we can say with confidence how much a contract is worth on a monthly and yearly basis. We extracted the relevant data from our database using PostgreSQL queries, which extracted the value over the financial year 2018-2019 of the contracts based on the 8
monthly value of contracts.
Obtaining the value unlocked as open data
Summing the totals from these countries gave us a total figure of US$362.8 billion per annum.
Strengths and weaknesses
Spend Network collects tenders and contracts from around the world on a daily basis. We used our expertise and knowledge of the sources to build a comprehensive picture of open publishing rates and quality around the world. We have made every attempt to identify and collect sources. Some sources nonetheless eluded us owing to issues of accessibility of the system and/or data (for example, South Korea). We have explained key omissions in the section below. Another vulnerability is that it is very likely that the true values unlocked by open publishing and OCDS are higher than our figures would suggest. For example, a significant quantity of contracts are published but lack start dates, end dates, and/or values. Nonetheless we decided to be conservative and exclude these. This is because, without these parameters, we cannot know the annual value of a contract. The implications of this are twofold. First, this exercise provides a baseline of the minimum value opened up through open publishing and OCDS publishing. Second, it provides clear areas of improvement that can be adopted by open publishers and OCDS publishers alike.
8 Financial Year being defined as 1 April 2018 to 31 March 2019
12
Data quality findings
Publication of consistent, good quality and open data is a challenge not perfected by any one country or subnational publisher. Even in countries with a strong, voluminous publication regime in OCDS, there can be a lack of key information such as values, start dates, and end dates. We cover omissions and why in the ‘Key open data omissions’ section below. There are instances of imperfect compliance to OCDS or troublesome implementation. One example of troublesome implementation is the UK, which overlapped OCDS on an existing standard rather than creating a regime from bottom up. For OCDS countries, we found that the published value of some countries was more than officially reported. In Colombia, for instance, the value we gathered from contracts was twice the amount of reported public procurement spend. There are a number of reasons why this discrepancy might occur. For instance, there is a possibility that quite a few contracts are published with a 0 value. Frameworks can also distort a contract’s value, as its actual value is often not fully known at the start of a contract and so a framework might have its value reported per supplier attached. By way of example, a $10 million framework agreement with five suppliers might have a reported value of $50 million (5 x $10). Finally, it might be that reported procurement spend is underestimated.
Key open data omissions
There are several countries that may publish excellent open data and may also be OCDS compliant, but are notably absent from the in-scope country list under the ‘Analysing the data’ section above. There are a number of reasons for this, such as:
● Lack of complete contract dates (e.g. Paraguay, El Salvador, New Zealand) ● Lack of access (e.g. KONEPS for South Korea, Germany where access to contracts
is removed after completion) ● Issues with the source (e.g. Chile) ● Sources have not been updated for an extended period of time (e.g. Mexico) ● Lack of contracts data (e.g. New Zealand)
13
Recommendations for publishers Several countries in the world publish adequate, open data but could not be included in this study. Open Contracting Data Standard adopters Paraguay and Uruguay, for instance, lacked key information around dates. This meant that contract values could not be discerned. Other countries that publish open data such as El Salvador, Argentina, and Norway also lacked end dates. Publish contract duration: It is therefore strongly recommended that publishers include end dates as part of their contract data. This would not just allow a valuation of contracts over time but provide data users with a better understanding of when pertinent contracts are due to expire. It is recommended for contract start and end dates to be mandatory on Tenders Electronic Daily. As a key European source of tenders and contracts, this recommendation would allow for a much better, like-for-like understanding of European procurement data. It would also reduce the need for extensive searching and standardisation of national sources such as Doffin.no and evergabe-online.de. Good data stewardship: It is recommended for all publishers to maintain and validate their data, even those that publish good data. By way of example, on the UK’s Contracts Finder, there are many 0 and blank value tenders being published as well as contracts with end dates that are before start dates. These were generally isolated rather than systemic examples but nonetheless underline the importance of good data stewardship.
14
Appendix: Public procurement spend in charts
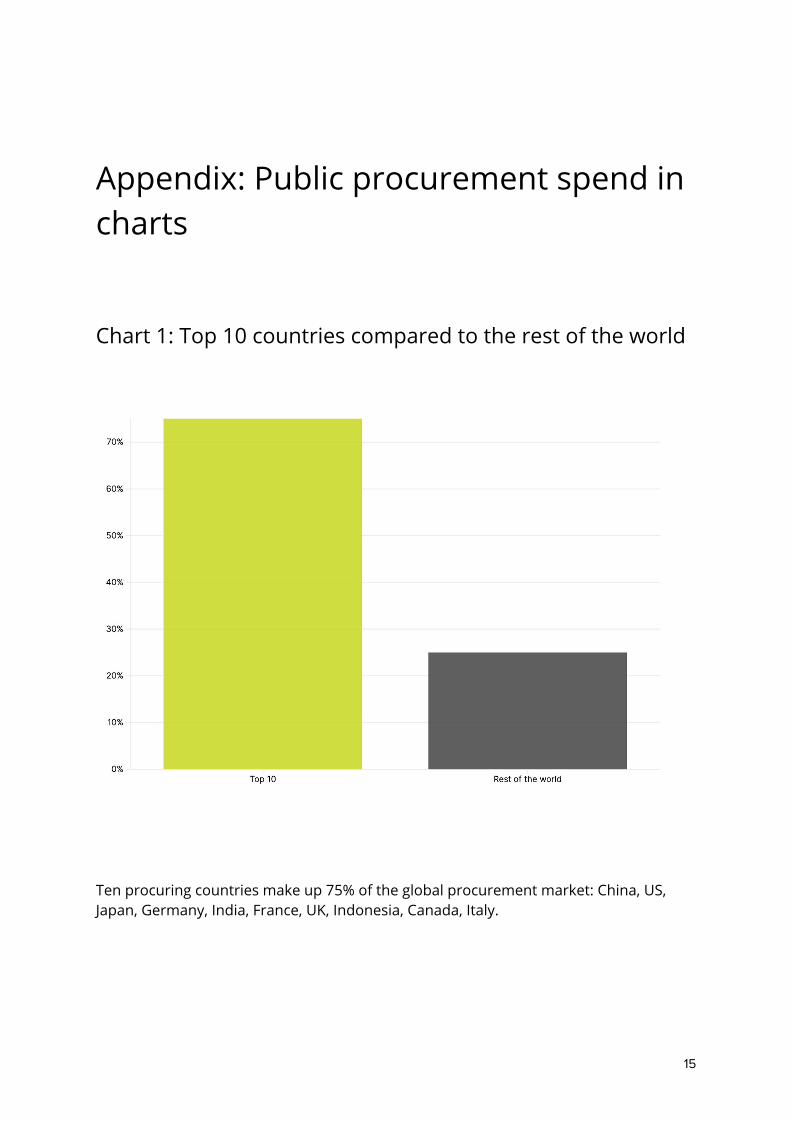
Chart 1: Top 10 countries compared to the rest of the world
Ten procuring countries make up 75% of the global procurement market: China, US, Japan, Germany, India, France, UK, Indonesia, Canada, Italy.
15
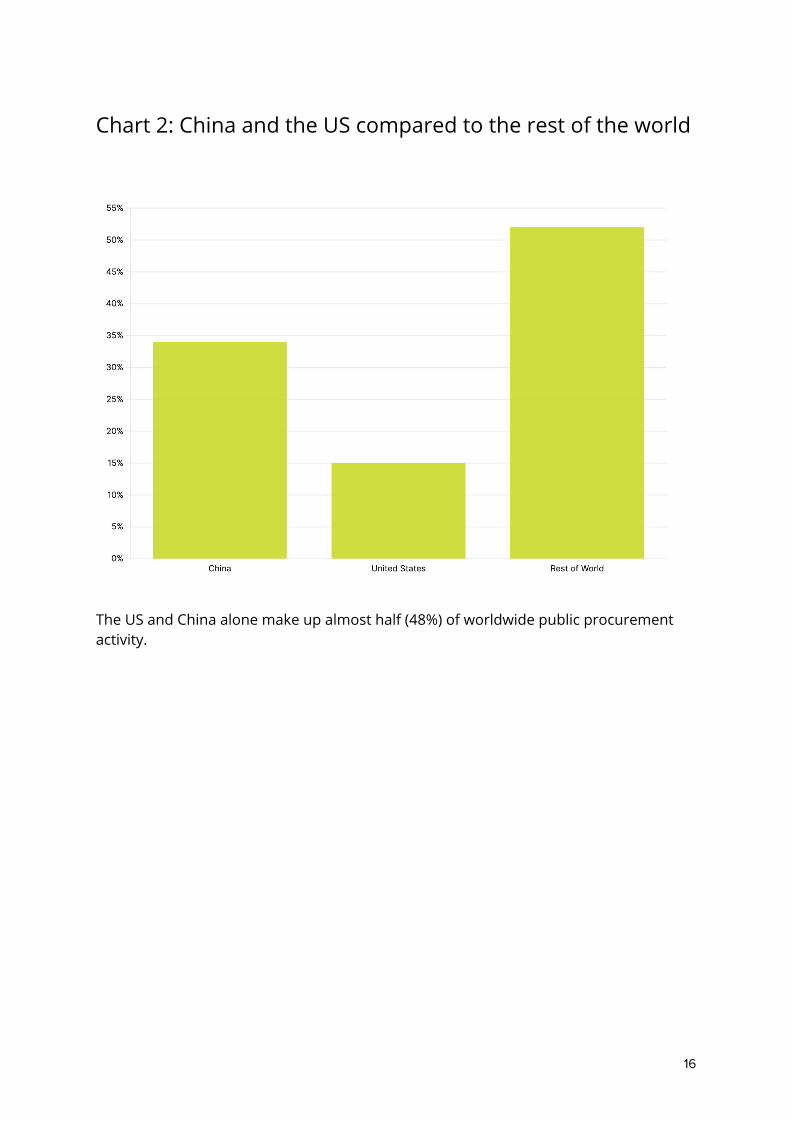
Chart 2: China and the US compared to the rest of the world
The US and China alone make up almost half (48%) of worldwide public procurement activity.
16
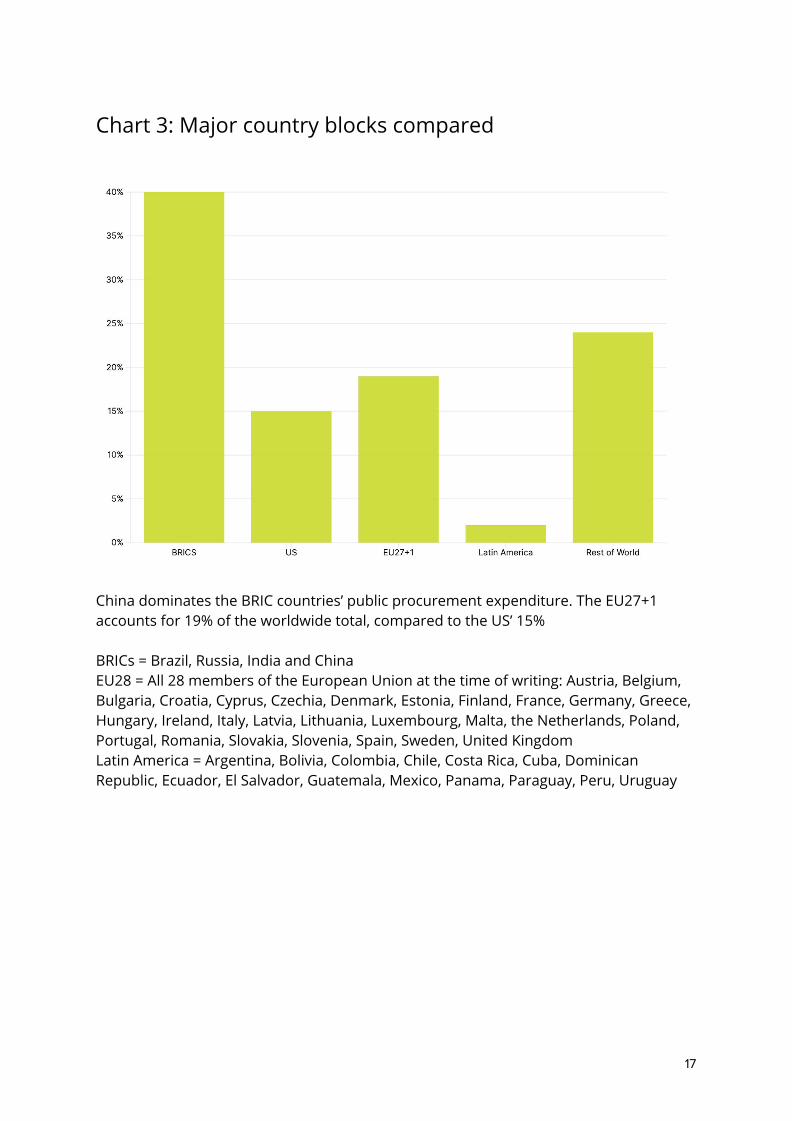
Chart 3: Major country blocks compared
China dominates the BRIC countries’ public procurement expenditure. The EU27+1 accounts for 19% of the worldwide total, compared to the US’ 15% BRICs = Brazil, Russia, India and China EU28 = All 28 members of the European Union at the time of writing: Austria, Belgium, Bulgaria, Croatia, Cyprus, Czechia, Denmark, Estonia, Finland, France, Germany, Greece, Hungary, Ireland, Italy, Latvia, Lithuania, Luxembourg, Malta, the Netherlands, Poland, Portugal, Romania, Slovakia, Slovenia, Spain, Sweden, United Kingdom Latin America = Argentina, Bolivia, Colombia, Chile, Costa Rica, Cuba, Dominican Republic, Ecuador, El Salvador, Guatemala, Mexico, Panama, Paraguay, Peru, Uruguay
17
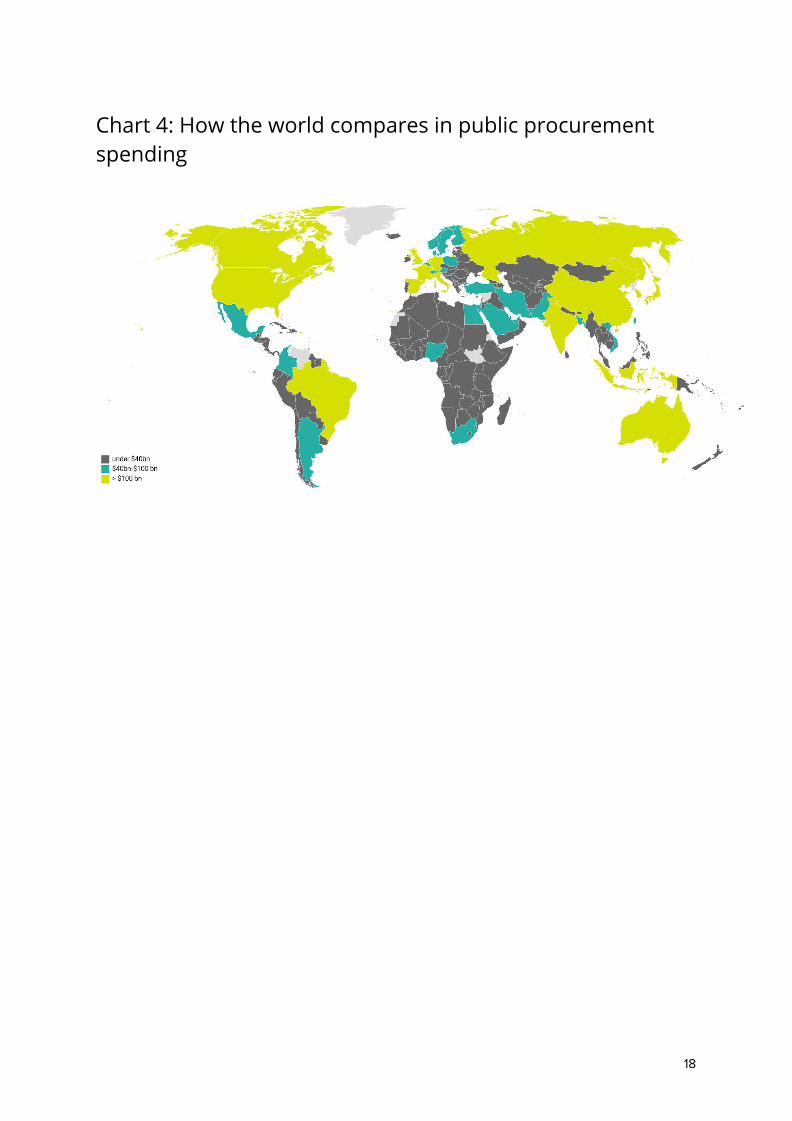
Chart 4: How the world compares in public procurement spending
18
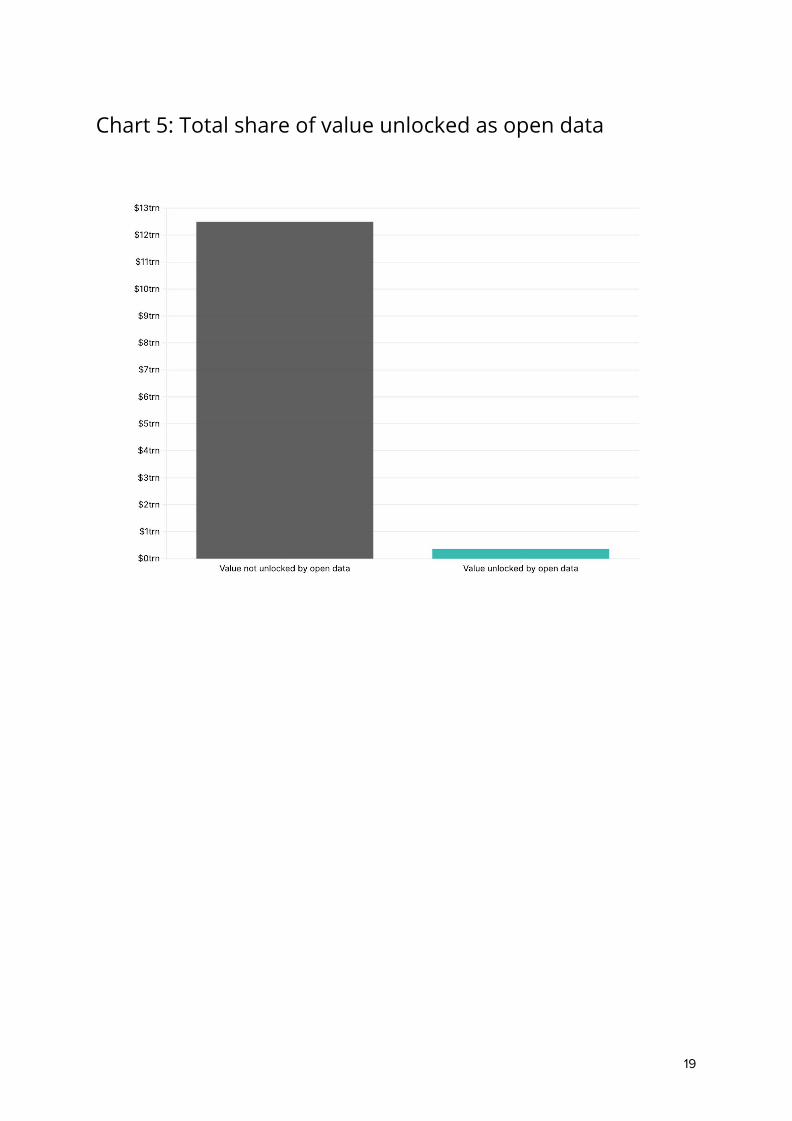
Chart 5: Total share of value unlocked as open data
19
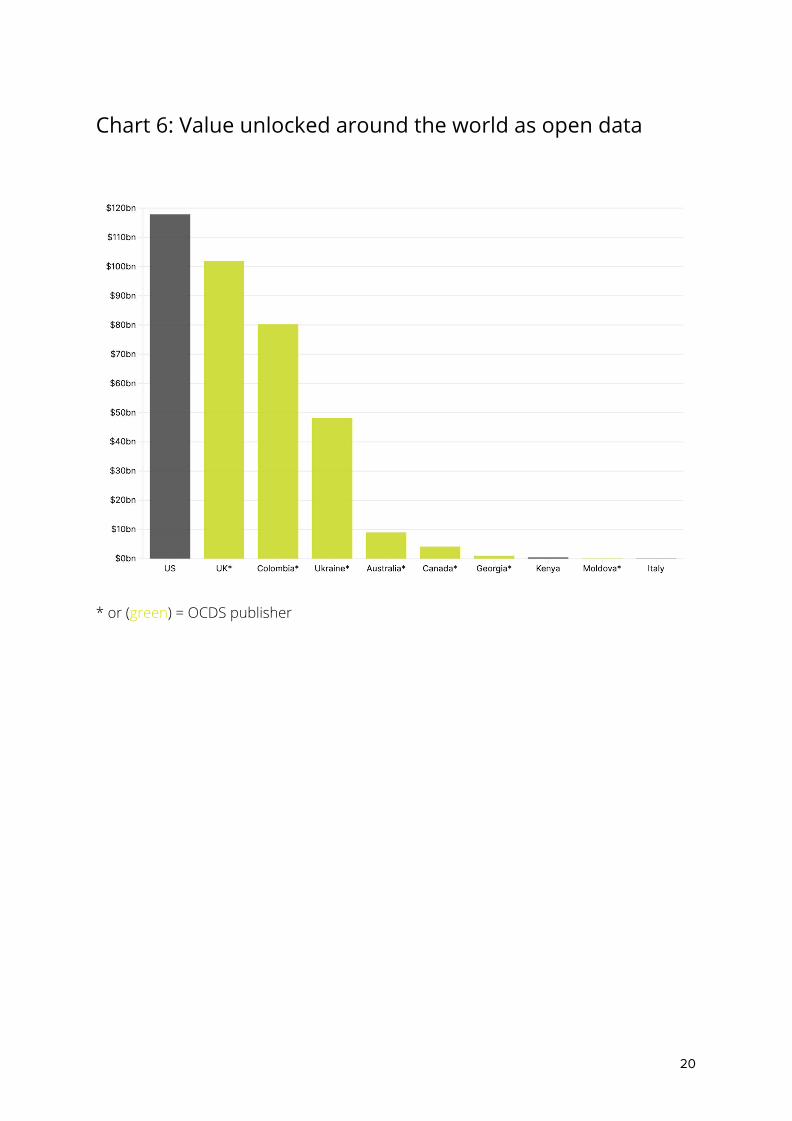
Chart 6: Value unlocked around the world as open data
* or (green) = OCDS publisher
20
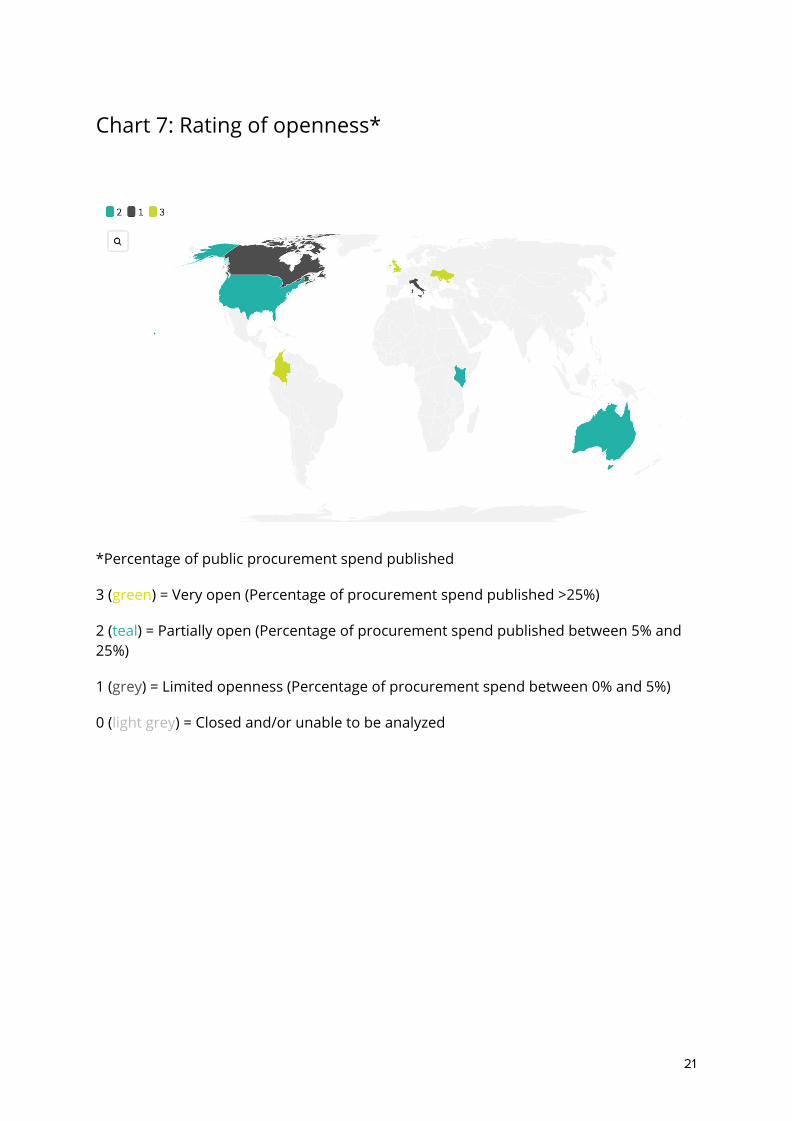
Chart 7: Rating of openness*
*Percentage of public procurement spend published
3 (green) = Very open (Percentage of procurement spend published >25%)
2 (teal) = Partially open (Percentage of procurement spend published between 5% and 25%)
1 (grey) = Limited openness (Percentage of procurement spend between 0% and 5%)
0 (light grey) = Closed and/or unable to be analyzed
21
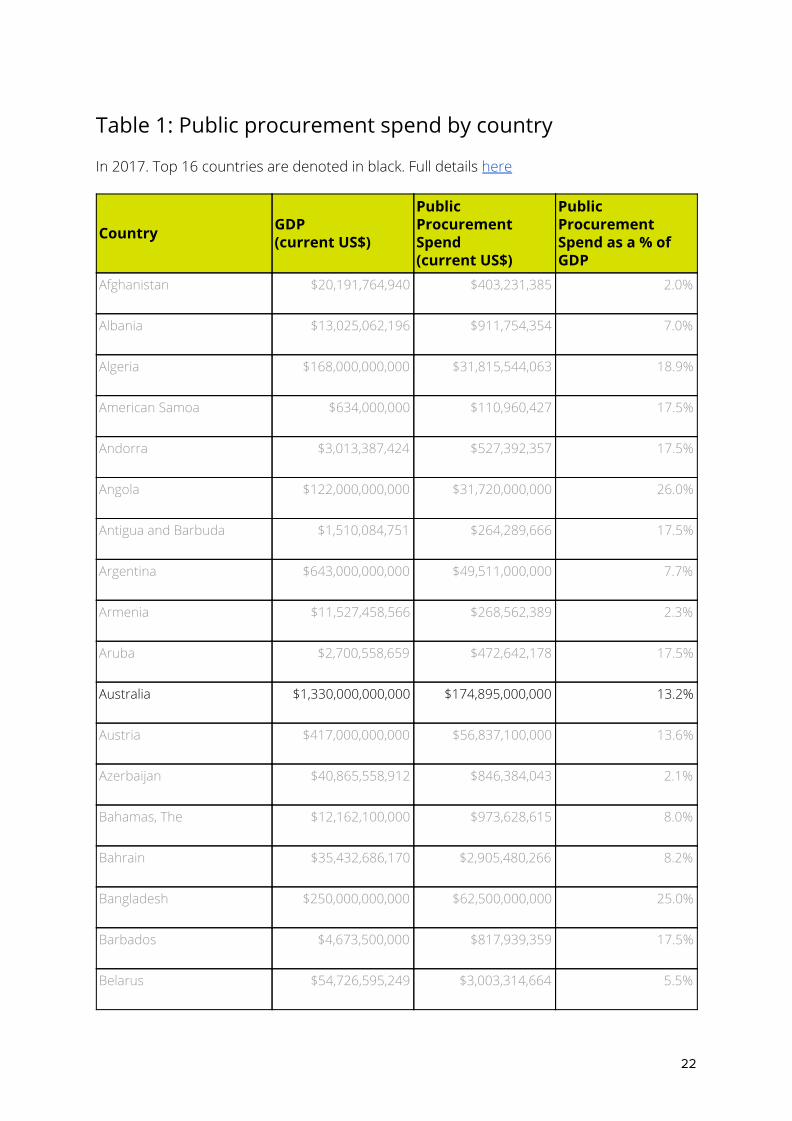
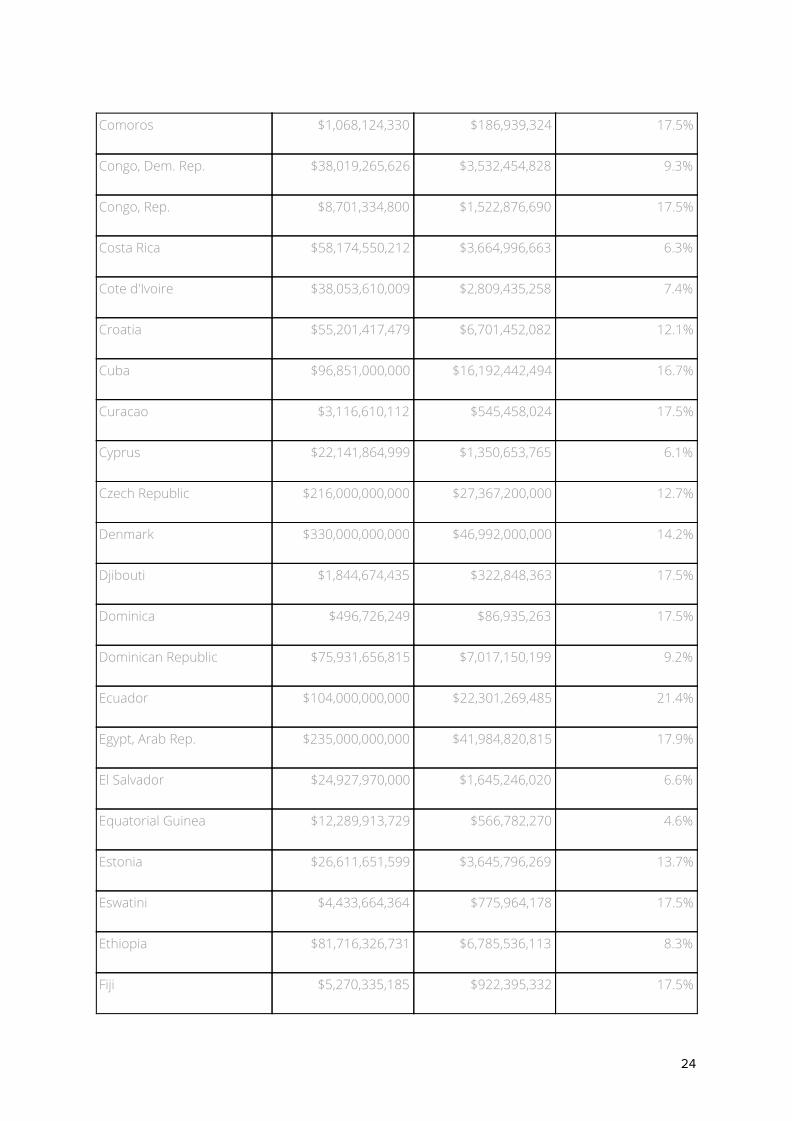
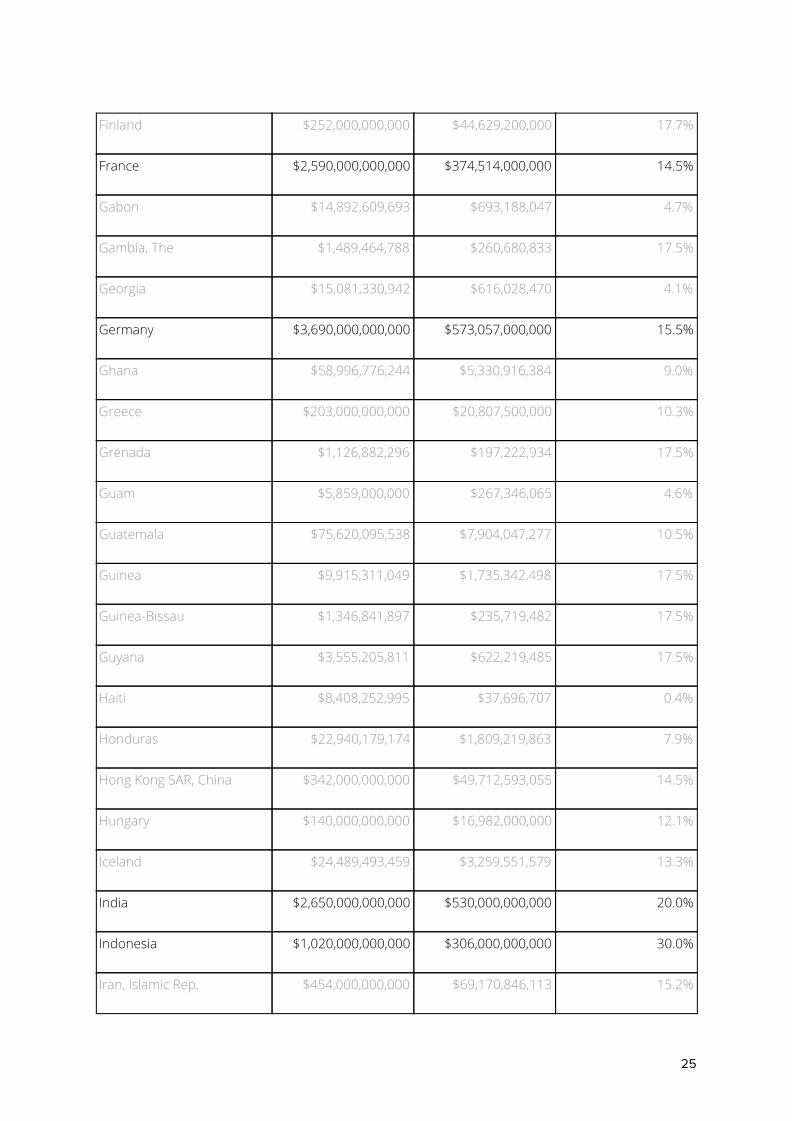
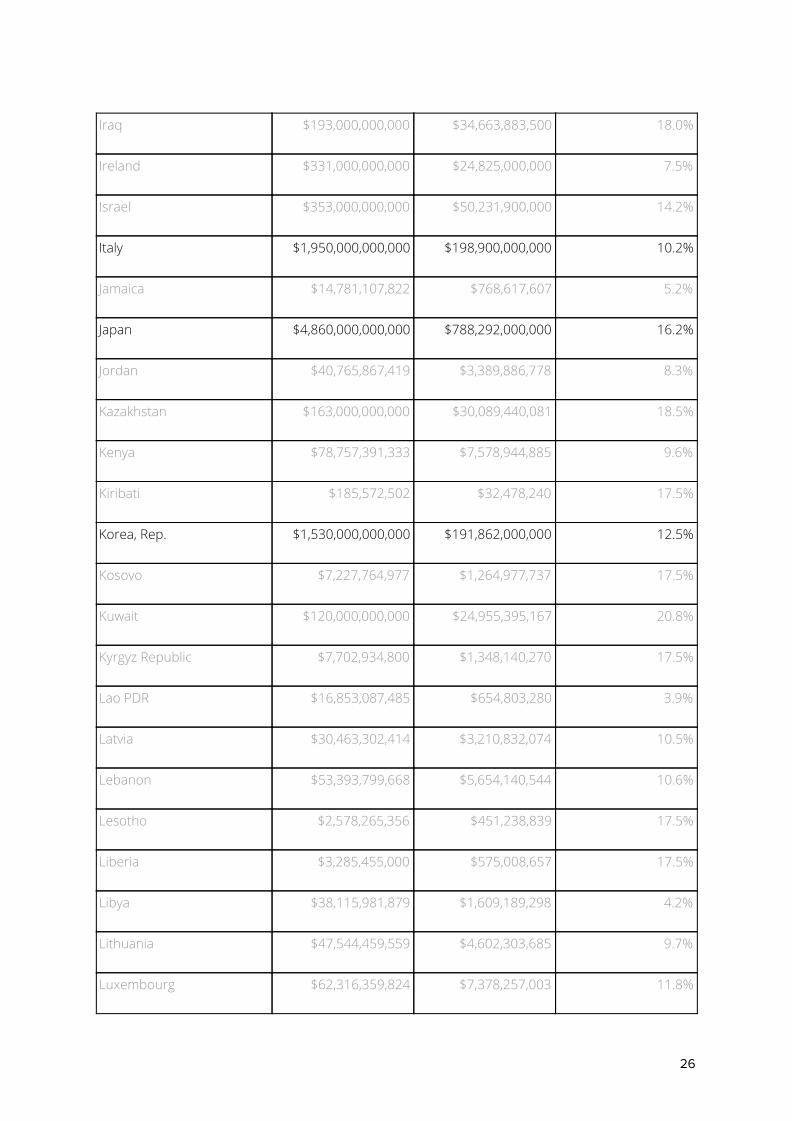
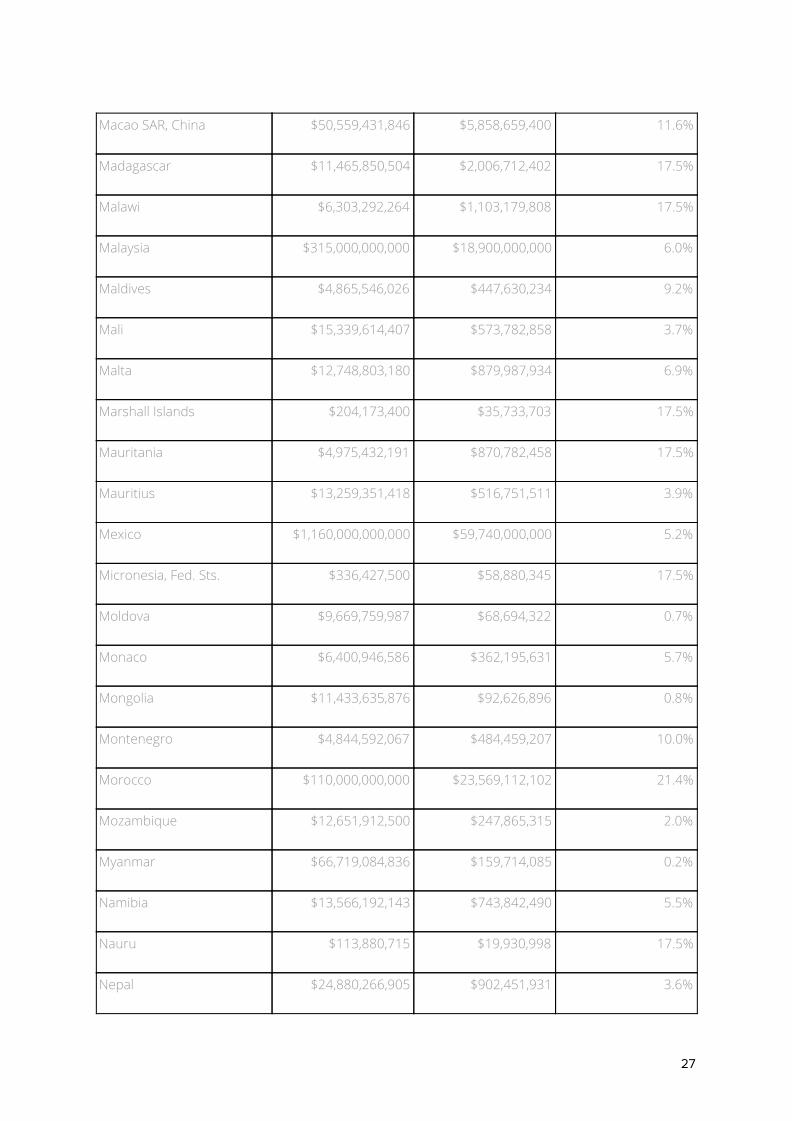
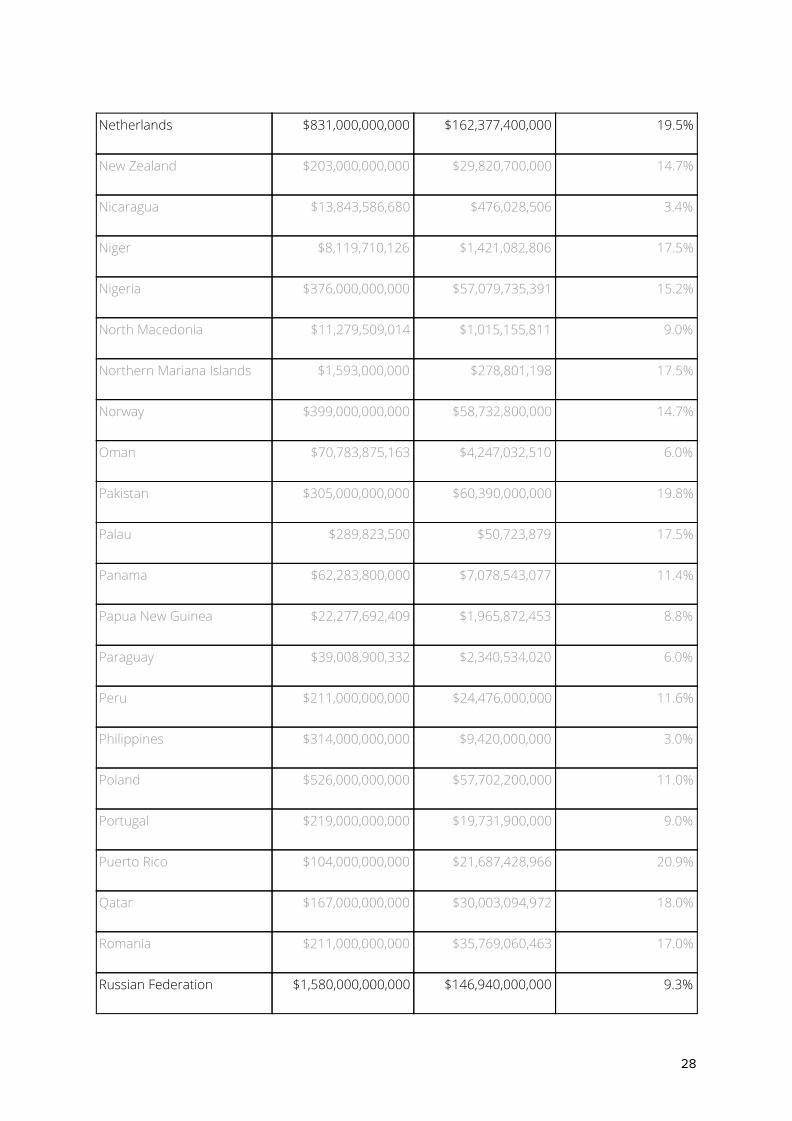
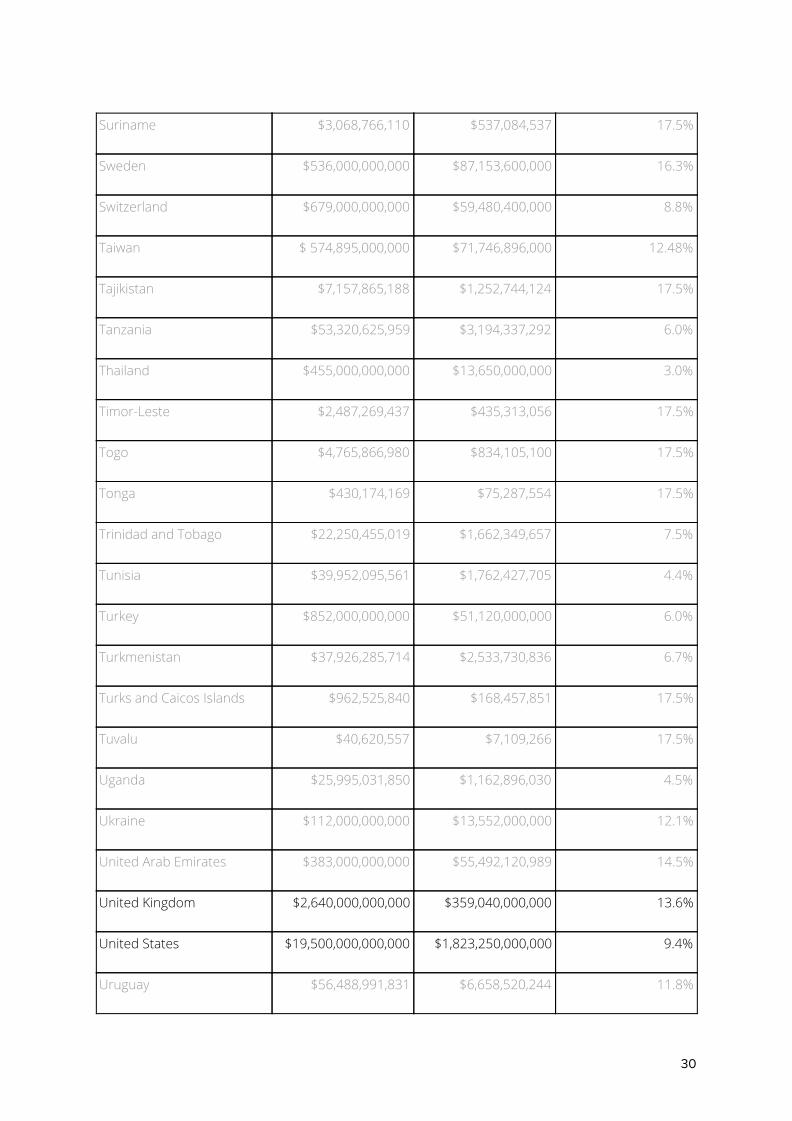
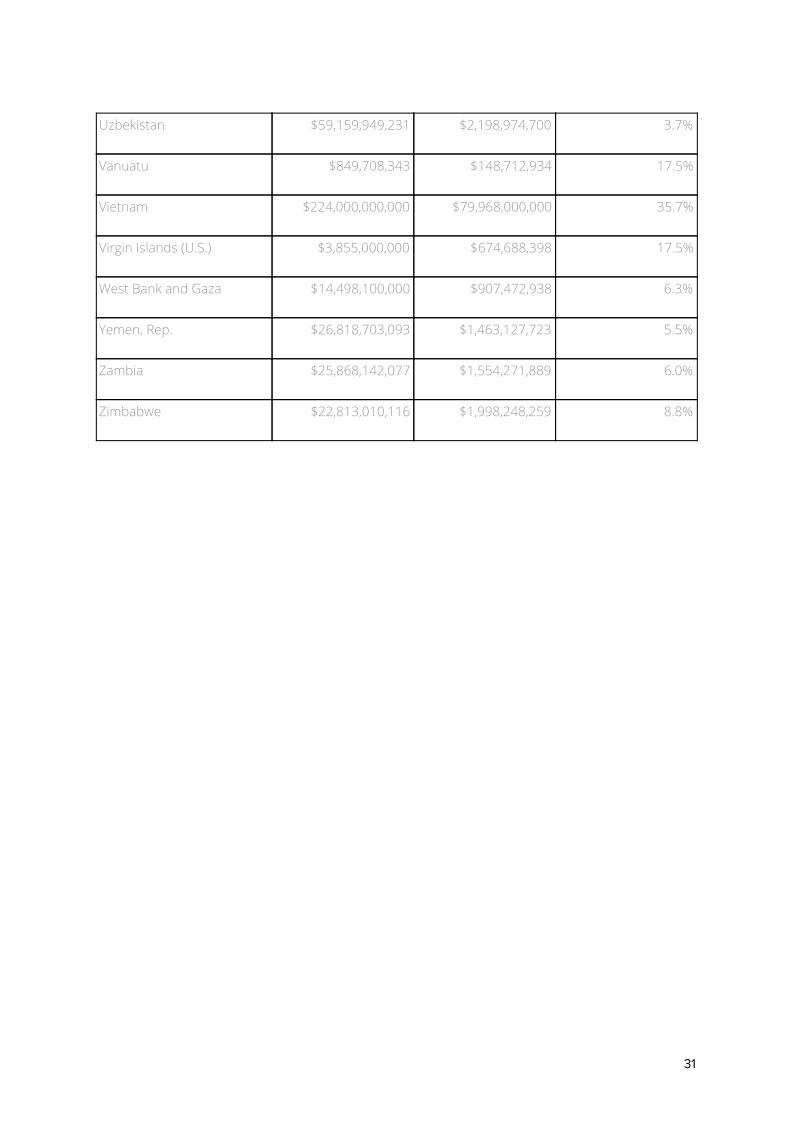
Table 1: Public procurement spend by country
In 2017. Top 16 countries are denoted in black. Full details here
Country GDP (current US$)
Public Procurement Spend (current US$)
Public Procurement Spend as a % of GDP
Afghanistan $20,191,764,940 $403,231,385 2.0%
Albania $13,025,062,196 $911,754,354 7.0%
Algeria $168,000,000,000 $31,815,544,063 18.9%
American Samoa $634,000,000 $110,960,427 17.5%
Andorra $3,013,387,424 $527,392,357 17.5%
Angola $122,000,000,000 $31,720,000,000 26.0%
Antigua and Barbuda $1,510,084,751 $264,289,666 17.5%
Argentina $643,000,000,000 $49,511,000,000 7.7%
Armenia $11,527,458,566 $268,562,389 2.3%
Aruba $2,700,558,659 $472,642,178 17.5%
Australia $1,330,000,000,000 $174,895,000,000 13.2%
Austria $417,000,000,000 $56,837,100,000 13.6%
Azerbaijan $40,865,558,912 $846,384,043 2.1%
Bahamas, The $12,162,100,000 $973,628,615 8.0%
Bahrain $35,432,686,170 $2,905,480,266 8.2%
Bangladesh $250,000,000,000 $62,500,000,000 25.0%
Barbados $4,673,500,000 $817,939,359 17.5%
Belarus $54,726,595,249 $3,003,314,664 5.5%
22

Belgium $495,000,000,000 $70,735,500,000 14.3%
Belize $1,862,614,800 $325,988,222 17.5%
Benin $9,246,696,924 $10,983,156 0.1%
Bhutan $2,528,007,911 $530,881,661 21.0%
Bolivia $37,508,642,258 $3,071,128,919 8.2%
Bosnia and Herzegovina $18,080,118,128 $865,329,183 4.8%
Botswana $17,406,565,823 $1,013,707,874 5.8%
Brazil $2,050,000,000,000 $168,100,000,000 8.2%
Brunei Darussalam $12,128,089,000 $154,697,857 1.3%
Bulgaria $58,220,973,783 $4,388,202,117 7.5%
Burkina Faso $12,322,864,245 $233,645,861 1.9%
Burundi $3,172,416,146 $555,224,998 17.5%
Cabo Verde $1,771,235,958 $309,995,422 17.5%
Cambodia $22,177,200,512 $1,093,954,954 4.9%
Cameroon $34,922,782,311 $2,400,513,286 6.9%
Canada $1,650,000,000,000 $221,595,000,000 13.4%
Cayman Islands $3,570,575,151 $624,909,372 17.5%
Central African Republic $2,167,501,640 $379,348,433 17.5%
Chad $9,975,692,095 $26,396,320 0.3%
Chile $278,000,000,000 $14,734,000,000 5.3%
China $12,100,000,000,000 $4,201,000,000,000 34.7%
Colombia $312,000,000,000 $41,745,600,000 13.4%
23
Comoros $1,068,124,330 $186,939,324 17.5%
Congo, Dem. Rep. $38,019,265,626 $3,532,454,828 9.3%
Congo, Rep. $8,701,334,800 $1,522,876,690 17.5%
Costa Rica $58,174,550,212 $3,664,996,663 6.3%
Cote d'Ivoire $38,053,610,009 $2,809,435,258 7.4%
Croatia $55,201,417,479 $6,701,452,082 12.1%
Cuba $96,851,000,000 $16,192,442,494 16.7%
Curacao $3,116,610,112 $545,458,024 17.5%
Cyprus $22,141,864,999 $1,350,653,765 6.1%
Czech Republic $216,000,000,000 $27,367,200,000 12.7%
Denmark $330,000,000,000 $46,992,000,000 14.2%
Djibouti $1,844,674,435 $322,848,363 17.5%
Dominica $496,726,249 $86,935,263 17.5%
Dominican Republic $75,931,656,815 $7,017,150,199 9.2%
Ecuador $104,000,000,000 $22,301,269,485 21.4%
Egypt, Arab Rep. $235,000,000,000 $41,984,820,815 17.9%
El Salvador $24,927,970,000 $1,645,246,020 6.6%
Equatorial Guinea $12,289,913,729 $566,782,270 4.6%
Estonia $26,611,651,599 $3,645,796,269 13.7%
Eswatini $4,433,664,364 $775,964,178 17.5%
Ethiopia $81,716,326,731 $6,785,536,113 8.3%
Fiji $5,270,335,185 $922,395,332 17.5%
24
Finland $252,000,000,000 $44,629,200,000 17.7%
France $2,590,000,000,000 $374,514,000,000 14.5%
Gabon $14,892,609,693 $693,188,047 4.7%
Gambia, The $1,489,464,788 $260,680,833 17.5%
Georgia $15,081,330,942 $616,028,470 4.1%
Germany $3,690,000,000,000 $573,057,000,000 15.5%
Ghana $58,996,776,244 $5,330,916,384 9.0%
Greece $203,000,000,000 $20,807,500,000 10.3%
Grenada $1,126,882,296 $197,222,934 17.5%
Guam $5,859,000,000 $267,346,065 4.6%
Guatemala $75,620,095,538 $7,904,047,277 10.5%
Guinea $9,915,311,049 $1,735,342,498 17.5%
Guinea-Bissau $1,346,841,897 $235,719,482 17.5%
Guyana $3,555,205,811 $622,219,485 17.5%
Haiti $8,408,252,995 $37,696,707 0.4%
Honduras $22,940,179,174 $1,809,219,863 7.9%
Hong Kong SAR, China $342,000,000,000 $49,712,593,055 14.5%
Hungary $140,000,000,000 $16,982,000,000 12.1%
Iceland $24,489,493,459 $3,259,551,579 13.3%
India $2,650,000,000,000 $530,000,000,000 20.0%
Indonesia $1,020,000,000,000 $306,000,000,000 30.0%
Iran, Islamic Rep. $454,000,000,000 $69,170,846,113 15.2%
25
Iraq $193,000,000,000 $34,663,883,500 18.0%
Ireland $331,000,000,000 $24,825,000,000 7.5%
Israel $353,000,000,000 $50,231,900,000 14.2%
Italy $1,950,000,000,000 $198,900,000,000 10.2%
Jamaica $14,781,107,822 $768,617,607 5.2%
Japan $4,860,000,000,000 $788,292,000,000 16.2%
Jordan $40,765,867,419 $3,389,886,778 8.3%
Kazakhstan $163,000,000,000 $30,089,440,081 18.5%
Kenya $78,757,391,333 $7,578,944,885 9.6%
Kiribati $185,572,502 $32,478,240 17.5%
Korea, Rep. $1,530,000,000,000 $191,862,000,000 12.5%
Kosovo $7,227,764,977 $1,264,977,737 17.5%
Kuwait $120,000,000,000 $24,955,395,167 20.8%
Kyrgyz Republic $7,702,934,800 $1,348,140,270 17.5%
Lao PDR $16,853,087,485 $654,803,280 3.9%
Latvia $30,463,302,414 $3,210,832,074 10.5%
Lebanon $53,393,799,668 $5,654,140,544 10.6%
Lesotho $2,578,265,356 $451,238,839 17.5%
Liberia $3,285,455,000 $575,008,657 17.5%
Libya $38,115,981,879 $1,609,189,298 4.2%
Lithuania $47,544,459,559 $4,602,303,685 9.7%
Luxembourg $62,316,359,824 $7,378,257,003 11.8%
26
Macao SAR, China $50,559,431,846 $5,858,659,400 11.6%
Madagascar $11,465,850,504 $2,006,712,402 17.5%
Malawi $6,303,292,264 $1,103,179,808 17.5%
Malaysia $315,000,000,000 $18,900,000,000 6.0%
Maldives $4,865,546,026 $447,630,234 9.2%
Mali $15,339,614,407 $573,782,858 3.7%
Malta $12,748,803,180 $879,987,934 6.9%
Marshall Islands $204,173,400 $35,733,703 17.5%
Mauritania $4,975,432,191 $870,782,458 17.5%
Mauritius $13,259,351,418 $516,751,511 3.9%
Mexico $1,160,000,000,000 $59,740,000,000 5.2%
Micronesia, Fed. Sts. $336,427,500 $58,880,345 17.5%
Moldova $9,669,759,987 $68,694,322 0.7%
Monaco $6,400,946,586 $362,195,631 5.7%
Mongolia $11,433,635,876 $92,626,896 0.8%
Montenegro $4,844,592,067 $484,459,207 10.0%
Morocco $110,000,000,000 $23,569,112,102 21.4%
Mozambique $12,651,912,500 $247,865,315 2.0%
Myanmar $66,719,084,836 $159,714,085 0.2%
Namibia $13,566,192,143 $743,842,490 5.5%
Nauru $113,880,715 $19,930,998 17.5%
Nepal $24,880,266,905 $902,451,931 3.6%
27
Netherlands $831,000,000,000 $162,377,400,000 19.5%
New Zealand $203,000,000,000 $29,820,700,000 14.7%
Nicaragua $13,843,586,680 $476,028,506 3.4%
Niger $8,119,710,126 $1,421,082,806 17.5%
Nigeria $376,000,000,000 $57,079,735,391 15.2%
North Macedonia $11,279,509,014 $1,015,155,811 9.0%
Northern Mariana Islands $1,593,000,000 $278,801,198 17.5%
Norway $399,000,000,000 $58,732,800,000 14.7%
Oman $70,783,875,163 $4,247,032,510 6.0%
Pakistan $305,000,000,000 $60,390,000,000 19.8%
Palau $289,823,500 $50,723,879 17.5%
Panama $62,283,800,000 $7,078,543,077 11.4%
Papua New Guinea $22,277,692,409 $1,965,872,453 8.8%
Paraguay $39,008,900,332 $2,340,534,020 6.0%
Peru $211,000,000,000 $24,476,000,000 11.6%
Philippines $314,000,000,000 $9,420,000,000 3.0%
Poland $526,000,000,000 $57,702,200,000 11.0%
Portugal $219,000,000,000 $19,731,900,000 9.0%
Puerto Rico $104,000,000,000 $21,687,428,966 20.9%
Qatar $167,000,000,000 $30,003,094,972 18.0%
Romania $211,000,000,000 $35,769,060,463 17.0%
Russian Federation $1,580,000,000,000 $146,940,000,000 9.3%
28

Rwanda $9,135,454,442 $20,415,511 0.2%
Samoa $841,538,413 $147,283,062 17.5%
San Marino $1,632,860,041 $285,777,361 17.5%
Sao Tome and Principe $375,040,174 $65,638,198 17.5%
Saudi Arabia $689,000,000,000 $95,132,117,694 13.8%
Senegal $21,081,669,870 $1,139,160,177 5.4%
Serbia $44,120,424,392 $3,529,633,951 8.0%
Seychelles $1,503,168,690 $263,079,241 17.5%
Sierra Leone $3,739,577,973 $654,487,645 17.5%
Singapore $338,000,000,000 $49,449,598,094 14.6%
Slovak Republic $95,617,670,260 $13,329,103,234 13.9%
Slovenia $48,455,919,386 $5,616,041,057 11.6%
Solomon Islands $1,321,131,091 $231,219,668 17.5%
Somalia $7,128,000,000 $489,441,935 6.9%
South Africa $349,000,000,000 $41,880,000,000 12.0%
Spain $1,310,000,000,000 $125,105,000,000 9.6%
Sri Lanka $88,019,706,804 $4,665,044,461 5.3%
St. Kitts and Nevis $992,007,403 $173,617,610 17.5%
St. Lucia $1,810,139,889 $316,804,250 17.5%
St. Vincent and the Grenadines $785,222,509 $137,426,853 17.5%
Sudan $123,000,000,000 $24,309,406,736 19.8%
29
Suriname $3,068,766,110 $537,084,537 17.5%
Sweden $536,000,000,000 $87,153,600,000 16.3%
Switzerland $679,000,000,000 $59,480,400,000 8.8%
Taiwan $ 574,895,000,000 $71,746,896,000 12.48%
Tajikistan $7,157,865,188 $1,252,744,124 17.5%
Tanzania $53,320,625,959 $3,194,337,292 6.0%
Thailand $455,000,000,000 $13,650,000,000 3.0%
Timor-Leste $2,487,269,437 $435,313,056 17.5%
Togo $4,765,866,980 $834,105,100 17.5%
Tonga $430,174,169 $75,287,554 17.5%
Trinidad and Tobago $22,250,455,019 $1,662,349,657 7.5%
Tunisia $39,952,095,561 $1,762,427,705 4.4%
Turkey $852,000,000,000 $51,120,000,000 6.0%
Turkmenistan $37,926,285,714 $2,533,730,836 6.7%
Turks and Caicos Islands $962,525,840 $168,457,851 17.5%
Tuvalu $40,620,557 $7,109,266 17.5%
Uganda $25,995,031,850 $1,162,896,030 4.5%
Ukraine $112,000,000,000 $13,552,000,000 12.1%
United Arab Emirates $383,000,000,000 $55,492,120,989 14.5%
United Kingdom $2,640,000,000,000 $359,040,000,000 13.6%
United States $19,500,000,000,000 $1,823,250,000,000 9.4%
Uruguay $56,488,991,831 $6,658,520,244 11.8%
30
Uzbekistan $59,159,949,231 $2,198,974,700 3.7%
Vanuatu $849,708,343 $148,712,934 17.5%
Vietnam $224,000,000,000 $79,968,000,000 35.7%
Virgin Islands (U.S.) $3,855,000,000 $674,688,398 17.5%
West Bank and Gaza $14,498,100,000 $907,472,938 6.3%
Yemen, Rep. $26,818,703,093 $1,463,127,723 5.5%
Zambia $25,868,142,077 $1,554,271,889 6.0%
Zimbabwe $22,813,010,116 $1,998,248,259 8.8%
31
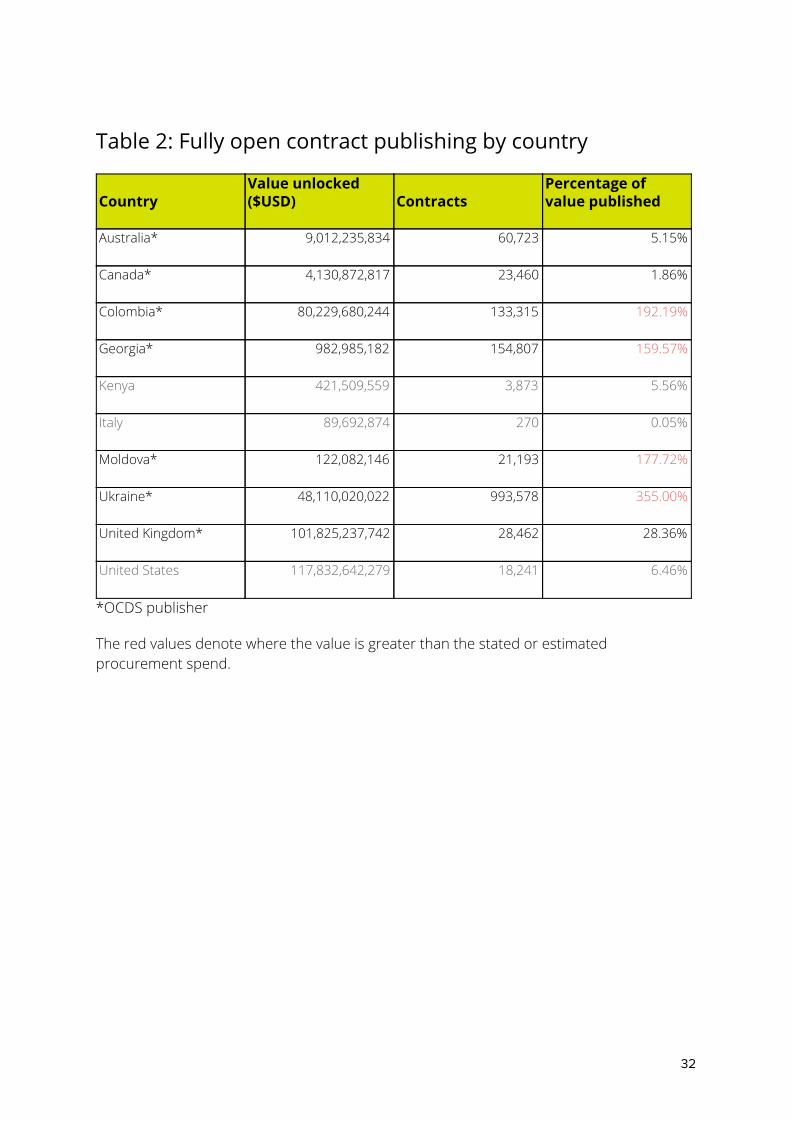
Table 2: Fully open contract publishing by country
Country
Value unlocked ($USD)
Contracts
Percentage of value published
Australia*
9,012,235,834
60,723
5.15%
Canada*
4,130,872,817
23,460
1.86%
Colombia*
80,229,680,244
133,315
192.19%
Georgia*
982,985,182
154,807
159.57%
Kenya
421,509,559
3,873
5.56%
Italy
89,692,874
270
0.05%
Moldova*
122,082,146
21,193
177.72%
Ukraine*
48,110,020,022
993,578
355.00%
United Kingdom*
101,825,237,742
28,462
28.36%
United States
117,832,642,279
18,241
6.46%
*OCDS publisher
The red values denote where the value is greater than the stated or estimated procurement spend.
32
About About Spend Network Spend Network is a team with a big goal: to collect every public tender and contract in the world and make it freely and openly available to everyone via OpenOpps.com. Procurement often has access to valuable data, but frequently fails to use the data to deliver better outcomes, both for suppliers and buyers. We exist to use data to improve a market valued at trillions of dollars a year. Our analysis can help governments increase exports, predict poor performance, spot bad tendering and find new savings. We can monitor market efficiency and look for new suppliers to increase competition. Modern statistical analysis has already transformed finance, sport and agriculture; we believe it is time for procurement to catch up, to gather better data and use it to deliver better services and better value for its citizens.
About the Open Contracting Partnership The Open Contracting Partnership is a silo-busting collaboration across governments, businesses, civil society, and technologists to open up and transform government contracting worldwide. We bring open data and open government together to ensure public money is spent openly, fairly and effectively. We focus on public contracts as they are the single biggest item of spending by most governments. They are a government’s number one corruption risk and they are vital to ensuring citizens get the services that they deserve. Spun out of the World Bank in 2015, the Open Contracting Partnership is now an independent not-for-profit working in over 50 countries. We drive massively improved value for money, public integrity and service delivery by shifting public contracting from closed processes and masses of paperwork to digital services that are fair, efficient and ‘open-by-design’. Contact: [email protected] | www.open-contracting.org | @opencontracting Open Contracting Partnership 2020. This work by the Open Contracting Partnership, unless otherwise noted, is licensed under a Creative Commons Attribution 4.0 International License.
33

34