Embed Size (px)
Citation preview

1
HOW GOOD IS MERTON MODEL AT ASSESSING CREDIT RISK?
EVIDENCE FROM INDIA
Amit Kulkarni
Alok Kumar Mishra
Jigisha Thakker
This paper models the default probabilities and credit spreads for select Indian firms in
the Black-Scholes-Merton framework. Counter to previous research, we show that the
objective (or ‘real’) probability estimates are higher than the risk-neutral estimates over
the sample period. However, the probability measure is found to be robust to the ‘default
trigger point’. The model output also compares favorably with the default rate reported
by CRISIL’s Average 1-year rating transitions as well as the Altman Z-score measure.
However it does not generate spreads as high as those observed in the corporate bond
market. Perhaps not surprisingly, this is consistent with the received literature on credit
spreads.
Keywords: Merton Model, Probability of Default, Credit Spreads
JEL classification codes: G130, G330
------------------------------------------------------------------------------------------------------------
The authors are faculty members at National Institute of Bank Management,Pune – 411 048, India. Tel.: (0091)(20) 26833080Email for communication: [email protected]

2
INDEX:
Particulars Page No.
Introduction 3 - 7
The Model 8 – 16
Literature Review 17 – 20
Sample Period & Dataset 21 – 23
Results 24 – 30
Concluding Remarks 31 – 32
Appendix (A) : Tables 33 – 40
Appendix (B) : Charts 41 – 46
References 47 - 49

3
Introduction:
Credit risk modelling is deemed to be the cornerstone of the Basel II Accord.
This is rightly so because bank’s economic capital requirement is directly a function of
the risk inherent in the credit portfolio. One of the guiding principles of the new Accord
is that the size of the required capital should be contingent on counterparty credit risk
instead of being constant per credit type as under the Basel I Accord. This fact has
induced banks and other financial institutions to invest sizeable resources in assessing
their credit risk exposures.
Credit risk modelling entails a theoretical framework that describes the
causality between the attributes of the borrowing entity (a corporation) and its potential
bankruptcy. The approach which has particularly gained prominence in credit risk
literature is the Contingent Claims Approach. It was proposed by Robert Merton (1974)
in his seminal paper on the valuation of corporate debt. Largely as a logical extension of
the Black-Scholes (1973) option pricing framework, he conceived a model for assessing
the credit risk of a firm by characterizing the firm’s equity as a call option on its assets.
Alternatively, the debtholders of the firm could be viewed as holding a short put position
on the firm’s assets. Merton’s approach is referred to as the ‘structural approach’
because it relies entirely upon the capital structure of the firm (viz, debt and equity) for
modelling credit risk. It builds a setup within which credit events are triggered by
movements of the firm’s value relative to some pre-defined threshold or barrier.
Consequently, a major issue within this framework is the modelling of the evolution of
the firm’s value and capital structure.

4
The model assumes that a company has equity and certain amount of zero-
coupon debt that will become due at a future time T 1. The equity receives no dividend.
Although Merton model is an ingenious application of the classical option pricing theory,
its performance in predicting defaults (or credit rating changes) depends on how realistic
its assumptions are. The model is a somewhat stylized structural model that requires a
number of simplifying assumptions. Following limitations would undermine the model
efficiency;
(a)The assumption that the firm can default only at time T and not before2 . If the firm’s
value falls down to minimal levels before the maturity of the debt but it is able to recover
and meet the debt’s payment at maturity, the default would be avoided in Merton’s
approach.
(b) Firm’s asset values follow log-normal distribution
(c) Default probability for private firms (not listed on the stock exchange) can be
estimated only by performing some comparability analysis based on accounting data3.
(d) The model does not distinguish among different types of debt according to their
seniority, collaterals, covenants or convertibility
(e) It is “static” in that the model assumes that once management puts a debt structure in
place, it leaves it unchanged even if the firms assets have increased. As a result, the
model cannot capture the behavior of those firms that seek to maintain a constant or
target leverage ratio across time.
(f) The model implies a ‘shrink’ in the default probability and credit spreads as the debt
approaches maturity. Indeed, the implication of the model is that, with perfect
information, the credit spread at the very short end should be near zero. In general,

5
however, observable short-term credit spreads are non-zero. The model predicts default
with increasing precision as the maturity of the debt comes near. As a result, in this
approach default does not come as a surprise, which makes the models generate very low
short-term credit spreads. However, with asymmetric information, yield spreads are
strictly positive at zero maturity because investors are uncertain about the nearness of the
assets to the trigger level at which the firm would declare default.
(g) Another potential shortcoming of the option based approach is that the stock market
may not efficiently incorporate all publicly-available information about default
probability into equity prices. In particular, prior studies suggest that the market does not
accurately reflect all of the information in the financial statements (Sloan, 1996).
Furthermore, equity market volatility need not always bear credit risk implications (noise
trading).
(h) The assumption of a constant and flat term structure of interest rates is other major
criticism the model has received.
-----------------------------------------------------------------------------------------------------------1 Credit risk models routinely assume one-year time horizon for debt maturity andsubsequent estimation of default probability. One year is perceived as being of sufficientlength for a bank to raise additional capital on account of increase in portfolio credit risk(if any). Furthermore, implicit in the regulatory approach to capital requirements is anassumption that if large losses (short of insolvency) are experienced during the analysisperiod, a bank will take actions such that its probability of remaining solvent during thefollowing period will remain high. Such actions include raising new equity to replace thatwhich has been lost or rebalancing to a safer portfolio such that the remaining equity isadequate to preserve solvency with the specified probability. For bank loan portfolios,substantial rebalancing is usually difficult to accomplish quickly, especially during theperiods of general economic distress that are typically associated with large losses. Thus,unless a bank is able to raise new equity by the end of the analysis period, it will beginthe next period with a larger-than-desired probability of insolvency. The one-yearconvention may have arisen largely because, until recently, default rates and ratingtransition matrices were most easily available at a one-year horizon, and such data arekey inputs to conventional portfolio credit risk models. However, Carey (2000) contendsthat this time horizon is too short.

6
All things considered, these limitations should not prompt us to belittle the substance of
Merton model; the model is being extensively used by Moodyskmv4, S&P and other
credit rating agencies worldwide for assessing the default probability of borrowing firms.
The main advantage in employing option-pricing models in bankruptcy prediction is that
they provide guidance about the theoretical determinants of bankruptcy risk and they
supply the necessary structure to extract bankruptcy-related information from market
prices.
The received literature on empirical assessment of contingent claims
approach has mainly been located in the context of developed economies. In this paper,
we intend to fill this lacuna by employing the balance sheet and market data of select
Indian corporates for modelling credit risk. Varma and Raghunathan (2000) did assess
the credit risk from Indian perspective; however we depart from them with respect to the
problem being studied and the methodology employed for analysis. Subsequent sections
delve further into this issue.
-----------------------------------------------------------------------------------------------------------2 Bankruptcy can only occur at time T because BSM assumes that the firm holds onlyzero-coupon debt maturing at time T. Subsequent studies have incorporated more realisticassumptions, such as allowing for debt covenants (e.g., Black and Cox, 1976) andmultiple classes of debt (e.g., Geske, 1977).
3 Credit rating agencies have developed models that estimate empirical EDF scores forprivate firms
4KMV is a trademark of KMV Corporation. Stephen Kealhofer, John McQuown andOldrich Vasicek founded KMV Corporation in 1989. On February 11, 2002, Moody’sannounced that it was acquiring KMV for more than $200 million in cash.

7
In the present study, we propose to test the relevance and validity of contingent claims
approach as applied to Indian corporates. A-priori, the default probability and credit
spreads are expected to widen as a firm gradually gets into bankruptcy mode.
Furthermore, assuming that credit rating agencies are privy to inside information on
companies getting rated, one may assume that it is impossible for a firm to experience a
change in its default probability without also experiencing a rating change. We also
propose to make some tentative comments in this direction. In case the results hold for
the subset of companies shortlisted for the study, the model can very well be applied
across a wide spectrum of companies representing various other sectors. This is
particularly important in light of the Reserve Bank of India’s stated objective to gradually
move Indian banks towards adoption of Internal Ratings Based Approach. We also
compare the performance of the Merton model to that of other popular alternatives like
agency ratings and Z-Scores.
The layout of the paper is as follows; Section 2 sets out the model specification,
Section 3 provides a brief survey of the empirical literature on estimation and analysis of
default probability and credit spreads, data details are presented in Section 4, Section 5
reports the results and Section 6 concludes.

8
2) The Model:
The Merton model generates the probability of default for each firm in the
sample at any given point in time. To calculate the probability, the model subtracts the
face value of the firm’s existing debt from an estimate of the future market value of the
firm and then divides this difference by an estimate of the volatility of the firm (scaled to
reflect the horizon of the forecast). The resulting score, which is referred to as the
distance to default, is then substituted into a cumulative density function to calculate the
probability that the value of the firm will be less than the face value of debt at the
forecasting horizon. The market value of the firm is simply the sum of the market value
of the firm’s debt and the value of its equity. If both these quantities were readily
observable, calculating default probabilities would be trivial. While equity values are
readily available, reliable data on the market value of debt is generally unavailable. The
Merton model makes two particularly important assumptions. The first is that the total
value of a firm is assumed to follow geometric Brownian motion,
VdZVdtdV σµ += .……..(1)
where V is the total value of the firm, µ is the expected continuously compounded return
on V (i.e., the asset drift) , is the volatility of firm value and dZ is a standard Weiner
process. The incremental changes in ln V follow a generalized Wiener process with drift
2/2σµ −
d
−≈ TTVT σ
σµφ ,)
2(ln
2
……..(2)
Since the logarithm of VT is normal, VT is log normally distributed.

9
The value of the firm’s assets at time T is given by,
+−= TT ZTTVV σ
σµ )
2(exp
2
0 .……..(3)
The basic feature of Merton’s model is that the firm’s value drifts upwards over time (at
the risk-free rate in the risk-neutral world of option pricing) and so its leverage falls. The
second critical assumption of the Merton model is that the firm has issued just one
discount bond maturing at time T. The company defaults if the value of its assets is less
than the promised debt repayment at time T. The equity of the company is a European
call option on the assets of the company with maturity T and a strike price equal to the
face value of the debt. The model can be used to estimate the risk-neutral probability that
the company will default as well as the credit spread on the debt5. As inputs, Merton's
model requires the current value of the company's assets, the volatility of the company’s
assets, the outstanding debt, and the debt maturity. In order to make the model
analytically tractable, one has to estimate the current value and volatility of the
company’s assets from the market value of the company’s equity and the equity’s
instantaneous volatility. A debt maturity date is chosen and debt payments are mapped
into a single payment on the debt maturity date in some way. The rest of the implicit
assumptions are the absence of transaction costs, bankruptcy costs, taxes or problems
with indivisibilities of assets, continuous time trading; unrestricted borrowing and
------------------------------------------------------------------------------------------------------------5A number of authors such as Black and Cox (1976), Geske (1977), Longstaff andSchwartz (1995), Leland and Toft (1996), and Collin-Dufresne and Goldstein (2001)have developed interesting extensions of Merton's model, but none has emerged asclearly superior. See Eom et al (2003) which compares the performance of alternativemodels using bond spreads. Gemmill (2002) shows that Merton’s model works well inthe particular case where zero-coupon bonds are used for funding.

10
lending at a constant interest rate r, no restrictions on the short selling of the assets and
few more.
Define E as the value of the firm’s equity and V as the value of its assets as of
today (t=0). Let ET and VT be their values at time T when the debt with face value of F
matures. More formally, the value of equity at time T in the Merton framework is given
by:
),0max( FVE TT −= ……..(4)
In accordance with the option pricing theory, the value of equity can be found from the
following partial differential equation,
02/1 2
222 =−
∂∂
+∂∂
+∂∂ rE
VEV
VErV
tE
σ ……..(5)
subject to the following boundary condition,
)0,(max FVE TT −= ....…...(6)
Symbolically, the Merton model stipulates that the equity value of a firm satisfies the
following equation within risk neutral framework,
)()( 21 dNFedVNE rT−−= ...…….(7)
where r is the instantaneous risk-free rate and N(·) is the cumulative standard normal
distribution function, d1 is given by
T
TrFV
dσ
σ )2
()ln(2
1
++= .……..(8)
Tdd σ−= 12 ..…….(9)
Equation (7) will hold irrespective of equity holders exercising their call option on or
before the maturity date T; the reason being the proposition from the option pricing

11
theory that early exercise of call option is suboptimal. Consequently, the price of a call
option is the same no matter whether it is European or American.
At time zero, Default probability
= )Pr( FVT ≤ ……..(10)
)ln)2/1(Pr(ln 2
0 FZTTrV T ≤+−+= σσ ...…….(11)
≥
−+−= TZ
TTrFV
σ
σ )2/1()/ln(Pr
2
0 .…….(12)
Under the risk-neutral probability measure, the default probability is given by,
−+−=− )
)2
()ln(()(
2
2 T
TrFV
NdNσ
σ
..……(13)
The “probabilities” in the Merton formula do not represent the actual probability of being
above or below the strike price at expiration. Since the underlying asset is risky, it does
not actually drift at the risk free rate. If we replace the risk free interest rate, r, in equation
(13) with the expected return on the asset value or the ’drift’ of the asset value, µ , we get
the default probability of the firm under an objective probability measure:
−+−=− )
)2
()ln(()(
2
^
2 T
TFV
NdNσ
σµ
.……..(14)
As shown in Deliandes and Geske (2003), risk neutral default probabilities serve as an
upper bound to objective default probabilities. Although the objective and risk neutral
distributions of the firm’s value have the same diffusion terms (i.e. variance), however,
the objective distribution must generally have a mean greater than the risk free rate (the
drift is generally higher than the risk free rate of return), it follows that the risk neutral

12
distribution implies a higher default probability. However, it is well known that expected
returns on equities are estimated with significant error. Because risk neutral probabilities
of default can be calculated without estimating the firm’s expected return, they may be
more accurately estimated than objective default probabilities.
Equation (7) includes two unknowns in the form of V and volatility of V, i.e., . In order
to identify two unknowns with two equations, the model invokes the Weiner process to
model equity value, i.e., E,
EdzEdtdE EE σµ += …….(15)
where µE is the expected continuously compounded return on E , E is the volatility of
equity value and dZ is a standard Weiner process. By Ito’s lemma, we can also represent
the process for equity as6:
VdZVEdtV
VE
tEV
VEdE σσµ
∂∂
+
∂∂
+∂∂
+∂∂
= 22
2
2
2/1 .……..(16)
where,
0)( 1 >=∂∂
=∆ dNVEaEquityDelt E ..........(17)
0)( 1
2
2
>=∂∂
=ΓTV
dnV
EaEquityGamm E
σ ..........(18)
0)(2
)(2
1
><−−=∂∂
= − dNrDeT
dVntEaEquityThet rTE σ
θ ..........(19)
------------------------------------------------------------------------------------------------------------6Farmen, Westgaard et al (2003) show how a risk neutral default probability can betransformed into an objective probability.

13
Since the diffusion terms in the equity process in (15) and (16) are equal,
we can write,
)( 1dVNVEVEE σσσ =
∂∂
= .……..(20)
Equations (7) & (20) complete the system of two simultaneous nonlinear equations with
two unknowns which can very well be solved in Microsoft Excel using Solver routine7.
Similarly, we can compare the drift terms of equations (10) and (12) and solve for the
asset drift µ,
2
222
21
VEV
VEV
tEEE ∂
∂+
∂∂
+∂∂
= σµµ ..........(21)
EEE
E VVE Γ+∆+= 22
21
σµθµ ...........(22)
E
EE
E
V
VE
∆
Γ−−=⇒
22
21
σθµµ ...........(23)
The approach followed here assumes that the drift of equity or expected return of equity
µE can be estimated from the stock market price data. In order to estimate µE, we may
employ a pricing model such as the CAPM. Having found V, and µ, we can now
calculate the objective probability of default using (14)8.
----------------------------------------------------------------------------------------------------------------------------------------------------------------
7To solve two nonlinear equations of the form F(x,y)=0 and G(x,y)=0, we can use theSolver routine in Microsoft Excel to find the values of x and y that minimize[F(x,y)]2+[G(x,y)]2 (Hull, 2003). Also refer Benos and Papanastasopoulos (2005) forsimilar application of the same algorithm.
8Crouhy, Galai, Mark (2000) show that risk neutral default probabilities serve as an upperbound to objective default probabilities if and only if asset drift µ is greater than the riskfree rate r.

14
At this stage, we need to point out that there are certain aspects which differentiate the
Merton model which we test from that being actually employed by Moody’s KMV. One
important difference is that Moody’s KMV uses a proprietary model that they call the VK
model. Apparently the VK model is a generalization of the Merton model that currently
incorporates five classes of liabilities; short-term, long-term, convertible, preferred
equity, and common equity. Another difference is that we use the cumulative normal
distribution to convert distances to default into default probabilities. Moody’s KMV uses
its large historical database to estimate the empirical distribution of distances to default
and it calculates default probabilities based on that distribution. Finally, KMV may also
make proprietary adjustments to the accounting information that they use to calculate the
face value of debt. We cannot perfectly replicate the methods of Moody’s KMV because
several of the modelling choices made by Moody’s KMV are proprietary information,
and subscribing to their database is prohibitively expensive for us9.
The market value of a firm comprises of the market value of equity and market
value of debt. It can be represented as,
V = E + D .........(24)
Hence, D = V E (as a European Call)
= V - [ VN(d1) Fe-rTN(d2) ]
= VN(-d1) + Fe-rTN(d2) ……..(25)
-----------------------------------------------------------------------------------------------------------9Sobehart,Keenan and Stein (2000) report that the Merton model performs almost as wellas the Moody’s model in the case of extremely poor quality firms. However, the Moody’sKMV model clearly performs better beyond 10% of the population and is much better atdiscriminating defaults in the middle ranges of credit.

15
or alternatively,
D = Fe-rT European Put
= Fe-rT [-VN(-d1) + Fe-rTN(-d2)]
= VN(-d1) + Fe-rTN(d2) ...…...(26)
Thus, the market value of debt can be represented as a portfolio comprising of money lent
at a risk free rate and a short put option. It is common in dealing with bonds to discuss
them in terms of yields rather than prices. The yield to maturity, y, of a corporate zero-
coupon bond in continuous-time finance is a solution to,
yTFeD −= ………(27)
The yield for the bond today (t=0) maturing at time T , y(T), is simply,
TFDTy )/ln()( −= .……..(28)
Define F´ as the present value (discounted at riskfree rate) at time zero of the promised
debt F maturing at time T.
rTFeF −=′ .……..(29)
and let L = F´/ V be a measure of leverage, termed as Quasi-Debt ratio.
The yield to maturity on the debt becomes,
TyryT eFFeD )( −− ′== ………(30)
Substituting this into equation (26) and using the Quasi-Debt ratio gives the credit spread
as,
TLdNdN
ry]/)()(ln[ 12 −+
−=− ………(31)

16
The expression for credit spread shows that the credit spread is an increasing function of
the Quasi-Debt ratio and of the volatility of the firm’s asset values. As is the case with
option pricing, the asset drift µ has no impact on the credit spread. Empirical studies of
credit spreads using structural models are quite rare. They are complicated by the
following features: (i) companies have more than one issue of debt; (ii) the debt is
coupon-paying; (iii) there are call features and sinking funds; and (iv) the firm value must
be known in order to find its volatility, yet at the same time the volatility affects the value
of the debt and hence the firm value (v) the presence of liquidity premium, transaction
costs and taxes. In particular the need to exclude companies which do not have very
simple capital structures has led to small samples of bonds being available for testing the
models. One basic feature of Merton model is that the firm’s value drifts upwards over
time (at the risk-free rate in the risk-neutral world of option pricing) and so its leverage
falls. Hence, the resulting profile for the term-structure of credit spreads generated by the
model is downward-sloping , because of the implicit fall in leverage of the firm over
time.

17
3) Literature Review:
Over the past several years, number of researchers have examined the
contribution of the Merton model. The first authors to examine the model carefully were
practitioners employed by either KMV or Moody’s. Crosbie and Bohn (2003) summarize
KMV’s default probability model. Several papers addressing the accuracy of the KMV-
Merton model are available on the internet10. Stein (2002) argues that KMV-Merton
models can easily be improved upon. Other papers, including Bohn, Arora and Korablev
(2005), argued that KMV-Merton models capture all of the information in traditional
agency ratings and well known accounting variables. Both Hillegeist, Keating, Cram and
Lundstedt (2004) and Du and Suo (2004) examine the model’s predictive power. Duffie
and Wang (2004) show that KMV-Merton probabilities have significant predictive
power in a model of default probabilties over time, which can generate a term structure of
default probabilities. Farmen, Westgaard et al (2003) investigate the default probabilities
and their comparative statics (default Greeks) in the Merton framework using the
objective or ’real’ probability measure.
Bohn (2000) surveys some of the main theoretical models of risky debt
valuation that built on Merton (1974) and Black and Cox (1976). Empirical evidence has
suggested that the actual credit spreads are higher than model spreads. Jones, Mason, and
Rosenfeld (1983) and Frank and Torous (1989) find that contingent-claim models yield
theoretical credit spreads much lower than actual credit spreads. In the same year, Sarig
and Warga (1989) estimate the term structure of credit spreads and show it to be
---------------------------------------------------------------------------------------------------------------------------------------------------------------
10 The website www.defaultrisk.com has an enormous collection of research papers oncredit risk modelling.

18
consistent with contingent claim model predictions. A more recent study by Wei and Guo
(1997) tests the models of Merton (1974) and Longstaff and Schwartz (1995) and finds
the Merton model to be empirically superior. However, Gemmill(2002) employs zero
coupon corporate bonds data and concludes that model and market spreads are on
average of similar magnitude. Similar to previous research, market spreads are high
(relative to model spreads) for bonds which have low risk and for bonds which are near to
maturity. Longstaff and Schwartz (1995) argue that an additional element in the spread is
the expectation that equity holders and other junior claimants receive in the bankruptcy
settlement more than what is consistent with absolute Priority rule. In addition, Anderson
and Sundaresan (1996) suggest that debt holders are forced to accept concessions to
receive less than the originally agreed amount, prior to formal bankruptcy proceedings.
Mella-Barral and Perraudin (1997) incorporate this strategic debt service into an option
pricing-based model and show that the spread widening impact can be significant. The
upshot of the study is that the simple structural models (eg. Merton,Geske) forecast
spreads which are smaller than market spreads, particularly for companies which have
low leverage and low volatility, but the more complicated structural models which
produce larger spreads (eg. Longstaff/Schwartz and Leland/Toft) also produce large
errors. Another finding is that whether a model allows for stochastic interest rates or not
does not make much difference.
In the Indian context, credit risk modelling has been attempted based on
corporate bond ratings. Varma and Raghunathan (2000) analyze credit rating migrations
in Indian corporate bond market to bring about greater understanding of its credit risk.
Their dataset comprises of the ratings of debentures of manufacturing companies by the

19
Credit Rating and Information Services of India Limited (CRISIL). CRISIL is India’s
largest and oldest credit rating agency. The ratings were collected from CRISIL’s Rating
Scan for 24 quarters from January 1993 to October 1998. Darbha, Roy, Pavaskar (2003)
employ Nelson-Siegel formulation to incorporate the impact of shifts in the sovereign
term structure and equity index movements into the credit spread estimates. Their model
compares favorably with similar estimates of corporate term structures for developed
countries. Bose and Coondoo (2003) produce estimates of yields to maturity for corporate
bonds based on the available bond price data. Their results suggest that on the whole the
pricing mechanism of the Indian corporate bond market, in spite of its underdeveloped
state, was consistent with the theory of bond pricing. Tracking daily data, for a period of
38 months between April 1997 to March 2001, they find that the secondary market for
(exchange traded) corporate bonds is characterized by shrinking depth and width in
recent years. This is borne out by the decreasing frequency of trades per month and the
rising concentration of trading in an increasingly lesser number of securities as revealed
by the 5, 10 and 15 bond concentration ratios in each month. Ramakrishnan (2005) has
assessed the applicability of two well-known financial distress models, namely, Multiple
Discriminant Analysis and Logistic Regression analysis by using a sample of 298 Indian
firms.
Contingent-claim valuation of equity has also been used extensively in the
literature on bank deposit insurance where the equity-call model is ‘reversed’ to generate
estimates of the market value of assets from observed stock prices. This approach, along
with the observation in Merton (1977) that deposit insurance can be modeled as a put
option, allows the calculation of fair deposit insurance premia. Duan (1994) proposes

20
another method of estimating asset value and asset volatility, based on Maximum
Likelihood estimation using equity prices. Shah and Thomas (2000) utilize option pricing
theory in order to obtain empirical estimates for the extent of leverage present, the stock
of assets required to recapitalize the Indian banking system and the subsidy implicit in the
deposit insurance scheme.

21
4) Sample Period and Dataset:
Modelling credit risk of Indian corporates gets seriously handicapped on
account of the lack of reliable data. The difficulty is particularly pronounced in case of
credit spreads because the corporate bond market is only an insignificant part of the
Indian Debt Market. A large part of the issuance in the non-Government debt market is
currently on private placement basis. On an average, private placements account for little
over one third of the debt issuance. Unofficial estimates indicate that about 90 per cent of
the private corporate sector debt has been raised through private placement in the recent
past. Credit spread data is particularly missing for non-investment grade bonds.
Notwithstanding these difficulties, we proceed with our analysis based on the
data for select companies representing diverse sectors. The companies are tracked from
March 1998 to March 2004. We employ the CMIE Prowess database for equity values,
balance sheet information and credit ratings for outstanding issues, whereas, Credence
Analytics provides the average credit spreads for “AAA” to “A” rated corporate bonds at
monthly frequency. Credit spread data is not available separately for each bond traded in
the market. This fact pre-empts the possibility of comparing company-wise actual credit
spread with the model spread. The companies selected for the purpose of analysis
comprise four top rated corporates, one merged banking institution and seven companies
which filed for bankruptcy with the Board for Industrial and Financial Reconstruction
(BIFR), either in 2003 or 2004. Table 1 presents the details for these firms. Since the
accounting year runs from 1st April to 31st March for Indian firms, we compute the
default probability and credit spreads for the aforementioned corporates as on 31st March
every year during the sample period.

22
Consistent with prior literature and KMV methodology, for book value of debt
we use the “debt due in one year” plus half the “long-term debt”11. The “debt due in one
year” comprises of current liabilities and provisions, commercial papers outstanding,
deferred tax payments, short-term bank borrowings and also current portion of long-term
debt reported in Prowess database. “Long-term debt” is set equal to total long-term debt
less the current portion of long-term debt. We calculate the equity return volatility E as
the annualized standard deviation of daily returns during the given year. The market
value of equity MVE is the average market capitalization reported by CMIE for the year.
The yield on a government security with one year remaining to maturity constitutes the
discrete risk-free rate of return. This rate is converted into continuously compounded rate
for further analysis. Equity returns volatility is ‘de-levered’ to generate a seed value for
asset volatility. From equation (20), de-levered equity returns volatility implies
VEE σσ = where N(d1) =1, implying zero debt. Market value of the firm V is proxied
by the sum of market value of equity and book value of debt. Based on these initial
estimates, we perform iterations with the Solver routine to generate final values for V and
which serve as inputs for computing risk neutral default probability and theoretical
credit spreads.
-----------------------------------------------------------------------------------------------------------11KMV has observed from a sample of several hundred companies that firms defaultwhen the asset value reaches a level somewhere between the value of total liabilities andthe value of short-term debt. The default point is in reality also a random variable. Inparticular, firms will often adjust their liabilities as they near default. It is common toobserve the liabilities of commercial and industrial firms increase as they near defaultwhile the liabilities of financial institutions often decrease as they approach default. Howdoes the model deal with off-balance-sheet liabilities? Fortunately, the model issurprisingly robust to the precise level of the liabilities (Crosbie and Bohn, 2003).

23
The procedure continues in this manner until it converges. Subsequently, CAPM model is
employed for calculating equity drift which goes into the final estimation of objective
default probability.

24
5) Results:
In Appendix (A), tables 2 to 14 present the default probability estimates
(Risk-neutral and Objective) for the sample firms. The results clearly bring out the fact
that the firms filed with BIFR definitely had default probability much higher than the four
top-rated corporates. Furthermore, the estimates are found to be extremely sensitive to the
equity volatility experienced during the period of study (refer charts in Appendix (B)).
For example, the annualized equity returns volatility for Mardia Chemicals Ltd. increased
from 69.5% (1997-98) to 180% (1998-99). Consequently the risk-neutral probability
jumped nine-fold from 8.54% (1997-98) to 76.62% (1998-99). Likewise, for RPG Cables
Ltd. the risk-neutral probability increased from 2.016% ( 2002-03) to 22.384% (2003-
04) as a result of the increase in equity volatility from 49.6% ( 2002-03) to 90.8%
(2003-04).This evidence fully documents the dependence of Merton model estimates on
the equity price fluctuations which in itself underscore the equity shareholders’ trading
on varied information sets.
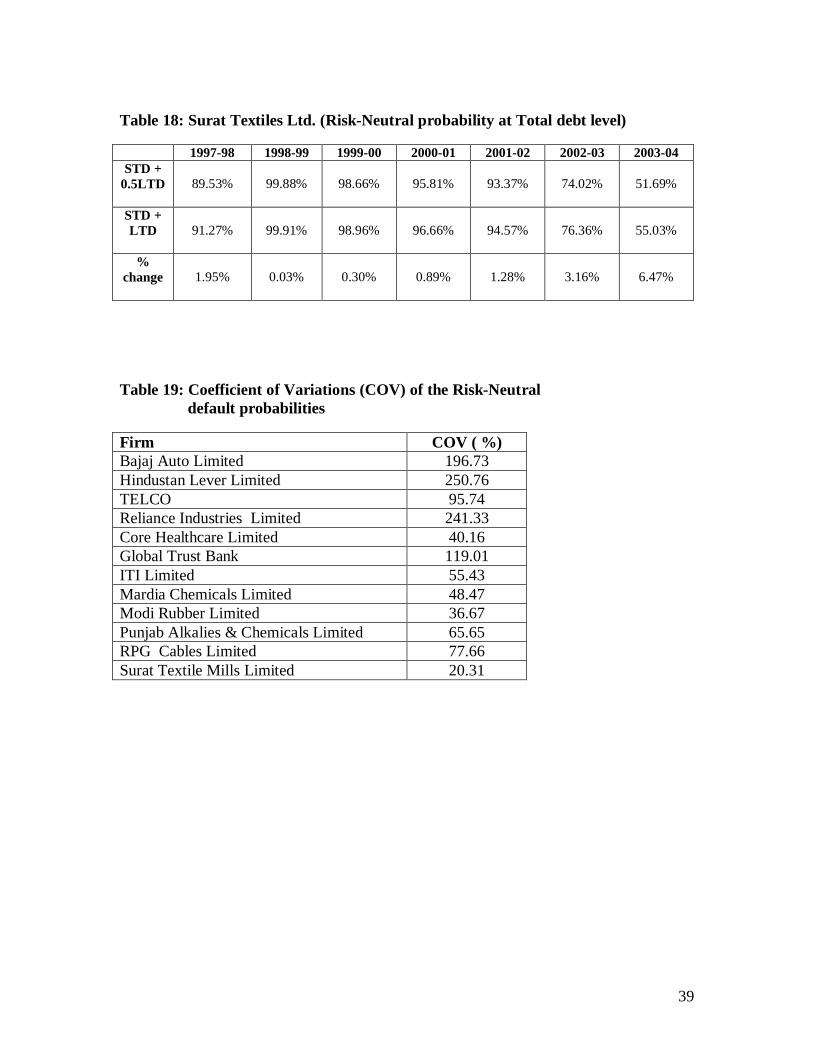
Table 19 reports the Coefficient-of-Variation (COV) estimated for the risk -
neutral default probability measures of the sample firms. The COV measures for the four
top-rated firms included in the sample are much higher than that for the defaulted firms.
However, a certain degree of caution is necessary while interpreting this result. Higher
COV for top-rated firms need not imply any significant ‘credit erosion’ and subsequent
rating downgrade, the reason being these firms have extremely low base-level default
probabilities and hence the possibility of moving from AAA to speculative grades is
negligible (if not nil). For example, the COV is 250.76% for HLL and 196.74% for Bajaj

25
Auto. However, the risk-neutral probability has never exceeded 0.01% for these firms
over the sample period.
In the conventional analysis, risk-neutral probability estimate is always
supposed to exceed the objective probability estimate, the reason being that the riskfree
rate is less than the rate of asset drift (refer equations (13) and (14)). However, in direct
opposition to this view, the evidence from the present study is markedly different. Of
greater significance empirically is the fact that the real world (i.e., objective) default
probability estimates are higher than the risk-neutral probability estimates for the sample
firms across the period of study; the source of this result can be traced to the riskfree
rate which has been persistently higher than the rate of asset drift over the sample period.
This result has serious implications from the viewpoint of maintaining adequate level of
economic capital. Risk-neutral probabilities cannot be used for risk management
purposes; this requires objective default probabilities. A correct estimation of a
counterpart’s objective probability of default is crucial in any credit risk management
system. To illustrate, banks use default probability to compute expected and unexpected
loss, economic capital and risk adjusted profitability. Pricing guidelines are based on
these measures. An incorrect estimation of default probability may result in mispricing of
credit risk. Underprediction of this measure will subsequently lead to inadequate capital
allocation.
The probability estimates compare quite well with CRISIL’s Average 1 year
rating transition matrix (see Table 15). The default rate is 0% for AAA ratings in the
transition matrix. Compare it with the default probability predicted for the three AAA
rated firms (HLL, Reliance Industries & Bajaj Auto). Except for the values predicted for

26
Reliance Industries over the year 1997-98 and 1999-2000, the estimates are virtually
zero. Similar arguments can be made in the context of defaulted firms. Although the
matrix doesn’t report the stability rates for D category, it does report a default rate of
28.57% for C rating class. This also compares well with the probabilities modeled for
various defaulted firms in the sample. A cursory glance at the probability estimates of the
three AAA rated firms and the single AA rated firm (Telco) further validates the
performance of the Merton model at tracking credit ratings. The results could also be
interpreted in a different way. They signify the ability of rating agencies to correctly
assess the credit risk of firms which had been assigned the lowest probabilities of default
by the Merton model. However, the performance of these agencies seems to occasionally
falter in the case of failed firms. For example, ITI limited was persistently rated AAA by
various rating agencies although the Merton model had rightly predicted it to be a
‘problem firm’ (refer Table 9).
In the literature, very little attention has been paid to the more pedestrian issue
of the sensitivity of default probability estimates to the change in ‘default trigger point’.
Tables 16, 17 and 18 summarize the results of the sensitivity analysis undertaking in this
direction. It also reports the percentage change in risk-neutral probability if entire debt
(Total short-term debt plus Total long-term debt) is incorporated in the analysis. The
results are reported for the one AA rated firm (Telco) and two defaulted firms (ITI Ltd.
and Surat Textile Mills Ltd.). The evidence brings to light the fact that the probability
measure for top-rated firms (low base-level probability) is relatively more sensitive to the
changes in default trigger point. However, the incremental difference in probability
measure on account of this change is not sizeable enough to push such firms in the

27
subsequent lower rating grade. In case of defaulted firms (high base-level probability),
the impact is quite nominal. Pursuing this issue further, with reference to equation (20),
equity volatility ( E) and market capitalization (E) are independent of the value
assigned for default trigger point. Any increase in this level increases the leverage, thus
reducing the volatility ( ) of firm value and increasing the firm value (V). As derived
by Farmen, Westgaard et al (2003), the sensitivity of the default probability with respect
to a change in the value of the firm (V) is negative and with respect to change in the
volatility of the firm ( ) is positive. However, differentiating equation (13) with respect
to default trigger point (F) brings out the fact that any change in F has a direct positive
effect on the probability measure. Consequently, the overall impact on probability is
negligible (but positive). The robustness of the probability measure especially augurs
well for testing the model on firms which carry sizeable off- balance sheet exposures.
We now return to tables 3 to 14 which also report the Altman Z-scores for the
sample firms12. As is evident from these tables, the Z-scores seem to track the
probability predictions quite well. For example, the AAA rated firm HLL has been
consistently assigned the Z score above 5 which is in line with its default probability
estimate of 0%. Similarly, almost all the defaulted firms have obtained the scores well
below 1.81 over the period of study. Barring few exceptions, such as, Bajaj Auto (2000-
01) and Reliance Industries Ltd. (2002-03), the predictions made by the Merton model
and Altman Z-Score model are analogous. However, notwithstanding the precision of
Altman Z-Score model at predicting future bankruptcy, Z-Scores are not directly
interpreted as default probabilities and they work as ordinal measures of financial health.
Therefore, they cannot be directly used for valuation, quantitative risk assessment, and

28
capital allocation purposes. However, Merton model is far more functional on account of
its ability to assign different default probability estimates across firms in the same rating
class.13
In Tables 3 to 6, we also depict the ability of the Merton model to predict
credit spreads. Pooling quarterly data since March 2002 provides adequate number of
observations to draw certain conclusions; however, the data are not sufficiently dispersed
across issuers or maturity horizons. Consequently, we restrict our estimates only to the
four top-rated firms, the reason being absence of active secondary market for Non-
Investment Grade rated bonds. A sizable chunk of such speculative category bonds
change hands through private placements. The credit spread estimates are compared with
the actual market data on credit spreads as presented in Table 20. This table summarizes
the standard deviation, maximum, minimum and mean values for the actual credit spreads
on an aggregate basis.
------------------------------------------------------------------------------------------------------------------------------------------------------------------
12Altman Z-Score is a classificatory model for corporate customers;Zscore > 2.99 - Firm is in a good shape2.99 > Zscore >1.81 - Warning signal1.81 > Zscore - Firm could be heading towards bankruptcy
Therefore, the greater a firm’s distress potential, the lower its discriminant score.
13An interesting result to note here is that the performance of the default probabilitymeasure improves with firm size (Prediction Accuracy Ratio increases from 0.74 to0.88), while that of the Z-score deteriorates slightly with size (Prediction Accuracy Ratiodeteriorates from 0.60 to 0.58). This is because the probability measure relies on aninformative equity price for its effectiveness. While equity markets are usually efficientand equity prices are a good indicator of the intrinsic worth of the firm, there is noisearound them in reality. For larger firms, due to an increased market interest and largernumber of analysts following them, the equities are more transparent, making them morereliable. On the other hand, larger firms have more sophisticated financial statementssince they usually operate in multiple segments across the world. This makes theirfinancial ratios more difficult to interpret. Since the Z-score primarily depends on thefinancial ratios, its effectiveness reduces with size (Bohn, Arora & Korablev, 2005).

29
Absence of company-wise spread data seriously impedes the explanation of spread
estimates. However, notwithstanding this difficulty, the results clearly highlight the fact
that the Merton model underpredicts credit spreads for AAA and AA rating grades vis-à-
vis the actual market spreads. The mean value of actual credit spreads is 0.889% and
1.222% respectively for these rating grades over the period from March 2002 to March
2004. Comparing this market evidence with the estimates reported in tables underscores
the propensity of Merton model to underpredict credit spreads. The results are clearly in
confirmation with the received literature on credit spreads (see for example Jones,
Mason, and Rosenfeld (1984), Gemmill(2002), Teixeira (2005),
Eom,Helwege,Huang(2003) ). Ogden (1987) conducted a similar study using prices from
new offerings and reported that the Merton model underpredicts spreads by 104 basis
points (bps) on average. Our results lends credence to this observation with reference to
Indian corporate bond spreads. The model’s underprediction problem is quite severe for
low leverage and low volatility firms, so unless these firms have many years left for the
debt to mature, there is little chance in the model to generate a high spread
(Eom,Helwege,Huang(2003))14. The firms’ volatility and Quasi-Debt ratios reported in
the tables 3 to 6 confirm this proposition 15.
Ericsson and Renault (2001) find that there is liquidity premium in the
observed credit spread which increases its size relative to the model spread. Bose and
Coondoo (2003) report that during the sub-period April 1998- February 1999, the share
of AAA and AA rated bonds together in total traded volumes went down to 22% This
share went down further to 15% during the last sub-period of their study ,i.e., April 2000
to March 2001. This evidence points out the volatile traded volumes experienced in the

30
Investment –Grade rated segment of the Indian corporate bond market. Dwindling
volumes quite often manifest themselves in the form of higher liquidity premium. Elton
et al (2001) attribute about one third of the observed US spread to state and local taxes,
which apply to corporate bonds but not to treasuries. It would therefore not be surprising
if model spreads appeared to be smaller than market spreads in the US. Quite analogous
to this, the interest income receivable from Indian corporate bonds and debentures is
subject to Tax Deduction at Source (TDS), whereas, the maturity or redemption of a zero
coupon bond is treated as transfer giving rise to capital gain which is subject to tax.
Incidentally, Huang and Huang (2003) conclude that, for investment grade bonds (those
with a credit rating not lower than Baa) of all maturities, credit risk accounts for only a
small fraction—typically around 20%, and, for Baa-rated 10-year bonds, in the 30%
range—of the observed yield spreads, and it accounts for a lower fraction of the observed
spreads for bonds of shorter maturities. For junk bonds, however, credit risk accounts for
a much larger fraction of the observed spreads.
-----------------------------------------------------------------------------------------------------------14Note that the Merton model estimates credit spreads assuming one year of residualmaturity across entire debt outstanding
15Absence of sizeable dataset on zero-coupon bonds has forced researchers in the past toemploy coupon-bearing bonds for estimating the structural models (which implicitlyassume zero-coupon debt). This has seriously undermined the efficacy of the existingresearch on predicting credit spreads. The present study is no exception to this limitation.Moreover, due to lack of bond issue-wise data, bonds with different maturity profileshave been bunched together assuming one year residual maturity.

31
6) Concluding Remarks:
This paper derives a risk-neutral (and objective) indicator of credit risk, the
distance-to-default, that can be used to assess financial distress. This indicator, that is
based on Robert Merton’s structural model of credit risk, measures the distance between
the asset value of a firm and its liabilities at any given point in time. Therefore, the lower
the absolute value of the distance-to-default, the higher the risk of default. We construct
this measure for select Indian firms and find that it is able to correctly differentiate top-
rated firms from those in default mode. We then demonstrate that the Merton model
estimates depend significantly on the equity price volatility, which in itself need not
always carry credit risk implications. Another aspect on which we shed some light is
whether the default measure is sensitive to the ‘default trigger point’ chosen for analysis,
i.e. the sum of short-term and long-term debt employed in the modelling framework. Our
tests, however, confirm the robustness of this indicator. This especially augurs well for
testing the model on firms which carry sizeable off- balance sheet exposures.
Given that the riskfree rate is less than the rate of asset drift, in conventional
analysis the risk-neutral probability estimate is always supposed to exceed the objective
probability measure. However, the evidence from the present study is markedly different.
We find that the real world (i.e., objective) probability estimates are higher than the risk-
neutral measures across the period of study; the reason being the rate of asset drift
persistently falling short of the riskfree rate over the sample period. We have attempted
to map our estimates to the Altman Z-scores as well as the default rate reported by
CRISIL’s Average 1-year rating transition matrix. The results are found to compare
quite well with both these benchmarks. In the concluding part, we employ the Merton

32
model to estimate credit spreads for the four top-rated firms included in the sample. The
findings which we confirm empirically are twofold. First, the model spreads are small
relative to the spreads observed in the secondary market for these bonds. Second, the
model’s underprediction problem is quite severe for low leverage and low volatility
firms, so unless these firms have many years left for the debt to mature, there is little
chance in the model to generate higher spreads. The observations broadly support the
argument that liquidity premium and transaction costs account for the unexplained
component of market spreads.

33
APPENDIX (A) :
Table 1: Sample FirmsSr.No
.Company Particulars Industry
1 Bajaj Auto Limited “AAA rated Two and Three wheelers2 Hindustan Lever Limited “AAA” rated Consumer goods3 TELCO “AA” rated* Cars and Heavy vehicles4 Reliance Industries Limited “AAA” rated Petrochemicals5 Core Healthcare Limited Filed with BIFR Pharmaceuticals6 Global Trust Bank Merged (2004) Banking7 ITI Limited Filed with BIFR Electronics8 Mardia Chemicals Limited Filed with BIFR Dyes and Pigments9 Modi Rubber Limited Filed with BIFR Tyres and Tubes10 Punjab Alkalies & Chemicals Limited Filed with BIFR Caustic Soda11 RPG Cables Limited Filed with BIFR Wires and Cables12 Surat Textile Mills Limited Filed with BIFR Synthetic Yarn
*Securitized debt rated “AAA” since 2001.
Table 2: NotationsRf Riskfree rate
e Equity returns volatilitya Asset returns volatility
MVA Total market value of the firmDebt Short-term debt + 50% of Long term debtµa Asset drift rateDD Distance-to-DefaultPRN Risk-neutral probability of defaultPO Objective probability of defaultQ-D Quasi-debt ratioSpread Credit spread ( Merton model)Rating Credit rating (CRISIL , ICRA, CARE or Fitch )Z score Altman’s Z score estimate

34
Table 3: Bajaj Auto Ltd.Years 1997-98 1998-99 1999-00 2000-01 2001-02 2002-03 2003-04Rf 0.089 0.095 0.096 0.093 0.069 0.057 0.045
e 0.513 0.395 0.480 0.351 0.361 0.291 0.336a 0.433 0.322 0.358 0.240 0.220 0.191 0.242
MVA 8227.75 8467.59 7336.69 5140.42 5363.00 7331.34 10812.55Debt 1395.83 1724.79 2049.71 1776.26 2244.89 2676.02 3122.55µa 0.024 0.025 0.037 0.076 0.058 0.028 0.024DD 4.084 5.082 3.650 4.685 4.167 5.494 5.190PRN 0.002% 0.000% 0.013% 0.000% 0.002% 0.000% 0.000%PO 0.004% 0.000% 0.024% 0.000% 0.002% 0.000% 0.000%Q-D 0.155 0.185 0.254 0.315 0.391 0.345 0.276Spread 0.0002% 0.0000% 0.0011% 0.0000% 0.0001% 0.0000% 0.0000%Rating AAA AAA AAA AAA AAA AAA AAAZ score 5.33 4.56 3.72 2.73 2.84 2.89 3.54
Table 4: Hindustan Lever Ltd.Years 1997-98 1998-99 1999-00 2000-01 2001-02 2002-03 2003-04Rf 0.089 0.095 0.096 0.093 0.069 0.057 0.045
e 0.305 0.309 0.415 0.427 0.306 0.252 0.316a 0.284 0.291 0.395 0.403 0.286 0.231 0.277
MVA 28651.59 39709.11 56373.91 52436.81 50942.12 43613.02 43913.75Debt 2188.04 2592.84 3001.185 3286.27 3693.83 3854.445 5709.41µa 0.010 0.031 0.043 0.064 0.025 0.003 0.013DD 9.242 9.567 7.475 6.911 9.281 10.617 7.387PRN 0.000% 0.000% 0.000% 0.000% 0.000% 0.000% 0.000%PO 0.000% 0.000% 0.000% 0.000% 0.000% 0.000% 0.000%Q-D 0.070 0.059 0.048 0.057 0.068 0.083 0.124Spread 0.000% 0.000% 0.000% 0.000% 0.000% 0.000% 0.000%Rating AAA AAA AAA AAA AAA AAA AAAZ score 10.32 11.71 13.83 12.01 10.55 8.91 6.52
Table 5: TELCOYears 1997-98 1998-99 1999-00 2000-01 2001-02 2002-03 2003-04Rf 0.089 0.095 0.096 0.093 0.069 0.057 0.045
e 0.357 0.591 0.663 0.564 0.522 0.341 0.415a 0.246 0.283 0.392 0.210 0.177 0.167 0.269
MVA 12528.19 9579.64 9419.25 7058.74 6864.24 9531.53 16599.53Debt 4284.26 5535.07 4292.64 4899.22 4888.64 5142.66 6105.64µa 0.027 0.034 0.031 0.061 0.051 0.019 0.006DD 4.608 2.132 2.052 2.075 2.223 3.947 3.746PRN 0.000% 1.652% 2.008% 1.898% 1.310% 0.004% 0.009%PO 0.001% 2.758% 2.964% 2.712% 1.682% 0.010% 0.016%Q-D 0.313 0.526 0.414 0.633 0.665 0.510 0.352Spread 0.0000% 0.1534% 0.2557% 0.1360% 0.0763% 0.0001% 0.0005%Rating AA AA AA AA AA AA AAZ score 2.32 1.23 1.95 1.16 1.36 2.02 3.03

35
Table 6: Reliance Industries Ltd.Years 1997-98 1998-99 1999-00 2000-01 2001-02 2002-03 2003-04Rf 0.089 0.095 0.096 0.093 0.069 0.057 0.045
e 0.776 0.456 0.538 0.390 0.434 0.298 0.305a 0.529 0.262 0.372 0.310 0.274 0.176 0.207
MVA 22919.72 22305.17 29708.50 46065.91 52768.92 55947.04 88390.95Debt 8189.09 10470.795 10137.63 10365.85 20885.955 24303.2 29764.72µa 0.011 0.030 0.019 0.033 0.016 0.011 0.012DD 1.851 3.123 2.965 4.951 3.497 4.978 5.376PRN 3.207% 0.089% 0.152% 0.000% 0.024% 0.000% 0.000%PO 4.428% 0.200% 0.292% 0.000% 0.048% 0.000% 0.000%Q-D 0.327 0.427 0.310 0.205 0.369 0.410 0.322Spread 0.5585% 0.0060% 0.0146% 0.0000% 0.0015% 0.0000% 0.0000%Rating AAA AAA AAA AAA AAA AAA AAAZ score 1.94 1.67 2.23 3.13 2.3 2.16 2.43
Table 7: Core Healthcare Ltd.Years 1997-98 1998-99 1999-00 2000-01 2001-02 2002-03 2003-04Rf 0.089 0.095 0.096 0.093 0.069 0.057 0.045
e 0.730 1.053 0.834 0.789 0.936 0.749 0.973a 0.101 0.129 0.093 0.035 0.020 0.015 0.020
MVA 561.97 633.62 796.95 1086.80 1154.25 1246.72 1362.57Debt 539.6 652.59 800.925 1150.495 1220.34 1297.775 1409.13µa 0.083 0.082 0.086 0.090 0.068 0.055 0.043DD 1.228 0.443 0.929 0.997 0.631 1.088 0.549PRN 10.982% 32.904% 17.652% 15.927% 26.412% 13.830% 29.140%PO 12.093% 36.710% 20.498% 17.713% 27.971% 16.522% 31.315%Rating BB D D D D D DZ score 0.05 0.01 -0.12 -1.25 -1.1 -1.12 -1.79
Table 8: Global Trust BankYears 1997-98 1998-99 1999-00 2000-01 2001-02 2002-03Rf 0.089 0.095 0.096 0.093 0.069 0.057
e 0.526 0.570 0.715 0.916 0.659 0.374a 0.345 0.258 0.338 0.506 0.276 0.120
MVA 684.11 978.88 1109.76 1625.37 664.93 712.12Debt 256.59 593.24 661.42 865.775 421.55 511.68µa 0.021 0.047 0.051 0.032 0.028 0.034DD 2.923 2.178 1.643 1.176 1.760 3.162PRN 0.173% 1.470% 5.018% 11.979% 3.921% 0.078%PO 0.319% 2.314% 6.528% 14.565% 5.347% 0.148%Rating P1+ P1 P1 P1+ P1 P3Z score 1.72 0.97 0.95 0.98 0.79 0.51

36
Table 9: ITI LtdYears 1997-98 1998-99 1999-00 2000-01 2001-02 2002-03 2003-04Rf 0.089 0.095 0.096 0.093 0.069 0.057 0.045
e 0.903 1.108 0.836 0.736 0.774 0.703 0.688a 0.089 0.120 0.154 0.088 0.038 0.055 0.045
MVA 1473.66 1653.92 2022.15 1997.14 2568.34 2900.82 2775.86Debt 1500.83 1736.36 1892.75 1965.55 2642.175 2862.99 2733.425µa 0.082 0.082 0.074 0.079 0.064 0.048 0.041DD 0.752 0.326 0.976 1.195 1.039 1.260 1.297PRN 22.606% 37.240% 16.448% 11.606% 14.947% 10.391% 9.730%PO 24.877% 41.380% 20.160% 14.876% 18.056% 13.881% 11.141%Rating AAA AAA AAA AAA AAA AAA AAAZ score 1.07 1.32 1.48 1.41 1.21 0.25 -0.75
Table 10: Mardia Chemicals Ltd.Years 1997-98 1998-99 1999-00 2000-01 2001-02 2002-03Rf 0.089 0.095 0.096 0.093 0.069 0.057
e 0.696 1.796 1.272 2.286 1.787 1.442a 0.128 0.463 0.081 0.393 0.059 0.031
MVA 501.70 479.64 788.00 610.52 1213.90 1260.67Debt 456.24 663.15 864.47 1093.79 1362.51 1346.81µa 0.082 0.090 0.092 0.080 0.067 0.055DD 1.370 -0.726 -0.002 -1.443 -0.823 -0.307PRN 8.538% 76.623% 50.067% 92.548% 79.463% 62.043%PO 9.399% 76.906% 51.753% 93.012% 80.122% 64.040%Rating NA NA NA NA NA NAZ score 0.22 -1.61 -1.5 -0.39 -1.94 -1.46
Table 11: Modi Rubber Ltd.Years 1997-98 1998-99 1999-00 2000-01 2001-02 2002-03Rf 0.089 0.095 0.096 0.093 0.069 0.057
e 0.608 0.784 0.721 0.766 0.833 0.745a 0.151 0.162 0.258 0.253 0.269 0.144
MVA 455.26 370.84 445.09 418.92 392.26 383.14Debt 378.48 335.04 324.15 320.03 300.64 336.10µa 0.081 0.092 0.091 0.090 0.059 0.048DD 1.734 1.132 1.469 1.303 1.108 1.231PRN 4.142% 12.883% 7.095% 9.624% 13.393% 10.922%PO 4.598% 13.300% 7.323% 9.825% 14.194% 12.159%Rating NA NA NA NA NA NAZ score 2.43 2.14 2.6 1.92 1.18 -0.6

37
Table 12: Punjab Alkalies & Chemicals Ltd.Years 1997-98 1998-99 1999-00 2000-01 2001-02Rf 0.089 0.095 0.096 0.093 0.069
e 0.567 1.116 1.522 1.623 1.057a 0.211 0.253 0.421 0.414 0.108
MVA 117.54 107.58 97.96 89.83 111.84Debt 81.28 103.94 111.79 109.85 113.77µa 0.074 0.081 0.101 0.077 0.064DD 2.060 0.385 -0.296 -0.468 0.423PRN 1.970% 34.995% 61.650% 68.018% 33.618%PO 2.333% 36.961% 61.149% 69.419% 35.055%Rating Suspended Suspended Suspended Suspended SuspendedZ score 0.76 0.26 0.51 1.14 0.8
Table 13: RPG Cables Ltd.Years 1997-98 1998-99 1999-00 2000-01 2001-02 2002-03 2003-04Rf 0.089 0.095 0.096 0.093 0.069 0.057 0.045
e 0.733 0.955 0.823 0.612 0.562 0.496 0.908a 0.114 0.169 0.257 0.134 0.060 0.050 0.113
MVA 288.64 233.27 301.11 274.51 279.34 243.75 250.06Debt 272.32 225.135 240.08 237.98 268.65 232.71 238.42µa 0.081 0.088 0.070 0.075 0.064 0.050 0.038DD 1.234 0.689 1.125 1.687 1.769 2.051 0.759PRN 10.858% 24.544% 13.032% 4.584% 3.843% 2.016% 22.384%PO 12.166% 25.853% 15.266% 5.977% 4.549% 2.796% 24.228%Rating NA NA NA NA NA NA NAZ score 1.47 1.45 1.62 1.3 1.02 0.81 -1.64
Table 14: Surat Textile Mills Ltd.Years 1997-98 1998-99 1999-00 2000-01 2001-02 2002-03 2003-04Rf 0.089 0.095 0.096 0.093 0.069 0.057 0.045
e 2.458 5.621 3.822 3.005 2.647 1.823 1.422a 1.678 5.594 3.555 2.419 1.810 0.790 0.560
MVA 33.24 14.09 14.13 18.47 21.38 54.38 67.10Debt 73.04 65.4 74.27 71.33 67.81 70.1 61.43µa 0.124 0.042 0.148 0.147 0.066 0.050 0.040DD -1.255 -3.054 -2.217 -1.730 -1.505 -0.644 -0.042PRN 89.532% 99.887% 98.669% 95.815% 93.379% 74.021% 51.690%PO 89.151% 99.891% 98.618% 95.612% 93.401% 74.293% 51.987%Rating NA NA NA NA NA NA NAZ score 0.68 0.77 0.89 1.11 0.99 1.27 1.43

38
Table 15: CRISIL Average 1-Year Rating Transition Matrix over 1992-2004 (%)
From\To AAA AA A BBB BB B C DAAA 96.64 3.36 0.00 0.00 0.00 0.00 0.00 0.00AA 2.36 89.26 7.24 0.57 0.33 0.16 0.08 0.00A 0.00 3.61 82.40 7.50 4.40 0.22 0.87 1.01BBB 0.00 0.33 5.45 73.27 14.19 1.65 1.65 3.47BB 0.00 0.61 0.00 1.83 75.30 0.91 5.49 15.85B 0.00 0.00 0.00 6.06 0.00 57.58 6.06 30.30C 0.00 0.00 0.00 1.19 0.00 0.00 70.24 28.57(Source: “Insight” CRISIL Default Study, 2004-05)
Table 16: TELCO ( Risk-Neutral probability at Total debt level)
1997-98 1998-99 1999-00 2000-01 2001-02 2002-03 2003-04STD +
0.5LTD 0.00020% 1.65% 2.00% 1.89% 1.31% 0.003% 0.008%
STD +LTD 0.00059% 1.95% 2.52% 2.12% 1.47% 0.005% 0.012%
%change 190.03% 18.03% 25.81% 11.97% 12.76% 42.86% 40.01%
Table 17: ITI Ltd. (Risk-Neutral probability at Total debt level)
1997-98 1998-99 1999-00 2000-01 2001-02 2002-03 2003-04STD +
0.5LTD 22.606% 37.240% 16.448% 11.606% 14.947% 10.391% 9.730%
STD +LTD 22.730% 37.463% 16.723% 11.733% 14.970% 10.439% 9.836%
%change 0.55% 0.60% 1.67% 1.10% 0.15% 0.46% 1.09%
39
Table 18: Surat Textiles Ltd. (Risk-Neutral probability at Total debt level)
1997-98 1998-99 1999-00 2000-01 2001-02 2002-03 2003-04STD +
0.5LTD 89.53% 99.88% 98.66% 95.81% 93.37% 74.02% 51.69%
STD +LTD 91.27% 99.91% 98.96% 96.66% 94.57% 76.36% 55.03%
%change 1.95% 0.03% 0.30% 0.89% 1.28% 3.16% 6.47%
Table 19: Coefficient of Variations (COV) of the Risk-Neutral default probabilities
Firm COV ( %)Bajaj Auto Limited 196.73Hindustan Lever Limited 250.76TELCO 95.74Reliance Industries Limited 241.33Core Healthcare Limited 40.16Global Trust Bank 119.01ITI Limited 55.43Mardia Chemicals Limited 48.47Modi Rubber Limited 36.67Punjab Alkalies & Chemicals Limited 65.65RPG Cables Limited 77.66Surat Textile Mills Limited 20.31

40
Table 20: Credit Spreads (%)
AAA AA+ AA AA- A+ A31/03/2002 2.04 2.95 3.56 4.07 4.67 5.3701/07/2002 1.75 2.15 2.94 3.44 4.17 4.9130/09/2002 0.73 0.94 1.32 1.72 2.32 2.831/12/2002 0.28 0.52 0.86 1.27 1.92 2.4331/03/2003 0.78 1.15 1.46 1.96 2.82 3.2501/07/2003 0.41 0.61 0.98 1.45 2.13 2.7530/09/2003 0.77 0.95 1.36 1.85 2.62 3.2231/12/2003 0.37 0.61 0.95 1.34 1.97 2.5531/03/2004 0.87 1.12 1.49 2.03 2.88 3.79Average 0.889 1.222 1.658 2.126 2.833 3.452Stdev 0.611 0.811 0.944 0.974 0.971 1.048Maximum 2.040 2.950 3.560 4.070 4.670 5.370Minimum 0.280 0.520 0.860 1.270 1.920 2.430

41
APPENDIX (B):
Note: PRN refers to Risk-Neutral probability of default, whereas, e refers to volatility of equity returns.
Bajaj Auto Ltd.
0.00%
0.01%
0.02%
97-98 98-99 99-00 00-01 01-02 02-03 03-04
PRN
0
0.2
0.4
0.6
e
PRN e
HLL
0.00%
0.25%
0.50%
0.75%
1.00%
97-98 98-99 99-00 00-01 01-02 02-03 03-04
PRN
0
0.15
0.3
0.45e
PRN e

42
TELCO
0%
1%
2%
3%
97-98 98-99 99-00 00-01 01-02 02-03 03-04
PRN
0
0.25
0.5
0.75
e
PRN e
Reliance Industries Ltd.
0%
1%
2%
3%
4%
97-98 98-99 99-00 00-01 01-02 02-03 03-04
PRN
0
0.25
0.5
0.75
1
e
PRN e

43
Core Healthcare Ltd.
0%
15%
30%
45%
97-98 98-99 99-00 00-01 01-02 02-03 03-04
PRN
0
0.25
0.5
0.75
1
1.25
e
PRN e
Global Trust Bank
0%
2%
4%
6%
8%
10%
12%
14%
97-98 98-99 99-00 00-01 01-02 02-03
PRN
0
0.25
0.5
0.75
1
e
PRN e

44
ITI Ltd.
0%
10%
20%
30%
40%
97-98 98-99 99-00 00-01 01-02 02-03 03-04
PRN
0
0.3
0.6
0.9
1.2
e
PRN e
Mardia Chemicals Ltd.
0%
25%
50%
75%
100%
97-98 98-99 99-00 00-01 01-02 02-03
PRN
0
0.5
1
1.5
2
2.5
e
PRN e

45
Modi Rubber Ltd.
0%
5%
10%
15%
97-98 98-99 99-00 00-01 01-02 02-03
PRN
0
0.25
0.5
0.75
1
e
PRN e
Punjab Alkalies Ltd.
0%
20%
40%
60%
80%
97-98 98-99 99-00 00-01 01-02
PRN
0
0.5
1
1.5
2
e
PRN e

46
RPG Cables Ltd.
0%
10%
20%
30%
97-98 98-99 99-00 00-01 01-02 02-03 03-04
PRN
0
0.25
0.5
0.75
1
1.25
e
PRN e
Surat Textile Mills Ltd.
0%
25%
50%
75%
100%
125%
97-98 98-99 99-00 00-01 01-02 02-03 03-04
PRN
0
2
4
6
e
PRN e

47
References:
• Anderson, R. & Sundaresan, S. (2000), “A Comparative Study Of Structural Models Of CorporateBond Yields: An Exploratory Investigation”, Journal of Banking and Finance; 24, 255-269
• Benos, A & Papanastasopoulos, G. (2005), “Extending the Merton Model: A Hybrid Approach toAssessing Credit Quality”, Working Paper, University of Piraeus
• Bharath,S.T & Shumway,T., (2004), “Forecasting Default With The KMV-Merton Model”.,Working Paper, Department of Finance, University of Michigan Business School.
• Black, F. and Scholes M. (1973), “The Pricing Of Options And Corporate Liabilities,” Journal ofPolitical Economy, No 81, pp.637-659
• Black, F. & Cox, .C (1976), “Valuing Corporate Securities: Some Effects Of Bond IndentureProvisions”, Journal of Finance, 31 (2), pp.351-367
• Bohn J.R. (2000), “A Survey Of Contingent-Claims Approaches To Risky Debt Valuation”, The Journal of Risk Finance, Spring 2000, 53-70
• Bohn, J , Arora N & I Korablev, (2005), “Power And Level Validation Of The EDF CreditMeasure In The U.S. Market”, Moody s KMV Working Paper
• Bose, S & Coondoo, D. (2003), “A Study Of The Indian Corporate Bond Market”., Money &Finance, Vol. 2, No. 12, January-March 2003
• Carey, M. (2000), “Dimensions Of Credit Risk And Their Relationship To Economic CapitalRequirements”, NBER Working Paper, No. 7629
• Chan-Lau, J.A. & Joberta., Kong, J. (2004), An Option-Based Approach To Bank VulnerabilitiesIn Emerging Markets”., IMF Working Paper, WP/04/33
• Collin-Dufresne, P. & Goldstein, R. (2001), “Do Credit Spreads Reflect Stationary LeverageRatios?,” Journal of Finance, 56, 1929-1957.
• Crouhy M, Galai D. & Mark,R. (2000), “A Comparative Analysis Of Current Credit RiskModels”, Journal of Banking and Finance, 24, pp57-117
• Crosbie, P.J. & Bohn, J. R.(2003), ”Modelling Default Risk”, Working Paper, KMV Corporation.
• Delianedis G. & Geske R.(2003),”Credit Risk And Risk Neutral Default Probabilities -Information About Rating Migrations And Defaults”, Working paper UCLA
• Duan, J.C. (1994), “Maximum Likelihood Estimation Using Price Data Of The DerivativeContract”, Mathematical Finance, Vol. 4, No. 2, p.155-157.
• Duffee, Darrell. & Wang, Ke. (2004), “Multi-Period Corporate Failure Prediction With StochasticCovariates”, Working Paper, Stanford University
• Du, Yu & Suo, Wulin. ( 2003), “Assessing Credit Quality From Equity Markets: Is StructuralModel A Better Approach”, Working Paper, Queen s University
• Elton, Edward, Gruber, Martin, Agrawal, Deepak & Christopher Mann. (2001) "ExplainingThe Rate Spread On Corporate Bonds," Journal of Finance, 2001,v56(1)

48
• Eom,Y., J. Helwege, & Huang, J. (2003), “Structural Models Of Corporate Bond Pricing: AnEmpirical Analysis,” forthcoming in Review of Financial Studies.
• Farmen, E. S., Westgaard, S., Fleten, S. & Wijst, N. (2003), “Default Risk And Its Greeks UnderAn Objective Probability Measure”., Paper presented at Stockholm School of Economics -Department of Finance seminar series November 2003.
• Frank, J.&. Torous, W (1989), “An Empirical Investigation Of U.S. Firms In Reorganization,”Journal of Finance, 44 (3), 747-769.
• Gemmill, Gordon. (2002)., “Testing Merton’s Model For Credit Spreads On Zero-CouponBonds”., Working Paper, Faculty of Finance, City University Business School
• Geske, R. (1977), “The Valuation Of Corporate Liabilities As Compound Options”,Journal of Financial and Quantitative Analysis, 12, pp.541- 552
• Hillegeist, S.A., Keating E.K., Cram D.P., & Lundstedt, K.G.(2002), “Assessing The ProbabilityOf Bankruptcy”, Working Paper Kellog School of Management
• Huang, Jing-zhi & Huang, Ming (2003), “How Much Of The Corporate-Treasury Yield Spread IsDue To Credit Risk?”, Stanford University, Working paper
• Hull, J. C. (2003), “Options, Futures And Other Derivatives”, 5th Ed, First Indian Reprint,Pearson Education, pp 619-623
• Jones, P., S. Mason & E. Rosenfeld. (1983), “Contingent Claim Analysis Of Corporate Capital Structure: An Empirical Investigation,” Journal of Finance, 39 (3), 611-625.
• Kurbat, M. and I. Korablev. (2002), “Methodology For Testing The Level Of The EDF™ CreditMeasure”, Moody's KMV.
• Leland H.. & Toft K.. (1996), “Optimal Capital Structure, Endogenous Bankruptcy, And TheTerm Structure Of Credit Spreads”, Journal of Finance, 51 (3), pp.987-1019
• Longstaff, F , & Schwartz, E. (1995), “A Simple Approach To Valuing Risky Fixed And FloatingRate Debt,” Journal of Finance, 50, 789-820.
• Mella-Barral,P and Perraudin,W. (1997), “Strategic Debt Service”, Journal of Finance, Vol. 52,No. 3, pp531-556
• Merton, R.C. (1974), “On The Pricing Of Corporate Debt: The Risk Structure Of Interest Rates,”,Journal of Finance, 29, 449-470.
• Merton, R. C. (1977), “An Analytical Derivation Of The Cost Of Deposit Insurance And LoanGuarantees: An Application Of Modern Option Pricing Theory”, Journal of Banking and Finance,1, 3–11.
• Nikolova .S.M.(2003), “The Informational Content And Accuracy Of Implied Asset Volatility AsA Measure Of Total Firm Risk ., Working Paper., Department of Finance, Insurance, and RealEstate., University of Florida
• Ogden, Joseph P. (1987) "Determinants Of The Ratings And Yields On Corporate Bonds: TestsOf The Contingent Claims Model," Journal of Financial Research, , v10(4),329-340.

49
• Raju, M. T., Bhutáni,U. & Sahay,A. (2004), “Corporate Debt Market In India: Key Issues AndPolicy Recommendations”., SEBI Working Paper Series No. 9
• Ramakrishnan, P. (2005), “Financial Distress Prediction Models: A Case Of Potential SickCompanies In India”, ICFAI Journal of Applied Finance, October r2005
• Ronn, E. & A. Verma. (1989), “Pricing Risk-Adjusted Deposit Insurance: An Option-BasedModel,” Journal of Finance, 41, 871-895.
• Roy,S., Darbha,G., Pawaskar,V.,(2003), The Risk Structure Of Interest Rates: Estimates ForThe Indian Corporate Bond Market”., Working Paper, National Stock Exchange.
• Sarig, O., & Warga, A.(1989), “Some Empirical Estimates Of The Risk Structure Of InterestRates”, Journal of Finance, Vol. 44, p. 1351-1360.
• Shah, Ajay & Thomas, Susan. (2000); “Systemic Fragility In Indian Banking: HarnessingInformation From The Equity Market”, I.G.I.D.R. Working Paper
• Sloan, R. (1996): “Do Stock Prices Fully Reflect Information In Accruals And Cash Flows AboutFuture Earnings?,” Accounting Review, 71(3), 289—315.
• Sobehart, Jorge R., Sean C. Keenan & Roger M. Stein. (2000). “Benchmarking QuantitativeDefault Risk Models: A Validation Methodology”. Moody's Special Comment: Moody's InvestorsService.
• Stein, Roger. (2002), “Benchmarking Default Prediction Models: Pitfalls and Remedies in ModelValidation”, Moody s Risk Management Services, Technical Report #020305.
• Tarashev,Nikola. (2005), “An Empirical Evaluation Of Structural Credit Risk Models”, BISWorking Papers No 179
• Teixeira J. (2005); “An Empirical Analysis of Structural Models of Corporate Debt Pricing “,Working Paper ,Lancaster University Management School
• Varma,J.R., Raghunathan, V. (2000), “Modelling Credit Risk In Indian Bond Markets”., ICFAI Journal of Applied Finance, 6(3), July 2000, 53-67.
• Wei, D. & Guo, D. (1997), “Pricing Risky Debt: An Empirical Comparison Of The Longstaff AndSchwartz And Merton Models,” Journal of Fixed Income, 7 (2), 8-28.