Embed Size (px)
Citation preview
How Finland Approaches Land Value Taxation:
An experiment to cost-effectively value land
in a system where land and structures are valued separately
Risto PELTOLA, Finland
Key words: Property Tax, Mass Appraisal, Land Valuation, Separate Valuation of Land and
Structures, Effective Property Tax Rate, CAMA, Computer Aided Mass Appraisal, Spatial Analysis
SUMMARY
Finland is among those rather few countries where higher rates are applied to land than structures in
property taxation. As the valuation methods used in our country are more than 20 years old, and the
valuation itself almost as old, the methods and the valuation itself are in urgent need of updating. A
new system of valuation was ordered by the Ministry of Finance, and it has now been developed.
Based on the availability of data and how valuable the location is, a toolbox of three valuation
methods is introduced:
1) for most invaluable land zip-code medians are recommended,
2) for more expensive land a spatial moving average of nearest comparable land sales is
recommended, and
3) for most expensive land a spatial moving average of nearest comparable apartment sales is
recommended as a second method.
In this paper those methods are explained and evaluated. The paper also includes results of an
extensive analysis of effective property tax rates.
How Finland Approaches Land Value Taxation: an Experiment to Cost-Effectively Value Land in a System Where
Land and Structures Are Valued Separately (8666)
Risto Peltola (Finland)
FIG Working Week 2017
Surveying the world of tomorrow - From digitalisation to augmented reality
Helsinki, Finland, May 29–June 2, 2017

How Finland Approaches Land Value Taxation:
An experiment to cost-effectively value land
in a system where land and structures are valued separately1
Risto PELTOLA, Finland
BACKGROUND AND PURPOSE OF THE STUDY
Finland used to have all these types of property taxes: (1) recurrent (annual) taxes on real
(immovable) property, (2) recurrent taxes on net wealth, (3) taxes on estates, inheritances, and gifts,
(4) taxes on financial and capital transactions (including real property transfers). The tax on net
wealth was recently abolished. Taxes on inheritances have recently been lowered and there was a
debate about abolishing them altogether (it didn’t happen). Taxes on real property transfers, on the
other hand, have been recently raised, in spite of a consensus view among economists about
harmful effect of those taxes on housing markets and other economic activity.
As annual property tax is a local tax the revenue of all other taxes on wealth and property go to the
coffers of central government. Arable and forest land is exempt from property tax.
It has been stated over and over again by experts and many politicians that the importance of annual
property tax will grow in my country. Indeed the revenue now on property taxes is many times what
it used to be when it was introduced in 1993. The maximum nominal rate was recently raised to 1,8
%, apart from for residential buildings 0,9 %. Maximum nominal rate for vacant building sites is as
high as 6 %. Another trend is expected to take place: the land portion of property tax will grow in
importance vis a vi the building portion.
As the revaluation will bring assessment values closer to market values the effective rates may
sometimes exceed 1 %. As to vacant building sites it will be sometimes much higher. All these
trends make a case for a good quality valuation system with uniform treatment of properties and
taxpayers. On the other hand, the system should be cost effective.
In most systems the taxable value of the property is the combined value of land and structures. It
may be seen more convinient to value the functional property as a whole. Indeeed, in the literature a
separate valuation of land and buildings is seen as a cause of complications:
Other complications can arise, especially in market value-based taxes. When land or
buildings is taxed separately, it is difficult to estimate the market value of each
component accurately. This difficulty also occurs under unified property taxes when
the assessor is required to divide total value into its land and buildings components. 1 An earlier version of this presentation was given at “2016 WORLD BANK CONFERENCE ON LAND
AND POVERTY”, The World Bank - Washington DC, March 14-18, 2016
How Finland Approaches Land Value Taxation: an Experiment to Cost-Effectively Value Land in a System Where
Land and Structures Are Valued Separately (8666)
Risto Peltola (Finland)
FIG Working Week 2017
Surveying the world of tomorrow - From digitalisation to augmented reality
Helsinki, Finland, May 29–June 2, 2017

This makes it difficult to implement a pure site value tax—a land tax based only on
the location value of the property. When a building or a unit in a building is sold, its
price will reflect the value of its location (also an element of land value). (Property
Tax Regimes in Europe. p. 24)
As to land for housing, Finland is one of those rather few countries, where separate rates are applied
to land and structures, higher rates to land, especially vacant land. In this sense there is certain
georgist spirit of land value taxation in the finnish system, although it has not been defended in
these terms. Rather the higher rates on land have been seen pragmatic land policy. Obviously land
and structures must be valued separatively. Indeed the valuation systems for land and structures are
separeted altogether and are executed in different offices, for reasons partly unknown to me. At may
continue that way even if new bodies of government take responsibility in these tasks.
The valuation of buildings is outside the scope of this paper. The scope and focus of this paper is to
offer a method to value land in all locations. Land is to be valued in areas with plenty of land sales
data as well as in areas with scarcity of sales data, and even in locations where most land is built
and there is not much vacant land to be sold to start with, and the land may be of highest value in
the country.
The ministry of finance ordered the National Land Survey of Finland to calculate land values for
property taxation for all properties in the tax base, more some two million units. The project was
started in January 2017 and is due to be completed by the end of 2019.
The structure of my presentation is following: An extensive performance analysis on property taxes
was carried out in Finland, namely analysis of effective property tax rates and ratios between
assessment values and market values, based on a large database on market data. The results of that
analysis are presented (part I). Based on that analysis a new system for property valuation for
taxation purposes was developed. The prototype of that valuation system is presented (part II).
How Finland Approaches Land Value Taxation: an Experiment to Cost-Effectively Value Land in a System Where
Land and Structures Are Valued Separately (8666)
Risto Peltola (Finland)
FIG Working Week 2017
Surveying the world of tomorrow - From digitalisation to augmented reality
Helsinki, Finland, May 29–June 2, 2017
PART I: CURRENT PROPERTY TAXATION IN FINLAND THE INSTITUIONAL
SETTING
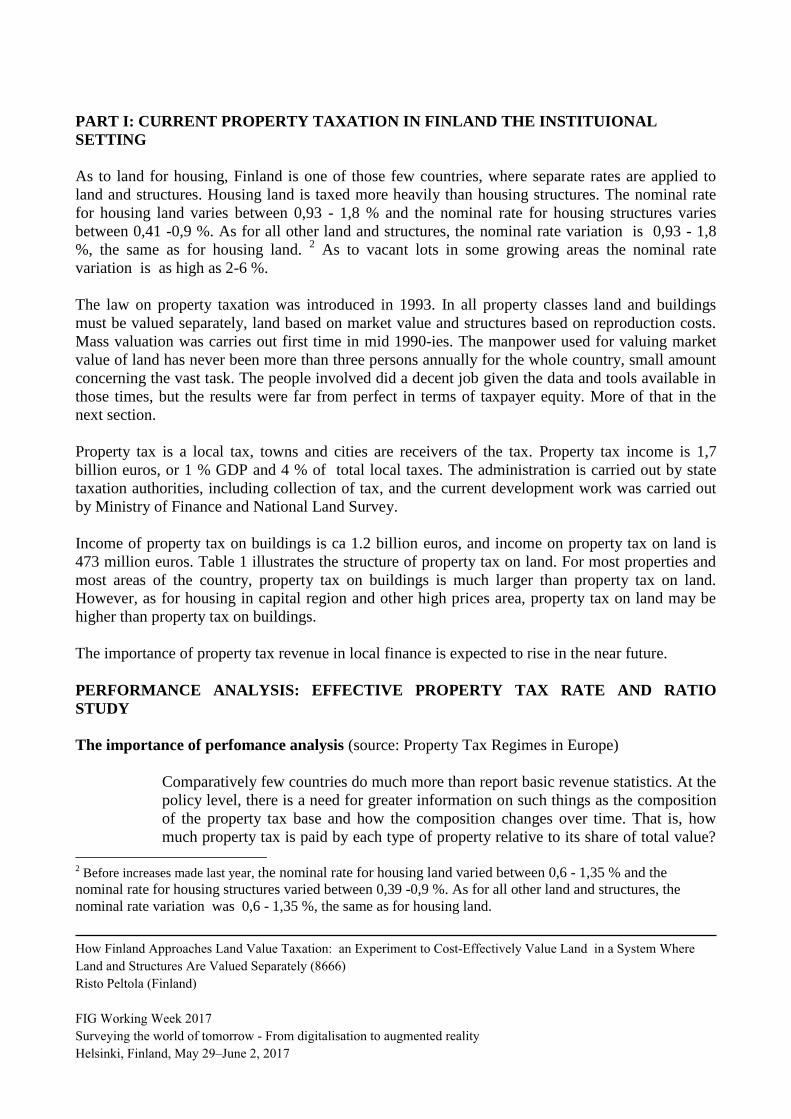
As to land for housing, Finland is one of those few countries, where separate rates are applied to
land and structures. Housing land is taxed more heavily than housing structures. The nominal rate
for housing land varies between 0,93 - 1,8 % and the nominal rate for housing structures varies
between 0,41 -0,9 %. As for all other land and structures, the nominal rate variation is 0,93 - 1,8
%, the same as for housing land. 2 As to vacant lots in some growing areas the nominal rate
variation is as high as 2-6 %.
The law on property taxation was introduced in 1993. In all property classes land and buildings
must be valued separately, land based on market value and structures based on reproduction costs.
Mass valuation was carries out first time in mid 1990-ies. The manpower used for valuing market
value of land has never been more than three persons annually for the whole country, small amount
concerning the vast task. The people involved did a decent job given the data and tools available in
those times, but the results were far from perfect in terms of taxpayer equity. More of that in the
next section.
Property tax is a local tax, towns and cities are receivers of the tax. Property tax income is 1,7
billion euros, or 1 % GDP and 4 % of total local taxes. The administration is carried out by state
taxation authorities, including collection of tax, and the current development work was carried out
by Ministry of Finance and National Land Survey.
Income of property tax on buildings is ca 1.2 billion euros, and income on property tax on land is
473 million euros. Table 1 illustrates the structure of property tax on land. For most properties and
most areas of the country, property tax on buildings is much larger than property tax on land.
However, as for housing in capital region and other high prices area, property tax on land may be
higher than property tax on buildings.
The importance of property tax revenue in local finance is expected to rise in the near future.
PERFORMANCE ANALYSIS: EFFECTIVE PROPERTY TAX RATE AND RATIO
STUDY
The importance of perfomance analysis (source: Property Tax Regimes in Europe)
Comparatively few countries do much more than report basic revenue statistics. At the
policy level, there is a need for greater information on such things as the composition
of the property tax base and how the composition changes over time. That is, how
much property tax is paid by each type of property relative to its share of total value?
2 Before increases made last year, the nominal rate for housing land varied between 0,6 - 1,35 % and the
nominal rate for housing structures varied between 0,39 -0,9 %. As for all other land and structures, the
nominal rate variation was 0,6 - 1,35 %, the same as for housing land.
How Finland Approaches Land Value Taxation: an Experiment to Cost-Effectively Value Land in a System Where
Land and Structures Are Valued Separately (8666)
Risto Peltola (Finland)
FIG Working Week 2017
Surveying the world of tomorrow - From digitalisation to augmented reality
Helsinki, Finland, May 29–June 2, 2017

This addresses the interplay of such factors as differential tax rates, differing bases of
assessments, and differing exemption amounts. (Property Tax Regimes in Europe. p.
61)
In a valued-based property tax, valuation accuracy is—or should be—an important
concern. The chief tool used to gauge valuation accuracy in mass appraisal for
property tax purposes is a “ratio study” (Gloudemans and Almy, 2011). Such a study
is an investigation of how closely the valuations that property taxes are based on
compare to market values (either current market values or the values on the valuation
date). Actual prices from transactions deemed to be open-market, arm’s length sales
are used as evidence of market values, and the “ratio” in a ratio study simply is the
ratio of the valuation to the sale price. (Property Tax Regimes in Europe. p. 62)
In a ratio study, sales ratios would be calculated for all the sales that were deemed
usable and patterns in the ratios would be examined. The statistics calculated in ratio
studies mainly deal with the level of value and the uniformity of values. Level of value
is measured by a measure of central tendency, such as the median, the common
arithmetic mean, and the weighted mean. There are several aspects to uniformity. If
the question is whether two or more groups of property are valued uniformly,
measures of central tendency are compared. If the question is whether all the
properties in a group are valued uniformly, a measure of variability is calculated.
(Property Tax Regimes in Europe. p. 62)
The coefficient of dispersion is the chief measure used. Sometimes, the concern is
whether high-value properties and low-value properties are valued uniformly, other
tests are used here. (The same concepts can be applied in studies of annual rental
value assessments.) Denmark, Iceland, Lithuania, Northern Ireland, and Sweden are
among the countries that routinely evaluate valuation performance using ratio studies.
(Property Tax Regimes in Europe. p. 62)
The execution of perfomance analysis
Effective property tax rates were analyzed in all property classes where sufficient market data is
available, namely housing properties and property for commercial and industrial purposes. Sales of
built and unbuilt properties were analyzed. The relevant assessment value for built properties was
the sum of assessment value of land and structures. As for unbuilt properties, the relevant
assessment value was the assessment value of land only, of course.
Units of comparison were total price of the property and unit price of the property, depending on
type of property. The market data covered 28 years. Table 2 shows the calculation system of the
ratio of assessment value to market value.
How Finland Approaches Land Value Taxation: an Experiment to Cost-Effectively Value Land in a System Where
Land and Structures Are Valued Separately (8666)
Risto Peltola (Finland)
FIG Working Week 2017
Surveying the world of tomorrow - From digitalisation to augmented reality
Helsinki, Finland, May 29–June 2, 2017

The results were published in 2014. They reveal that in all jurisdictions the assessments values were
quite low compared to market prices. Housing properties had the lowest relative assessments
values. The median of relative assessment values (ratio of assessment value to market value) were
20-40 % for multifamily housing, 20-50 % for single family houses, 20-60 % for housing lots and
30-70 % for non-housing properties. The lowest ratios very usually in expensive locations.
The median effective tax rates were 0,08 - 0,2 % for multifamily housing, 0,1 - 0,3 % for single
family houses, 0,1 - 0,4 % for housing lots and 0,1 - 0,5 for non-housing lots. Again, the lowest
levels very usually in expensive locations. Table 3 shows ratio and equity statistics in the Finnish
property taxation.
The variation between jurisdictions, as well as within a jurisdiction, is large. The analysis revealed
large problems in equal treatment of tax payers. Inequity is a problem in its own right. However, it
is an even larger problems if it is an obstacle for a property tax to be a more important source of
local finance.
PART II: INTRODUCING A NEW SET OF METHODS FOR VALUATION KEY SKILLS
NEEDED AND METHODS USED
Skills in valuation, statistics, econometrics, geomatics, and computing are needed and have been
used to develop state-of-the-art mass valuation models. The databases on which they depend where
taken mostly from public databases, and in some cases non-public databases kept by taxation
authorities.
The key methods are intensive use of market information, simple hedonic models and spatial
analysis. The main innovation is a mix of standard hedonic regression and spatial analysis, mainly
indentyfying nearest property sales and calculating spatial moving average.
DATA AVAILABILITY
Data has been gathered from these sources:
1) property tax records of 2011 and 2014 taxation (source: Taxation authorities).
2) condominium sales 1987 - 2014 (october), which are collected for tranfer and sales profit
taxation purposes (source: Taxation authorities).
3) land and other real property sales 1986 - 2015 (Official real property sales price register,
kept by National Land Survey)
4) cadastre
5) zip code area subdivision
6) grid data 250x250 m2 (major cities only)
Land price data includes 254.000 million of urban land sales made in 1985-2015. Apartment price
data includes 942.000 apartment sales made in 1987-2014.
How Finland Approaches Land Value Taxation: an Experiment to Cost-Effectively Value Land in a System Where
Land and Structures Are Valued Separately (8666)
Risto Peltola (Finland)
FIG Working Week 2017
Surveying the world of tomorrow - From digitalisation to augmented reality
Helsinki, Finland, May 29–June 2, 2017

Lot ratios are from taxation authorities. No other planning data was used. However, zoning maps
and other data is available in electric format in most cities nowadays (180 cities and towns).
THE ADEQUACY OF MARKET INFORMATION
The adequacy or market information is examined in figure 1, which shows the number of housing
lot sales in every zip code area, and the number of condominium sales in the same area. The number
of sales comprises all sales made during the last 28 years, so most of the sales are of inferior value
for valuation purposes. Most zip areas have more than 100 lot sales, so there must be more than
enough recent sales also to determine not only the median land value in the area, but also some
variation in land values within the area.
Some areas only have less than 10 lot sales made during a long period of 28 years, and in some
cases the number of lot sales is only one or two. In the upper left corner of figure 1 is shown some
one hundred zip areas with only a few land sales but more than a hundred-fold number of
condominium sales. As it happens, these areas are those with most expensive land in the country.
The more expensive land, the fewer vacant lots, and the fewer sales of them. On top of that there is
often something unique about those sales, so the sales prices of most expensive locations are not
always representative or at least need a closer inspection.
Some of these expensive areas are in CBD of course. However most of it is residential and there is
vast amount of condominium sales, where a share of residential property aka “housing association”
(comprising land and structures) is sold, so there is an implicit land price, or the price of location,
included in these condominium prices. The connection between land prices and condominium
prices cannot be analyzed in a property level, because there seldom is a land sale where
condominiums later sell, and even if there is that land sale may be very old. However, the
connection between land prices and condominium prices can be analyzed in a city level, and more
importantly in a zip code level and a grid level.
OVERVIEW OF THE PRICE LANDSCAPE
To approach the price landscape, three levels of accuracy are used: The crudest level is a zip area
comprising up to 10.000 properties. The intermediate levels are grids of 100 ha or 6.25 ha,
comprising usually 20-100 properties. The most accurate level is the property subdivision itself.
Mean property values are calculated for each level. As to the property level, standardized housing
prices are used as a proxy to land prices.
The overview of the price landscape helps determine the most cost-effective way of valuation, and
may in some cases be the valuation itself. Figure 3 gives a macro view of price landscape using zip
area subdivision. Figure 4 gives a more detailed view of price landscape using grids in Helsinki
MPA. Figure 5 gives a micro view of price landscape using property subdivision and constant
quality apartment prices.
How Finland Approaches Land Value Taxation: an Experiment to Cost-Effectively Value Land in a System Where
Land and Structures Are Valued Separately (8666)
Risto Peltola (Finland)
FIG Working Week 2017
Surveying the world of tomorrow - From digitalisation to augmented reality
Helsinki, Finland, May 29–June 2, 2017
There are 2 million property units subject to property taxation in Finland. There are 5 million
250x250 m2 grids in Finnish land area, but an urban grid usually consists more than 10 properties.
There are 3016 zip codes and 300 communities. All those subdivisions are relevant in property
taxation: as the object of valuation, as a receiver of the tax revenue and as a setter of the tax rate, or
as a methodological unit.
From a mass valuation point of view grids and zip code areas are very useful units of subdivision:
there is enough data, preliminary property values can be calculated with small effort, and land
values can be systematically compared to housing values.
MODELLING LAND PRICES
The impact of location on land prices is the purpose of the analysis, so all the other variables apart
from spatial are control variables, and spatial variables are excluded from the model to be analyzed
later by GIS tools. As the location is the single most important argument factor, only a small
number of control variables are needed. Time is controlled firstly by deflating all prices by house
price index, and secondly by a trend correction term. Zoning of land and size of lot are also
controlled. An example of model specification is given in table 4.
A grid (250x250 m2) map of average values are made to help determine which method to use, and
to give a second look at the price landscape. Only urban land is subject to property taxation in
Finland, and the number of urban grids is ca 200.000 in urban areas.
THE TOOLBOX FOR PRACTICAL USE: A SET OF 3 VALUATION METHODS TO
CHOOSE FROM
In search of a scalable, cost-effective way to calculate more than 2 million land values, a multiple
method approach is proposed. There are three methods that are very different from each other in
terms of accuracy, effort, costs and ease of use. The methods are, from less accurate to most
accurate:
A. Zip code area median price. This method is less accurate, very easy to use, very cheap.
B. Nearest lot sales. This is the main method, quite accurate, quite costly.
C. Nearest condo sales. This is most difficult to use, quite accurate even when land price data is
scarce.
How Finland Approaches Land Value Taxation: an Experiment to Cost-Effectively Value Land in a System Where
Land and Structures Are Valued Separately (8666)
Risto Peltola (Finland)
FIG Working Week 2017
Surveying the world of tomorrow - From digitalisation to augmented reality
Helsinki, Finland, May 29–June 2, 2017
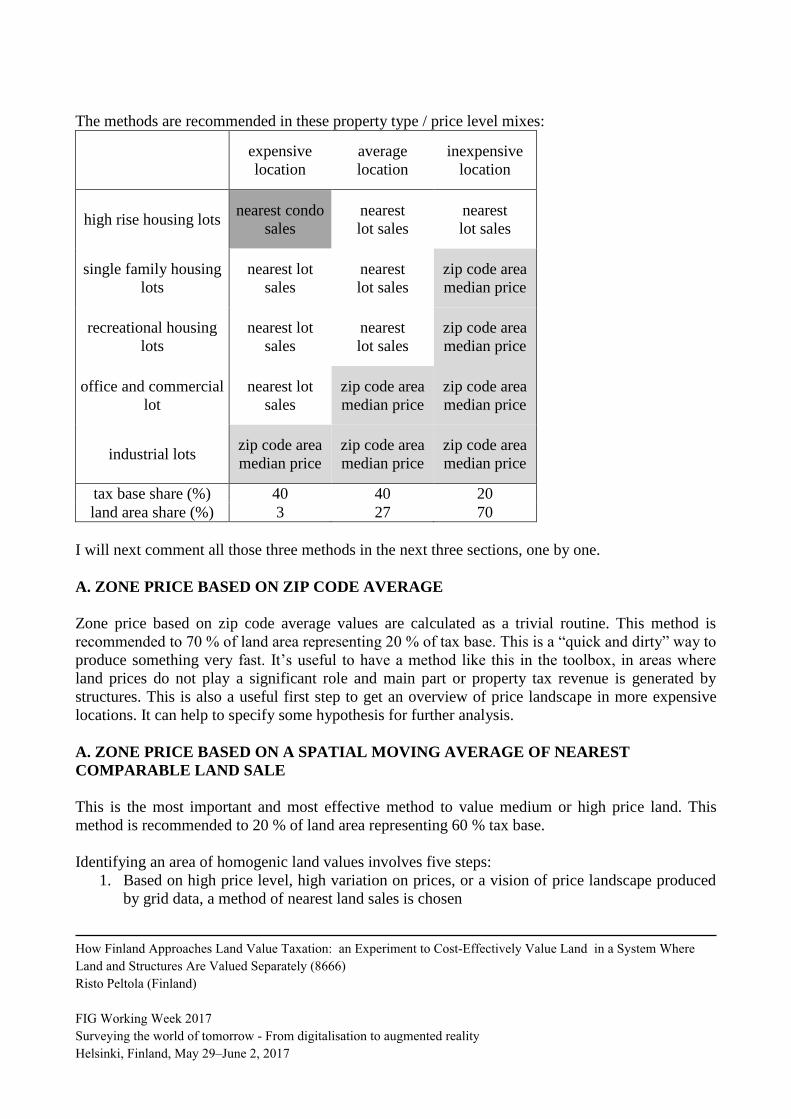
The methods are recommended in these property type / price level mixes:
expensive
location
average
location
inexpensive
location
high rise housing lots nearest condo
sales
nearest
lot sales
nearest
lot sales
single family housing
lots
nearest lot
sales
nearest
lot sales
zip code area
median price
recreational housing
lots
nearest lot
sales
nearest
lot sales
zip code area
median price
office and commercial
lot
nearest lot
sales
zip code area
median price
zip code area
median price
industrial lots zip code area
median price
zip code area
median price
zip code area
median price
tax base share (%) 40 40 20
land area share (%) 3 27 70
I will next comment all those three methods in the next three sections, one by one.
A. ZONE PRICE BASED ON ZIP CODE AVERAGE
Zone price based on zip code average values are calculated as a trivial routine. This method is
recommended to 70 % of land area representing 20 % of tax base. This is a “quick and dirty” way to
produce something very fast. It’s useful to have a method like this in the toolbox, in areas where
land prices do not play a significant role and main part or property tax revenue is generated by
structures. This is also a useful first step to get an overview of price landscape in more expensive
locations. It can help to specify some hypothesis for further analysis.
A. ZONE PRICE BASED ON A SPATIAL MOVING AVERAGE OF NEAREST
COMPARABLE LAND SALE
This is the most important and most effective method to value medium or high price land. This
method is recommended to 20 % of land area representing 60 % tax base.
Identifying an area of homogenic land values involves five steps:
1. Based on high price level, high variation on prices, or a vision of price landscape produced
by grid data, a method of nearest land sales is chosen
How Finland Approaches Land Value Taxation: an Experiment to Cost-Effectively Value Land in a System Where
Land and Structures Are Valued Separately (8666)
Risto Peltola (Finland)
FIG Working Week 2017
Surveying the world of tomorrow - From digitalisation to augmented reality
Helsinki, Finland, May 29–June 2, 2017
2. Constant quality, deflated unit land prices are calculated by hedonic regression. Only spatial
factors are left out of regression.
3. Nearest land sales are automatically identified and a suitable number, between three and
nine of them, is chosen
4. Spatial moving average of land prices is calculated automatically
5. Price zones are finished by manual interpretation
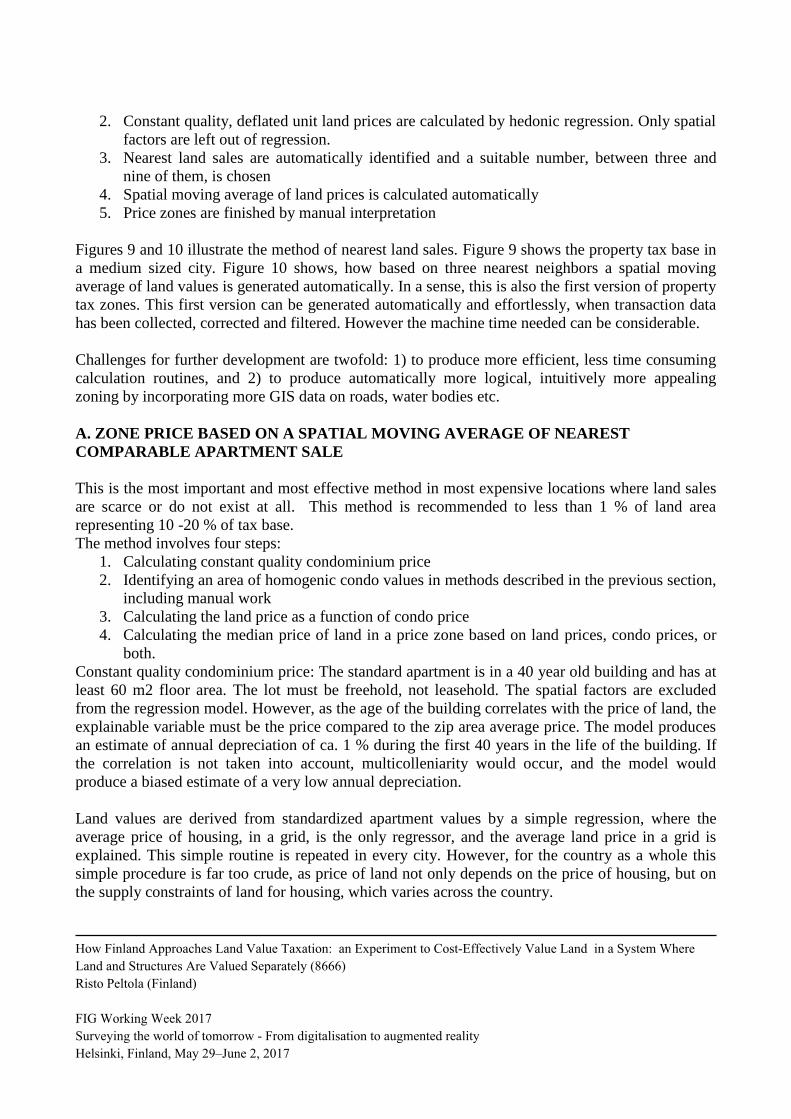
Figures 9 and 10 illustrate the method of nearest land sales. Figure 9 shows the property tax base in
a medium sized city. Figure 10 shows, how based on three nearest neighbors a spatial moving
average of land values is generated automatically. In a sense, this is also the first version of property
tax zones. This first version can be generated automatically and effortlessly, when transaction data
has been collected, corrected and filtered. However the machine time needed can be considerable.
Challenges for further development are twofold: 1) to produce more efficient, less time consuming
calculation routines, and 2) to produce automatically more logical, intuitively more appealing
zoning by incorporating more GIS data on roads, water bodies etc.
A. ZONE PRICE BASED ON A SPATIAL MOVING AVERAGE OF NEAREST
COMPARABLE APARTMENT SALE
This is the most important and most effective method in most expensive locations where land sales
are scarce or do not exist at all. This method is recommended to less than 1 % of land area
representing 10 -20 % of tax base.
The method involves four steps:
1. Calculating constant quality condominium price
2. Identifying an area of homogenic condo values in methods described in the previous section,
including manual work
3. Calculating the land price as a function of condo price
4. Calculating the median price of land in a price zone based on land prices, condo prices, or
both.
Constant quality condominium price: The standard apartment is in a 40 year old building and has at
least 60 m2 floor area. The lot must be freehold, not leasehold. The spatial factors are excluded
from the regression model. However, as the age of the building correlates with the price of land, the
explainable variable must be the price compared to the zip area average price. The model produces
an estimate of annual depreciation of ca. 1 % during the first 40 years in the life of the building. If
the correlation is not taken into account, multicolleniarity would occur, and the model would
produce a biased estimate of a very low annual depreciation.
Land values are derived from standardized apartment values by a simple regression, where the
average price of housing, in a grid, is the only regressor, and the average land price in a grid is
explained. This simple routine is repeated in every city. However, for the country as a whole this
simple procedure is far too crude, as price of land not only depends on the price of housing, but on
the supply constraints of land for housing, which varies across the country.
How Finland Approaches Land Value Taxation: an Experiment to Cost-Effectively Value Land in a System Where
Land and Structures Are Valued Separately (8666)
Risto Peltola (Finland)
FIG Working Week 2017
Surveying the world of tomorrow - From digitalisation to augmented reality
Helsinki, Finland, May 29–June 2, 2017

Figure 8 and tables 5 illustrate the relationship of high rise residential land price and condominium
price.
Table 6 gives a model of high rise residential lot sales price (€/floor-m2) as a function of constant
quality condominium sale price. Table 7 gives a model of high rise residential lot sales price with a
different explainable variable (€/land-m2) as a function of constant quality condominium sale price.
In the first model parameters are around unity (one), in the second model parameters are around
two. When lot ratios are modelled as a function of constant quality condominium sale price, the
parameters are again around one. The conclusion is simple: the most expensive land is so expensive
because unit prices for floor-m2 are high, and because the land is built more efficiently.
Zone price based on a spatial moving average of nearest comparable apartment sales follows the
procedure presented with land sales. A land share of an apartment prices ratio is useful and it is
calculated.
The land price can also be calculated using sales prices of single family homes. As there is usually
data on vacant lot sales in areas zoned for single family housing, using single family homes sales
data is not essential. However using that data gives a valuable extra view in the price landscape, and
coupled with lot sales data, produces a rich view on prices.
PART III: CONCLUSIONS
According to literature the best practice shows that all four steps in property tax administration
(identification of properties, valuation, recordkeeping, and collection) should be part of any
administrative reform program. To leave out even one of the basic pillars of administration may
jeopardize the success of a property tax reform, whether in terms of revenue mobilization or any
other objectives the reform was designed to achieve (Property Tax Regimes in Europe. p. 61). In
Finland the property tax base is rather well identified with the help of local governments, the
recipients of the tax. The fiscal cadaster is in a rather good shape, although it requires far too much
manual work in the update process. Collection performance is among the best in the world.
Valuation and recordkeeping are clearly the weakest pillars.
The aim is to derive the land part of the property value for all the property tax base. In most cases
comparable prices of land sales are enough. In most valuable locations land sales are scarce, but
home sales are abundant. It’s possible to derive the land share of house prices.
The relevant techniques are:
1. Extensive use of standard regression analysis
2. Calculating constant quality home prices
3. Indentifying nearest comparable sales and calculating spatial moving average
Based on the availability of data and how valuable the location is, a toolbox of three valuation
methods is introduced:
1. for most invaluable land zip-code medians are recommended,
How Finland Approaches Land Value Taxation: an Experiment to Cost-Effectively Value Land in a System Where
Land and Structures Are Valued Separately (8666)
Risto Peltola (Finland)
FIG Working Week 2017
Surveying the world of tomorrow - From digitalisation to augmented reality
Helsinki, Finland, May 29–June 2, 2017

2. for more expensive land a spatial moving average of nearest comparable land sales is
recommended, and
3. for most expensive land a spatial moving average of nearest comparable apartment sales is
recommended as a second method.
The project has just started and it is too early to draw conclusions. In three years the new property
taxation tool is in use and experience will tell how accurate and cost-effective it will be.
The finnish approach with spatial analysis, standard statitical models and intensive use of all
possible price data offers a potential to produce rather accurate land price estimates at low cost,
even in the absense of actual land price data in some locations.
As to future revaluation cycles “Property Tax Regimes in Europe“ offers this insight:
Changing from intermittent revaluation projects to an annual reassessment program
can offer major benefits. The most important is that property tax burdens are more
equitably distributed. Changes in the composition of the tax base are more gradual,
which reduces popular and political opposition to revaluations. Property owners can
more easily predict what their property taxes will be, and taxing districts can better
judge their property tax capacity. Lastly, the annual costs of an ongoing revaluation
program often compare favorably with the annualized costs of periodic revaluations.
To argue for frequent revaluations is not to argue that all recurrent taxes on
immovable property should be value-based. As previously noted, there are situations
in which area based property taxes are appropriate, and a well-administered area-base
tax likely is more acceptable than a badly neglected value-based property tax.
(Property Tax Regimes in Europe. p. 62)
After the revaluation is ready in 2019, the next revaluation should be in 3-6 years. The goal in
Finland should be an annual reassessment program. It should not be too unrealistic.
REFERENCES
Gloudemans, R., and Almy, R. (2011) Fundamentals of Mass Appraisal, Kansas City: International
Grover, R., Törhönen, M.-P., Munro-Faure, P., & Anand, A. (2015). Property Valuation and
Taxation for Fiscal Sustainability and Improved Local Governance in the Europe and Central Asia
Region. Land Tenure Journal (2).
IAAO standards (International Association of Assessing Officers). http://www.iaao.org/
Standard on Mass Appraisal of Real Property (Apr 2013)
Standard on Ratio Studies (Apr 2013)
How Finland Approaches Land Value Taxation: an Experiment to Cost-Effectively Value Land in a System Where
Land and Structures Are Valued Separately (8666)
Risto Peltola (Finland)
FIG Working Week 2017
Surveying the world of tomorrow - From digitalisation to augmented reality
Helsinki, Finland, May 29–June 2, 2017

Kathmann, Ruud and Kuijper, Marco,: The Three Key Principles For Mass Appraisal: Data Quality,
Data Quality And Data Quality “2016 WORLD BANK CONFERENCE ON LAND AND
POVERTY”. The World Bank - Washington DC, March 14-18, 2016
Property Tax Regimes in Europe. United Nations Human Settlements Programme Nairobi 2013
Söderblom, Hans. Mass Valuation in Sweden. Lantmäteriet The Swedish Mapping, Cadastraland
Land Registration Authority. Hans Söderblom, 2016-05-12
Tomson, Aivar. Key issues of mass valuation in countries under transition. Department Department
of Real Estate, Planning and Geoinformatics. Date of submission for examination 29.03.2012
CONTACTS
Risto Peltola
Senior advisor
National Land Survey
POBox 84, 00521 Helsinki
tel: ++358 40 801 7674
How Finland Approaches Land Value Taxation: an Experiment to Cost-Effectively Value Land in a System Where
Land and Structures Are Valued Separately (8666)
Risto Peltola (Finland)
FIG Working Week 2017
Surveying the world of tomorrow - From digitalisation to augmented reality
Helsinki, Finland, May 29–June 2, 2017

Table 1. The amount and structure of property tax on land, 2014
number assessment
value (mill.€)
property tax on land
(mill.€)
all properties 2175817 57475 473
shares (%) 2013
type of property number assessment
value (mill.€)
property tax on land
(mill.€)
residential 69 % 62 % 64 %
office/retail 1 % 14 % 13 %
logistics 1 % 1 % 1 %
recreation 26 % 11 % 13 %
industrial 2 % 4 % 4 %
public 1 % 6 % 4 %
Table 2. System of comparing assessment value and market value
assesment
value unit
market
value remarks
land
housing lot
of land €/land-m2
real estate
sale
most recent sale after
1985
vacation housing lot
commercial/industrial lot
built property
multifamily building
of land and
building
together
€/floor
area-m2
comdomi-
nium sale
all sales in 1987-
2011
single family building
€
real estate
sale
most recent sale after
1985
vacation building
commercial/industrial building
How Finland Approaches Land Value Taxation: an Experiment to Cost-Effectively Value Land in a System Where
Land and Structures Are Valued Separately (8666)
Risto Peltola (Finland)
FIG Working Week 2017
Surveying the world of tomorrow - From digitalisation to augmented reality
Helsinki, Finland, May 29–June 2, 2017

Table 3. Ratio and equity statistics in Finnish property taxation, 2011
the ratio of assessment value to market value
(%) effective
property tax
rate (0,01 %) Median standard deviation (log)
all country within a
jurisdiction Median
housing, several apartments 25 0,49 0,32 12
single family house 32 0,70 0,67 15
lot for housing 34 0,94 1,00 25
second home, recreation 29 0,72 0,69 27
lot for second home, recreation 32 0,97 0,97 22
commercial-industrial, built 42 1,14 1,07 34
commercial-industrial lot 47 1,17 1,12 32
Table 4. Housing lot price model specification
LBRPRICE = α + βt * TIME + βa * LLOTAREA + βr * ADJACENTTOSEE + ε, where
LBRPRICE = ln (price of building right €/floor-m2)
TIME = time of sale = year - 2000 + month /12
LLOTAREA = ln (LOTAREA)
LOTAREA = lot area m2, max 1000 m2 in cities and towns , max 3000 m2 elsewhere
ADJACENTTOSEE = 1, when the sale is adjacent to see, otherwise = 0
Α = constant
βt, βa , βr = parameter values
ε = error term
ln =natural log
How Finland Approaches Land Value Taxation: an Experiment to Cost-Effectively Value Land in a System Where
Land and Structures Are Valued Separately (8666)
Risto Peltola (Finland)
FIG Working Week 2017
Surveying the world of tomorrow - From digitalisation to augmented reality
Helsinki, Finland, May 29–June 2, 2017
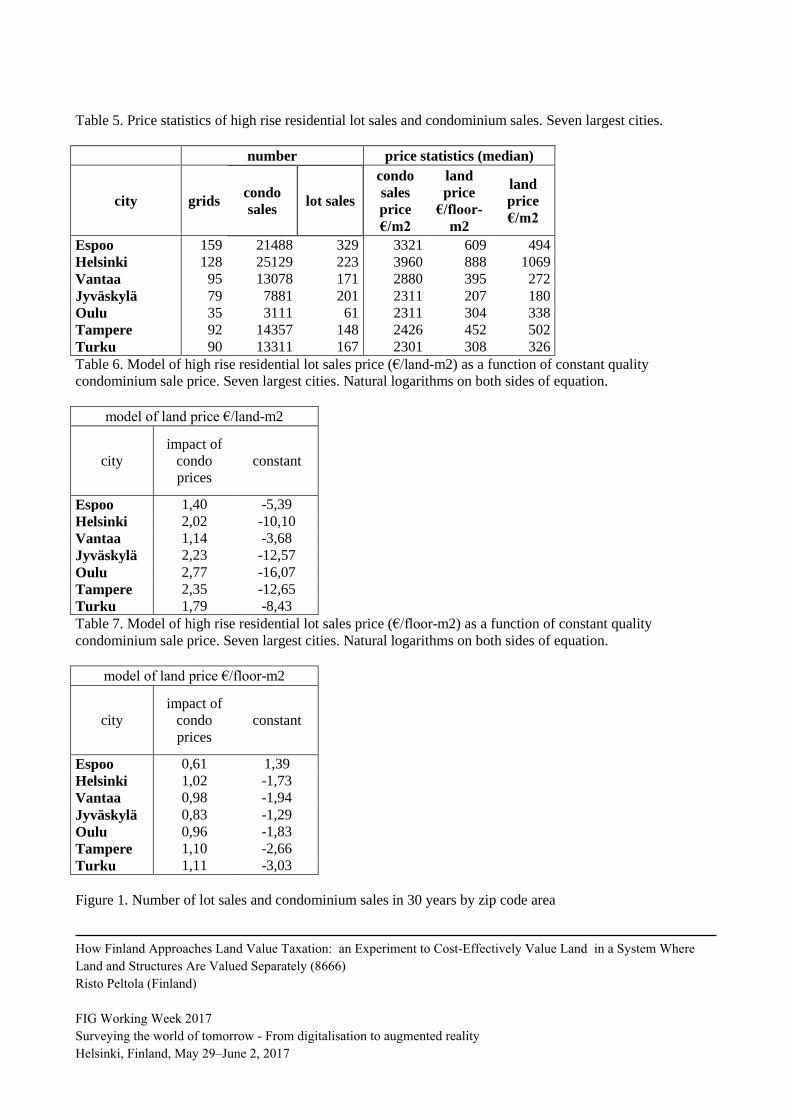
Table 5. Price statistics of high rise residential lot sales and condominium sales. Seven largest cities.
number price statistics (median)
city grids condo
sales lot sales
condo
sales
price
€/m2
land
price
€/floor-
m2
land
price
€/m2
Espoo 159 21488 329 3321 609 494
Helsinki 128 25129 223 3960 888 1069
Vantaa 95 13078 171 2880 395 272
Jyväskylä 79 7881 201 2311 207 180
Oulu 35 3111 61 2311 304 338
Tampere 92 14357 148 2426 452 502
Turku 90 13311 167 2301 308 326
Table 6. Model of high rise residential lot sales price (€/land-m2) as a function of constant quality
condominium sale price. Seven largest cities. Natural logarithms on both sides of equation.
model of land price €/land-m2
city
impact of
condo
prices
constant
Espoo 1,40 -5,39
Helsinki 2,02 -10,10
Vantaa 1,14 -3,68
Jyväskylä 2,23 -12,57
Oulu 2,77 -16,07
Tampere 2,35 -12,65
Turku 1,79 -8,43
Table 7. Model of high rise residential lot sales price (€/floor-m2) as a function of constant quality
condominium sale price. Seven largest cities. Natural logarithms on both sides of equation.
model of land price €/floor-m2
city
impact of
condo
prices
constant
Espoo 0,61 1,39
Helsinki 1,02 -1,73
Vantaa 0,98 -1,94
Jyväskylä 0,83 -1,29
Oulu 0,96 -1,83
Tampere 1,10 -2,66
Turku 1,11 -3,03
Figure 1. Number of lot sales and condominium sales in 30 years by zip code area
How Finland Approaches Land Value Taxation: an Experiment to Cost-Effectively Value Land in a System Where
Land and Structures Are Valued Separately (8666)
Risto Peltola (Finland)
FIG Working Week 2017
Surveying the world of tomorrow - From digitalisation to augmented reality
Helsinki, Finland, May 29–June 2, 2017

Figure 2. Price of housing lot and condominium in 2014 by zip code area
Figure 3. Price of single family home by zip code area, Southern Finland
100
1000
10000
100000
1 10 100 1000 10000
nu
mb
er o
f co
nd
o s
ales
in 3
0 y
ears
number of lot sales in 30 years
1
10
100
1000
10000
512 2048 8192
pri
ce o
f la
nd
€/m
2
price of housing €/floor-m2
How Finland Approaches Land Value Taxation: an Experiment to Cost-Effectively Value Land in a System Where
Land and Structures Are Valued Separately (8666)
Risto Peltola (Finland)
FIG Working Week 2017
Surveying the world of tomorrow - From digitalisation to augmented reality
Helsinki, Finland, May 29–June 2, 2017

Figure 4. Constant quality price of condominium by grid, Helsinki MPA
ashi15
0,000000 - 2600,000000
2600,000001 - 3200,000000
3200,000001 - 4000,000000
4000,000001 - 5000,000000
5000,000001 - 8070,000000
How Finland Approaches Land Value Taxation: an Experiment to Cost-Effectively Value Land in a System Where
Land and Structures Are Valued Separately (8666)
Risto Peltola (Finland)
FIG Working Week 2017
Surveying the world of tomorrow - From digitalisation to augmented reality
Helsinki, Finland, May 29–June 2, 2017
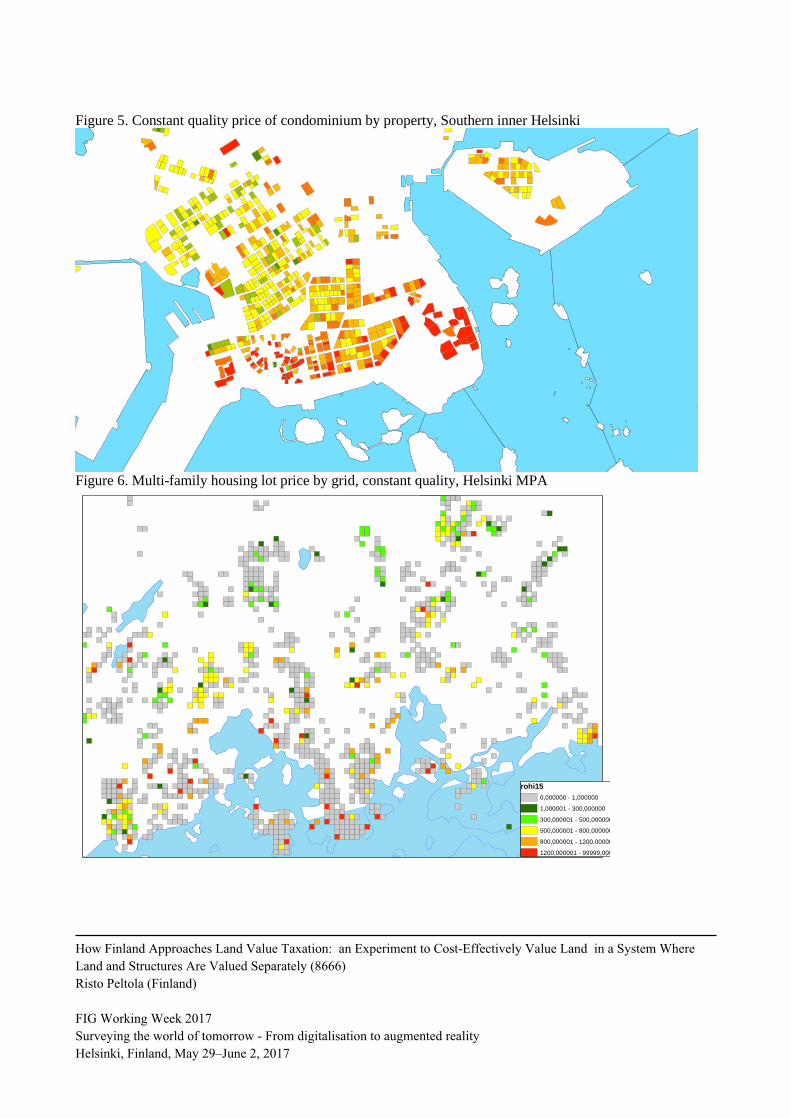
Figure 5. Constant quality price of condominium by property, Southern inner Helsinki
Figure 6. Multi-family housing lot price by grid, constant quality, Helsinki MPA
rohi15
0,000000 - 1,000000
1,000001 - 300,000000
300,000001 - 500,000000
500,000001 - 800,000000
800,000001 - 1200,000000
1200,000001 - 99999,000000
How Finland Approaches Land Value Taxation: an Experiment to Cost-Effectively Value Land in a System Where
Land and Structures Are Valued Separately (8666)
Risto Peltola (Finland)
FIG Working Week 2017
Surveying the world of tomorrow - From digitalisation to augmented reality
Helsinki, Finland, May 29–June 2, 2017

Figure 7. Land share of housing price by grid, Helsinki MPA
Figure
Figure 8. Housing land price (€/m2) as function of house price. 77 commuting areas in the country.
tos
0,000000 - 1,000000
1,000001 - 10,000000
10,000001 - 17,000000
17,000001 - 25,000000
25,000001 - 35,000000
35,000001 - 9999,000000
y = 3,4158x + 0,4206
-3,00
-2,00
-1,00
0,00
1,00
2,00
3,00
-0,80 -0,60 -0,40 -0,20 0,00 0,20 0,40 0,60 0,80
log
of
ho
usi
ng
lot
p
rice
(Fi
nla
nd
=0)
log of house price (Finland=0)
How Finland Approaches Land Value Taxation: an Experiment to Cost-Effectively Value Land in a System Where
Land and Structures Are Valued Separately (8666)
Risto Peltola (Finland)
FIG Working Week 2017
Surveying the world of tomorrow - From digitalisation to augmented reality
Helsinki, Finland, May 29–June 2, 2017

Figure 9. Property tax base in a medium sized city (Kouvola). Brown indicates lots owned by other than the
city itself. Green indicates lots owned by the city itself that do not have to pay property tax on land. Lilac
indicates housing lot sales.
How Finland Approaches Land Value Taxation: an Experiment to Cost-Effectively Value Land in a System Where
Land and Structures Are Valued Separately (8666)
Risto Peltola (Finland)
FIG Working Week 2017
Surveying the world of tomorrow - From digitalisation to augmented reality
Helsinki, Finland, May 29–June 2, 2017

Figure 10. Based on three nearest neighbors a spatial moving average of land values is generated
automatically.
How Finland Approaches Land Value Taxation: an Experiment to Cost-Effectively Value Land in a System Where
Land and Structures Are Valued Separately (8666)
Risto Peltola (Finland)
FIG Working Week 2017
Surveying the world of tomorrow - From digitalisation to augmented reality
Helsinki, Finland, May 29–June 2, 2017