Embed Size (px)
Citation preview
How Finances Affect the Educational Ambitions of Two-year College Students
Katharine Broton & Sara Goldrick-RabDepartments of Sociology & Educational Policy Studies
July 8, 2011

Higher Education Today
• High school students have high educational expectations
• 80% of high school sophomores expect to earn a B.A. or higher and 12% expect an associate’s degree or certificate
• Two-thirds of high school graduates enroll in higher education
• Stratified higher education system • Income gap
• College completion rates are stagnant
• 20% students at public 2-year colleges earn a degree in 3 yrs.• Varies by institutional and student factors
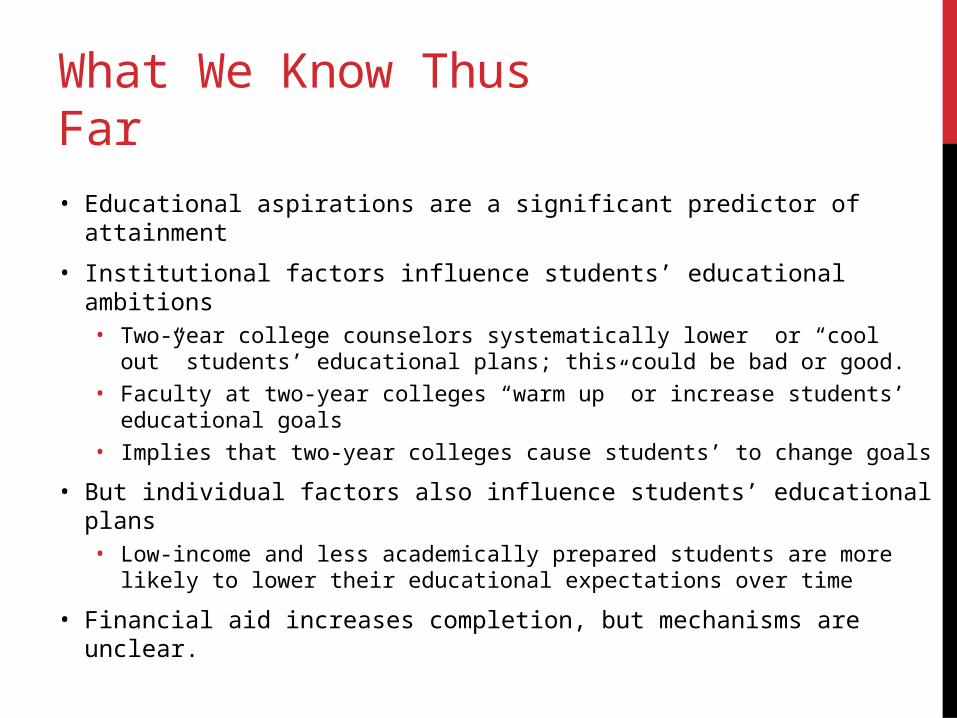
What We Know Thus Far
• Educational aspirations are a significant predictor of attainment
• Institutional factors influence students’ educational ambitions• Two-year college counselors systematically lower or “cool out”
students’ educational plans; this could be bad or good. • Faculty at two-year colleges “warm up” or increase students’
educational goals• Implies that two-year colleges cause students’ to change goals
• But individual factors also influence students’ educational plans• Low-income and less academically prepared students are more
likely to lower their educational expectations over time
• Financial aid increases completion, but mechanisms are unclear.

Research Questions
• How do students describe the relationship between finances and educational ambitions, if at all?
• What are students’ educational ambitions during their early college years and how do they change over time?
• Is there a causal relationship between students’ finances and their educational ambitions?

Wisconsin Scholars Longitudinal Study
Panel study of low-income students who are first-time full-time enrollees in a Wisconsin public college in fall 2008.
1,100 students enrolled at a two-year college in fall 2008*
• 477 students were randomly selected to receive the Wisconsin Scholars Grant valued at $1,800 per year (up to five years).
• 623 low-income students serve as the control group.
Data include: • Two surveys (fall 2008 and fall 2009)• Repeated in-depth interviews (fall 2008–spring 2010)
* One college dropped because the program was not administered as intended due to unexpected challenges.

Research Design
Qualitative
Quantitative
Qualitative
Quantitative
Expands the breadth and depth of inquiry

Qualitative analytical approach
Phase 1: Examined the interviews of 15 two or four-year college students who lowered their educational ambitions according to survey data
• Coded for educational and occupational plans, finances, and enrollment decisions
Phase 2: Examined the interviews of 12 students who attended a Wisconsin Technical College System two-year institution in 2008, regardless of educational ambitions (no interviews available with UW-College students).
• Inductive coding
• Triangulation

Quantitative analytical approach
Highest Aspiration:
• Thinking about the rest of your life, how much college education would you like to get? • AA, BA, MA, or Other prof. or graduate degree
Likelihood Questions:
How likely are each of the following scenarios?*
• You will transfer to a four-year college?
• You will get a bachelor's degree? • Rate from 1="not at all likely” to 5="extremely likely”
*Excludes students not enrolled in college in fall 2009.

Validity
• Internal validity• Treatment and control groups statistically equivalent at baseline • Differential attrition rates are very low (0-2 percent)• Covariates included in the regression models
• External validity • Analytic samples differ slightly from full sample
• More women (~1.5 times more likely than men to respond to the survey in 2008 & 2009)

Initial Qualitative Findings
Financial constraints influence enrollment decisions and act an obstacle in reaching educational goals
Sheva: “[Two-year college] was just a wiser choice for me because I really wasn't sure I'd be able to afford - I know I wouldn't be able to afford a four-year university by myself.”
Pao: “[If] I don't get the financial aid money then I probably won't go to school or I'll probably have to work and go part-time so I can pay it off - because I really rely on financial aid money just to go to school.”
Bethany: “It’s just financial issues now because I know I can do the [school] work – that’s no biggie – it’s just paying for everything…it’s about $7,000 worth of obstacle.”
Students talked about changing their educational ambitions less often.

Two-year students’ aspirations, fall 2008
Control Group Wisconsin Scholars Grant0%
5%
10%
15%
20%
25%
30%
35%
40%
45%
50%
21% 20%
40% 39%
27% 26%
12%15%
AABAMAPhD or Prof.
Note: Survey weights were used in all analyses (constant composition N=445)

Two-year students’ aspirations, fall 2009 among those who initially aspired to an AA
Control Group Wisconsin Scholars Grant0%
10%
20%
30%
40%
50%
60%
70%66%
51%
30%
44%
1% 0%4% 5%
AABAMAPhD or Prof.
Note: Logistic regression AA vs. BA+ marginally significant (p=.10)Survey weights were used in all analyses (constant composition N=88)

Two-year students’ aspirations, fall 2009 among those who initially aspired to a BA+
Control Group Wisconsin Scholars Grant0%
5%
10%
15%
20%
25%
30%
35%
40%
45%
50%
12%14%
45%48%
32%
25%
12% 13%
AABAMAPhD or Prof.
Note: Multinomial logistic regression BA vs. MA significant (p<.05)Survey weights were used in all analyses (constant composition N=357)

Key Quantitative Findings• Among those who initially aspired to an Associate’s degree,
grant recipients were more likely to “warm up” or aspire to a Bachelor’s degree in 2009 than non-recipients (p=.10; N=88).
• Grant recipients were 50% more likely than non-recipients to aspire to a Bachelor’s degree rather than a Master’s degree in 2009, among those who initially aspired to a BA or higher.
• No statistically significant findings regarding the likelihood of transfer to a four-year college or Bachelor’s degree attainment.

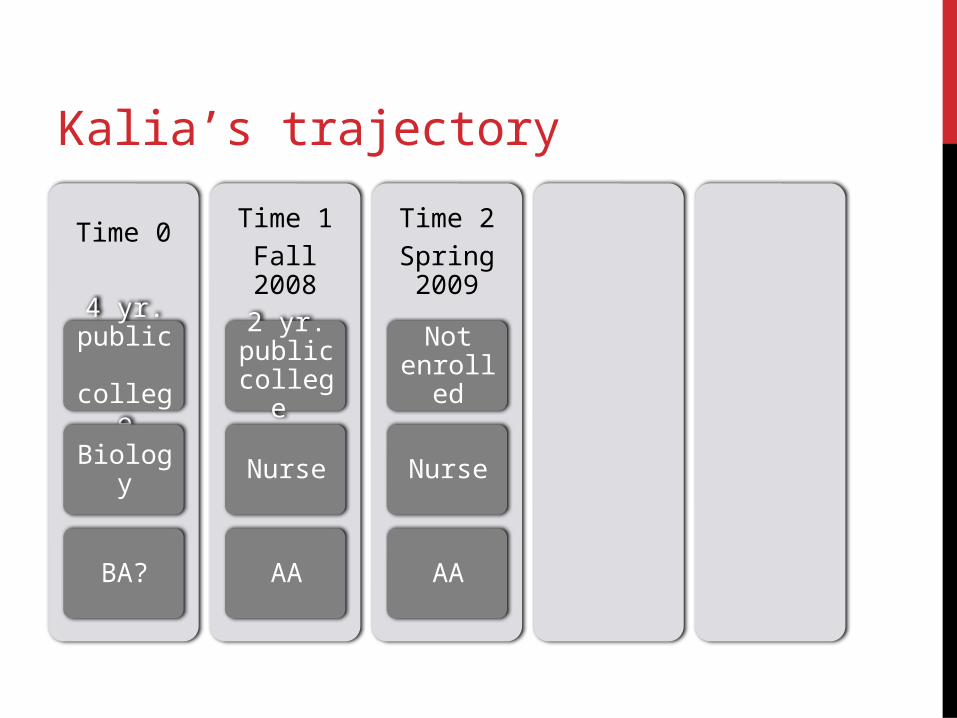
Kalia’s trajectory

Kalia’s trajectory
Time 1
Fall 2008
2 yr. public
college
Nurse
AA

Kalia’s trajectory
Time 0
4 yr. public college
Biology
BA?
Time 1Fall 2008
2 yr. public
college
Nurse
AA
Kalia’s trajectory
Time 0
4 yr. public college
Biology
BA?
Time 1Fall 2008
2 yr. public
college
Nurse
AA
Time 2Spring 2009
Not enrolled
Nurse
AA

Kalia’s trajectory
Time 0
4 yr. public college
Biology
BA?
Time 1Fall 2008
2 yr. public
college
Nurse
AA
Time 2Spring 2009
Not enrolled
Nurse
AA
Time 3Fall 2009
2/4 yr. private college
Nurse
BA?
Kalia plans to take out two loans to pay for her AA. She says she would prefer to stay in school and earn her BA, but isn’t sure how she is going to pay for it.

Kalia’s trajectory
Time 0
4 yr. public college
Biology
BA?
Time 1Fall 2008
2 yr. public
college
Nurse
AA
Time 2Spring 2009
Not enrolled
Nurse
AA
Time 3Fall 2009
2/4 yr. private college
Nurse
BA?
Time 4Spring 2010
2/4 yr. private college
Nurse
AA & BA if funded
Kalia learns the V.A. will pay for most of her AA so she doesn’t need to take the loans. She says she’ll probably earn a BA if she gets tuition reimbursement, but plans to enter the workforce after earning her AA.

Key Qualitative Findings
• Changing educational plans
• More dynamic than previous research suggests
• Aspirations survey measure is a snapshot in time
• Survey and interview data don’t always line up (r=.33; N=11)
• Various levels of alignment between students’ educational and career plans
• Career goals Educational goals
• Academic success or failure influences educational ambitions

Working Hypotheses
• Additional grant dollars change students’ beliefs regarding who should pay for college and how much debt is acceptable.
• Grant recipients learn more about their occupational goals and the level of education necessary for that career (through increased contact with counselors or professors) and adjust their educational ambitions accordingly.
• Grant recipients who attempt more credits have additional stress or burnout - thus they decide they do not want to or cannot go as far in school as they had previously hoped.
• Grant recipients are aligning their ambitions with the 5 year eligibility of the Wisconsin Scholars Grant.

Conclusions
• There is a causal relationship between students’ finances and their educational aspirations indicating that ambitions are influenced by individual-level factors.
• Grant recipients are more likely than non-recipients to aspire to a Bachelor’s degree in their second year of college.
• Indicates that additional financial resources promotes “warming up” among those who initially aspired to an AA.
• Suggests a leveling down to possibly more realistic aspirations among those who initially had graduate degree aspirations.
• “Cooling out” may be a reflection of the disproportionate share of low-income students at two-year colleges.
• Educational ambitions are more malleable and nuanced than previous research indicates.

Thank you
Special thanks to the Wisconsin Scholars Longitudinal Study staff, partners, and funders for collecting the data and making it available and to the students for participating.
Thank you to the Mixed Methods seminar participants and Social Science Computing Cooperative at UW-Madison for feedback and advice on earlier drafts.
The research reported here was supported in part by the Institute of Education Sciences, U.S. Department of Education, through Award #R305B090009 to UW-Madison.


Two-year students’ aspirations in 2009 by initial aspiration in 2008
Survey weights were used in all analyses (constant composition N=445)
010
%20
%30
%40
%50
%
Control Group Wisconsin Scholars Grant
AA BA MA PhD or Prof AA BA MA PhD or Prof
AA BAMA PhD or Prof
23%
42%
25%
10%
21%
48%
20%
11%

Two-year students’ aspirations, fall 2008 by sector of enrollment
WTCS UW-College0%
5%
10%
15%
20%
25%
30%
35%
40%
45%
50%
29%
1%
37%
45%
22%
36%
12%
18%
AABAMAPhD or Prof.
Note: Survey weights were used in all analyses (constant composition N=445)

1. Selected pre-treatment characteristics of two-year college students by sample (fall 2008)
Characteristic
Full Sample Fall 2008 Survey Fall 2009 Survey Fall 2008 & 2009 Surveys
Control WSG Total N Control WSG Total N Control WSG Total N Control WSG Total N
Assigned to treatment (WSG) (%) 0.0 100.0 55.4 1100 0.0 100.0 55.5 743 0.0 100.0 56.6 501 0.0 100.0 55.8 476
Female 53.9 53.0 53.4 1079 57.0 57.1 57.0*** 730 59.8 57.5 58.5** 493 58.9 57.6 58.1** 468
Targeted minority n/a 19.3 19.8 19.6 743 19.8 19.3 19.5 501 20.5 20.6 20.5 476
Sector (%) 1100 743 501 476
UW-Colleges 27.1 26.0 26.5 28.9 24.6 26.5 35.0 27.2 30.6 35.2 28.0 31.2
Wisconsin Technical College System 72.9 74.0 73.5 71.1 75.4 73.5 65.0 72.8 69.4 64.8 72.0 68.8
Father holds a college degree (AA or higher) (%) 20.4 22.3 21.5 876 20.4 21.8 21.1 596 20.7 21.7 21.3 404 20.4 21.5 21.0 383
Mother holds a college degree (AA or higher) (%) 31.0 31.3 31.2 940 28.2 33.7 31.2 636 27.3 31.9 29.8 423 26.6 32.0 29.5 401
Financially dependent on parents (%) 87.0 88.1 87.6 1080 86.4 88.7 87.7 732 89.5 91.2 90.4 495 89.1 92.5 91.0 470
Average expected family contribution ($) 1,088 1,212 1,157 1078 1,075 1,256 1,176 730 1,063 1,115 1,092 494 1,042 1,134 1,094 469
Zero expected family contribution (%) 43.7 43.3 43.5 1078 43.3 40.3 41.7 730 43.5 42.2 42.8 494 44.2 41.2 42.5 469
Parent(s)' adjusted gross income (dependents only) ($) 26,490 26,872 26,703 947 27,151 27,728 27,476 640 27,290 26,160 26,644 445 27,214 26,479 26,796 424
Parent(s)' investment income (dependents only) ($) 5,461 3,761 4,510 947 6,024** 3,392 4,543 640 6,817* 2,787 4,514 445 6,620* 2,827 4,463 424
Student(s)' adjusted gross income (independents only) ($) 9,949 10,419 10,199 133 9,651 10,423 10,046 92 9,046 8,072 8,535 50 9,046 8,562 8,819 46
Student(s)' investment income (independents only) ($) 10 20 15 133 13 28 21 92 0 0 0* 50 0 0 0* 46
ACT composite score (mean) 19.6 19.5 19.5 323 19.7 19.5 19.6 319 19.7 19.3 19.5 231 19.8 19.3 19.5 227
Highest educational degree expectation in high school (mean) 3.5 3.4 3.4 287 3.5 3.4 3.4 283 3.5 3.4 3.4 205 3.5 3.4 3.4 201
* p<.05, **p<.01, ***p<.001

Evidence standards WSLS two-year college students survey measurement attrition
Note: N=1100; one school dropped due to implementation issuesWWC Procedures and Standards Handbook Version 2.0 – December 2008 http://ies.ed.gov/ncee/wwc/references/idocviewer/Doc.aspx?docId=19&tocId=4
Fall 2008Fall 2009
Constant Composition
Fall 2008: 31.1% overall 0.2% T-CFall 2009: 53.1% overall 2.1% T-CFall 2008 & 2009: 55.4% overall 0.7% T-C