Embed Size (px)
Citation preview
How exposure to different opinionsimpacts the life cycle of social media
The MIT Faculty has made this article openly available. Please share how this access benefits you. Your story matters.
Citation Rad, Armin A. et al. “How Exposure to Different Opinions Impactsthe Life Cycle of Social Media.” Annals of Operations Research (June2017) © 2017 Springer Science+Business Media
As Published http://dx.doi.org/10.1007/s10479-017-2554-8
Publisher Springer-Verlag
Version Author's final manuscript
Citable link http://hdl.handle.net/1721.1/113384
Terms of Use Creative Commons Attribution-Noncommercial-Share Alike
Detailed Terms http://creativecommons.org/licenses/by-nc-sa/4.0/
1
How Exposure to Different Opinions Impacts the Life Cycle of Social Media
Armin A. Rada,*, Mohammad S. Jalalib, Hazhir Rahmandadb
a Grado Department of Industrial and Systems Engineering, Virginia Tech, Blacksburg, VA 24061, USA
b Sloan School of Management, Massachusetts Institute of Technology, Cambridge, MA 02142, USA
* Corresponding author: [email protected]
Abstract As a lot of communication and media consumption moves online, people may be exposed to a
wider population and more diverse opinions. However, individuals may act differently when faced with
opinions far removed from their own. Moreover, changes in the frequency of visits, posting, and other
forms of expression could lead to narrowing of the opinions that each person observes, as well as changes
in the customer base for online platforms. Despite increasing research on the rise and fall of online social
media outlets, user activity in response to exposure to others’ opinions has received little attention. In this
study, we first introduce a method that maps opinions of individuals and their generated content on a
multi-dimensional space by factorizing an individual-object interaction (e.g., user-news rating) matrix.
Using data on 6,151 users interacting with 287,327 pieces of content over 21 months on a social media
platform we estimate changes in individuals’ activities in response to interaction with content expressing
a variety of opinions. We find that individuals increase their online activities when interacting with
content close to their own opinions, and interacting with extreme opinions may decrease their activities.
Finally, developing an agent-based simulation model, we study the effect of the estimated mechanisms on
the future success of a simulated platform.
Keywords Social media, user activity, opinion measuring, agent-based simulation
1 Introduction Social media platforms have become an important part of our daily lives. Social networks such as
Facebook and Twitter, messaging applications such as WhatsApp and Viber, and picture and video
sharing platforms such as Instagram and Snapchat have a big influence on our daily lives. For example,
more than a third of 18 to 29-year-old Americans identified social media as their most helpful resource
for learning about the 2016 presidential election (35% social media, 18% news websites and applications,
and 12% cable TV news) (Gottfried et al. 2016). And this trend is increasingly global: Facebook, with
more than 1.86 billion monthly active users, has grown more populous than China; Add to that the more
than one billion active users of YouTube, 600 millions of Instagram, 319 million of Twitter, and 106
million of LinkedIn, and the global reach of social media outlets becomes even clearer. This is a dynamic
marketplace where most big companies of today grew from obscurity, defeating other major social media
platforms just a few years ago: Facebook defeated Myspace, and YouTube replaced shareyourworld.com.
Similar examples of boom and bust in online social media are common over the past decade.
Researchers have studied various aspects and causes of these cycles. In one study, Cannarella and
Spechler (2014) developed an SIR (susceptible, infected, and recovered) model for explaining trends of
user activity on Myspace and predicted that Facebook would lose 80% of its peak users by 2017 and its
users would migrate to other social network outlets. Torkjazi et al. (2009) studied the activities of
2
Myspace users and discussed the various factors behind user departure from social networks. They built
on the idea that social networks are vulnerable to new fads; therefore, it is important to innovate and add
new features to platforms in order to keep users interested. They also discussed the importance of linking
users to other like-minded individuals when the platform grows. Wu et al. (2013) studied the relationship
between user arrival and departure on social networks with respect to network topology, and elaborated
on the important role of active friends in social networks in departure decisions. In another study based on
network topology, Garcia et al. (2013) focused on understanding the resilience of social networks and
how friends’ departures impact focal users. Giliette (2011) provided a more popular view on some of the
technical, managerial, financial, and social issues that could lead to social media outlet failure. Among
relevant factors, he highlights lack of technology (e.g., spam filtering in the case of Myspace), poor
choice of advertising services (e.g., inappropriate advertisements in Myspace), and bad publicity (e.g., a
court case about inappropriate content for children on Myspace).
Information privacy is another research area which, if not attended to, may contribute to the loss
of users. Individuals’ trust may affect their activity level on social media. For example, Facebook users
expressed greater trust in the platform than MySpace, which increased their willing to share their
information (Dwyer et al. 2007). However, the user’s willingness to act to preserve their privacy has not
been well established. Madejski et al. (2011) identified a mismatch between sharing intentions of users on
Facebook and their privacy settings, an issue that has also been identified for the users on blogging
platforms (Viégas 2005).
Innovation and specialization is also another potential driver of changes in social media
landscape. New social media platforms target specific interactions (e.g., dating applications and
professional social networks), and the conventional use of social media is changing, which may affect
user activity and engagement and the competitive landscape (Lampe et al. 2008). For instance, photo
sharing social networks such as Pinterest and Instagram attracted significantly more users than Facebook
during 2014 and 2015 (Greenwood et al. 2016).
On the user side, individuals may be learning about what social media can do for them and their
needs may be changing too. For example, the sense of connectivity and entertainment are among the
major benefits users identify for social media (Boyd 2007). However, heavy use can reduce bonding and
increase loneliness (Burke et al. 2010). Besides connecting to similar people, i.e., bonding, Ellison et al.
(2007) identified the important bridging role of social media (i.e., social ties linking diverse people).
Usage also varies based on individuals’ degree of self-esteem and satisfaction with life. Those lower on
this scale may find social media more useful as it offers non-traditional options for connecting with others
(Ellison et al. 2007). Research has shown that increased frequency of updating Facebook status helps
reduce loneliness (Deters & Mehl 2013), and anonymity (on certain platforms) or lack of face-to-face
online communication can decrease self-consciousness and social anxiety (Morahan-Martin &
Schumacher 2003). To the extent that these benefits change over time, or users learn about them, the use
cases for social media and the appeal of different platforms would change.
Besides the factors highlighted above, the rise and fall of a platform depends on individuals
engaging with or leaving the platform—their actions depends on how much they enjoy their interactions
within the platform. Some of those interactions have been studied under social influence research. From
making a simple estimation (e.g., Jalali 2014) to more major decision-making processes (e.g., Tanford &
Montgomery 2015), individuals’ opinions are influenced by others. On rating-based social news
platforms in particular, research has shown that social influence substantially biases rating dynamics;
prior ratings of news can have a significant effect on individual rating behavior (Muchnik et al. 2013).
Social influence is a very strong finding that applies across most individuals, even though individual
3
variations exist, e.g., internal political self-efficacy moderates social influence on political topics (Lee
2014). Such social influence patterns can homogenize behavior. For example, Kim and Lee (2014)
showed that highly active users on Twitter tend to show consistent behavior patterns by retweeting others
who have the same viewpoints. An et al. (2014) summarized four theoretical motivations in sharing
political news: selective exposure (sharing news that one likes and agrees with); trust and intimacy (based
on credibility of the news source); gratification (enjoyment or informativeness of the news); and
socialization (sharing news matching the leanings of the user’s followers). While the extant literature has
analyzed the impact of social influence on liking and sharing a piece of content, the other side of the coin
remains less studied. Specifically, we do not know much about the impact of the actual opinions
consumed on the activity patterns of social media users. Social media platforms allow ordinary users to
generate content and consume content provided by others. In such an environment, user-generated content
is the fundamental building block of the platform. This creates a path dependent and endogenous
feedback system in which the history of past activities and content has a major effect on the actions of
users in the future and the content that will be generated. To fully understand this system, we need both
an understanding of what content gets shared and promoted, and what the consumption of that content
does to the future activity patterns of users. The focus of the current study is to better understand this
complex system, by first analyzing the impact of various content consumption patterns on user activity,
and then simulating how those reactions add up to shape the evolution of a social media platform.
Teasing out the endogenous drivers of user contributions in a multi-faceted social media is
complicated: people may post personal pictures, political articles, short stories, and their current emotions
for different reasons. Therefore, we focus on addressing this question in a particular type of platform, one
that focuses on sharing and rating news, i.e., social news websites. On social news websites, users
produce content (i.e., share news) based on their own viewpoints and opinions on a variety of topics. The
content generated by some users may be repulsive from the perspective of others, which could affect their
behaviors and activities in the social media, offering an appealing empirical setting to analyze our
research question.
In this study, we contribute to a better understanding of how content and user activity coevolve, a
complex process that partly explains the growth and failure of social network platforms and their content
composition. To this end we used opinion data extracted using a novel opinion mapping method
introduced in Ashouri Rad (2016), and estimated regression models to study changes in individual
activities (i.e., posting, commenting, and revisiting rates) influenced by interacting with a variety of
opinions. Extracting the mechanisms affecting online communities, we simulated and predicted the future
formation of the communities. We also studied the effects of community bias and extremeness on its
evolution. Finally, based on our simulation analysis, we proposed different interventions that can help
increase user activity and the life cycle of social media outlets. Studying user activities and behavior can
help us understand the social behaviors of communities in general and individuals in particular. It can also
assist social media outlets in design, decision-making and policymaking.
The rest of this paper is organized as follows. In Section 2, we present the data and case study.
Our methodology is presented in Section 3, where we first discuss our analytical models (Section 3.1) and
then our simulation model (Section 3.2). The results of these two approaches are presented in Section 4.1
and 4.2, respectively. Section 5 discusses the findings.
2 Data and case study We used data from one of the first and largest Persian social media platforms, a social news
website (similar to Digg and Reddit) which has gathered over 60,000 registered members, 2.5 million
4
stories, 65 million votes, and several million comments since its inception in August 2006 until the
beginning of 2016 for which we had data. We selected this social media platform because: 1) The sole
focus of the platform on story sharing facilitates analyzing the effect of users’ behavior on the dynamics
of the growth of social media, with no need to tease out that effect of other influences; 2) We could secure
full access to its data; and 3) The mechanisms of the platform are similar to those of other story-sharing
platforms in other languages, which help increase the generalizability of our findings.
Because our case study platform is based outside Iran, it is not restricted by the Iranian government’s
regulations. Hence, it quickly became an environment in which users could freely discuss politics,
particularly the Iranian government and its policies. After the presidential election in 2009, the platform
was used as one of the channels for coordinating protests to the government. Consequently, a large
portion of its content is concentrated on Iran’s government and its political issues, which we focus on in
our analysis. We collected data from August 2006 to May 2008 on all active users and stories (users who
cast votes and stories that received votes). This provided us with behavior data on 6,151 active users who
posted multiple stories (and thus their activity over time could be tracked) and properties of 287,327
stories with multiple votes.
Users can post stories (links containing news, videos, pictures, etc.—we consider them all as
online objects) as well as comments. They can also vote for other stories. Stories published recently are
viewed on an ordering page (called a recently published stories ordering page) in which stories are sorted
in chronological order. The life cycle of the stories on this page is one day, after which stories are moved
to an archive page. Once users initiate posts, they can select a related category (political, social, sport,
etc.), but we specifically focus on political content and limit our analysis to that, because: 1) political
content forms the majority of posted items; 2) polarity and segregation of opinions are more salient for
political content.
3 Methodology We first present our analytical modeling (Section 3.1) in two sub-sections, opinion estimation
methodology (3.1.1) and regression analysis (3.1.2). We then present an agent-based simulation model
(Section 3.2). The results are discussed in Section 4. Further results, along with more information about
our analysis which facilitates further analysis and development are documented in the Online
Supplementary Materials.
3.1 Analytical models For the analytical modeling, we first estimated the opinions of individuals and of the objects on social
media using a novel opinion estimation method. The basic idea is that we can define an opinion space
with multiple dimensions and locate each individual and each online object on that space. For example, a
potential dimension of an opinion space on our platform may include orientation towards the Iranian
government (i.e., supporting or opposing). This could be a continuous metric with positive values for
support and negative values for opposing individuals or objects. We let the actual dimensions emerge
from our estimation algorithm, so that every individual and story is located on the same two-dimensional
space consistent with the patterns of voting that suggests which individual holds opinions close to those
embedded in which objects.
5
Then, based on the estimated opinion of each individual and the estimated opinion expressed by the
content they are exposed to, we studied the effect of interacting with various opinions on individual
online activity. Therefore, our analytical modeling analysis is divided into two sections: 1) Opinion
estimation method, which maps out the opinions of individuals and their generated content in a multi-
dimensional space by factorizing an individual-content rating matrix into opinion matrices for individuals
and content; 2) Regression analysis, in which we propose three regression models (one for each type of
activity under study: posting, commenting, and revisiting) to analyze the effect of interacting with various
opinions on individual activities, through exposure to different content.
3.1.1 Opinion estimation method
Table 1 Mathematical notations used in the opinion estimation method
Notation Expression Notation Expression
𝑅 user-object rating matrix 𝑅𝑖,𝑗 rating of user 𝑖 assigned to object 𝑗
𝑊 user-object exposure probability matrix 𝑊𝑖,𝑗 the probability that object 𝑗 is exposed to user 𝑖
𝑈𝑖. user 𝑖 opinion vector 𝑈𝑖,𝑘 user 𝑖 opinion on 𝑘𝑡ℎ dimension
𝑉𝑗. story 𝑗 opinion vector 𝑉𝑗,𝑘 opinion story 𝑗 expresses on 𝑘𝑡ℎ dimension
𝑄 factor variables 𝑄𝑘,𝑗 value of 𝑘𝑡ℎ factor for object 𝑗
𝛼 coefficient assigned to factor variable 𝛼𝑘 coefficient estimated for 𝑘𝑡ℎ factor variable
We developed a novel method to estimate the opinions of individuals on social media, based on available
individual-content interaction data in our case study. Further details on the method can be found in
Ashouri Rad (2016), but in a nutshell, we factorize the user-object (individual-news) interaction matrix
into two opinion matrices (user and object) by maximizing the likelihood of observing the actual user-
object matrix. Specifically, we use the idea that individuals are more likely to vote for stories that embed
opinions congruent with their own, compared to content that opposes their opinions. Building on this
intuition, formalized in equation 1, we extracted the opinions of users about content on different topics by
the factorization process. Table 1 presents the notations used in this section. The basic approach we use is
similar to that used in the more commonly studied case of continuous rating, e.g., for a movie rating
website. In that case, if we put the data on user-movie ratings in the format of matrix 𝑅 (where 𝑅𝑖,𝑗
represents the rating user 𝑖 assigns to movie 𝑗), we can factorize 𝑅 into taste (opinion on genres of
movies) matrices of users and movies, such as 𝑅~𝑈. 𝑉𝑇, where: 𝑈 (a 𝑛 × k matrix) and 𝑉 (a 𝑚 × k
matrix) represent the taste of (𝑛) users and (𝑚) movies, respectively, on (𝑘) different dimensions (e.g.,
genres), and 𝑉𝑇 is the transpose of matrix 𝑉. In a one-dimensional space (𝑘 = 1), 𝑈𝑖. could be
representative of user 𝑖’s interest in the comedy genre, 𝑉𝑗. the extent/level of comedy in movie 𝑗, and 𝑅𝑖,𝑗
the rate that user 𝑖 assigns to movie 𝑗 based on the comedy genre.
The same intuition carries to our case of binary liking of stories (rather than a continuous rating).
Specifically, we defined a utility function, 𝑆𝑖𝑔𝑚𝑜𝑖𝑑(𝑈. 𝑉𝑇), where 𝑆𝑖𝑔𝑚𝑜𝑖𝑑(𝑥) = 1/(1 + 𝑒−𝑥)) in
which users gain more utility by reading stories that convey opinions close to their own (i.e., 𝑈. 𝑉𝑇 has a
higher value)—see Ashouri Rad (2016) for more discussion. Building on this utility function, we
developed a likelihood function for a factorization process that estimates opinion vectors of users and
stories, and factorizes the interaction matrix. The factorization likelihood function (𝐿) in our case also
accounts for the likelihood that an object is observed by the user (𝑊𝑖, 𝑗), and can be defined as:
6
𝐿(𝑅, 𝑊, 𝑄) = ∑ ∑ 𝑆𝑖𝑔𝑚𝑜𝑖𝑑(𝑈𝑖.. 𝑉𝑗.𝑇 + 𝛼𝑝 × 𝑄𝑝,𝑖,𝑗)
𝑅𝑖,𝑗
𝑛
𝑗=1
𝑚
𝑖=1
× (1 − 𝑊𝑖,𝑗 × 𝑆𝑖𝑔𝑚𝑜𝑖𝑑(𝑈𝑖.. 𝑉𝑗.𝑇 + 𝛼𝑝 × 𝑄𝑝,𝑖,𝑗))
(1−𝑅𝑖,𝑗)
(1)
where,
𝑅𝑖,𝑗 = {1 user 𝑖 votes for object 𝑗0 otherwise
𝑈𝑖. and 𝑉𝑗. (∈ ℝ) are the opinion vectors for user 𝑖 and object 𝑗, respectively. Note that the
number of dimensions for opinion vectors (i.e., 𝑘 in 𝑈𝑛×𝑘 and 𝑉𝑚×𝑘, where 𝑛 and 𝑚 represent
the total number of users and objects, respectively) depends on the number of opinion-based
factors that could influence the user ratings of the objects (e.g., the number of different genres in
rating movies)1. In our study we use 𝑘 = 2.
𝑄𝑝,𝑖,𝑗 represents different properties of story 𝑗 which are not captured in the opinion vector for
that story, (i.e., 𝑝: the number of votes, the sub-page, and location of the story in the page) but
are seen by user 𝑖.
𝑆𝑖𝑔𝑚𝑜𝑖𝑑(𝑈𝑖.. 𝑉𝑗.𝑇 + 𝛼 × 𝑄) indicates the probability of user 𝑖 voting for story 𝑗 due to closeness
of user’s and object’s opinions (i.e., 𝑈. 𝑉𝑇), and different properties of the object as 𝑄 (e.g.,
popularity of the content, visibility of the content on the website, etc.). 𝛼 ∈ ℝ captures the
vectors of coefficients for non-opinion mediators of votes.
𝑊𝑖,𝑗 represents the probability that user 𝑖 is exposed to object 𝑗 (i.e., 𝑊𝑖,𝑗 = 1, where 𝑅𝑖,𝑗 = 1;
and 𝑊𝑖,𝑗 ≤ 1, where 𝑅𝑖,𝑗 = 0).
Votes are binary, and optimizing the likelihood function will estimate 𝑈𝑖. and 𝑉𝑗. in such a way
that 𝑆𝑖𝑔𝑚𝑜𝑖𝑑(𝑈𝑖.. 𝑉𝑗.𝑇) increases for voted user-story pairs (𝑅𝑖,𝑗 = 1) and (1 − 𝑆𝑖𝑔𝑚𝑜𝑖𝑑(𝑈𝑖.. 𝑉𝑗.
𝑇))
increases otherwise (𝑅𝑖,𝑗 = 0). Thus, on a one-dimensional opinion space, and ignoring other factors (Q),
users and stories may share opinions that are:
in the same direction (i.e., 𝑈𝑖. > 0 and 𝑉𝑗. > 0 or 𝑈𝑖. < 0 and 𝑉𝑗. < 0), resulting in more than
50% probability of voting (i.e., user 𝑖 votes for story 𝑗 with a probability higher than 50%)
in different directions (i.e., 𝑈𝑖. > 0 and 𝑉𝑗. < 0 or 𝑈𝑖. < 0 and 𝑉𝑗. > 0), resulting in less than 50%
probability of voting
In our case study, each opinion vector contains two opinion dimensions (𝑘 = 2), reflecting the
opinions of the users and that of the stories (𝑈1 and 𝑈2 for users and 𝑉1 and 𝑉2 for stories), as well as one
fixed effect (𝑈3 for users and 𝑉3 for stories). Hence:
𝑈𝑖.. 𝑉𝑗.𝑇 = 𝑈𝑖,1 × 𝑉𝑗,1 + 𝑈𝑖,2 × 𝑉𝑗,2 + 𝑈𝑖,3 + 𝑉𝑗,3 (2)
The fixed effect for the user’s opinion vector (𝑈3) represents the user’s interest in voting in
general compared to others (i.e., higher values for those who vote more frequently). For the story’s
opinion vector, the fixed effect (𝑉3) shows the attractiveness of the story (i.e., there is a higher value for
stories that attract more votes regardless of the opinion they express). In our case study, we set stories
1Mapping the opinions in lower (than influential factors) dimensional spaces forces the factorization process to mix the effect of multiple factors
on a single dimension. Yet, the computational expense of the optimization increases with higher dimensions. Thus, setting the number of
dimensions is a tradeoff between capturing the (most important) influential factors in separate dimensions and keeping the optimization process
feasible.
7
posted by users as the online objects; both the user-story interaction matrix (𝑅) and the exposure
probability (𝑊) are extracted from the data (more detail on data extraction provided in Rad and
Rahmandad (2013)). We maximize the log-likelihood (of equation (1)) function by estimating the opinion
matrices (i.e., 𝑈 and 𝑉 for each user and each story) and the coefficients of the factor variables (𝛼𝑘):
Max𝑈,𝑉,𝛼 log(𝐿(𝑅, 𝑊, 𝑄))
= ∑ ∑ {𝑅𝑖,𝑗 × log (𝑆𝑖𝑔𝑚𝑜𝑖𝑑(𝑈𝑖.. 𝑉𝑗.𝑇 + 𝛼𝑝 × 𝑄𝑝,𝑖,𝑗)) + (1 − 𝑅𝑖,𝑗)
𝑛
𝑗=1
𝑚
𝑖=1
× log (1 − 𝑊𝑖,𝑗 × 𝑆𝑖𝑔𝑚𝑜𝑖𝑑(𝑈𝑖.. 𝑉𝑗.𝑇 + 𝛼𝑝 × 𝑄𝑝,𝑖,𝑗))}
(3)
Equation (3) maximizes a non-linear, smooth (has derivatives of all orders on 𝑈, 𝑉, 𝛼 ∈ ℝ), and
continuous function. It is high-dimensional and computationally expensive. Yet, this optimization
problem features a special structure that simplifies our task tremendously: All local optima for this
optimization reach the same payoff function, and the optimal solutions are simple transformations of each
other. Specifically, there is a matrix A that converts any local optima of the factorization problem (e.g.,
𝑈. 𝑉𝑇) to any other one (𝑈′. 𝑉′𝑇): 𝑅 = 𝑈. 𝑉𝑇 = (𝑈. 𝐴). (𝑉(𝐴−1)𝑇)𝑇 = 𝑈′. 𝑉′𝑇. Therefore, simple gradient
search methods can find a global optimal solution, from which all the other optimal solutions are
reachable (see Ashouri Rad (2016) for more detail). Based on these key characteristics of the problem and
our study of different optimization algorithms, we used the limited memory BFGS (L-BFGS)
optimization algorithm (Liu & Nocedal 1989) for the optimization step which we found effective for
solving the problem.
Maximizing the likelihood function (equation (3)) based on the data, which was collected from our
case study platform using a history reconstruction algorithm (Rad & Rahmandad 2013), we estimated the
opinion vectors of users and stories (as well as coefficients of factor variables (𝛼)) on weekly time
windows from August 2006 to May 2008 on a two-dimensional opinion space. Opinion vector values
were estimated for all the active users and active stories (i.e., users who cast votes and stories that
received votes) in each time window. This process provided us with 6,151 user-week opinion vectors and
287,327 story opinion vectors. The estimation was conducted on a computer with a CPU of 2.1 GHz and
16 cores, which took approximately 2,000 hours of computation.
By studying estimated opinion values for stories in a case study, Ashouri Rad (2016) presented 2-
dimensional opinion vectors, where the first dimension (i.e., 𝑈1 for users and 𝑉1 for stories) represents
support for, or opposition to, the Iranian government (on positive and negative sides of the axis,
respectively). The second dimension (i.e., 𝑈2 for users and 𝑉2 for stories) represents a mixture of other
features of stories (related to tone and style) that affect the voting of users, in which having rich media
(i.e., picture, video, and audio), language of the content (informal vs. formal), expressing personal
opinion, and having entertaining content are the most important explanatory features of in this second
dimension. For the sake of simplicity, we refer to stories containing rich media, personal opinion, with
informal language or entertaining content, which often use eye-catching rather than well-researched news,
as ‘yellow’ stories. We refer to the other broad group of stories (including non-yellow content) as ‘green’
stories. The opinion values of yellow stories (and their fans) lie on the negative side of the second opinion
dimension, while the opinion values for green stories (and their fans) lie on the positive side (see Ashouri
Rad (2016) for more details). Fig. 1 presents the combinations of different opinions and stories studied in
this research.
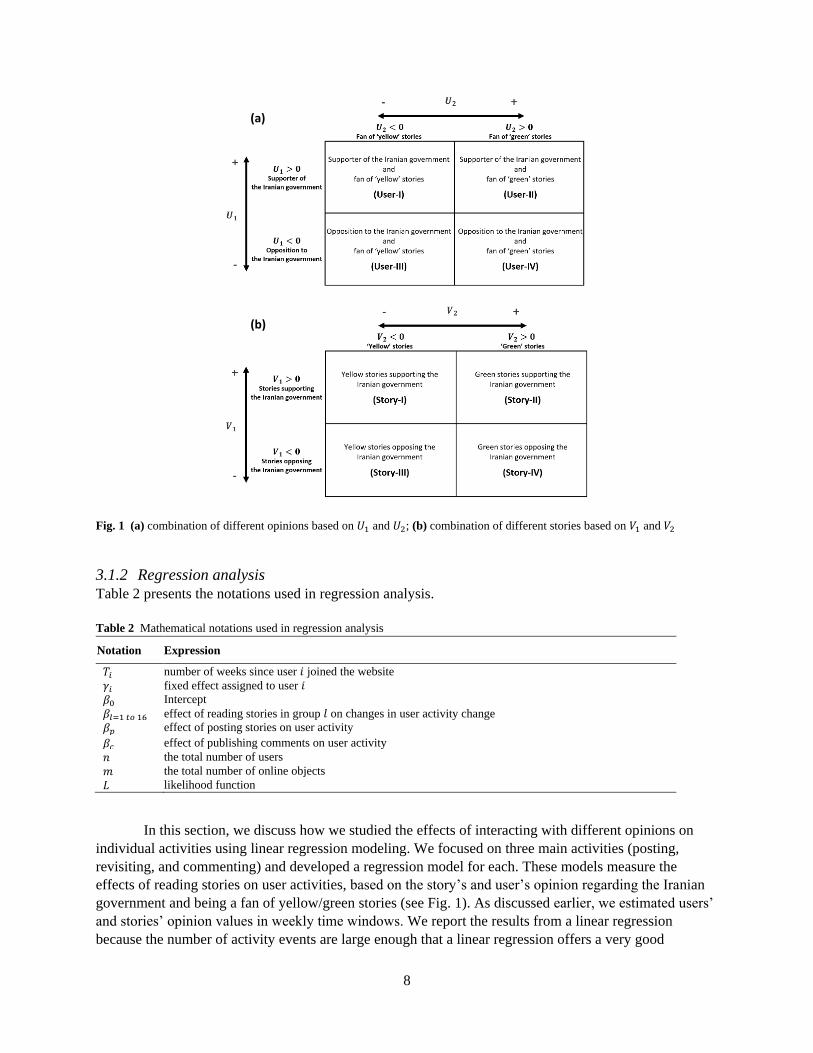
8
Fig. 1 (a) combination of different opinions based on 𝑈1 and 𝑈2; (b) combination of different stories based on 𝑉1 and 𝑉2
3.1.2 Regression analysis
Table 2 presents the notations used in regression analysis.
Table 2 Mathematical notations used in regression analysis
Notation Expression
𝑇𝑖 number of weeks since user 𝑖 joined the website
𝛾𝑖 fixed effect assigned to user 𝑖 𝛽0 Intercept
𝛽𝑙=1 𝑡𝑜 16 effect of reading stories in group 𝑙 on changes in user activity change
𝛽𝑝 effect of posting stories on user activity
𝛽𝑐 effect of publishing comments on user activity
𝑛 the total number of users
𝑚 the total number of online objects
𝐿 likelihood function
In this section, we discuss how we studied the effects of interacting with different opinions on
individual activities using linear regression modeling. We focused on three main activities (posting,
revisiting, and commenting) and developed a regression model for each. These models measure the
effects of reading stories on user activities, based on the story’s and user’s opinion regarding the Iranian
government and being a fan of yellow/green stories (see Fig. 1). As discussed earlier, we estimated users’
and stories’ opinion values in weekly time windows. We report the results from a linear regression
because the number of activity events are large enough that a linear regression offers a very good
(b)
(a)
9
approximation with more intuitive coefficient values. Results are robust to using a Poisson regression
model.
To study the effect of interaction with different opinions on user activities, we measured the
changes in user activity, i.e., the number of stories posted, the number of revisits, and the number of
comments. These changes were measured in two separate weeks, ℎ weeks apart. We then estimated the
effect of opinions on the changes based on the cumulative utility (defined below) users had gained from
reading stories within the intervening ℎ weeks. Based on our data set, we estimated ℎ to be 23 weeks,
considering a tradeoff between the between-week duration and the number of data points; we needed a
long duration to study the behavior of users, but the longer the duration, the fewer users and data points2.
We use a sliding window method, moving forward the time window by one week and recording the
independent and dependent variables for each new week.
We recorded the utility from consuming the content in the intervening weeks (as an independent
variable) and the change in activity (as a dependent variable) to fit the regression model. For instance, we
calculated the change in the number of revisits between weeks 1 and 25 (i.e., 𝑅𝑒𝑣𝑖𝑠𝑖𝑡𝑖,𝑡+25 − 𝑅𝑒𝑣𝑖𝑠𝑖𝑡𝑖,𝑡 in
equation (4)), and measured the sum of the utility gained in weeks 2 to 24 from reading stories. Then, we
moved the time window one week forward and calculated the change between weeks 2 and 26 and
measured the utility in weeks 3 to 25, and so forth. We continued collecting the data in this manner for all
users during the total of 87 active weeks.
In each of the three regression models, we set a fixed effect (𝛾) for user baseline activity change,
to measure the average change in user activity based on factors independent of what they read. We also
controlled for the number of weeks (𝑇) since users had joined the website, to assess the effect on user
activity of being a newcomer vs. being an old-timer in the community.
We categorized each user-story pair into one of the 16 different groups based on the polarity
(sign) of the opinion of the story and user with regard to the Iranian government and yellow or green
content/fans; all possible combinations of 𝑈1 < 0, 𝑈1 > 0, 𝑉1 < 0 and 𝑉1 > 0 result in 16 groups (see
Table 7 for the structure of the three regression models based on these 16 groups). If we assume user 𝑖,
who is a supporter of the government (𝑈𝑖,1 > 0) and is a fan of yellow stories (𝑈𝑖,2 < 0), reads story 𝑗 that
opposes the Iranian government (𝑉𝑗,1 < 0) and is yellow (𝑉𝑗,2 < 0), then the user 𝑖-story 𝑗 pair lies in the
group that represents 𝑈1 > 0, 𝑉1 < 0, 𝑉2 < 0, 𝑈2 < 0 (i.e., group 8 in Table 7).
We measured the marginal utility the user gained from reading each story using 𝑠𝑖𝑔𝑚𝑜𝑖𝑑(𝐾) −
0.5, where 𝐾 = 𝑈1 × 𝑉1 + 𝑈2 × 𝑉2 + 𝑉3, 𝑈1 and 𝑈2 are the user’s opinion values, 𝑉1 and 𝑉2 are the
story’s opinion values, and 𝑉3 is the attractiveness of the story (i.e., the story’s fixed effect). We then
calculated cumulative gained utility on each of the groupings as one independent variable in the
regression models. This leads to a total of 16 coefficients (𝛽1-𝛽16) that capture how various pairs of user-
story types may have a different type of impact on the user’s activity. Here, the marginal utility gained by
reading a story is the result of comparing (i.e., subtracting) the total utility the user gains from reading the
story (𝑠𝑖𝑔𝑚𝑜𝑖𝑑(𝐾)) with the utility she gains from reading a completely neutral story (i.e.,
2 The number of ‘between-weeks’ was optimized using the F-test on the first regression model (on posting), and we chose the number of in-
between weeks based on the p-value. Note that since the number of variables (user and time-fixed effects) and the number of datasets change with
different ‘between weeks’ values, we cannot use 𝑅2, Akaike information criterion (AIC), or log-likelihood value for this comparison. 2𝑠𝑖𝑔𝑚𝑜𝑖𝑑(𝐾 = 0) = 0.5 implies that the story is not biased toward any of the groups (supporter/opposition and yellow/green), and the story’s
attractiveness is zero: The story is neither attractive nor unattractive in obtaining votes.
10
𝑠𝑖𝑔𝑚𝑜𝑖𝑑(𝐾 = 0) = 0.5)3. Thus, when a user reads a story that contradicts her opinion (e.g., a User-II
reads a Story-III—see Fig. 1—with zero attractiveness), the result of the subtraction is negative,
indicating that the user does not gain the expected utility by reading that story. In essence, the user gains
less utility by reading that story compared to when she reads a story that is not about the government at
all. In other words, considering the time and energy the user spends in reading the story, she gains less
utility than her expectation. Therefore, the marginal utility implies the difference between gained and
expected utility, which could be either negative or positive. Following this assumption, the regression
model for revisiting, as an example, is defined as:
𝑅𝑒𝑣𝑖𝑠𝑖𝑡𝑖,𝑡+25 − 𝑅𝑒𝑣𝑖𝑠𝑖𝑡𝑖,𝑡
= 𝛽0
+ 𝛽𝑙=1 𝑡𝑜 16 ∑ ∑ (𝑠𝑖𝑔𝑚𝑜𝑖𝑑(𝐾) − 0.5)
𝑗∈𝛹𝑖,𝑘,𝑙
+ 𝛽𝑝 ∑ 𝑃𝑜𝑠𝑡𝑠𝑖,𝑘
𝑡+24
𝑘=𝑡+1
𝑡+24
𝑘=𝑡+1
+ 𝛽𝑐 ∑ 𝐶𝑜𝑚𝑚𝑒𝑛𝑡𝑠𝑖,𝑘
𝑡+24
𝑘=𝑡+1
+ 𝛾𝑖 + 𝑇𝑖
(4)
where,
𝑅𝑒𝑣𝑖𝑠𝑖𝑡𝑖,𝑡+25 − 𝑅𝑒𝑣𝑖𝑠𝑖𝑡𝑖,𝑡 represents the change in the number of times user 𝑖 revisited the website
between weeks 𝑡 and 𝑡 + 25.
𝛹𝑖,𝑘,𝑙 represents the set of stories belonging to opinion group 𝑙 (considering the opinion of user 𝑖)
that user 𝑖 read in week 𝑘.
𝛽0 is the intercept of the model. For the sake of decreasing the complexity of the models, we
assumed that 𝛽𝑝 is the same for all 16 groups.
𝛾𝑖 is the user fixed effect (i.e., one dummy variable for each user) for user 𝑖 and 𝑇𝑖 , which is the
number of weeks since user 𝑖 joined the website (i.e., one dummy variable for each week).
∑ 𝑃𝑜𝑠𝑡𝑠𝑖,𝑘𝑡+24𝑘=𝑡+1 and ∑ 𝐶𝑜𝑚𝑚𝑒𝑛𝑡𝑠𝑖,𝑘
𝑡+24𝑘=𝑡+1 are the number of stories and comments, respectively,
user 𝑖 published in the weeks between 𝑡 + 1 and 𝑡 + 24.
We extracted the effect of opinions by summing the marginal utility (i.e., 𝑠𝑖𝑔𝑚𝑜𝑖𝑑(𝐾) − 0.5) the
user gained by reading stories in each group, where 𝛽𝑙 captures the effect of reading stories in group 𝑙 on
user’s activity change; note that we have 𝑙 = 1 𝑡𝑜 16 as the opinion groups. We used the same model for
the change in the number of posted stories and published comments: We removed ∑ 𝑃𝑜𝑠𝑡𝑠𝑖,𝑘𝑡+24𝑘=𝑡+1 and
∑ 𝐶𝑜𝑚𝑚𝑒𝑛𝑡𝑠𝑖,𝑘𝑡+24𝑘=𝑡+1 for the posting and commenting models, respectively.
Data on posting stories and comments are directly available in our datasets. However, to extract
the data on the stories each user reads and revisiting data, we used a novel history reconstruction method
introduced by Rad and Rahmandad (2013). In short, we recreated the history of each action (i.e., posting,
revisiting, and commenting) of users based on a heuristic minimization model and the ranking algorithm
of the website. Thus, we can recreate a snapshot of the website (i.e., stories in each sub-page and ordering
page, promotion status of the stories, etc.) at any time a user has voted for a story and estimate the stories
she reads based on her location on the website (i.e., ordering page, sub-page, and place in the sub-page
where the user voted for the story) (see Rad and Rahmandad (2013) for more details on this method).
Based on our case study data, we estimated the three regression models. In Section 4.1, we
present the results and discuss the mechanisms that change user activities on the website. Next, we
3𝑠𝑖𝑔𝑚𝑜𝑖𝑑(𝐾 = 0) = 0.5 implies that the story is not biased toward any of the groups (supporter/opposition and yellow/green), and the story’s
attractiveness is zero: The story is neither attractive nor unattractive in obtaining votes.
11
present an agent-based simulation model to study the formation of communities in our case study as a
result of user interactions with different opinions.
3.2 Simulation model The regression analysis above focused on the impact of consuming different types of opinions on user
activity. However, in a system where individuals affect each other, and there are interdependencies
among the variables, regression equations do not directly inform the system level outcomes. To study and
understand the evolution of such a nested system, we developed an agent-based model that simulates the
behaviors and activities of the users and the formation of communities as a result of user interactions with
opinions of others.
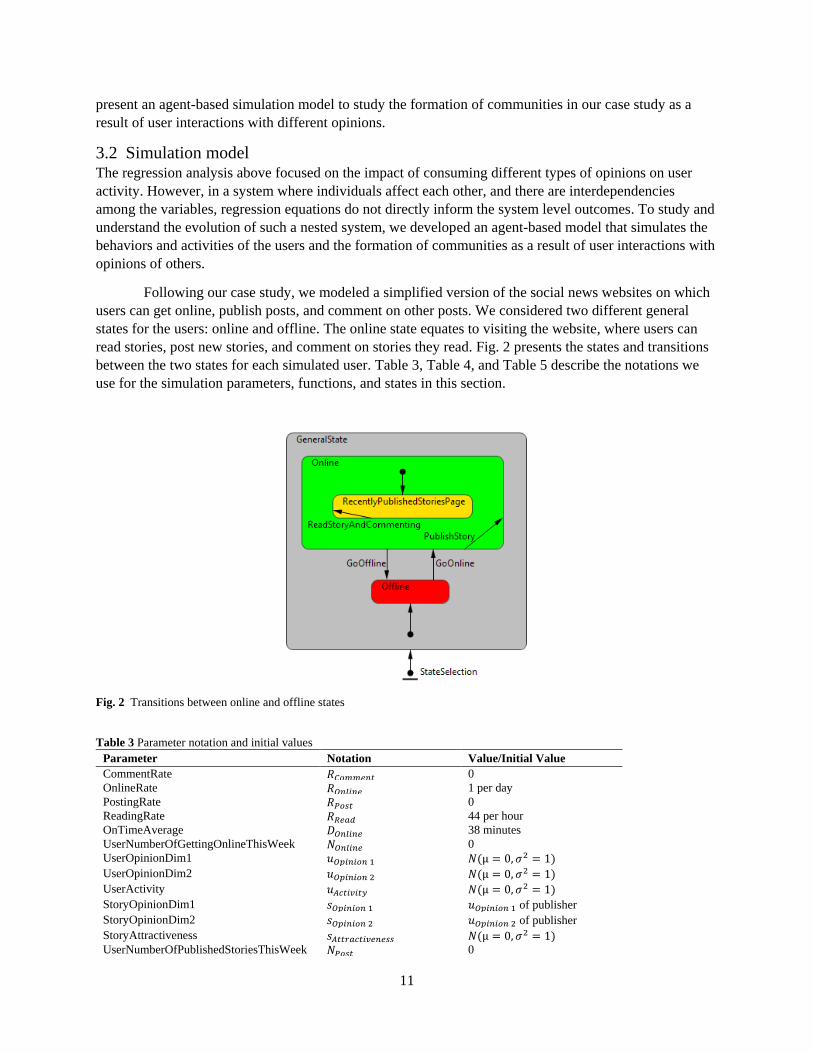
Following our case study, we modeled a simplified version of the social news websites on which
users can get online, publish posts, and comment on other posts. We considered two different general
states for the users: online and offline. The online state equates to visiting the website, where users can
read stories, post new stories, and comment on stories they read. Fig. 2 presents the states and transitions
between the two states for each simulated user. Table 3, Table 4, and Table 5 describe the notations we
use for the simulation parameters, functions, and states in this section.
Fig. 2 Transitions between online and offline states
Table 3 Parameter notation and initial values
Parameter Notation Value/Initial Value
CommentRate 𝑅𝐶𝑜𝑚𝑚𝑒𝑛𝑡 0
OnlineRate 𝑅𝑂𝑛𝑙𝑖𝑛𝑒 1 per day
PostingRate 𝑅𝑃𝑜𝑠𝑡 0
ReadingRate 𝑅𝑅𝑒𝑎𝑑 44 per hour
OnTimeAverage 𝐷𝑂𝑛𝑙𝑖𝑛𝑒 38 minutes
UserNumberOfGettingOnlineThisWeek 𝑁𝑂𝑛𝑙𝑖𝑛𝑒 0
UserOpinionDim1 𝑢𝑂𝑝𝑖𝑛𝑖𝑜𝑛 1 𝑁(µ = 0, 𝜎2 = 1)
UserOpinionDim2 𝑢𝑂𝑝𝑖𝑛𝑖𝑜𝑛 2 𝑁(µ = 0, 𝜎2 = 1)
UserActivity 𝑢𝐴𝑐𝑡𝑖𝑣𝑖𝑡𝑦 𝑁(µ = 0, 𝜎2 = 1)
StoryOpinionDim1 𝑠𝑂𝑝𝑖𝑛𝑖𝑜𝑛 1 𝑢𝑂𝑝𝑖𝑛𝑖𝑜𝑛 1 of publisher
StoryOpinionDim2 𝑠𝑂𝑝𝑖𝑛𝑖𝑜𝑛 2 𝑢𝑂𝑝𝑖𝑛𝑖𝑜𝑛 2 of publisher
StoryAttractiveness 𝑠𝐴𝑡𝑡𝑟𝑎𝑐𝑡𝑖𝑣𝑒𝑛𝑒𝑠𝑠 𝑁(µ = 0, 𝜎2 = 1) UserNumberOfPublishedStoriesThisWeek 𝑁𝑃𝑜𝑠𝑡 0

12
Parameter Notation Value/Initial Value
PostsEffectOnOnlineRate 𝛽𝑃,𝑂𝑛𝑙𝑖𝑛𝑒 From regression results
PostsEffectOnCommentRate 𝛽𝑃,𝐶𝑜𝑚𝑚𝑒𝑛𝑡 From regression results
CommentsEffectOnPostRate 𝛽𝐶,𝑃𝑜𝑠𝑡 From regression results
CommentsEffectOnOnlineRate 𝛽𝐶,𝑂𝑛𝑙𝑖𝑛𝑒 From regression results
OpinionEffectOnPostRate 𝛽𝑂𝑝𝑖𝑛𝑖𝑜𝑛 𝐺𝑟𝑜𝑢𝑝,𝑃𝑜𝑠𝑡 From regression results
OppinionEffectOnOnlineRate 𝛽𝑂𝑝𝑖𝑛𝑖𝑜𝑛 𝐺𝑟𝑜𝑢𝑝,𝑂𝑛𝑙𝑖𝑛𝑒 From regression results
OppinionEffectOnCommentRate 𝛽𝑂𝑝𝑖𝑛𝑖𝑜𝑛 𝐺𝑟𝑜𝑢𝑝,𝐶𝑜𝑚𝑚𝑒𝑛𝑡 From regression results
LifeCycleOfStoryInRecentlyPublishedPage 𝐷𝑆𝑡𝑜𝑟𝑦 𝐿𝑖𝑓𝑒 𝐶𝑦𝑐𝑙𝑒 1 day
ReadStoriesID 𝑢{𝑆𝑡𝑜𝑟𝑖𝑒𝑠 𝑅𝑒𝑎𝑑} Empty
Table 4 Function and procedure notation
Function/Procedure Notation
AddStory() 𝐹𝐴𝑑𝑑 𝑆𝑡𝑜𝑟𝑦
CommentForStory() 𝐹𝐶𝑜𝑚𝑚𝑒𝑛𝑡 EmptyReadStories() 𝐹𝐸𝑚𝑝𝑡𝑦
EmptyReadStories() 𝐹𝑅𝑒𝑙𝑒𝑎𝑠𝑒 𝑀𝑒𝑚𝑜𝑟𝑦
Remove() 𝐹𝑅𝑒𝑚𝑜𝑣𝑒 SearchForNewStory() 𝐹𝑆𝑒𝑎𝑟𝑐ℎ 𝑆𝑡𝑜𝑟𝑦
SetActivity() 𝐹𝑆𝑒𝑡 𝐴𝑐𝑡𝑖𝑣𝑖𝑡𝑦
SetBoundaries() 𝐹𝑆𝑒𝑡 𝐵𝑜𝑢𝑛𝑑𝑎𝑟𝑖𝑒𝑠 SetStoryAsRead() 𝐹𝑆𝑒𝑡 𝐴𝑠 𝑅𝑒𝑎𝑑 Sigmoid() 𝑠𝑖𝑔𝑚𝑜𝑖𝑑
Table 5 State names and notations
State Name State Notation Parent-state
GeneralState 𝑆𝐺 -
Offline 𝑆𝑂𝑓𝑓𝑙𝑖𝑛𝑒 GeneralState
Online 𝑆𝑂𝑛𝑙𝑖𝑛𝑒 GeneralState
RecentlyPublishedPage 𝑆′𝑃𝑎𝑔𝑒 -
RecentlyPublishedStoriesPage 𝑆𝑃𝑎𝑔𝑒 Online
Users, as agents in the simulation, change their state from offline to online through a 𝑇𝑂𝑛𝑙𝑖𝑛𝑒
transition with the rate of 𝑅𝑂𝑛𝑙𝑖𝑛𝑒. In the online state, users can either publish a new story (using 𝑇𝑃𝑜𝑠𝑡
transition) or visit the ordering page (𝑆𝑃𝑎𝑔𝑒) and read stories (through 𝑇𝑅𝑒𝑎𝑑 transition). Users go offline
after spending a certain amount of time (with duration 𝐷𝑂𝑛𝑙𝑖𝑛𝑒) on the website through a 𝑇𝑂𝑓𝑓𝑙𝑖𝑛𝑒
transition. Table 6 presents the transition triggers and the pseudocodes for each transition.
Table 6 Transition triggers and the pseudocodes
Transition
Name
Transition
Notation Trigger Pseudocode
GoOnline 𝑇𝑂𝑛𝑙𝑖𝑛𝑒 𝑅𝑂𝑛𝑙𝑖𝑛𝑒 𝑁𝑂𝑛𝑙𝑖𝑛𝑒 = 𝑁𝑂𝑛𝑙𝑖𝑛𝑒 + 1
ReadStoryAnd
Commenting 𝑇𝑅𝑒𝑎𝑑 𝑅𝑅𝑒𝑎𝑑 𝑠 = 𝐹𝑆𝑒𝑎𝑟𝑐ℎ 𝑆𝑡𝑜𝑟𝑦
𝐹𝑆𝑒𝑡 𝐴𝑐𝑡𝑖𝑣𝑖𝑡𝑦(𝑠𝑂𝑝𝑖𝑛𝑖𝑜𝑛 1, 𝑠𝑂𝑝𝑖𝑛𝑖𝑜𝑛 2, 𝑠𝐴𝑡𝑡𝑟𝑎𝑐𝑡𝑖𝑣𝑒𝑛𝑒𝑠𝑠)
𝐹𝐶𝑜𝑚𝑚𝑒𝑛𝑡(𝑅𝐶𝑜𝑚𝑚𝑒𝑛𝑡)
𝐹𝑆𝑒𝑡 𝐴𝑠 𝑅𝑒𝑎𝑑(𝑠)
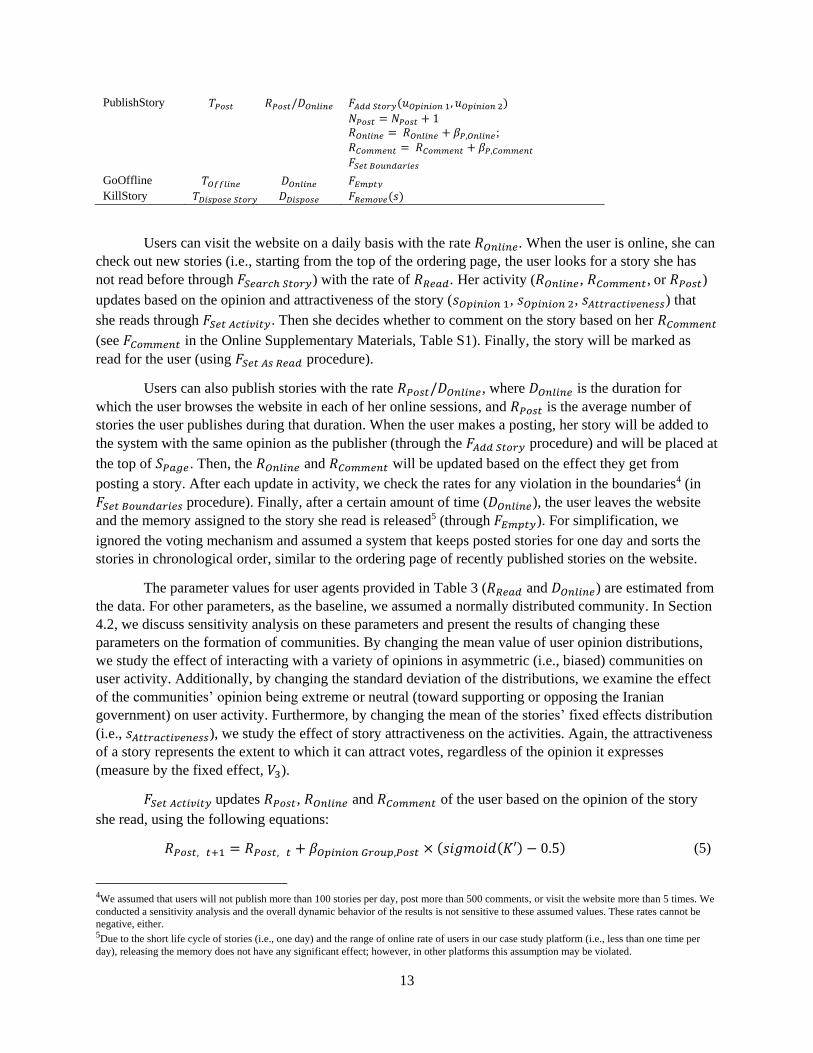
13
PublishStory 𝑇𝑃𝑜𝑠𝑡 𝑅𝑃𝑜𝑠𝑡/𝐷𝑂𝑛𝑙𝑖𝑛𝑒 𝐹𝐴𝑑𝑑 𝑆𝑡𝑜𝑟𝑦(𝑢𝑂𝑝𝑖𝑛𝑖𝑜𝑛 1, 𝑢𝑂𝑝𝑖𝑛𝑖𝑜𝑛 2)
𝑁𝑃𝑜𝑠𝑡 = 𝑁𝑃𝑜𝑠𝑡 + 1
𝑅𝑂𝑛𝑙𝑖𝑛𝑒 = 𝑅𝑂𝑛𝑙𝑖𝑛𝑒 + 𝛽𝑃,𝑂𝑛𝑙𝑖𝑛𝑒;
𝑅𝐶𝑜𝑚𝑚𝑒𝑛𝑡 = 𝑅𝐶𝑜𝑚𝑚𝑒𝑛𝑡 + 𝛽𝑃,𝐶𝑜𝑚𝑚𝑒𝑛𝑡
𝐹𝑆𝑒𝑡 𝐵𝑜𝑢𝑛𝑑𝑎𝑟𝑖𝑒𝑠
GoOffline 𝑇𝑂𝑓𝑓𝑙𝑖𝑛𝑒 𝐷𝑂𝑛𝑙𝑖𝑛𝑒 𝐹𝐸𝑚𝑝𝑡𝑦
KillStory 𝑇𝐷𝑖𝑠𝑝𝑜𝑠𝑒 𝑆𝑡𝑜𝑟𝑦 𝐷𝐷𝑖𝑠𝑝𝑜𝑠𝑒 𝐹𝑅𝑒𝑚𝑜𝑣𝑒(𝑠)
Users can visit the website on a daily basis with the rate 𝑅𝑂𝑛𝑙𝑖𝑛𝑒. When the user is online, she can
check out new stories (i.e., starting from the top of the ordering page, the user looks for a story she has
not read before through 𝐹𝑆𝑒𝑎𝑟𝑐ℎ 𝑆𝑡𝑜𝑟𝑦) with the rate of 𝑅𝑅𝑒𝑎𝑑. Her activity (𝑅𝑂𝑛𝑙𝑖𝑛𝑒, 𝑅𝐶𝑜𝑚𝑚𝑒𝑛𝑡, or 𝑅𝑃𝑜𝑠𝑡)
updates based on the opinion and attractiveness of the story (𝑠𝑂𝑝𝑖𝑛𝑖𝑜𝑛 1, 𝑠𝑂𝑝𝑖𝑛𝑖𝑜𝑛 2, 𝑠𝐴𝑡𝑡𝑟𝑎𝑐𝑡𝑖𝑣𝑒𝑛𝑒𝑠𝑠) that
she reads through 𝐹𝑆𝑒𝑡 𝐴𝑐𝑡𝑖𝑣𝑖𝑡𝑦. Then she decides whether to comment on the story based on her 𝑅𝐶𝑜𝑚𝑚𝑒𝑛𝑡
(see 𝐹𝐶𝑜𝑚𝑚𝑒𝑛𝑡 in the Online Supplementary Materials, Table S1). Finally, the story will be marked as
read for the user (using 𝐹𝑆𝑒𝑡 𝐴𝑠 𝑅𝑒𝑎𝑑 procedure).
Users can also publish stories with the rate 𝑅𝑃𝑜𝑠𝑡/𝐷𝑂𝑛𝑙𝑖𝑛𝑒, where 𝐷𝑂𝑛𝑙𝑖𝑛𝑒 is the duration for
which the user browses the website in each of her online sessions, and 𝑅𝑃𝑜𝑠𝑡 is the average number of
stories the user publishes during that duration. When the user makes a posting, her story will be added to
the system with the same opinion as the publisher (through the 𝐹𝐴𝑑𝑑 𝑆𝑡𝑜𝑟𝑦 procedure) and will be placed at
the top of 𝑆𝑃𝑎𝑔𝑒. Then, the 𝑅𝑂𝑛𝑙𝑖𝑛𝑒 and 𝑅𝐶𝑜𝑚𝑚𝑒𝑛𝑡 will be updated based on the effect they get from
posting a story. After each update in activity, we check the rates for any violation in the boundaries4 (in
𝐹𝑆𝑒𝑡 𝐵𝑜𝑢𝑛𝑑𝑎𝑟𝑖𝑒𝑠 procedure). Finally, after a certain amount of time (𝐷𝑂𝑛𝑙𝑖𝑛𝑒), the user leaves the website
and the memory assigned to the story she read is released5 (through 𝐹𝐸𝑚𝑝𝑡𝑦). For simplification, we
ignored the voting mechanism and assumed a system that keeps posted stories for one day and sorts the
stories in chronological order, similar to the ordering page of recently published stories on the website.
The parameter values for user agents provided in Table 3 (𝑅𝑅𝑒𝑎𝑑 and 𝐷𝑂𝑛𝑙𝑖𝑛𝑒) are estimated from
the data. For other parameters, as the baseline, we assumed a normally distributed community. In Section
4.2, we discuss sensitivity analysis on these parameters and present the results of changing these
parameters on the formation of communities. By changing the mean value of user opinion distributions,
we study the effect of interacting with a variety of opinions in asymmetric (i.e., biased) communities on
user activity. Additionally, by changing the standard deviation of the distributions, we examine the effect
of the communities’ opinion being extreme or neutral (toward supporting or opposing the Iranian
government) on user activity. Furthermore, by changing the mean of the stories’ fixed effects distribution
(i.e., 𝑠𝐴𝑡𝑡𝑟𝑎𝑐𝑡𝑖𝑣𝑒𝑛𝑒𝑠𝑠), we study the effect of story attractiveness on the activities. Again, the attractiveness
of a story represents the extent to which it can attract votes, regardless of the opinion it expresses
(measure by the fixed effect, 𝑉3).
𝐹𝑆𝑒𝑡 𝐴𝑐𝑡𝑖𝑣𝑖𝑡𝑦 updates 𝑅𝑃𝑜𝑠𝑡, 𝑅𝑂𝑛𝑙𝑖𝑛𝑒 and 𝑅𝐶𝑜𝑚𝑚𝑒𝑛𝑡 of the user based on the opinion of the story
she read, using the following equations:
𝑅𝑃𝑜𝑠𝑡, 𝑡+1 = 𝑅𝑃𝑜𝑠𝑡, 𝑡 + 𝛽𝑂𝑝𝑖𝑛𝑖𝑜𝑛 𝐺𝑟𝑜𝑢𝑝,𝑃𝑜𝑠𝑡 × (𝑠𝑖𝑔𝑚𝑜𝑖𝑑(𝐾′) − 0.5) (5)
4We assumed that users will not publish more than 100 stories per day, post more than 500 comments, or visit the website more than 5 times. We
conducted a sensitivity analysis and the overall dynamic behavior of the results is not sensitive to these assumed values. These rates cannot be
negative, either. 5Due to the short life cycle of stories (i.e., one day) and the range of online rate of users in our case study platform (i.e., less than one time per
day), releasing the memory does not have any significant effect; however, in other platforms this assumption may be violated.
14
𝑅𝑂𝑛𝑙𝑖𝑛𝑒, 𝑡+1 = 𝑅𝑂𝑛𝑙𝑖𝑛𝑒, 𝑡 + 𝛽𝑂𝑝𝑖𝑛𝑖𝑜𝑛 𝐺𝑟𝑜𝑢𝑝,𝑂𝑛𝑙𝑖𝑛𝑒 × (𝑠𝑖𝑔𝑚𝑜𝑖𝑑(𝐾′) − 0.5) (6)
𝑅𝐶𝑜𝑚𝑚𝑒𝑛𝑡, 𝑡+1 = 𝑅𝐶𝑜𝑚𝑚𝑒𝑛𝑡, 𝑡 + 𝛽𝑂𝑝𝑖𝑛𝑖𝑜𝑛 𝐺𝑟𝑜𝑢𝑝,𝐶𝑜𝑚𝑚𝑒𝑛𝑡 × (𝑠𝑖𝑔𝑚𝑜𝑖𝑑(𝐾′) − 0.5) (7)
where, 𝐾′ = 𝑢𝑂𝑝𝑖𝑛𝑖𝑜𝑛 1 × 𝑠𝑂𝑝𝑖𝑛𝑖𝑜𝑛 1 + 𝑢𝑂𝑝𝑖𝑛𝑖𝑜𝑛 2 × 𝑠𝑂𝑝𝑖𝑛𝑖𝑜𝑛 2 + 𝑠𝐴𝑡𝑡𝑟𝑎𝑐𝑡𝑖𝑣𝑒𝑛𝑒𝑠𝑠.
In equations (5), (6), and (7), we basically calculate the marginal utility value that the user gains
by reading the story (i.e., (𝑠𝑖𝑔𝑚𝑜𝑖𝑑(𝐾′) − 0.5)), and derive its effect on the user’s activity change,
considering the respective opinion group (i.e., in the same way we calculate the regression independent
variable in equation (4)).
For simplification, in our simulation model we assumed that there was only one ordering page (𝑆′𝑃𝑎𝑔𝑒) so
that when a story is posted, it is placed at the top of this ordering page. The life cycle of stories on this
ordering page (𝐷𝑆𝑡𝑜𝑟𝑦 𝐿𝑖𝑓𝑒 𝐶𝑦𝑐𝑙𝑒) is assumed to be one day. 𝑇𝐷𝑖𝑠𝑝𝑜𝑠𝑒 𝑆𝑡𝑜𝑟𝑦 transition removes the story
from the ordering page (and the system) when it reaches the end of its life cycle (i.e., one day for recently
published ordering pages). The results of the simulation model are presented in Section 4.2.
4 Results We first present the results of regression modeling analysis in Section 4.1, and then discuss the results of
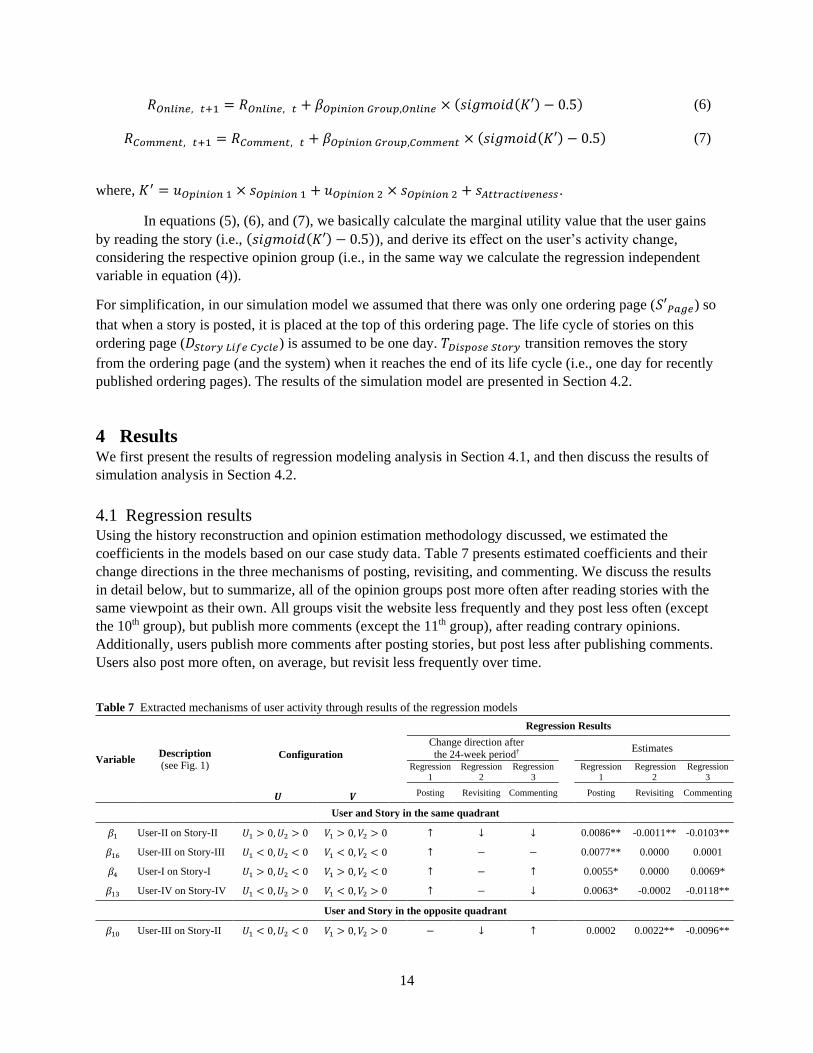
simulation analysis in Section 4.2.
4.1 Regression results Using the history reconstruction and opinion estimation methodology discussed, we estimated the
coefficients in the models based on our case study data. Table 7 presents estimated coefficients and their
change directions in the three mechanisms of posting, revisiting, and commenting. We discuss the results
in detail below, but to summarize, all of the opinion groups post more often after reading stories with the
same viewpoint as their own. All groups visit the website less frequently and they post less often (except
the 10th group), but publish more comments (except the 11th group), after reading contrary opinions.
Additionally, users publish more comments after posting stories, but post less after publishing comments.
Users also post more often, on average, but revisit less frequently over time.
Table 7 Extracted mechanisms of user activity through results of the regression models
Variable Description
(see Fig. 1) Configuration
Regression Results
Change direction after
the 24-week period† Estimates
𝑼 𝑽
Regression
1
Regression
2
Regression
3
Regression
1
Regression
2
Regression
3
Posting Revisiting Commenting
Posting Revisiting Commenting
User and Story in the same quadrant
𝛽1 User-II on Story-II 𝑈1 > 0, 𝑈2 > 0 𝑉1 > 0, 𝑉2 > 0 ↑ ↓ ↓ 0.0086** -0.0011** -0.0103**
𝛽16 User-III on Story-III 𝑈1 < 0, 𝑈2 < 0 𝑉1 < 0, 𝑉2 < 0 ↑ − − 0.0077** 0.0000 0.0001
𝛽4 User-I on Story-I 𝑈1 > 0, 𝑈2 < 0 𝑉1 > 0, 𝑉2 < 0 ↑ − ↑ 0.0055* 0.0000 0.0069*
𝛽13 User-IV on Story-IV 𝑈1 < 0, 𝑈2 > 0 𝑉1 < 0, 𝑉2 > 0 ↑ − ↓ 0.0063* -0.0002 -0.0118**
User and Story in the opposite quadrant
𝛽10 User-III on Story-II 𝑈1 < 0, 𝑈2 < 0 𝑉1 > 0, 𝑉2 > 0 − ↓ ↑ 0.0002 0.0022** -0.0096**
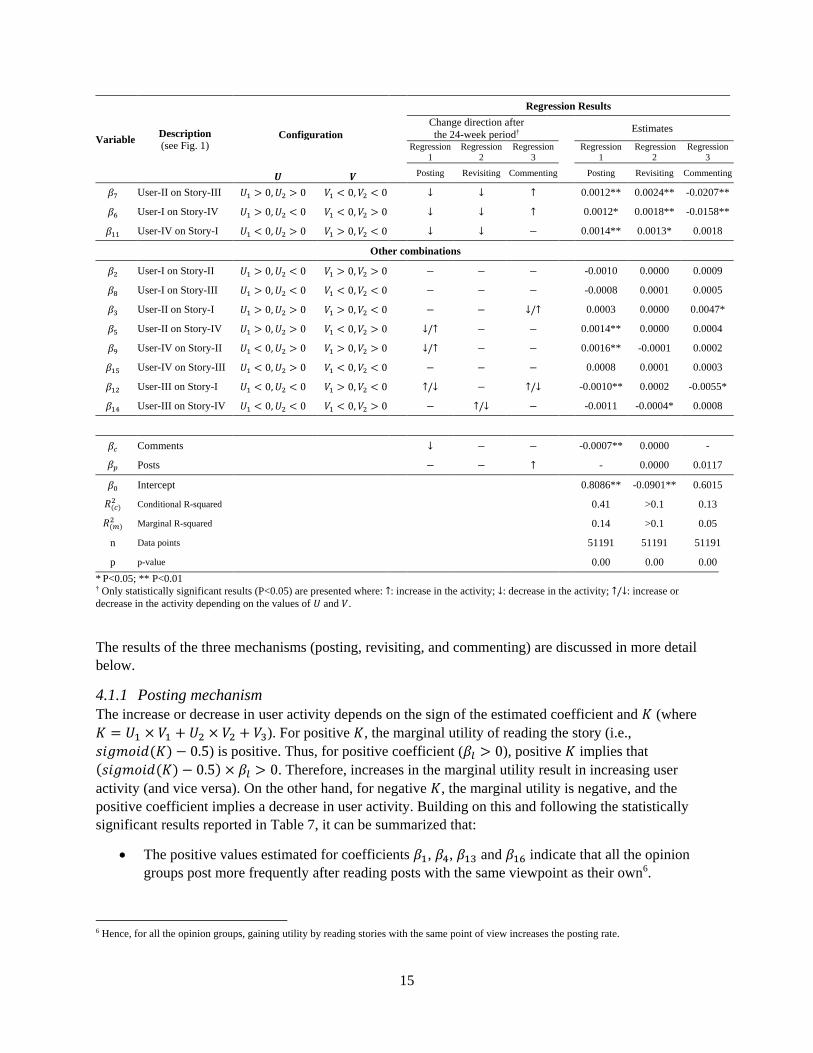
15
Variable Description
(see Fig. 1) Configuration
Regression Results
Change direction after
the 24-week period† Estimates
𝑼 𝑽
Regression
1
Regression
2
Regression
3
Regression
1
Regression
2
Regression
3
Posting Revisiting Commenting
Posting Revisiting Commenting
𝛽7 User-II on Story-III 𝑈1 > 0, 𝑈2 > 0 𝑉1 < 0, 𝑉2 < 0 ↓ ↓ ↑ 0.0012** 0.0024** -0.0207**
𝛽6 User-I on Story-IV 𝑈1 > 0, 𝑈2 < 0 𝑉1 < 0, 𝑉2 > 0 ↓ ↓ ↑ 0.0012* 0.0018** -0.0158**
𝛽11 User-IV on Story-I 𝑈1 < 0, 𝑈2 > 0 𝑉1 > 0, 𝑉2 < 0 ↓ ↓ − 0.0014** 0.0013* 0.0018
Other combinations
𝛽2 User-I on Story-II 𝑈1 > 0, 𝑈2 < 0 𝑉1 > 0, 𝑉2 > 0 − − − -0.0010 0.0000 0.0009
𝛽8 User-I on Story-III 𝑈1 > 0, 𝑈2 < 0 𝑉1 < 0, 𝑉2 < 0 − − − -0.0008 0.0001 0.0005
𝛽3 User-II on Story-I 𝑈1 > 0, 𝑈2 > 0 𝑉1 > 0, 𝑉2 < 0 − − ↓/↑ 0.0003 0.0000 0.0047*
𝛽5 User-II on Story-IV 𝑈1 > 0, 𝑈2 > 0 𝑉1 < 0, 𝑉2 > 0 ↓/↑ − − 0.0014** 0.0000 0.0004
𝛽9 User-IV on Story-II 𝑈1 < 0, 𝑈2 > 0 𝑉1 > 0, 𝑉2 > 0 ↓/↑ − − 0.0016** -0.0001 0.0002
𝛽15 User-IV on Story-III 𝑈1 < 0, 𝑈2 > 0 𝑉1 < 0, 𝑉2 < 0 − − − 0.0008 0.0001 0.0003
𝛽12 User-III on Story-I 𝑈1 < 0, 𝑈2 < 0 𝑉1 > 0, 𝑉2 < 0 ↑/↓ − ↑/↓ -0.0010** 0.0002 -0.0055*
𝛽14 User-III on Story-IV 𝑈1 < 0, 𝑈2 < 0 𝑉1 < 0, 𝑉2 > 0 − ↑/↓ − -0.0011 -0.0004* 0.0008
𝛽𝑐 Comments ↓ − − -0.0007** 0.0000 -
𝛽𝑝 Posts − − ↑ - 0.0000 0.0117
𝛽0 Intercept 0.8086** -0.0901** 0.6015
𝑅(𝑐)2 Conditional R-squared 0.41 >0.1 0.13
𝑅(𝑚)2 Marginal R-squared 0.14 >0.1 0.05
n Data points 51191 51191 51191
p p-value 0.00 0.00 0.00
* P<0.05; ** P<0.01
† Only statistically significant results (P<0.05) are presented where: ↑: increase in the activity; ↓: decrease in the activity; ↑/↓: increase or
decrease in the activity depending on the values of 𝑈 and 𝑉.
The results of the three mechanisms (posting, revisiting, and commenting) are discussed in more detail
below.
4.1.1 Posting mechanism
The increase or decrease in user activity depends on the sign of the estimated coefficient and 𝐾 (where
𝐾 = 𝑈1 × 𝑉1 + 𝑈2 × 𝑉2 + 𝑉3). For positive 𝐾, the marginal utility of reading the story (i.e.,
𝑠𝑖𝑔𝑚𝑜𝑖𝑑(𝐾) − 0.5) is positive. Thus, for positive coefficient (𝛽𝑙 > 0), positive 𝐾 implies that
(𝑠𝑖𝑔𝑚𝑜𝑖𝑑(𝐾) − 0.5) × 𝛽𝑙 > 0. Therefore, increases in the marginal utility result in increasing user
activity (and vice versa). On the other hand, for negative 𝐾, the marginal utility is negative, and the
positive coefficient implies a decrease in user activity. Building on this and following the statistically
significant results reported in Table 7, it can be summarized that:
The positive values estimated for coefficients 𝛽1, 𝛽4, 𝛽13 and 𝛽16 indicate that all the opinion
groups post more frequently after reading posts with the same viewpoint as their own6.
6 Hence, for all the opinion groups, gaining utility by reading stories with the same point of view increases the posting rate.

16
Reading stories with contrary opinions (e.g., Users-II reading Story-III) reduces the posting rate
for all the groups except Users-III, yellow opposition, for whom the effect is insignificant (i.e.,
𝛽6, 𝛽7 and 𝛽11 estimated to be positive and statistically significant, while 𝛽10 is insignificant)7.
The positive values estimated for 𝛽5 and 𝛽9 indicate that fans of green stories (Users-II and
Users-IV) post more stories reading green opponent stories (Stories-IV and Stories-II,
respectively), if it increases their utility (i.e., if the utility gained from the ‘greenness’ of the
content overcomes the decrease in utility caused by opposing or supporting the government), and
post less otherwise8.
𝛽12 is estimated to be negative, which implies that Users-III, yellow opposition, post more stories
after reading Stories-I, yellow supporter, if it increases their utility (i.e., if the utility gained from
the ‘yellowness’ of the content overcomes the decrease in utility caused by supporting the
government), and post less otherwise9.
A positive significant intercept indicates that on average the number of posts increases, regardless
of what users read on the website. This change in the posting rate varies between different users
(𝜎𝑢𝑠𝑒𝑟𝑠 𝑟𝑎𝑛𝑑𝑜𝑚 𝑒𝑓𝑓𝑒𝑐𝑡 = 0.952), but the number of weeks that have passed since the user started using the
website (i.e., the time fixed effect) has no significant effect on posting. A negative significant coefficient
for the number of published comments indicates that the posting rate decreases when a user publishes
more comments. This could be the result of users becoming frustrated and discouraged when they
participate in heated discussions on platform.
The conditional R-squared and marginal R-squared of the regression model are 0.41 and 0.14,
respectively, meaning that the model explains 41% of the variability in the data, while the fixed effect
alone explains 14% of the variability.
4.1.2 Revisiting mechanism
Most of the coefficients in the regression model for the revisiting mechanism are not statistically
significant (see Table 7), so one could infer that what users read on the website has a limited effect on
their likelihood of revisiting the website. However, due to the lack of data on exact times of online visits,
our results on this variable are more tentative10. We discuss the significant results below:
Negative 𝛽1 signifies that reading like-minded stories decreases Users-II’s (green supporter)
online rate, which means they return less frequently after reading Stories-II.
𝛽6, 𝛽7, 𝛽10 and 𝛽11 are all estimated to be positive, implying that all of the opinion groups revisit
the website less often after reading stories from users with opposing opinions (e.g., Users-II
reading stories from Stories-III). This could be the result of users becoming frustrated by reading
stories that are incompatible with their opinions.
7 Note that a greater difference between the opinion of the user and that of the stories she reads results in a further decrease in her utility and
posting rates. For instance, when a User-II reads a Story-III, her posting rate decreases more than when she reads a Story-III which is more
neutral toward opposing the government. 8In other words, reading green stories (Story-II or Story-IV) that are somehow more neutral (i.e., not extreme in opposing/supporting the
government) increases the posting rate of green users (User-II or User-IV). However, reading green extreme opponent stories (User-IV reading
Story-II or User-II reading Story-IV) reduces user posting rates, implying that they become discouraged about sharing their opinions when they
read stories with opinions differing widely from their own with regard to the government (i.e., when they feel the opinions of their audiences are
very different from theirs). 9Unlike in the previous cases, here Users-III confront opinions of Users-I who are extreme in supporting the government by posting more stories. 10As noted earlier, we had raw data for comments and posts but estimated the time of online visits—see Ashouri Rad (2016) for more
information.
17
A negative 𝛽14 implies that Users-III revisit the website more often upon reading Stories-IV that
decrease their utility (i.e., if the utility loss from the ‘greenness’ of the content overcomes the
increase in utility caused by opposing the government), and revisit less otherwise.
A negative significant intercept indicates that users’ online rate decreases on average over time,
but the scale varies (slightly) based on the number of weeks that have passed since the user joined the
website (𝜎𝑡𝑖𝑚𝑒 𝑟𝑎𝑛𝑑𝑜𝑚 𝑒𝑓𝑓𝑒𝑐𝑡 = 0.059). There is limited variation in the change of online rates between
different users. Note that posting is conditional on users being online; consequently, positive and negative
intercepts for posting and online rate, respectively, imply that users revisit the website less frequently
over time, but in each online session they post more stories. Additionally, the number of published posts
and comments has no effect on the online rate.
Conditional and marginal R-squared are both less than 0.01, which means that the model explains
less than 1% of the variability in the data. Therefore, the change in users’ online rates is mostly affected
by other variables (possibly exogenous factors) not considered in our model.
4.1.3 Commenting mechanism
The statistically significant results for the commenting regression (see Table 7) are summarized as
follows:
Negative 𝛽1 and 𝛽13 imply that green users (User-II and User-IV) comment less when they read
stories with the same opinion as theirs (Story-II and Story-IV, respectively). This means that, for
green users, reading stories with the same viewpoint as theirs decreases their willingness or need
to participate in discussion.
A positive 𝛽3 presents that the comment rate for Users-II decreases when they read Stories-I that
decrease their utility (i.e., if the utility loss from the ‘yellowness’ of the content overcomes the
increase in utility caused by supporting the government), and the comment rate increases
otherwise.
A positive 𝛽4 presents that Users-I comment more after reading stories with the same viewpoint
as their own.
Negative 𝛽6 and 𝛽7 indicate that Users-I and Users-II become more engaged in discussions after
reading Stories-IV and Stories-III, respectively.
𝛽10 is negative, meaning that Users-III comment more after reading Stories-II.
A negative 𝛽12 implies that Users-III comment more after reading Stories-I that decrease their
utility (i.e., if the utility loss from supporting the government overcomes the increase in utility
caused by ‘greenness’ of the content), and comment less otherwise.
The estimated intercept value is not significant; hence, there is no constant change in the number
of comments over time. However, the change in the number of comments varies for different users and
times since joining the website (based on 𝜎𝑢𝑠𝑒𝑟 𝑓𝑖𝑥𝑒𝑑 𝑒𝑓𝑓𝑒𝑐𝑡 = 0.830 and 𝜎𝑡𝑖𝑚𝑒 𝑓𝑖𝑥𝑒𝑑 𝑒𝑓𝑓𝑒𝑐𝑡 = 0.886,
respectively). Also, the number of posts the user publishes has a positive effect on her number of
comments. This could be due to the users’ contributions in discussions on their posted stories.
Conditional R-squared of the online rate regression model is 0.13, while its marginal R-squared is
0.05; i.e., the model explains 13% of variability in the data, while fixed effects alone explain only 5% of
the variability.
18
4.2 Simulation results In this section, as a baseline scenario, we first present simulation results for a symmetric (i.e., unbiased)
community that does not have a significant tendency to support or oppose the Iranian government, and to
be fans of yellow or green stories (Section 4.2.1); the mean values of the starting points of 𝑢𝑂𝑝𝑖𝑛𝑖𝑜𝑛 1 and
𝑢𝑂𝑝𝑖𝑛𝑖𝑜𝑛 2 are set to be zero. We discuss the evolution of this community over time, considering the three
mechanisms of posting, revisiting, and commenting. Then, by changing the mean starting points of
𝑢𝑂𝑝𝑖𝑛𝑖𝑜𝑛 1, we are able to study the behavior and the future formation of biased communities (see Section
4.2.3).
4.2.1 Symmetric community
First, we simulate 500 hypothesized users with standard-normally distributed opinions (on two
dimensions in Fig. 1: supporting/opposing the Iranian government, and being fans of yellow and green
stories), as well as stories’ attractiveness (𝑁(0,1)) for 1,000 days11. Based on our data, we assume that the
distribution of opinions is normal; however, this assumption can be violated in other data sets. The total
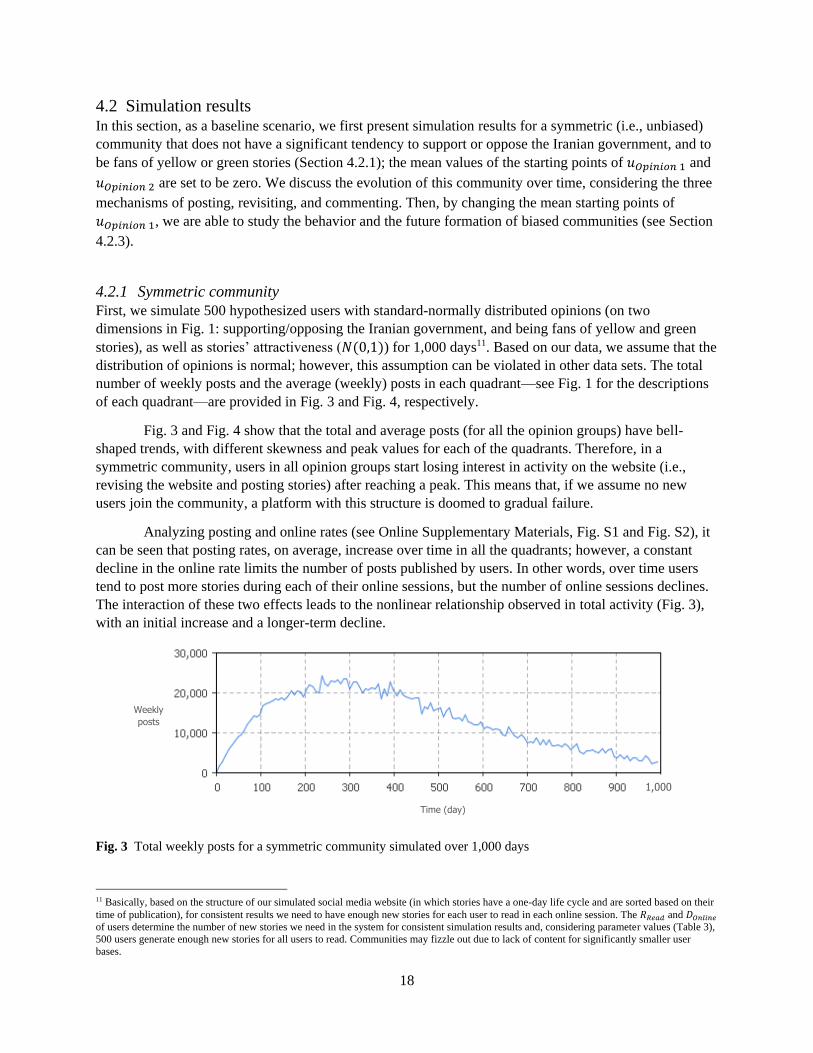
number of weekly posts and the average (weekly) posts in each quadrant—see Fig. 1 for the descriptions
of each quadrant—are provided in Fig. 3 and Fig. 4, respectively.
Fig. 3 and Fig. 4 show that the total and average posts (for all the opinion groups) have bell-
shaped trends, with different skewness and peak values for each of the quadrants. Therefore, in a
symmetric community, users in all opinion groups start losing interest in activity on the website (i.e.,
revising the website and posting stories) after reaching a peak. This means that, if we assume no new
users join the community, a platform with this structure is doomed to gradual failure.
Analyzing posting and online rates (see Online Supplementary Materials, Fig. S1 and Fig. S2), it
can be seen that posting rates, on average, increase over time in all the quadrants; however, a constant
decline in the online rate limits the number of posts published by users. In other words, over time users
tend to post more stories during each of their online sessions, but the number of online sessions declines.
The interaction of these two effects leads to the nonlinear relationship observed in total activity (Fig. 3),
with an initial increase and a longer-term decline.
Fig. 3 Total weekly posts for a symmetric community simulated over 1,000 days
11 Basically, based on the structure of our simulated social media website (in which stories have a one-day life cycle and are sorted based on their
time of publication), for consistent results we need to have enough new stories for each user to read in each online session. The 𝑅𝑅𝑒𝑎𝑑 and 𝐷𝑂𝑛𝑙𝑖𝑛𝑒
of users determine the number of new stories we need in the system for consistent simulation results and, considering parameter values (Table 3),
500 users generate enough new stories for all users to read. Communities may fizzle out due to lack of content for significantly smaller user
bases.
Weekly
posts
Time (day)
1,000
19
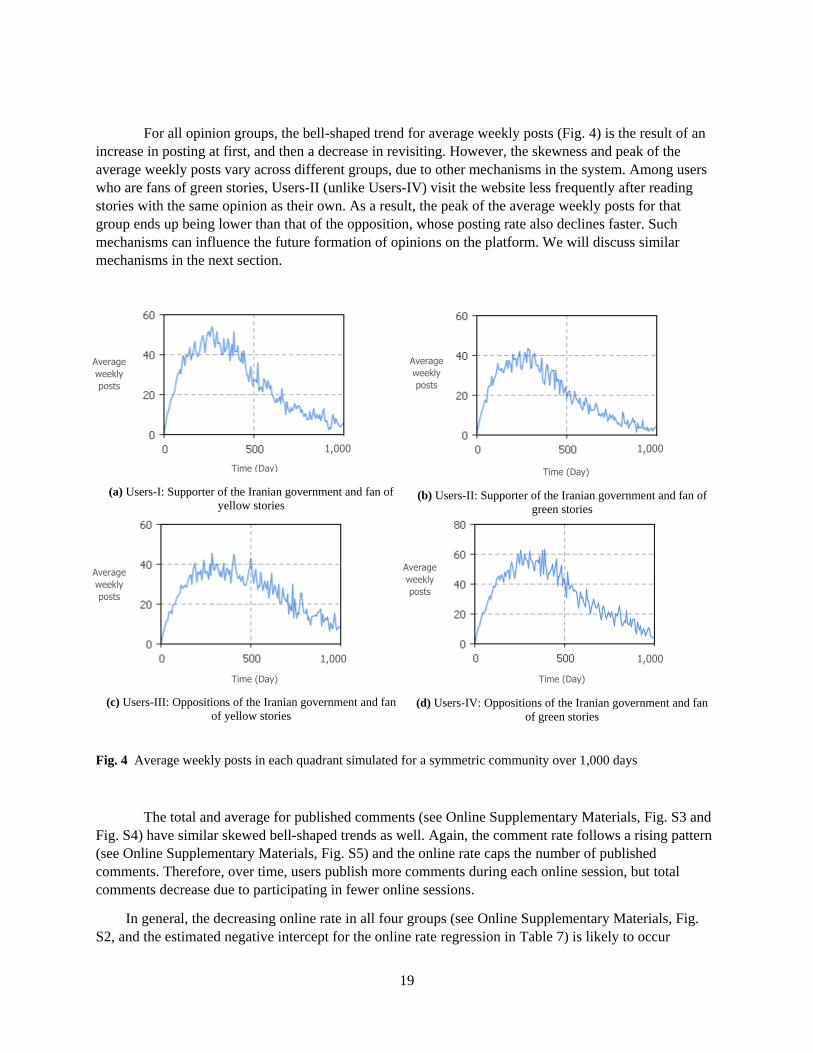
For all opinion groups, the bell-shaped trend for average weekly posts (Fig. 4) is the result of an
increase in posting at first, and then a decrease in revisiting. However, the skewness and peak of the
average weekly posts vary across different groups, due to other mechanisms in the system. Among users
who are fans of green stories, Users-II (unlike Users-IV) visit the website less frequently after reading
stories with the same opinion as their own. As a result, the peak of the average weekly posts for that
group ends up being lower than that of the opposition, whose posting rate also declines faster. Such
mechanisms can influence the future formation of opinions on the platform. We will discuss similar
mechanisms in the next section.
(a) Users-I: Supporter of the Iranian government and fan of
yellow stories
(b) Users-II: Supporter of the Iranian government and fan of
green stories
(c) Users-III: Oppositions of the Iranian government and fan
of yellow stories
(d) Users-IV: Oppositions of the Iranian government and fan
of green stories
Fig. 4 Average weekly posts in each quadrant simulated for a symmetric community over 1,000 days
The total and average for published comments (see Online Supplementary Materials, Fig. S3 and
Fig. S4) have similar skewed bell-shaped trends as well. Again, the comment rate follows a rising pattern
(see Online Supplementary Materials, Fig. S5) and the online rate caps the number of published
comments. Therefore, over time, users publish more comments during each online session, but total
comments decrease due to participating in fewer online sessions.
In general, the decreasing online rate in all four groups (see Online Supplementary Materials, Fig.
S2, and the estimated negative intercept for the online rate regression in Table 7) is likely to occur
Time (Day)
1,000
Average
weekly
posts
1,000
Average
weekly
posts
Time (Day)
1,000
Average
weekly
posts
Time (Day)
1,000
Average
weekly
posts
Time (Day)
20
because users become tired of the community, regardless of their opinion and that of the community.
Furthermore, the fact that the numbers of posts and comments are estimated to be non-significant (in the
revisiting regression) shows that user activity rates have little effect on users eventually becoming tired of
the community and ultimately leaving the system.
4.2.2 Assessment
To assess the results of the baseline simulation, we compared them with a subset of case study data for
133 users who were active on the website for at least six months. We particularly focused on the data for
the posting mechanism, based on the attractiveness of fit of the posting regression model compared with
the models of the other two mechanisms (see Table 7). Based on the extracted data, we calculated the
time trend for the weekly average posts for the duration of user activity, starting from the time each user
joined the website. We then simulated our model 50 times for 500 hypothesized users with standard-
normally distributed opinions; however, we set the stories’ attractiveness to the estimated value for the
case study community (µ=-3.55,σ=1) (see Ashouri Rad (2016) for more information). We then calculated
the 95% confidence interval of the simulated average weekly posts and compared it with the trend we
extracted from the data.
Comparing the average weekly posts of the selected users with that of the simulations, 85% of the
data points fall in the simulated 95% confidence interval. The trend extracted from the data lies slightly
above the 95% confidence interval during the first 10 weeks of the simulation, which could be the result
of other dynamics not consider in this study for the sake of simplification, such as voting dynamics and
promotion programs of the website. Despite this minor bias in our simulation, the results project the
overall behavior of users in the case study.
4.2.3 Asymmetric communities
So far, we have simulated a symmetric community where user opinions are distributed normally with a
mean of zero on two dimensions of 𝑈1 and 𝑈2 (see Fig. 1). However, online communities could be
asymmetric, i.e., biased. The popularity of a community within specific groups of users with specific
mindsets, subsets of initial users who invite and attract like-minded individuals to join the community,
among other reasons, could form a community that is biased toward one quadrant of the opinion space;
see Fig. 1 for the descriptions of each quadrant. Here, we study the effect of community bias on user
activity rates and the evolution of the community.
It should be noted that we studied communities biased toward supporting or opposing the Iranian
government and being fans of yellow or green stories. The overall dynamics of simulation outcomes were
similar for both. We focus our presentation of results on being supportive/against the government, a
dimension that is both more coherent and somewhat more interesting. Furthermore, given the nature of
political polarities, extremeness often develops in social media. We therefore analyze such extreme
behaviors as well in the following two sub-sections.
Politically biased communities
We changed the mean of users’ opinion in the first dimension (i.e., 𝑢𝑂𝑝𝑖𝑛𝑖𝑜𝑛 1 which represents 𝑈1 in Fig.
1) in the range of [−1, 1] (from users mostly opposing the Iranian government to mostly supporting the
government) with a step size of 0.1, and ran a simulation with 500 users for each step size, a total of 21
simulated data series of 500 users. We assume all other model variables stay the same and no new users
21
joining the system, so that the changes in simulation results can be described by the changes in the initial
means of users’ opinion.
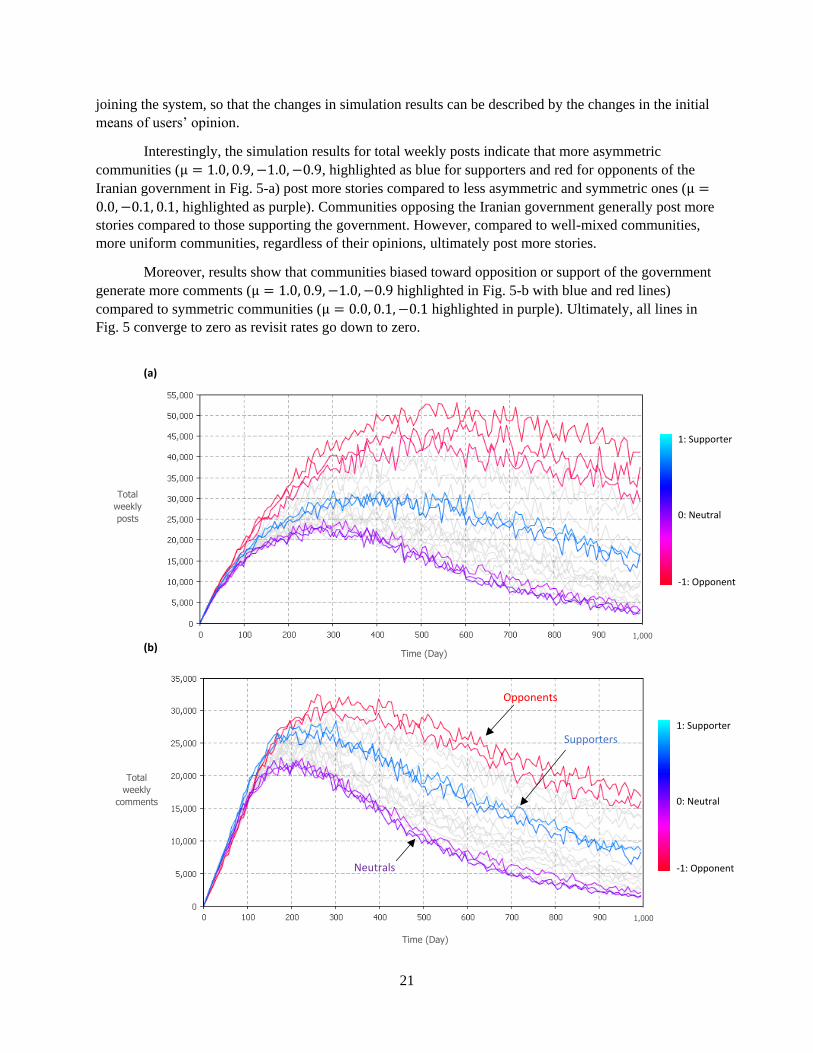
Interestingly, the simulation results for total weekly posts indicate that more asymmetric
communities (µ = 1.0, 0.9, −1.0, −0.9, highlighted as blue for supporters and red for opponents of the
Iranian government in Fig. 5-a) post more stories compared to less asymmetric and symmetric ones (µ =
0.0, −0.1, 0.1, highlighted as purple). Communities opposing the Iranian government generally post more
stories compared to those supporting the government. However, compared to well-mixed communities,
more uniform communities, regardless of their opinions, ultimately post more stories.
Moreover, results show that communities biased toward opposition or support of the government
generate more comments (µ = 1.0, 0.9, −1.0, −0.9 highlighted in Fig. 5-b with blue and red lines)
compared to symmetric communities (µ = 0.0, 0.1, −0.1 highlighted in purple). Ultimately, all lines in
Fig. 5 converge to zero as revisit rates go down to zero.
(a)
(b)
Opponents
Supporters
1: Supporter
0: Neutral
-1: Opponent Neutrals
1,000
Time (Day)
Total
weekly
posts
Total
weekly
comments
Time (Day)
Opponents
Supporters
Neutrals
1: Supporter
0: Neutral
-1: Opponent
1,000
22
Fig. 5 (a): Total weekly posts, and (b): total weekly comments; for communities with different bias levels over
1,000 days
-1.0 and 1.0 bias levels represent complete bias against and in favor of the Iranian government, respectively. Zero bias level represents neutral.
Red lines show the opponents and blue lines show the supporters. For the sake of presentation, eight lines are highlighted that show extremely
biased, minimally biased, or neutral communities.
Extremeness in supporting or opposing the Iranian government
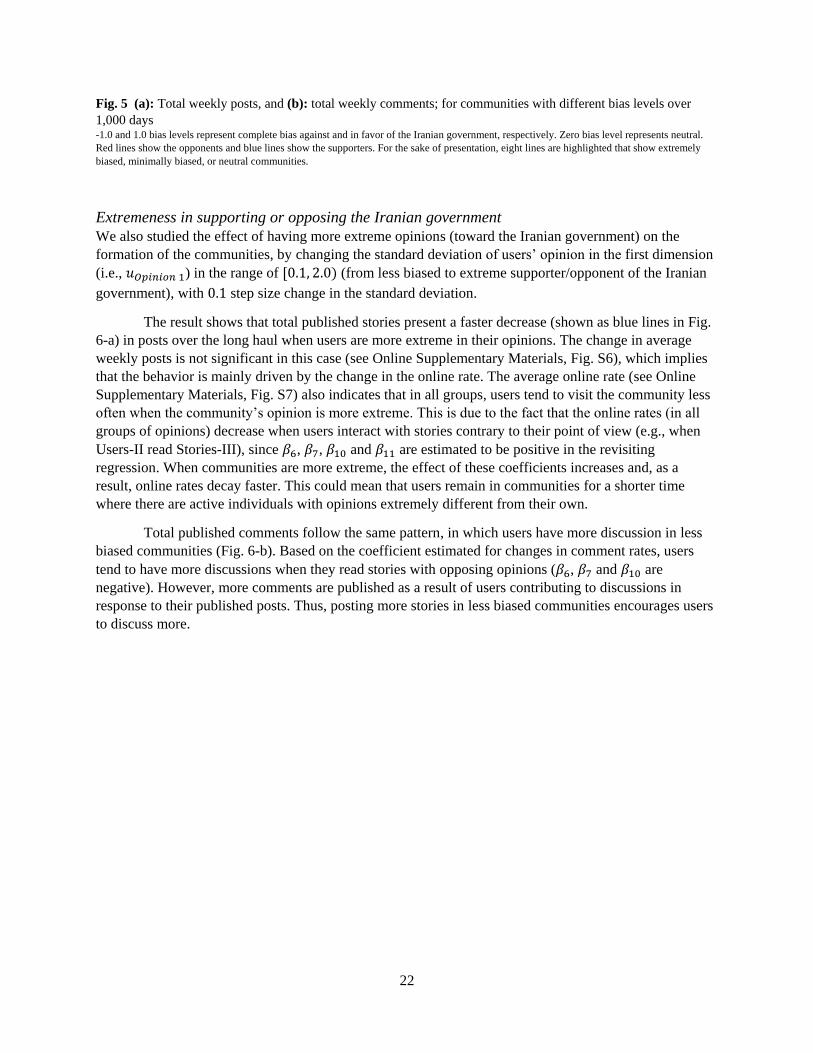
We also studied the effect of having more extreme opinions (toward the Iranian government) on the
formation of the communities, by changing the standard deviation of users’ opinion in the first dimension
(i.e., 𝑢𝑂𝑝𝑖𝑛𝑖𝑜𝑛 1) in the range of [0.1, 2.0) (from less biased to extreme supporter/opponent of the Iranian
government), with 0.1 step size change in the standard deviation.
The result shows that total published stories present a faster decrease (shown as blue lines in Fig.
6-a) in posts over the long haul when users are more extreme in their opinions. The change in average
weekly posts is not significant in this case (see Online Supplementary Materials, Fig. S6), which implies
that the behavior is mainly driven by the change in the online rate. The average online rate (see Online
Supplementary Materials, Fig. S7) also indicates that in all groups, users tend to visit the community less
often when the community’s opinion is more extreme. This is due to the fact that the online rates (in all
groups of opinions) decrease when users interact with stories contrary to their point of view (e.g., when
Users-II read Stories-III), since 𝛽6, 𝛽7, 𝛽10 and 𝛽11 are estimated to be positive in the revisiting
regression. When communities are more extreme, the effect of these coefficients increases and, as a
result, online rates decay faster. This could mean that users remain in communities for a shorter time
where there are active individuals with opinions extremely different from their own.
Total published comments follow the same pattern, in which users have more discussion in less
biased communities (Fig. 6-b). Based on the coefficient estimated for changes in comment rates, users
tend to have more discussions when they read stories with opposing opinions (𝛽6, 𝛽7 and 𝛽10 are
negative). However, more comments are published as a result of users contributing to discussions in
response to their published posts. Thus, posting more stories in less biased communities encourages users
to discuss more.
23
(a)
(b)
Fig. 6 (a): Total weekly posts, and (b): total weekly comments; for communities with wider bias levels over 1,000
days Red lines represent less biased communities and blue lines represent more extremely biased communities
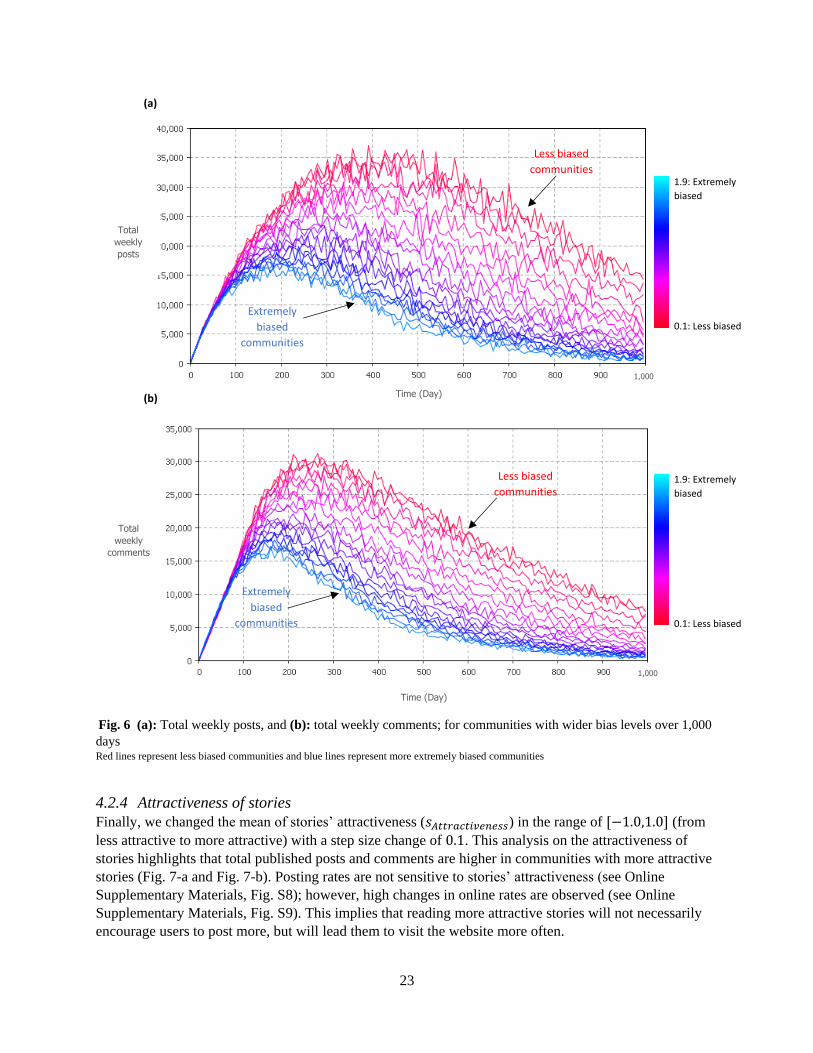
4.2.4 Attractiveness of stories
Finally, we changed the mean of stories’ attractiveness (𝑠𝐴𝑡𝑡𝑟𝑎𝑐𝑡𝑖𝑣𝑒𝑛𝑒𝑠𝑠) in the range of [−1.0,1.0] (from
less attractive to more attractive) with a step size change of 0.1. This analysis on the attractiveness of
stories highlights that total published posts and comments are higher in communities with more attractive
stories (Fig. 7-a and Fig. 7-b). Posting rates are not sensitive to stories’ attractiveness (see Online
Supplementary Materials, Fig. S8); however, high changes in online rates are observed (see Online
Supplementary Materials, Fig. S9). This implies that reading more attractive stories will not necessarily
encourage users to post more, but will lead them to visit the website more often.
1,000
1,000
Time (Day)
Total
weekly
posts
Time (Day)
Total
weekly
comments
Less biased
communities
Extremely
biased
communities
Less biased
communities
Extremely
biased
communities
1.9: Extremely
biased
0.1: Less biased
1.9: Extremely
biased
0.1: Less biased
24
Interestingly, in the case of Users-I and Users-IV, more attractive stories (with µ close to one, see
Online Supplementary Materials, Fig. S9) can even increase the online rate, persuading those users to
return to the website more frequently and breaking the overall pattern of activity decline. Comment rates,
however, are highly sensitive to the attractiveness of stories (see Online Supplementary Materials, Fig.
S10) and increase for more attractive stories across all groups. Therefore, all users tend to discuss
attractive stories more, regardless of their opinions.
(a)
(b)
Fig. 7 (a): Total weekly posts, and (b): total weekly comments; for communities generating more/less attractive
content over 1,000 days Red lines present the results for communities generating less attractive content and blue lines present the results for communities generating more
attractive content.
1,000
1,000
Time (Day)
Total
weekly
posts
Time (Day)
Total
weekly
comments
Communities generating
less attractive content
Communities generating
attractive content
Communities generating
less attractive content
Communities generating more
attractive content
1: More attractive
content
-1: Less attractive
content
1: More attractive
content
-1: Less attractive
content
25
5 Discussion and Conclusions The importance of online social media platforms in people’s daily life is well recognized. Individuals use
social media to stay in touch with their family and friends, share ideas (Bakshy et al. 2012), and spread
the word about petitions ( Jalali et al. 2016), services or products (Trusov et al. 2009; Tucker 2014), just
to name a few. Overall, we now spend around 7%-10% of our lives on social media12. Social media is
also used as internal communication tools in organizations, and can also help increase internal
engagement among employees and generate new ideas across teams (Gose 2013; Wadee 2013). But the
growing pattern masks much rise and fall among various platforms. What explains those ebbs and flows?
In this research, we studied the effect of individual interaction with a variety of opinions in social
media on online activities, and consequently on the formation and future of platforms. Considering that
users have a critical role in the life cycle of social media, where they are content generators, we focused
on user behaviors. We estimated different mechanisms that influence individual behaviors, and studied
the effect of these mechanisms on the life cycle of social media through an agent-based simulation model.
We then examined the effect of different compositions of users on individual activity and the future of
social media. Although our data extraction algorithm, opinion estimation method, and models for changes
in user activities (as the three main components of this research) were customized for the types of data we
collected from a particular case study platform, all of these components are relatively generic and similar
models can be tailored and applied to other social media platforms.
Our results indicate that individuals’ reactions to each other’s opinions vary based on the content
and tone of the online objects. While there are variations in reactions, depending on where the individual
stands on these factors, we found that, individuals increase their activity on social media upon interacting
with content that closely matches their own opinions; moreover, encountering extreme content could have
a negative effect on individual activity levels. Furthermore, the attractiveness of the content (i.e., the
attractiveness of the stories independent of content and tone) plays an essential role in keeping individuals
interested and active on the outlet. That is likely a reason why many social media platforms focus on
promoting the more liked content.
Besides exploring the impact of consumed opinions on user activities, some practical implications
follow from our results. First, it seems that keeping users entails engaging them with content that is
closely aligned to their opinions (i.e., by creating clusters of like-minded users and feeding them with
content generated among themselves). Most of the social network platforms today use recommendations
and ranking algorithms that work based on the proximity of opinions. Some extract users’ opinions
directly (using methods such as collaborative filtering) and feed the users content that has proven
interesting to other like-minded people (e.g., Netflix and Pandora recommend movies and songs to users
based on the taste of other users), while others use different proxies to feed users content closely aligned
to their own opinions (e.g., Facebook feeds its users content shared by their friends or pages in which they
are interested). Both cases create plurality in communities, which, based on our results, increases the life
cycle of outlets. Yet, ranking algorithms in both cases treat all of the opinion groups the same, which may
not be optimal. There is no difference in the ranking of opponents’ stories for supporters and supporters’
stories for opponents, although they may react differently to opposing opinions. Our study, however,
shows that different opinion groups could be treated according to their overall reactions, in order to
maximize user activity rates.
12 GWI Social report 2015: A typical internet user on average spend 1.77 hours per day on social networks, while younger generations spend
more than that (2.68 hours for 16-24 years old and 2.16 for 25-34 years old).
26
A more fundamental challenge to society relates to the impact of these filtering algorithms on
users’ opinions, which we did not discuss here. If, consistent with the goal of maximizing user retention
and activity, users are shown content in sync with their opinions, they may find few opportunities to be
challenged and revise their opinions. Such filter bubbles may hurt democratic conversations that are
critical to sifting through complex social problems, building understanding across ideological gaps, and
solving big challenges that require people of different opinions to come together. To the extent that social
media companies are forced to create filter bubbles to thrive, the society may be facing a prisoner’s
dilemma situation in which no firm dares to promote cross-boundary communication, which is in
everybody’s interest. There is much interesting research to be done in this space, bridging firm-level
profit considerations and societal goals.
This study is subject to several limitations. The data is limited to the particular case under study
and readers should be cautious about the generalizability of the results. Our regression and simulation
results also mostly reflect correlations in empirical data rather than causation. We estimate opinions based
on voting patterns, and while attractive due to scalability, this method misses on direct measurement of
opinions which would be more reliable. Furthermore, our simulation study is fairly simple in that it does
not consider many relevant feedback mechanisms and exogenous effects and only explores the results of
the mechanisms we empirically identify. Future research could benefit from using larger datasets and data
from different types of social media platforms. They could also attempt at identifying the causes of the
mechanisms discussed in this study, and incorporate more feedback loops. Studying the effects of voting
dynamics and promotion systems, which are often used in social media, could be other areas for
extending this work.
Acknowledgements:
This study is based in part upon work supported by the National Science Foundation under Grant
Numbers SES-1027413. Any opinions, findings, and conclusions, or recommendations expressed in this
study are those of the authors and do not necessarily reflect the views of the National Science Foundation.
References:
An, J., Quercia, D., Cha, M., Gummadi, K., & Crowcroft, J. (2014). Sharing political news: the balancing act of intimacy and socialization in selective exposure. Epj Data Science, 3(1). doi:10.1140/epjds/s13688-014-0012-2
Ashouri Rad, A. (2016). Three Essays on Dynamics of Online Communities. (Doctor of Philosophy), Virginia Tech.
Ashoury, A., Herrera-Restrepo, O., & Zhang, H. (2013). The Diffusion of a Petition in a Social Network. Paper presented at the 63rd Annual Conference and Expo of the Institute of Industrial Engineers.
Bakshy, E., Rosenn, I., Marlow, C., & Adamic, L. (2012). The role of social networks in information diffusion. Paper presented at the Proceedings of the 21st international conference on World Wide Web.
Boyd, D. (2007). Why youth (heart) social network sites: The role of networked publics in teenage social life. MacArthur foundation series on digital learning–Youth, identity, and digital media volume, 119-142.
27
Burke, M., Marlow, C., & Lento, T. (2010). Social network activity and social well-being. Paper presented at the Proceedings of the SIGCHI conference on human factors in computing systems.
Cannarella, J., & Spechler, J. A. (2014). Epidemiological modeling of online social network dynamics. arXiv preprint arXiv:1401.4208.
Deters, F. g., & Mehl, M. R. (2013). Does posting Facebook status updates increase or decrease loneliness? An online social networking experiment. Social psychological and personality science, 4(5), 579-586.
Dwyer, C., Hiltz, S., & Passerini, K. (2007). Trust and privacy concern within social networking sites: A comparison of Facebook and MySpace. AMCIS 2007 proceedings, 339.
Ellison, N. B., Steinfield, C., & Lampe, C. (2007). The benefits of Facebook “friends:” Social capital and
college students’ use of online social network sites. Journal of Computer‐Mediated
Communication, 12(4), 1143-1168. Garcia, D., Mavrodiev, P., & Schweitzer, F. (2013). Social resilience in online communities: The autopsy of
friendster. Paper presented at the Proceedings of the first ACM conference on Online social networks.
Giliette, F. (2011). The rise and inglorious fall of myspace. Gose, C. (2013). Internal communications: the rise and fall of internal social networks. Retrieved from
http://www.rmgnetworks.com/blog/bid/215425/Internal-communications-the-rise-and-fall-of-internal-social-networks
Gottfried, J., Barthel, M., Shearer, E., & Mitchell, A. (2016). The 2016 Presidential Campaign–a News Event That’s Hard to Miss. Pew Research Center.
Greenwood, S., Perrin, A., & Duggan, M. (2016). Social Media Update 2016. Pew Research Center. Jalali, M. S. (2014). How individuals weigh their previous estimates to make a new estimate in the
presence or absence of social influence Social Computing, Behavioral-Cultural Modeling and Prediction (pp. 67-74): Springer International Publishing.
Jalali, M. S., Ashouri, A., Herrera-Restrepo, O., & Zhang, H. (2016). Information diffusion through social networks: The case of an online petition. Expert Systems with Applications, 44, 187-197.
Kim, J.-G., & Lee, K.-S. (2014). Predicting Political Orientation of News Articles Based on User Behavior Analysis in Social Network. Ieice Transactions on Information and Systems, E97D(4), 685-693. doi:10.1587/transinf.E97.D.685
Lampe, C., Ellison, N. B., & Steinfield, C. (2008). Changes in use and perception of Facebook. Paper presented at the Proceedings of the 2008 ACM conference on Computer supported cooperative work.
Lee, J. (2014). Are Some People Less Influenced by Others' Opinions? The Role of Internal Political Self-Efficacy and Need for Cognition in Impression Formation on Social Networking Sites. Cyberpsychology Behavior and Social Networking, 17(9), 571-577. doi:10.1089/cyber.2013.0713
Liu, D. C., & Nocedal, J. (1989). On the limited memory BFGS method for large scale optimization. Mathematical programming, 45(1-3), 503-528.
Madejski, M., Johnson, M., & Bellovin, S. M. (2011). The failure of online social network privacy settings. Department of Computer Science, Columbia University, Tech. Rep. CUCS-010-11.
Morahan-Martin, J., & Schumacher, P. (2003). Loneliness and social uses of the Internet. Computers in Human Behavior, 19(6), 659-671.
Muchnik, L., Aral, S., & Taylor, S. J. (2013). Social Influence Bias: A Randomized Experiment. Science, 341(6146), 647-651. doi:10.1126/science.1240466
Rad, A. A., & Rahmandad, H. (2013). Reconstructing online behaviors by effort minimization Social Computing, Behavioral-Cultural Modeling and Prediction (pp. 75-82): Springer.
28
Tanford, S., & Montgomery, R. (2015). The Effects of Social Influence and Cognitive Dissonance on Travel Purchase Decisions. Journal of Travel Research, 54(5), 596-610. doi:10.1177/0047287514528287
Torkjazi, M., Rejaie, R., & Willinger, W. (2009). Hot today, gone tomorrow: on the migration of MySpace users. Paper presented at the Proceedings of the 2nd ACM workshop on Online social networks.
Trusov, M., Bucklin, R. E., & Pauwels, K. (2009). Effects of word-of-mouth versus traditional marketing: findings from an internet social networking site. Journal of marketing, 73(5), 90-102.
Tucker, C. E. (2014). Social networks, personalized advertising, and privacy controls. Journal of Marketing Research, 51(5), 546-562.
Viégas, F. B. (2005). Bloggers' expectations of privacy and accountability: An initial survey. Journal of
Computer‐Mediated Communication, 10(3), 00-00.
Wadee, Z. (2013). Facebook your boss: using social media in internal communications. Retrieved from http://www.theguardian.com/careers/careers-blog/facebook-employers-encourage-social-media
Wu, S., Das Sarma, A., Fabrikant, A., Lattanzi, S., & Tomkins, A. (2013). Arrival and departure dynamics in social networks. Paper presented at the Proceedings of the sixth ACM international conference on Web search and data mining.
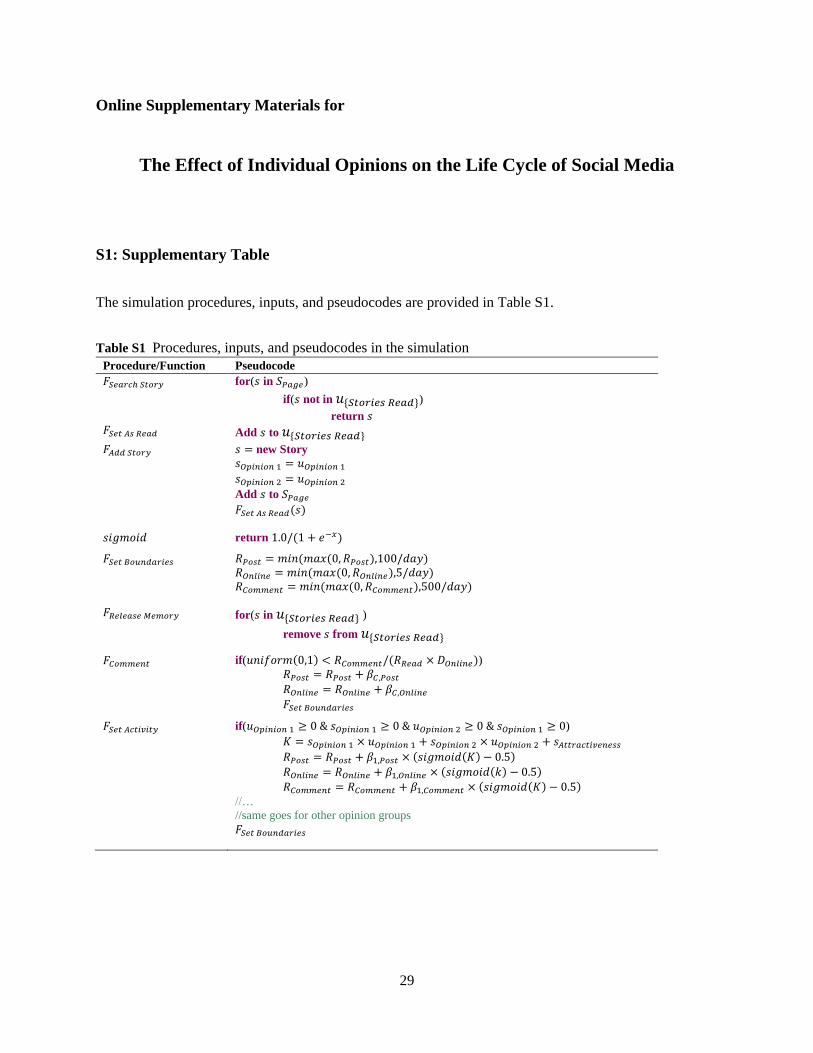
29
Online Supplementary Materials for
The Effect of Individual Opinions on the Life Cycle of Social Media
S1: Supplementary Table
The simulation procedures, inputs, and pseudocodes are provided in Table S1.
Table S1 Procedures, inputs, and pseudocodes in the simulation
Procedure/Function Pseudocode
𝐹𝑆𝑒𝑎𝑟𝑐ℎ 𝑆𝑡𝑜𝑟𝑦 for(𝑠 in 𝑆𝑃𝑎𝑔𝑒)
if(𝑠 not in 𝑢{𝑆𝑡𝑜𝑟𝑖𝑒𝑠 𝑅𝑒𝑎𝑑})
return 𝑠
𝐹𝑆𝑒𝑡 𝐴𝑠 𝑅𝑒𝑎𝑑 Add 𝑠 to 𝑢{𝑆𝑡𝑜𝑟𝑖𝑒𝑠 𝑅𝑒𝑎𝑑}
𝐹𝐴𝑑𝑑 𝑆𝑡𝑜𝑟𝑦 𝑠 = new Story
𝑠𝑂𝑝𝑖𝑛𝑖𝑜𝑛 1 = 𝑢𝑂𝑝𝑖𝑛𝑖𝑜𝑛 1
𝑠𝑂𝑝𝑖𝑛𝑖𝑜𝑛 2 = 𝑢𝑂𝑝𝑖𝑛𝑖𝑜𝑛 2
Add 𝑠 to 𝑆𝑃𝑎𝑔𝑒
𝐹𝑆𝑒𝑡 𝐴𝑠 𝑅𝑒𝑎𝑑(𝑠)
𝑠𝑖𝑔𝑚𝑜𝑖𝑑 return 1.0/(1 + 𝑒−𝑥)
𝐹𝑆𝑒𝑡 𝐵𝑜𝑢𝑛𝑑𝑎𝑟𝑖𝑒𝑠 𝑅𝑃𝑜𝑠𝑡 = 𝑚𝑖𝑛(𝑚𝑎𝑥(0, 𝑅𝑃𝑜𝑠𝑡),100/𝑑𝑎𝑦)
𝑅𝑂𝑛𝑙𝑖𝑛𝑒 = 𝑚𝑖𝑛(𝑚𝑎𝑥(0, 𝑅𝑂𝑛𝑙𝑖𝑛𝑒),5/𝑑𝑎𝑦)
𝑅𝐶𝑜𝑚𝑚𝑒𝑛𝑡 = 𝑚𝑖𝑛(𝑚𝑎𝑥(0, 𝑅𝐶𝑜𝑚𝑚𝑒𝑛𝑡),500/𝑑𝑎𝑦)
𝐹𝑅𝑒𝑙𝑒𝑎𝑠𝑒 𝑀𝑒𝑚𝑜𝑟𝑦 for(𝑠 in 𝑢{𝑆𝑡𝑜𝑟𝑖𝑒𝑠 𝑅𝑒𝑎𝑑} )
remove 𝑠 from 𝑢{𝑆𝑡𝑜𝑟𝑖𝑒𝑠 𝑅𝑒𝑎𝑑}
𝐹𝐶𝑜𝑚𝑚𝑒𝑛𝑡 if(𝑢𝑛𝑖𝑓𝑜𝑟𝑚(0,1) < 𝑅𝐶𝑜𝑚𝑚𝑒𝑛𝑡/(𝑅𝑅𝑒𝑎𝑑 × 𝐷𝑂𝑛𝑙𝑖𝑛𝑒))
𝑅𝑃𝑜𝑠𝑡 = 𝑅𝑃𝑜𝑠𝑡 + 𝛽𝐶,𝑃𝑜𝑠𝑡
𝑅𝑂𝑛𝑙𝑖𝑛𝑒 = 𝑅𝑂𝑛𝑙𝑖𝑛𝑒 + 𝛽𝐶,𝑂𝑛𝑙𝑖𝑛𝑒
𝐹𝑆𝑒𝑡 𝐵𝑜𝑢𝑛𝑑𝑎𝑟𝑖𝑒𝑠
𝐹𝑆𝑒𝑡 𝐴𝑐𝑡𝑖𝑣𝑖𝑡𝑦 if(𝑢𝑂𝑝𝑖𝑛𝑖𝑜𝑛 1 ≥ 0 & 𝑠𝑂𝑝𝑖𝑛𝑖𝑜𝑛 1 ≥ 0 & 𝑢𝑂𝑝𝑖𝑛𝑖𝑜𝑛 2 ≥ 0 & 𝑠𝑂𝑝𝑖𝑛𝑖𝑜𝑛 1 ≥ 0)
𝐾 = 𝑠𝑂𝑝𝑖𝑛𝑖𝑜𝑛 1 × 𝑢𝑂𝑝𝑖𝑛𝑖𝑜𝑛 1 + 𝑠𝑂𝑝𝑖𝑛𝑖𝑜𝑛 2 × 𝑢𝑂𝑝𝑖𝑛𝑖𝑜𝑛 2 + 𝑠𝐴𝑡𝑡𝑟𝑎𝑐𝑡𝑖𝑣𝑒𝑛𝑒𝑠𝑠
𝑅𝑃𝑜𝑠𝑡 = 𝑅𝑃𝑜𝑠𝑡 + 𝛽1,𝑃𝑜𝑠𝑡 × (𝑠𝑖𝑔𝑚𝑜𝑖𝑑(𝐾) − 0.5) 𝑅𝑂𝑛𝑙𝑖𝑛𝑒 = 𝑅𝑂𝑛𝑙𝑖𝑛𝑒 + 𝛽1,𝑂𝑛𝑙𝑖𝑛𝑒 × (𝑠𝑖𝑔𝑚𝑜𝑖𝑑(𝑘) − 0.5)
𝑅𝐶𝑜𝑚𝑚𝑒𝑛𝑡 = 𝑅𝐶𝑜𝑚𝑚𝑒𝑛𝑡 + 𝛽1,𝐶𝑜𝑚𝑚𝑒𝑛𝑡 × (𝑠𝑖𝑔𝑚𝑜𝑖𝑑(𝐾) − 0.5)
//…
//same goes for other opinion groups
𝐹𝑆𝑒𝑡 𝐵𝑜𝑢𝑛𝑑𝑎𝑟𝑖𝑒𝑠
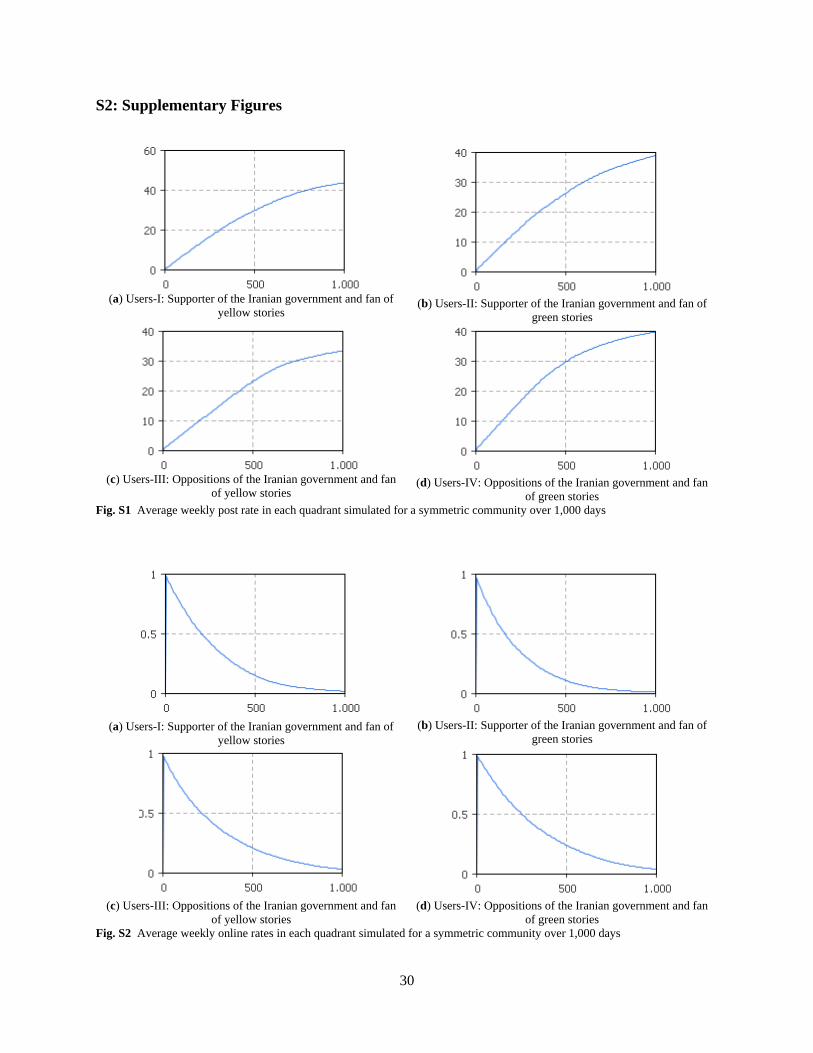
30
S2: Supplementary Figures
(a) Users-I: Supporter of the Iranian government and fan of
yellow stories
(b) Users-II: Supporter of the Iranian government and fan of
green stories
(c) Users-III: Oppositions of the Iranian government and fan
of yellow stories
(d) Users-IV: Oppositions of the Iranian government and fan
of green stories Fig. S1 Average weekly post rate in each quadrant simulated for a symmetric community over 1,000 days
(a) Users-I: Supporter of the Iranian government and fan of
yellow stories
(b) Users-II: Supporter of the Iranian government and fan of
green stories
(c) Users-III: Oppositions of the Iranian government and fan
of yellow stories
(d) Users-IV: Oppositions of the Iranian government and fan
of green stories Fig. S2 Average weekly online rates in each quadrant simulated for a symmetric community over 1,000 days
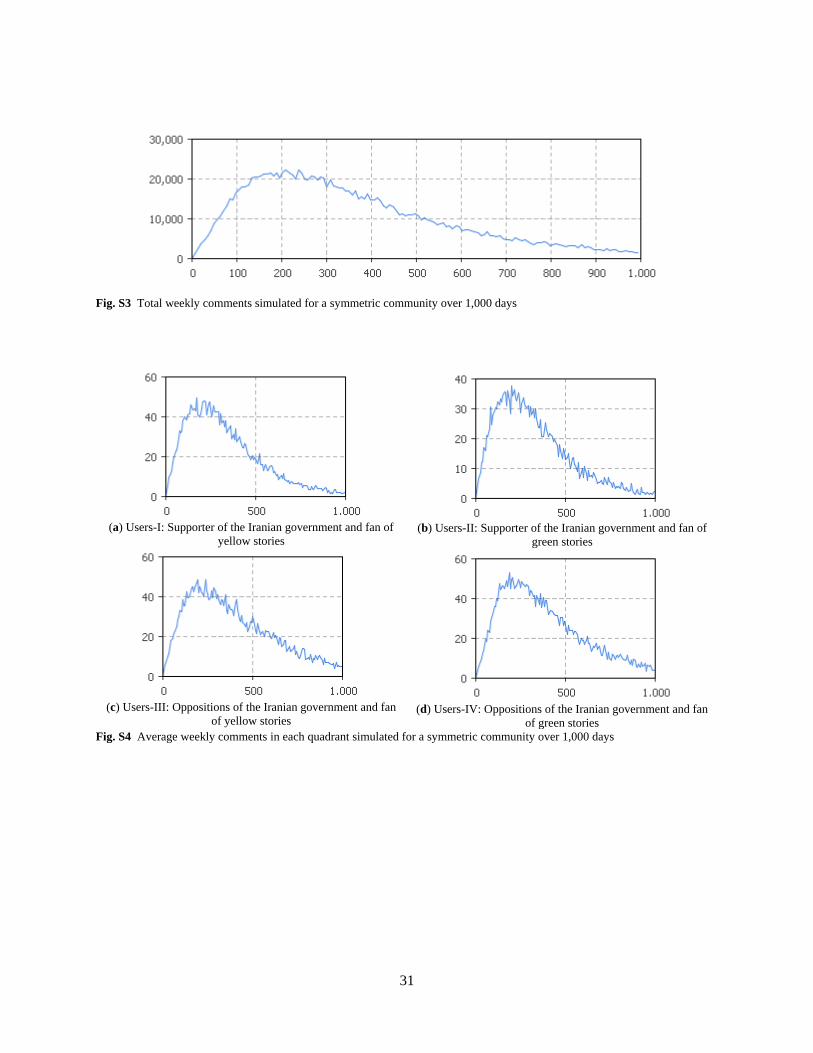
31
Fig. S3 Total weekly comments simulated for a symmetric community over 1,000 days
(a) Users-I: Supporter of the Iranian government and fan of
yellow stories
(b) Users-II: Supporter of the Iranian government and fan of
green stories
(c) Users-III: Oppositions of the Iranian government and fan
of yellow stories
(d) Users-IV: Oppositions of the Iranian government and fan
of green stories Fig. S4 Average weekly comments in each quadrant simulated for a symmetric community over 1,000 days
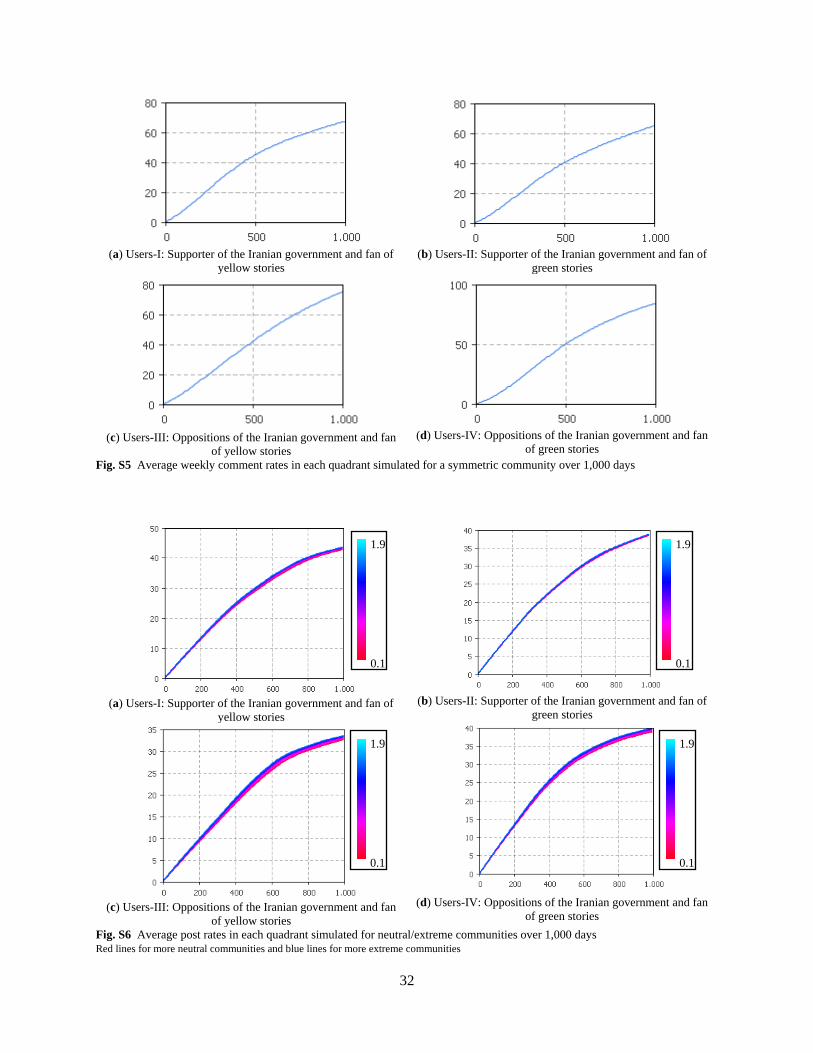
32
(a) Users-I: Supporter of the Iranian government and fan of
yellow stories
(b) Users-II: Supporter of the Iranian government and fan of
green stories
(c) Users-III: Oppositions of the Iranian government and fan
of yellow stories
(d) Users-IV: Oppositions of the Iranian government and fan
of green stories Fig. S5 Average weekly comment rates in each quadrant simulated for a symmetric community over 1,000 days
(a) Users-I: Supporter of the Iranian government and fan of
yellow stories
(b) Users-II: Supporter of the Iranian government and fan of
green stories
(c) Users-III: Oppositions of the Iranian government and fan
of yellow stories
(d) Users-IV: Oppositions of the Iranian government and fan
of green stories
Fig. S6 Average post rates in each quadrant simulated for neutral/extreme communities over 1,000 days
Red lines for more neutral communities and blue lines for more extreme communities
1.9
0.1
1.9
0.1
1.9
0.1
1.9
0.1
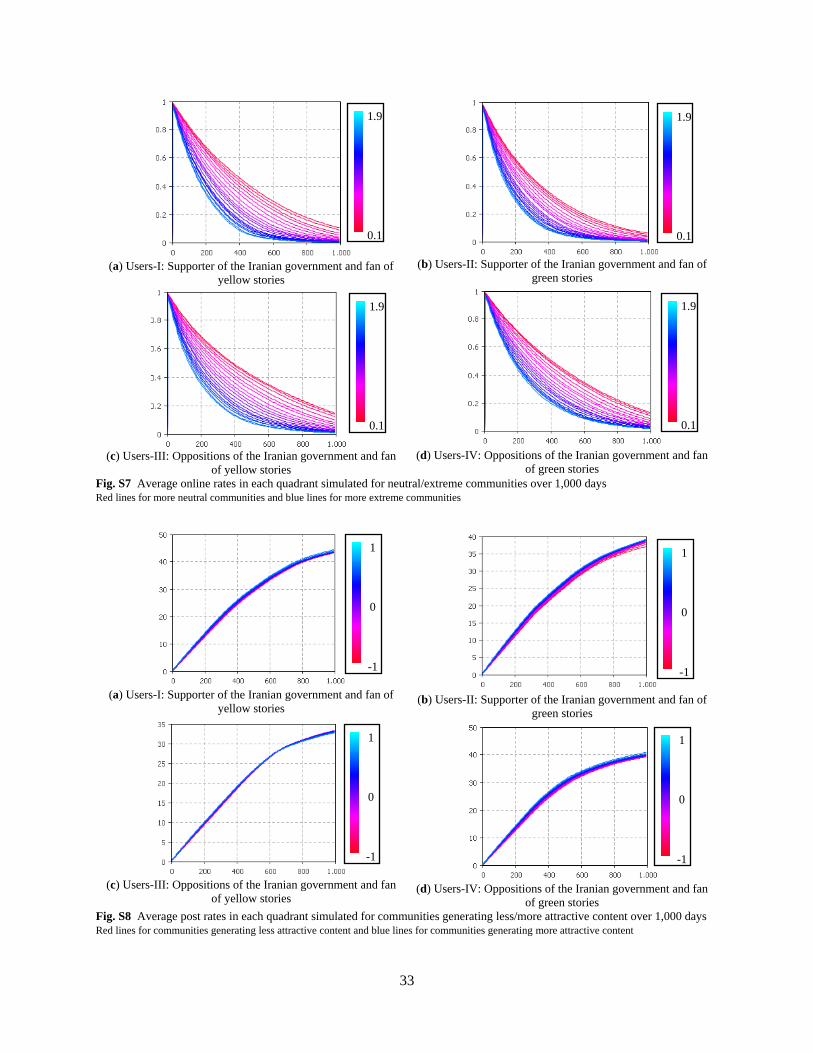
33
(a) Users-I: Supporter of the Iranian government and fan of
yellow stories
(b) Users-II: Supporter of the Iranian government and fan of
green stories
(c) Users-III: Oppositions of the Iranian government and fan
of yellow stories
(d) Users-IV: Oppositions of the Iranian government and fan
of green stories Fig. S7 Average online rates in each quadrant simulated for neutral/extreme communities over 1,000 days
Red lines for more neutral communities and blue lines for more extreme communities
(a) Users-I: Supporter of the Iranian government and fan of
yellow stories
(b) Users-II: Supporter of the Iranian government and fan of
green stories
(c) Users-III: Oppositions of the Iranian government and fan
of yellow stories
(d) Users-IV: Oppositions of the Iranian government and fan
of green stories Fig. S8 Average post rates in each quadrant simulated for communities generating less/more attractive content over 1,000 days
Red lines for communities generating less attractive content and blue lines for communities generating more attractive content
1.9
0.1
1.9
0.1
1.9
0.1
1.9
0.1
1
0
-1
1
0
-1
1
0
-1
1
0
-1
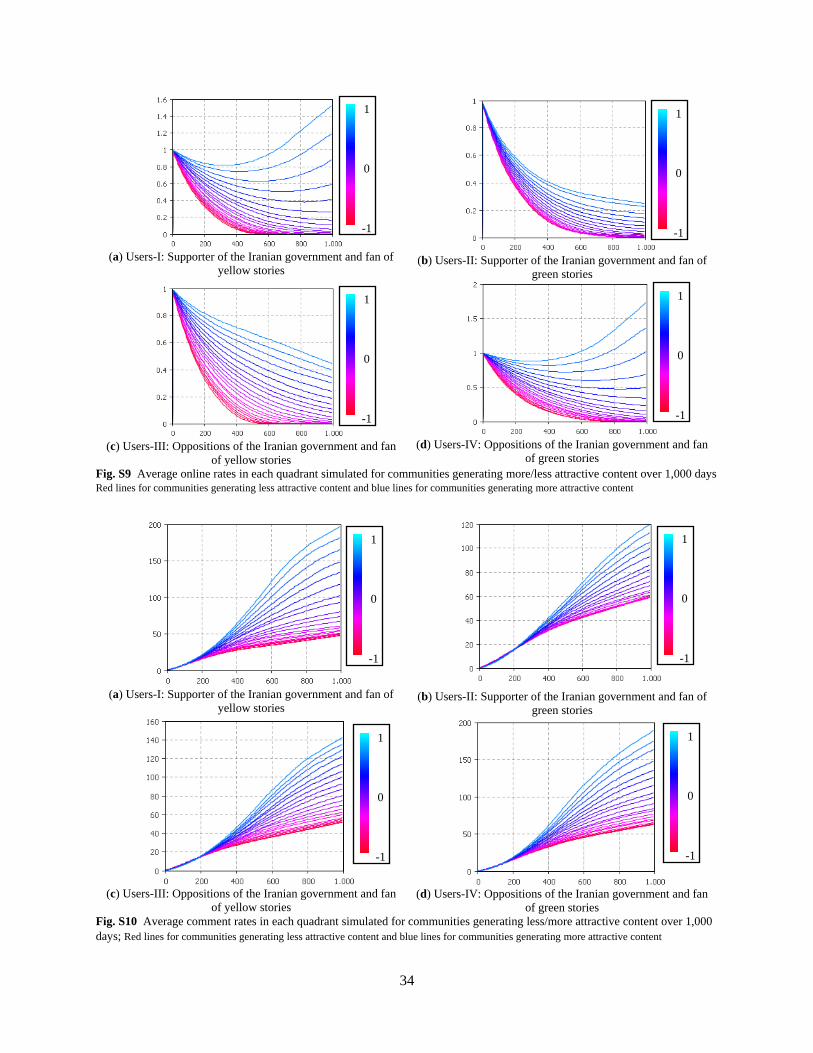
34
(a) Users-I: Supporter of the Iranian government and fan of
yellow stories
(b) Users-II: Supporter of the Iranian government and fan of
green stories
(c) Users-III: Oppositions of the Iranian government and fan
of yellow stories
(d) Users-IV: Oppositions of the Iranian government and fan
of green stories Fig. S9 Average online rates in each quadrant simulated for communities generating more/less attractive content over 1,000 days
Red lines for communities generating less attractive content and blue lines for communities generating more attractive content
(a) Users-I: Supporter of the Iranian government and fan of
yellow stories
(b) Users-II: Supporter of the Iranian government and fan of
green stories
(c) Users-III: Oppositions of the Iranian government and fan
of yellow stories
(d) Users-IV: Oppositions of the Iranian government and fan
of green stories Fig. S10 Average comment rates in each quadrant simulated for communities generating less/more attractive content over 1,000
days; Red lines for communities generating less attractive content and blue lines for communities generating more attractive content
1
0
-1
1
0
-1
1
0
-1
1
0
-1
1
0
-1
1
0
-1
1
0
-1
1
0
-1


![County: CY 2018* CY 2019 CY 2020 ALAMANCE OO #1 · County: CY 2018* CY 2019 CY 2020 512 55 31.3% 0.8% 18.0% [1] Note: CY 2018 is baseline data [2] *OO #1 is the denominator for OO](https://img.pdfslide.us/doc/110x75/604bda711fef087ac12d0021/county-cy-2018-cy-2019-cy-2020-alamance-oo-1-county-cy-2018-cy-2019-cy-2020.jpg)