Embed Size (px)
Citation preview
Policy Research Working Paper 5617
How Economic Growth and Rational Decisions Can Make Disaster Losses Grow
Faster Than WealthStéphane Hallegatte
The World BankSustainable Development NetworkOffice of the Chief EconomistMarch 2011
WPS5617P
ublic
Dis
clos
ure
Aut
horiz
edP
ublic
Dis
clos
ure
Aut
horiz
edP
ublic
Dis
clos
ure
Aut
horiz
edP
ublic
Dis
clos
ure
Aut
horiz
ed
Produced by the Research Support Team
Abstract
The Policy Research Working Paper Series disseminates the findings of work in progress to encourage the exchange of ideas about development issues. An objective of the series is to get the findings out quickly, even if the presentations are less than fully polished. The papers carry the names of the authors and should be cited accordingly. The findings, interpretations, and conclusions expressed in this paper are entirely those of the authors. They do not necessarily represent the views of the International Bank for Reconstruction and Development/World Bank and its affiliated organizations, or those of the Executive Directors of the World Bank or the governments they represent.
Policy Research Working Paper 5617
Assuming that capital productivity is higher in areas at risk from natural hazards (such as coastal zones or flood plains), this paper shows that rapid development in these areas—and the resulting increase in disaster losses—may be the consequence of a rational and well-informed trade-off between lower disaster losses and higher productivity. With disasters possibly becoming less frequent but
This paper is a product of the Office of the Chief Economist, Sustainable Development Network. It is part of a larger effort by the World Bank to provide open access to its research and make a contribution to development policy discussions around the world. Policy Research Working Papers are also posted on the Web at http://econ.worldbank.org. The author may be contacted at [email protected].
increasingly destructive in the future, average disaster losses may grow faster than wealth. Myopic expectations, lack of information, moral hazard, and externalities reinforce the likelihood of this scenario. These results have consequences on how to design risk management and climate change policies.

How economic growth and rational decisions canmake disaster losses grow faster than wealth
Stephane Hallegatte a,b,∗aSustainable Development Network, The World Bank, Washington D.C., USA
bEcole Nationale de la Meteorologie, Toulouse, France
∗ Corresponding author: Stephane Hallegatte.Email address: [email protected] (Stephane Hallegatte).
1 Introduction
It is widely recognized that economic losses due to natural disasters have been increasing expo-nentially in the last decades. The main drivers of this trend are the increase in population, and thegrowth in wealth per capita. With more and richer people, it is not surprising to find an increase indisaster losses. More surprising is the fact that, in spite of growing investments in risk reduction,the growth in losses has been as fast as economic growth (e.g., for floods in Europe, see Barredo,2009; at the global scale, with much larger uncertainties, see Miller et al., 2008, Neumayer andBarthel, 2010), or even faster than economic growth (e.g., in the U.S., see Nordhaus, 2006; Pielkeet al., 2008). Climate change does not seem to play a significant role in these evolutions, exceptpossibly in very specific cases, for some hazards in some regions (Neumayer and Barthel, 2010).In the U.S., the trend in disaster loss relative to wealth can be almost completely explained bythe fact that people take more and more risks, by moving and investing more and more in at-riskareas (Pielke et al., 2008).
Most of the time, the explanations offered for this increasingly risk-taking trend are the follow-ing:
• Information and transaction costs: since the information on natural hazards and risk are notalways easily available, households and businesses may decide not to spend the time, moneyand effort to collect them, and disregard this information in their decision-making process(Magat et al., 1987; Camerer and Kunreuther, 1989; and Hogarth and Kunreuther, 1995).
• Externalities, moral hazards, and market failures: since insurance and post-disaster support areoften available in developed countries, households and firms in risky areas do not pay the fullcost of the risk, and may take more risk than what is socially optimal (e.g., Kaplow, 1991;Burby et al., 1991; Laffont, 1995). Also, Lall and Deichmann (2010) show that risk mitigationhas positive externalities and that private and social costs of disaster losses may differ, leadingto inappropriate risk reducing investments.
• Irrational behaviors and biased risk perceptions: Individuals do not always react rationallywhen confronted to small probability risks, and they defer choosing between ambiguous choices(Tversky and Shafir 1992; Trope and Lieberman, 2003). Moreover, they have trouble to takeinto account events that have never occurred before (the “bias of imaginability”, see Tverskyand Kahneman, 1974). Finally, private and public investment decisions do not always ade-quately take long and very long-term consequences into account (for public decisions, seeMichel-Kerjan, 2008; for private decisions, see Kunreuther et al. 1978, and Thaler, 1999).
There is no doubt these factors play a key role. But this move toward at-risk areas could also bea rational decision — motivated by higher productivity in at-risk areas — rather than a marketfailure. This paper shows that this possibility cannot be discarded.
It is possible, indeed, that investments in at-risk areas bring benefits that justify increased risks.For instance, international harbors and tourism create jobs and activities that attract workers in
2
coastal zones in spite of flood risks. When economic growth is driven by export, the attractivenessof coastal zones is reinforced because these regions allow for easier and cheaper exports. Fromthe activities that benefit from being located in a risk-prone area, additional investments are thencarried out to benefit from agglomeration externalities on productivity and reduced transportationcosts (Ciccone et al., 1996; Ciccone, 2002; Lall and Deichmann, 2010). New Orleans started asa port, and then became an important city that attracted a growing population. This populationfaced a scarcity of land that induced it to settle in low-lying areas, protected by fragile sea wallsand pumping systems.
More generally, the drivers of economic growth are concentrated in cities. Combined with re-duced income from agriculture — especially in the poorest countries — these opportunities havecreated strong incentives for rapid rural-urban migration. Confronted with land scarcity and highland costs in large cities, this migration has led to construction in at-risk areas (e.g., Burby et al.,2001; Burby et al., 2006; Lall and Deichmann, 2010). In the most marginal and risky locations,informal settlements and slums are often present, putting a poor and vulnerable population in asituation of extreme risk (e.g., Ranger et al., 2011).
One can make the case, therefore, that population and asset migration to at-risk areas is notsolely due to lack of information, irrational behaviors and moral hazard, as often suggested, butalso to a rational trade-off between lower disaster losses and higher productivity in risky areas.This paper proposes an economic framework to analyze this possibility. Compared with previ-ous investigations of the economics of risk mitigation (e.g., Lewis and Nickerson, 1989; Strobl,2008), this analysis stresses the existence of benefits from investing in at-risk areas, investigatesboth investments in at-risk locations and risk mitigation choices in a common framework, andhighlights the trade-off between lower disaster losses and higher productivity.
Assuming this framework is valid, and under some conditions, it is found that — even with nochange in climate conditions and hazard characteristics — natural disasters may become moredestructive in the future and that average losses may increase faster than wealth and income. Thispossibility has important consequences on how to design risk management and risk reductionpolicies and how to deal with climate change. These aspects are discussed in the conclusion.
2 Larger disasters in a wealthier world?
It is generally accepted that richer populations invest more to protect themselves from naturalhazards. A richer population, however, may also invest more in at-risk areas, increasing exposureto natural hazards. These two trends have opposite impacts on risk, and the resulting trend in riskis thus ambiguous. This trend is investigated in this section with a simple model.
3
2.1 A balanced growth pathway
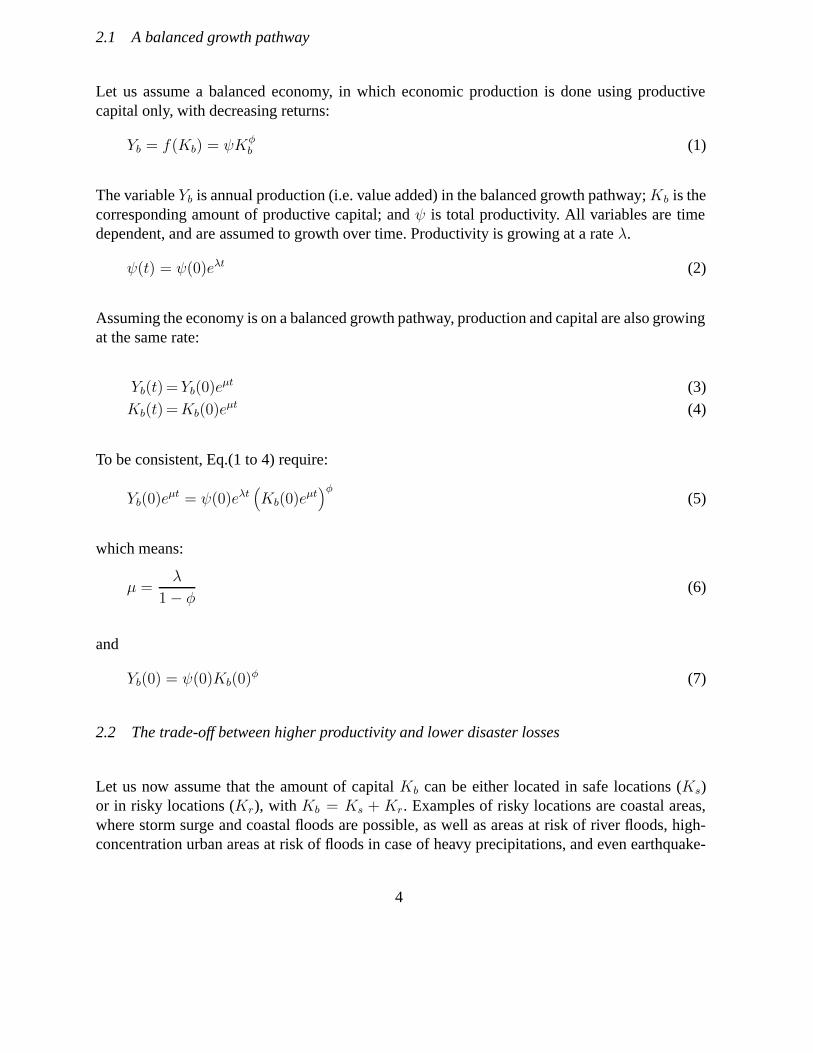
Let us assume a balanced economy, in which economic production is done using productivecapital only, with decreasing returns:
Yb = f(Kb) = ψKφb (1)
The variable Yb is annual production (i.e. value added) in the balanced growth pathway;Kb is thecorresponding amount of productive capital; and ψ is total productivity. All variables are timedependent, and are assumed to growth over time. Productivity is growing at a rate λ.
ψ(t) = ψ(0)eλt (2)
Assuming the economy is on a balanced growth pathway, production and capital are also growingat the same rate:
Yb(t) = Yb(0)eμt (3)
Kb(t) =Kb(0)eμt (4)
To be consistent, Eq.(1 to 4) require:
Yb(0)eμt = ψ(0)eλt
(Kb(0)e
μt)φ
(5)
which means:
μ =λ
1− φ(6)
and
Yb(0) = ψ(0)Kb(0)φ (7)
2.2 The trade-off between higher productivity and lower disaster losses
Let us now assume that the amount of capital Kb can be either located in safe locations (Ks)or in risky locations (Kr), with Kb = Ks + Kr. Examples of risky locations are coastal areas,where storm surge and coastal floods are possible, as well as areas at risk of river floods, high-concentration urban areas at risk of floods in case of heavy precipitations, and even earthquake-
4
and hurricane-prone regions. We assume that risky locations are more productive, thanks to theirlocation (e.g., proximity from port infrastructure for export-oriented industries; coastline ameni-ties for tourism; easier access to jobs in at-risk locations in crowded cities). This increase inproduction has decreasing returns, however. As a consequence, total production becomes:
Y = Yb +ΔY = Yb + αKγr (8)
where ΔY is the additional output produced thanks to the localization of capital in risk-proneareas; α is a relative productivity advantage, and is assumed to growth at the same rate as thegeneral productivity ψ (i.e., at the rate λ).
The capital located in the risky area can be affected by hazards, like floods and windstorms. If ahazard is too strong, it causes damages to the capital installed in at-risk areas, and can be labeledas a disaster. To simplify the analysis, we assume that in that case, the capital at-risk is totallydestroyed. It is assumed that this is the only consequence of disasters; no other impacts likefatalities and casualties are considered in this simple model, and additional indirect economicconsequences (Hallegatte and Przyluski, 2011) are not taken into account.
These disasters (i.e. hazards that lead to capital destruction) have a probability p0 to occur everyyear, except if protection investments are carried out and reduce this probability. These protec-tion investments take many forms, depending on which hazard is considered. Flood protectionsinclude dikes and seawalls, but also drainage systems to cope with heavy precipitations in ur-ban areas. Windstorm and earthquake protections consist mainly in building retrofits and stricterbuilding norms, to ensure old and new buildings can resist stronger winds or larger earthquakes.
It is assumed that better defenses reduce the probability of disasters, but do not reduce theirconsequences. This is consistent with many types of defenses, like seawalls that can protect anarea up to a design standard of protection but fail totally if this standard is exceeded. Betterdefenses are also more expensive, and the annual cost of defenses C and the remaining disasterprobability p are assumed linked by the relationship:
C(p) = ξ
(1
pν− 1
pν0
)(9)
so that the cost of reducing the disaster probability to zero is infinite. Depending on the value of ν,protection costs increase more or less rapidly when the disaster probability approaches zero. Theparameter ν therefore corresponds to more or less optimistic assumptions on protection costs.
Any given year, the economic output is given by:
Y = Yb + αKγr − C(p)− L (10)
5

where L is the damages from disasters, and is given by a random draw with probability p. If adisaster occurs, losses are equal to Kr, i.e. all the capital located in the risky area is destroyed.Any given year, the expected loss E(L) is equal to pKr and the expected output is equal to:
E(Y ) = Yb + αKγr − C(p)− pKr (11)
2.3 Optimal choice of p and Kr
Assuming a social planner — or an equivalent decentralized decision-making process — decidesthe amount of capital Kr to be located in the risky area and the level of protection that is to bebuilt, its program is: 1
maxp,Kr E(Y )
s.c.Kr ≤ Kb and 0 ≤ p ≤ p0(12)
We neglect risk aversion and we assume that the expected production is maximized, not theexpected utility. Doing so is acceptable if disaster losses remain small compared with income,consistently with the Arrow-Lind theorem for public investment decisions (Arrow and Lind,1970). However, this condition holds only if disaster losses can be pooled among a large enoughpopulation (e.g., a large country), and with many other uncorrelated risks, i.e. in the presenceof comprehensive insurance coverage or post-disaster government support. For small countries(where a disaster can strike a large share of the population), or where insurance and post-disastersupport are not available, the objective function should need to include risk aversion.
First order conditions lead to the optimal values of p and Kr:
p=(νξ)γ−1
γ+ν(γ−1) (αγ)1
γ+ν(γ−1) (13)
Kr =(νξ)1
γ+ν(γ−1) (αγ)−ν+1
γ+ν(γ−1) (14)
Assuming for now that Kr ≤ Kb and that p ≤ p0, the expected annual loss at the optimum isequal to:
E(L) = (νξ)γ
γ+ν(γ−1) (αγ)−ν
γ+ν(γ−1) (15)
1 This model is different from the Strobl’s (2008) model. In the latter, the only decision concerns protec-tion investments that mitigate disaster consequences, and there is no benefit from taking risks and thus notrade-off between safety and higher income.
6
At the optimum, the loss in case of disaster is equal to:
L= (νξ)1
γ+ν(γ−1) (αγ)−ν+1
γ+ν(γ−1) (16)
When productivity α is growing over time at the rate λ, there are two possibilities, depending onthe value of γ, the exponent representing decreasing returns in the additional productivity fromcapital located in at-risk areas (see Eq. (8)).
Proposition 1 If γ > ν/(ν + 1), then Kr and E(L) are decreasing over time in absolute terms.In that case, less and less capital is installed in the risky area when productivity and wealthincrease. So, the absolute level of risk is decreasing with wealth. It is also noteworthy that, insuch a situation, annual mean losses and capital at risk counter-intuitively decrease if protectioncosts (ξ) increase. If γ < ν/(ν + 1), then the amount of capital at-risk increases, and the risk(both in terms of average loss and maximum loss) is increasing with wealth, and mean annuallosses and capital at risk are augmented if protection costs (ξ) increase.
But the absolute level of risk is not a good measure of risk: a wealthier society is able to copewith larger losses. The question is therefore the relative change in risk. One way of investigatingthis question is to assess whether Kr and E(L) are growing more or less rapidly than Yb and Kb,i.e. at a rate larger or lower than μ.
If α is growing at a rate λ, expected losses E(L) are growing at a rate λ −νγ+ν(γ−1)
and maximum
losses (i.e., the losses in case a disaster occurs), Kr, are growing at a rate λ −(ν+1)γ+ν(γ−1)
. Since Kand Y are growing at a rate μ = λ/(1− φ), we have the following result:
Proposition 2 If φ νν+1
< γ < νν+1
, then mean annual losses E(L) are growing faster thanbaseline economic output Yb. If φ − 1
ν+1< γ < ν
ν+1, then the capital at risk and the losses in
case of disasters (i.e. Kr) are growing faster than Yb.
With usual values for φ, i.e. about 1/3, and the simplest assumption for protection cost, i.e. ν = 1,losses in case of disasters are growing faster than Y for any γ, positive and lower than 1/2. Meanannual losses increase faster than Yb if γ is between 1/6 and 1/2. Therefore, it is possible thatdisaster maximum losses and mean annual losses increase with wealth in the future, even inrelative terms.
In this case, all capital will eventually be installed in at-risk areas (Kr = Kb), and a dis-aster would lead to the complete destruction of all production capacities, with a probability
p =(
ξνKb
) 11+ν .
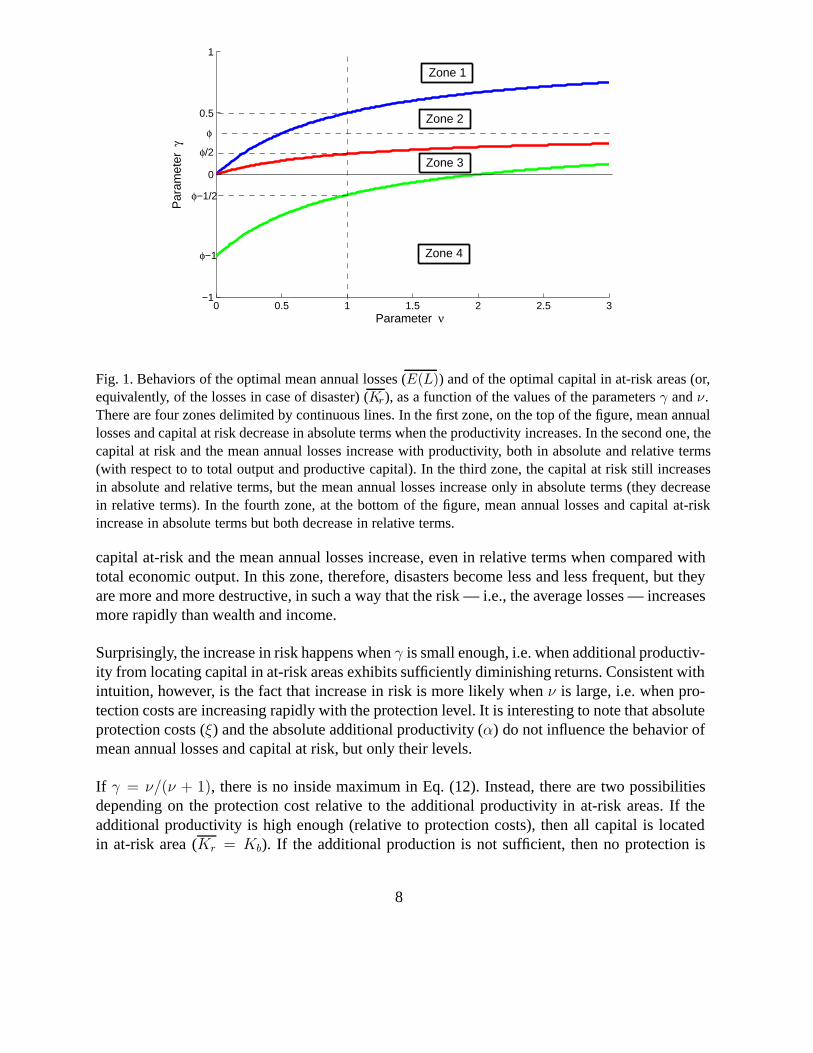
Figure 1 summarizes these findings, for φ = 1/3. It shows four zones, as a function of the valuesof the parameters ν and γ. In a significant portion of the parameter space, labeled “zone 2”, the
7
0 0.5 1 1.5 2 2.5 3
0
1
−1
0.5
Parameter ν
Par
amet
er γ
φ−1
φ−1/2
φ
φ/2
Zone 1
Zone 2
Zone 3
Zone 4
Fig. 1. Behaviors of the optimal mean annual losses (E(L)) and of the optimal capital in at-risk areas (or,equivalently, of the losses in case of disaster) (Kr), as a function of the values of the parameters γ and ν.There are four zones delimited by continuous lines. In the first zone, on the top of the figure, mean annuallosses and capital at risk decrease in absolute terms when the productivity increases. In the second one, thecapital at risk and the mean annual losses increase with productivity, both in absolute and relative terms(with respect to to total output and productive capital). In the third zone, the capital at risk still increasesin absolute and relative terms, but the mean annual losses increase only in absolute terms (they decreasein relative terms). In the fourth zone, at the bottom of the figure, mean annual losses and capital at-riskincrease in absolute terms but both decrease in relative terms.
capital at-risk and the mean annual losses increase, even in relative terms when compared withtotal economic output. In this zone, therefore, disasters become less and less frequent, but theyare more and more destructive, in such a way that the risk — i.e., the average losses — increasesmore rapidly than wealth and income.
Surprisingly, the increase in risk happens when γ is small enough, i.e. when additional productiv-ity from locating capital in at-risk areas exhibits sufficiently diminishing returns. Consistent withintuition, however, is the fact that increase in risk is more likely when ν is large, i.e. when pro-tection costs are increasing rapidly with the protection level. It is interesting to note that absoluteprotection costs (ξ) and the absolute additional productivity (α) do not influence the behavior ofmean annual losses and capital at risk, but only their levels.
If γ = ν/(ν + 1), there is no inside maximum in Eq. (12). Instead, there are two possibilitiesdepending on the protection cost relative to the additional productivity in at-risk areas. If theadditional productivity is high enough (relative to protection costs), then all capital is locatedin at-risk area (Kr = Kb). If the additional production is not sufficient, then no protection is
8
provided (p = p0).
The limit between these two possibilities depends on the protection costs, relative to the addi-tional productivity in at-risk areas. The limit protection cost (ξ l) can be written as a function ofthe additional productivity α as:
ξl(α) =(
α
1 + ν
)(1+ν)
νν (17)
and — equivalently — the limit additional productivity can be written as a function of protectioncosts:
αl(ξ) = (1 + ν)c−ν
1+ν ξ1
1+ν (18)
Proposition 3 If γ = ν/(ν + 1) and ξ > ξl(α) (or, equivalently, α < αl(ξ)), then no protection
is provided (p = p0) and the capital in at-risk areas is equal to Kr =(
ανp0(1+ν)
)(1+ν). If γ =
ν/(ν + 1) and ξ < ξl(α) (or, equivalently, α > αl(ξ)), then all capital is located in at-risk areas
(Kr = Kb), and the protection is such that the disaster probability is equal to p =(
ξνKb
) 11+ν .
2.4 Preliminary conclusion
In a reasonable framework and in a large parameter domain, a simple optimization suggests that,as observed by ISDR (2009), poor countries suffer from frequent and low-cost events, whilerich countries suffer from rare but catastrophic events. Our analysis also suggests, however, thatoverall risk — i.e. mean annual losses — can increase with time, and that it can increase fasterthan wealth, even if all decisions are based on rational trade-offs between income and safety.
This behavior appears consistent with time series of globally aggregated disaster losses. On theother hand, econometric analyses of the relationship between wealth and disaster losses havereached contradicting results. Skidmore and Toya (2007) find that the ratio of economic lossesto GDP is decreasing linearly with GDP. Schumacher and Strobl (2008) reach more complicatedresults, with a nonlinear relationship that depends on the risk level. Their econometric analysisconcludes that disaster losses can increase with wealth for low GDP levels where the risk is lowor moderate, and for all GDP where the risk level is particularly high. 2 These results should beused with care, however, because of low data quality for global disaster data and methodologicalissues.
In our model, the risk — i.e. mean annual losses — can increase with time as a result of a rationaltrade-off. Model assumptions can always be discussed, and this model does not demonstrate that
2 Note that in our analysis, loss behavior does not depend on the absolute risk level, but on the shape ofthe protection cost function and on the exponent of decreasing returns from investing in at-risk areas.
9
disaster economic losses need to increase. It shows, however, that the observed increase in dis-aster losses may not be due to irrational behaviors and could be the result of rational decisions.If these assumptions are correct, an increasingly wealthy world could see less disasters, but withincreasingly large consequences, resulting in average annual losses that keep increasing morerapidly than income. These disasters, therefore, would have increasing macroeconomic conse-quences, and a growing welfare cost (see, on “rare economic disasters”, Barro, 2006, 2009).Accounting for indirect disaster impact (see, e.g., Hallegatte and Przyluski, 2011) or for changesin risk aversion with wealth may alter this conclusion by augmenting disaster impacts in Eq. (11)or changing the objective function in Eq. (12).
3 Taking into account myopic behaviors
This result assumes that both protection (i.e., p) and capital investment (i.e., Kr) decisions aremade rationally and with perfect knowledge of natural risks. This last assumption appears unre-alistic, since many decisions are made using risk analysis based only on recent past experience,when risk is not simply disregarded (Magat et al., 1987; Camerer and Kunreuther, 1989; andHogarth and Kunreuther, 1995). This section proposes a modified model to take into account thisunder-optimality in decision-making.
In this modified model, we assume that capital investment decisions are made with imperfectknowledge, using risk assessments based on events of the recent past. This assumption is consis-tent with the observation that most capital investment decisions are not made using all availabledisaster risk information, and that risk-based regulations (e.g., zoning policies) have had a lim-ited impact on new developments in at-risk areas (on the U.S. National Flood Insurance Programregulations, see for instance Burby, 2001).
On the other hand, we model protection decisions as made with perfect knowledge of naturalrisks and assuming (wrongly) that capital investment decisions will then also be made optimallyand with perfect knowledge. There is thus an inconsistency in the model between protectiondecisions and capital investment decisions. This hypothesis is justified by the fact that (publicand private) protection decisions are most of time designed through sophisticated risk analyses,taking into account all available information and assuming optimal behaviors.
To assess the consequence of this myopic behavior, it is necessary to go beyond analytical calcu-lations, and use a numerical model. This model is extremely simple, and based on the calculationsfrom the previous section. The model has a yearly time step. Each year, the baseline output Yb
increases at the rate μ, and the additional productivity α from at-risk capital increases at the rateλ. To decide on the optimal protection level, perfect knowledge is assumed, leading to the sameprotection levels as in the previous section:
10
p= ξγ−12γ−1 (αγ)
12γ−1 (19)
Then, a decision is made on the amount of capital to install in at-risk areas. We assume that thisdecision is made independently each year, with no inertia. It means that the optimization can bedone in a static manner, with no intertemporal optimization.
We assume decisions on the amount of capital to install in the risky area are based on a disasterprobability that is estimated empirically, not on the exact probability. To do so, the model includesa random process, which decides — each year — whether a disaster occurs. In practice, F (t) = 1if there is a disaster during the year t, and F (t) = 0 otherwise. The real disaster probability is p.The empirically estimated disaster probability is p(t) and is given by:
p(t) =j=t∑
j=−∞e−
t−jτ F (j) (20)
This modeling corresponds to backward-looking myopic expectation, in which past events havean exponentially decreasing weight (with time scale τ ). In other terms, agents assess future dis-aster risks from past events, with a memory characteristic time τ . The consequence is that theestimated disaster probability is higher than the real one just after a disaster, and lower than thereal one when no disaster has occurred for a while. This behavior appears consistent with manyobservations (e.g., Kunreuther and Slovic, 1978; Tol, 1998).
Investment decisions are based on this empirical probability, and the amount of capital in at-riskarea is:
Kr =
(p
αγ
) 1γ−1
(21)
Just after a disaster, p(t) is larger than p(t), disaster risks are overestimated, the capital in therisky area is lower than its optimal value, and output is lower than its optimal value. After aperiod without disaster, p(t) is lower than p(t), disaster risks are underestimated, the capital inthe risky area is higher than its optimal value. As a consequence, output is higher than its optimalvalue in absence of disaster, but losses are larger if a disaster occurs. On average, output is alsolower than its optimal value, since additional production thanks to higher productivity in riskyareas does not compensate for larger disaster losses.
The efficiency of this empirical process depends on the disaster probability. If there are manydisasters over a period τ (i.e. if 1/p << τ ), the estimated probability remains close to the realone. If the memory is too short, i.e. if τ is too low, then the estimated probability will often bedifferent from the real one.
11
Name Description Value
Y (0) Initial production 10.
phi Capital decreasing return parameter 1/3
λ Growth in general productivity 2%
α0 Initial value of the additional productivity from capital in at-risk areas 0.4
γ Parameter describing the decreasing returns of investments in at-risk areas 0.2
p0 Disaster probability in absence of protections 0.8
ξ Parameter for absolute protection costs 0.035
ν Exponent in protection costs 1
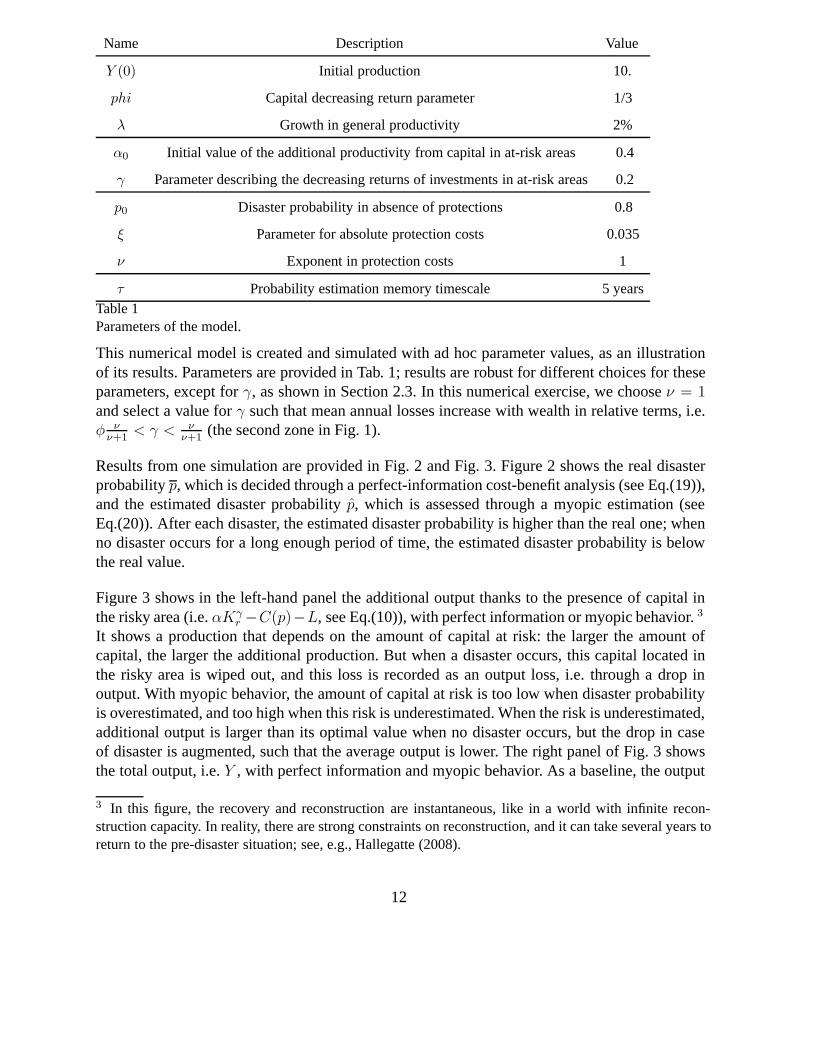
τ Probability estimation memory timescale 5 yearsTable 1Parameters of the model.
This numerical model is created and simulated with ad hoc parameter values, as an illustrationof its results. Parameters are provided in Tab. 1; results are robust for different choices for theseparameters, except for γ, as shown in Section 2.3. In this numerical exercise, we choose ν = 1and select a value for γ such that mean annual losses increase with wealth in relative terms, i.e.φ ν
ν+1< γ < ν
ν+1(the second zone in Fig. 1).
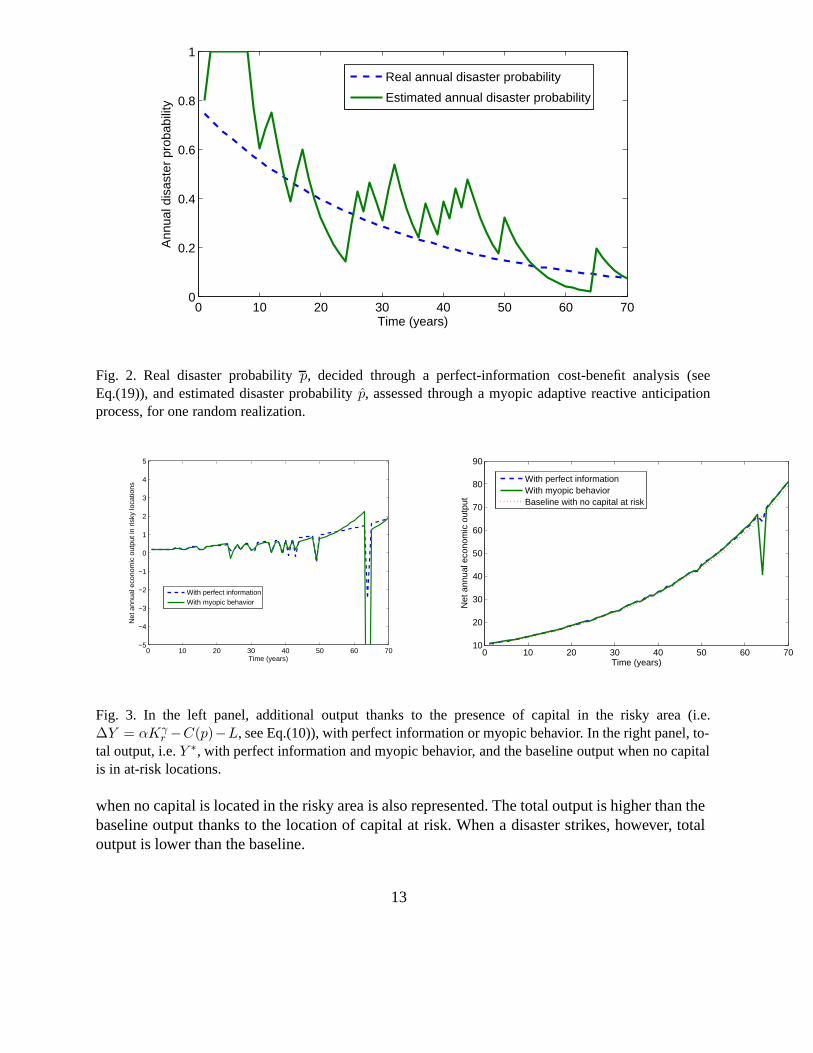
Results from one simulation are provided in Fig. 2 and Fig. 3. Figure 2 shows the real disasterprobability p, which is decided through a perfect-information cost-benefit analysis (see Eq.(19)),and the estimated disaster probability p, which is assessed through a myopic estimation (seeEq.(20)). After each disaster, the estimated disaster probability is higher than the real one; whenno disaster occurs for a long enough period of time, the estimated disaster probability is belowthe real value.
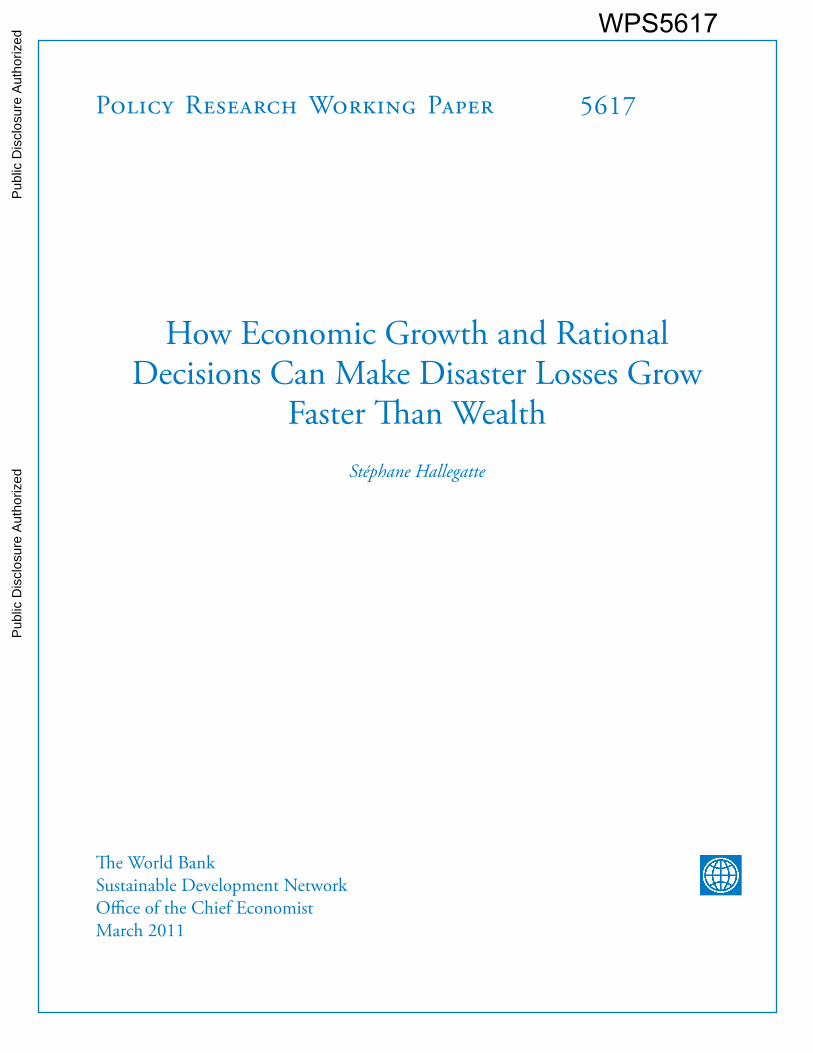
Figure 3 shows in the left-hand panel the additional output thanks to the presence of capital inthe risky area (i.e. αKγ
r −C(p)−L, see Eq.(10)), with perfect information or myopic behavior. 3
It shows a production that depends on the amount of capital at risk: the larger the amount ofcapital, the larger the additional production. But when a disaster occurs, this capital located inthe risky area is wiped out, and this loss is recorded as an output loss, i.e. through a drop inoutput. With myopic behavior, the amount of capital at risk is too low when disaster probabilityis overestimated, and too high when this risk is underestimated. When the risk is underestimated,additional output is larger than its optimal value when no disaster occurs, but the drop in caseof disaster is augmented, such that the average output is lower. The right panel of Fig. 3 showsthe total output, i.e. Y , with perfect information and myopic behavior. As a baseline, the output
3 In this figure, the recovery and reconstruction are instantaneous, like in a world with infinite recon-struction capacity. In reality, there are strong constraints on reconstruction, and it can take several years toreturn to the pre-disaster situation; see, e.g., Hallegatte (2008).
12
0 10 20 30 40 50 60 700
0.2
0.4
0.6
0.8
1
Time (years)
Ann
ual d
isas
ter
prob
abili
ty
Real annual disaster probability
Estimated annual disaster probability
Fig. 2. Real disaster probability p, decided through a perfect-information cost-benefit analysis (seeEq.(19)), and estimated disaster probability p, assessed through a myopic adaptive reactive anticipationprocess, for one random realization.
0 10 20 30 40 50 60 70−5
−4
−3
−2
−1
0
1
2
3
4
5
Time (years)
Net
ann
ual e
cono
mic
out
put i
n ris
ky lo
catio
ns
With perfect informationWith myopic behavior
0 10 20 30 40 50 60 7010
20
30
40
50
60
70
80
90
Time (years)
Net
ann
ual e
cono
mic
out
put
With perfect informationWith myopic behaviorBaseline with no capital at risk
Fig. 3. In the left panel, additional output thanks to the presence of capital in the risky area (i.e.ΔY = αKγ
r −C(p)−L, see Eq.(10)), with perfect information or myopic behavior. In the right panel, to-tal output, i.e. Y ∗, with perfect information and myopic behavior, and the baseline output when no capitalis in at-risk locations.
when no capital is located in the risky area is also represented. The total output is higher than thebaseline output thanks to the location of capital at risk. When a disaster strikes, however, totaloutput is lower than the baseline.
13
In the myopic behavior case, at the end of the period, the productivity is high, and the standardof protection is thus high. In other terms, the disaster probability is very low thanks to goodprotection. In such a situation, disasters are rare and the estimated disaster probability gets rapidlylower than the real one, prompting an over-investment in the at-risk area. The consequence is alarger disaster with myopic behavior than with perfect information.
So, adding myopic behaviors amplifies our previous results. With perfect information, the pop-ulation is more protected when it gets richer, the disaster probability decreases over time. Butdisasters become larger and larger when they occur. With myopic behavior, the interval betweentwo disasters rapidly becomes larger than the memory of the probability estimation process, andthere is over-investment in at-risk areas, making disasters more catastrophic.
This trend toward larger disasters is even likely to be enhanced by other processes influencingvulnerability, and especially indirect disaster impacts. In their industrial organization, businessesmake trade-offs between their efficiency in normal conditions and their resilience in case of un-expected shock (e.g., Henriet et al., 2011). For instance, there is a tendency to reduce inventoriesand the number of suppliers to increase efficiency and reduce costs. This strategy increases ef-ficiency and reduces costs when all suppliers are able to produce on demand. But in case of anexogenous shock, a disaster or the bankruptcy of a supplier, reduced inventories and relianceon few suppliers can easily turn into operational problems. In the same way, networks-shapedinfrastructure (e.g., transportation or electricity infrastructure) can be designed with redundancyto increase robustness in case of disasters, but this option make them more expensive in ab-sence of disaster. In a situation in which disasters are more and more exceptional, it is likelythat businesses and other decision-makers will focus even more on efficiency and less on disasterresilience. Such a trend would increase the overall economic vulnerability, and would enlarge thewelfare and economic consequences of any disaster.
4 Conclusion
This paper proposes an economic framework to analyze the trade-off between disaster losses andhigher capital productivity in areas at risk from natural hazards. Even though hypotheses canalways be discussed, it shows that natural disasters may become less frequent but more intensewhen productivity and wealth increase. It is even possible to observe a long-term increase inaverage disaster losses, even in relative terms with wealth and income. Current trends in disasterlosses appear consistent with this prediction (e.g., Etkin, 1999; Nordhaus, 2006; Pielke et al.,2008). These results are also in line with ISDR (2009), which observes that poor countries sufferfrom frequent and low-cost events, while rich countries suffer from rare but high-cost events.This trend is illustrated by the case of Japan. Thanks to strict building norms, the country cancope with no damages with frequent earthquakes that would cause disasters in any other placeof the world. But this resilience allows for higher investments in at-risk areas, and exceptionalquakes like the recent Tohoku Pacific earthquake can then lead to immense losses.
14
These results also suggest that the overall risk — i.e. mean annual losses — can increase withtime, and even faster than wealth, in spite of continuously improving protection. A consequenceof these findings is that future increase in disaster losses might be difficult to avoid. Increasinglosses may even be desirable from an economic point-of-view, provided that (i) human lossescan be avoided (thanks to warning and evacuation); (ii) affected populations are supported indisaster aftermaths or have access to insurance, to make sure individual losses remain small andthe conditions of the Arrow-Lind theorem are respected (i.e., risk aversion can be neglected).This paper suggests a strong and increasing need for post-disaster support, through insurance,ad hoc support, emergency and crisis-management arrangements, in addition to investments indisaster protections, hazard forecasts, and early warning.
All risks are not linked to rational choices, however. We showed that imperfect information andmyopic expectations can amplify risk-taking behaviors. This effect can be reinforced by othersub-optimalities. In particular, some economic agents have little flexibility in their localizationchoices, like the poorest households who locate in informal settlements in developing-countrycities. Also, risk involves externalities: when many buildings are destroyed by an earthquake,the economic system is paralyzed and collective losses exceed the sum of initial private losses(Lall and Deichmann, 2010; Hallegatte and Przyluski, 2011; Henriet et al., 2011). These riskamplification mechanisms and externalities may lead economic agents to accept more risk thanwhat is socially optimal. These important sub-optimalities provide ample justification for publicaction to manage risks and limit risk-taking behaviors. But our results suggests that this actionshould not systematically aim at reducing the level of risk. Instead, it should aim at managing thelevel of risk, to limit disaster losses while making sure that we can still take the worthwhile risksthat yield large benefits. In other terms, disaster risk management policies should be favored overdisaster risk reduction policies.
These results also have consequences on climate change policies. It is likely that socio-economicdrivers will remain the dominant drivers of future changes in disaster losses. Some have de-rived from this result the idea that policy-makers should focus on reducing trends in disasterexposure and vulnerability, not on mitigating climate change (e.g., Pielke et al., 2005). But ifsocio-economic drivers of losses are the consequence of a desirable trade-off and yield signif-icant benefits, as suggested here, it might not be rational to oppose them in a systematic way.Climate change, on the other hand, may increase disaster losses without providing any benefitsin return. The risk of increasing hazards may therefore represent a powerful incentive to mitigategreenhouse gas emissions, even if climate change is not the dominant driver of disaster losses.
5 Acknowledgments
The author wants to thank Patrice Dumas, Marianne Fay, Antonin Pottier, Julie Rozenberg, andAdrien Vogt-Schilb for useful comments on a previous version of this paper. The remaining errorsare the author’s. The views expressed in this paper are the sole responsibility of the author. They
15
do not necessarily reflect the views of the World Bank, its executive directors, or the countriesthey represent.
6 References
Arrow, K., and R. Lind, 1970. Uncertainty and the Evaluation of Public Investment Decisions.American Economic Review 60, no.3: 364-78.
Barredo, J.I., 2009. Normalised flood losses in Europe: 1970–2006. Nat. Hazards Earth Syst., 9,97–104.
Barro, R.J., 2006. Rare disasters and asset markets in the twentieth century, Quarterly Journal ofEconomics, 121(3), 823–866
Barro, R.J., 2009. Rare disasters, asset prices, and welfare costs. The American Economic Re-view, 99(1), 243–264
Burby, R. J., 2001. Flood insurance and floodplain management: the US experience. Environ-mental Hazards 3, 111–122
Burby, R. J., Beverly A. Cigler, Steven P. French, Edward J. Kaiser, Jack Kartez, Dale Roenigk,Dana Weist, and Dale Whittington, 1991. Sharing Environmental Risks: How to Control Gov-ernments’ Losses in Natural Disasters. Boulder, CO: Westview.
Burby R. J, Nelson A. C., Parker D., and Handmer J., 2001. Urban Containment Policy andExposure to Natural Hazards: Is There a Connection? Journal of Environmental Planning andManagement 44(4), p. 475-490.
Burby R.J., Birch E. L., and Wachter S. M., 2006. The problems of containment and the promiseof planning. In Rebuilding urban places after disaster: lessons from Hurricane Katrina. Universityof Pennsylvania Press.
Camerer, C. and H. Kunreuther, 1989. Decision Processes for Low Probability Events: PolicyImplications. Journal of Policy Analysis and Management, 8, 565-592.
Ciccone, A., 2002. Agglomeration effects in Europe, European Economic Review 46 (2002)213–227
Ciccone, A., and R. E. Hall, 1996. Productivity and the density of economic activity, The Amer-ican Economic Review, 86(1), 54–70
Etkin D., 1999. Risk transference and related trends: driving forces towards more mega-disasters.
16
Environmental Hazards 1, 69–75
Hallegatte, S., 2008. An adaptive regional input-output model and its application to the assess-ment of the economic cost of Katrina, Risk Analysis, 28(3).
Hallegatte S., Przyluski, V., 2011. The Economics of Natural Disasters: Concepts and Methods,Policy Research Working Paper 5507, The World Bank, Washington D.C.
Henriet, F., S. Hallegatte, L. Tabourier, 2011. Firm-Network Characteristics and Economic Ro-bustness to Natural Disasters, Journal of Economic Dynamics and Control, in review.
Hogarth, R., and H. Kunreuther, 1995. Decision Making Under Ignorance: Arguing with Your-self. Journal of Risk and Uncertainty, 10, 15-36.
Kaplow, L., 1991. Incentives and government relief for risk. Journal of Risk and Uncertainty4(2), 167–175.
Kunreuther, H., and P. Slovic, 1978. Economics, psychology, and protective behavior. The Amer-ican Economic Review, 68(2), Papers and Proceedings of the Ninetieth Annual Meeting of theAmerican Economic Association, pp. 64–69
Kunreuther, H., R. Ginsberg, L. Miller, P. Sagi, P. Slovic, B. Borkan, and N. Katz, 1978. DisasterInsurance Protection: Public Policy Lessons. John Wiley and Sons, New York.
Laffont, J.J., 1995. Regulation, moral hazard and insurance of environmental risks, Journal ofPublic Economics 58(3), 319–336
Lall S. V, and Deichmann U., 2010. Density and disasters: economics of urban hazard risk. PolicyResearch Working Paper 5161, The World Bank, Washington, D.C.
Lewis, T., and D. Nickerson, 1989. Self-insurance against natural disasters, Journal of Environ-mental Economics and Management, 16, 209–223.
Magat, W., K. W. Viscusi, and J. Huber, 1987. Risk-dollar trade-offs, risk perceptions, and con-sumer behaviour. In: Learning About Risk [Viscusi, W. and W. Magat (eds.)]. Harvard UniversityPress, Cambridge, MA, 83-97.
Michel-Kerjan, E., 2008. Disasters and public policy: Can market lessons help address govern-ment failures. Proceedings of the 99th National Tax Association conference, Boston, MA.
Miller S, Muir-Wood R, Boissonnade A, 2008. An exploration of trends in normalized weather-related catastrophe losses. In: Diaz HF, Murnane RJ (eds) Climate extremes and society. Cam-bridge University Press, Cambridge, 225–347
Neumayer, E., F. Barthel, 2010. Normalizing economic loss from natural disasters: A global
17

analysis, Global Environmental Change 21(1), 13–24
Nordhaus, William D., 2006. The Economics of Hurricanes in the United States, Working Paper.New Haven: Yale University.
Pielke, Jr., R. A, C. Landsea, M. Mayfield, J. Laver, and R. Pasch, R, 2005. Hurricanes and globalwarming. Bulletin of American Meteorological Society, 86(11), 1571–1575
Pielke, R. A., Jr., Gratz, J., Landsea, C. W., Collins, D., Saunders, M. A., and Musulin, R., 2008.Normalized hurricane damages in the United States: 1900–2005, Natural Hazards Review, 9(1),29–42.
Ranger N., S. Hallegatte, S. Bhattacharya, M. Bachu, S. Priya, K. Dhore, F. Rafique, P. Mathur,N. Naville, F. Henriet, C. Herweijer, S. Pohit, J. Corfee-Morlot, 2011. A Preliminary Assessmentof the Potential Impact of Climate Change on Flood Risk in Mumbai, Climatic Change, 104(1),139–167.
Schumacher, I. and E. Strobl, 2008. Economic Development and Losses due to Natural Disasters:The Role of Risk, Ecole Polytechnique. Departement d’Economie. Cahiers 2008-32.
Skidmore, M., and H. Toya, 2007. Economic development and the impact of natural disasters.Economic Letters, 94, 20–25.
Thaler, R., 1999. Mental accounting matters. Journal of Behavioral Decision Making, 12, 183-206
Trope, Y. and N. Liberman, 2003. Temporal construal. Psychological Review. 110 (3), 403-421.
Tversky A., and D. Kahneman, 1974. Judgment under Uncertainty: Heuristics and Biases, Sci-ence, New Series, 185(4157), 1124–1131.
Tversky, A. and E. Shafir, 1992. Choice under conflict: the dynamics of deferred decision. Psy-chological Science, 3(6), 358-361.
18