Embed Size (px)
Citation preview

How Does YourDental Practice Compare?2013 Edition
CWA Brochure Concept 8x8 NG.indd 2 1/12/15 7:52 PM

For more than 30 years, Cain Watters and Associates (CWA) has guided thousands of dentists and dental practices in the smart, effective
management of their personal and business financial matters, helping bring the two into alignment in order to reach set goals.
Through the years we have gained tremendous knowledge about the factors, attitudes and disciplines that generate the desired outcomes.
Much of our understanding is derived from data that we are able to compile, analyze and translate into actionable intelligence resulting in
well-informed and highly-effective accounting and financial planning services for CWA clients.
Moreover, we believe sharing these valuable insights elevates our entire community of dentists, which is why we have developed and
published a yearly CWA dental practice comparison report.
“How Does Your Dental Practice Compare? - 2013 Edition” is a compilation of net income averages based on collections and overhead that
were taken from a cross-section of CWA’s clients nationwide and broken out by specialty and the number of doctors. This useful information,
which also includes year 2012 averages for comparison, will help provide perspective on how costs impact practices similar to yours and can
be used as a high-level benchmarking tool to direct efforts and goals from year to year. And there are likely others in your network that will
also find this information helpful for defining their own business goals, we encourage you to share it with them as well.
We take pride in our ability to combine proven methods for achieving financial success with our unique knowledge of dentistry, so that you
don’t have to go it alone. Our comprehensive services were developed with you in mind – put simply, we have everything you need to help you
achieve the financial peace and security you want.
Sincerely,
Cain Watters and Associates
6 9 0 0 N . D a l l a s P a r k w a y , S t e . 5 0 0 I P l a n o , T e x a s 7 5 0 2 4 I 9 7 2 - 2 3 3 - 3 3 2 3 I w w w . c a i n w a t t e r s . c o m
A Note from our Partners
CWA Brochure Concept 8x8 NG.indd 3 1/12/15 7:52 PM

General Dentist 1 Doctor Practice ............................................................................................................................................................................ 5
General Dentist 2 Doctor Practice ............................................................................................................................................................................ 6
General Dentist 3 Doctor Practice ............................................................................................................................................................................ 7
General Dentist 4+ Doctor Practice ......................................................................................................................................................................... 8
Pediatric Dentist 1 Doctor Practice .......................................................................................................................................................................... 9
Pediatric Dentist 2 Doctor Practice ........................................................................................................................................................................10
Pediatric Dentist 3+ Doctor Practice .....................................................................................................................................................................11
Orthodontist 1 Doctor Practice ...............................................................................................................................................................................12
Orthodontist 2 Doctor Practice ...............................................................................................................................................................................13
Periodontist 1 Doctor Practice .................................................................................................................................................................................14
Periodontist 2 Doctor Practice .................................................................................................................................................................................15
Oral Surgery 1 Doctor Practice ................................................................................................................................................................................16
Oral Surgery 2 Doctor Practice ................................................................................................................................................................................17
Prosthodontist 1 Doctor Practice ...........................................................................................................................................................................18
Endodontist 1 Doctor Practice ................................................................................................................................................................................19
Average Revenue and Overhead for 1 Doctor Practices in 2013 ................................................................................................................20
Average Revenue and Overhead for 2 Doctor Practices in 2013 ................................................................................................................21
Contents
CWA Brochure Concept 8x8 NG.indd 4 1/12/15 7:52 PM

CWA Brochure Concept 8x8 NG.indd 5 1/12/15 7:52 PM

2013 2012 Year-End Year-End
GROSS RECEIPTS 1,206,432 100.00% 1,249,570 100.00%
Direct Expenses Salaries - Oce 84,991 7.04% 92,329 7.39% Salaries - Hygiene 101,812 8.44% 106,168 8.50% Salaries - Chairside/Other 71,073 5.89% 73,933 5.92% Payroll Tax Expense 34,103 2.83% 34,494 2.76% Lab Fees 84,309 6.99% 88,740 7.10% Drugs and Supplies 88,927 7.37% 86,060 6.89% Oce Supplies/Expense 24,948 2.07% 26,511 2.12%Total Direct Costs 490,163 40.63% 508,235 42.23%
Gross Pro�t 716,269 59.37% 741,335 59.33%
Fixed Expenses Legal & Accounting 21,217 1.76% 19,984 1.60% Advertising & Promotion 33,118 2.75% 37,261 2.98% Consultant Fees 6,018 0.50% 5,078 0.41% Continuing Education 8,419 0.70% 5,827 0.47% Credit Card & Bank Fees 13,502 1.12% 14,918 1.19% Dues & Subscriptions 3,857 0.32% 3,884 0.31% Insurance Practice 18,978 1.57% 19,754 1.58% Meals & Entertainment 2,371 0.20% 2,260 0.18% Pension Admin 3,330 0.28% 3,479 0.28% Repairs & Maintenance 7,943 0.66% 8,248 0.66% Rent 52,592 4.36% 55,932 4.48% Licenses & Taxes 11,521 0.95% 12,071 0.97% Telephone & Utilities 16,269 1.35% 16,029 1.28% Travel & Lodging 10,611 0.88% 9,441 0.76% Other Fixed Costs 14,999 1.24% 14,252 1.14%Total Administrative Costs 224,745 18.63% 228,418 18.28%
Net Income 491,524 40.74% 512,917 39.31%(Before Non-Operating & Doctor Costs)
$ $
$ $
General Dentist 1 Doctor Practice
5
General Dentist 1 Doctor Practice
5
CWA Brochure Concept 8x8 NG.indd 6 1/12/15 7:52 PM

General Dentist 2 Doctor Practice
6
2013 2012 Year-End Year-End
GROSS RECEIPTS 1,981,695 100.00% 1,982,657 100.00%
Direct Expenses Salaries - Oce 128,001 6.46% 125,354 6.32% Salaries - Hygiene 193,038 9.74% 188,192 9.49% Salaries - Chairside/Other 124,982 6.31% 127,784 6.45% Payroll Tax Expense 43,212 2.18% 42,774 2.16% Lab Fees 132,032 6.66% 130,741 6.59% Drugs and Supplies 143,340 7.23% 141,017 7.11% Oce Supplies/Expense 32,845 1.66% 31,215 1.57%Total Direct Costs 797,450 40.24% 787,077 40.56%
Gross Pro�t 1,184,245 59.76% 1,195,580 60.30%
Fixed Expenses Legal & Accounting 21,874 1.10% 20,345 1.03% Advertising & Promotion 38,525 1.94% 37,972 1.92% Consultant Fees 7,735 0.39% 6,815 0.34% Continuing Education 6,807 0.34% 7,648 0.39% Credit Card & Bank Fees 21,731 1.10% 21,203 1.07% Dues & Subscriptions 3,446 0.17% 3,328 0.17% Insurance Practice 25,417 1.28% 25,004 1.26% Meals & Entertainment 2,895 0.15% 2,759 0.14% Pension Admin 4,924 0.25% 4,478 0.23% Repairs & Maintenance 13,032 0.66% 13,496 0.68% Rent 83,061 4.19% 85,541 4.31% Licenses & Taxes 13,139 0.66% 14,090 0.71% Telephone & Utilities 20,586 1.04% 21,313 1.07% Travel and Lodging 5,319 0.27% 4,574 0.23% Other Fixed Costs 18,206 0.92% 16,057 0.81%Total Administrative Costs 286,697 14.47% 284,623 14.36%
Net Income 897,548 45.29% 910,957 44.72%(Before Non-Operating & Doctor Costs)
$ $
$ $
General Dentist 2 Doctor Practice
6
CWA Brochure Concept 8x8 NG.indd 7 1/12/15 7:52 PM

General Dentist 3 Doctor Practice
7
2013 2012 Year-End Year-End
GROSS RECEIPTS 3,197,389 100.00% 3,080,685 100.00%
Direct Expenses Salaries - Oce 231,690 7.25% 192,739 6.26% Salaries - Hygiene 286,874 8.97% 283,318 9.20% Salaries - Chairside/Other 201,961 6.32% 210,142 6.82% Payroll Tax Expense 67,627 2.12% 63,639 2.07% Lab Fees 193,998 6.07% 199,805 6.49% Drugs and Supplies 232,319 7.27% 223,459 7.25% Oce Supplies/Expense 46,093 1.44% 50,300 1.63%Total Direct Costs 1,260,562 39.42% 1,223,402 40.67%
Gross Pro�t 1,936,827 60.58% 1,857,283 60.29%
Fixed Expenses Legal & Accounting 26,675 0.83% 27,104 0.88% Advertising & Promotion 77,171 2.41% 78,753 2.56% Consultant Fees 15,030 0.47% 11,556 0.38% Continuing Education 11,732 0.37% 7,946 0.26% Credit Card & Bank Fees 36,987 1.16% 32,858 1.07% Dues & Subscriptions 3,887 0.12% 3,940 0.13% Insurance Practice 36,284 1.13% 35,937 1.17% Meals & Entertainment 4,118 0.13% 3,265 0.11% Pension Admin 6,193 0.19% 6,399 0.21% Repairs & Maintenance 17,637 0.55% 17,358 0.56% Rent 136,671 4.27% 124,269 4.03% Licenses & Taxes 18,764 0.59% 19,962 0.65% Telephone & Utilities 26,455 0.83% 25,609 0.83% Travel & Lodging 5,450 0.17% 6,592 0.21% Other Fixed Costs 24,558 0.77% 29,621 0.96%Total Administrative Costs 447,612 14.00% 431,169 14.00%
Net Income 1,489,215 46.58% 1,426,114 45.31%(Before Non-Operating & Doctor Costs)
$ $
$ $
General Dentist 3 Doctor Practice
7
CWA Brochure Concept 8x8 NG.indd 8 1/12/15 7:52 PM

General Dentist 4+ Doctor Practice
8
2013 2012 Year-End Year-End
GROSS RECEIPTS 3,424,484 100.00% 4,163,440 100.00%
Direct Expenses Salaries - O�ce 252,194 7.36% 293,177 7.04% Salaries - Hygiene 307,195 8.97% 370,155 8.89% Salaries - Chairside/Other 251,939 7.36% 304,259 7.31% Payroll Tax Expense 74,468 2.17% 94,306 2.27% Lab Fees 223,765 6.53% 295,479 7.10% Drugs and Supplies 209,484 6.12% 242,051 5.81% O�ce Supplies/Expense 52,721 1.54% 64,159 1.54%Total Direct Costs 1,371,766 40.06% 1,663,586 39.96%
Gross Pro�t 2,052,718 59.94% 2,499,854 60.04%
Fixed Expenses Legal & Accounting 27,409 0.80% 28,299 0.68% Advertising & Promotion 60,515 1.77% 71,871 1.73% Consultant Fees 18,689 0.55% 31,111 0.75% Continuing Education 4,826 0.14% 6,227 0.15% Credit Card & Bank Fees 37,270 1.09% 51,695 1.24% Dues & Subscriptions 5,664 0.17% 3,166 0.08% Insurance Practice 24,556 0.72% 35,501 0.85% Meals & Entertainment 4,496 0.13% 6,902 0.17% Pension Admin 4,945 0.14% 5,463 0.13% Repairs & Maintenance 18,999 0.55% 26,729 0.64% Rent 156,182 4.56% 176,792 4.25% Licenses & Taxes 17,430 0.51% 27,289 0.66% Telephone & Utilities 26,831 0.78% 31,879 0.77% Travel & Lodging 5,410 0.16% 8,289 0.20% Other Fixed Costs 25,387 0.74% 34,190 0.82%Total Administrative Costs 438,609 12.81% 545,403 13.10%
Net Income 1,614,109 47.13% 1,954,451 46.94%(Before Non-Operating & Doctor Costs)
$ $
$ $
General Dentist 4+ Doctor Practice
8
CWA Brochure Concept 8x8 NG.indd 9 1/12/15 7:52 PM

Pediatric Dentist 1 Doctor Practice
9
2013 2012 Year-End Year-End
GROSS RECEIPTS 1,515,337 100.00% 1,412,020 100.00%
Direct Expenses Salaries - O�ce 134,462 8.87% 130,059 9.21% Salaries - Hygiene 84,489 5.58% 69,188 4.90% Salaries - Chairside/Other 121,413 8.01% 104,809 7.42% Payroll Tax Expense 43,919 2.90% 40,877 2.89% Lab Fees 5,883 0.39% 5,902 0.42% Drugs and Supplies 86,206 5.69% 85,683 6.07% O�ce Supplies/Expense 37,345 2.46% 36,943 2.62%Total Direct Costs 513,717 33.90% 473,461 34.84%
Gross Pro�t 1,001,620 66.10% 938,559 66.47%
Fixed Expenses Legal & Accounting 21,212 1.40% 21,834 1.55% Advertising & Promotion 24,851 1.64% 26,495 1.88% Consultant Fees 9,007 0.59% 6,829 0.48% Continuing Education 3,136 0.21% 3,336 0.24% Credit Card & Bank Fees 10,372 0.68% 9,007 0.64% Dues & Subscriptions 4,368 0.29% 4,809 0.34% Insurance Practice 25,798 1.70% 21,844 1.55% Meals & Entertainment 3,741 0.25% 4,164 0.29% Pension Admin 3,227 0.21% 3,489 0.25% Repairs & Maintenance 8,275 0.55% 7,484 0.53% Rent 81,613 5.39% 88,362 6.26% Licenses & Taxes 15,986 1.05% 10,612 0.75% Telephone & Utilities 18,712 1.23% 19,077 1.35% Travel & Lodging 9,728 0.64% 9,421 0.67% Other Fixed Costs 22,924 1.51% 19,989 1.42%Total Administrative Costs 262,950 17.35% 256,752 18.18%
Net Income 738,670 48.75% 681,807 48.29%(Before Non-Operating & Doctor Costs)
$ $
$ $
Pediatric Dentist 1 Doctor Practice
9
CWA Brochure Concept 8x8 NG.indd 10 1/12/15 7:52 PM

Pediatric Dentist 2 Doctor Practice
10
2013 2012 Year-End Year-End
GROSS RECEIPTS 2,111,037 100.00% 2,010,702 100.00%
Direct Expenses Salaries - O ce 159,487 7.55% 164,818 8.20% Salaries - Hygiene 111,857 5.30% 109,892 5.47% Salaries - Chairside/Other 167,143 7.92% 169,585 8.43% Payroll Tax Expense 44,606 2.11% 44,463 2.21% Lab Fees 8,488 0.40% 9,176 0.46% Drugs and Supplies 120,511 5.71% 117,296 5.83% O ce Supplies/Expense 42,885 2.03% 45,192 2.25%Total Direct Costs 654,977 31.03% 660,422 32.85%
Gross Pro�t 1,456,060 68.97% 1,350,280 67.15%
Fixed Expenses Legal & Accounting 22,748 1.08% 25,733 1.28% Advertising & Promotion 38,026 1.80% 42,751 2.13% Consultant Fees 7,797 0.37% 13,748 0.68% Continuing Education 3,755 0.18% 5,403 0.27% Credit Card & Bank Fees 15,597 0.74% 14,120 0.70% Dues & Subscriptions 6,426 0.30% 5,453 0.27% Insurance Practice 26,507 1.26% 28,301 1.41% Meals & Entertainment 2,427 0.11% 2,968 0.15% Pension Admin 5,941 0.28% 4,822 0.24% Repairs & Maintenance 11,704 0.55% 9,698 0.48% Rent 94,977 4.50% 101,670 5.06% Licenses & Taxes 17,971 0.85% 16,855 0.84% Telephone & Utilities 23,713 1.12% 26,159 1.30% Travel & Lodging 9,182 0.43% 8,779 0.44% Other Fixed Costs 26,121 1.24% 23,437 1.17%Total Administrative Costs 312,892 14.82% 329,897 16.41%
Net Income 1,143,168 54.15% 1,020,383 50.75%(Before Non-Operating & Doctor Costs)
$ $
$ $
Pediatric Dentist 2 Doctor Practice
10
CWA Brochure Concept 8x8 NG.indd 11 1/12/15 7:52 PM

Pediatric Dentist 3+ Doctor Practice
11
2013 2012 Year-End Year-End
GROSS RECEIPTS 3,570,476 100.00% 3,609,024 100.00%
Direct Expenses Salaries - Oce 240,772 6.74% 306,303 8.49% Salaries - Hygiene 107,715 3.02% 126,860 3.52% Salaries - Chairside/Other 275,331 7.71% 270,163 7.49% Payroll Tax Expense 78,660 2.20% 76,658 2.12% Lab Fees 19,312 0.54% 21,235 0.59% Drugs and Supplies 195,800 5.48% 171,504 4.75% Oce Supplies/Expense 68,549 1.92% 61,388 1.70%Total Direct Costs 986,139 27.62% 1,034,111 31.15%
Gross Pro�t 2,584,337 72.38% 2,574,913 71.35%
Fixed Expenses Legal & Accounting 36,935 1.03% 35,191 0.98% Advertising & Promotion 53,068 1.49% 56,842 1.57% Consultant Fees 4,706 0.13% 3,414 0.09% Continuing Education 5,750 0.16% 3,635 0.10% Credit Card & Bank Fees 20,915 0.59% 19,961 0.55% Dues & Subscriptions 6,206 0.17% 7,675 0.21% Insurance Practice 59,194 1.66% 49,618 1.37% Meals & Entertainment 4,754 0.13% 5,567 0.15% Pension Admin 7,566 0.21% 8,355 0.23% Repairs & Maintenance 22,579 0.63% 17,541 0.49% Rent 165,397 4.63% 159,242 4.41% Licenses & Taxes 17,958 0.50% 21,603 0.60% Telephone & Utilities 42,479 1.19% 38,696 1.07% Travel & Lodging 8,238 0.23% 10,734 0.30% Other Fixed Costs 37,838 1.06% 41,427 1.15%Total Administrative Costs 493,583 13.82% 479,501 13.29%
Net Income 2,090,754 58.56% 2,095,412 58.06%(Before Non-Operating & Doctor Costs)
$ $
$ $
Pediatric Dentist 3+ Doctor Practice
11
CWA Brochure Concept 8x8 NG.indd 12 1/12/15 7:52 PM
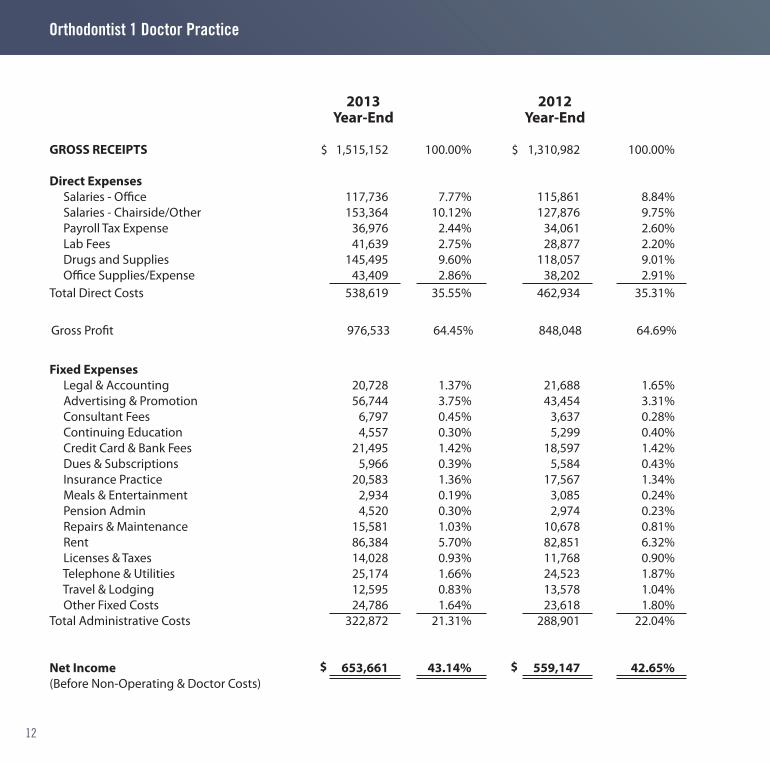
Orthodontist 1 Doctor Practice
12
2013 2012 Year-End Year-End
GROSS RECEIPTS 1,515,152 100.00% 1,310,982 100.00%
Direct Expenses Salaries - O�ce 117,736 7.77% 115,861 8.84% Salaries - Chairside/Other 153,364 10.12% 127,876 9.75% Payroll Tax Expense 36,976 2.44% 34,061 2.60% Lab Fees 41,639 2.75% 28,877 2.20% Drugs and Supplies 145,495 9.60% 118,057 9.01% O�ce Supplies/Expense 43,409 2.86% 38,202 2.91%Total Direct Costs 538,619 35.55% 462,934 35.31%
Gross Pro�t 976,533 64.45% 848,048 64.69%
Fixed Expenses Legal & Accounting 20,728 1.37% 21,688 1.65% Advertising & Promotion 56,744 3.75% 43,454 3.31% Consultant Fees 6,797 0.45% 3,637 0.28% Continuing Education 4,557 0.30% 5,299 0.40% Credit Card & Bank Fees 21,495 1.42% 18,597 1.42% Dues & Subscriptions 5,966 0.39% 5,584 0.43% Insurance Practice 20,583 1.36% 17,567 1.34% Meals & Entertainment 2,934 0.19% 3,085 0.24% Pension Admin 4,520 0.30% 2,974 0.23% Repairs & Maintenance 15,581 1.03% 10,678 0.81% Rent 86,384 5.70% 82,851 6.32% Licenses & Taxes 14,028 0.93% 11,768 0.90% Telephone & Utilities 25,174 1.66% 24,523 1.87% Travel & Lodging 12,595 0.83% 13,578 1.04% Other Fixed Costs 24,786 1.64% 23,618 1.80%Total Administrative Costs 322,872 21.31% 288,901 22.04%
Net Income 653,661 43.14% 559,147 42.65%(Before Non-Operating & Doctor Costs)
$ $
$ $
Orthodontist 1 Doctor Practice
12
CWA Brochure Concept 8x8 NG.indd 13 1/12/15 7:52 PM

Orthodontist 2 Doctor Practice
13
2013 2012 Year-End Year-End
GROSS RECEIPTS 2,316,800 100.00% 1,954,020 100.00%
Direct Expenses Salaries - Oce 207,817 8.97% 178,218 9.12% Salaries - Chairside/Other 184,031 7.94% 238,381 12.20% Payroll Tax Expense 44,939 1.94% 43,463 2.22% Lab Fees 78,726 3.40% 20,284 1.04% Drugs and Supplies 244,491 10.55% 183,286 9.38% Oce Supplies/Expense 53,782 2.32% 46,000 2.35%Total Direct Costs 813,786 35.13% 709,632 36.32%
Gross Pro�t 1,503,014 64.87% 1,244,388 63.68%
Fixed Expenses Legal & Accounting 16,459 0.71% 20,498 1.05% Advertising & Promotion 56,756 2.45% 50,802 2.60% Consultant Fees 6,765 0.29% 1,203 0.06% Continuing Education 3,045 0.13% 1,256 0.06% Credit Card & Bank Fees 33,930 1.46% 27,875 1.43% Dues & Subscriptions 5,124 0.22% 7,155 0.37% Insurance Practice 19,442 0.84% 30,422 1.56% Meals & Entertainment 5,685 0.25% 5,052 0.26% Pension Admin 4,755 0.21% 4,468 0.23% Repairs & Maintenance 14,400 0.62% 15,775 0.81% Rent 77,595 3.35% 75,838 3.88% Licenses & Taxes 42,490 1.83% 12,517 0.64% Telephone & Utilities 22,692 0.98% 22,736 1.16% Travel & Lodging 11,981 0.52% 8,024 0.41% Other Fixed Costs 31,859 1.38% 29,116 1.49%Total Administrative Costs 352,978 15.24% 312,737 16.00%
Net Income 1,150,036 49.64% 931,651 47.68%(Before Non-Operating & Doctor Costs)
$ $
$ $
Orthodontist 2 Doctor Practice
13
CWA Brochure Concept 8x8 NG.indd 14 1/12/15 7:52 PM

Periodontist 1 Doctor Practice
14
2013 2012 Year-End Year-End
GROSS RECEIPTS 1,374,387 100.00% 1,353,386 100.00%
Direct Expenses Salaries - Oce 84,639 6.16% 92,556 6.84% Salaries - Hygiene 63,282 4.60% 51,138 3.78% Salaries - Chairside/Other 61,252 4.46% 71,666 5.30% Payroll Tax Expense 29,112 2.12% 29,199 2.16% Lab Fees 31,077 2.26% 23,984 1.77% Drugs and Supplies 142,588 10.37% 141,192 10.43% Oce Supplies/Expense 29,634 2.16% 33,003 2.44%Total Direct Costs 441,584 32.13% 442,738 32.71%
Gross Pro�t 932,803 67.87% 910,648 67.29%
Fixed Expenses Legal & Accounting 17,342 1.26% 15,003 1.11% Advertising & Promotion 24,977 1.82% 29,269 2.16% Consultant Fees 6,009 0.44% 9,864 0.73% Continuing Education 5,000 0.36% 2,692 0.20% Credit Card & Bank Fees 20,254 1.47% 17,886 1.32% Dues & Subscriptions 6,019 0.44% 4,647 0.34% Insurance Practice 14,821 1.08% 16,528 1.22% Meals & Entertainment 1,257 0.09% 1,508 0.11% Pension Admin 4,272 0.31% 2,844 0.21% Repairs & Maintenance 11,061 0.80% 5,472 0.40% Rent 87,525 6.37% 90,478 6.69% Licenses & Taxes 14,376 1.05% 8,269 0.61% Telephone & Utilities 17,911 1.30% 14,469 1.07% Travel & Lodging 9,599 0.70% 16,300 1.20% Other Fixed Costs 15,778 1.15% 16,831 1.24%Total Administrative Costs 256,201 18.64% 252,060 18.62%
Net Income 676,602 49.23% 658,588 48.66%(Before Non-Operating & Doctor Costs)
$ $
$ $
Periodontist 1 Doctor Practice
14
CWA Brochure Concept 8x8 NG.indd 15 1/12/15 7:52 PM

Periodontist 2 Doctor Practice
15
2013 2012 Year-End Year-End
GROSS RECEIPTS 2,306,772 100.00% 2,248,576 100.00%
Direct Expenses Salaries - Oce 101,699 4.41% 101,355 4.51% Salaries - Hygiene 154,640 6.70% 131,420 5.84% Salaries - Chairside/Other 127,659 5.53% 143,863 6.40% Payroll Tax Expense 38,774 1.68% 35,228 1.57% Lab Fees 31,316 1.36% 42,952 1.91% Drugs and Supplies 312,981 13.57% 258,047 11.48% Oce Supplies/Expense 38,702 1.68% 53,831 2.39%Total Direct Costs 805,771 34.93% 766,696 34.10%
Gross Pro�t 1,501,001 65.07% 1,481,880 65.90%
Fixed Expenses Legal & Accounting 19,342 0.84% 19,825 0.88% Advertising & Promotion 41,665 1.81% 47,473 2.11% Consultant Fees 6,657 0.29% 0 0.00% Continuing Education 3,632 0.16% 4,746 0.21% Credit Card & Bank Fees 56,275 2.44% 38,447 1.71% Dues & Subscriptions 7,061 0.31% 3,454 0.15% Insurance Practice 13,117 0.57% 21,468 0.95% Meals & Entertainment 6,745 0.29% 2,628 0.12% Pension Admin 4,594 0.20% 2,806 0.12% Repairs & Maintenance 18,320 0.79% 19,227 0.86% Rent 70,169 3.04% 69,089 3.07% Licenses & Taxes 10,057 0.44% 9,559 0.43% Telephone & Utilities 22,543 0.98% 22,899 1.02% Travel & Lodging 11,083 0.48% 4,847 0.22% Other Fixed Costs 34,011 1.47% 42,552 1.89%Total Administrative Costs 325,271 14.10% 309,020 13.74%
Net Income 1,175,730 50.97% 1,172,860 52.16%(Before Non-Operating & Doctor Costs)
$ $
$ $
Periodontist 2 Doctor Practice
15
CWA Brochure Concept 8x8 NG.indd 16 1/12/15 7:52 PM

Oral Surgery 1 Doctor Practice
16
2013 2012 Year-End Year-End
GROSS RECEIPTS 1,734,497 100.00% 1,440,674 100.00%
Direct Expenses Salaries - O�ce 168,586 9.72% 166,305 11.54% Salaries - Chairside/Other 130,335 7.51% 115,250 8.00% Payroll Tax Expense 43,380 2.50% 36,484 2.53% Lab Fees 22,830 1.32% 18,731 1.30% Drugs and Supplies 156,460 9.02% 148,182 10.29% O�ce Supplies/Expense 46,221 2.66% 32,977 2.29%Total Direct Costs 567,812 32.74% 517,929 35.95%
Gross Pro�t 1,166,685 67.26% 922,745 64.05%
Fixed Expenses Legal & Accounting 25,567 1.47% 19,998 1.39% Advertising & Promotion 36,073 2.08% 58,346 4.05% Consultant Fees 5,513 0.32% 15,136 1.05% Continuing Education 3,758 0.22% 3,024 0.21% Credit Card & Bank Fees 24,799 1.43% 18,029 1.25% Dues & Subscriptions 8,199 0.47% 8,754 0.61% Insurance Practice 39,252 2.26% 36,124 2.51% Meals & Entertainment 2,853 0.16% 2,455 0.17% Pension Admin 4,754 0.27% 3,750 0.26% Repairs & Maintenance 8,427 0.49% 3,171 0.22% Rent 87,384 5.04% 53,893 3.74% Licenses & Taxes 13,966 0.81% 8,232 0.57% Telephone & Utilities 16,592 0.96% 14,170 0.98% Travel & Lodging 32,496 1.87% 10,962 0.76% Other Fixed Costs 9,921 0.57% 8,123 0.56%Total Administrative Costs 319,554 18.42% 264,167 18.34%
Net Income 847,131 48.84% 658,578 45.71%(Before Non-Operating & Doctor Costs)
$ $
$ $
Oral Surgery 1 Doctor Practice
16
CWA Brochure Concept 8x8 NG.indd 17 1/12/15 7:52 PM

Oral Surgery 2 Doctor Practice
17
2013 2012 Year-End Year-End
GROSS RECEIPTS 3,119,173 100.00% 3,040,743 100.00%
Direct Expenses Salaries - O�ce 249,975 8.01% 213,677 7.03% Salaries - Chairside/Other 191,327 6.13% 182,784 6.01% Payroll Tax Expense 55,215 1.77% 42,849 1.41% Lab Fees 18,218 0.58% 42,077 1.38% Drugs and Supplies 480,360 15.40% 353,581 11.63% O�ce Supplies/Expense 98,531 3.16% 56,019 1.84%Total Direct Costs 1,093,626 35.06% 890,987 29.30%
Gross Pro�t 2,025,547 64.94% 2,149,756 70.70%
Fixed Expenses Legal & Accounting 36,665 1.18% 24,809 0.82% Advertising & Promotion 41,783 1.34% 35,537 1.17% Consultant Fees 13,486 0.43% 6,025 0.20% Continuing Education 5,025 0.16% 6,397 0.21% Credit Card & Bank Fees 42,560 1.36% 31,825 1.05% Dues & Subscriptions 34,794 1.12% 6,629 0.22% Insurance Practice 69,930 2.24% 43,041 1.42% Meals & Entertainment 41,626 1.33% 1,451 0.05% Pension Admin 3,970 0.13% 5,397 0.18% Repairs & Maintenance 10,783 0.35% 14,801 0.49% Rent 154,583 4.96% 127,179 4.18% Licenses & Taxes 16,551 0.53% 7,809 0.26% Telephone & Utilities 27,619 0.89% 19,970 0.66% Travel & Lodging 14,817 0.48% 14,932 0.49% Other Fixed Costs 27,006 0.87% 17,589 0.58%Total Administrative Costs 541,198 17.35% 363,391 11.95%
Net Income 1,484,349 47.59% 1,786,365 58.75%(Before Non-Operating & Doctor Costs)
$ $
$ $
Oral Surgery 2 Doctor Practice
17
CWA Brochure Concept 8x8 NG.indd 18 1/12/15 7:52 PM

Prosthodontist 1 Doctor Practice
18
2013 2012 Year-End Year-End
GROSS RECEIPTS 988,987 100.00% 971,052 100.00%
Direct Expenses Salaries - O�ce 44,965 4.55% 32,585 3.36% Salaries - Hygiene 58,809 5.95% 51,283 5.28% Salaries - Chairside/Other 61,148 6.18% 57,219 5.89% Payroll Tax Expense 22,337 2.26% 20,500 2.11% Lab Fees 108,312 10.95% 92,323 9.51% Drugs and Supplies 46,191 4.67% 45,958 4.73% O�ce Supplies/Expense 22,740 2.30% 12,386 1.28%Total Direct Costs 364,502 36.86% 312,254 32.16%
Gross Pro�t 624,485 63.14% 658,798 67.84%
Fixed Expenses Legal & Accounting 17,623 1.78% 18,053 1.86% Advertising & Promotion 42,058 4.25% 44,343 4.57% Consultant Fees 0 0.00% 3,370 0.35% Continuing Education 1,354 0.14% 950 0.10% Credit Card & Bank Fees 17,266 1.75% 19,897 2.05% Dues & Subscriptions 8,178 0.83% 6,590 0.68% Insurance Practice 13,210 1.34% 13,284 1.37% Meals & Entertainment 124 0.01% 267 0.03% Pension Admin 2,184 0.22% 3,156 0.33% Repairs & Maintenance 463 0.05% 4,959 0.51% Rent 28,400 2.87% 25,979 2.68% Licenses & Taxes 3,770 0.38% 7,535 0.78% Telephone & Utilities 12,272 1.24% 13,726 1.41% Travel & Lodging 2,682 0.27% 300 0.03% Other Fixed Costs 21,563 2.18% 40,842 4.21%Total Administrative Costs 171,147 17.31% 203,251 20.93%
Net Income 453,338 45.84% 455,547 46.91%(Before Non-Operating & Doctor Costs)
$ $
$ $
Prosthodontist 1 Doctor Practice
18
CWA Brochure Concept 8x8 NG.indd 19 1/12/15 7:52 PM
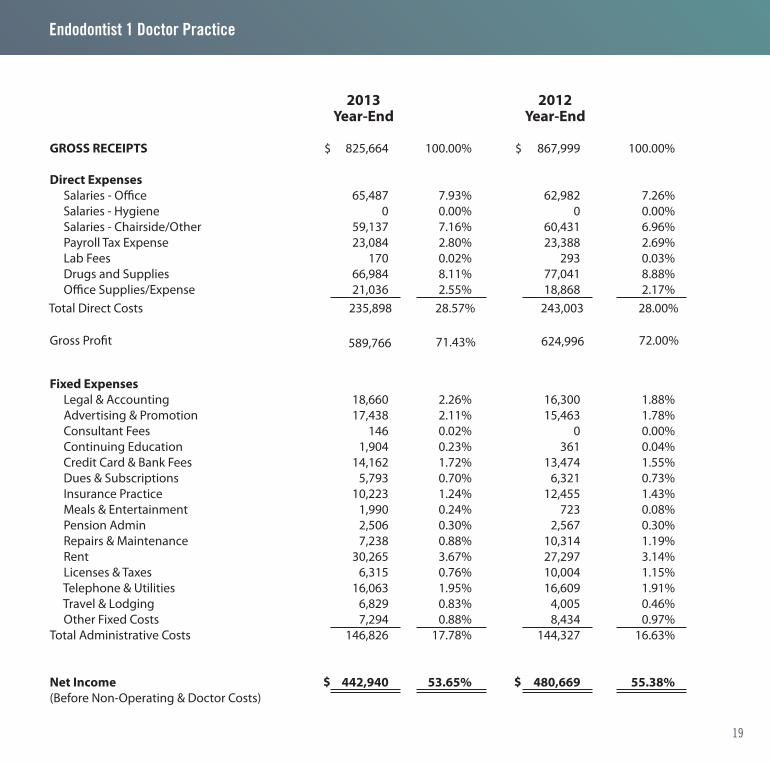
Endodontist 1 Doctor Practice
19
2013 2012 Year-End Year-End
GROSS RECEIPTS 825,664 100.00% 867,999 100.00%
Direct Expenses Salaries - Oce 65,487 7.93% 62,982 7.26% Salaries - Hygiene 0 0.00% 0 0.00% Salaries - Chairside/Other 59,137 7.16% 60,431 6.96% Payroll Tax Expense 23,084 2.80% 23,388 2.69% Lab Fees 170 0.02% 293 0.03% Drugs and Supplies 66,984 8.11% 77,041 8.88% Oce Supplies/Expense 21,036 2.55% 18,868 2.17%Total Direct Costs 235,898 28.57% 243,003 28.00%
Gross Pro�t 589,766 71.43% 624,996 72.00%
Fixed Expenses Legal & Accounting 18,660 2.26% 16,300 1.88% Advertising & Promotion 17,438 2.11% 15,463 1.78% Consultant Fees 146 0.02% 0 0.00% Continuing Education 1,904 0.23% 361 0.04% Credit Card & Bank Fees 14,162 1.72% 13,474 1.55% Dues & Subscriptions 5,793 0.70% 6,321 0.73% Insurance Practice 10,223 1.24% 12,455 1.43% Meals & Entertainment 1,990 0.24% 723 0.08% Pension Admin 2,506 0.30% 2,567 0.30% Repairs & Maintenance 7,238 0.88% 10,314 1.19% Rent 30,265 3.67% 27,297 3.14% Licenses & Taxes 6,315 0.76% 10,004 1.15% Telephone & Utilities 16,063 1.95% 16,609 1.91% Travel & Lodging 6,829 0.83% 4,005 0.46% Other Fixed Costs 7,294 0.88% 8,434 0.97%Total Administrative Costs 146,826 17.78% 144,327 16.63%
Net Income 442,940 53.65% 480,669 55.38%(Before Non-Operating & Doctor Costs)
$ $
$ $
Endodontist 1 Doctor Practice
19
CWA Brochure Concept 8x8 NG.indd 20 1/12/15 7:52 PM

Average Revenue and Overhead for One Doctor Practices in 2013
20
Average Revenue and Overhead for One Doctor Practices in 2013
AVERAGE REVENUE AND OVERHEAD FOR ONE DOCTOR PRACTICES IN 2013
2013 Gross Receipts $ Total Overhead $ % Overhead Net Income $ % Net IncomeGENERAL DENTISTS 1,206,432 714,908 59.26% 491,524 40.74%PEDIATRIC DENTISTS 1,515,337 776,667 51.25% 738,670 48.75%ORTHODONTISTS 1,515,152 861,491 56.86% 653,661 43.14%PERIODONTISTS 1,374,387 697,785 50.77% 676,602 49.23%ORAL SURGEONS 1,734,497 887,366 51.16% 847,131 48.84%PROSTHODONTISTS 988,987 535,649 54.16% 453,338 45.84%ENDODONTISTS 825,664 382,724 46.35% 442,940 53.65%
$0
$200,000
$400,000
$600,000
$800,000
$1,000,000
$1,200,000
$1,400,000
$1,600,000
$1,800,000
$2,000,000
GROSS RECEIPTS TOTAL OVERHEAD NET INCOME
GENERAL DENTISTS
PEDIATRIC DENTISTS
ORTHODONTISTS
PERIODONTISTS
ORAL SURGEONS
PROSTHODONTISTS
ENDODONTISTS
$$$$$$$
$$$$$$$
$$$$$$$
20
CWA Brochure Concept 8x8 NG.indd 21 1/12/15 7:52 PM

Average Revenue and Overhead for Two Doctor Practices in 2013
21
Average Revenue and Overhead for Two Doctor Practices in 2013
21
AVERAGE REVENUE AND OVERHEAD FOR TWO DOCTOR PRACTICES IN 2013
2013 Gross Receipts $ Total Overhead $ % Overhead Net Income $ % Net IncomeGENERAL DENTISTS 1,981,695 1,084,147 54.71% 897,548 45.29%PEDIATRIC DENTISTS 2,111,037 967,869 45.85% 1,143,168 54.15%ORTHODONTISTS 2,316,800 1,166,764 50.36% 1,150,036 49.64%PERIODONTISTS 2,306,772 1,131,042 49.03% 1,175,730 50.97%ORAL SURGEONS 3,119,173 1,634,824 52.41% 1,484,349 47.59%
$0
$500,000
$1,000,000
$1,500,000
$2,000,000
$2,500,000
$3,000,000
$3,500,000
GROSS RECEIPTS TOTAL OVERHEAD NET INCOME
GENERAL DENTISTS
PEDIATRIC DENTISTS
ORTHODONTISTS
PERIODONTISTS
ORAL SURGEONS
$$$$$
$$$$$
$$$$$
CWA Brochure Concept 8x8 NG.indd 22 1/12/15 7:52 PM
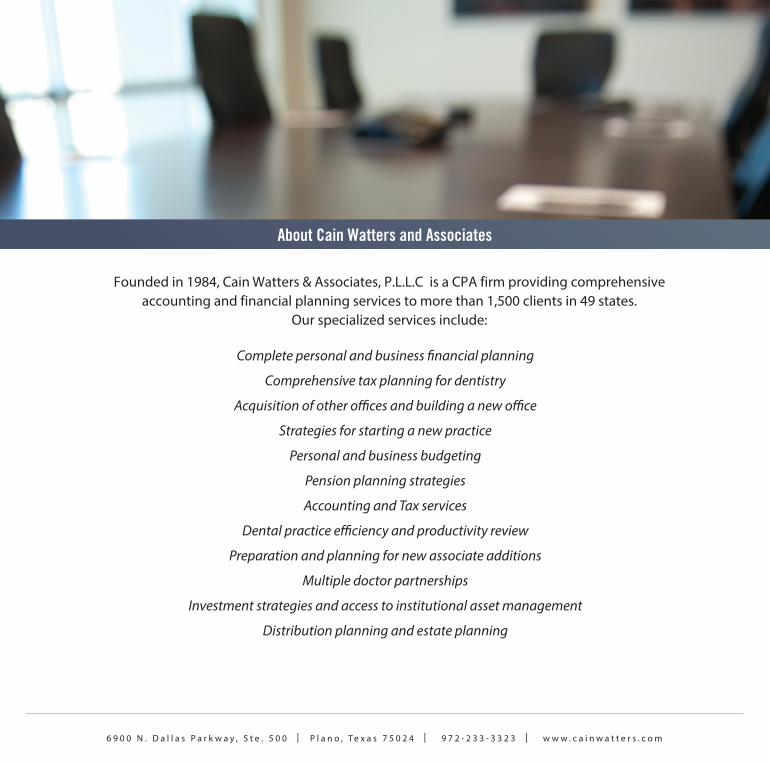
About Cain Watters and Associates
Complete personal and business financial planning
Comprehensive tax planning for dentistry
Acquisition of other offices and building a new office
Strategies for starting a new practice
Personal and business budgeting
Pension planning strategies
Accounting and Tax services
Dental practice efficiency and productivity review
Preparation and planning for new associate additions
Multiple doctor partnerships
Investment strategies and access to institutional asset management
Distribution planning and estate planning
Founded in 1984, Cain Watters & Associates, P.L.L.C is a CPA firm providing comprehensive accounting and financial planning services to more than 1,500 clients in 49 states.
Our specialized services include:
6 9 0 0 N . D a l l a s P a r k w a y , S t e . 5 0 0 I P l a n o , T e x a s 7 5 0 2 4 I 9 7 2 - 2 3 3 - 3 3 2 3 I w w w . c a i n w a t t e r s . c o m
CWA Brochure Concept 8x8 NG.indd 23 1/12/15 7:52 PM

For more information, please contact our New Client Services Team:
Charles [email protected]
Kaitlin [email protected]
www.cainwatters.com
Dental Practice Comparison information was compiled utilizing data from current accounting clients of Cain Watters & Associates P.L.L.C. (CWA) to produce the average result presented. Accounting clients are also clients who have engaged CWA for financial planning services. Prospective clients should not infer their practice will have similar results solely by becoming clients of CWA. Many managerial, economic, geographic, and industry specific conditions could materially affect the results seen by any specific practice. This Dental Practice Comparison document was prepared by CWA only for informational and comparative use by owners of a dental practice. This document should not be reproduced or distributed by anyone other than CWA. No other use or other business purpose by a third party is authorized and is expressly not permitted without the express written consent of CWA. CWA is an Investment Advisor registered with the Securities and Exchange Commission. No client or prospective client should assume that any information presented herein is receipt of, or a substitute for, personalized financial planning consulting advice. Financial planning consulting advice can only be rendered after the following conditions are met: 1. Delivery of our form ADV Part 2A to you; 2. Execution of an Investment Advisory and/or Financial Planning Engagement Letter between us.
CWA Brochure Concept 8x8 NG.indd 24 1/12/15 7:52 PM


![Fall 2000CWatters1 Technology for e-Commerce Overview Dr. Carolyn Watters watters@cs.dal.ca [watters/ottawa]](https://img.pdfslide.us/doc/110x75/56649f455503460f94c66b2f/fall-2000cwatters1-technology-for-e-commerce-overview-dr-carolyn-watters-watterscsdalca.jpg)