Embed Size (px)
Citation preview
How Does Gender
Diversity on Corporate
Boards Affect the Firm
Financial Performance?
An Empirical Investigation of Swedish OMX-
listed Firms
University of Gothenburg
School of Business, Economics and Law
Bachelor thesis in Financial Economics
Autumn 2015
Authors: Marcus Alm and Jonathan Winberg
Supervisor: Moursli Mohamed-Reda
2016-01-08

1
Acknowledgements
We are grateful for the support from our supervisor Moursli Mohamed-Reda and want to
extend our gratitude for letting us base this thesis on his hand collected data regarding board
members. Further, we want to thank Jan Feld for giving us the econometric tools needed to
conduct this study.
Gothenburg, January 2016
Marcus Alm and Jonathan Winberg
2
Abstract
The aim of this thesis is to determine whether gender diversity in corporate boards has an
impact on firm financial performance of Swedish OMX-listed firms. The study is conducted
in Sweden, as there is frequent political pressure of a board gender quota, but no major
research to base the discussion on. Previous research finds both positive and negative
relationship between firm financial performance and the female gender variable; depending
on market studied, time period and political climate. A common finding is that gender
diversity has no impact on financial performance. Our study is based on panel data for 255
companies over a period of six years. We find that there is not a statistically significant
relationship between neither ROA nor Tobin’s Q and the female gender variable; which
indicates that no clear link can be seen in the gender diversity-performance relationship.
Keywords: Board Diversity, Corporate Governance, Financial Performance, Board
Composition, Gender Diversity
3
Table of Contents 1. Introduction ............................................................................................................................ 4
2. Literature Review ................................................................................................................... 6
2.1 Theoretical Part ................................................................................................................ 6
2.1.1 Resource Dependence Theory .................................................................................... 6
2.1.2 Human Capital Theory .............................................................................................. 6
2.1.3 Agency Theory ........................................................................................................... 7
2.1.4 Social Psychological Theory ...................................................................................... 7
2.2 Empirical Part .................................................................................................................. 8
3. Hypothesis .............................................................................................................................. 9
4. Data Analysis ....................................................................................................................... 11
4.1 Data Collection ............................................................................................................... 11
4.2 Situation of Females on Corporate Boards .................................................................... 11
4.3 Descriptive Statistics ...................................................................................................... 14
4.4 Dependent Variables ...................................................................................................... 14
4.5 Independent Variable of Primary Interest ...................................................................... 15
4.6 Control Variables ........................................................................................................... 15
5. Methodology ......................................................................................................................... 16
5.1 Panel Data and Fixed Effects ......................................................................................... 16
5.2 Endogeneity .................................................................................................................... 16
5.3 Instrumental Variables (IV) ............................................................................................ 17
5.4 Model .............................................................................................................................. 18
5.5 Diagnostic Tests ............................................................................................................. 19
5.5.1 Breusch-Pagan/Cook-Weisberg Test for Heteroscedasticity ................................... 19
5.5.2 Breusch-Godfrey Test for Serial Correlation .......................................................... 19
5.5.3 Durbin-Wu-Hausman Test of Endogeneity .............................................................. 19
6. Results .................................................................................................................................. 22
7. Conclusion ............................................................................................................................ 28
Bibliography ............................................................................................................................. 30
Appendix ................................................................................................................................... 33
4
1. Introduction
Improvements in corporate governance is a widely discussed topic around the world as
demographics is evolving to become more diverse, the foundation of this contemporary
discussion is due to that this trend has been not been followed; neither in management nor in
boardrooms for the larger corporations (Carter et al., 2010). Due to the lacking progress,
sixteen countries in different parts of the world now require quotas to increase the number of
women in the boardroom and many have voluntary quotas in their corporate governance
codes (Rhode and Packel, 2015). Norway is among the frontrunners, already in 2003 having
passed a law where at least 40 % of the boards is to be composed of women by 2008 (Børen
and Strøm, 2010). Even though no legislation is yet in place in Sweden, the issue of women
on boards has gotten an increasing amount of attention; with plenty of political pressure for
companies to improve the situation or follow in Norway´s footsteps with legal actions
(Lindén, 2014). High profile politicians, like former Swedish Minister of Finance, Anders
Borg, declares that the board composition in Sweden, currently consisting of 24 % women is
unacceptable. Borg continues with; unless the fraction of women on corporate boards
increase, Sweden is going towards a legal quota (Andersson, 2013). The situation with legal
actions occurs as the leaders of the listed cooperation’s are not always equally convinced of a
positive diversity-performance relationship. As an example, Herman Bulls, former CEO of
Real Estate Advisory Group and a director for Comfort Systems USA, states that: “When I’m
sitting in that boardroom, my fiduciary responsibility is to the shareholders of that company –
not social engineering. I can talk about diversity. But there ought to be a business case”
(Dvorak, 2008). Even though decision makers and corporate leaders are not always
convinced, the general opinion in this debate and even an argument for legislations is often
that a gender diverse board is financially beneficial to a homogenous one (Egan, 2013).
Some of the most common arguments for gender diversity on the boardrooms are that women
are equally skilled as men but are not given the opportunity. Another argument is that boards
can enhance their effectiveness since women has unique skillsets and different thinking
compared to men (Adams and Ferreira, 2009). There is also research supporting these
arguments; for example Reguera-Alvarado et al. (2015) argues a positive relationship between
gender diversity on corporate boards and firm financial performance, as women are more risk
averse than men in addition to proposing less aggressive and more sustainable investment
strategies. However, further research presented by Carter et al. (2010) states that gender
5
diversity on corporate boards result in diverse opinions and critical thinking that makes
decision-making more time-consuming and less effective. Therefore, even though women
might have unique skillsets and offer different perspectives that argue financially beneficial, it
is not widely accepted in the specialized academic literature that the impact gender diversity
has on financial performance has to be positive. Prior studies associate gender diversity with
negative financial results, (Bøhren and Strøm, 2010), while some find positive results,
(Reguera-Alvarado et al., 2015) and some researchers even find that there is no link between
the two variables (Carter et al., 2010).
Based on the framework on previous studies, in this paper we are doing the first research on
Sweden where there is yet to be a publication on gender diversity on financial performance.
We are answering the question: does gender diversity on the corporate boards affect the
financial performance of Swedish OMX-listed firms? We are also investigating the impact of
female leadership and the result it has on firm financial performance. Finally, we are
exploring the fraction of ownership that females have compared to males and what influences
that has on the firm financial performance. We are by answering these questions providing a
foundation in the discussion in Sweden concerning board gender quotas. In order to do so, we
use both ordinary least square (OLS) regressions and two stage least square (2SLS)
regressions with panel data from 255 companies during a period of six years, both with robust
standard errors to correct the problem of heteroscedasticity. We especially analyze and
address the concern of endogeneity that occurs due to firm characteristic omitted variables,
unobserved variables and the issue of reverse causality due to the potential incentives to join
firms with a positive financial performance. The issues were resolved primarily using time-
and firm fixed effects, lagged variables and Instrumental Variables (IV). Overall, our result
shows that gender diversity on corporate boards on Swedish OMX-listed firms has no effect
on neither of our two measurement variables of financial performance, ROA and Tobin’s Q.
The structure of the paper is as follows: we examine the existing theories in the diversity-
performance relationship and present the existing empirical literature in section 2. In section 3
we present our hypothesis. Section 4 is the data analysis; starting with the situation of females
on corporate boards followed by descriptive statistics of all data collected. In section 5 we
present the methodology where we explain how we conduct the research, how we gather the
data and a variable explanation. Section 6 is a presentation of our regression results and
section 7 concludes the thesis. In the end we include an appendix section.
6
2. Literature Review
2.1 Theoretical Part
According to Carter et al. (2010), a corporate board of directors is commonly assumed to have
four areas of responsibilities: (i) monitoring and controlling managers; (ii) providing
information and council to managers; (iii) monitoring compliance with applicable laws and
regulations; as well as (iv) linking the corporation to the external environment (Carter et al.,
2010). The authors highlight composition of the board affects how these functions are
performed, and thus partially determines financial performance (Carter et al., 2010). To
comprehend the concept of the diversity-performance relationship, several theories have been
explored. In their influential work on the topic Terjesen et al. (2008), Carter et al. (2010) and
Mateos de Cabo et al. (2011) all argue that no single theory can fully explain the relationship
between board diversity and firm financial performance. Hence, they have all used the four
sub-theories: (i) resource dependence theory; (ii) human capital theory; (iii) agency theory;
and (iv) social psychological theory when explaining the complexity of this topic.
2.1.1 Resource Dependence Theory
Resource dependence theory discusses how external resources of the organization (Terjesen et
al., 2008) affect organizational behavior. Since corporate boards function as a link between
the company and external organizations, resource dependence theory plays an important role
when researching the relationship between the diversity of corporate boards and firm financial
performance (Hillman et al., 2002). Subsequently, as ethnic and gender diversity provides a
broader information set available for management in the decision making process; board
diversity can play an important part in the company’s financial performance (Carter et al.,
2010). Based on this, Carter et al. (2010) argue that the basis for some of the most convincing
theoretical arguments for a business case of board diversity can be found in resource
dependence theory.
2.1.2 Human Capital Theory
Human capital theory complements some of the concepts derived from resource dependence
theory as it discusses how the education, experience and skills of the human capital can
benefit the organizations (Carter et al., 2010). Based on this, Cartel et al. (2010) argue that
7
human capital theory is a key determinant in regards to the financial performance of
companies. As differences in gender also result in difference in the human capital, this theory
is highly relevant when discussing the diversity-performance relationship (Terjesen et al.,
2008). Human capital theory predicts that the performance of a corporate board will be
affected by board diversity in a number of ways but the direction of this effect can be both
positive and negative (Carter et al., 2010).
2.1.3 Agency Theory
A board’s role to monitor and control managers is a fundamental concept of agency theory
(Carter et al., 2003). Agency theory suggests that a diverse board frequently increases board
independence, which in turn increases the board’s ability to monitor the management.
However, even though more efficient monitoring of management might have a positive
impact on firm financial performance, on the contrary to resource dependence theory and
human capital theory, agency theory provides no clear link between board diversity and firm
financial performance (Carter et al., 2010).
2.1.4 Social Psychological Theory
Social psychological theory discusses group dynamics inside boardrooms, and predicts that
individuals who have a majority position have the potential to exert a disproportionate amount
of influence on group decisions (Mateos de Cabo et al., 2011). Therefore, according to the
social psychological theory, the minorities of a diverse set of board members may not
influence the decisions board (Carter et al., 2010). On the contrary, social psychological
theory also suggests that board diversity can have a positive impact on group dynamics by
encouraging different thinking. In turn, different ideas can have a positive impact on the
decision-making process and as a result a positive impact on an organization’s financial
performance (Westphal and Milton, 2000). However, Campbell and Minguez (2008) suggest
that a more gender diverse board can result in different, and thus critical thinking, which may
result in a decision making process that is both more time-consuming and less effective.
Opposing theories and results on social psychological theory suggest that board gender
diversity can have both positive and negative impact on financial performance (Carter et al.,
2010).
8
2.2 Empirical Part
The existing empirical evidence on the relationship between board diversity and firm financial
performance is inconclusive in the sense that very different results have been found. Results
have shown both positive, negative or no effect of diversity on financial performance.
Moreover, previous research has also shown that the diversity of the board has other
implications than its impact on financial performance, such as board director behavior and
risk taking.
Adams and Ferreira (2009) studied the relationship between corporate board diversity and
firm financial performance in the US. They found both positive and negative relationships
between board gender diversity and financial performance. The positive impact a gender
diverse board had on firm financial performance was in companies with weak governance;
measured in takeover defenses while they had negative impact on companies with stronger
governance; also measured in takeover defenses. Thus, they concluded that there is no reason
to support gender quota legislation. This somewhat contradicts prior research for the US by
Carter et al. (2010), who find that neither ethnicity nor gender had an impact on financial
performance. Carter et al. (2010) do however agree with Adams and Ferreira (2009) that there
is no reason to support gender quotas. Francoeur et al. (2008) study the diversity-performance
relationship while considering risk; they also found that the impact board diversity had on
financial firm performance showed different results depending on the companies’ situation.
They find that females had a positive impact on companies operating under difficult
circumstances with a larger risk of failure. However, they also find that companies with a high
proportion of females in the boardrooms usually did not create excess return, but managed to
keep pace with the stock market index. They concluded that women might have a positive
impact on financial firm performance as they argue that women might be given circumstances
that are more difficult to start with.
A study on the relationship between corporate board diversity and firm financial performance
is conducted in by Fan (2012) in Hong Kong who researched companies listed on the Hong
Kong stock exchange. She researched both gender and nationality of the boards and found
some support for a diverse board to likely have a better both firm performance and firm
independence. However, the findings varied depending on the different proxy measurements
of board diversity. Reguera-Alvarado et al. (2015) when researching companies on the
9
Madrid stock exchange find that women increased the financial performance of the firms due
to new ideas, views and skills. They also argued that women on boards provided social
visibility and attraction of human talent. An important aspect of the findings by Reguera-
Alvarado et al. (2015) is that it, on the contrary to the previously mentioned research, is a
follow up on the already implemented law of 40 % females in the boardrooms, and thus a
larger proportion of females in the sample.
A more relevant study to the situation in Sweden is the Norwegian study led by Bøhren and
Strøm (2010). However, on the contrary to Sweden they researched gender diversity´s impact
on financial performance in a country with an already implemented law of boardroom gender
quotas, Norway. They established a clear negative link in the diversity-performance
relationship when measured by the firm value. Based on their findings they argue that
politicians should encourage less gender diversity. They also discovered that employee
directors have a negative impact on creating firm value. Rose (2007) has conducted further
Scandinavian research on the subject in Denmark. This study is also of high importance as
Denmark is in a similar situation to Sweden, where the gender quota is not yet a law but
implemented in the code of corporate governance (Rose, 2007; Lindén, 2014). Contradictory
to the previous Scandinavian research they found no relationship between board diversity and
firm financial performance. Mateos de Cabo et al. (2011) who research
ed 612 European banks conduct one of the most comprehensive studies on the topic. They
found no clear link in the diversity-performance relationship; they did however find patterns
such as females tend to sit on the boards in low risk banks.
3. Hypothesis
Resource dependence theory and human capital theory both suggest that there can be a
positive relationship between gender diversity on corporate boards and financial performance,
but whether it is positive or not depends on a diverse set of circumstances. Agency theory and
social psychological theory has no clear suggestion whether the diversity-performance
relationship is positive or negative. Furthermore, the limited amount of empirical evidence
does not provide clear support for the direction of the link being positive or negative. As we
do not yet know the circumstances in Sweden and the fact that we want to test whether the
10
widely discussed gender quotas in the boardrooms has any substance in terms of financial
performance, our main hypothesis states that:
Hypothesis 1: All else being equal, the number of women on corporate boards does not affect
financial performance of Swedish OMX-listed firms.
The second hypothesis concerns board ownership, which is an extensively used variable when
researching board gender diversity on firm financial performance. Carter et al. (2010) argues
that board ownership result in a more involved board with better monitoring, which can be a
positive variable. However, they also argue that high ownership might result in an entrenched
board that does not support the interest of all stakeholders; thus takes a negative direction.
Adams and Ferreira (2009) also argue that board ownership can influence financial
performance both positively and negatively as too much monitoring can affect shareholder
value; however, the direction of the link depends on the shareholder rights. Further, they
argue that too much monitoring in a well-managed company can be counterproductive. Carter
et al. (2010), Adams and Ferreira (2009) and Reguera-Alvarado et al. (2015) all argue that a
gender diverse board increases monitoring, but finds no clear direction of the relationship on
the impact that the monitoring might have on financial performance. Therefore, our second
hypothesis regarding board ownership states that:
Hypothesis 2: All else being equal, female share ownership does not affect financial
performance of Swedish OMX-listed firms.
The third hypothesis concerns female leadership, in the case of this thesis, measured with
companies having either a female CEO or a female Chairman. The reason for including both
positions is due to the relative small number of CEO´s and Chairmen that are female in this
sample. In the previous research of board diversity on firm financial performance, the female
leadership variable is seldom considered, even as a control variable. We are unsure of whether
or not it is due to the low number of female leaders or simply not of interest. We believe
however, since we on the contrary to certain existing published papers on board diversity are
focusing only on gender; leadership would be an interesting variable to not only control for,
but to take into full consideration. In addition, based on the limited prior literature taking the
leadership variable into consideration, we hope to contribute to the research field by exploring
11
its significance. Francoeur et al. (2008) explore the effect women in top management has on
financial performance and find no overall clear link, therefore our third hypothesis states:
Hypothesis 3: All else being equal, female leadership does not affect financial performance of
Swedish OMX-listed firms.
4. Data Analysis
4.1 Data Collection
We collect data on firm financial performance from Thomson Reuter’s DataStream. Director
data is hand collected from Boards of Directors and Auditors in Sweden’s Listed Companies,
SIS Ägarservice. Ownership structure data is collected from Owners and Power in Sweden’s
Listed Companies, SIS Ägarservice. Data on ownership and compensation is collected from
corporate governance reports (annual reports). Our data includes Swedish firms traded
involving 255 firms from the Stockholm stock exchange Nasdaq OMX between years 2006
and 2011. Our sample consists of 10,315 director-firm-year observations.
4.2 Situation of Females on Corporate Boards
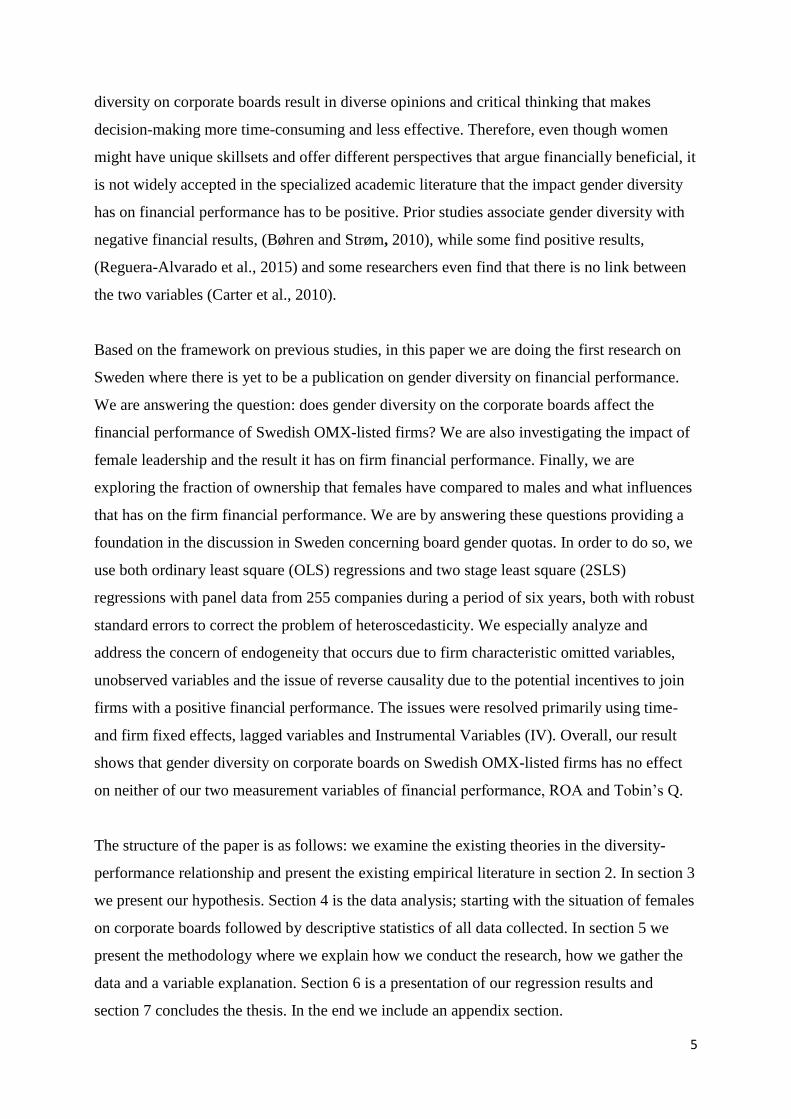
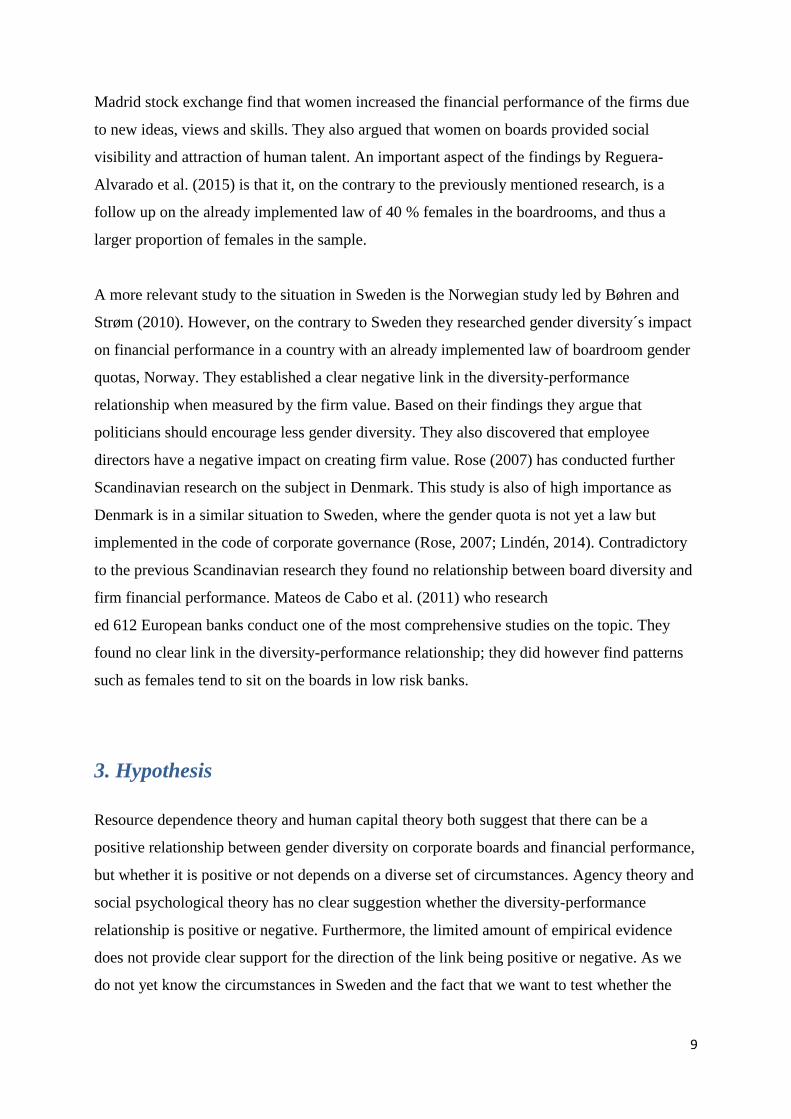
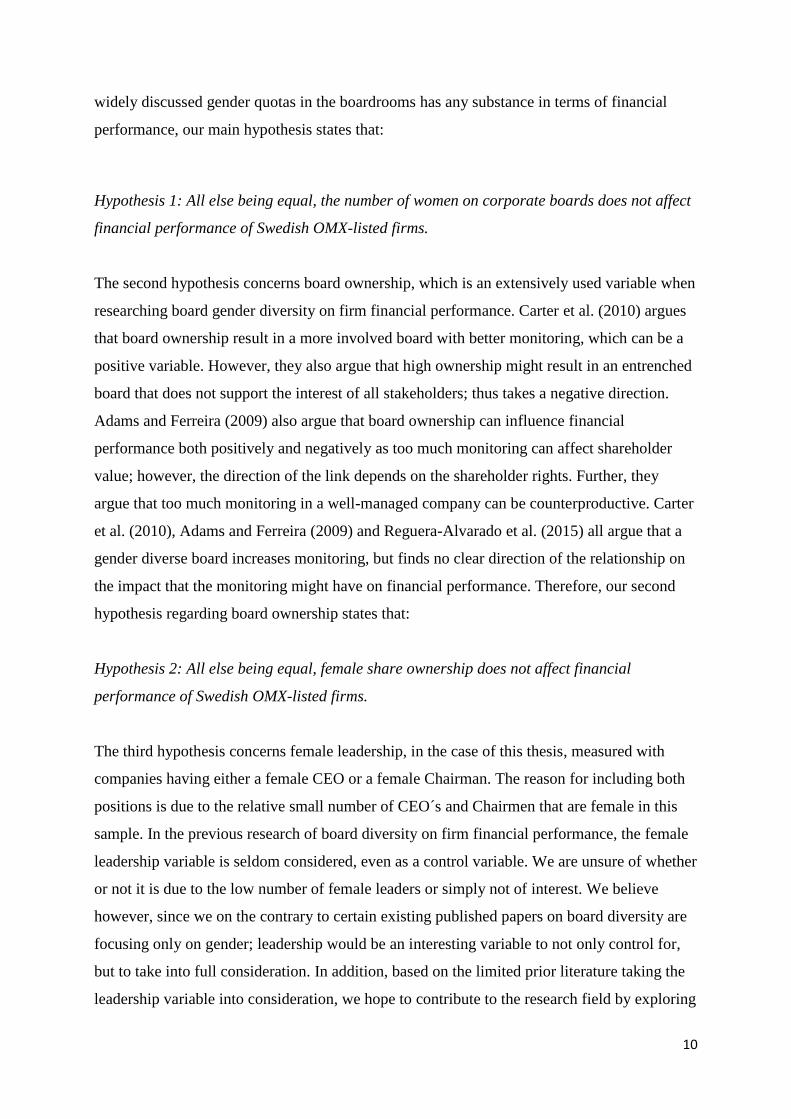
Figure 1 in Panel A shows the percentage of males and females on corporate boards. We can
see that the majority of the board members are male with 79.89 %, and only 20.11 % of the
board members are females. In 2013, Anders Borg stated that unless companies increased the
fraction of females on corporate boards; eventually Sweden is going towards a quota
(Andersson, 2013).
12
Figure 1 – Percentage Between the Genders on Boards and Percentage Between the Genders
Figure 1 in Panel B shows the percentage of female CEOs and Chairmen in Swedish
corporate boards. Panel B shows a much smaller fraction of females compared to Panel A.
96.25 % of the CEO’s or Chairmen in the data set are males and consequently 3.75 %
females.
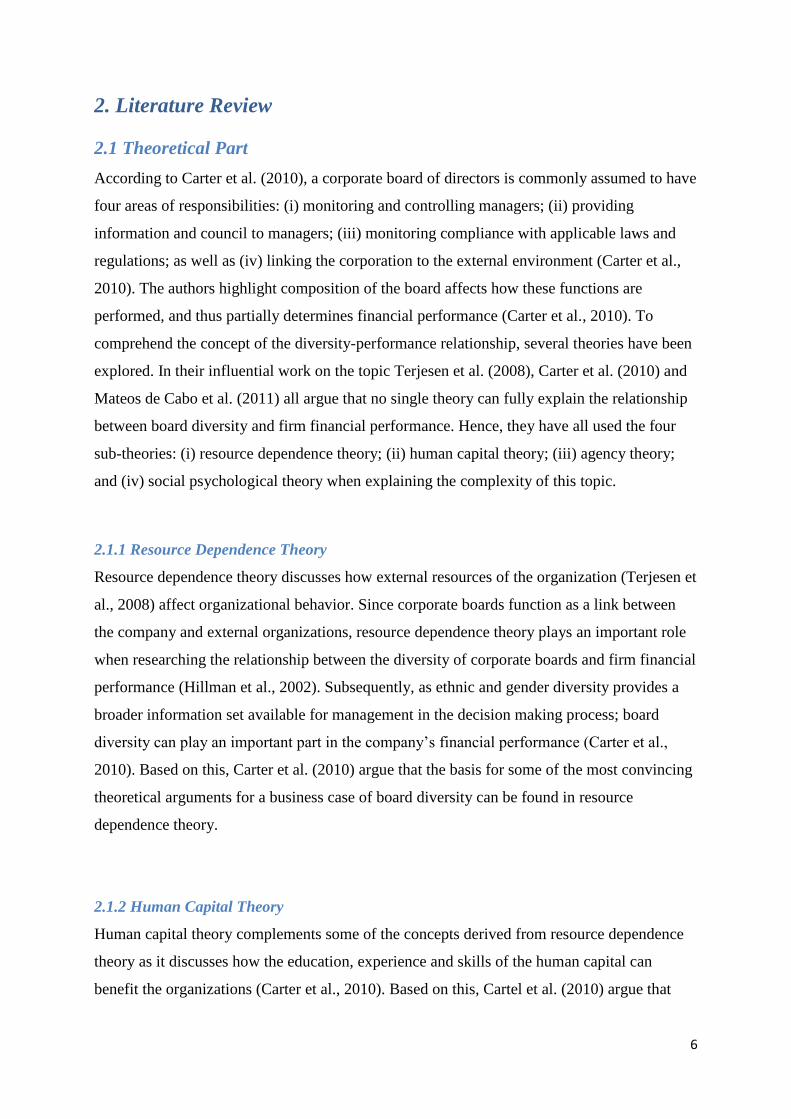
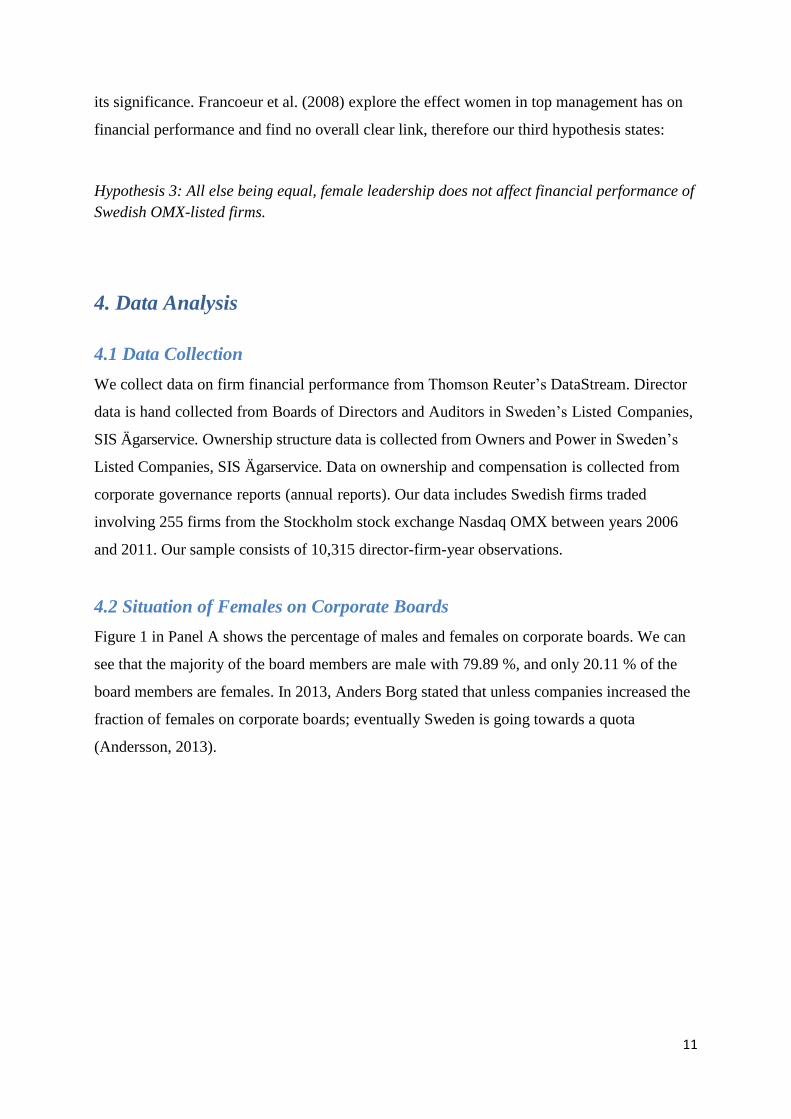
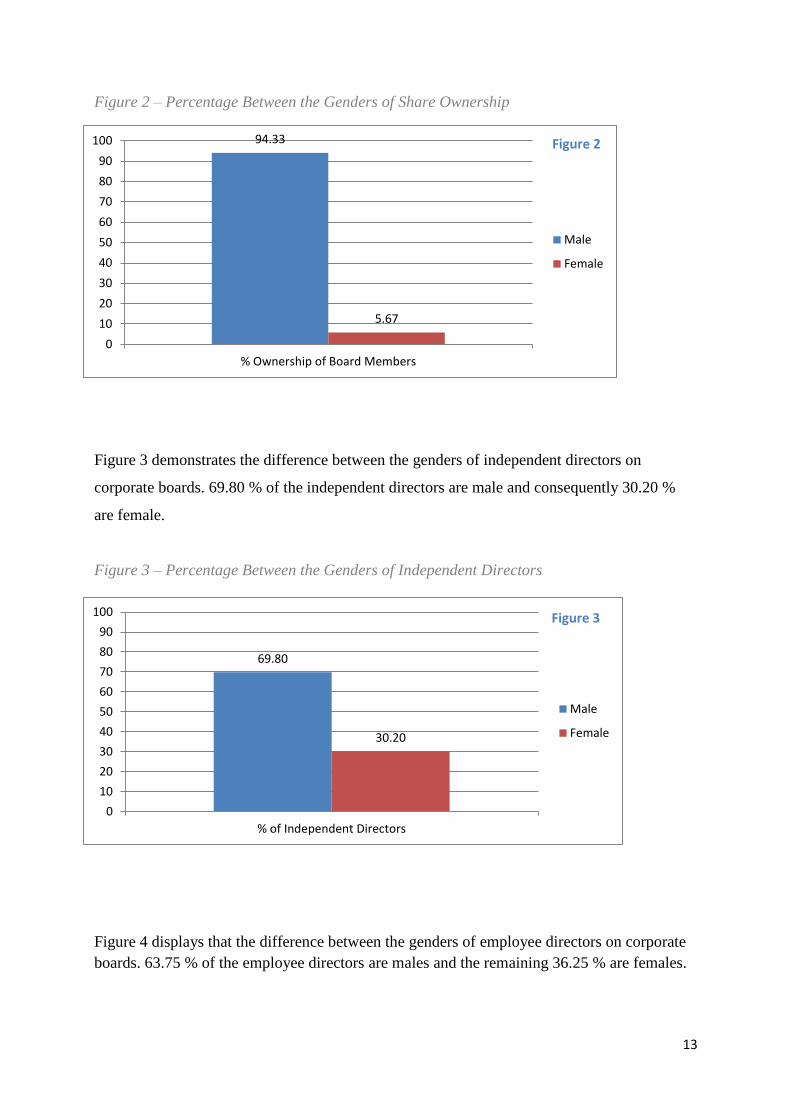
Figure 2 demonstrates the difference in share ownership between the genders on corporate
boards. Females own on average 5.67 % and consequently males own 94.33 % of the total
amount of shares owned by board members. We can conclude that females have neither
leadership roles nor the fraction of the share ownership that is representative for the 20.11 %
of the directorships on corporate boards that they hold. A reason for this proportion might be
that there is a vast majority of male CEO and Chairman, as shown in Panel B in Figure 1. We
removed the employee directors from the sample, as they have very limited influence in the
corporate boardrooms.
79.89
20.11
0
10
20
30
40
50
60
70
80
90
100
% of Board Members
Male
Female
96.25
3.75
0
10
20
30
40
50
60
70
80
90
100
% of Chairman or CEO on Boards
Male
Female
Panel A Panel B
Figure 1 Figure 1
13
Figure 2 – Percentage Between the Genders of Share Ownership
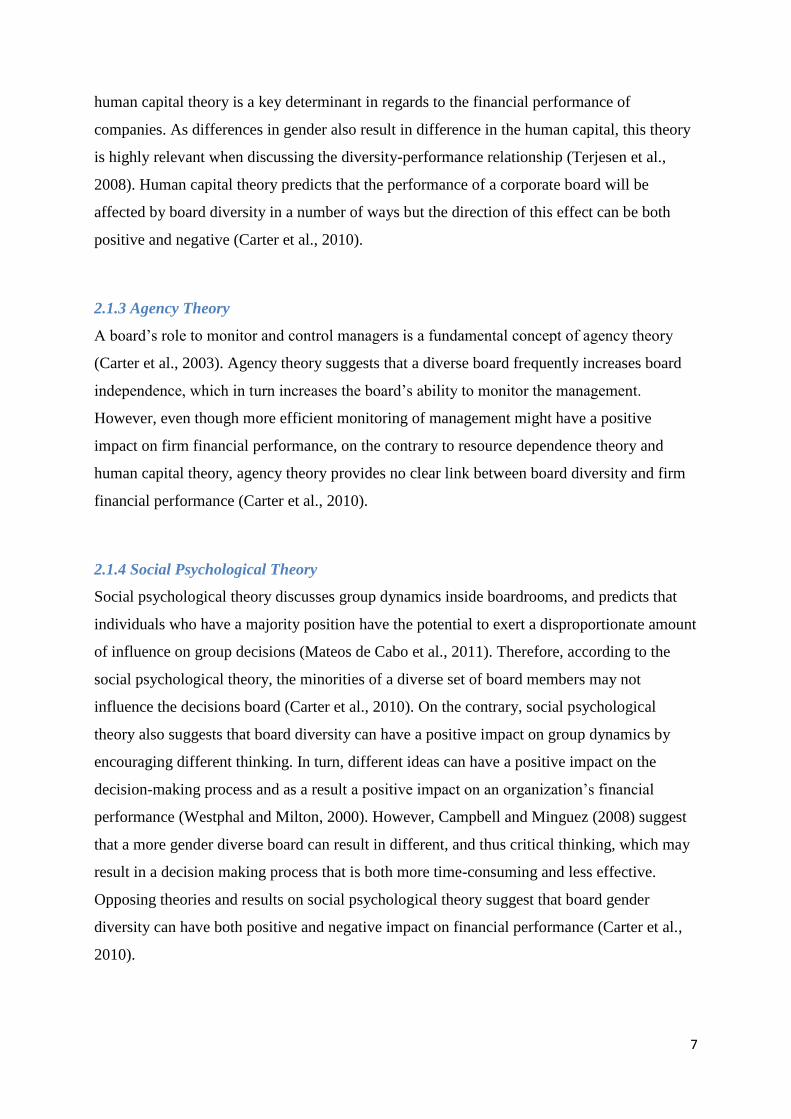
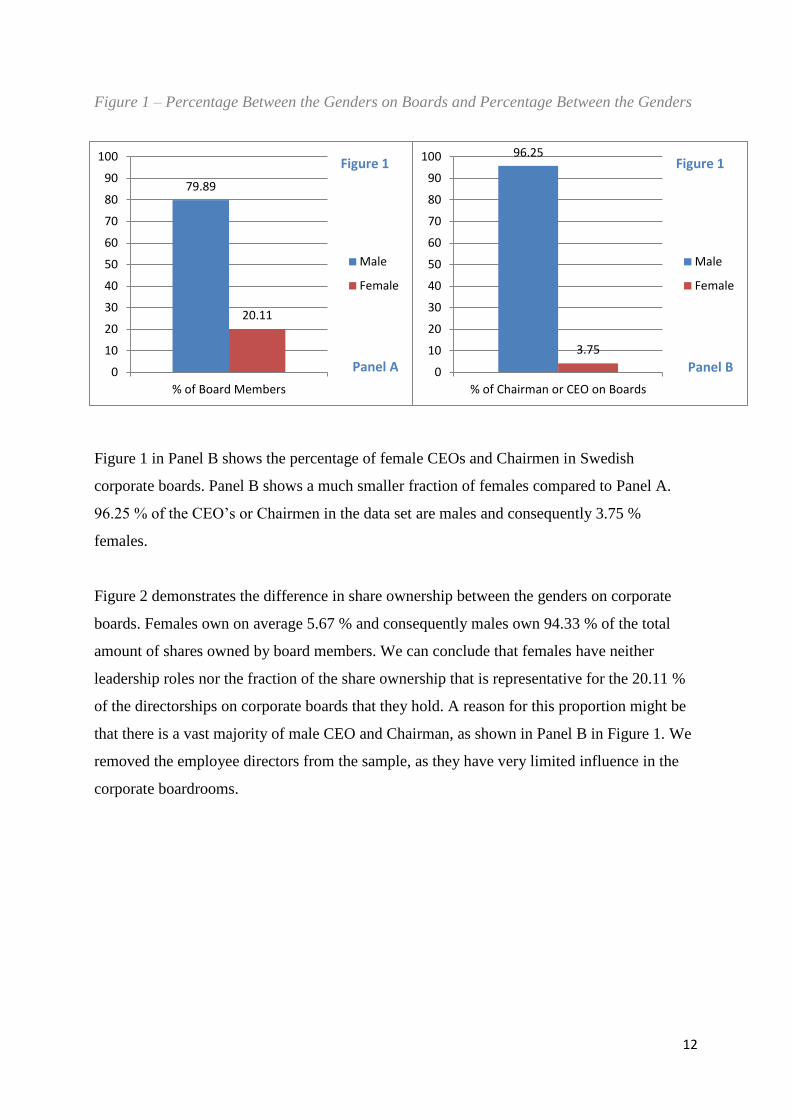
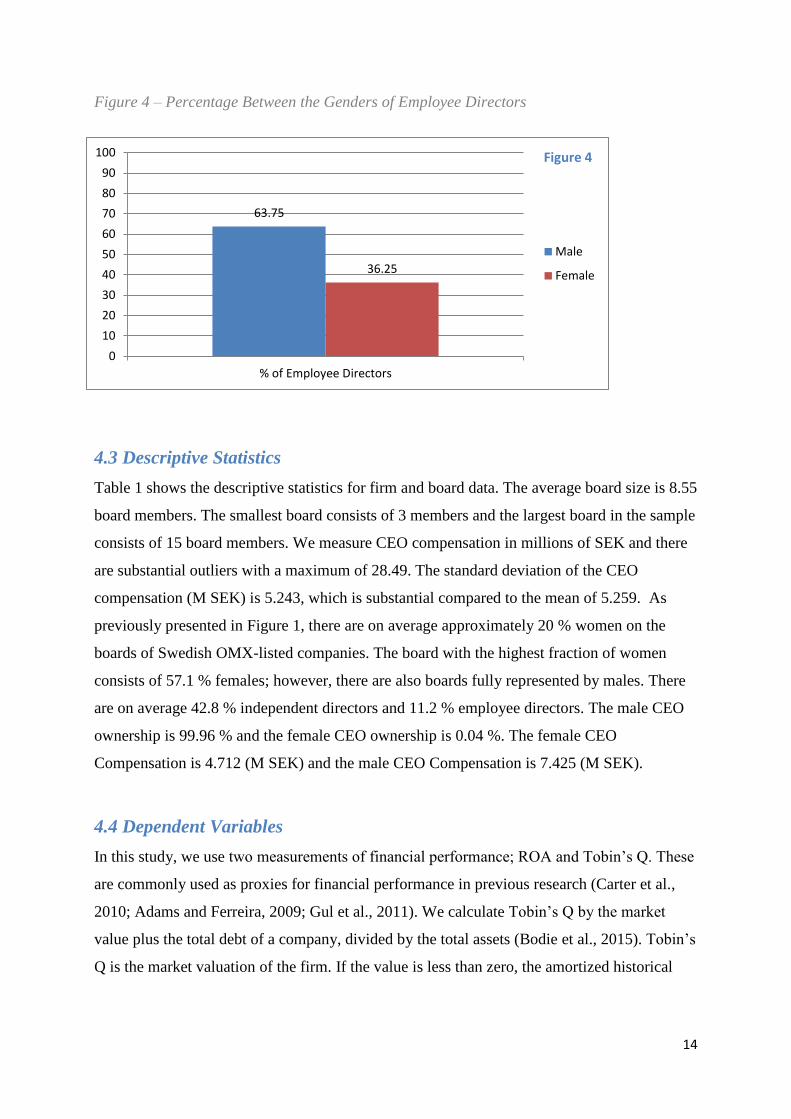
Figure 3 demonstrates the difference between the genders of independent directors on
corporate boards. 69.80 % of the independent directors are male and consequently 30.20 %
are female.
Figure 3 – Percentage Between the Genders of Independent Directors
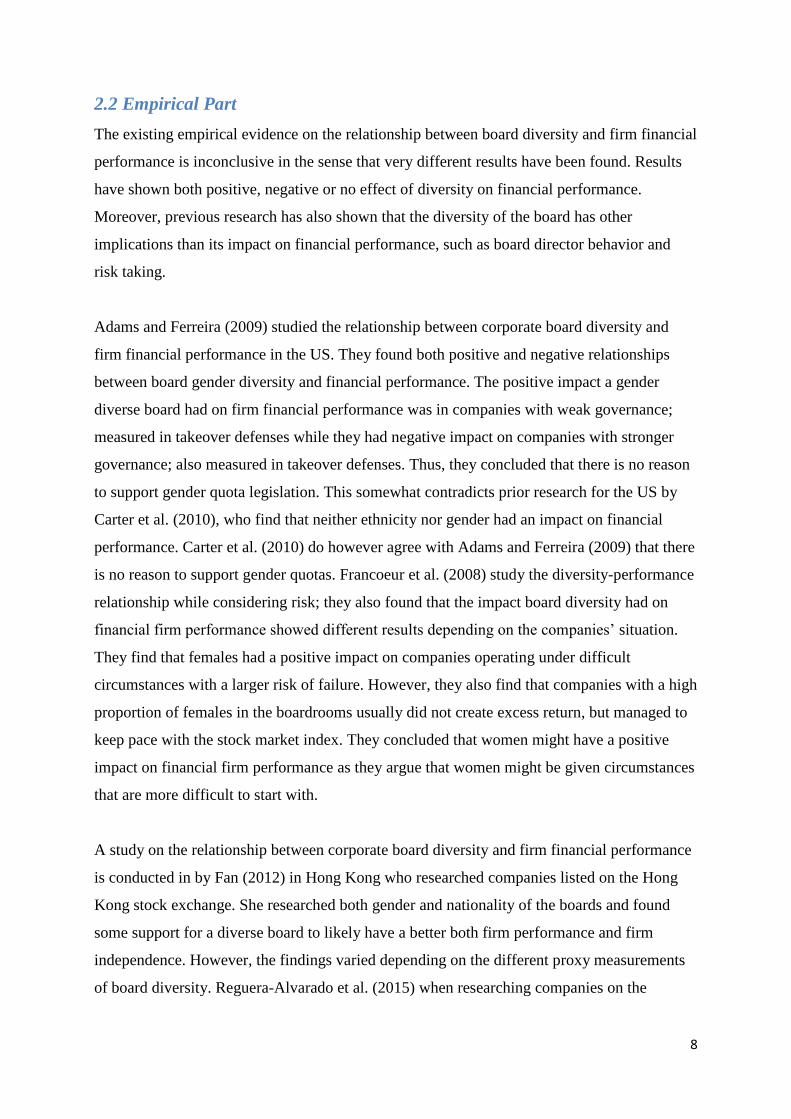
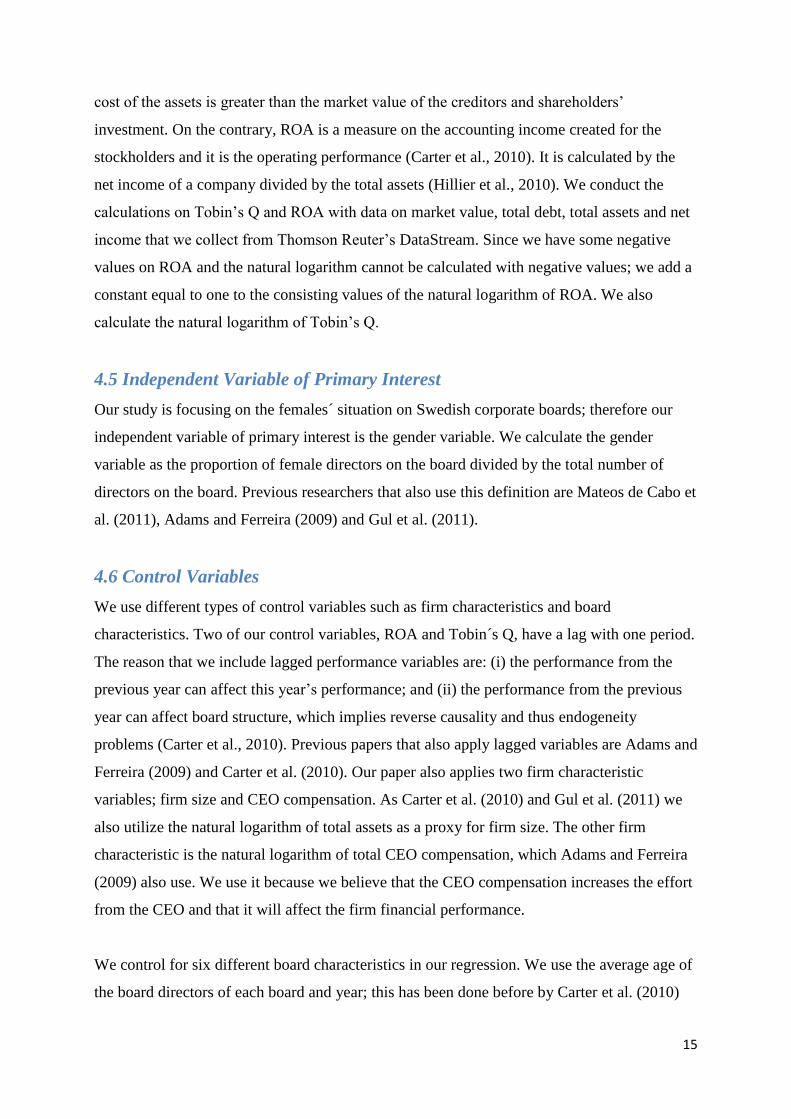
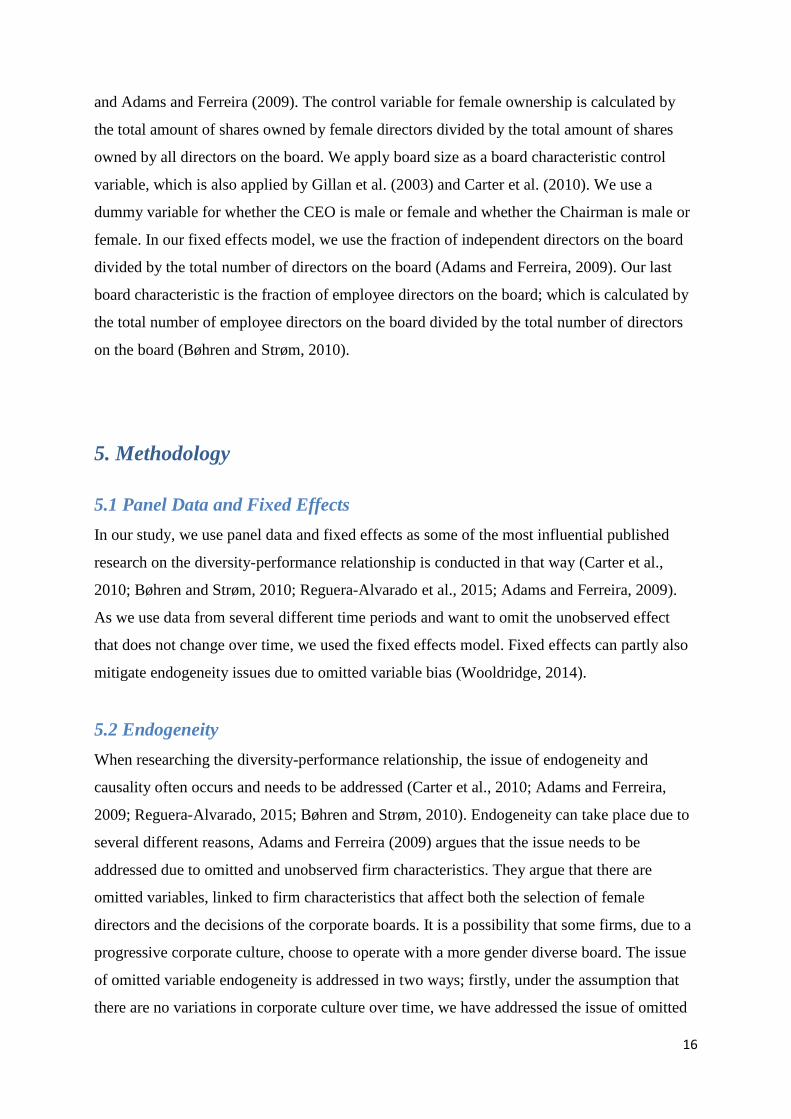
Figure 4 displays that the difference between the genders of employee directors on corporate
boards. 63.75 % of the employee directors are males and the remaining 36.25 % are females.
94.33
5.67
0
10
20
30
40
50
60
70
80
90
100
% Ownership of Board Members
Male
Female
Figure 2
69.80
30.20
0
10
20
30
40
50
60
70
80
90
100
% of Independent Directors
Male
Female
Figure 3
14
Figure 4 – Percentage Between the Genders of Employee Directors
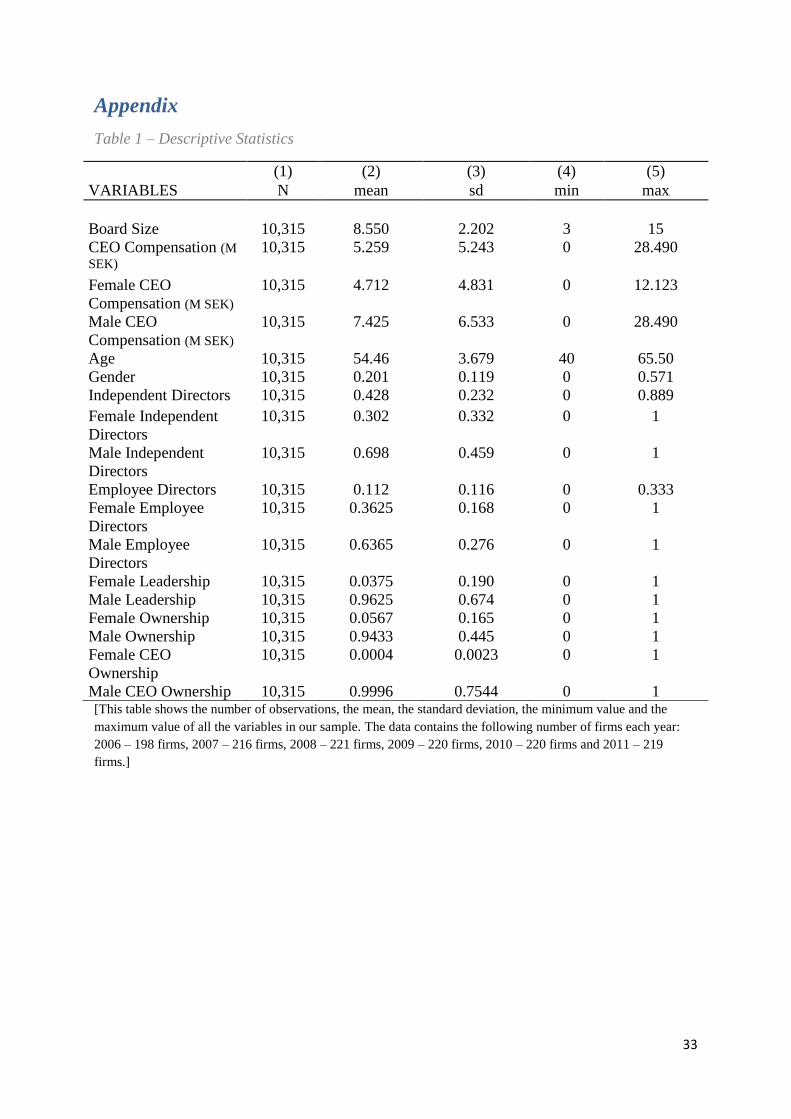
4.3 Descriptive Statistics
Table 1 shows the descriptive statistics for firm and board data. The average board size is 8.55
board members. The smallest board consists of 3 members and the largest board in the sample
consists of 15 board members. We measure CEO compensation in millions of SEK and there
are substantial outliers with a maximum of 28.49. The standard deviation of the CEO
compensation (M SEK) is 5.243, which is substantial compared to the mean of 5.259. As
previously presented in Figure 1, there are on average approximately 20 % women on the
boards of Swedish OMX-listed companies. The board with the highest fraction of women
consists of 57.1 % females; however, there are also boards fully represented by males. There
are on average 42.8 % independent directors and 11.2 % employee directors. The male CEO
ownership is 99.96 % and the female CEO ownership is 0.04 %. The female CEO
Compensation is 4.712 (M SEK) and the male CEO Compensation is 7.425 (M SEK).
4.4 Dependent Variables
In this study, we use two measurements of financial performance; ROA and Tobin’s Q. These
are commonly used as proxies for financial performance in previous research (Carter et al.,
2010; Adams and Ferreira, 2009; Gul et al., 2011). We calculate Tobin’s Q by the market
value plus the total debt of a company, divided by the total assets (Bodie et al., 2015). Tobin’s
Q is the market valuation of the firm. If the value is less than zero, the amortized historical
63.75
36.25
0
10
20
30
40
50
60
70
80
90
100
% of Employee Directors
Male
Female
Figure 4
15
cost of the assets is greater than the market value of the creditors and shareholders’
investment. On the contrary, ROA is a measure on the accounting income created for the
stockholders and it is the operating performance (Carter et al., 2010). It is calculated by the
net income of a company divided by the total assets (Hillier et al., 2010). We conduct the
calculations on Tobin’s Q and ROA with data on market value, total debt, total assets and net
income that we collect from Thomson Reuter’s DataStream. Since we have some negative
values on ROA and the natural logarithm cannot be calculated with negative values; we add a
constant equal to one to the consisting values of the natural logarithm of ROA. We also
calculate the natural logarithm of Tobin’s Q.
4.5 Independent Variable of Primary Interest
Our study is focusing on the females´ situation on Swedish corporate boards; therefore our
independent variable of primary interest is the gender variable. We calculate the gender
variable as the proportion of female directors on the board divided by the total number of
directors on the board. Previous researchers that also use this definition are Mateos de Cabo et
al. (2011), Adams and Ferreira (2009) and Gul et al. (2011).
4.6 Control Variables
We use different types of control variables such as firm characteristics and board
characteristics. Two of our control variables, ROA and Tobin´s Q, have a lag with one period.
The reason that we include lagged performance variables are: (i) the performance from the
previous year can affect this year’s performance; and (ii) the performance from the previous
year can affect board structure, which implies reverse causality and thus endogeneity
problems (Carter et al., 2010). Previous papers that also apply lagged variables are Adams and
Ferreira (2009) and Carter et al. (2010). Our paper also applies two firm characteristic
variables; firm size and CEO compensation. As Carter et al. (2010) and Gul et al. (2011) we
also utilize the natural logarithm of total assets as a proxy for firm size. The other firm
characteristic is the natural logarithm of total CEO compensation, which Adams and Ferreira
(2009) also use. We use it because we believe that the CEO compensation increases the effort
from the CEO and that it will affect the firm financial performance.
We control for six different board characteristics in our regression. We use the average age of
the board directors of each board and year; this has been done before by Carter et al. (2010)
16
and Adams and Ferreira (2009). The control variable for female ownership is calculated by
the total amount of shares owned by female directors divided by the total amount of shares
owned by all directors on the board. We apply board size as a board characteristic control
variable, which is also applied by Gillan et al. (2003) and Carter et al. (2010). We use a
dummy variable for whether the CEO is male or female and whether the Chairman is male or
female. In our fixed effects model, we use the fraction of independent directors on the board
divided by the total number of directors on the board (Adams and Ferreira, 2009). Our last
board characteristic is the fraction of employee directors on the board; which is calculated by
the total number of employee directors on the board divided by the total number of directors
on the board (Bøhren and Strøm, 2010).
5. Methodology
5.1 Panel Data and Fixed Effects
In our study, we use panel data and fixed effects as some of the most influential published
research on the diversity-performance relationship is conducted in that way (Carter et al.,
2010; Bøhren and Strøm, 2010; Reguera-Alvarado et al., 2015; Adams and Ferreira, 2009).
As we use data from several different time periods and want to omit the unobserved effect
that does not change over time, we used the fixed effects model. Fixed effects can partly also
mitigate endogeneity issues due to omitted variable bias (Wooldridge, 2014).
5.2 Endogeneity
When researching the diversity-performance relationship, the issue of endogeneity and
causality often occurs and needs to be addressed (Carter et al., 2010; Adams and Ferreira,
2009; Reguera-Alvarado, 2015; Bøhren and Strøm, 2010). Endogeneity can take place due to
several different reasons, Adams and Ferreira (2009) argues that the issue needs to be
addressed due to omitted and unobserved firm characteristics. They argue that there are
omitted variables, linked to firm characteristics that affect both the selection of female
directors and the decisions of the corporate boards. It is a possibility that some firms, due to a
progressive corporate culture, choose to operate with a more gender diverse board. The issue
of omitted variable endogeneity is addressed in two ways; firstly, under the assumption that
there are no variations in corporate culture over time, we have addressed the issue of omitted
17
firm characteristic variables by using fixed effects (Adams and Ferreira, 2009; Reguera-
Alvarado, 2015). Secondly, as Bøhren and Strøm (2010) points out, endogeneity concerns
such as omitted variables is and partly mitigated due to using panel data; which we also use in
this thesis and allows us to observe the same companies over a period of time.
Another major concern when studying the diversity-performance relationship is reverse
causality. Previous literature (Carter et al. 2010; Adams and Ferreira, 2009; Reguera-
Alvarado, 2015) have all addressed that it is likely that performance can have an effect on
both women’s incentives to join the company and the company’s willingness to increase the
amount of females on the corporate boards. In the case of this thesis, it means that the
dependent variables of firm financial performance might affect the independent variable of
primary interest, gender. To overcome this issue we have, just as when mitigating the omitted
variable concern, used two different methods. Firstly, just as Bøhren and Strøm (2010) we use
lagged performance variables as independent variables (lagged ROA and lagged Tobin’s Q).
This allows for performance persistence and for feedback from past performance to current
board composition. The second method we use to mitigate the reverse causality concern is to
follow the path of Carter et al. (2010), Adams and Ferreira (2009) and Reguera-Alvarado
(2015) and use instrumental variables (IV) and two-stage-least square (2SLS).
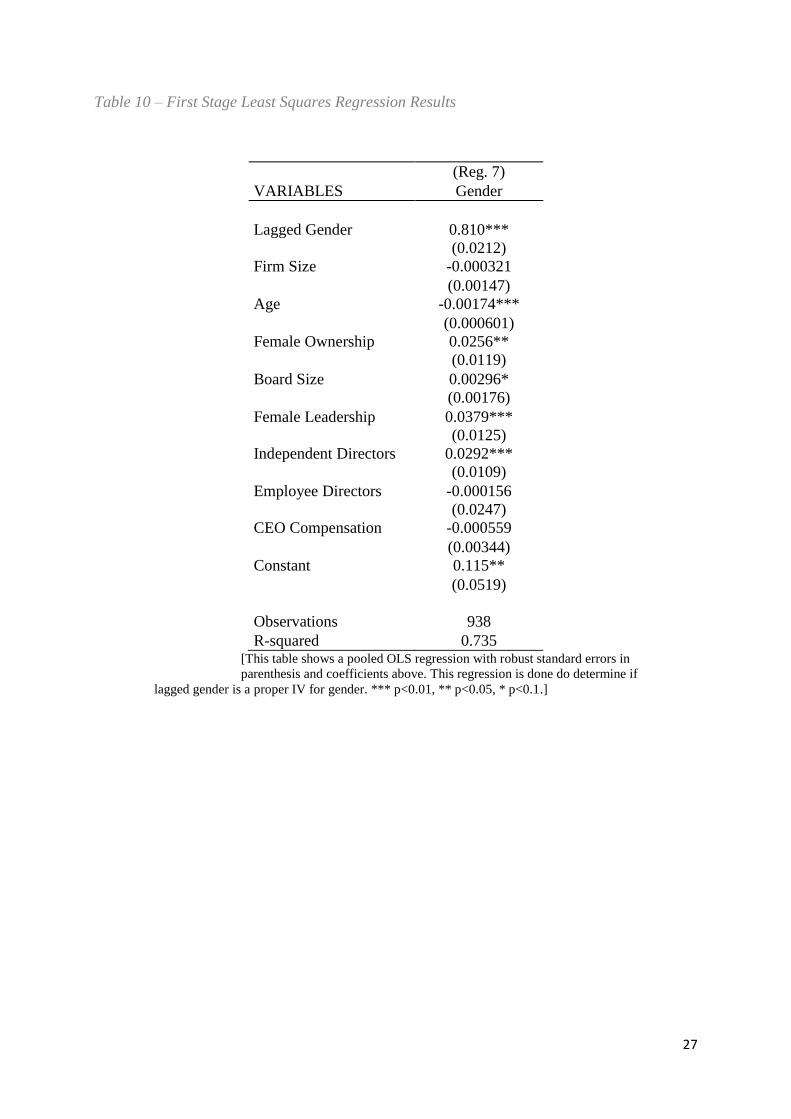
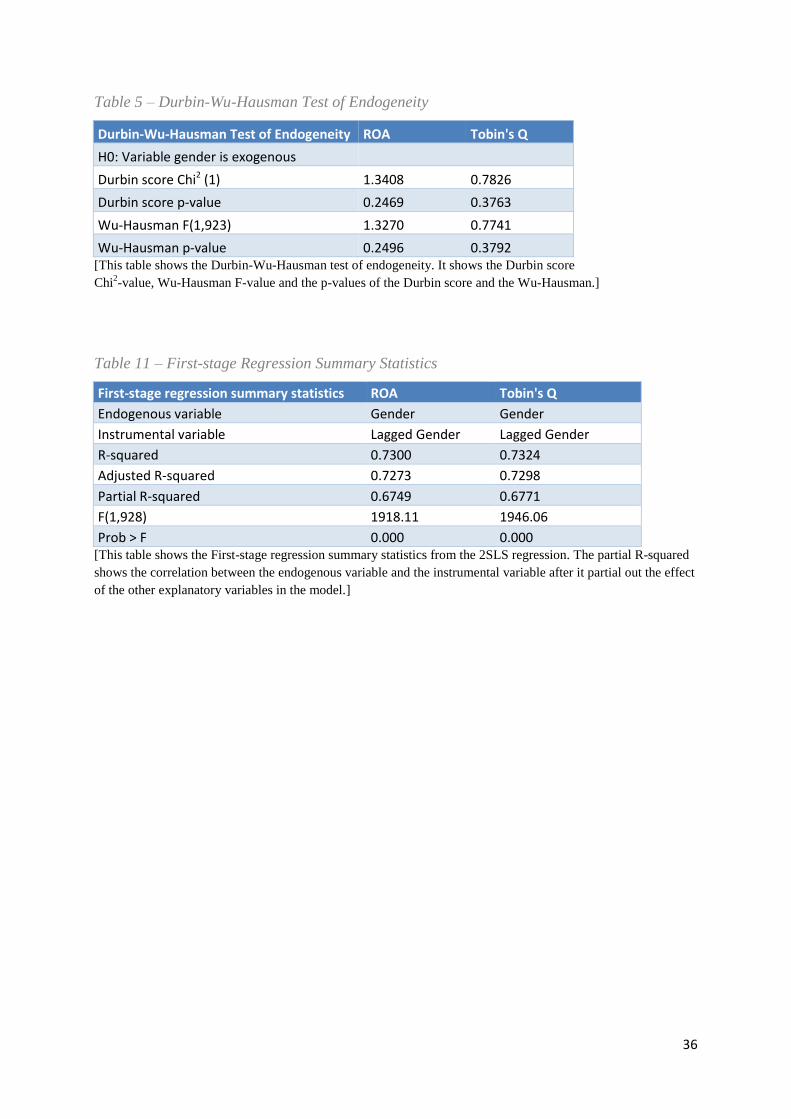
5.3 Instrumental Variables (IV)
In order to deal with the endogeneity and causality problems, we need to define instrumental
variables (IV) that correlate with the endogenous variable, but does not correlate with the
error term (Wooldridge, 2014). To find suitable instrumental variables, we examine Table 10.
There we can see that the lagged gender variable is statistically significant when the
dependent variable is gender, so we can conclude that lagged gender is a valid IV for gender.
The validness of the IV can also be determined by the results in Table 11. There we can see
that the lagged gender variable and gender have a partial R-squared of 0.6749 when ROA is
the dependent variable and a partial R-squared of 0.6771 when Tobin’s Q is the dependent
variable. The partial R-squared partial out the effect of the other explanatory variables and
shows the correlation between the endogenous variable, gender, and the instrumental variable,
lagged gender. The partial R-squared can take values between zero and one where a high
value is a condition for a valid IV, which means that the lagged gender variable is an effective
IV for the gender variable. We have also tested endogeneity for the independent variables
18
female leadership and female ownership. The lagged female ownership variable was
statistically significant when the female ownership was the dependent variable, which means
that it is a suitable IV for the female ownership variable. It is also validated with the partial R-
squared of 0.7465 when Tobin’s Q was the dependent variable and 0.7392 when ROA was the
dependent variable. The lagged female leadership variable was statistically significant when
the female leadership was the dependent variable, which means that it is a suitable IV for the
female leadership variable. We can determine that it is valid by the partial R-squared of
0.6001 when Tobin’s Q was the dependent variable and 0.5862 when ROA was the dependent
variable.
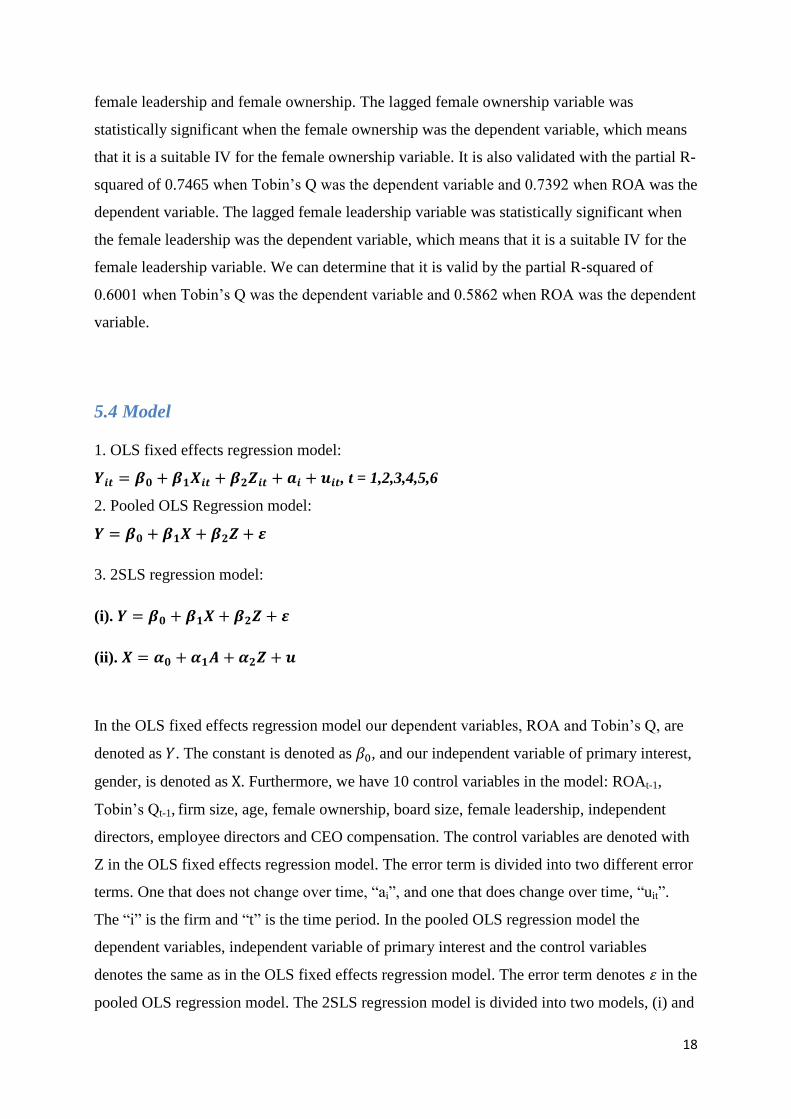
5.4 Model
1. OLS fixed effects regression model:
𝒀𝒊𝒕 = 𝜷𝟎 + 𝜷𝟏𝑿𝒊𝒕 + 𝜷𝟐𝒁𝒊𝒕 + 𝒂𝒊 + 𝒖𝒊𝒕, t = 1,2,3,4,5,6
2. Pooled OLS Regression model:
𝒀 = 𝜷𝟎 + 𝜷𝟏𝑿 + 𝜷𝟐𝒁 + 𝜺
3. 2SLS regression model:
(i). 𝒀 = 𝜷𝟎 + 𝜷𝟏𝑿 + 𝜷𝟐𝒁 + 𝜺
(ii). 𝑿 = 𝜶𝟎 + 𝜶𝟏𝑨 + 𝜶𝟐𝒁 + 𝒖
In the OLS fixed effects regression model our dependent variables, ROA and Tobin’s Q, are
denoted as 𝑌. The constant is denoted as 𝛽0, and our independent variable of primary interest,
gender, is denoted as X. Furthermore, we have 10 control variables in the model: ROAt-1,
Tobin’s Qt-1, firm size, age, female ownership, board size, female leadership, independent
directors, employee directors and CEO compensation. The control variables are denoted with
Z in the OLS fixed effects regression model. The error term is divided into two different error
terms. One that does not change over time, “ai”, and one that does change over time, “uit”.
The “i” is the firm and “t” is the time period. In the pooled OLS regression model the
dependent variables, independent variable of primary interest and the control variables
denotes the same as in the OLS fixed effects regression model. The error term denotes 𝜀 in the
pooled OLS regression model. The 2SLS regression model is divided into two models, (i) and
19
(ii). The notations in the 2SLS model in (i) is identical with the pooled OLS regression model.
The second part in the 2SLS model has the gender variable as the dependent variable, noted as
X. The constant in (ii) is noted as 𝛼0 and the instrumental variable, lagged gender is noted as
A. Furthermore, the control variables are denoted as Z and the error term is denoted as u.
5.5 Diagnostic Tests
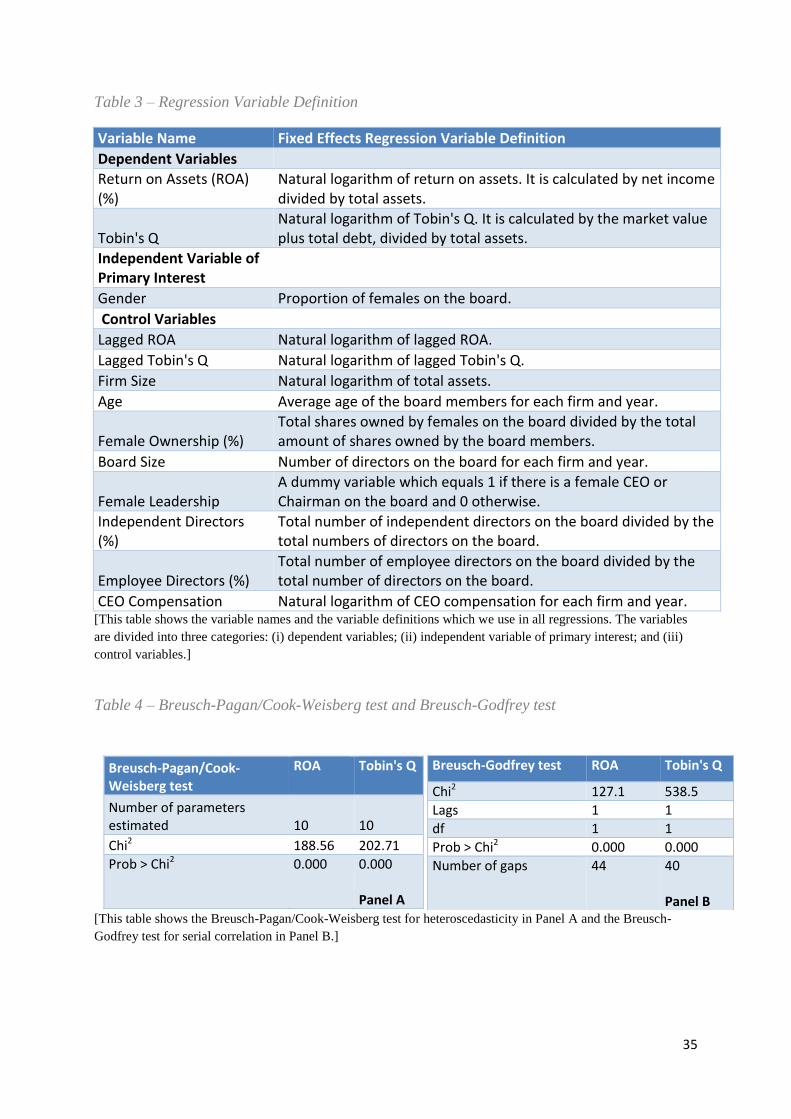
5.5.1 Breusch-Pagan/Cook-Weisberg Test for Heteroscedasticity
We use the Breusch-Pagan/Cook-Weisberg test to test for heteroscedasticity in the data set;
with that test, we can determine if the error term is normally distributed. When we conduct
the Breusch-Pagan/Cook-Weisberg test, we find that we have to reject the null hypothesis that
the error term is normally distributed, since the p-value is 0.000, and that there is
heteroscedasticity in the data set. In order to correct for the problem of heteroscedasticity, we
use robust standard errors in our OLS regressions (Wooldridge, 2014). The Breusch-
Pagan/Cook-Weisberg test is displayed in Table 4, in Panel A.
5.5.2 Breusch-Godfrey Test for Serial Correlation
We apply the Breusch-Godfrey test, to test whether there is serial correlation or not in the data
set. Due to our p-value, which is 0.000, there is strong evidence for serial correlation even at
the 1 % significance level. In order to correct for the serial correlation in our sample we use
robust standard errors in our OLS regressions (Wooldridge, 2014). The Breusch-Godfrey test
is presented in Table 4, in Panel B.
5.5.3 Durbin-Wu-Hausman Test of Endogeneity
Table 5 shows the Durbin-Wu-Hausman test of endogeneity which tests for endogeneity and
reverse causality. Examining Table 5, we can conclude that our independent variable of
primary interest, gender, does not have an endogeneity issue. This can be determined, as the
Durbin score p-value is 0.2469 and the Wu-Hausman p-value 0.2496 for ROA. For Tobin’s Q
the Durbin score p-value is 0.3763 and the Wu-Hausman p-value is 0.3792; which means that
we fail to reject the null hypothesis that the gender variable is exogenous (Wooldridge, 2014).
We also test for endogeneity in our independent variables female leadership and female
ownership. We find no endogeneity issue in either of the variables, although the test results
are not shown in the table below.
20
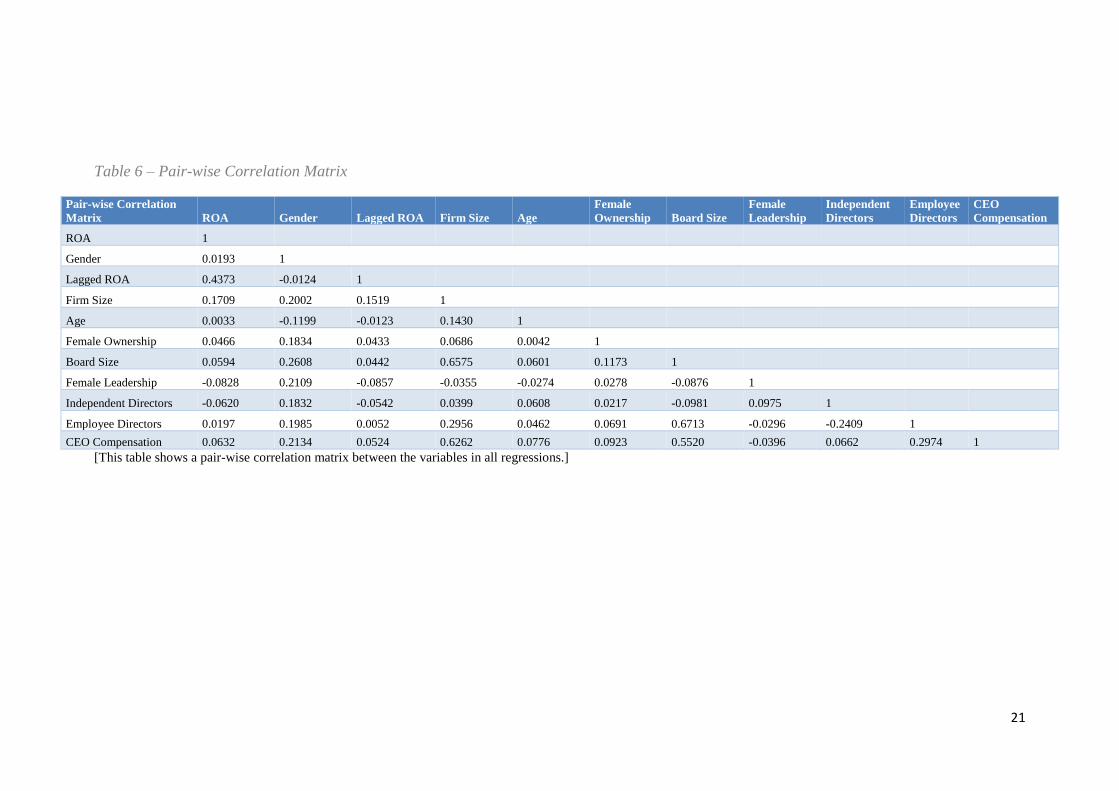
5.5.4 Pair-wise Correlation Matrix
To check for multicollinearity we construct a pair-wise correlation matrix. The pair-wise
correlation matrix shows the correlation between the independent variables. It can take values
from -1 to 1 where -1 is perfect negative correlation and 1 is perfect positive correlation. The
multicollinearity problem arises when the correlation between two variables exceeds 0.9. In
terms of the pair-wise correlation matrix, the highest correlation measured is 0.6713 which
takes place between the independent variables board size and employee directors. Therefore,
we can conclude that we do not have a problem with multicollinearity (Wooldridge, 2014).
Other pair-wise correlations that are noticeable are for example, the correlation between board
size and firm size is 0.6575. We expected a high correlation between these variables since the
board size would increase with firm size. Furthermore, the correlation between ROA and the
lagged ROA is 0.4373, which is expected as the financial performance from this year is most
likely affected by the performance from the previous year. The pair-wise correlation matrix is
presented in Table 6.
21
Table 6 – Pair-wise Correlation Matrix
Pair-wise Correlation
Matrix ROA Gender Lagged ROA Firm Size Age
Female
Ownership Board Size
Female
Leadership
Independent
Directors
Employee
Directors
CEO
Compensation
ROA 1
Gender 0.0193 1
Lagged ROA 0.4373 -0.0124 1
Firm Size 0.1709 0.2002 0.1519 1
Age 0.0033 -0.1199 -0.0123 0.1430 1
Female Ownership 0.0466 0.1834 0.0433 0.0686 0.0042 1
Board Size 0.0594 0.2608 0.0442 0.6575 0.0601 0.1173 1
Female Leadership -0.0828 0.2109 -0.0857 -0.0355 -0.0274 0.0278 -0.0876 1
Independent Directors -0.0620 0.1832 -0.0542 0.0399 0.0608 0.0217 -0.0981 0.0975 1
Employee Directors 0.0197 0.1985 0.0052 0.2956 0.0462 0.0691 0.6713 -0.0296 -0.2409 1
CEO Compensation 0.0632 0.2134 0.0524 0.6262 0.0776 0.0923 0.5520 -0.0396 0.0662 0.2974 1
[This table shows a pair-wise correlation matrix between the variables in all regressions.]
22
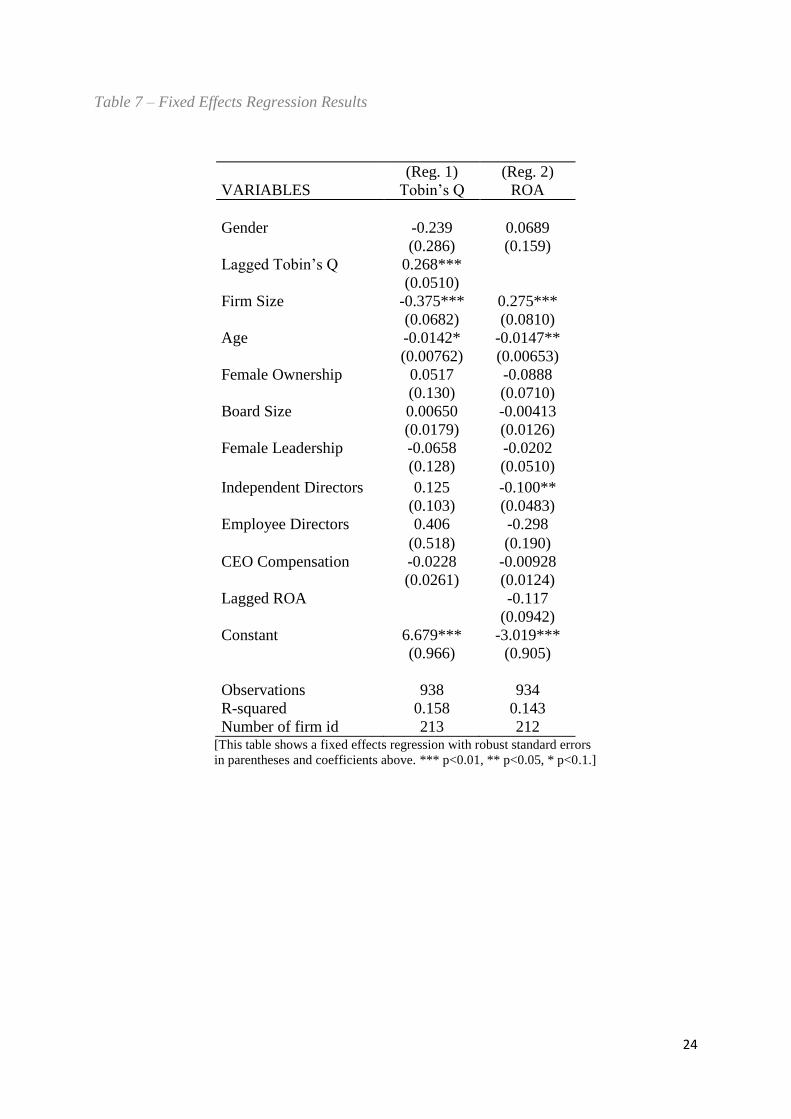
6. Results
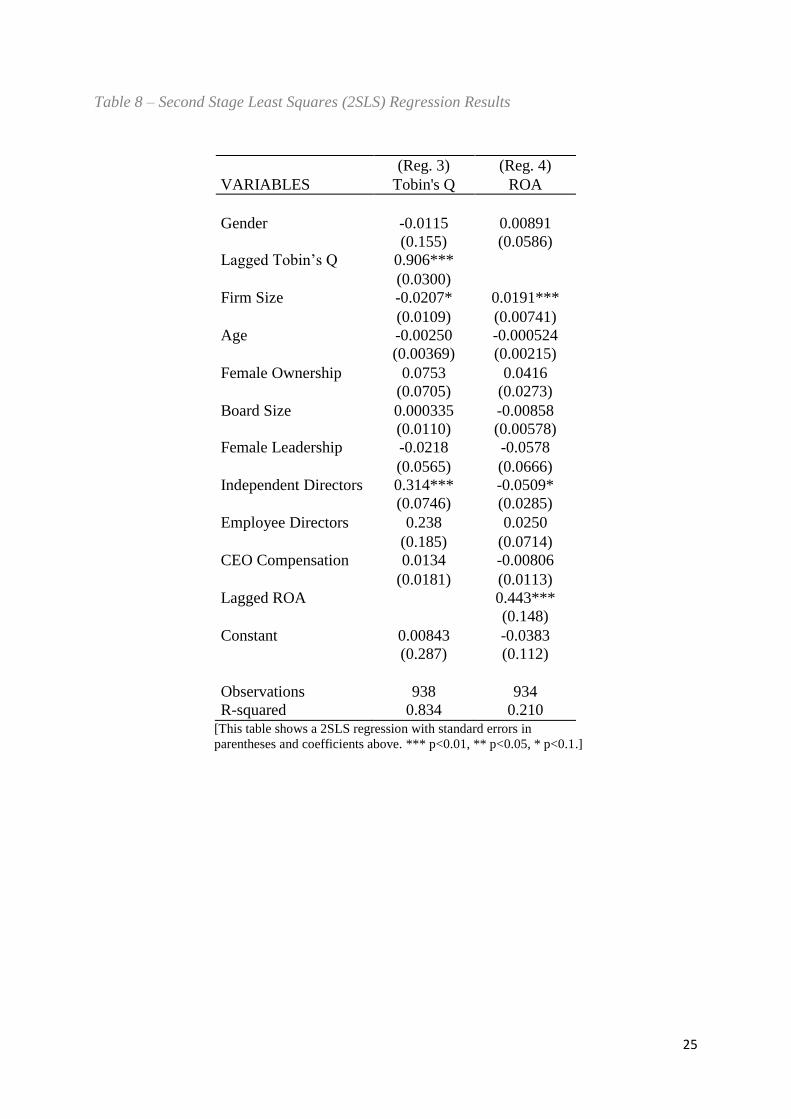
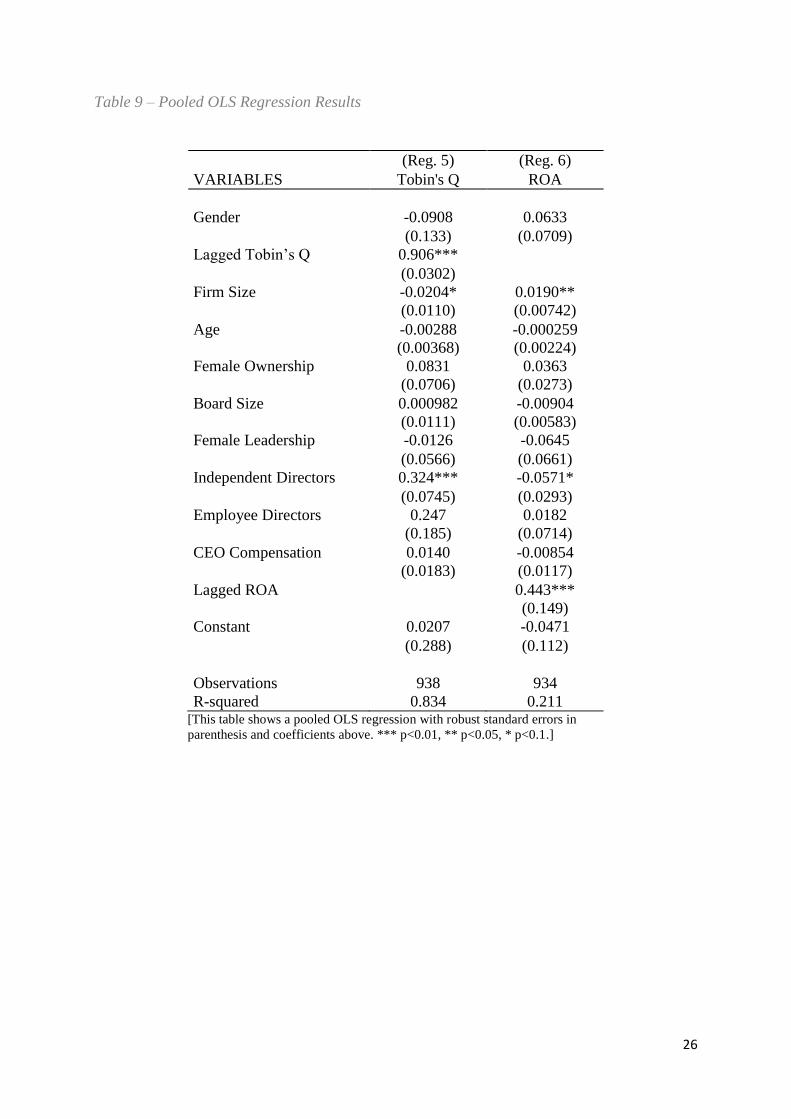
We present the results of the fixed effects regression in Table 7, the 2SLS regression in Table
8 and the pooled OLS regression in Table 9. As we can see, our independent variable of
primary interest, gender, is not statistically significant at the 1, 5 or 10 % significance levels
in any of the six regressions. At first sight when we considered the fixed effects regression,
we believed that the statistically insignificant result of the gender variable could depend on
the lack of variation over time. However, observing the 2SLS regression and the pooled OLS
regression where the gender variable also is statistically insignificant; that theory had to be
rejected. Instead we considered reverse causality issues, however when conducting the 2SLS
regression where we use lagged gender as an IV and gender as an endogenous variable; we
still find a statistically insignificant result. One of the reasons might be that board members
with a different background tend to assimilate into the more traditional behavior and adapt the
customs of the existing board members. This suggests that a minority, in this case females on
corporate boards, would in fact affect firm financial performance less than males. It might
even result in that females, in order to be appointed at the board in the first place, already
have adapted the behavior of the existing majority of the board members, males.
Consequently, the possible gains of having females on corporate boards would never be
reflected on the financial performance measurements’ (Rose, 2007). Based on this, we can
conclude that we fail to reject the null hypothesis that gender affects financial performance.
The female ownership variable is not statistically significant at any significance level, in any
of our six regressions. Certain theory suggests that an increased ownership of the board
member increases incentive to monitor (Carter et al., 2010). According to such theory, due to
female directors on average less ownership, they would have less incentive to monitor.
However, existing literature (Adams and Ferreira, 2009) also suggest that females tend to
monitor more than males; therefore, the result can be insignificant as females then might not
be as motivated by ownership as males. Furthermore, as board members might alter their
ownership in a company depending on financial performance, we suspect that there might be
a reverse causality issue, and thus utilize the lagged female ownership as an IV for the female
ownership variable. The female leadership variable is not significant in any of our regression
models. Since the result was insignificant in the fixed effects regression, we considered the
fact that there might be a lack of variation over time. However, we did not get significant
results in the 2SLS and the pooled OLS regression either; therefore, we had to reject that
23
theory. Furthermore, we found it of great importance to control for endogeneity in this
variable, especially reverse casualty as existing literature argues that females might be given
on average more difficult circumstances to start with. This would imply that females, for
being more risk averse, are given leadership roles in companies that are not performing well
(Francoeur et al., 2008). Their theory applied to our results suggests that females in fact could
affect financial performance positively, but it would not be noticed. Therefore, as financial
performance might affect the recruitment of females we utilize lagged female leadership as an
IV for female leadership. With all this being said, the reason for all three hypotheses not being
rejected can depend on that gender diversity simply does not affect firm financial performance
We find that all lagged variables, except lagged ROA in the fixed effects regression, are
statistically significant even at the 1 % significance level. We believe that there might be a
lack of variation in the lagged ROA in the fixed effects regression, which causes the
statistically insignificant result. Regarding firm size, we find that the variable is statistically
significant in all six regressions; however, the significance level differs between the
regressions. Firm size has a negative relationship with Tobin’s Q and a positive relationship
with ROA in all regressions. On the variable age, we can see that it is only statistically
significant in the fixed effects model, on both Tobin’s Q and ROA. We believe that the age
variable is statistically significant in the fixed effects regression, as the average age of the
board most likely changes frequently. The relationship is negative which indicates that there
might be financial benefits of having an on average younger board. The independent director
variable is statistically significant in the fixed effects regression, with ROA as the dependent
variable. On the contrary, the independent director variable is statistically significant, with
Tobin’s Q as the dependent variable in the 2SLS regression and with both financial
performance measurement tools in the pooled OLS regression. The direction of the
relationship is positive for Tobin’s Q and negative for ROA.
24
Table 7 – Fixed Effects Regression Results
(Reg. 1) (Reg. 2)
VARIABLES Tobin’s Q ROA
Gender -0.239 0.0689
(0.286) (0.159)
Lagged Tobin’s Q 0.268***
(0.0510)
Firm Size -0.375*** 0.275***
(0.0682) (0.0810)
Age -0.0142* -0.0147**
(0.00762) (0.00653)
Female Ownership 0.0517 -0.0888
(0.130) (0.0710)
Board Size 0.00650 -0.00413
(0.0179) (0.0126)
Female Leadership -0.0658 -0.0202
(0.128) (0.0510)
Independent Directors 0.125 -0.100**
(0.103) (0.0483)
Employee Directors 0.406 -0.298
(0.518) (0.190)
CEO Compensation -0.0228 -0.00928
(0.0261) (0.0124)
Lagged ROA -0.117
(0.0942)
Constant 6.679*** -3.019***
(0.966) (0.905)
Observations 938 934
R-squared 0.158 0.143
Number of firm id 213 212 [This table shows a fixed effects regression with robust standard errors
in parentheses and coefficients above. *** p<0.01, ** p<0.05, * p<0.1.]
25
Table 8 – Second Stage Least Squares (2SLS) Regression Results
(Reg. 3) (Reg. 4)
VARIABLES Tobin's Q ROA
Gender -0.0115 0.00891
(0.155) (0.0586)
Lagged Tobin’s Q 0.906***
(0.0300)
Firm Size -0.0207* 0.0191***
(0.0109) (0.00741)
Age -0.00250 -0.000524
(0.00369) (0.00215)
Female Ownership 0.0753 0.0416
(0.0705) (0.0273)
Board Size 0.000335 -0.00858
(0.0110) (0.00578)
Female Leadership -0.0218 -0.0578
(0.0565) (0.0666)
Independent Directors 0.314***
(0.0746)
-0.0509*
(0.0285)
Employee Directors 0.238 0.0250
(0.185) (0.0714)
CEO Compensation 0.0134 -0.00806
(0.0181) (0.0113)
Lagged ROA 0.443***
(0.148)
Constant 0.00843 -0.0383
(0.287) (0.112)
Observations 938 934
R-squared 0.834 0.210 [This table shows a 2SLS regression with standard errors in
parentheses and coefficients above. *** p<0.01, ** p<0.05, * p<0.1.]
26
Table 9 – Pooled OLS Regression Results
(Reg. 5) (Reg. 6)
VARIABLES Tobin's Q ROA
Gender -0.0908 0.0633
(0.133) (0.0709)
Lagged Tobin’s Q 0.906***
(0.0302)
Firm Size -0.0204* 0.0190**
(0.0110) (0.00742)
Age -0.00288 -0.000259
(0.00368) (0.00224)
Female Ownership 0.0831
(0.0706)
0.0363
(0.0273)
Board Size 0.000982 -0.00904
(0.0111) (0.00583)
Female Leadership -0.0126 -0.0645
(0.0566) (0.0661)
Independent Directors 0.324*** -0.0571*
(0.0745) (0.0293)
Employee Directors 0.247 0.0182
(0.185) (0.0714)
CEO Compensation 0.0140 -0.00854
(0.0183) (0.0117)
Lagged ROA 0.443***
(0.149)
Constant 0.0207 -0.0471
(0.288) (0.112)
Observations 938 934
R-squared 0.834 0.211 [This table shows a pooled OLS regression with robust standard errors in
parenthesis and coefficients above. *** p<0.01, ** p<0.05, * p<0.1.]
27
Table 10 – First Stage Least Squares Regression Results
(Reg. 7)
VARIABLES Gender
Lagged Gender 0.810***
(0.0212)
Firm Size -0.000321
(0.00147)
Age -0.00174***
(0.000601)
Female Ownership 0.0256**
(0.0119)
Board Size 0.00296*
(0.00176)
Female Leadership 0.0379***
(0.0125)
Independent Directors 0.0292***
(0.0109)
Employee Directors -0.000156
(0.0247)
CEO Compensation -0.000559
(0.00344)
Constant 0.115**
(0.0519)
Observations 938
R-squared 0.735 [This table shows a pooled OLS regression with robust standard errors in
parenthesis and coefficients above. This regression is done do determine if
lagged gender is a proper IV for gender. *** p<0.01, ** p<0.05, * p<0.1.]
28
7. Conclusion
The aim of this study is to investigate whether the composition of the corporate boards in
terms of gender affects the financial performance of Swedish OMX-listed firms. Further, we
want to determine whether the female share ownership have any impact on financial
performance. Finally, we are considering the impact on financial performance that might be
due to the company having a female Chairman or female CEO. By doing this, we hope to
present empirical evidence that can be utilized in the discussion regarding gender quotas on
Swedish corporate boards. We have an overall low level of significance in our regressions,
with an insignificant result on the independent variable of primary interest, gender. This result
suggests that diversity-performance relationship in terms of gender composition of the
corporate boards has no effects on the financial performance. Hence, we fail to reject our
primary hypothesis that gender diversity has no impact on firm financial performance. The
result of the second hypothesis was also insignificant, which means that we cannot reject that
female share ownership has no effect on firm financial performance. Finally, we also find an
insignificant result on our third hypothesis, which results in that we also fail to reject that
female leadership has no impact on firm financial performance. Yet, as listed in the result
section, there are factors that might influence the findings.
We find some statistically significant board- and firm characteristic variables that can be of
interest for corporate financial performance. Primarily, we can determine that age has a
negative relationship on both Tobin’s Q and ROA. Therefore, we can conclude that
companies might benefit financially from having an on average younger board. Firm size has
a statistically significant negative relationship with Tobin’s Q but a positive relationship with
ROA, even at the 1 % significance level. This finding indicates that, when conducting
research concerning the diversity-performance relationship, it can be both necessary and
useful to measure performance in several different ways. The final significant variable that we
have is the independent directors, however because the six regressions had very different
results, it is difficult to draw a valid conclusion of the actual effect.
The key findings were expected as it corresponds with our previously presented papers from
the US, France and Denmark. However, it differs from primarily South European and Asian
research that find either positive or negative statistically significant results in their research on
board diversity on financial performance. Our result also varies from Børen and Strøm (2010)
29
who find a negative link between females on corporate boards and firm financial
performance. We suspect that the results differ, as the law of the 40 % quota on females on
corporate boards was already implemented in Norway during the collection of their data. This
was also the reason why our main hypothesis was not based on the findings of Børen and
Strøm (2010). To conclude, the result of this thesis does not support the implementations of a
gender quota on Swedish corporate boards due to financial reasons.
We find that further research would be both highly necessary and interesting due to the
political climate regarding gender quotas on corporate boards in Sweden. As the European
Parliament recently approved the EU-commission´s bill of 40 % women in the boardrooms by
2020 (Lindén, 2014), we encourage further research in Sweden with more recent data on the
relationship between gender diversity and firm financial performance. During the further
research, we recommend to have several measurements of financial performance. The reason
for this being that we find that the same independent variable can have both positive and
negative relationships, depending on the way in which financial performance is measured. A
limitation of this study is the amount of time that we have; with an increased amount of time,
we can investigate more companies over a longer period. We can also increase the amount of
explanatory variables, such as board experience, board tenure, director compensation, firm
industry, multiple directorships and a market index indicator that might have given us more
statistically significant results. In addition to that, we can improve existing variables, such as
female ownership by having the voting rights of the owned shares rather than the amount of
shares.
30
Bibliography
Adams, Renée B. and Daniel Ferreira. “Women in the boardroom and their impact on
governance and performance.” Journal of financial economics 94 (2009): 291-309. Accessed
November 19, 2015. doi:10.1016/j.jfineco.2008.10.007.
Andersson, Klas. “Borg öppnar för lag om kvotering.” Svenska Dagbladet, April 20, 2013.
Accessed November 17, 2015. http://www.svd.se/borg-oppnar-for-lag-om-kvotering-3k0P.
Bodie, Zvi., Alex Kane., and Alan J. Marcus. Investments. New York: McGraw-Hill, 2014.
Børen, Øyvind and Øystein R. Strøm. “Governance and Politics: Regulating Independence
and Diversity in the Board Room.” Journal of Business Finance & Accounting 37 (2010):
1281-1307. Accessed November 18, 2015.
http://papers.ssrn.com/sol3/papers.cfm?abstract_id=2257734.
Campbell, Kevin and Antonio Mínguez-Vera. “Gender Diversity in the Boardroom and Firm
Financial Performance.” Journal of business ethics 83 (2008): 435-51. Accessed November
20, 2015. doi:10.1007/s10551-007-9630-y.
Carter, David A., Betty J. Simkins and Gary W. Simpson. “Corporate Governance, Board
Diversity and Firm Value.” The Financial Review 38 (2003): 33-53. Accessed November 17,
2015. doi:10.1111/1540-6288.00034.
Carter, David A., Frank D’Souza., Betty J. Simkins and Gary W. Simpson. “The Gender and
Ethnic Diversity of US Boards and Board Committees and Firms.” Corporate Governance:
An International review 18(5) (2010): 396-414. Accessed November 17, 2015.
doi:10.1111/j.1467-8683.2010.00809.x.
Cortinhas, Carlos., and Ken Black. Statistics for business and economics. New York: John
Wiley Sons, 2012.
Dvorak, Phred. “Some Things Don’t Change. Sarbanes-Oxley was expected to increase the
number of minority directors. What happened?” Wall Street Journal, January 14, 2008.
Accessed December 10, 2015. http://www.wsj.com/articles/SB119998932208381439.
Egan, Mary E. “Fostering Innovation Through a Diverse Workforce.” Forbes Insights, July,
2011. Accessed December 10, 2015.
http://www.forbes.com/forbesinsights/innovation_diversity/.
31
Fan, Pei Sai. “Is Board Diversity Important for Firm Performance and Board Independence? –
An exploratory study of Singapore Listed Companies.” The monetary Authority of Singapore,
MAS Staff Paper No. 52 (2012). Accessed November 17, 2015.
http://www.mas.gov.sg/~/media/resource/publications/staff_papers/Staff%20Paper%20No52.
pdf.
Francoeur, Claude., Réal Labelle and Bernard Sinclair-Desgagné. “Gender Diversity in
Corporate Governance and Top Management.” Journal of Business Ethics 81 (2008): 83-95.
Accessed November 19, 2015. doi:10.1007/s10551-007-9482-5.
Fulton, Lionel. “Board-Level Representation” Worker-Participation.eu (2015). Accessed
December 28, 2015. http://www.worker-participation.eu/National-Industrial-
Relations/Across-Europe/Board-level-Representation2.
Gillan, Stuart., Jay C. Hartzell and Laura T. Starks. “Explaining Corporate Governance:
Boards, Bylaws and Charter Provisions.” Weinberg Center of Corporate Governance,
Working Paper No. 03 (2003). Accessed November 27, 2015.
http://papers.ssrn.com/sol3/papers.cfm?abstract_id=442740.
Gujarati, Damodar N., and Dawn C. Porter. Basic Econometrics. New York: McGraw-Hill,
2009.
Gul, Ferdinand A., Bin Srinidhi and Anthony C. Ng. “Does board gender diversity improve
the informativeness of stocks prices?” Journal of Accounting and Economics 51 (2011): 314-
38. Accessed November 20, 2015. doi:10.1016/j.jacceco.2011.01.005.
Hillier, David., Stephen Ross., Randolph Westerfield., Jeffrey Jaffe., and Bradford Jordan.
Corporate Finance. New York: McGraw-Hill, 2010.
Hillman, Amy J., Albert A. Cannella Jr. and Ira C. Harris. “Women and Racial Minorities in
the Boardroom: How Do Directors Differ?” Journal of Management 28(6) (2002): 747-63.
Accesses November 18, 2015. doi:10.1177/014920630202800603.
Lindén, Carl-Gustav. “The threat of quotas.” Nordic Labour Journal (2014). Accessed
December 9, 2015. http://www.nordiclabourjournal.org/i-fokus/gender-equality-
2014/article.2014-03-04.0069351438.
32
Mateos de Cabo, Ruth., Ricardo Gimeno and María J. Nieto. “Gender Diversity on European
Banks´ Boards of Directors.” Journal of Business Ethics 109 (2012): 145-62. Accessed
November 20, 2015. doi:10.1007/s10551-011-1112-6.
Reguera-Alvarado, Nuria., Pilar, de Fuentes and Joaquina Laffarga. “Does Board Gender
Diversity Influence Financial Performance? Evidence from Spain.” Journal of Business Ethics
(2015). Accessed November 19, 2015. doi:10.1007/s10551-015-2735-9.
Rhode, Debroah L and Amanda K. Packel. “Diversity on corporate boards: How much
difference does difference make?” Delaware Journal of Corporate Law 39 (2015): 377-426.
Accessed November 20, 2014. http://papers.ssrn.com/sol3/papers.cfm?abstract_id=1685615.
Rose, Caspar. “Does female board representation influence firm performance? The Danish
evidence.” Corporate Governance: An international review 15(2) (2007): 404-13. Accessed
November 17, 2015. doi:10.1111/j.1467-8683.2007.00570.x.
Terjesen, Siri., Ruth Sealy and Val Singh. “Women Directors of Corporate Boards: A Review
and Research Agenda.” Corporate Governance: An international review 17(3) (2009): 320-
37. Accessed November 30, 2015. doi:10.1111/j.1467-8683.2009.00742.x.
Westphal, James D. and Laurie P. Milton. “How Experience and Network Ties Affect the
Influence of Demographic Minorities on Corporate Boards.” Administrative Science
Quarterly 45(2) (2000): 366-98. Accessed November 18, 2015. doi:10.2307/2667075.
Wooldridge, Jeffrey M. Introduction to Econometrics. Hampshire: Cengage, 2015.
33
Appendix
Table 1 – Descriptive Statistics
(1) (2) (3) (4) (5)
VARIABLES N mean sd min max
Board Size 10,315 8.550 2.202 3 15
CEO Compensation (M
SEK) 10,315 5.259
5.243 0
28.490
Female CEO
Compensation (M SEK)
Male CEO
Compensation (M SEK)
Age
10,315
10,315
10,315
4.712
7.425
54.46
4.831
6.533
3.679
0
0
40
12.123
28.490
65.50
Gender 10,315 0.201 0.119 0 0.571
Independent Directors 10,315 0.428 0.232 0 0.889
Female Independent
Directors
Male Independent
Directors
Employee Directors
10,315
10,315
10,315
0.302
0.698
0.112
0.332
0.459
0.116
0
0
0
1
1
0.333
Female Employee
Directors
Male Employee
Directors
Female Leadership
10,315
10,315
10,315
0.3625
0.6365
0.0375
0.168
0.276
0.190
0
0
0
1
1
1
Male Leadership
Female Ownership
Male Ownership
Female CEO
Ownership
Male CEO Ownership
10,315
10,315
10,315
10,315
10,315
0.9625
0.0567
0.9433
0.0004
0.9996
0.674
0.165
0.445
0.0023
0.7544
0
0
0
0
0
1
1
1
1
1 [This table shows the number of observations, the mean, the standard deviation, the minimum value and the
maximum value of all the variables in our sample. The data contains the following number of firms each year:
2006 – 198 firms, 2007 – 216 firms, 2008 – 221 firms, 2009 – 220 firms, 2010 – 220 firms and 2011 – 219
firms.]

34
Table 2 – Descriptive Statistics Variable Definition
Variable name Descriptive Statistics Variable Definition
Board Size Number of directors on the board for each firm and year.
CEO Compensation (M SEK) CEO compensation for each firm and year.
Female CEO Compensation (M SEK) Female CEO compensation for each firm and year.
Male CEO Compensation (M SEK) Male CEO compensation for each firm and year.
Age Average age of the board members for each firm and year.
Gender Proportion of females on the board.
Independent Directors
Total number of independent directors on the board divided by the total numbers of directors on the board.
Female Independent Directors
Total numbers of female independent directors on the board divided by the total numbers of independent directors on the board.
Male Independent Directors
Total numbers of male independent directors on the board divided by the total numbers of independent directors on the board.
Employee Directors
Total number of employee directors on the board divided by the total number of directors on the board.
Female Employee Directors
Total number of female employee directors on the board divided by the total number of employee directors on the board.
Male Employee Directors
Total number of male employee directors on the board divided by the total number of employee directors on the board.
Female Leadership
Total number of female CEO's and Chairmen divided by the total numbers of CEO's and Chairmen.
Male Leadership Total number of male CEO's and Chairmen divided by the total numbers of CEO's and Chairmen.
Female Ownership
Total shares owned by females on the board divided by the total number of shares owned by the board members.
Male Ownership Total shares owned by males on the board divided by the total number of shares owned by the board members.
Female CEO Ownership
Total number of share equity owned by female CEO's divided by total number of share equity owned by the total number of CEO's.
Male CEO Ownership
Total number of share equity owned by male CEO's divided by total number of share equity owned by the total number of CEO's.
[This table shows the variable names and the variable definitions of our descriptive statistics.]
35
Table 3 – Regression Variable Definition
Variable Name Fixed Effects Regression Variable Definition
Dependent Variables Return on Assets (ROA)
(%) Natural logarithm of return on assets. It is calculated by net income divided by total assets.
Tobin's Q Natural logarithm of Tobin's Q. It is calculated by the market value plus total debt, divided by total assets.
Independent Variable of Primary Interest
Gender Proportion of females on the board.
Control Variables Lagged ROA Natural logarithm of lagged ROA.
Lagged Tobin's Q Natural logarithm of lagged Tobin's Q.
Firm Size Natural logarithm of total assets.
Age Average age of the board members for each firm and year.
Female Ownership (%) Total shares owned by females on the board divided by the total amount of shares owned by the board members.
Board Size Number of directors on the board for each firm and year.
Female Leadership A dummy variable which equals 1 if there is a female CEO or Chairman on the board and 0 otherwise.
Independent Directors (%)
Total number of independent directors on the board divided by the total numbers of directors on the board.
Employee Directors (%) Total number of employee directors on the board divided by the total number of directors on the board.
CEO Compensation Natural logarithm of CEO compensation for each firm and year. [This table shows the variable names and the variable definitions which we use in all regressions. The variables
are divided into three categories: (i) dependent variables; (ii) independent variable of primary interest; and (iii)
control variables.]
Table 4 – Breusch-Pagan/Cook-Weisberg test and Breusch-Godfrey test
Breusch-Pagan/Cook-Weisberg test
ROA Tobin's Q
Number of parameters estimated 10 10
Chi2 188.56 202.71
Prob > Chi2 0.000 0.000 Panel A
Breusch-Godfrey test ROA Tobin's Q
Chi2 127.1 538.5
Lags 1 1
df 1 1
Prob > Chi2 0.000 0.000
Number of gaps 44 40 Panel B
[This table shows the Breusch-Pagan/Cook-Weisberg test for heteroscedasticity in Panel A and the Breusch-
Godfrey test for serial correlation in Panel B.]
36
Table 5 – Durbin-Wu-Hausman Test of Endogeneity
Durbin-Wu-Hausman Test of Endogeneity ROA Tobin's Q
H0: Variable gender is exogenous Durbin score Chi2 (1) 1.3408 0.7826
Durbin score p-value 0.2469 0.3763
Wu-Hausman F(1,923) 1.3270 0.7741
Wu-Hausman p-value 0.2496 0.3792 [This table shows the Durbin-Wu-Hausman test of endogeneity. It shows the Durbin score
Chi2-value, Wu-Hausman F-value and the p-values of the Durbin score and the Wu-Hausman.]
Table 11 – First-stage Regression Summary Statistics
First-stage regression summary statistics ROA Tobin's Q
Endogenous variable Gender Gender
Instrumental variable Lagged Gender Lagged Gender
R-squared 0.7300 0.7324
Adjusted R-squared 0.7273 0.7298
Partial R-squared 0.6749 0.6771
F(1,928) 1918.11 1946.06
Prob > F 0.000 0.000 [This table shows the First-stage regression summary statistics from the 2SLS regression. The partial R-squared
shows the correlation between the endogenous variable and the instrumental variable after it partial out the effect
of the other explanatory variables in the model.]