Embed Size (px)
Citation preview
Anna-Karin Björsne
Uppsats för avläggande av naturvetenskaplig kandidatexamen iMiljövetenskap
15 hpInstitutionen för växt- och miljövetenskaper
Göteborgs universitet
Juni 2010
How does drainage affect the nitrogen
cycle in organic soils?
1
Abstract Nitrogen (N) is one of the most abundant elements on Earth and its different forms can be summarized in the N cycle. The increased anthropogenic input of reactive N has altered the global N cycle with large consequences for sensitive ecosystems where N saturation and over-fertilization can be a problem. The aim of this study was to investigate how N transformations differs between a drained and an undrained peatland, in order to give an increased comprehension of how water content in soil affects the N fluxes. Samples were taken from two sites in Västra Götaland, an undrained (UP) and a drained peatland (DP). Pools of NH4
+ and NO3
- were labelled with the isotope 15N according to the isotope dilution technique, and other soil properties were measured. The C:N ratio was slightly higher in UP, while the pH value was lower. UP had a high background content of NH4
+, which corresponded to higher mineralization rates in that soil type. The background content of NO3
- was varied between the replicates, but is generally lower than the NH4
+ content. Soil organic matter (SOM) was lower than expected for DP, only 51 % compared to 95 % in UP. The conclusions of this study are that the large NH4
+ pool and high mineralization rates in UP probably are effects of high SOM content. The nitrification rates were higher in DP because of the lower water content, which enables better aeration of the soil. Dissimilatory nitrate reduction to ammonium (DNRA) stands for 2-6 % of total consumption of NO3
-, and there were no significant differences between the soil types.
Sammanfattning Kväve (N) är ett av de mest förekommande grundämnena på jorden, och dess olika former kan sammanfattas i kvävecykeln. Ökad antropogen tillförsel av reaktivt kväve har förändrat den globala N-cykeln, med stora konsekvenser för känsliga ekosystem där N-mättnad och övergödning kan utgöra problem. Målet med den här studien var att undersöka skillnaderna mellan omvandlingar av N i en dränerad (DP) och en icke-dränerad (UP) torvmark, för att ge ökad förståelse för hur vattenhalten i marken påverkar kvävets flöden. Jordprover togs från två platser i Västra Götaland, en ursprunglig våtmark och en dränerad. Märkning av proverna med isotopen 15N gjordes enligt isotoputspädningsmetoden och omvandlingshastigheterna mättes tillsammans med andra jordegenskaper. C:N-kvoten var något högre i UP medan pH var lägre. UP hade en hög bakgrundshalt av NH4
+ vilket stämde väl överens med högre mineraliseringshastigheter för den jordtypen. Bakgrundshalten av NO3
- var varierande mellan replikaten, men i allmänhet lägre än halten av NH4
+. Halten av organiskt material (SOM) var lägre än väntat i DP, endast 51 % jämfört med 95 % i UP. Slutsatserna av denna studie är att de höga NH4
+-halterna och mineraliseringshastigheterna i UP beror på hög halt av SOM. Nitrifikationshastigheterna var högre i DP på grund av den lägre vattenhalten, vilket medför bättre luftning av jorden. Dissimilativ nitratreduktion till ammonium (DNRA) utgör 2-6 % av den totala konsumtionen av NO3
-, utan skillnader mellan jordtyperna.
2
Table of contents
List of abbreviations 3
1. INTRODUCTION 4 1.1 Nitrogen and its functions in soil 4 1.2 Measuring transformation rates 5 1.3 Aims and objectives 6
2. MATERIALS AND METHODS 7 2.1 Sites 7 2.2 Sampling 7 2.3 Laboratory work 7
2.3.1 Determining soil properties 8 2.3.2 NH4
+ conversions 8 2.3.3 NO3
- conversions 8 2.3.4 Calculations 9
3. RESULTS 11 3.1 Sites comparison 11 3.2 Gross nitrification rates 12 3.2 Gross mineralization rates 12 3.3 DNRA-rates 13
4. DISCUSSION 14 4.1 Soil properties 14 4.2 Mineralization and nitrification 14 4.3 Consumption 15
5. CONCLUSIONS 16
6. ACKNOWLEDGEMENTS 17
7. REFERENCES 18
APPENDIX 20 Appendix A – Atom % of 15N 20 Appendix B – Variables used in calculations 21
3
List of abbreviations
DNRA – Dissimilatory nitrate reduction to ammonium
DP – Drained peat
FIA – Flow injection analysis
IRMS – Isotope ratio mass spectrometry
N – Nitrogen
SOM – Soil organic matter
UP – Undrained peat
4
1. Introduction
1.1 Nitrogen and its functions in soil Nitrogen (N) is one of the most abundant elements in the atmosphere, hydrosphere and biosphere. 99 % of all N consists as N2, a non-reactive gas that the majority of the organisms on Earth cannot use for assimilation (Robertson and Groffman 2006). The forms of N that organisms can incorporate are reactive forms e.g. nitrate (NO3
-), ammonium (NH4+), and
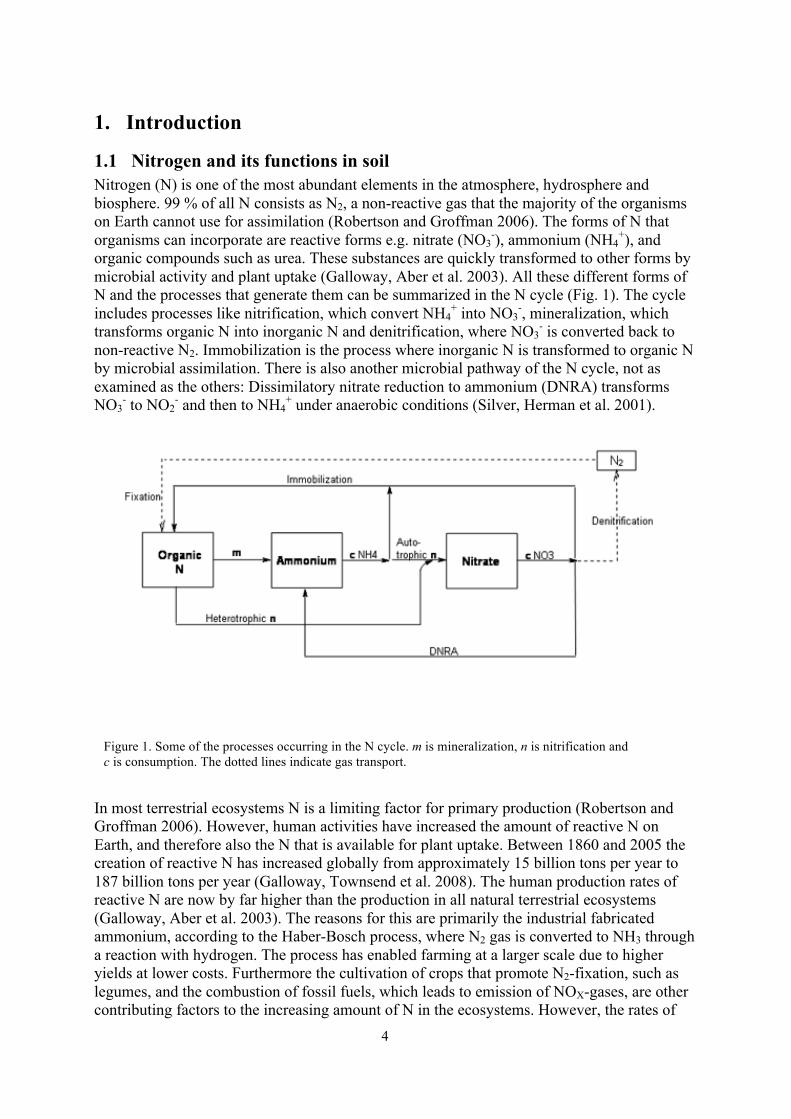
organic compounds such as urea. These substances are quickly transformed to other forms by microbial activity and plant uptake (Galloway, Aber et al. 2003). All these different forms of N and the processes that generate them can be summarized in the N cycle (Fig. 1). The cycle includes processes like nitrification, which convert NH4
+ into NO3-, mineralization, which
transforms organic N into inorganic N and denitrification, where NO3- is converted back to
non-reactive N2. Immobilization is the process where inorganic N is transformed to organic N by microbial assimilation. There is also another microbial pathway of the N cycle, not as examined as the others: Dissimilatory nitrate reduction to ammonium (DNRA) transforms NO3
- to NO2- and then to NH4
+ under anaerobic conditions (Silver, Herman et al. 2001).
In most terrestrial ecosystems N is a limiting factor for primary production (Robertson and Groffman 2006). However, human activities have increased the amount of reactive N on Earth, and therefore also the N that is available for plant uptake. Between 1860 and 2005 the creation of reactive N has increased globally from approximately 15 billion tons per year to 187 billion tons per year (Galloway, Townsend et al. 2008). The human production rates of reactive N are now by far higher than the production in all natural terrestrial ecosystems (Galloway, Aber et al. 2003). The reasons for this are primarily the industrial fabricated ammonium, according to the Haber-Bosch process, where N2 gas is converted to NH3 through a reaction with hydrogen. The process has enabled farming at a larger scale due to higher yields at lower costs. Furthermore the cultivation of crops that promote N2-fixation, such as legumes, and the combustion of fossil fuels, which leads to emission of NOX-gases, are other contributing factors to the increasing amount of N in the ecosystems. However, the rates of
Figure 1. Some of the processes occurring in the N cycle. m is mineralization, n is nitrification and c is consumption. The dotted lines indicate gas transport.
5
denitrification have far from increased at the same rate, which leads to accumulation of reactive N in the environment. From the soil, N leaks to streams, lakes and coastal areas, causing eutrophication (Galloway, Aber et al. 2003).
Atmospheric transport and deposition is now the dominant distribution process of reactive N. In ecosystems not affected by human impact, the N deposition is about 0.5 kg N ha-1 year-1. Today, the average N deposition rates go beyond 10 kg N ha-1 year-1 in some regions of the world (Galloway, Townsend et al. 2008; Kreutzer, Butterbach-Bahl et al. 2009). For forests, this has greater consequences than for agricultural land, since forests are more slowly growing ecosystems and not fertilized to the same extent as agricultural soils. Due to this many forest soils has become N saturated with increased leaching and N2O-emissions as a consequence (Aber, McDowell et al. 1998). Higher amounts of reactive N in the environment lower the C:N ratio in soil and in forest soils this can lead to higher N2O emissions. N2O is a by-product of nitrification and denitrification and is a highly potent greenhouse gas that contributes to global warming. The N2O-fluxes from soils are directly dependent on rates of nitrification and denitrification, and with a higher amount reactive N in the soil the rates of these processes will increase (Klemedtsson, von Arnold et al. 2005). Another large anthropogenic impact on soil is drainage, which has been a way of obtaining larger areas for forestry and agriculture. Drainage greatly changes the conditions in soil. The water content of the soil decreases and allows air to enter the soil, and due to better growth conditions the primary production increases (Ernfors 2009). This changes the carbon balance in the soil, and as a result of increasing oxygen content the N stored in organic matter is mineralized and therefore available for nitrification (Kasimir-Klemedtsson, Klemedtsson et al. 1997).
Many factors indicate that as a result of anthropogenic input the global N cycle has altered, and the availability and mobility of N has increased (Vitousek, Aber et al. 1997). What the consequences of this will be for ecosystems all around the world is hard to predict owing to the complexity of N, with all its different forms. In order to handle these consequences in the future it is important to get a better comprehension of the N fluxes in soil, and the factors affecting them.
1.2 Measuring transformation rates Nitrogen has two stable isotopes, 14N and 15N, with abundances of 99.63 % and 0.37 % respectively. Since the latter is naturally scarce in the environment it can be used for monitoring fluxes between N pools, and determine gross transformation rates in soil. Gross transformation shows more about the fluxes between the pools in the N cycle than net transformation. The net transformation is the balance between the influx and the outflow of the pool (Robertson and Groffman 2006), and as long as the pool does not change in size it is difficult to say something about how large the fluxes between the pools are, since net and gross transformation rates are not always correlated (Hart, Nason et al. 1994). For example, Davidson, Hart et al. (1992) compared gross and net mineralization in one young and one old forest and found that only looking at the net mineralization can be misleading. In their study the net mineralization of the old forest was almost zero, while much higher in the young forest. However, when measuring the gross rates they found that they were in fact much higher in the old forest than in the young.
There are different methods for measuring transformation rates. One is the tracer technique, where one N pool, such as NH4
+, is labelled with 15N and the movement of the isotope is monitored through the system (Hart and Myrold 1996). Another method, used in this study, is based on dilution of a 15N labelled N pool. During incubation, there will be an influx and out-
6
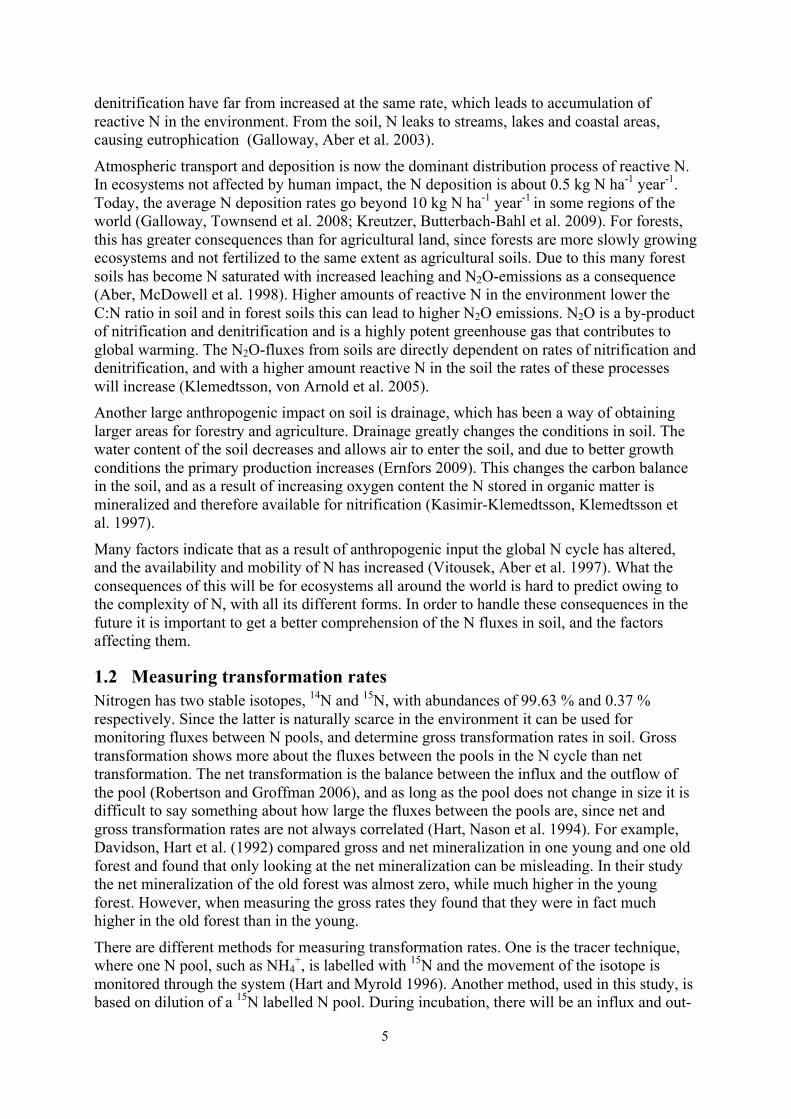
flux of the pool. The influx is diluting the pool with 14N and with the out-flux 15N vanishes out of the pool (Fig. 2). The dilution is monitored by measuring the 15N as a fraction of the whole N content at two times, one right after the isotope labelling and one after incubation for 24 hours.
Kirkham and Bartholomew (1954) presented equations to calculate the rates of influx and outflow of the N pool, i.e. the mineralization/nitrification and consumption together with three important assumptions: (I) Microorganisms in soil do not differentiate between the isotopes 14N and 15N, i.e. the isotopes behave the same in the soil. (II) The mineral atoms are not being remineralized, as they are so few compared to the organic material. (III) The rates of mineralization/nitrification and consumption are the same during the incubation period. This method is widely used for measuring transformation rates and has the advantages that a flux can be monitored with measurements of only one pool (Hart and Myrold 1996).
1.3 Aims and objectives The aim of this study was to investigate how the fluxes in the nitrogen cycle differ between a drained and undrained peat soil. Gross transformation rates of processes such as mineralization and nitrification in the N cycle were measured to give an increased understanding of how the N cycle is affected by water content in soil, using the isotope dilution technique and the equations by Kirkham and Bartholomew (1954) and Silver, Herman et al. (2001)
Figure 2. The principles of the isotope dilution technique. The 15N-content in the pool becomes diluted due to mineralization or nitrification (m). The out-flux of the pool is consumption (c). The 15N fraction is measured at both t0 and t1 and rates are calculated with the equations of Kirkham and Bartholomew (1954). Figure redrawn from Hart and Myrold (1996).
7
2. Materials and methods
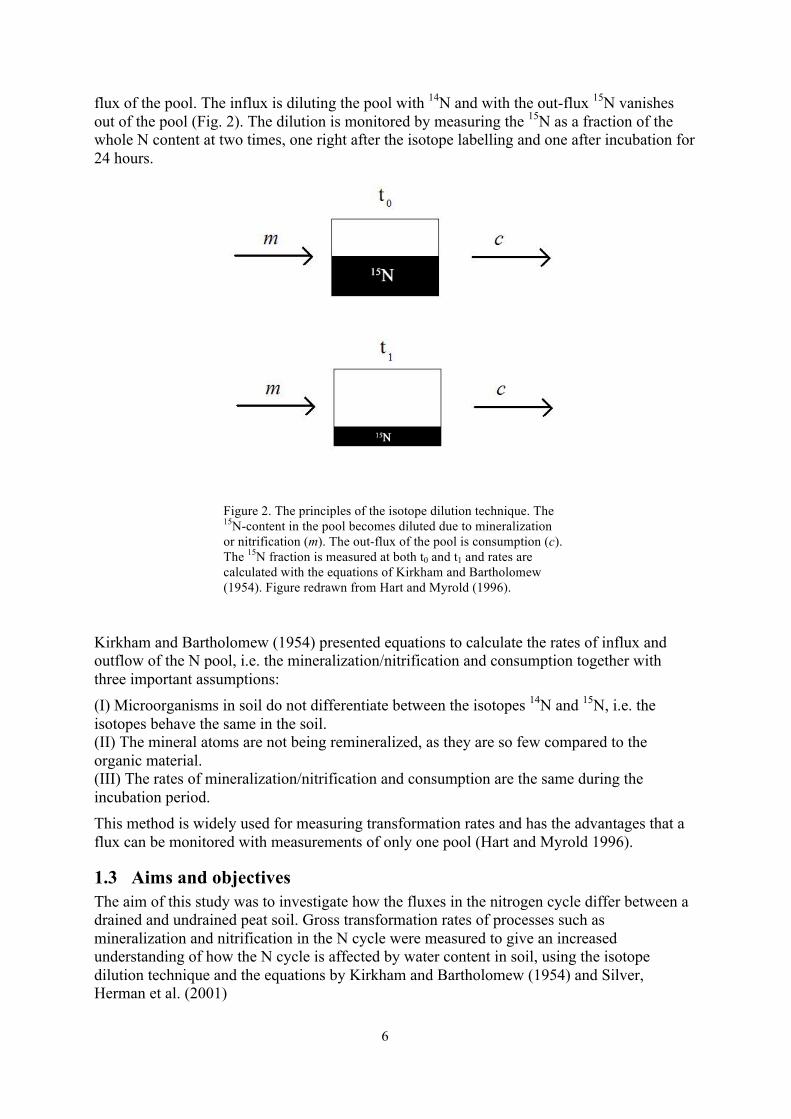
2.1 Sites Samples were taken from two sites in Skogaryd, Västra Götaland, on the 4th of April 2010. The first site is a drained peatland (DP), with planted coniferous woodland, dominated by Norway spruce (Picea abies). The ground vegetation is sparse and dominated by bryophytes such as Mnium hornum, Polytricum formosum and Pleurozium schreberi. The peat was drained in the 1870’s and used for agriculture until 1951 when the current tree stand was planted (Ernfors 2009). At the time of sampling there was still plenty of snow at this site, and the soil was frozen in some of the samples. The second site is a bog (undrained peatland = UP), with Sphagnum, Carex and Erica tetralix growing on top layer.
2.2 Sampling Three replicates were taken from each site, with a distance of 2 m; each replicate contained five subsamples. The subsamples were taken in a line, with a distance of 50 cm from each other. The total sampling area was 2 x 6 m. Subsamples were taken to a depth of 10 cm; the litter not included, and put in plastic bags.
2.3 Laboratory work Roots and other larger distinguishable materials were removed from the samples and passed through a sieve with meshes of 5.6 mm. About 30 g of soil from each sample was extracted with the double amount of 2 M KCl. The bottles were shaken in an orbital shaker for one hour at 120 rpm, and the extract was filtrated with Whatman GF/D filter papers. The filter papers were rinsed with 2 M KCl before filtration. The extract was measured with flow injection analysis (FIA) to determine the background content of NH4
+ and NO3-.
The samples were divided into 24 plastic bottles (four for each sample) with 100 g soil in each and covered with plastic film. Holes were made in the film to enable air exchange without drying the soil. Half of the 24 bottles were labelled with 15NH4NO3 and the other half with NH4
15NO3. The enrichment of the salts was 98 atom percent and the added amount 3 µg g-1 wet soil. 30 min after labelling half of the samples (12 bottles) from each labelling were extracted with 100 ml of 2 M KCl according to the same procedure described above. The other 12 samples were incubated for 24 hours and extracted the following day (Stevens and Laughlin 1995).
Figure 3. The sites in Skogaryd. Drained peat (left) and bog site (right).
8
The total content of NH4+-N and NO3
--N in the extracts after labelling was measured with FIA. The labelled N pool had to be converted into N2O gas in order to measure the fractions of the N isotopes with isotope ratio mass spectrometry (IRMS).
2.3.1 Determining soil properties About 10 g of each soil sample were weighed, dried at 70 degrees for 24 hours and weighed again, to determine the water content. Soil organic matter (SOM) was determined by calculating the weight difference of dry soil before and after burning at 550° C for 8 hours. The C and N content of soil was measured with an elemental analyzer, using dried and milled samples. The pH was measured in the 2 M KCl extracts.
2.3.2 NH4+ conversions
Saghir, Mulvancy et al. (1993) describes this technique in detail.
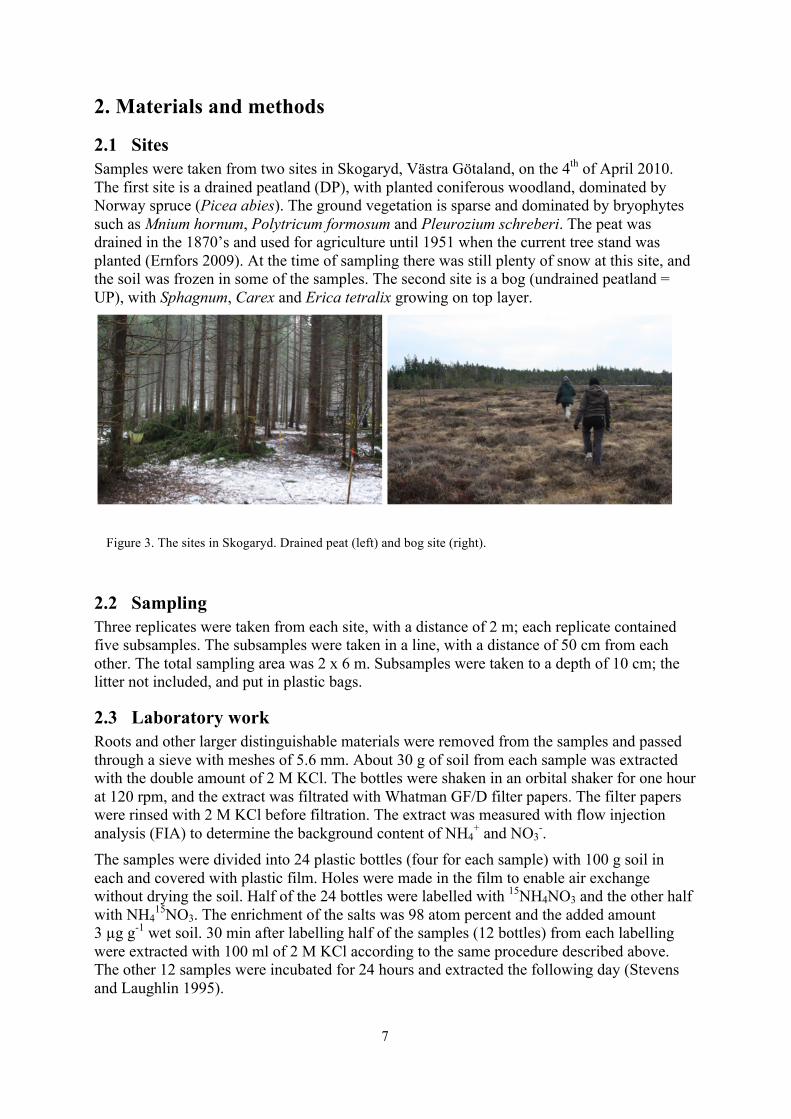
The extracts were pipetted into kilner jars together with a spike solution ((NH4)2SO4), 2 M KCl and MgO. A tripod was placed in the jar and on top of that a petri dish with 3 ml of an absorption solution containing 0.005 M H2SO4 and 0.5 mM CuSO4 (Fig. 4). The lids were closed and the samples were then incubated at 20°C for five days. After diffusion the absorption solution was poured in glass vials and dried in 150°C. The vials were thereafter cooled down to room temperature, sealed with an airtight septum cap and evacuated. 1 ml of NaOBr was injected with a syringe in the vial. The vial was left for 5 minutes in order to let the reaction start and ensure that enough N2O was produced. Helium gas was then added to get atmospheric pressure inside in the vial. The concentration of the produced N2O was measured with gas chromatography (GC) and the isotope ratio in the samples with IRMS.
2.3.3 NO3- conversions
Stevens and Laughlin (1994) describes this technique in detail. The extracts were pipetted into 60 ml dark glass bottles together with 2 M KCl-solution, a spike solution (KNO3) and 2 ml of 0.2 M sulphamic acid (H3NSO3). A Cd/Cu reductor was added to the bottles, containing of a piece of Cd-foil (10 x 10 x 0.25 mm) formed into a cylinder. Before addition in the bottles the cylinders were prepared by treatment with 6 ml of HCl for 1 minute, washed with distilled water for 1 minute, then treated with 0.04 M CuSO4-solution for 1 minute and finally washed with distilled water. The bottles were capped with septum caps and evacuated. 2.5 ml of 1 M acetic acid buffer were added with a syringe through the septa. The bottles were laid flat on an orbital shaker
Figure 4. Adding MgO to the solution in the jars (left). Closed kilner jars with the tripod and petri dish inside (right).
9
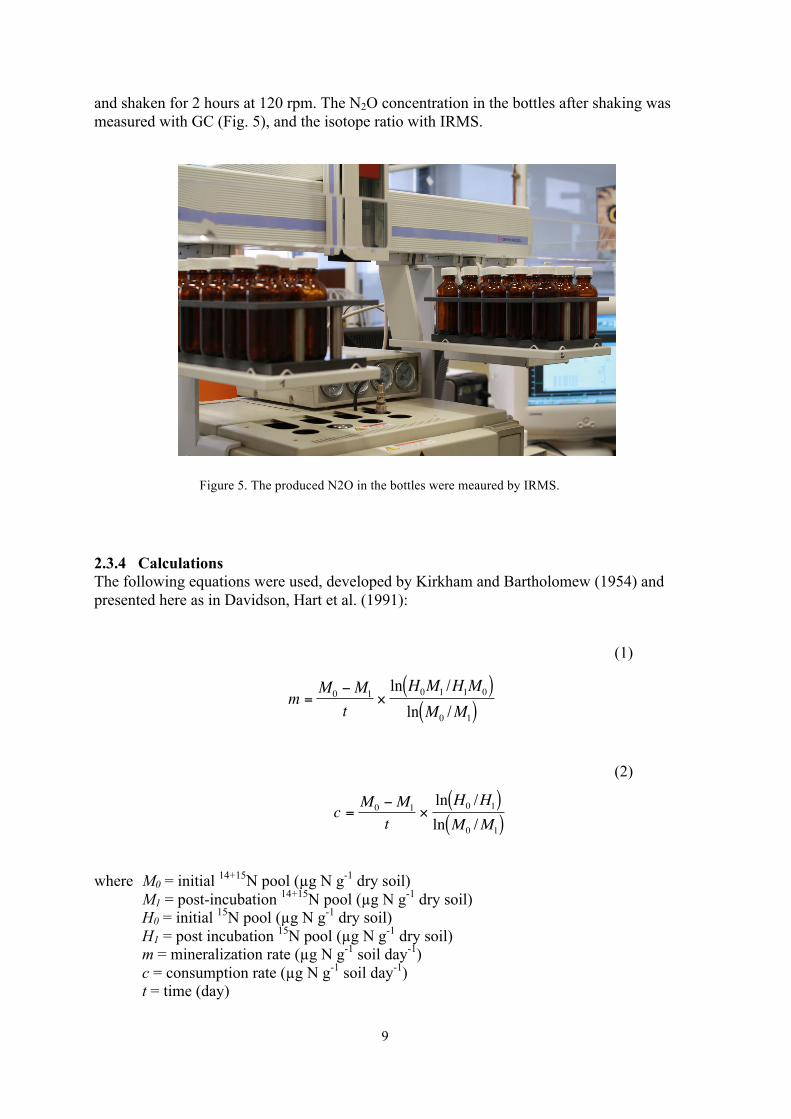
and shaken for 2 hours at 120 rpm. The N2O concentration in the bottles after shaking was measured with GC (Fig. 5), and the isotope ratio with IRMS.
2.3.4 Calculations The following equations were used, developed by Kirkham and Bartholomew (1954) and presented here as in Davidson, Hart et al. (1991):
(1)
(2)
€
c =M0 −M1
t×ln H0 /H1( )ln M0 /M1( )
where M0 = initial 14+15N pool (µg N g-1 dry soil)
M1 = post-incubation 14+15N pool (µg N g-1 dry soil) H0 = initial 15N pool (µg N g-1 dry soil) H1 = post incubation 15N pool (µg N g-1 dry soil) m = mineralization rate (µg N g-1 soil day-1) c = consumption rate (µg N g-1 soil day-1) t = time (day)
!
m =M0 "M1
t#ln H0M1 /H1M0( )ln M0 /M1( )
Figure 5. The produced N2O in the bottles were meaured by IRMS.
10
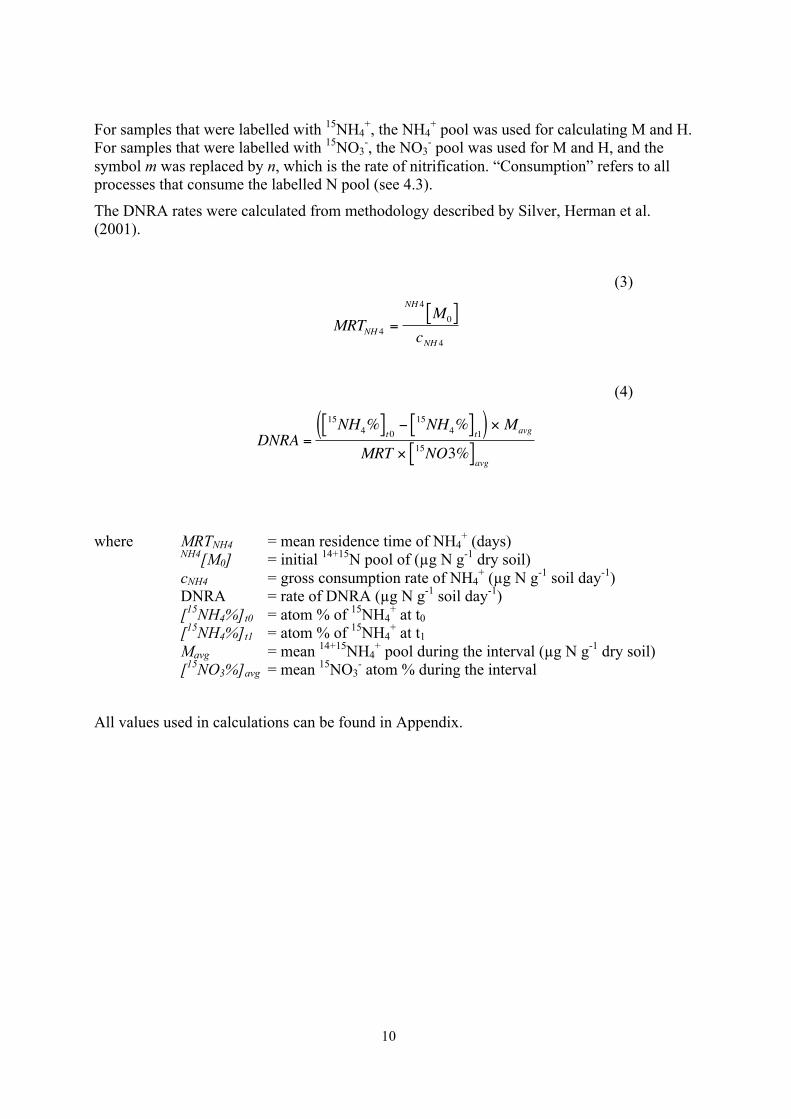
For samples that were labelled with 15NH4+, the NH4
+ pool was used for calculating M and H. For samples that were labelled with 15NO3
-, the NO3- pool was used for M and H, and the
symbol m was replaced by n, which is the rate of nitrification. “Consumption” refers to all processes that consume the labelled N pool (see 4.3).
The DNRA rates were calculated from methodology described by Silver, Herman et al. (2001).
(3)
€
MRTNH 4 =
NH 4M0[ ]
cNH 4
(4)
€
DNRA =
15NH4%[ ]t0 −15NH4%[ ]t1( ) × Mavg
MRT × 15NO3%[ ]avg
where MRTNH4 = mean residence time of NH4+ (days)
NH4[M0] = initial 14+15N pool of (µg N g-1 dry soil) cNH4 = gross consumption rate of NH4
+ (µg N g-1 soil day-1) DNRA = rate of DNRA (µg N g-1 soil day-1) [15NH4%]t0 = atom % of 15NH4
+ at t0 [15NH4%]t1 = atom % of 15NH4
+ at t1 Mavg = mean 14+15NH4
+ pool during the interval (µg N g-1 dry soil) [15NO3%]avg = mean 15NO3
- atom % during the interval
All values used in calculations can be found in Appendix.
11
3. Results
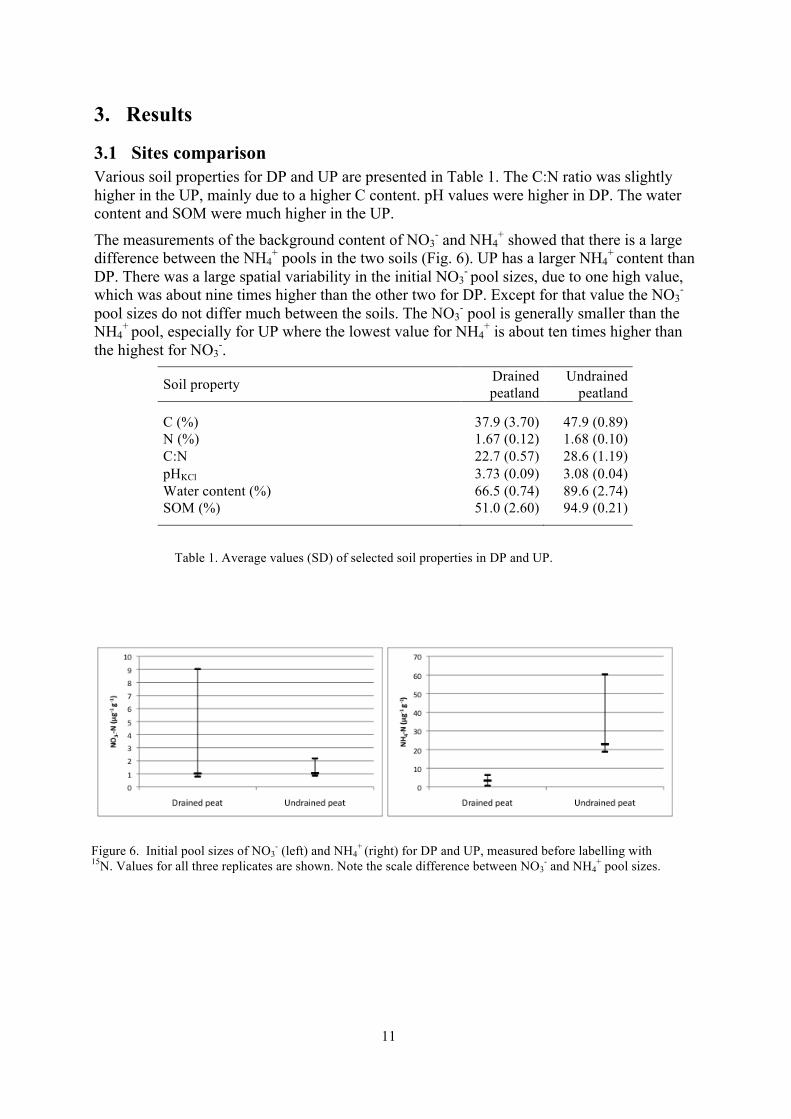
3.1 Sites comparison Various soil properties for DP and UP are presented in Table 1. The C:N ratio was slightly higher in the UP, mainly due to a higher C content. pH values were higher in DP. The water content and SOM were much higher in the UP.
The measurements of the background content of NO3- and NH4
+ showed that there is a large difference between the NH4
+ pools in the two soils (Fig. 6). UP has a larger NH4+ content than
DP. There was a large spatial variability in the initial NO3- pool sizes, due to one high value,
which was about nine times higher than the other two for DP. Except for that value the NO3-
pool sizes do not differ much between the soils. The NO3- pool is generally smaller than the
NH4+ pool, especially for UP where the lowest value for NH4
+ is about ten times higher than the highest for NO3
-.
Soil property Drained peatland
Undrained peatland
C (%) 37.9 (3.70) 47.9 (0.89) N (%) 1.67 (0.12) 1.68 (0.10) C:N 22.7 (0.57) 28.6 (1.19) pHKCl 3.73 (0.09) 3.08 (0.04) Water content (%) 66.5 (0.74) 89.6 (2.74) SOM (%) 51.0 (2.60) 94.9 (0.21)
Table 1. Average values (SD) of selected soil properties in DP and UP.
Figure 6. Initial pool sizes of NO3- (left) and NH4
+ (right) for DP and UP, measured before labelling with 15N. Values for all three replicates are shown. Note the scale difference between NO3
- and NH4+ pool sizes.
12
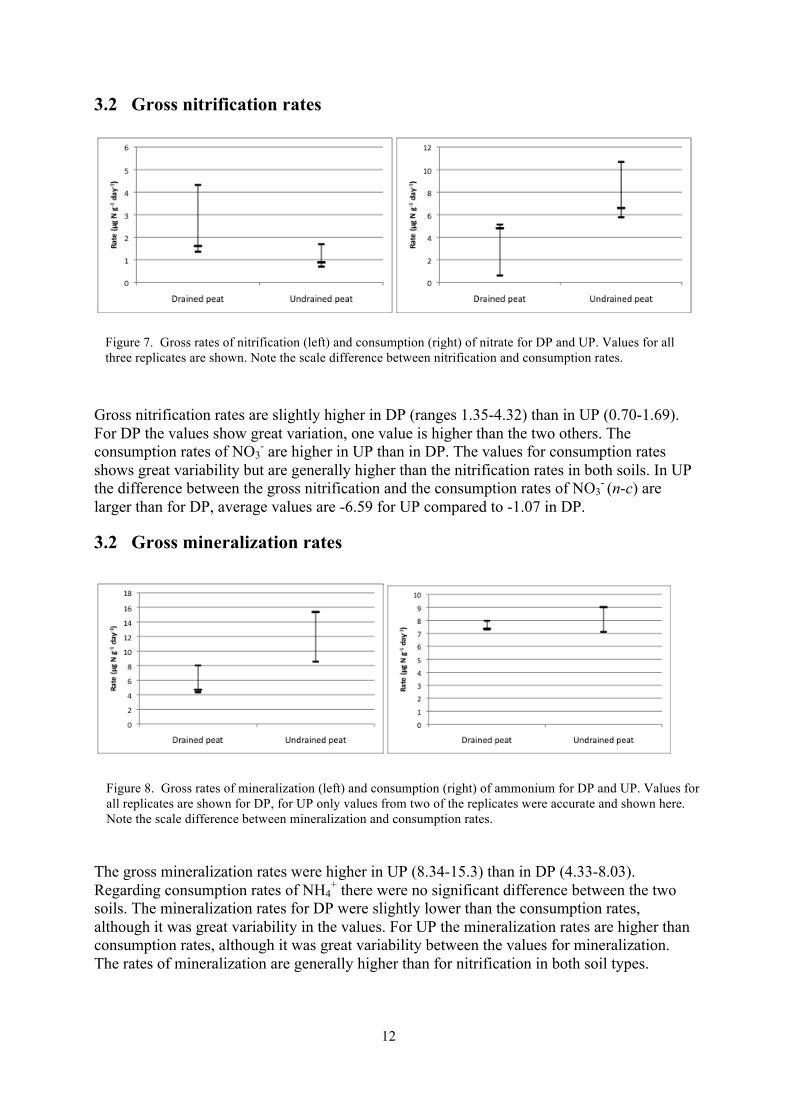
3.2 Gross nitrification rates
Gross nitrification rates are slightly higher in DP (ranges 1.35-4.32) than in UP (0.70-1.69). For DP the values show great variation, one value is higher than the two others. The consumption rates of NO3
- are higher in UP than in DP. The values for consumption rates shows great variability but are generally higher than the nitrification rates in both soils. In UP the difference between the gross nitrification and the consumption rates of NO3
- (n-c) are larger than for DP, average values are -6.59 for UP compared to -1.07 in DP.
3.2 Gross mineralization rates
The gross mineralization rates were higher in UP (8.34-15.3) than in DP (4.33-8.03). Regarding consumption rates of NH4
+ there were no significant difference between the two soils. The mineralization rates for DP were slightly lower than the consumption rates, although it was great variability in the values. For UP the mineralization rates are higher than consumption rates, although it was great variability between the values for mineralization. The rates of mineralization are generally higher than for nitrification in both soil types.
Figure 7. Gross rates of nitrification (left) and consumption (right) of nitrate for DP and UP. Values for all three replicates are shown. Note the scale difference between nitrification and consumption rates.
Figure 8. Gross rates of mineralization (left) and consumption (right) of ammonium for DP and UP. Values for all replicates are shown for DP, for UP only values from two of the replicates were accurate and shown here. Note the scale difference between mineralization and consumption rates.
13
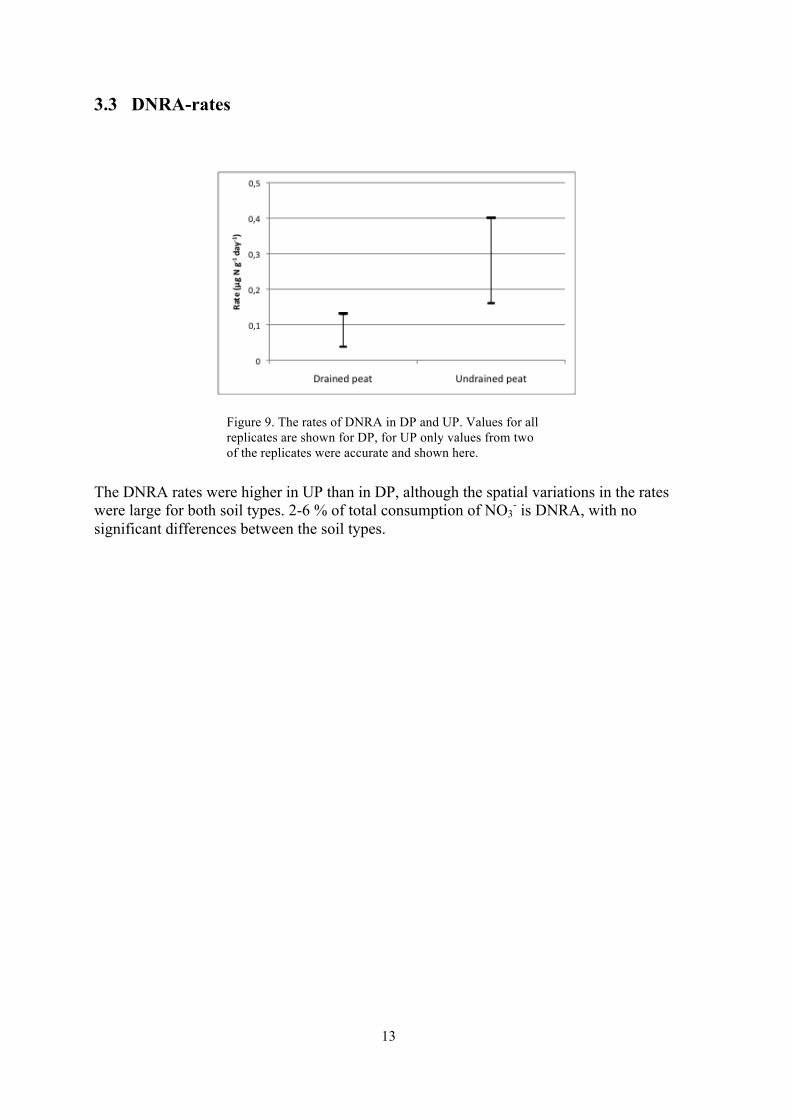
3.3 DNRA-rates
The DNRA rates were higher in UP than in DP, although the spatial variations in the rates were large for both soil types. 2-6 % of total consumption of NO3
- is DNRA, with no significant differences between the soil types.
!
Figure 9. The rates of DNRA in DP and UP. Values for all replicates are shown for DP, for UP only values from two of the replicates were accurate and shown here.
14
4. Discussion
4.1 Soil properties The amount of SOM was surprisingly low for DP, only about 50 % (Table 1). Other studies made at the same site in Skogaryd indicated SOM about 90 % (Ernfors 2009). This parameter was measured twice with the same result. Forest soils are heterogeneous and this could be due to natural spatial variability. The SOM in UP was 95 %, which was expected. Since the SOM content was so different in the two sampled soils, but was expected to be the same, this had to be considered when interpreting the results.
4.2 Mineralization and nitrification The initial pools of NH4
+ in UP were considerably higher than in DP, and much higher than the NO3
- pools for both soils. Similar results have been described by Ambus, Mosier et al. (1992) in a study of a riparian fen, where the NH4
+ pool was 5-10 times higher than the NO3-
pool at a soil depth of 10 cm. Also Westbrook and Devito (2004) has compared the different initial pools in peatlands and found that the initial pool of NH4
+ was ~130 times larger than the NO3
- pool. In the present study the NH4+ pool was 22-27 times larger than the NO3
- pool. There was one replicate for UP with the value of 60.4 µg g-1, while the two others were ~20 µg g-1 (Fig. 6). How the large initial pool of NH4
+ in that replicate affected the transformation rates in the experiments is unfortunately not known as the IRMS value was not accurate (see Table A1).
The large NH4+ pool correlates well with the higher gross mineralization rates in UP which
probably was a consequence of the higher SOM content. Booth, Stark et al. (2005) concluded that the C:N ratio and the mineralization rates are negatively correlated, i.e. a low C:N ratio imply higher mineralization rates. In the present study UP has both a higher C:N ratio and mineralization rate than DP. However, Booth, Stark et al. (2005) also suggested that the SOM composition impact the mineralization in soil, possibly through influence on microbial biomass. There is a strong positive correlation between C and N concentration and microbial biomass, and as seen in the results the C content in soil was higher for UP (Table 1).
The rates of mineralization were higher in this study than in a study done by Münchmeyer, Russow et al. (2000), where they compared drained and reflooded peatlands in Germany. The rates in drained peatlands were 1.42 µg g-1 d-1 compared to average 5.69 µg g-1 d-1 in this study. For reflooded peatlands the rates were 4.57 µg g-1 d-1 compared to average 12.0 µg g-1 d-1 for UP. Münchmeyer, Russow et al. (2000) also mentions the loss of 15N from the soil samples after labelling, which could be due to abiotic reasons such as volatilization and clay fixation. Volatilization of NH3 can be a problem for alkaline soils, but is in this study probably negligible, since the pH in the used soils is ~3.5 and the NH4
+ adsorption capacity is high under acidic conditions (Huber, Oberhauser et al. 2002). SOM can fixate N as well as clay, which could be a source of error since the SOM content in the used soil is high. This is primarily a problem for NH4
+, since the soil particles are negatively charged (Schlesinger 1997). How large the SOM fixation is can be measured using sterilized soils to see how much of the 15N that is recovered at t0 without microbes in the soil (Davidson, Hart et al. 1991). This has not been done in this study due to time limitations and thus the affect of cation exchange of SOM is not known.
The initial pools of NO3- show great variability for DP, particularly one replicate that is nine
times higher than the other two (Fig. 6). Nevertheless, this is related to an almost three times
15
higher nitrification rate compared to the other replicates (Fig. 7). Excluding this extreme value, the initial pools of NO3
- do not differ much between the soils, but regarding the nitrification rates they are still higher in DP. Booth, Stark et al. (2005) imply that the nitrification rates are highly dependent on the mineralization rates, since nitrifying microbes need NH4
+ as a substrate. In spite of the fact that the mineralization rates are higher in UP they are not correlating to the nitrification rates in this study. This is due to the lower water content in DP that enables better aeration of the soil. As a result of this the gross nitrification rates are higher in DP, since it is an oxygen demanding process.
4.3 Consumption In order to estimate the rates of consumption of NO3
- and NH4+ it is necessary to add substrate
to the samples. If the natural N pool is small in the samples the addition of substrate can result in a temporary boost of the microbial activity, which speeds up the measured transformation rates. It is also possible that the removal of plant roots from the soil makes the inorganic N more available and hence alters the activity of microbes. Overestimation of the real consumption rates of NO3
- and NH4+ can therefore be a source of error in this type of study
(Hart, Nason et al. 1994). Since the values of the consumption rates might be uncertain, this method cannot be used to measure net transformation by taking the difference between gross mineralization and gross consumption (Davidson, Hart et al. 1992). Kirkham and Bartholomew (1954) did not make a distinction between the immobilization and consumption of NH4
+. This distinction is made here since immobilization is only one of several possible outcomes for NH4
+ in soil. The others are autotrophic nitrification, clay or SOM fixation, volatilization and leaching losses. However, under laboratory conditions the microbial assimilation and nitrification are the most important processes (Di, Cameron et al. 2000). Overestimation of the consumption can also be a factor affecting the nitrification rates, since a major fate of consumed NH4
+ is nitrification. Adding labelled substrate to the already small NH4
+ pool might have affected the transformation rates, mainly in DP. However, in order to apply this method labelled substrate has to be added, and several studies indicate that the isotope dilution technique is a good instrument for measuring microbial processes (Davidson, Hart et al. 1991; Di, Cameron et al. 2000; Hart and Myrold 1996). Despite the uncertainties mentioned above, the consumption rates for NH4
+ was probably more accurate than the consumption rates for NO3
-, since the initial pools of NO3- in the
samples were smaller. Included in the consumption of NO3- are microbial assimilation,
DNRA and denitrification. DNRA stands for 2-6 % of the total consumption of NO3-, with no
significant differences between the soil types. As a result the higher DNRA rates in UP can neither be derived from the fact that it is an anoxic process favoured by high water content, nor that it is thought to be favoured by a high C:N ratio (Fazzolari, Nicolardot et al. 1998). The explanation is rather that the total consumption rates are generally higher for that soil type.
16
5. Conclusions The aim of this study was to compare the gross transformation rates of N between a drained and an undrained peat soil by using the isotope dilution technique. Although this study might be too small to draw definitive conclusions about the effect of drainage, these results give suggestions about the N dynamics in peat soil.
- The NH4+ pool was more than twice as large in undrained peat as in the drained. This
was also reflected in the gross transformation rates where the mineralization rates in the undrained peat were higher. This was probably a consequence of the high SOM content in the undrained peat rather than the water content.
- The water content of the soil had a larger impact on the nitrification rates. The nitrification rates were slightly higher in the drained peat, which was due to the lower water content and the improved aeration of the soil.
- DNRA stands for 2-6 % of total consumption of NO3-, and there were no significant
differences between the soil types.
17
6. Acknowledgements Special thanks to
Tobias Rütting, my supervisor, for your dedication, support whenever needed and good advises. I’ve learnt a lot!
Katja VanNieuland, at the University of Gent, for wonderful help and enthusiasm in the lab, and for introducing us to a lot of good Belgian specialties during our weeks in Gent.
Leif Klemedtsson, for encouraging conversations and enthusiastic help with a little of everything.
Vivian Aldén and Mats Räntfors for helping in the lab and for analyzing our samples in Gothenburg. Robert Björk for help with the sampling in Skogaryd.
Elin Julén, for good company during long days in the lab, especially in Gent. The lab work would have taken twice as long if it weren’t for you!
18
7. References
Aber, J. D., McDowell, W., et al. (1998). "Nitrogen saturation in temperate forest ecosystems." Bioscience 48(11): 921-934.
Ambus, P., Mosier, A., et al. (1992). "Nitrogen turnover rates in a riparian fen determined by 15N dilution." Biology and Fertility of Soils 14(4): 230-236.
Booth, M. S., Stark, J. M., et al. (2005). "Controls on nitrogen cycling in terrestrial ecosystems: A synthetic analysis of literature data." Ecological Monographs 75(2): 139-157.
Davidson, E. A., Hart, S., et al. (1991). "Measuring gross nitrogen mineralization, immobilization and nitrification by 15N isotopic pool dilution in intact soil cores." European Journal of Soil Science 42(3): 335-349.
Davidson, E. A., Hart, S. C., et al. (1992). "Internal Cycling of Nitrate in Soils of a Mature Coniferous Forest." Ecology 73(4): 1148-1156.
Di, H. J., Cameron, K. C., et al. (2000). "Isotopic dilution methods to determine the gross transformation rates of nitrogen, phosphorus, and sulfur in soil: a review of the theory, methodologies, and limitations." Australian Journal of Soil Research 38(1): 213-230.
Ernfors, M. (2009). "Greenhouse gas fluxes between drainerd forested peatlands and the atmosphere." [Ph.D. Thesis] Department of Plant and Environmental Sciences, University of Gothenburg, Gothenburg
Fazzolari, l., Nicolardot, B., et al. (1998). "Simultaneous effects of increasing levels of glucose and oxygen partial pressures on denitrification and dissimilatory nitrate reduction to ammonium in repacked soil cores." European Journal of Soil Biology 34(1): 47-52.
Galloway, J., Townsend, A., et al. (2008). "Transformation of the nitrogen cycle: Recent trends, questions, and potential solutions." SCIENCE 320(5878): 889-892.
Galloway, J. N., Aber, J. D., et al. (2003). "The nitrogen cascade." Bioscience 53(4): 341-356. Hart, S. C. and Myrold, D. D. (1996). 15N Tracer studies of soil nitrogen transformations.
Mass spectrometry of soils. Boutton, T. W. and Yamasaki, S.-i., Marcel Dekker, Inc.: 225-245.
Hart, S. C., Nason, G. E., et al. (1994). "Dynamics of Gross Nitrogen Transformations in an Old-Growth Forest: The Carbon Connection." Ecology 75(4): 880-891.
Huber, C., Oberhauser, A., et al. (2002). "Deposition of ammonia to the forest floor under spruce and beech at the Hoglwald site." Plant and Soil 240(1): 3-11.
Kasimir-Klemedtsson, Klemedtsson, L., et al. (1997). "Greenhouse gas emissions from farmed organic soils: a review." Soil Use and Management 13(4): 245-250.
Kirkham, D. and Bartholomew, W. V. (1954). "Equations for following nutrient transformations in soil, utilizing tracer data." Soil Science Society of America Proceedings 18(1): 33-34.
Klemedtsson, L., von Arnold, K., et al. (2005). "Soil CN ratio as a scalar parameter to predict nitrous oxide emissions." Global Change Biology 11(7): 1142-1147.
19
Kreutzer, K., Butterbach-Bahl, K., et al. (2009). "The complete nitrogen cycle of an N-saturated spruce forest ecosystem." Plant Biology 11(5): 643-649.
Münchmeyer, U., Russow, R., et al. (2000). "Net and Gross Nitrogen Mineralization in Drained and Reflooded Fen Soils." Isotopes in Environmental and Health Studies 36(1): 79 - 98.
Robertson, G. P. and Groffman, P. M. (2006). Nitrogen transformations. Soil Microbiology, Ecology and Biochemistry Paul, E. A., Elsevier: 341- 364.
Saghir, N. S., Mulvancy, R. L., et al. (1993). "Determination of nitrogen by microdiffusion in mason Jars. I. inorganic nitrogen in soil extracts." Communications in Soil Science and Plant Analysis 24(13): 1745-1762.
Schlesinger, W. H. (1997). Biogeochemistry - an analysis of global change. Amsterdam, Academic Press.
Silver, W. L., Herman, D. J., et al. (2001). "Dissimilatory nitrate reduction to ammonium in upland tropical forest soils." Ecology 82(9): 2410-2416.
Stevens, R. J. and Laughlin, R. J. (1994). "Determining nitrogen-15 in nitrite or nitrate by producing nitrous oxide." Soil Science Society of America Journal 58(4): 1108-1116.
Stevens, R. J. and Laughlin, R. J. (1995). "Nitrate transformations during soil extraction with potassium chloride." Soil Science Society of America Journal 59(3): 933-938.
Vitousek, P. M., Aber, J. D., et al. (1997). "Human alteration of the global nitrogen cycle: sources and consequenses." Ecological Applications 7(3): 737-750.
Westbrook, C. J. and Devito, K. J. (2004). "Gross nitrogen transformations in soils from uncut and cut boreal upland and peatland coniferous forest stands." Biogeochemistry 68(1): 33-49.
20
Appendix
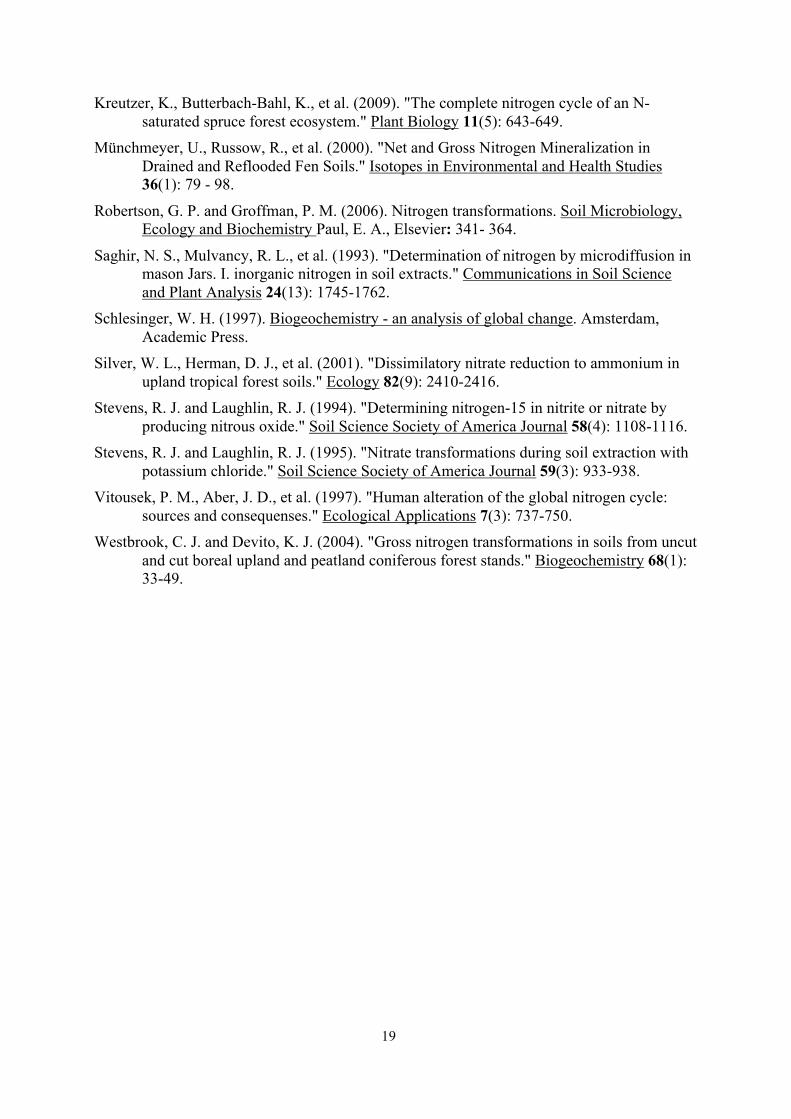
Appendix A – Atom % of 15N Table A1. Atom % of 15N from NH4
+.
Label 15NH4+ 15NO3
-
t0 t1 t0 t1
55.2 9.60 0.39 0.51
31.3 15.0 0.45 1.79
Drained peat
25.8 10.4 0.43 1.34
24.8 19.0 0.43 2.44
24.5 14.9 0.46 3.98
Undrained peat
19.4 -† 0.41 2.49
† This value from the IRMS was not accurate, and therefore not included in the calculations.
Table A2. Atom % of 15N from NO3-.
Label 15NH4+ 15NO3
-
t0 t1 t0 t1
0.95 7.99 17.53 13.92
6.67 14.80 65.29 40.67
Drained peat
4.29 28.45 66.08 34.58
0.36 0.20 88.48 79.47
0.41 0.26 87.62 80.66
Undrained peat
0.48 2.08 87.87 65.75
21
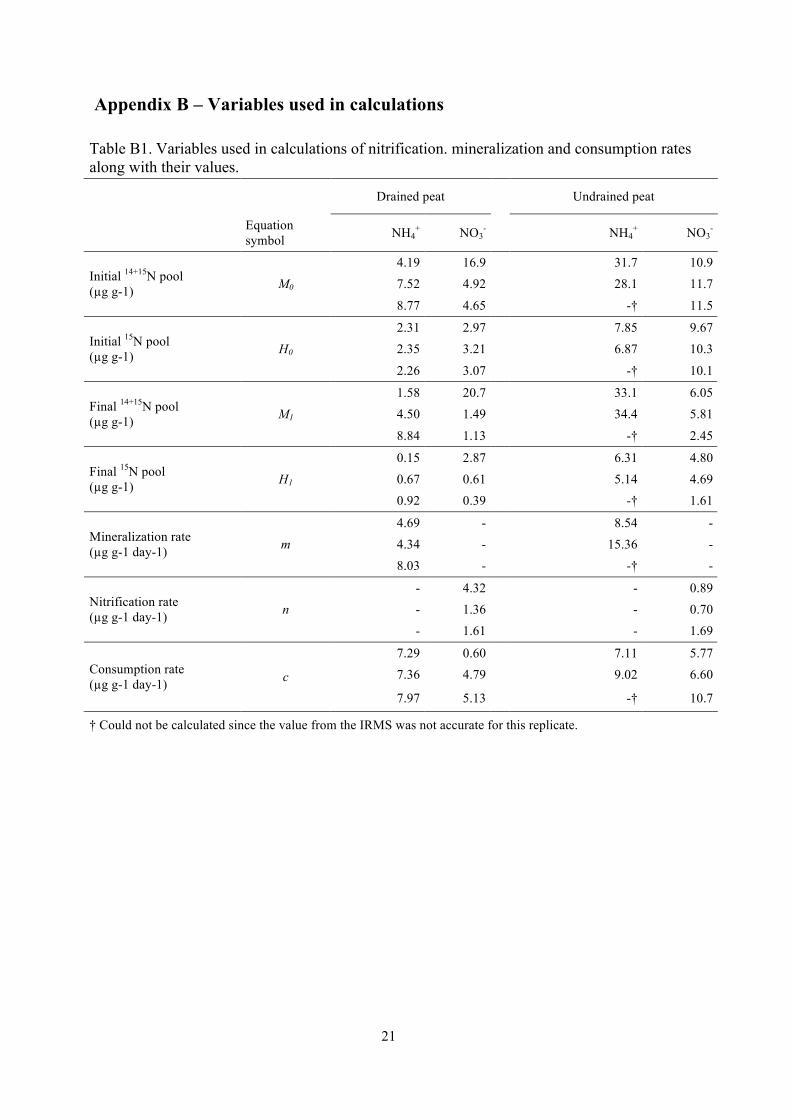
Appendix B – Variables used in calculations
Table B1. Variables used in calculations of nitrification. mineralization and consumption rates along with their values.
Drained peat Undrained peat
Equation symbol NH4
+ NO3- NH4
+ NO3-
4.19 16.9 31.7 10.9 7.52 4.92 28.1 11.7 Initial 14+15N pool
(µg g-1) M0
8.77 4.65 -† 11.5
2.31 2.97 7.85 9.67 2.35 3.21 6.87 10.3 Initial 15N pool
(µg g-1) H0
2.26 3.07 -† 10.1
1.58 20.7 33.1 6.05 4.50 1.49 34.4 5.81 Final 14+15N pool
(µg g-1) M1
8.84 1.13 -† 2.45
0.15 2.87 6.31 4.80 0.67 0.61 5.14 4.69 Final 15N pool
(µg g-1) H1 0.92 0.39 -† 1.61
4.69 - 8.54 - 4.34 - 15.36 - Mineralization rate
(µg g-1 day-1) m 8.03 - -† -
- 4.32 - 0.89 - 1.36 - 0.70 Nitrification rate
(µg g-1 day-1) n - 1.61 - 1.69
7.29 0.60 7.11 5.77 7.36 4.79 9.02 6.60 Consumption rate
(µg g-1 day-1) c 7.97 5.13 -† 10.7
† Could not be calculated since the value from the IRMS was not accurate for this replicate.
22
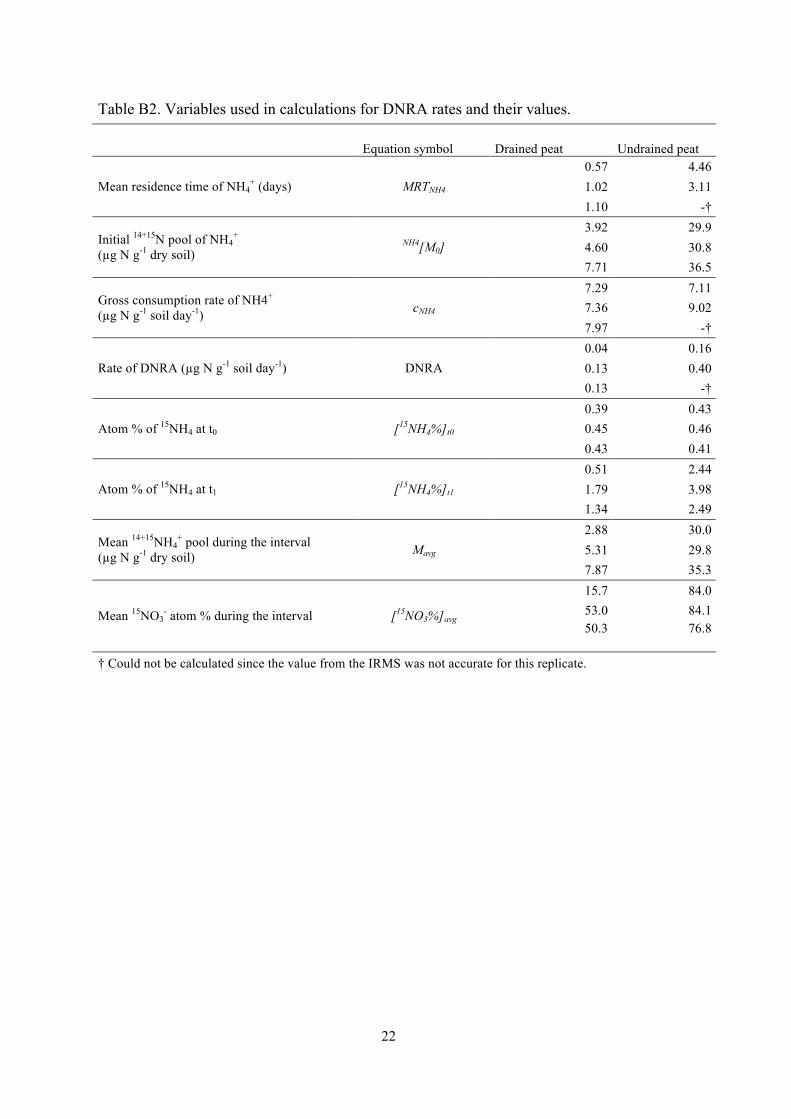
Table B2. Variables used in calculations for DNRA rates and their values.
Equation symbol Drained peat Undrained peat 0.57 4.46 1.02 3.11 Mean residence time of NH4
+ (days) MRTNH4
1.10 -† 3.92 29.9 4.60 30.8 Initial 14+15N pool of NH4
+ (µg N g-1 dry soil)
NH4[M0] 7.71 36.5 7.29 7.11 7.36 9.02 Gross consumption rate of NH4+
(µg N g-1 soil day-1) cNH4 7.97 -† 0.04 0.16 0.13 0.40 Rate of DNRA (µg N g-1 soil day-1) DNRA 0.13 -† 0.39 0.43 0.45 0.46 Atom % of 15NH4 at t0 [15NH4%]t0 0.43 0.41 0.51 2.44 1.79 3.98 Atom % of 15NH4 at t1 [15NH4%]t1 1.34 2.49 2.88 30.0 5.31 29.8 Mean 14+15NH4
+ pool during the interval (µg N g-1 dry soil) Mavg
7.87 35.3 15.7 84.0 53.0 84.1 Mean 15NO3
- atom % during the interval [15NO3%]avg 50.3 76.8
† Could not be calculated since the value from the IRMS was not accurate for this replicate.