Embed Size (px)
Citation preview

How does breakfast help manage body weight?
The plausible mechanisms
Dr Sue Reeves, Tina Smith, Lewis Halsey & Jorg Huber

Does breakfast help manage body weight?
To answer this question we wanted to investigate: – Why breakfast eaters tend to be slimmer
than breakfast skippers (Ruxton & Kirk, 1997).
– Physiological differences between breakfast eaters and skippers.
Earlier studies focused on differences in energy intake but often found breakfast eaters tended to consume more than skippers (de al Hunty, Gibson & Ashwell, 2012).

• Consumption of breakfast did not alter activity levels.
• Significantly less calcium and folate were consumed with no breakfast
• Differences in compensatory behaviour in terms of the amounts and timing of food consumption between habitual breakfast eaters and breakfast skippers.
“If there are no differences in energy intakes then perhaps this is due to differences in Energy Expenditure” (Timlin et al., 2008).

Usual breakfast routine and BMI
Farschi et al. (2005a, 2005b) indicated differences in thermic effect of food to missed meals between lean & obese.
Schlundt et al. (1992) obese women wanting to lose weight, lost more weight when they switched their usual morning routine.
Lean
60
80
100
120
Before Intervention After Intervention
TEF
(kJ
in 3
h)
Breakfast
No breakfast
Obese
60
80
100
120
Before Intervention After Intervention
TEF
(kJ
in 3
h)
Regular meals
Irregular meals
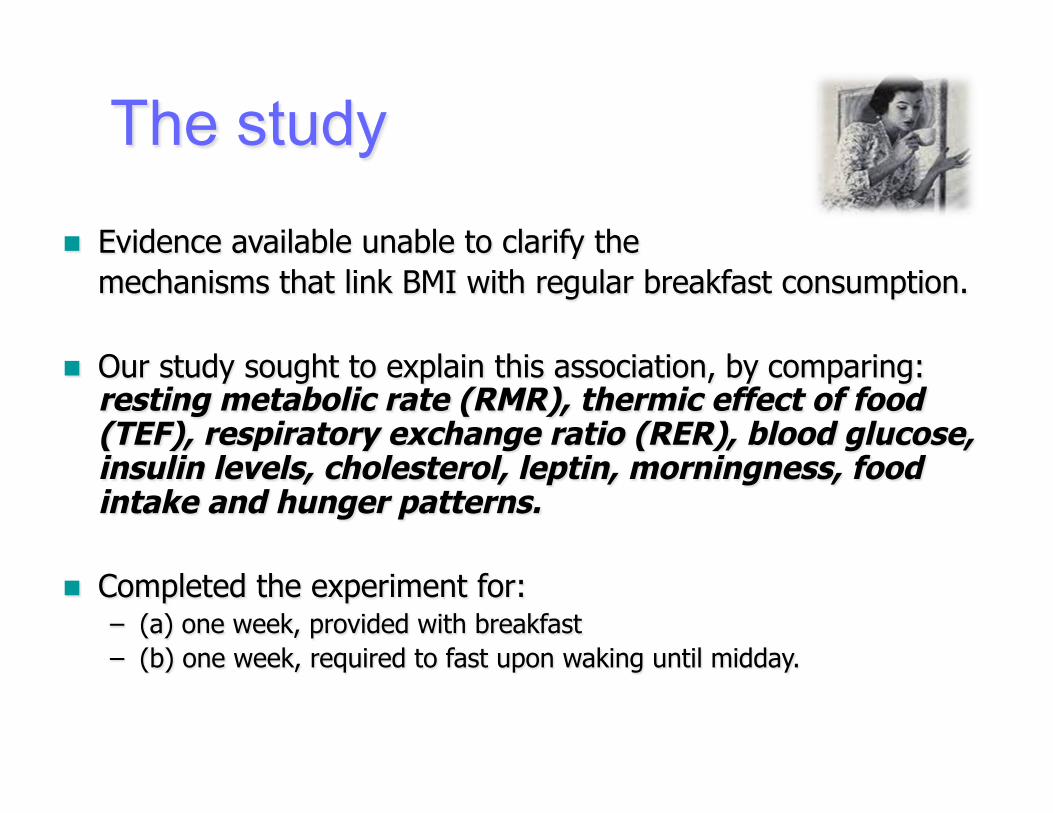
The study n Evidence available unable to clarify the
mechanisms that link BMI with regular breakfast consumption.
n Our study sought to explain this association, by comparing: resting metabolic rate (RMR), thermic effect of food (TEF), respiratory exchange ratio (RER), blood glucose, insulin levels, cholesterol, leptin, morningness, food intake and hunger patterns.
n Completed the experiment for: – (a) one week, provided with breakfast – (b) one week, required to fast upon waking until midday.
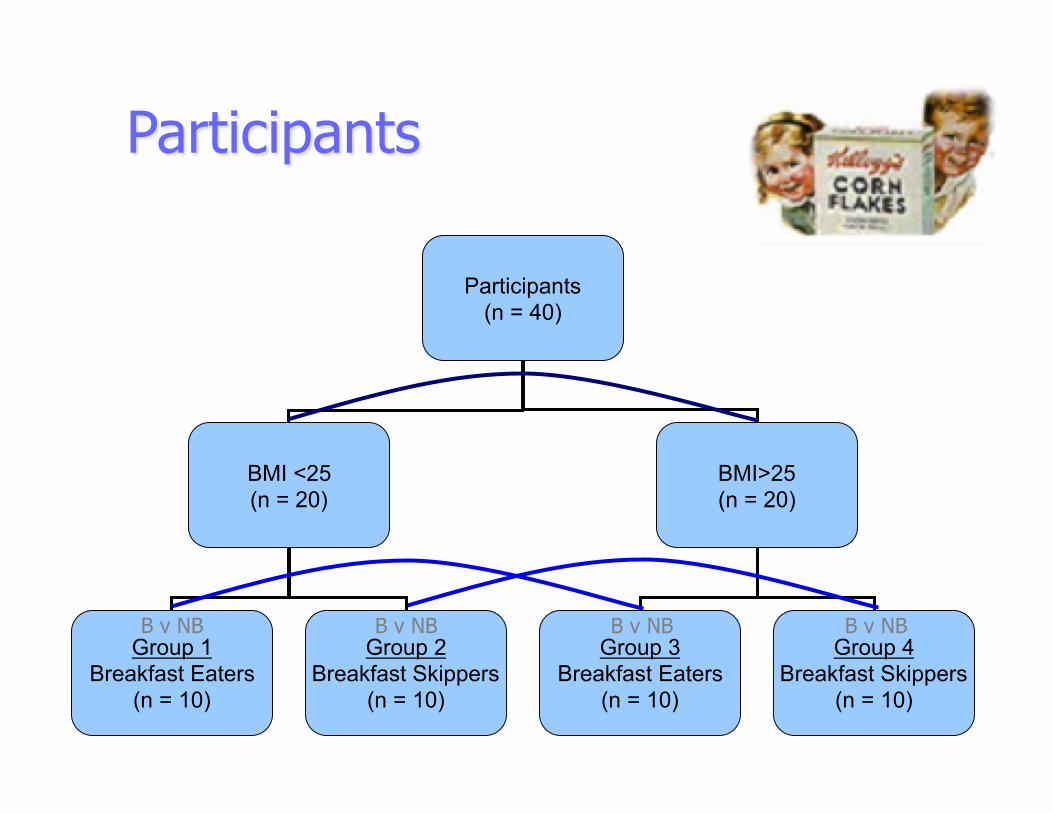
Participants
Participants (n = 40)
BMI <25 (n = 20)
BMI>25 (n = 20)
Group 1 Breakfast Eaters
(n = 10)
Group 2 Breakfast Skippers
(n = 10)
Group 3 Breakfast Eaters
(n = 10)
Group 4 Breakfast Skippers
(n = 10)
B v NB B v NB B v NB B v NB

Protocol
n Familiarisation & 2 occasions in each breakfast condition.
n Breakfast / No breakfast
n 7 am, participants lie down resting, baseline measurements made.
n Douglas bags, blood samples and hunger ratings measured every 30 min for 3 hours.
n Repeated measures mixed models ANOVAs were run as appropriate.
n Testing: April ‘11 - Jan ‘12.
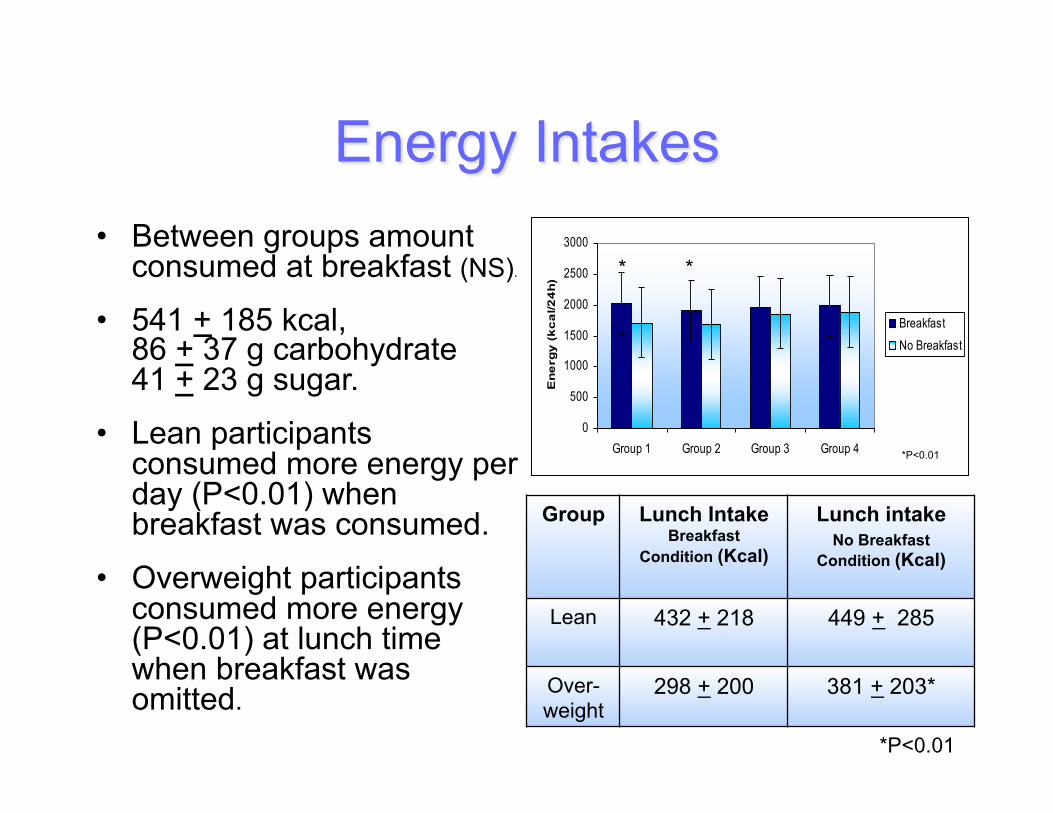
Energy Intakes • Between groups amount
consumed at breakfast (NS).
• 541 + 185 kcal, 86 + 37 g carbohydrate 41 + 23 g sugar.
• Lean participants consumed more energy per day (P<0.01) when breakfast was consumed.
• Overweight participants consumed more energy (P<0.01) at lunch time when breakfast was omitted.
Group Lunch Intake Breakfast
Condition (Kcal)
Lunch intake No Breakfast
Condition (Kcal)
Lean 432 + 218
449 + 285
Over-weight
298 + 200 381 + 203*
*P<0.01
0
500
1000
1500
2000
2500
3000
Group 1 Group 2 Group 3 Group 4
En
erg
y (
kc
al/2
4h
)
Breakfast
No Breakfast
* *
*P<0.01

Energy intake of overweight participants in Breakfast & No - Breakfast conditions.
0
50
100
150
200
250
300
350
400
6 7 8 9 10 11 12 13 14 15 16 17 18 19 20 21 22 23 24 25 26 27 28 29
Time (Hours)
Energy In
take (K
cal)

Macronutrients: Percentage contribution to total energy intakes
0%10%20%30%40%50%60%70%80%90%
100%
1 2 3 4 1 2 3 4
Breakfast No Breakfast
FatProteinCarb* *
* P<0.05

Hunger
0
10
20
30
40
50
60
70
80
90
100
BL 1 2 3 4 5 6
VAS Score (%)
Sample
Mean VAS Score (Breakfast)Group 1
Group 2
Group 3
Group 4
0
10
20
30
40
50
60
70
80
90
100
BL 1 2 3 4 5 6
VAS Score (%)
Sample
Mean VAS Score (Non-‐Breakfast)Group 1
Group 2
Group 3
Group 4

0.0
0.1
0.2
0.3
0.4
0.5
0.6
0.7
0.8
0.9
1.0
Group 1 Group 2 Group 3 Group 4
RER
Resting Metabolic Rate (RMR) & Respiratory Exchange Ratio (RER)
Group RMR (kcal/day)
RMR (kcal/kg/day)
1 1672 +277 24.9 + 3
2 1589 + 324 24.4 + 4
3 1709 + 379 19.6 + 3*
4 1722 + 194 21.2 + 3
*P<0.05
*
RER in breakfast condition
P<0.05

0.0
1.0
2.0
3.0
4.0
5.0
6.0
7.0
8.0
9.0
10.0
Group 1 Group 2 Group 3 Group 4
TEF (kcal/k
g/d)
Mean of Tests 1 -‐ 6Breakfast
Non-‐Breakfast
Thermic Effect of Food (TEF)
*
*P<0.05
-‐100
0
100
200
300
400
500
600
1 2 3 4 5 6
TEF (kcal/d)
Sample
BreakfastGroup 1
Group 2
Group 3
Group 4
-‐100
0
100
200
300
400
500
600
1 2 3 4 5 6
TEF (kcal/d)
Sample
Non-‐BreakfastGroup 1
Group 2
Group 3
Group 4
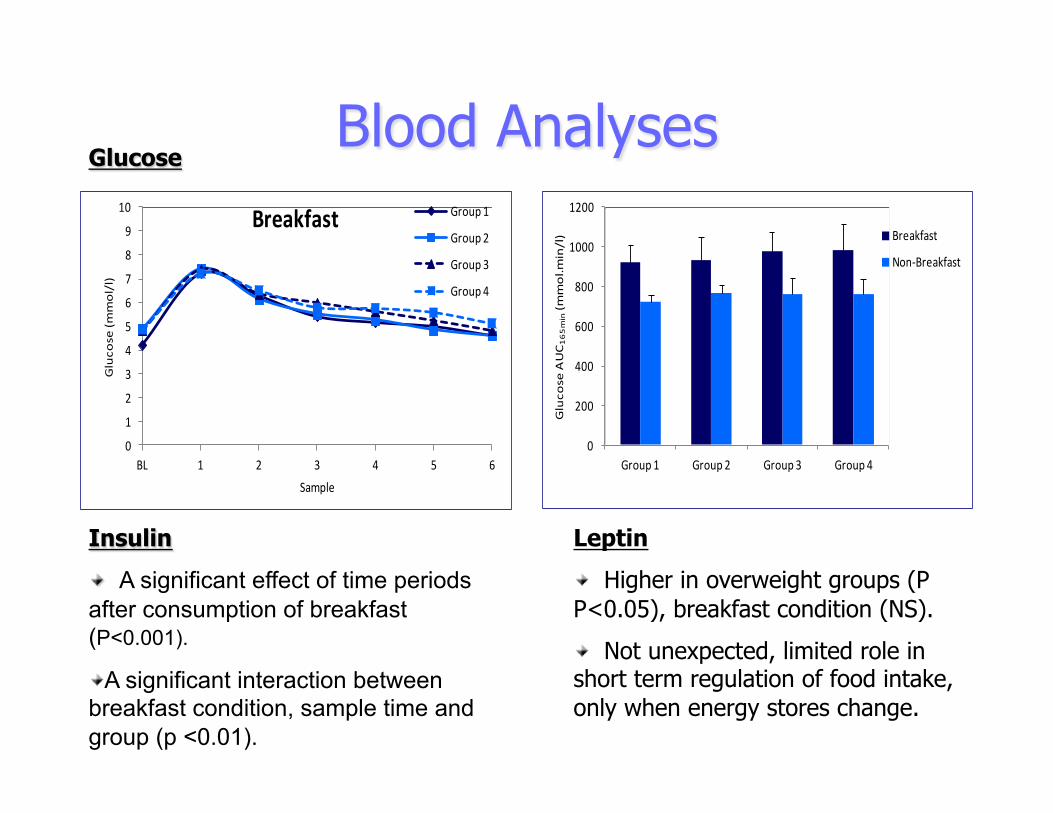
Blood Analyses
Insulin
" A significant effect of time periods after consumption of breakfast (P<0.001).
" A significant interaction between breakfast condition, sample time and group (p <0.01).
Leptin
" Higher in overweight groups (P P<0.05), breakfast condition (NS).
" Not unexpected, limited role in short term regulation of food intake, only when energy stores change.
0
1
2
3
4
5
6
7
8
9
10
BL 1 2 3 4 5 6
Glucose (m
mol/l)
Sample
Breakfast Group 1
Group 2
Group 3
Group 4
0
200
400
600
800
1000
1200
Group 1 Group 2 Group 3 Group 4
Glucose AUC165min(m
mol.m
in/l) Breakfast
Non-‐Breakfast
Glucose

Physical Activity
0
2000
4000
6000
8000
10000
12000
14000
Group 1 Group 2 Group 3 Group 4
Step
s per day
Breakfast Week
Non-‐Breakfast Week
*
*P<0.05

Morningness & Caffeine
0
10
20
30
40
50
Group 1 Group 2 Group 3 Group 4
Morningne
ss Score
Morningness Scores Daily Caffeine Intake
0
100
200
300
400
500
Group 1 Group 2 Group 3 Group 4
Caffeine
Con
sumption (m
g/day)
*
*P<0.05
*

Summary of findings
Overweight
Replace energy and carb. Intakes
Eater later in the day
Lower RMR per kg
Higher leptin levels
Skippers
Less hungry in the morning
Lower levels of morningess
Consume more caffeine
Higher RER
Overweight Skippers
Blunted thermic effect of food
More physically active
+ +

Possible mechanisms to explain the relationship between breakfast & BMI
Breakfast Skipping &
BMI
Positive Energy Balance
Altered Behavioural Response
Altered Metabolic Response
Chronic Exposure
á Ghrelin
â PYY & âCCK
â Thyroid Hormones
á Energy Intake (appetite, snacks, energy dense foods)
â Resting EE & TEF
(Impaired insulin sensitivity)
(adapted from Betts et al., 2011).

Conclusion
l Overweight skippers warrant further attention.
l Appear to be at greater risk of metabolic disturbances and cardio-vascular disease.
l Further studies investigating role of hunger hormones and metabolism and also breakfast interventions.
NOT
V
Perhaps the aim of further research should not be: ‘ to investigate why breakfast eaters tend to be slimmer than skippers?’
but ‘why breakfast skippers are not slimmer?’

Acknowledgements
n Tina Smith n Martha Villegas-Montes n Tom Reeve n Jennifer Elgumati n Yasmin H. Farahany n Mernez Ijadi
n Jenny Walton