Embed Size (px)
DESCRIPTION
How do we interpret Confidence Intervals (Merit)? A 95% Confidence Interval DOES NOT mean that there is a 95 % probability that the population mean lies in the interval. - PowerPoint PPT Presentation
Citation preview
1
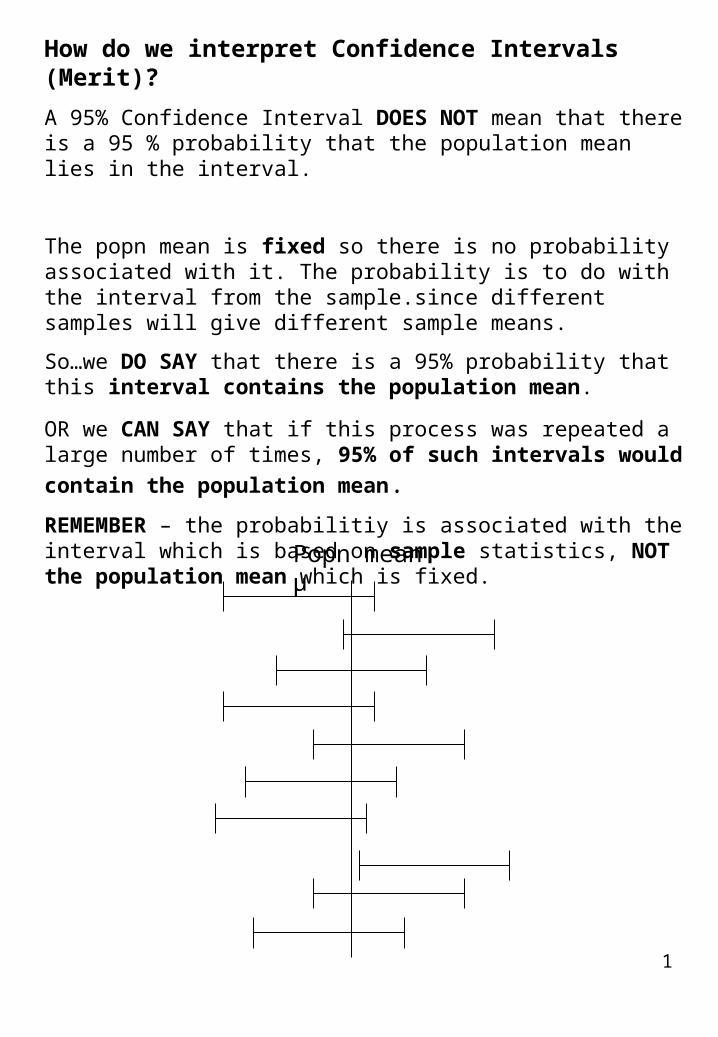
How do we interpret Confidence Intervals (Merit)?
A 95% Confidence Interval DOES NOT mean that there is a 95 % probability that the population mean lies in the interval.
The popn mean is fixed so there is no probability associated with it. The probability is to do with the interval from the sample.since different samples will give different sample means.
So…we DO SAY that there is a 95% probability that this interval contains the population mean.
OR we CAN SAY that if this process was repeated a large number of times, 95% of such intervals would contain the population
mean.
REMEMBER – the probabilitiy is associated with the interval which is based on sample statistics, NOT the population mean which is fixed.
Popn mean μ
2
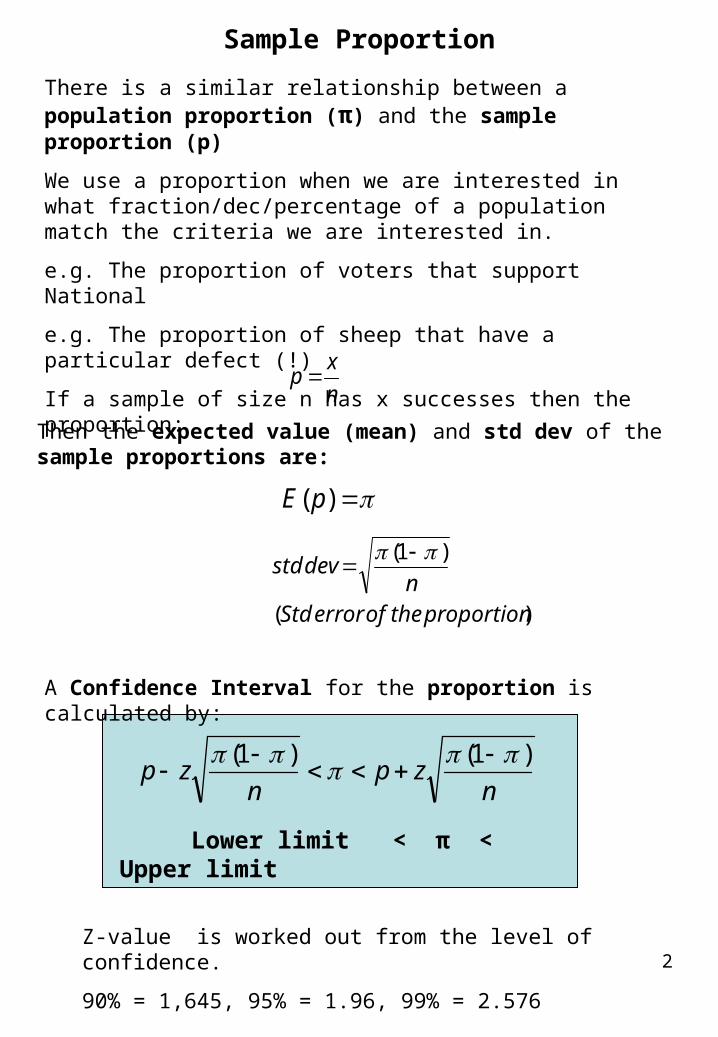
Sample Proportion
There is a similar relationship between a population proportion (π) and the sample proportion (p)
We use a proportion when we are interested in what fraction/dec/percentage of a population match the criteria we are interested in.
e.g. The proportion of voters that support National
e.g. The proportion of sheep that have a particular defect (!)
If a sample of size n has x successes then the proportion:
n
xp
Then the expected value (mean) and std dev of the sample proportions are:
)( pE
)(
)1(
proportiontheoferrorStdn
devstd
nzp
nzp
)1()1(
A Confidence Interval for the proportion is calculated by:
Z-value is worked out from the level of confidence.
90% = 1,645, 95% = 1.96, 99% = 2.576
Lower limit < π < Upper limit
3
Confidence Interval for ProportionThe same process is used for confidence intervals for proportions as for means except the parameter is the population proportion and its standard deviation (std error):
Example 1. A recent poll of 1000 voters showed that 545 would vote for National in the coming election.
a) Calculate a 95% confidence interval for the proportion of voters who would vote for National.
b) Explain what this confidence interval means:
Use GC for CI:
Clevel = 0.95
X = 545, n = 1000
Example 2. A supermarket retailer conducted a survey which included a question on preference of brands of chocolate confectionery. They surveyed 150 customers and found that 40% preferred Cadbury chocolate confectionery.
Calculate a 99% confidence interval for the proportion of customers that prefer Cadbury chocolate confectionery.
57586.051413.01000
)455.0(545.0645.1545.0
1000
)455.0(545.0645.1545.0
645.1,1000,545,1000
545
znxp
There is a 95% probability that this interval contains the true proportion of voters who would vote National.
50303.029696.0150
)6.0(4.0576.24.0
150
)6.0(4.0576.24.0
576.2,150),150%40(60,4.0
znofxp
4
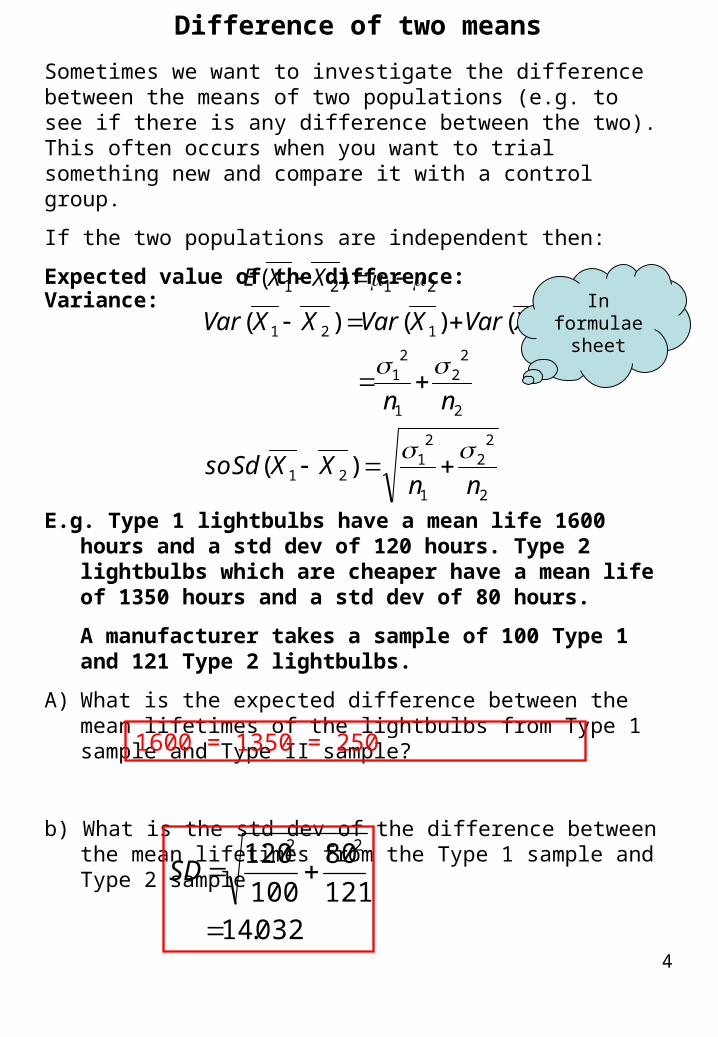
Difference of two means
Sometimes we want to investigate the difference between the means of two populations (e.g. to see if there is any difference between the two). This often occurs when you want to trial something new and compare it with a control group.
If the two populations are independent then:
Expected value of the difference:
2121 )( XXE
2
22
1
21
21
2
22
1
21
2121
)(
)()()(
nnXXSdso
nn
XVarXVarXXVar
Variance:
E.g. Type 1 lightbulbs have a mean life 1600 hours and a std dev of 120 hours. Type 2 lightbulbs which are cheaper have a mean life of 1350 hours and a std dev of 80 hours.
A manufacturer takes a sample of 100 Type 1 and 121 Type 2 lightbulbs.
A) What is the expected difference between the mean lifetimes of the lightbulbs from Type 1 sample and Type II sample?
b) What is the std dev of the difference between the mean lifetimes from the Type 1 sample and Type 2 sample
In formulae sheet
1600 = 1350 = 250
032.14121
80
100
120 22
SD
5
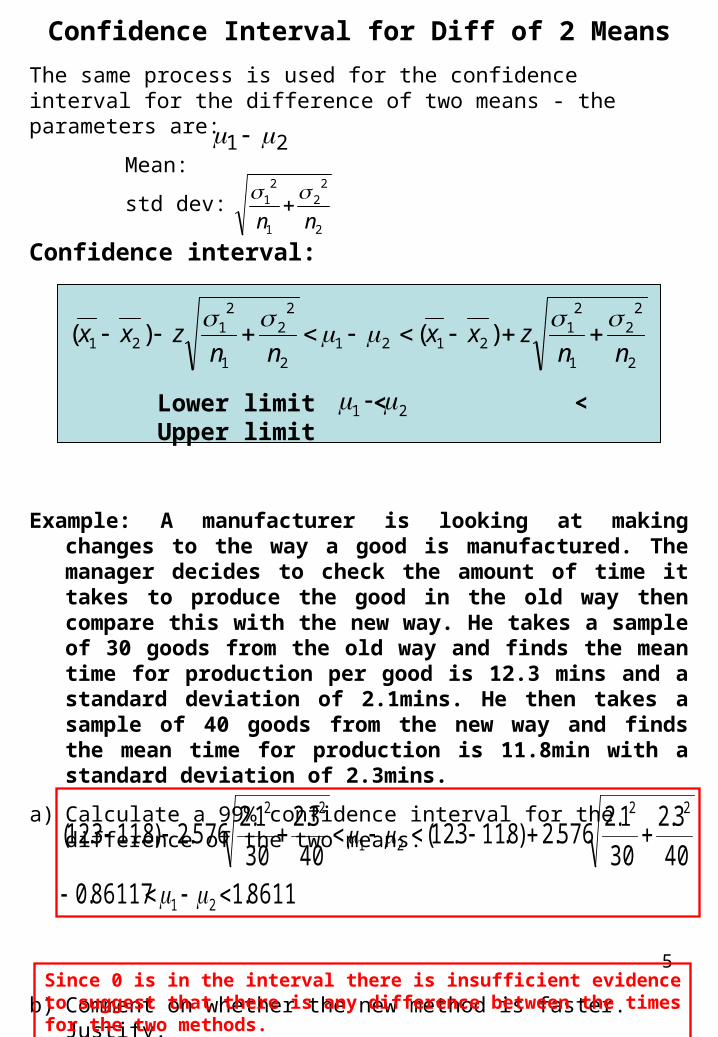
Confidence Interval for Diff of 2 Means
21
2
22
1
21
nn
2
22
1
21
21212
22
1
21
21 )()(nn
zxxnn
zxx
The same process is used for the confidence interval for the difference of two means - the parameters are:
Mean:
std dev:
Confidence interval:
Example: A manufacturer is looking at making changes to the way a good is manufactured. The manager decides to check the amount of time it takes to produce the good in the old way then compare this with the new way. He takes a sample of 30 goods from the old way and finds the mean time for production per good is 12.3 mins and a standard deviation of 2.1mins. He then takes a sample of 40 goods from the new way and finds the mean time for production is 11.8min with a standard deviation of 2.3mins.
a) Calculate a 99% confidence interval for the difference of the two means.
b) Comment on whether the new method is faster. Justify.
Lower limit < < Upper limit 21
8611.186117.040
3.2
30
1.2576.2)8.113.12(
40
3.2
30
1.2576.2)8.113.12(
21
22
21
22
Since 0 is in the interval there is insufficient evidence to suggest that there is any difference between the times for the two methods.
6
Sample Size (Merit) and Margin of error
en
z
en
z )1(
CIfor
CIfor
CIforz
%99576.2
,%9596.1
,%90645.1
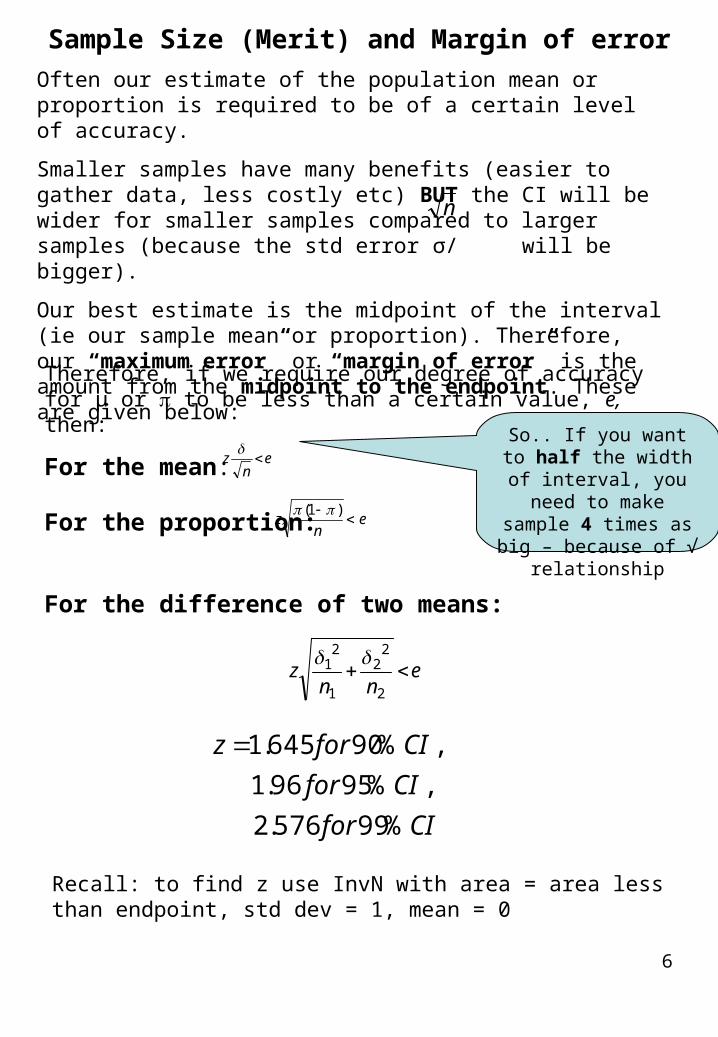
Often our estimate of the population mean or proportion is required to be of a certain level of accuracy.
Smaller samples have many benefits (easier to gather data, less costly etc) BUT the CI will be wider for smaller samples compared to larger samples (because the std error σ/ will be bigger).
Our best estimate is the midpoint of the interval (ie our sample mean or proportion). Therefore, our “maximum error” or “margin of error” is the amount from the midpoint to the endpoint. These are given below:
Therefore, if we require our degree of accuracy for μ or to be less than a certain value, e, then:
For the mean:
For the proportion:
Recall: to find z use InvN with area = area less than endpoint, std dev = 1, mean = 0
So.. If you want to half the width of interval, you need to make sample 4 times as big – because
of √ relationship
n
For the difference of two means:
enn
z 2
22
1
21
7
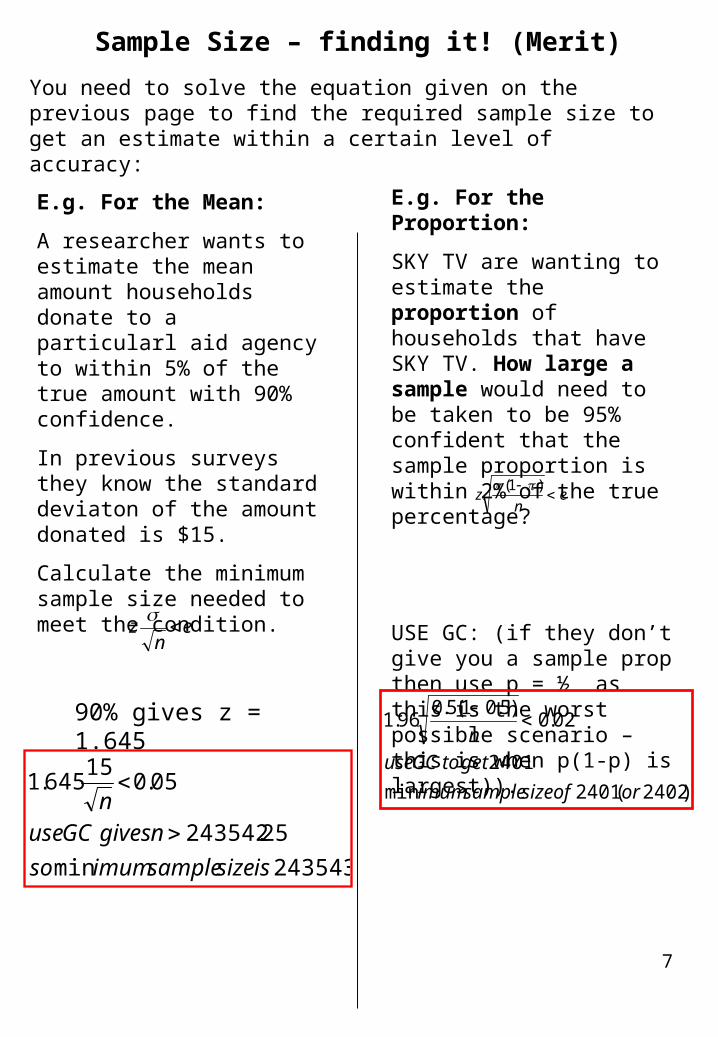
Sample Size – finding it! (Merit)
You need to solve the equation given on the previous page to find the required sample size to get an estimate within a certain level of accuracy:
E.g. For the Mean:
A researcher wants to estimate the mean amount households donate to a particularl aid agency to within 5% of the true amount with 90% confidence.
In previous surveys they know the standard deviaton of the amount donated is $15.
Calculate the minimum sample size needed to meet the condition.
E.g. For the Proportion:
SKY TV are wanting to estimate the proportion of households that have SKY TV. How large a sample would need to be taken to be 95% confident that the sample proportion is within 2% of the true percentage?
USE GC: (if they don’t give you a sample prop then use p = ½ as this is the worst possible scenario – this is when p(1-p) is largest)).e
nz
en
z )1(
90% gives z = 1.645
243543min
25.243542
05.015
645.1
issizesampleimumso
ngivesGCusen
)2402(2401min
2401
02.0)5.01(5.0
96.1
orofsizesampleimum
gettoGCusen
8
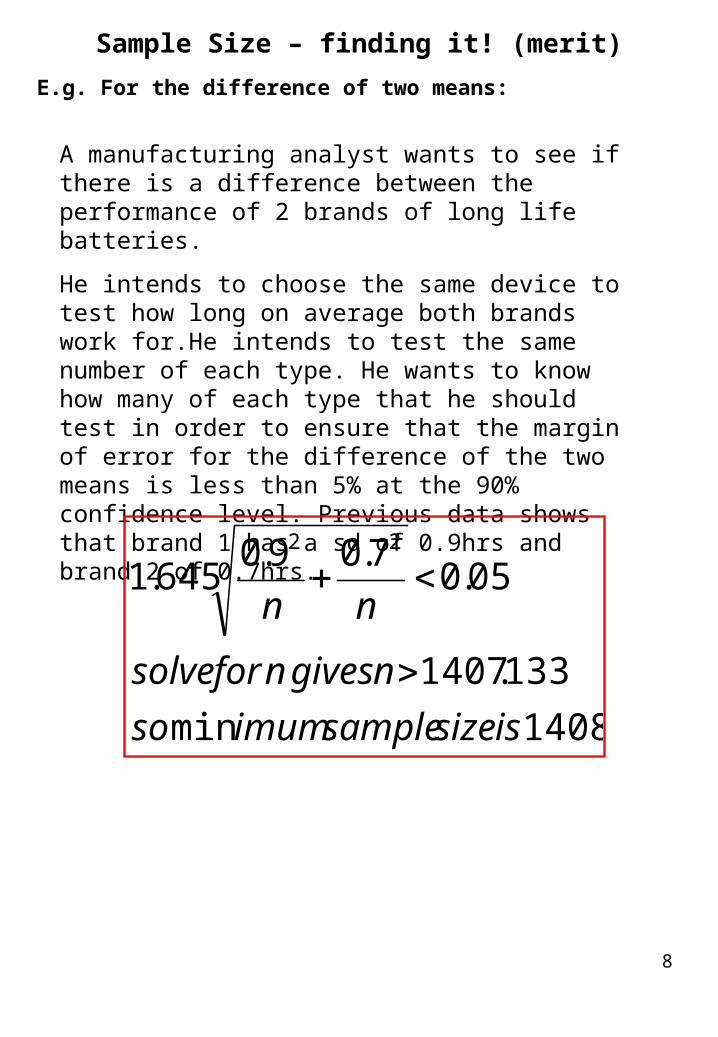
Sample Size – finding it! (merit)
E.g. For the difference of two means:
A manufacturing analyst wants to see if there is a difference between the performance of 2 brands of long life batteries.
He intends to choose the same device to test how long on average both brands work for.He intends to test the same number of each type. He wants to know how many of each type that he should test in order to ensure that the margin of error for the difference of the two means is less than 5% at the 90% confidence level. Previous data shows that brand 1 has a sd of 0.9hrs and brand 2 of 0.7hrs.
1408min
133.1407
05.07.09.0
645.122
issizesampleimumso
ngivesnforsolve
nn
9
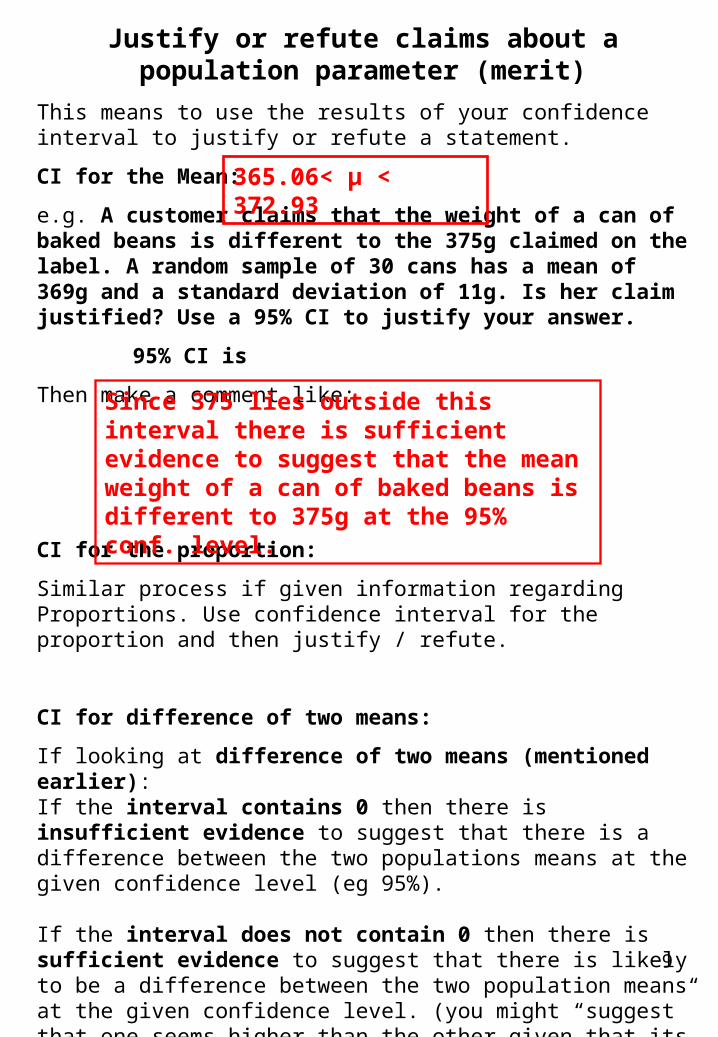
Justify or refute claims about a population parameter (merit)
This means to use the results of your confidence interval to justify or refute a statement.
CI for the Mean:
e.g. A customer claims that the weight of a can of baked beans is different to the 375g claimed on the label. A random sample of 30 cans has a mean of 369g and a standard deviation of 11g. Is her claim justified? Use a 95% CI to justify your answer.
95% CI is
Then make a comment like:
CI for the proportion:
Similar process if given information regarding Proportions. Use confidence interval for the proportion and then justify / refute.
CI for difference of two means:
If looking at difference of two means (mentioned earlier): If the interval contains 0 then there is insufficient evidence to suggest that there is a difference between the two populations means at the given confidence level (eg 95%).
If the interval does not contain 0 then there is sufficient evidence to suggest that there is likely to be a difference between the two population means at the given confidence level. (you might “suggest” that one seems higher than the other given that its sample mean was higher).
Always answer in CONTEXT
365.06< μ < 372.93
Since 375 lies outside this interval there is sufficient evidence to suggest that the mean weight of a can of baked beans is different to 375g at the 95% conf. level.