Embed Size (px)
Citation preview

www.nuffieldfoundation.org
Rebecca Allen & Sam Sims FFT Education Datalab
How do shortages of maths teachers affect the within-school allocation of maths teachers to pupils?
1
About the authors
• Rebecca Allen is an associate research fellow at Education Datalab • Sam Sims is a researcher at Education Datalab
About this report
This report presents the findings from the Nuffield-funded project to explore how shortages of maths teachers affect the within-in school allocation of maths teachers to pupils.
It complements the Gatbsy Charitable Goundation report on the profile of the mathematics teaching workforce in the further education college sector in England (Hayward & Homer, 2015), which was itself part of a collaboration between the two Foundations.
The report is available to download from http://www.nuffieldfoundation.org/reports-and-briefing-papers
About FFT Education DataLab
Education Datalab produce independent, cutting-edge research that can be used by policymakers to inform education policy, and by schools to improve practice.
About the Nuffield Foundation
The Nuffield Foundation funds research, analysis, and student programmes that advance educational opportunity and social well-being across the United Kingdom.
We want to improve people’s lives, and their ability to participate in society, by understanding the social and economic factors that affect their chances in life. The research we fund aims to improve the design and operation of social policy, particularly in Education, Welfare, and Justice.
Our student programmes - Nuffield Research Placements and Q-Step - provide opportunities for individual students, particularly those from disadvantaged backgrounds, to develop their skills and confidence in quantitative and scientific methods.
We are an independent charitable trust established in 1943 by William Morris, Lord Nuffield, the founder of Morris Motors.
www.nuffieldfoundation.org | @NuffieldFound
Extracts from this document may be reproduced for non-commercial purposes on condition that the source is acknowledged.
Copyright © Nuffield Foundation 2018 28 Bedford Square, London WC1B 3JS | Registered charity 206601
2
Contents
Tables ................................................................................................................................... 3
Figures .................................................................................................................................. 3
Foreword ............................................................................................................................... 5
Executive Summary .............................................................................................................. 7
1. Introduction: Teacher shortages and teacher allocation ................................................. 9
2. Data ............................................................................................................................. 10
3. Comparing the profiles of those teaching maths and English ....................................... 11
4. Allocation of teachers across Key Stages .................................................................... 16
5. Comparing schools with differing levels of post-16 maths resit entries ......................... 20
6. School demographic differences in the allocation of teachers across Key Stages ........ 23
7. Regional differences in the allocation of teachers across Key Stages .......................... 25
8. Conclusion ................................................................................................................... 27
References ......................................................................................................................... 29
Data appendix I – Local authority distribution of maths and English teachers ..................... 31

3
Tables
Table 1: Profile of those teaching maths and English in 2016 Error! Bookmark not defined.
Table 2: Career paths of those who were teaching maths and English in November 2010 ..................................................................................... Error! Bookmark not defined.4
Table 3: Key characteristics of those teaching maths and English at each Key Stage......... 17
Table 4: Key characteristics of those teaching maths at each Key Stage in schools with low, middle and high proportions of students taking a post-16 Level 2 maths qualification ......... 21
Figures
Figure 1: Teaching responsibilities in 2010 of the 2016 cohort of maths and English teachers ................................................................................. Error! Bookmark not defined.
Figure 2: Teaching responsibilities by 2016 of the 2010 cohort of maths and English teachers ................................................................................. Error! Bookmark not defined.
Figure 3: Variation across schools in the proportion of inexperienced maths teachers by Key Stage .................................................................................................................................. 18
Figure 4: Variation across schools in the proportion of maths teachers with a maths degree by Key Stage ...................................................................................................................... 19
Figure 5: Variation across schools in the proportion of English teachers with an English degree by Key Stage........................................................................................................... 20
Figure 6: Relationship between overall proportion of inexperienced maths teachers in school and teaching Key Stage 5 ................................................................................................... 22
Figure 7: Relationship between overall proportion without a maths degree in school and teaching Key Stage 5 .......................................................................................................... 22
Figure 8: Percentage of inexperienced teachers in each Key Stage for maths and English, by free school meals quintile of the school ............................................................................... 23
Figure 9: Percentage of teachers with a relevant degree in each Key Stage for maths and English, by free school meals quintile of the school ............................................................ 24
Figure 10: Percentage of maths and English lessons taught in each Key Stage by a teacher for whom it is their main subject .......................................................................................... 24
4
Figure 11: Percentage of maths and English lessons taught by inexperienced teachers across Key Stages .............................................................................................................. 25
Figure 12: Percentage of maths and English lessons taught by out-of-subject teachers across Key Stages .............................................................................................................. 26
Figure 13: Percentage of maths and English lessons taught by teachers for whom it is main subject, by Key Stage ......................................................................................................... 26
Figure 14: Percentage of lessons taught by inexperienced teachers in maths (left) and English (right) ...................................................................................................................... 31
Figure 15: Percentage of lessons taught by someone without relevant academic degree in maths (left) and English (right) ............................................................................................ 32
5
Foreword
The Nuffield Foundation has long been a champion for enabling all young people to study maths beyond the age of 16. Research we have funded has been influential both in demonstrating the comparatively low rates of participation in England, Wales, and Northern Ireland, and in developing ways to increase it. Most recently, this influence has been evident in the development of the new post-16 Core Maths qualification, and in the Smith Review of post-16 mathematics.
One of the most significant challenges in increasing participation is addressing the shortage of maths teachers, and we have been keen to understand more about the maths teaching workforce and issues relating to supply and retention. This report presents analysis of the ways in which schools have responded to the shortage, using the latest Schools Workforce Census (SWC).
The analysis presented in this report shows that in broad terms, schools deploy their more experienced maths teachers with the most relevant qualifications to teach year groups where the external stakes are high: GCSE, A-Level and GCSE retakes (Key Stages 4 and 5). This pattern is consistent across all schools, although those in disadvantaged areas are less likely to have teachers who fit this criteria, meaning that teacher shortages are having the biggest impact on pupils from disadvantaged backgrounds.
This deployment of more experienced teachers at Key Stage 5, while understandable, means that the shortage of maths teachers is being felt most keenly at Key Stage 3 (and to some degree Key Stage 4). At this age, young people’s attitudes to subjects and future study are crystallising. If maths teaching and learning is not as engaging or tuned to individual needs as might be desired there are significant risks of adverse effects on pupil outcomes and progression in those schools struggling to allocate specialist or experienced teachers for younger year groups.
We should also consider the implications of this analysis for increasing participation in post-16 maths. We welcome the government’s new advanced maths premium policy, which aims to increase post-16 participation by offering financial incentives to schools. However, the potential impact on teachers should also be considered. Putting more pressure on those already teaching maths at Key Stage 5 may have implications for retaining some of the most experienced and qualified maths teachers. We would urge government, schools, and the wider education community to pay close attention to findings from the National Foundation for Educational Research study into the effect of retention and turnover on the teaching workforce. Also funded by Nuffield, several outputs from the study have already been published, showing that long working hours, increased pressure, and lack of options for part-time and flexible working are all barriers to improving teacher retention.
In considering the analysis presented in this report, it is important to echo the authors’ point about the limitations of the data it draws upon. While the SWC offers some satisfactory

6
indicators of teacher shortages in schools, it does not provide the fine-grained workforce data required to fully understand the extent of shortages, the approaches schools take to managing them, or their impact on student outcomes. This lack of adequate data means we are limited in the conclusions we can draw, but the authors’ make good suggestions for how we might collect more, useful data.
Josh Hillman Director of Education Nuffield Foundation
7
Executive Summary
There are currently well-founded concerns about maths teacher shortages in England. The economic recovery has reduced maths teacher supply as employment opportunities have improved in the private sector. At the same time, demand for maths teachers has increased thanks to the requirement for all pupils without an A*–C grade in GCSE maths to continue studying the qualification until the age of 18. Shortages lead to disadvantaged secondary pupils having less access to experienced and well-qualified teachers (Allen & Sims, 2018).
This research addresses two questions. First, how have schools responded to a shortage of maths teachers? For example, are they using teachers who trained in other subjects to fill their staffing gaps in Key Stage 3? Second, can we use these behavioural responses as indicators of school-level maths teacher shortages.
We use data from England’s School Workforce Census (SWC)1 to construct a number of indicators of teacher shortages. We then compare these indicators between maths departments and English departments to investigate how maths departments have responded to shortages and to try and quantify the severity of maths teacher shortages in each school. We use English departments as a benchmark because their curriculum and qualification structure is similar to maths departments across Key Stages 3 to 5, while shortages are recognised to be worse in maths than in English (MAC, 2016).
How have schools responded to shortages of maths teachers?
Perhaps surprisingly, we find that many of the characteristics of secondary English and maths teachers are very similar. We find that those teaching maths are:
• Slightly older and more experienced • Slightly less likely to be new to the profession or unqualified • Have similar pay, suggesting similar school responsibilities • As likely to to be teaching most of their hours in maths, as English teachers are to be
teaching most of their hours in English • Teaching slightly more hours in maths in total than English teachers do in English,
which means we need 3,500 fewer maths teachers overall • Much less likely to have a maths degree than English teachers are to have an
English degree.
We compare changes in who is teaching maths and English between 2010 and 2016 to explore how teaching responsibilities change over teachers’ careers. Overall, this analysis shows that maths departments are less at risk of losing maths teaching hours to other school responsibilities, such as promotions to leadership roles. However, maths departments face two slightly higher attrition risks: new maths teachers are slightly more likely to leave the
1 https://www.gov.uk/education/school-workforce-censuses

8
profession than English teachers, perhaps because they are older; and maths departments have slightly higher numbers due for retirement soon.
The clearest conclusion from our analysis of how maths departments manage teacher shortages is that, where there are teachers who are inexperienced or do not have a degree in the subject, they are most frequently allocated to teach Key Stage 3 classes. This is true regardless of whether the school’s sixth form is delivering a large number of GCSE retake classes or not. Thus, it would seem that maths and English Heads of Department both place a value on ensuring that experienced and well-qualified teachers are delivering the GCSE retake and A Level (or equivalent) classes. Post-16 maths therefore seems to be insulated from direct harm by shortages of maths teachers, though of course if pupils arrive ill-prepared from Key Stage 3, this will have knock-on effects.
Can the staffing patterns of maths departments be used to quantify school-level shortages of maths teachers?
We construct three proxies for school-level maths teacher shortages: proportion of inexperienced teachers (having taught for less than two years); teachers without a relevant academic degree; and proportion of teaching hours delivered by a teacher outside their main subject. The first two of these proxies reproduce known patterns of teacher shortages, across regions and socio-economic groups. The third is less successful.
Overall, we conclude that metrics from the SWC, such as teacher inexperience or mis-matched academic degree, provided satisfactory, but rather blunt, indicators of teacher shortages in schools. In contrast to metrics such as applications per post, appointable applicants interviewed and headteacher perceptions of quality of applicants, they do not provide direct measures of school-level teacher shortages. If we are to understand how maths teacher shortages are affecting the education of children across schools and year groups then it will be necessary to collect this sort of data through e.g. an annual survey of headteachers.
9
1. Introduction: Teacher shortages and teacher allocation
Having a good teacher has an important impact on pupil attainment (Hanushek & Rivkin, 2012), particularly for pupils from disadvantaged households (Hamre & Pianta, 2005; Slater et al., 2012). The benefits of having access to good teachers can also be detected in pupils’ earnings as adults (Chetty et al., 2014). Moreover, the variation in teacher effectiveness appears to be particularly marked in mathematics (Burgess, 2015). It is therefore critical that schools are able to recruit, develop and retain good maths teachers.
Unfortunately, England has had an overall shortage of maths teachers since the 2012/13 academic year and severe shortages since the 2016/17 academic year (Sims, 2017). Indeed, a recent government report identified maths as having among the worst shortages of any subject (MAC, 2016). According to the Times Educational Supplement, which creates an index of success in appointing a teacher from their jobs portal and survey data, maths has been the most difficult subject to appoint to in every year since its index started in 2011 (TES Global, 2016).2
On the supply side, the shortage of maths teachers is in part accounted for by economic recovery (Chevalier et al., 2007) combined with the higher private sector wages available for those with a maths degree (MAC, 2016). This is consistent with maths and science teachers having among the highest rates of early-career attrition (Worth and De Lazzari, 2017). On the demand side, the shortage of maths teachers has been exacerbated by policy changes which have made it mandatory for all pupils without an A*–C grade in GCSE maths to continue studying the qualification until the age of 18 (Smith, 2017). There is also some evidence that the new GCSEs and Progress 8 accountability metric have caused many schools to increase maths and English timetables in Key Stages 4 and 3 (Worth and De Lazzari, 2017). Shortages appear to be concentrated in particular schools rather than particular regions (Department for Education, 2017), most likely because these schools are characterised by poor working conditions (Sims, 2017; Allen & Sims, 2018).
These shortages result in the sub-optimal recruitment and deployment of teachers. For example, survey research shows that school leaders respond to such shortages by making increased use of temporary teachers, lowering recruitment standards or increasing class sizes (Smithers & Robinson, 2000; Moor et al., 2006). In general, there is substantial variation in the quality of teachers within schools, as well as between schools (Hanushek & Rivkin, 2010). By allocating teachers to certain phases, Key Stages (International Standard Classification of Education (ISCED) levels) or ability groups, middle and senior leaders therefore determine which pupils get access to the best teachers and, by extension, which of them will make the most progress. During teacher shortages, these choices become more stark, for more schools.
2 Although note that English is also not particularly good in terms of recruitment.

10
There is a growing literature on the allocation of teachers to pupils within schools. The first strand of the literature has looked at which pupils get access to high quality teachers. Three studies from the US (Kalogrides et al., 2012; Loeb et al., 2012; Grissom et al., 2015) have found that classes containing disadvantaged pupils are more likely to get inexperienced or less qualified teachers. In England, two comparable studies have been conducted; one found that teachers with no post-compulsory qualifications in maths were more likely to be allocated to low-ability sets (Moor et al., 2006), and the other found that classes containing disadvantaged pupils were more likely to have inexperienced teachers (Allen & Sims, 2018). In the US, three studies have used direct measures of teachers’ ability to improve attainment, and all three found that classes with disadvantaged pupils are slightly less likely to get teachers with high value-added scores (Sass et al., 2010; Isenberg et al., 2013; Mansfield, 2015). The second strand of the literature has looked at how schools respond to accountability incentives in allocating their teachers. For example, Boyd et al. (2008) show that the introduction of a fourth-grade examination, the results of which would be used in accountability measures, led schools to reallocate their experienced teachers to fourth-grade classes.
In this paper, we use a number of indicators of teacher shortages to identify which schools are struggling to recruit and retain maths teachers. We then investigate how schools are allocating their maths teachers to different Key Stages. We find that inexperienced and out-of-subject maths teachers are much more likely to be allocated to Key Stage 3 than Key Stages 4 or 5. This finding holds across most regions of the country and irrespective of the level of pupils resitting maths GCSE during Key Stage 5. The pattern is particularly marked in schools with higher levels of deprivation.
2. Data
Our analysis uses data from England’s School Workforce Census (SWC). This is a large administrative dataset which contains demographic, employment, absence, curriculum and qualification data on all teachers working in English state schools since 2010/11. The majority of the analysis in this paper uses the November 2016 Census, though we also use data from November 2010 to analyse changes in teacher timetables.
Throughout the analysis we compare teachers of maths to teachers of English. We include all teachers of these subjects, even if they only teach one lesson a week. In the first part of our analysis, we explore the demographic and career characteristics for all maths and English teachers that we can identify (unfortunately a minority of schools do not submit accurate curriculum data). In the second part of our analysis, we restrict the sample to schools with students in Key Stages 3, 4 and 5, where we are reasonably confident that the curriculum file is complete. We do this by dropping all schools without a sixth form and those schools who have unusually low or high maths or English teacher-to-pupil ratios at Key Stage 3 or 4. This leaves us with 1,149 schools included in our main analysis.

11
We cannot observe teacher shortages in schools through vacancies or job advertisement rates directly. Instead, we use three indirect indicators of teacher shortages. The first indicator is whether the teacher is inexperienced, which we define as being unqualified or in their first or second year of teaching. This amounts to 14% of secondary school teachers (who have a curriculum file) in the SWC. The second indicator is whether the teacher has an academic degree in maths (in maths departments) and English (in English departments). We count all Bachelor’s, Master’s and Doctoral degrees. Teachers are able to supply more than one subject for each degree (via a JACS3 code) and so joint honours degree subjects are all included (see Allen, 2017, for further notes on how this is calculated).
Thirdly, we identify the subject in which they teach the most hours and create indicators for whether their main subject is maths or English. This last indicator is a poor proxy for the thing we would ideally measure, i.e. whether the teacher originally trained to teach in maths or English. This information is rarely recorded in the qualification file – it is missing for about two-thirds of teachers. For those without missing information, we can see that 82% of those whose main subject today is maths actually trained to be maths teachers. The equivalent figure for English is 88%.
To compare how teacher shortages are distributed across different type of schools, we use a further indicator for the region and the deprivation of the school’s intake. We measure the school’s deprivation quintile via the proportion of pupils who qualify for free school meals (for a discussion of the use of free school meals as a measure of deprivation, see Hobbs and Vignoles, 2010).
3. Comparing the profiles of those teaching maths and English
In this section, we compare the demographic profile of maths teachers (more in shortage) and English teachers (less in shortage). We find that there are few clear differences, except for maths teachers are far less likely to have a degree in maths (44%) than English teachers are to have a degree in English (65%). We then analyse transitions into and out of teaching maths and English over time. We find that maths departments are less likely than English departments to lose maths teaching hours to other responsibilities in the school e.g. leadership activities. By contrast, maths departments lose more (40%) than English departments (36%) of teachers during their first six years in the profession.
There are many similarities between maths and English departments in secondary schools. Both subjects have similar timetable commitments in Key Stages 3 and 4. Where a school has a sixth form, they usually deliver both GCSE (or other level 2) resit qualifications alongside A Levels in maths and English. Moreover, both departments will generally teach all pupils in a school at GCSE level. This means that, as a country, we need almost identical
3 Joint Academic Coding System - https://www.hesa.ac.uk/support/documentation/jacs
12
numbers of teaching hours in these two subjects. Despite similar levels of demand, we know that maths teachers are in greater shortage (MAC, 2016).
Recruitment difficulties may manifest themselves in differences in the demographic profiles of maths and English teachers. Table 1 compares English and maths teachers on a range of characteristics, revealing few stark differences. Compared to English teachers, maths teachers (i.e. those teaching maths, weighted by number of maths teaching hours):
• Are 0.5 years older and 0.4 years less experienced • Are slightly less likely to be unqualified (5% for Maths, 7% for English) • Have similar pay, suggesting similar school responsibilities • Are as likely to to be teaching most of their hour in maths, as English teachers are to
be teaching most of their hours in English • Are teaching slightly more hours in maths, than English teachers are in English.
These differences in average hours taught per teachers mean that we need 3,500 fewer maths teachers overall
• Much less likely to have a maths degree (44%) than English teachers are to have an English degree (65%). Among maths teachers that do not have a maths degree, the two largest groups are those with physics and economics/business degrees.
In summary, besides clear differences in proportions teaching outside their own academic degree subject, maths and English teachers do look reasonably similar.

13
Table 1: Profile of those teaching maths and English in 2016 Maths English All secondary
Mean (S.D.) Mean (S.D.) Mean (S.D.) Age 38.47 (10.74) 36.98 (10.16) 38.06 (10.10) QTS 95%
93%
95%
Experience in years 11.02 (9.25) 10.59 (8.75) 11.52 (8.89) Inexperience 15%
17%
14%
Pay within-school percentile
45.03 (27.93) 44.48 (28.05) 47.32 (27.43)
Academic degree maths 44%
0%
7%
Academic degree English 1%
65%
12%
Main subject maths 98%
0%
15%
Main subject English 0%
97%
15%
Tenure in years 5.42 (6.25) 5.21 (5.89) 6.31 (6.61) Permanent contract 92%
91%
92%
Full-time equivalent hours 0.97 (0.11) 0.96 (0.12) 0.96 (0.13) Number of teachers 26,557
29,039
170,644
Average number of teaching Hours
14.86
13.54
16.19
Notes: observations weighted by number of teaching hours in relevant subject
We now turn to look at whether transitions of teachers between November 2010 and 2016 reveal material differences in the career paths within these two subjects. Table 2 groups those teaching maths and English according to their years of experience so far in November 2010. We then track their employment and promotion status by November 2016.
This shows that the proportions having left the profession (state-funded schools in England) is much higher in maths than in English at the very start of the career, but thereafter becomes very similar. The proportions that reach assistant, deputy or headship are shown because senior leadership responsibilities is one route by which teachers can reduce their teaching hours (and so need to be replaced by new teachers). These figures show that slightly higher numbers of English than maths teachers gain promotion to assistant head (or higher), which might explain why English teachers’ average teaching hours are lower in Table 1.
14
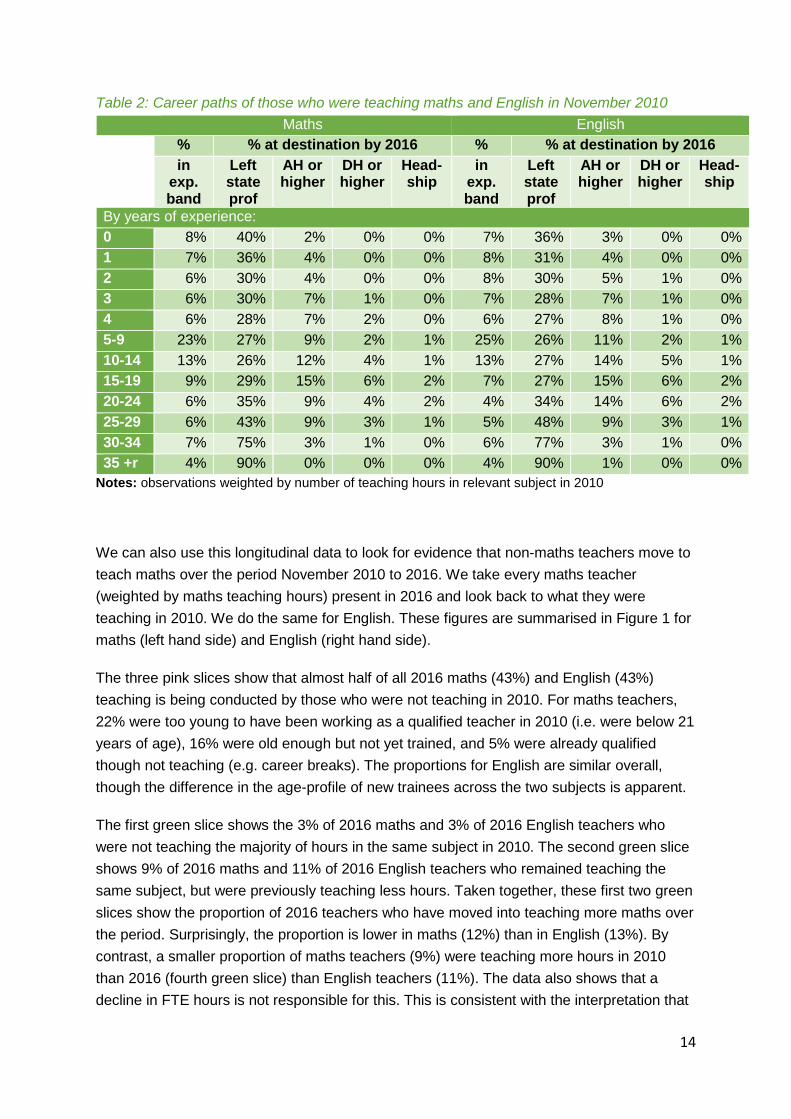
Table 2: Career paths of those who were teaching maths and English in November 2010 Maths English
% % at destination by 2016 % % at destination by 2016 in
exp. band
Left state prof
AH or higher
DH or higher
Head-ship
in exp. band
Left state prof
AH or higher
DH or higher
Head-ship
By years of experience: 0 8% 40% 2% 0% 0% 7% 36% 3% 0% 0% 1 7% 36% 4% 0% 0% 8% 31% 4% 0% 0% 2 6% 30% 4% 0% 0% 8% 30% 5% 1% 0% 3 6% 30% 7% 1% 0% 7% 28% 7% 1% 0% 4 6% 28% 7% 2% 0% 6% 27% 8% 1% 0% 5-9 23% 27% 9% 2% 1% 25% 26% 11% 2% 1% 10-14 13% 26% 12% 4% 1% 13% 27% 14% 5% 1% 15-19 9% 29% 15% 6% 2% 7% 27% 15% 6% 2% 20-24 6% 35% 9% 4% 2% 4% 34% 14% 6% 2% 25-29 6% 43% 9% 3% 1% 5% 48% 9% 3% 1% 30-34 7% 75% 3% 1% 0% 6% 77% 3% 1% 0% 35 +r 4% 90% 0% 0% 0% 4% 90% 1% 0% 0%
Notes: observations weighted by number of teaching hours in relevant subject in 2010
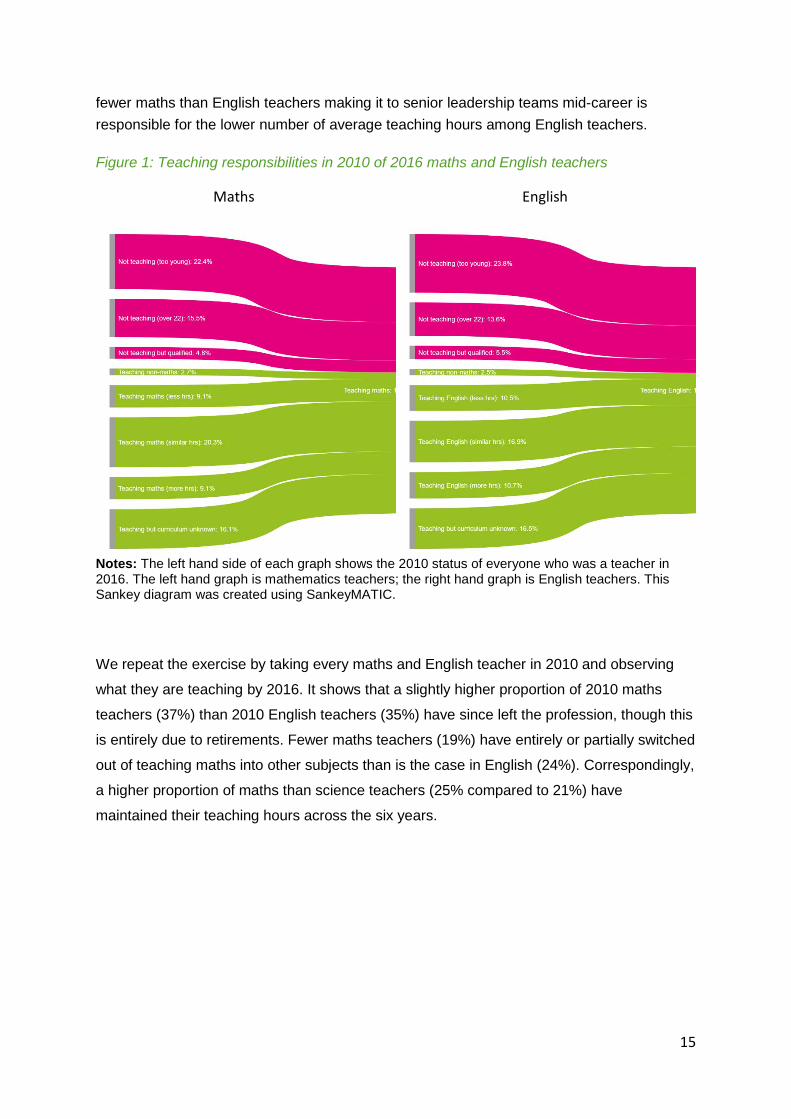
We can also use this longitudinal data to look for evidence that non-maths teachers move to teach maths over the period November 2010 to 2016. We take every maths teacher (weighted by maths teaching hours) present in 2016 and look back to what they were teaching in 2010. We do the same for English. These figures are summarised in Figure 1 for maths (left hand side) and English (right hand side).
The three pink slices show that almost half of all 2016 maths (43%) and English (43%) teaching is being conducted by those who were not teaching in 2010. For maths teachers, 22% were too young to have been working as a qualified teacher in 2010 (i.e. were below 21 years of age), 16% were old enough but not yet trained, and 5% were already qualified though not teaching (e.g. career breaks). The proportions for English are similar overall, though the difference in the age-profile of new trainees across the two subjects is apparent.
The first green slice shows the 3% of 2016 maths and 3% of 2016 English teachers who were not teaching the majority of hours in the same subject in 2010. The second green slice shows 9% of 2016 maths and 11% of 2016 English teachers who remained teaching the same subject, but were previously teaching less hours. Taken together, these first two green slices show the proportion of 2016 teachers who have moved into teaching more maths over the period. Surprisingly, the proportion is lower in maths (12%) than in English (13%). By contrast, a smaller proportion of maths teachers (9%) were teaching more hours in 2010 than 2016 (fourth green slice) than English teachers (11%). The data also shows that a decline in FTE hours is not responsible for this. This is consistent with the interpretation that
15
fewer maths than English teachers making it to senior leadership teams mid-career is responsible for the lower number of average teaching hours among English teachers.
Figure 1: Teaching responsibilities in 2010 of 2016 maths and English teachers
Maths English
Notes: The left hand side of each graph shows the 2010 status of everyone who was a teacher in 2016. The left hand graph is mathematics teachers; the right hand graph is English teachers. This Sankey diagram was created using SankeyMATIC.
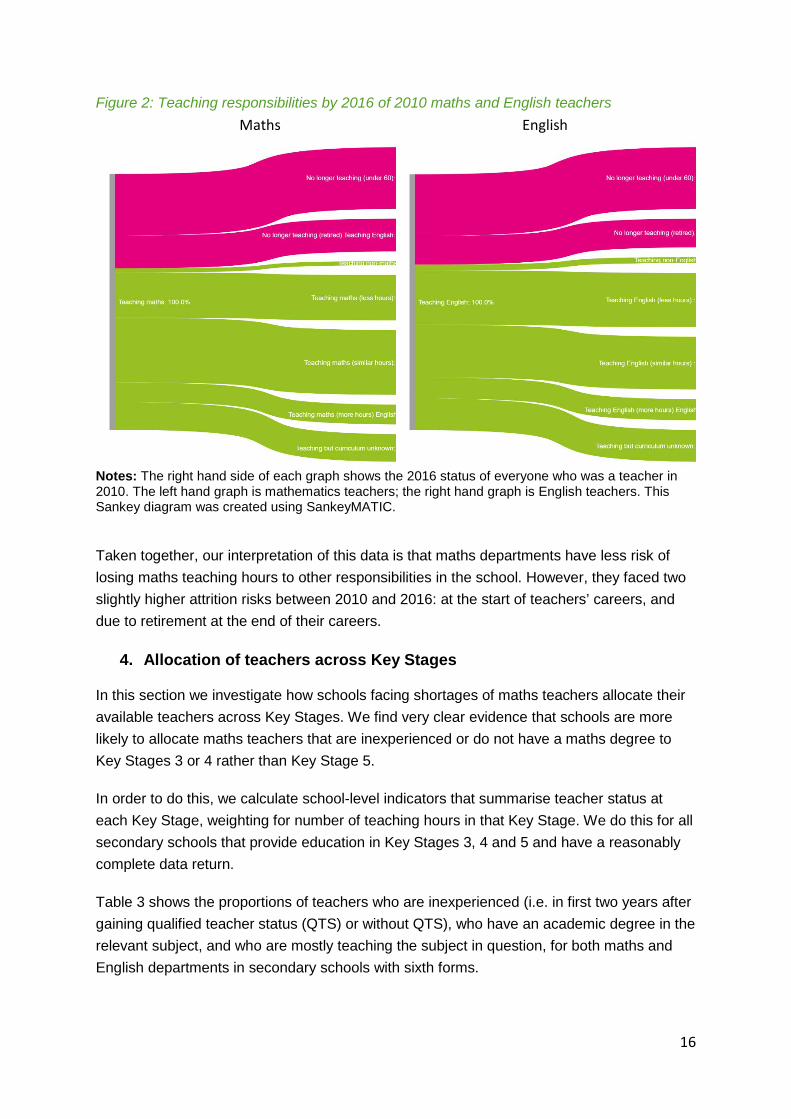
We repeat the exercise by taking every maths and English teacher in 2010 and observing
what they are teaching by 2016. It shows that a slightly higher proportion of 2010 maths
teachers (37%) than 2010 English teachers (35%) have since left the profession, though this
is entirely due to retirements. Fewer maths teachers (19%) have entirely or partially switched
out of teaching maths into other subjects than is the case in English (24%). Correspondingly,
a higher proportion of maths than science teachers (25% compared to 21%) have
maintained their teaching hours across the six years.
16
Figure 2: Teaching responsibilities by 2016 of 2010 maths and English teachers Maths English
Notes: The right hand side of each graph shows the 2016 status of everyone who was a teacher in 2010. The left hand graph is mathematics teachers; the right hand graph is English teachers. This Sankey diagram was created using SankeyMATIC.
Taken together, our interpretation of this data is that maths departments have less risk of losing maths teaching hours to other responsibilities in the school. However, they faced two slightly higher attrition risks between 2010 and 2016: at the start of teachers’ careers, and due to retirement at the end of their careers.
4. Allocation of teachers across Key Stages
In this section we investigate how schools facing shortages of maths teachers allocate their available teachers across Key Stages. We find very clear evidence that schools are more likely to allocate maths teachers that are inexperienced or do not have a maths degree to Key Stages 3 or 4 rather than Key Stage 5.
In order to do this, we calculate school-level indicators that summarise teacher status at each Key Stage, weighting for number of teaching hours in that Key Stage. We do this for all secondary schools that provide education in Key Stages 3, 4 and 5 and have a reasonably complete data return.
Table 3 shows the proportions of teachers who are inexperienced (i.e. in first two years after gaining qualified teacher status (QTS) or without QTS), who have an academic degree in the relevant subject, and who are mostly teaching the subject in question, for both maths and English departments in secondary schools with sixth forms.
17
The allocation of teachers across Key Stages is clear in both subjects. On average, schools tend to allocate their less-experienced and well-qualified teachers to teach maths and English at Key Stage 3. Key Stage 5 typically seems to have the most experienced and well-qualified teachers.
Table 3: Key characteristics of those teaching maths and English at each Key Stage Maths English
Mean (S.D.) Mean (S.D.) % inexperienced All maths teaching 14% (13%) 15% (14%)
KS3 teaching hours 19% (18%) 20% (18%) KS4 teaching hours 12% (13%) 13% (13%) KS5 teaching hours 7% (12%) 6% (11%)
% academic degree in subject
All maths teaching 48% (27%) 68% (28%) KS3 teaching hours 43% (28%) 66% (29%) KS4 teaching hours 48% (28%) 70% (28%) KS5 teaching hours 57% (32%) 72% (32%)
% teaching it as main subject
All maths teaching 98% (3%) 97% (3%) KS3 teaching hours 97% (6%) 95% (6%) KS4 teaching hours 99% (2%) 98% (4%) KS5 teaching hours 99% (4%) 98% (6%)
Notes: observations weighted by number of teaching hours in relevant subject and Key Stage
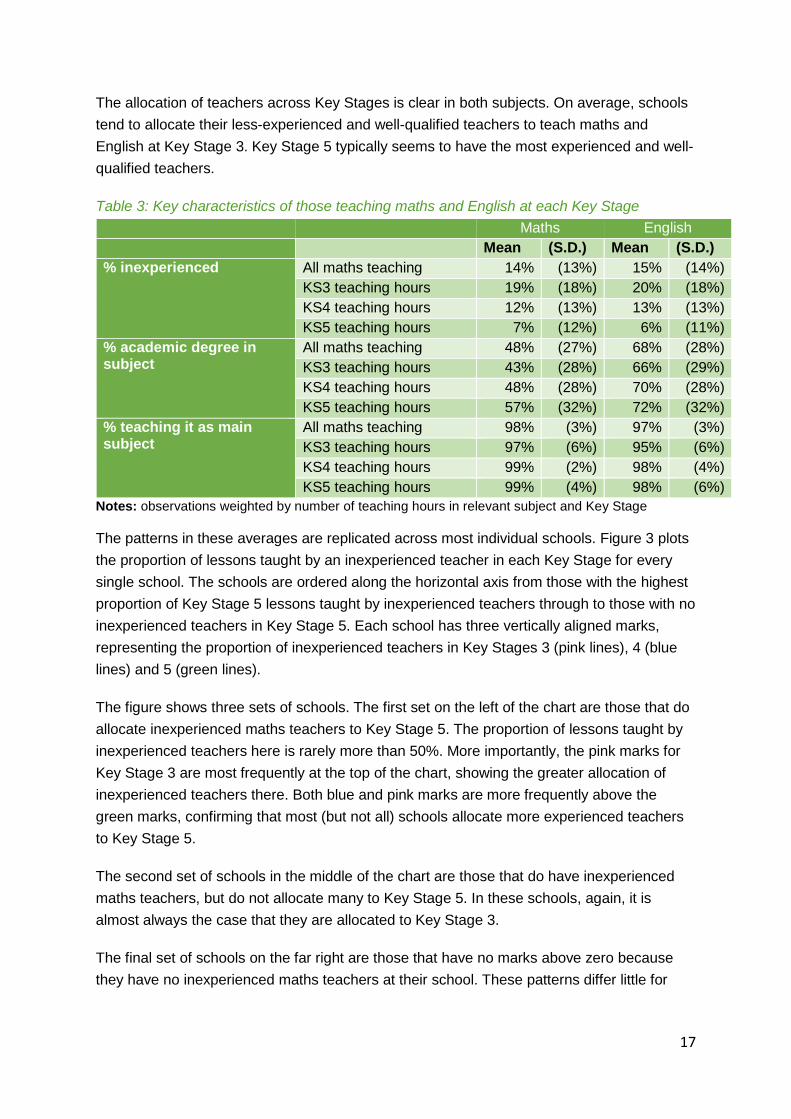
The patterns in these averages are replicated across most individual schools. Figure 3 plots the proportion of lessons taught by an inexperienced teacher in each Key Stage for every single school. The schools are ordered along the horizontal axis from those with the highest proportion of Key Stage 5 lessons taught by inexperienced teachers through to those with no inexperienced teachers in Key Stage 5. Each school has three vertically aligned marks, representing the proportion of inexperienced teachers in Key Stages 3 (pink lines), 4 (blue lines) and 5 (green lines).
The figure shows three sets of schools. The first set on the left of the chart are those that do allocate inexperienced maths teachers to Key Stage 5. The proportion of lessons taught by inexperienced teachers here is rarely more than 50%. More importantly, the pink marks for Key Stage 3 are most frequently at the top of the chart, showing the greater allocation of inexperienced teachers there. Both blue and pink marks are more frequently above the green marks, confirming that most (but not all) schools allocate more experienced teachers to Key Stage 5.
The second set of schools in the middle of the chart are those that do have inexperienced maths teachers, but do not allocate many to Key Stage 5. In these schools, again, it is almost always the case that they are allocated to Key Stage 3.
The final set of schools on the far right are those that have no marks above zero because they have no inexperienced maths teachers at their school. These patterns differ little for
18
English teachers, which is perhaps not surprising since the proportion of inexperienced teachers in English is quite similar.
Figure 3: Variation across schools in the proportion of inexperienced maths teachers by Key Stage
Notes: Each school is represented by three vertically aligned points: one for KS3 (red), one for KS4 (blue) and one for KS5 (green). Schools have been sorted by their proportion of inexperienced KS3 teachers. Inexperienced teachers are those with less than three years of experience following receipt of qualified teacher status. If a teacher teaches in multiple Key Stages then they contribute to the data for multiple Key Stages. Only secondary schools that deliver education in all three Key Stages are included in the graph. Schools with missing qualifications files are excluded from the analysis. N = 1,149 schools.
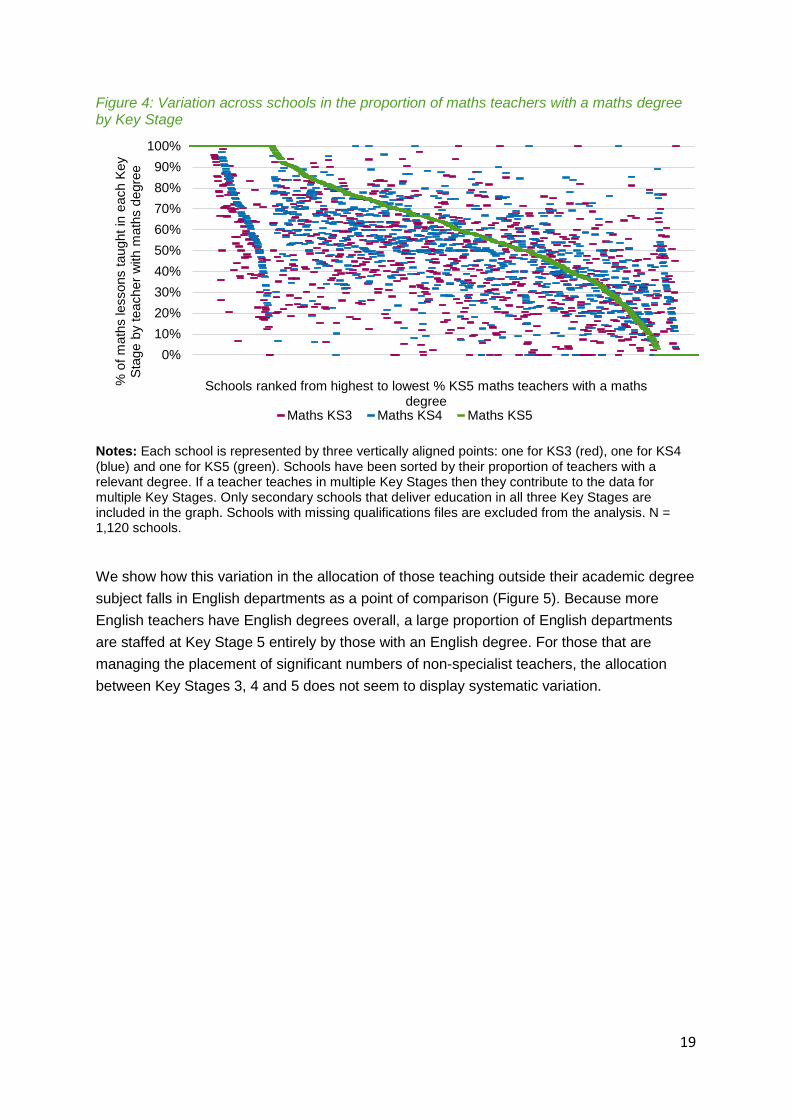
We now turn to our indicator of whether teachers have a degree in the relevant subject across each Key Stages in schools. As can be seen from Figure 4 below, teacher allocation to different Key Stages does not exhibit the same neat pattern of stratification displayed in Figure 3. Very few schools have all or no maths teachers with a maths degree. For those schools in the middle of the chart, where they must make decisions about the allocation of teachers without an academic degree in maths, there is more variation in where these teachers are placed. However, it is still the case that Key Stages 3 and 4 generally have fewer teachers with a maths degree than Key Stage 5.
0%
10%
20%
30%
40%
50%
60%
70%
80%
90%
100%
% o
f mat
hs le
sson
s in
eac
h K
ey S
tage
ta
ught
by
inex
perie
nced
teac
her
Schools ranked from highest to lowest % inexperienced teachers in maths KS5Maths KS3 Maths KS4 Maths KS5
19
Figure 4: Variation across schools in the proportion of maths teachers with a maths degree by Key Stage
Notes: Each school is represented by three vertically aligned points: one for KS3 (red), one for KS4 (blue) and one for KS5 (green). Schools have been sorted by their proportion of teachers with a relevant degree. If a teacher teaches in multiple Key Stages then they contribute to the data for multiple Key Stages. Only secondary schools that deliver education in all three Key Stages are included in the graph. Schools with missing qualifications files are excluded from the analysis. N = 1,120 schools.
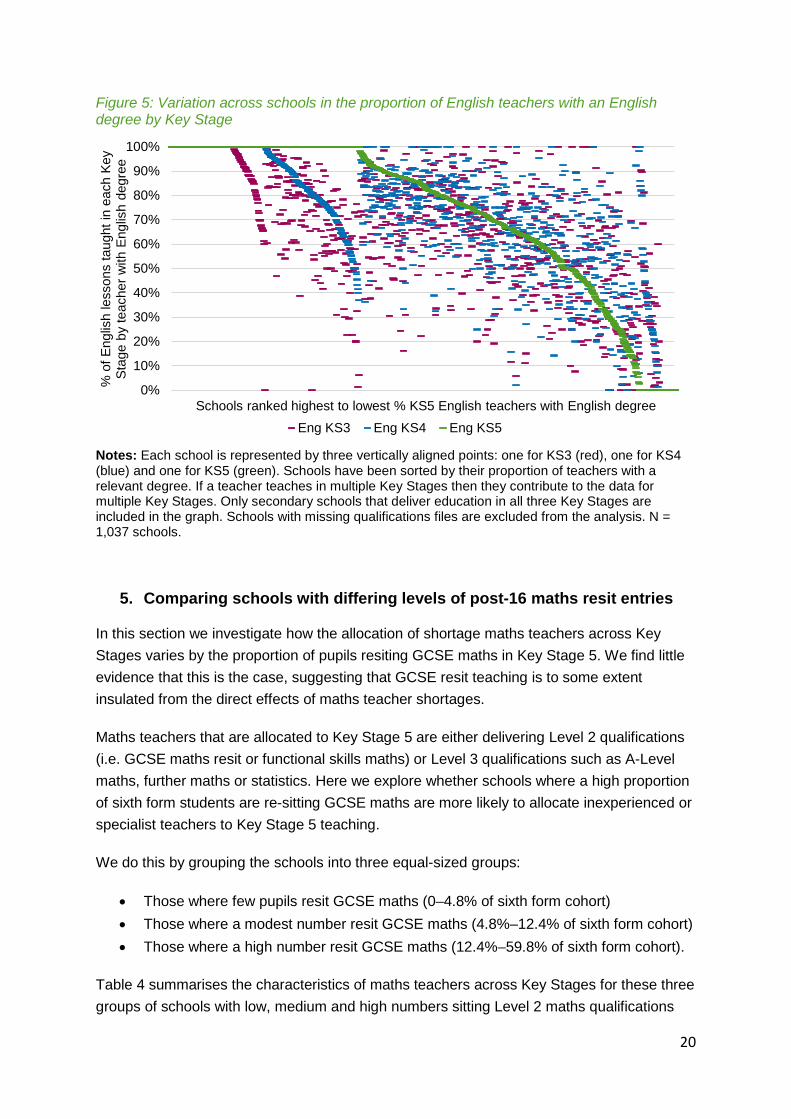
We show how this variation in the allocation of those teaching outside their academic degree subject falls in English departments as a point of comparison (Figure 5). Because more English teachers have English degrees overall, a large proportion of English departments are staffed at Key Stage 5 entirely by those with an English degree. For those that are managing the placement of significant numbers of non-specialist teachers, the allocation between Key Stages 3, 4 and 5 does not seem to display systematic variation.
0%10%20%30%40%50%60%70%80%90%
100%
% o
f mat
hs le
sson
s ta
ught
in e
ach
Key
Stag
e by
teac
her w
ith m
aths
deg
ree
Schools ranked from highest to lowest % KS5 maths teachers with a maths degree
Maths KS3 Maths KS4 Maths KS5
20
Figure 5: Variation across schools in the proportion of English teachers with an English degree by Key Stage
Notes: Each school is represented by three vertically aligned points: one for KS3 (red), one for KS4 (blue) and one for KS5 (green). Schools have been sorted by their proportion of teachers with a relevant degree. If a teacher teaches in multiple Key Stages then they contribute to the data for multiple Key Stages. Only secondary schools that deliver education in all three Key Stages are included in the graph. Schools with missing qualifications files are excluded from the analysis. N = 1,037 schools.
5. Comparing schools with differing levels of post-16 maths resit entries
In this section we investigate how the allocation of shortage maths teachers across Key Stages varies by the proportion of pupils resiting GCSE maths in Key Stage 5. We find little evidence that this is the case, suggesting that GCSE resit teaching is to some extent insulated from the direct effects of maths teacher shortages.
Maths teachers that are allocated to Key Stage 5 are either delivering Level 2 qualifications (i.e. GCSE maths resit or functional skills maths) or Level 3 qualifications such as A-Level maths, further maths or statistics. Here we explore whether schools where a high proportion of sixth form students are re-sitting GCSE maths are more likely to allocate inexperienced or specialist teachers to Key Stage 5 teaching.
We do this by grouping the schools into three equal-sized groups:
• Those where few pupils resit GCSE maths (0–4.8% of sixth form cohort) • Those where a modest number resit GCSE maths (4.8%–12.4% of sixth form cohort) • Those where a high number resit GCSE maths (12.4%–59.8% of sixth form cohort).
Table 4 summarises the characteristics of maths teachers across Key Stages for these three groups of schools with low, medium and high numbers sitting Level 2 maths qualifications
0%
10%
20%
30%
40%
50%
60%
70%
80%
90%
100%
% o
f Eng
lish
less
ons
taug
ht in
eac
h Ke
y St
age
by te
ache
r with
Eng
lish
degr
ee
Schools ranked highest to lowest % KS5 English teachers with English degreeEng KS3 Eng KS4 Eng KS5

21
during Key Stage 5. It is clear that high-retake schools have significantly more inexperienced or non-maths degree teachers allocated to Key Stage 5 maths. However, these patterns largely reflect the shortages of experienced and specialist maths teachers in these schools.
Table 4: Key characteristics of those teaching maths at each Key Stage in schools with low, middle and high proportions of students taking a post-16 Level 2 maths qualification
Low retakes Mid retakes High retakes Mean (S.D.) Mean (S.D.) Mean (S.D.)
% inexperienced All maths teaching 13% (13%) 14% (14%) 16% (14%) KS3 teaching hours
18% (17%) 19% (18%) 20% (19%)
KS4 teaching hours
11% (12%) 13% (14%) 13% (13%)
KS5 teaching hours
6% (10%) 6% (11%) 9% (15%)
% academic degree in subject
All maths teaching 51% (26%) 46% (26%) 40% (27%) KS3 teaching hours
47% (28%) 42% (28%) 36% (28%)
KS4 teaching hours
51% (26%) 47% (28%) 42% (29%)
KS5 teaching hours
61% (31%) 56% (31%) 51% (34%)
% teaching it as main subject
All maths teaching 98% (3%) 98% (3%) 98% (4%) KS3 teaching hours
97% (5%) 96% (6%) 96% (6%)
KS4 teaching hours
99% (2%) 99% (2%) 99% (3%)
KS5 teaching hours
100% (2%) 99% (4%) 99% (4%)
Notes: observations weighted by number of teaching hours in relevant subject and Key Stage
We explore the variation in this relationship between a maths department’s overall proportion of inexperienced teachers and the proportion in Key Stage 5 in more detail in Figure 6. It shows that the inexperienced teachers allocated to Key Stage 5, given the proportion in the department overall, is entirely unrelated to the mix of Key Stage 5 teaching at the school.

22
Figure 6: Relationship between overall percentage of inexperienced maths teachers in school and teaching Key Stage 5
Similarly, Figure 7 shows that the number of maths teachers without a maths academic degree that are allocated to Key Stage 5, given the proportion in the school overall, is entirely unrelated to the mix of Key Stage 5 teaching at the school.
Figure 7: Relationship between overall percentage without a maths degree in school and teaching Key Stage 5
0%
10%
20%
30%
40%
50%
60%
70%
80%
90%
100%
0% 10% 20% 30% 40% 50% 60% 70% 80% 90% 100%
Key
Stag
e 5
% in
expe
rienc
ed m
aths
teac
hers
Maths department overall % inexperienced teachers
Few retakes
Mid retakes
High retakes
0%
10%
20%
30%
40%
50%
60%
70%
80%
90%
100%
0% 10% 20% 30% 40% 50% 60% 70% 80% 90% 100%
Key
Stag
e 5
% m
aths
deg
ree
Maths department overall % maths degree
Few retakes
Mid retakes
High retakes
23
6. School demographic differences in the allocation of teachers across Key Stages
In this section we investigate how the allocation of shortage maths teachers across Key Stages varies by the proportion of disadvantaged pupils in schools. We find that socio-economic gradients in access to experienced maths teachers and maths teachers with a maths degree exist across all Key Stages but are steepest at Key Stage 3.
Earlier research has already shown that teacher shortages tend to disproportionately fall on schools that serve more disadvantaged communities (Allen & Sims, 2018). Here we explore how maths teacher shortages are managed in terms of the allocation of teachers across Key Stages, depending on how disadvantaged the pupil intake is.
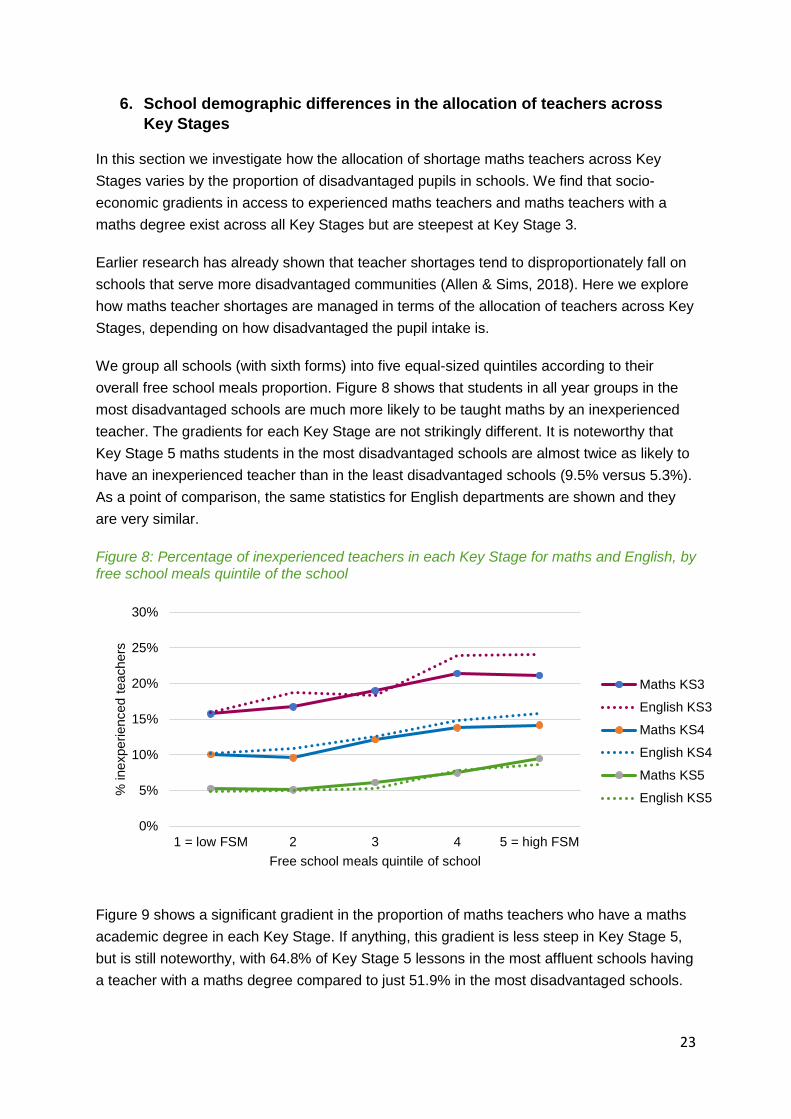
We group all schools (with sixth forms) into five equal-sized quintiles according to their overall free school meals proportion. Figure 8 shows that students in all year groups in the most disadvantaged schools are much more likely to be taught maths by an inexperienced teacher. The gradients for each Key Stage are not strikingly different. It is noteworthy that Key Stage 5 maths students in the most disadvantaged schools are almost twice as likely to have an inexperienced teacher than in the least disadvantaged schools (9.5% versus 5.3%). As a point of comparison, the same statistics for English departments are shown and they are very similar.
Figure 8: Percentage of inexperienced teachers in each Key Stage for maths and English, by free school meals quintile of the school
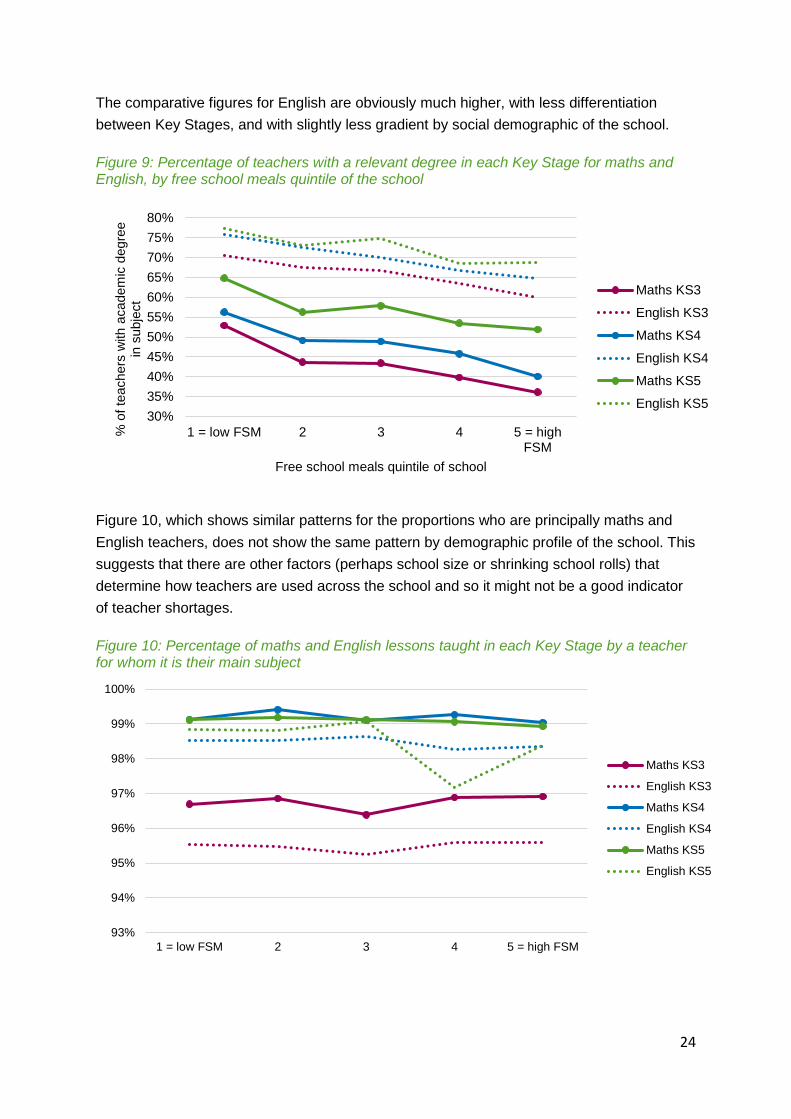
Figure 9 shows a significant gradient in the proportion of maths teachers who have a maths academic degree in each Key Stage. If anything, this gradient is less steep in Key Stage 5, but is still noteworthy, with 64.8% of Key Stage 5 lessons in the most affluent schools having a teacher with a maths degree compared to just 51.9% in the most disadvantaged schools.
0%
5%
10%
15%
20%
25%
30%
1 = low FSM 2 3 4 5 = high FSM
% in
expe
rienc
ed te
ache
rs
Free school meals quintile of school
Maths KS3
English KS3
Maths KS4
English KS4
Maths KS5
English KS5
24
The comparative figures for English are obviously much higher, with less differentiation between Key Stages, and with slightly less gradient by social demographic of the school.
Figure 9: Percentage of teachers with a relevant degree in each Key Stage for maths and English, by free school meals quintile of the school
Figure 10, which shows similar patterns for the proportions who are principally maths and English teachers, does not show the same pattern by demographic profile of the school. This suggests that there are other factors (perhaps school size or shrinking school rolls) that determine how teachers are used across the school and so it might not be a good indicator of teacher shortages.
Figure 10: Percentage of maths and English lessons taught in each Key Stage by a teacher for whom it is their main subject
30%35%40%45%50%55%60%65%70%75%80%
1 = low FSM 2 3 4 5 = highFSM
% o
f tea
cher
s w
ith a
cade
mic
deg
ree
in s
ubje
ct
Free school meals quintile of school
Maths KS3
English KS3
Maths KS4
English KS4
Maths KS5
English KS5
93%
94%
95%
96%
97%
98%
99%
100%
1 = low FSM 2 3 4 5 = high FSM
Maths KS3
English KS3
Maths KS4
English KS4
Maths KS5
English KS5

25
7. Regional differences in the allocation of teachers across Key Stages
In this section we investigate how the allocation of shortage maths teachers to Key Stages varies across regions. We find that areas which are known to have more severe shortages of maths teachers do indeed have greater disparities between English and maths departments in the proportion of experienced and in-subject teachers. Our general finding that schools allocate inexperienced or out-of-subject teachers mostly to Key Stage 3 holds across most of these shortage regions.
Figure 11 shows the regional proportions of maths and English lessons taught by inexperienced teachers across each Key Stage. Some data follow the patterns we would expect; for example, the South West has fewer inexperienced teachers and so little difference between their allocation in Key Stages 3 and 5. Also, London has the highest proportion of inexperienced teachers, and consequently a significant gap in their allocation between Key Stages 3 and 5, which is consistent with its status as a city that trains large numbers of novice teachers each year. On the other hand, we might have expected the statistics for the East of England to look a little worse, since it is often described as having the most challenging recruitment difficulties (e.g. MAC, 2016).
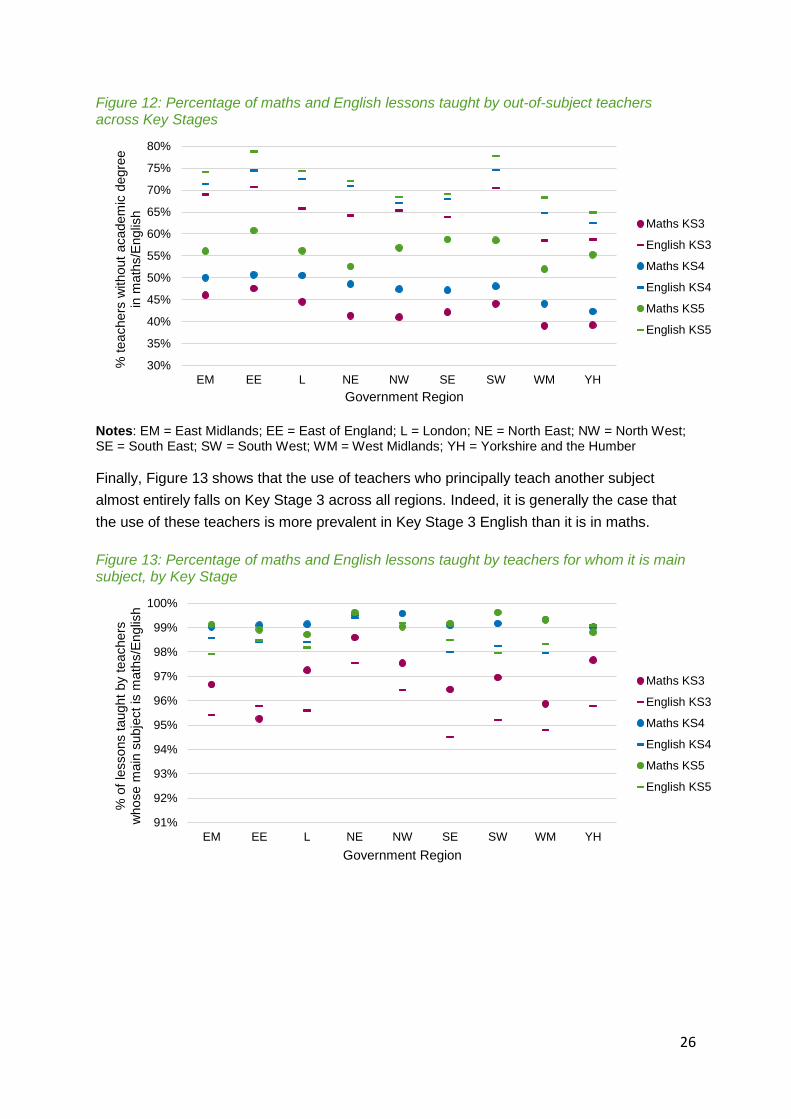
In most regions the differences between English and maths are not so great, but the North East and the East Midlands appear to have considerably fewer experienced maths teachers than English teachers. The reverse is somewhat true for Yorkshire and the Humber.
Figure 11: Percentage of maths and English lessons taught by inexperienced teachers across Key Stages
Notes: EM = East Midlands; EE = East of England; L = London; NE = North East; NW = North West; SE = South East; SW = South West; WM = West Midlands; YH = Yorkshire and the Humber
Figure 12 shows that it is the North East and the West Midlands where Key Stage 5 students are least likely to have maths teachers with a degree in the subject. However, this regional pattern is not consistent across Key Stages.
0%
5%
10%
15%
20%
25%
30%
EM EE L NE NW SE SW WM YH
Prop
ortio
n of
inex
perie
nced
teac
hers
Government Region
Maths KS3
English KS3
Maths KS4
English KS4
Maths KS5
English KS5
26
Figure 12: Percentage of maths and English lessons taught by out-of-subject teachers across Key Stages
Notes: EM = East Midlands; EE = East of England; L = London; NE = North East; NW = North West; SE = South East; SW = South West; WM = West Midlands; YH = Yorkshire and the Humber
Finally, Figure 13 shows that the use of teachers who principally teach another subject almost entirely falls on Key Stage 3 across all regions. Indeed, it is generally the case that the use of these teachers is more prevalent in Key Stage 3 English than it is in maths.
Figure 13: Percentage of maths and English lessons taught by teachers for whom it is main subject, by Key Stage
30%
35%
40%
45%
50%
55%
60%
65%
70%
75%
80%
EM EE L NE NW SE SW WM YH
% te
ache
rs w
ithou
t aca
dem
ic d
egre
e in
mat
hs/E
nglis
h
Government Region
Maths KS3
English KS3
Maths KS4
English KS4
Maths KS5
English KS5
91%
92%
93%
94%
95%
96%
97%
98%
99%
100%
EM EE L NE NW SE SW WM YH
% o
f les
sons
taug
ht b
y te
ache
rs
who
se m
ain
subj
ect i
s m
aths
/Eng
lish
Government Region
Maths KS3
English KS3
Maths KS4
English KS4
Maths KS5
English KS5

27
8. Conclusion
Where maths teacher shortages occur, schools find that they receive few job applications for advertised posts; many of the applicants are not suitable; they frequently have to re-advertise; and they may make teaching appointments that they consider less than ideal. We cannot observe any of this behaviour in the SWC. Instead, we can observe, across three measures:
• The proportion of inexperienced teachers in a school • The proportion of teachers delivering mathematics without an academic degree in the
subject • The proportion of maths teachers who have a principal subject for teaching that is not
mathematics.
We believe that the first two of these three metrics are reasonably good indicators of teacher shortages. We say this because we are able to use them to replicate known patterns of teacher shortages e.g. across regions. We cannot do this with the last of the three measures, which suggests that use of teachers who have another main subject is not a good proxy for shortages.
Overall, we find that differences in the demographic profiles of maths and English teachers, and their use both across and within schools, is not particularly pronounced (except that far more English teachers have an English academic degree than do maths teachers a maths degree). This remains largely true when we compare the movements of maths and English teachers in and out of classrooms between 2010 and 2016 in our Sankey diagrams.
This presents something of a paradox because it is widely agreed that maths teacher shortages are among the most severe, along with physics and computing. The best explanation we have for this is that maths teacher shortages are indeed felt by headteachers, but that they respond by employing maths teachers they feel are below par. By contrast, there is a much larger pool of available English teachers that cannot be observed in the SWC since headteacher perceived quality is not well correlated with the factors collected. The only possible signal is that so few maths teachers actually have a degree in the subject; perhaps this would be higher in circumstances where supply was plentiful over a sustained period.
Finally, where there are teachers who are inexperienced or do not have a degree in the subject, it is clear that they are most frequently allocated to teach Key Stage 3 classes. This is true, regardless of whether the school’s sixth form is delivering a large number of GCSE retake classes or not. Thus, it would seem that maths and English Heads of Department both place a value on ensuring that experienced and well-qualified teachers are delivering the GCSE retake classes. Post-16 maths therefore seems to be insulated from direct harm by shortages of maths teachers, though of course if pupils arrive ill-prepared from Key Stage 3 this will have knock-on effects.

28
The proxies for teacher shortages that we have identified can help shed light on the relative severity of shortages. For example, we find that schools in the East Midlands, North East and schools with disadvantaged intakes seem to be suffering from maths teacher shortages. However, If we are to understand how maths teacher shortages are affecting the education of children across schools and year groups then it will be necessary to collect direct measures of shortages data such as applications per post, appointable applicants interviewed, headteacher perceptions of quality of applicants, and so on. This could be done through an annual survey of headteachers, for example.

29
References
Allen, R. (2017) No need to recruit headteachers with particular subject backgrounds [blogpost], Education Datalab. Retrieved from: https://educationdatalab.org.uk/2017/01/no-need-to-recruit-headteachers-with-particular-subject-backgrounds/ Accessed 02.05.18
Allen, R. and Sims, S. (2018). Do pupils from low-income families get low-quality teachers? Indirect evidence from English schools, Oxford Review of Education, forthcoming.
Boyd, D., Lankford, H., Loeb, S. and Wyckoff, J. (2008). The impact of assessment and accountability on teacher recruitment and retention: Are there unintended consequences?. Public Finance Review, 36(1), pp. 88–111.
Burgess, S. (2015). Human capital and education: The state of the art in the economics of education. Brussels: COEURE (Cooperation on European Research in Economics).
Chetty, R., Friedman, J. and Rockoff, J. (2014). Measuring the impacts of teachers II: Teacher value-added and student outcomes in adulthood, American Economic Review, 104(9), pp. 2633–79.
Chevalier, A., Dolton, P. and McIntosh, S. (2007). Recruiting and retaining teachers in the UK: An analysis of graduate occupation choice from the 1960s to the 1990s. Economica, 74(293), pp. 69–96.
Department for Education (2017). Analysis of school and teacher level factors relating to teacher supply. London: Department for Education.
Grissom, J. A., Kalogrides, D. and Loeb, S. (2015). The micro-politics of educational inequality: The case of teacher–student assignments, Peabody Journal of Education, 90(5), pp. 601–14.
Hamre, B. and Pianta, R. (2005). Can instructional and emotional support in the first-grade classroom make a difference for children at risk of school failure?, Child Development, 76(5), pp. 949–67.
Hanushek, E. A. and Rivkin, S. G. (2010). Constrained job matching: Does teacher job search harm disadvantaged urban schools? (No. w15816). Cambridge, MA: National Bureau of Economic Research.
Hanushek, E. and Rivkin, S. (2012). The distribution of teacher quality and implications for policy, Annual Review of Economics, 4, pp. 131–57.
Hayward, G. and Homer, M. (2015). Profile Of The Mathematics Teaching Workforce In the College Sector In England. London: Gatsby Charitable Foundation. http://www.gatsby.org.uk/uploads/education/reports/pdf/profile-of-the-maths-teaching-workforce.pdf Accessed 03.05.18. Hobbs, G. and Vignoles, A. (2010). Is children's free school meal ‘eligibility’ a good proxy for
family income?, British Educational Research Journal, 36(10), pp. 673-690.
Isenberg, E., Max, J., Gleason, P., Potamites, L., Santillano, R., Hock, H. and Hansen, M. (2013). Access to effective teaching for disadvantaged students. Washington, DC: Institute of Education Sciences.
Kalogrides, D., Loeb, S. and Beteille, T. (2012). Systematic sorting : Teacher characteristics and class assignments, Sociology of Education, 86(2), pp.103–23.
Loeb, S., Kalogrides, D. and Béteille, T. (2012). Effective schools: Teacher hiring, assignment, development, and retention, Education Finance and Policy, 7, pp. 269–304.
30
MAC (2016). Partial review of the Shortage Occupation List: Review of teachers. London: Migration Advisory Committee.
Mansfield, R. K. (2015). Teacher quality and student inequality, Journal of Labor Economics, 33(3), pp. 751–88.
Moor, H., Jones, M., Johnson, F., Martin, K., Cowell, E. Bojke, C. and Merit, P. (2006). Mathematics and science in secondary schools: The deployment of teachers and support staff to deliver the curriculum. Department for Education and Skills Research Report RR708. Nottingham: DFS Publications.
Sass, T., Hannaway, J., Xu, Z., Figlio, D. and Feng, L. (2010). VAM of teachers in high-poverty schools and lower-poverty schools. CALDER Working Paper 52. Washington, DC: National Center for Analysis of Longitudinal Data in Education Research
Sims, S. (2017). TALIS 2013: Working conditions, teacher job satisfaction and retention. Department for Education Statistical Working Paper. London: Department for Education.
Slater, H., Davies, N. and Burgess, S. (2012). Do teachers matter? Measuring the variation in teacher effectiveness in England, Oxford Bulletin of Economics and Statistics, 74, pp. 629–45.
Smith, A. (2017). The report of Professor Sir Adrian Smith's inquiry into post-16 mathematics. London: Department for Education.
Smithers, A. and Robinson, P. (2000). Coping with teacher shortages. Liverpool: Centre for Education and Employment Research.
TES Global (2016). TES Teacher recruitment index: March 2016. London: TES.
Worth, J. and De Lazzari, G. (2017). Teacher retention and turnover research. Research update 1: Teacher retention by subject. Slough: NFER.
31
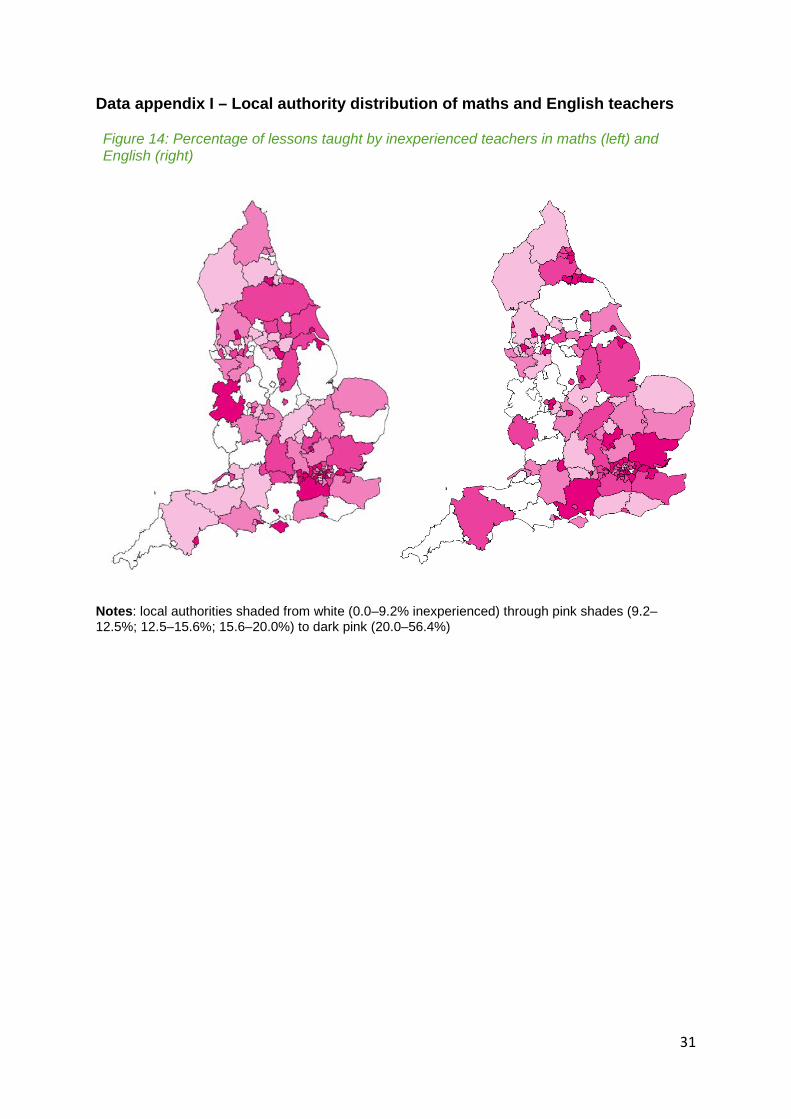
Data appendix I – Local authority distribution of maths and English teachers
Figure 14: Percentage of lessons taught by inexperienced teachers in maths (left) and English (right)
Notes: local authorities shaded from white (0.0–9.2% inexperienced) through pink shades (9.2–12.5%; 12.5–15.6%; 15.6–20.0%) to dark pink (20.0–56.4%)
32
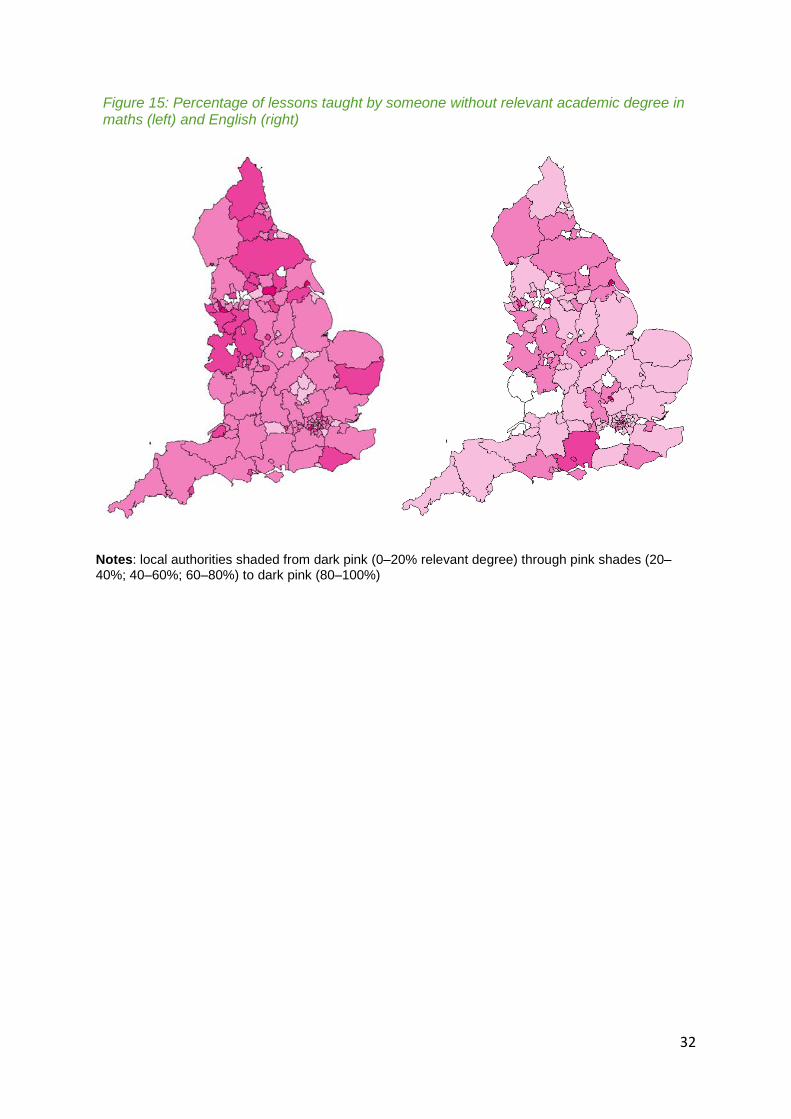
Figure 15: Percentage of lessons taught by someone without relevant academic degree in maths (left) and English (right)
Notes: local authorities shaded from dark pink (0–20% relevant degree) through pink shades (20–40%; 40–60%; 60–80%) to dark pink (80–100%)