Embed Size (px)
Citation preview
Migration Policy Debates © OECD/Bertelsmann Stiftung, N°19 May 2019 1
Talented and skilled individuals have a key role to play in countries’ future prosperity. They hold jobs that are key for innovation and technological progress and ultimately contribute to stronger economic growth with other employment opportunities and better living conditions for all. OECD countries increasingly compete to attract and retain talented workers notably by adopting more favourable migration policies for the best and the brightest. This competition has led to a convergence of policy frameworks but significant differences in policies and practices remain. Beyond conditions for migration, many other factors contribute to shape countries’ attractiveness for foreign talent.
This issue of Migration Policy Debates presents the results of the first edition of the OECD Indicators of Talent Attractiveness, developed by the OECD with support from the Bertelsmann Stiftung1. The OECD Indicators of Talent Attractiveness (ITA) measure for the first time the relative attractiveness of countries from a multidimensional perspective focusing on three types of talented migrants: highly skilled workers at master/PhD level, international students in tertiary education and foreign entrepreneurs. This aims at better understanding and comparing strengths and weaknesses of different OECD countries and can help elaborating public policies that are more effective. _____________________________________________________________________________________________________________________________________________________________________________________.
How do OECD countries compare in their attractiveness for talented migrants?
The OECD Indicators of Talent Attractiveness is the first comprehensive tool to capture, in a multidimensionalframework, strengths and weaknesses of OECD countries regarding their capacity to attract and retain three specificcategories of talented migrants: highly qualified workers (those with master and doctoral degrees), university studentsand foreign entrepreneurs.
The OECD Indicators of Talent Attractiveness score seven dimensions: quality of opportunities; income and tax; futureprospects; family environment; skills environment; inclusiveness; and quality of life. The indicators also take intoaccount how difficult it is for prospective migrants with required skills to obtain a visa or residence permit.
The most attractive OECD countries for highly qualified workers are Australia, Sweden, Switzerland, New Zealand andCanada, which offer favourable labour market conditions and an excellent skills environment for highly skilled workersin general. Admission conditions negatively affect the attractiveness of several OECD countries, including Israel, Japanand Turkey.
The most attractive OECD countries for entrepreneurs are Canada, New Zealand, Switzerland, Sweden and Norway.This also reflects relatively low minimum capital investments and job creation requirements in these countries.Greece, Mexico and Turkey are lagging behind on this indicator.
For international university students, the top five countries are Switzerland, Norway, Germany, Finland and theUnited States. Some countries that have many international students, including Canada, Australia, New Zealand andthe United Kingdom, fall in the ranking due to relatively high tuition fees.
Beyond conditions for migration, analysing the full impact of policies on talent attractiveness, it appears that adoptingmore favourable policy settings would enable most OECD countries to close most of their gap to the top rankedcountry. This is particularly salient for international students but also applies to entrepreneurs and to a lesser extentto talented workers.
All OECD countries can improve their attractiveness in the global competition for talent. Each one has strengths andweaknesses, factors to improve or enhance. The OECD Indicators of Talent Attractiveness show policy makers howmuch leeway OECD countries have to make their country the chosen destination for potential talented migrants.
The global competition for talents generates legitimate concerns regarding the impact on countries of origin, notablyless developed countries. A close monitoring of global movements of highly skilled migrants is therefore necessary toidentify the winners and losers and activate, where necessary, relevant international instruments to better share thecosts and benefits associated to international mobility of talents.
1 Special thanks go to the Fragomen law firm for sharing their data, without which it would not have been possible to compile these indicators.
N°19, May 2019

2 Migration Policy Debates © OECD/Bertelsmann Stiftung, N°19 May 2019
The importance of talent mobility
Educational levels and skills of the labour force have been rising enormously across the world. Young people entering the labour market now are more educated than retiring older workers. However, the supply of skills has not necessarily kept abreast with increasing demand due to technological change, the development of research and development activities or more generally new skills needs. In this context, international recruitment of talented migrants has increased across the OECD. In addition, the concentration of talent generates positive externalities, with the most dynamic centres attracting large inflows of highly skilled migrants.
According to the latest data from the OECD Database on Immigrants in OECD Countries (DIOC), the stock of tertiary educated migrants increased by 108% in the OECD between 2000/01 and 2015/16. The share of migrants in the tertiary educated working-age population increased from 11% to 16%. About half of the high-skilled migrants in G20 destinations come from other G20 countries, and about the same share is in the OECD.
Admission conditions for the highly qualified have been eased in most OECD countries over the past decades. Yet some countries are more attractive than others, due to a variety of factors, which may be related to overall economic, labour market and living conditions or to specific practices regarding the conditions for entry and stay of foreign talents.
A new approach to ranking attractiveness
In this context, providing benchmarking in terms of attractiveness across OECD countries offers invaluable information for both potential migrants and employers as well as for policy makers. There are a number of available indices and scoreboards for the “best countries”. Some are based on surveys of expatriates – often using non-representative samples (IMD, 2017; INSEAD, 2018), while others are ad hoc compilations of multiple macro indicators of overall economic performance of countries (EIU, 2011).
The OECD Indicators of Talent Attractiveness take a different and innovative approach to this question. They distinguish different types of talented migrants and rely on group-specific observations from large scale household surveys and immigration data that capture the difficulties these groups of migrants face when trying to obtain a visa or residence permit. The new OECD indicators are also based on a theoretical
framework that encompasses the decision-making process of talented migrants.
The OECD Indicators of Talent Attractiveness measure how attractive OECD countries are for three profiles of talented migrants.
First, individuals with the highest educational attainment – in line with the majority of the social science literature, master or doctoral level (ISCED 7 or 8) – are considered. Second, since entrepreneurs are widely recognized as contributing to economic growth, they comprise a further profile of talented migrants. This group includes business founders and active investors who manage the businesses in which they have invested. Finally, the competition for talent also involves vying for international students in higher education.
Distinguishing between these three groups is important because attractiveness of countries for different types of talent can vary, and those particularly attractive for one group of talented migrants may not look so interesting for other groups.
What is behind the indicators?
The OECD Indicators of Talent Attractiveness includes variables that are profile-specific, targeted to different talented migrant categories. Variables behind the composite indicators are therefore not identical for all profiles, but reflect the specificity of the migration determinants of each category. Furthermore, even when the variable is the same across profiles, its value may change according to the reference group.
For each migrant profile, the indicators comprise between 22 and 24 variables referring to both economic and non-pecuniary factors (the full list is in Box 1). The indicators are grouped in seven dimensions, each representing a distinct aspect of talent attractiveness: (1) quality of opportunities, (2) income and tax, (3) future prospects, (4) family environment, (5) skills environment, (6) inclusiveness, and (7) quality of life. In addition, an overarching dimension of country accessibility in terms of policies and practices for admission is included to take into account the accessibility of visa and residence permit in international mobility decisions.
In order to select the variables for each talent attractiveness dimension, the OECD Indicators of Talent Attractiveness refers to the most widely used

Migration Policy Debates © OECD/Bertelsmann Stiftung, N°19 May 2019 3
channel in each destination country. For highly skilled foreign workers, temporary visa programmes are used rather than permanent programmes, since most permanent economic migrants were previously on temporary visas, and for comparability purposes, as only a few OECD countries have direct settlement channels. Intra-company transfer (ICT) migrants are excluded from the analysis, since their mobility reflects employer choices more than individual preferences.
Box 1. Variables at the basis of the OECD Indicators of Talent Attractiveness
In line with the OECD experience in construction of composite indices, the variables of each dimension of the OECD Indicators of Talent Attractiveness have been selected based on their conceptual relevance, distinction, statistical association and data quality. The variables for the profiles of “entrepreneurs” and “international students”, as well as a detailed discussion on the methodology behind the indicators, are presented in Tuccio (2019).
Below are the variables included for the profile of “workers with master/doctoral degrees”:
Quality of opportunities: Unemployment rate of the foreign-born with education ISCED 7-8; Over-qualification rate of the foreign-born with education ISCED 7-8; Share of the ISCED 7-8 educated foreign-born with temporary contracts; Share of foreign-born part-time workers with education ISCED 7-8.
Income and tax: Earnings of ISCED 7-8 workers; Price level index; Tax burden for high-earners.
Future Prospects: Acquisition of nationality; Ease of status change from temporary to permanent; Dependency ratio in 2050.
Family environment: Right for spouse to join migrant; Possibility for the spouse of migrant to work; Easiness for children of migrants to get citizenship; PISA math test scores; Public expenditure on family benefits; Participation tax rate for second earner parent entering employment.
Skills environment: Internet access; English proficiency; Gross domestic spending on R&D; Patents.
Inclusiveness: Share of foreign-born in working age population with ISCED 7-8 education; Attitudes towards immigration; Gender equality.
Quality of life: OECD Better Life Index.
When looking at the stringency of migration policies and practices for highly skilled foreign workers, the most favourable case is assumed: that the prospective migrant already has a job offer from an employer based in a destination country, for a
position which matches the skill level of the individual.
People do not assign the same importance to different dimensions of attractiveness. Those without family, for example, may not care about the environment for families. Earnings may be more important to some individuals than inclusiveness, or vice versa. Age, gender, education, but also marital status and family background, country of origin and resource constraints, all affect migrants’ destination choices. As a result, the OECD Indicators of Talent Attractiveness are designed to allow users to express preferences, ranking and weighting different dimensions. Users can choose their own preferred weights on the online platform. Interested users can construct their own set of indicators based on their preferred weighting here: oe.cd/talent-attractiveness
This brief, however, presents benchmark indicators based on default equal weights across the seven dimensions of talent attractiveness.
Even when a potential immigrant is attracted to work opportunities in a specific destination country, if there is little chance of admission, that country may not be attractive overall. High barriers to admission make other dimensions of attractiveness less compelling. Thus, admission policies and practices are not considered an additional sub-group of drivers of talent mobility, but cover a separate role.
Once the average score is obtained based on the preferred set of weights for the seven dimensions mentioned above, a penalty is applied to reflect the stringency of migration policies. The reference policies and approach vary for each group of talented migrants considered.
Quantifying migration policies in terms of conditions for migration is no easy task. On the one hand, migration policies and visa programmes are numerous both across and within countries, making it difficult to compute a synthetic measure of entry laws. On the other hand, a normative approach based on coding legislation risks misrepresenting the true accessibility of countries to potential migrants, since practices may vary significantly for comparable legal frameworks and affect effective conditions for entry.
For highly skilled foreign workers, the OECD Indicators of Talent Attractiveness exploit two variables taken from proprietary data collected by Fragomen, a leading international law firm

4 Migration Policy Debates © OECD/Bertelsmann Stiftung, N°19 May 2019
specialized in immigration law services, from its own caseload. The first is refusal rates for highly qualified applicants. The second is processing time, measured in calendar days from when a prospective migrant initiates an immigration case to the date on which the individual is allowed to start working in the destination country. For OECD countries, this ranges from 39 days to 185 days. In addition, a third policy variable, calculated by the OECD Secretariat, captures restrictive quotas on the reference visa programme which effectively limit migration inflows and the likelihood of admission. This variable is based on oversubscription data for capped migration programmes. Each policy variable represents a penalty of up to 5% to the final index.2 The accessibility of OECD countries in terms of migration policies for migrant entrepreneurs is proxied by two variables: their requirements in terms of minimum capital that the individual has to invest and the minimum job creation of the incoming business in order to obtain the visa.3
International university students who have been admitted to a qualifying institution can theoretically obtain a visa in virtually all OECD countries but in practice face multiple constraints. In order to factor in their likelihood to obtain a visa at destination, the indicators account for university tuition fee levels for foreign students, which is a major determinant of students’ location choices.4 In addition, to capture the ease of obtaining a student visa relative to other channels of migration, the indicator incorporates a penalty based on the ratio between the share of international students in the total student population and the share of foreign-born individuals in the total population. Penalties go from 0% to 5% depending on in which quintile of distribution a given country is.
The attractiveness of OECD countries to talented workers
As expected, OECD countries have different degrees of attractiveness to highly qualified workers. Before taking into account the likelihood of getting a visa at
2 Specifically, refusal rates below 1% yield no penalty; 1%
to 10%, a 2.5% penalty; above 10%, a 5% penalty. Visa processing time of less than 3 months gives no penalty; 3 to 6 months, 5% penalty; more than 6 months, a 10% penalty. A restrictive quota on the visa programme accounts for an additional 5% penalty.
3 Countries with no job creation requirement receive no penalty, while a requirement yields a 5% penalty. Similarly, if visa programmes have no minimum
destination, the United States scores highest, due to a strong economy and labour market, and excellent scores for both “quality of opportunities” and “income and tax”. At the same time, the country also has particularly good amenities, with a unique “skills environment” and a pleasant “quality of life”. Australia and New Zealand follow closely, although their high ranking is due principally to very inclusive societies (“inclusiveness”) and advantageous “future prospects”. The remaining top 10 countries are Canada, Sweden, Ireland, Switzerland, Norway, Netherlands and the United Kingdom. These countries all have in common a generally high standard of living and excellent skills environments, while they differ in terms of economic landscapes and policy approaches to migration. In contrast, the OECD countries that fare worse in attracting the highest qualified workers generally have poor skills environment. This is in line with the agglomeration hypothesis of talent mobility: high-skilled workers are attracted by other high-skilled people, generating a multiplier effect that is at the base of technological breakthroughs and development. Countries less attractive to potential highly-qualified immigrant workers are Israel, Italy, Greece, Mexico and Turkey.
After taking into account the accessibility of OECD countries in terms of policies and practices for admission, the United States loses its top position in favour of Australia, which has lower refusal rates and less restrictive quotas for the highly skilled (Figure 1). Canada and New Zealand are also penalized by relatively high refusal rates. Overall, only a few countries – such as Sweden, Switzerland, Luxembourg and Slovenia – have migration systems that do not reduce their desirability to migrants. As such, after policies are taken into account, the top five most attractive OECD countries to highly skilled workers are Australia, Sweden, Switzerland, New Zealand and Canada. In contrast, there is no change in the position of countries at the bottom of the ranking, except for Poland which drops below Israel due to slower processing time.
investment clause, countries get no penalty, if the minimum investment is below EUR 100 000, the penalty is 2.5%, and 5% above EUR 100 000. Iceland is excluded since it has no specific entrepreneur visa.
4 Countries with university tuition fees for international students below EUR 2 000 receive no penalty; between EUR 2 000 and EUR 10 000, a 2.5% penalty; over EUR 10 000, 5%.

Migration Policy Debates © OECD/Bertelsmann Stiftung, N°19 May 2019 5
Figure 1. Attractiveness of OECD countries for potential migrants: workers with master or doctoral degrees
Note: Values closer to 1 (0) represent higher (lower) attractiveness. Ranking based on default equal weights across dimensions. Source: OECD Secretariat.
The attractiveness of OECD countries to entrepreneurs
In terms of the attractiveness of OECD countries to foreign-born entrepreneurs, the top five performers are different from the most attractive destinations for talented workers. Before taking into account policies and practices for admission, these are Canada, New Zealand, Ireland, Switzerland and the United States. All these countries share high scores for quality of opportunities in terms of ease of doing business, trade openness and both employment and product market regulations. The only exception is Switzerland, which however earns its ranking due to the lowest corporate taxes of the whole OECD area.
After controlling for the likelihood of getting an entrepreneur visa, the United States and Ireland drop from the top five most attractive countries, replaced by Sweden and Norway (Figure 2). The United States has high requirements for its EB-5 Immigrant Entrepreneur Visa: the minimum investment required is USD 1 000 0005 and the minimum jobs that the investment must create or preserve are 10. Nordic countries (Sweden, Norway, Finland and Denmark) improve their attractiveness thanks to low investment requirements for entrepreneurs.
Figure 2. Attractiveness of OECD countries for potential migrants: entrepreneurs
Note: Values closer to 1 (0) represent higher (lower) attractiveness. Ranking based on default equal weights across dimensions. Source: OECD Secretariat.
3 If the new enterprise is located within a Targeted
Employment Area (a rural or high-unemployment area) the threshold is USD 500 000, which is still high.
0.2
0.3
0.4
0.5
0.6
0.7
0.2
0.3
0.4
0.5
0.6
0.7

6 Migration Policy Debates © OECD/Bertelsmann Stiftung, N°19 May 2019
The attractiveness of OECD countries to university students
Compared to high-educated workers and entrepreneurs, international university students are potentially attracted by a different set of countries (Figure 3). Before considering the actual admission possibilities, the top five countries are Norway, the United States, Switzerland, Canada and Australia. In particular, the United States, Canada and Australia – as well as other countries where English is widely spoken (the United Kingdom and New Zealand) – score high for the “skills environment” dimension, because of English language use as well as their tertiary education spending. Norway, Germany and Switzerland, by contrast, dominate the “income and tax” dimension, thanks to student visas allowing international students broad access to work during studies, as well as applying the same tuition fees to
domestic and foreign students. The future prospects dimension is more favourable in countries like France and Italy, which allow easy transition to work permits after graduation, whereas countries that do not allow students to work during studies (e.g. Chile and Turkey) appear among the bottom quartile of the “income and tax” dimension.
Taking into account the probability of obtaining a student visa penalises the United States, Canada and Australia. In contrast, given the relatively low university tuition fees for foreign students, countries such as France, Switzerland and Iceland improve their overall attractiveness to international students. Both before and after the inclusion of practices for admissions, the least attractive countries for foreign university students are Chile, Israel, Greece, Mexico and Turkey.
Figure 3. Attractiveness of OECD countries for potential migrants: university students
Note: Values closer to 1 (0) represent higher (lower) attractiveness. Ranking based on default equal weights across dimensions. Source: OECD Secretariat.
The key role of migration policies in talent attractiveness
As shown, policies and practices for admission make a big difference for determining the optimal location choice of talented migrants. However, the OECD Indicators of Talent Attractiveness include even further information on migration policies, such as family reunification practices and the ease of status change from temporary to permanent. Exploiting such granularity of the indicators allows simulating how countries would fare should their overall migration policies be the most favourable on all dimensions.
Figure 4 shows how much of the gap to the most attractive country would be closed should all aspects of migration policies be similar to the most favourable case. A value of 0% means that by adopting policies that are more favourable, everything else being equal, the country would become the most attractive for that category of talented migrants.
The first and main finding here is that policies play a very important role. For a majority of countries adopting more favourable policy packages would indeed enable them jump to the top of the list and become the best country notably for international students and talented workers. The strong impact of policy settings for international students is due not
0
0.1
0.2
0.3
0.4
0.5
0.6
Migration Policy Debates © OECD/Bertelsmann Stiftung, N°19 May 2019 7
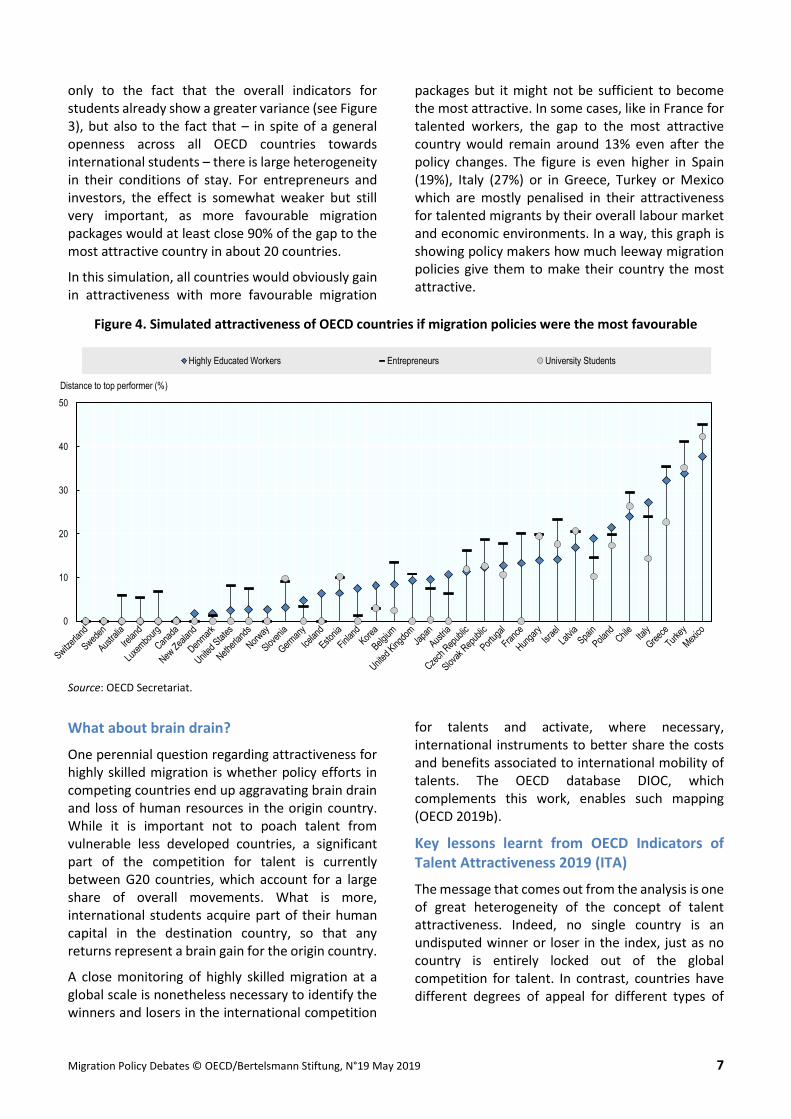
only to the fact that the overall indicators for students already show a greater variance (see Figure 3), but also to the fact that – in spite of a general openness across all OECD countries towards international students – there is large heterogeneity in their conditions of stay. For entrepreneurs and investors, the effect is somewhat weaker but still very important, as more favourable migration packages would at least close 90% of the gap to the most attractive country in about 20 countries.
In this simulation, all countries would obviously gain in attractiveness with more favourable migration
packages but it might not be sufficient to become the most attractive. In some cases, like in France for talented workers, the gap to the most attractive country would remain around 13% even after the policy changes. The figure is even higher in Spain (19%), Italy (27%) or in Greece, Turkey or Mexico which are mostly penalised in their attractiveness for talented migrants by their overall labour market and economic environments. In a way, this graph is showing policy makers how much leeway migration policies give them to make their country the most attractive.
Figure 4. Simulated attractiveness of OECD countries if migration policies were the most favourable
Source: OECD Secretariat.
What about brain drain?
One perennial question regarding attractiveness for highly skilled migration is whether policy efforts in competing countries end up aggravating brain drain and loss of human resources in the origin country. While it is important not to poach talent from vulnerable less developed countries, a significant part of the competition for talent is currently between G20 countries, which account for a large share of overall movements. What is more, international students acquire part of their human capital in the destination country, so that any returns represent a brain gain for the origin country.
A close monitoring of highly skilled migration at a global scale is nonetheless necessary to identify the winners and losers in the international competition
for talents and activate, where necessary, international instruments to better share the costs and benefits associated to international mobility of talents. The OECD database DIOC, which complements this work, enables such mapping (OECD 2019b).
Key lessons learnt from OECD Indicators of Talent Attractiveness 2019 (ITA)
The message that comes out from the analysis is one of great heterogeneity of the concept of talent attractiveness. Indeed, no single country is an undisputed winner or loser in the index, just as no country is entirely locked out of the global competition for talent. In contrast, countries have different degrees of appeal for different types of
0
10
20
30
40
50
Distance to top performer (%)
Highly Educated Workers Entrepreneurs University Students

8 Migration Policy Debates © OECD/Bertelsmann Stiftung, N°19 May 2019
talented migrants as well as for different dimension of talent mobility.
Overall, comparing Figures 1, 2 and 3 suggests that a country’s attractiveness can be high for certain types of talented migrants even as it is lower for other potential migrant categories. For example, Germany is one of the most attractive destinations for international university students, but its rating for talented workers is just above average. Conversely, highly skilled migrants should find Ireland greatly attractive, in contrast to international students. Furthermore, France’s attractiveness lies around the mean for all migrant profiles except for university students, for whom it is a highly desirable destination.
Some countries are lagging behind for all or two types of migrants, including Mexico, Turkey, Greece or Israel. Despite their low attractiveness in international comparison for talented migrants, these countries may be perceived as an attractive destination for migrants from specific origin countries, language skills or cultural background which cannot be captured by synthetic indicators. That said, these results also underline that such countries need to take decisive actions if they intend to remain competitive destinations in the global competition for talent.
More generally, talent mobility should be considered in a disaggregated fashion, dimension by dimension. Such analyses can provide policy makers with new and unique information about their performance in attracting foreign talent. One key lesson from the OECD Indicators of Talent Attractiveness though is that migration policy packages matter a great deal for all profiles.
Finally, extending these indicators to more possible destination countries in the G20 and beyond would probably enable to identify additional hotspots for talented migrants and to put the situation of OECD countries in a more global perspective.
References
Bertelsmann Stiftung (2015). A Fair Deal on Talent – Fostering Just Migration Governance. Bertelsmann Stiftung, Gütersloh.
EIU (2011), The Global Talent Index Report: The Outlook to 2015. Heidrick & Struggles, Chicago.
IMD (2017), IMD World Talent Ranking 2017. Institute for Management Development, Lausanne.
INSEAD (2018), The Global Talent Competitiveness Index 2018. INSEAD, Fontainebleau.
OECD (2019a), Building an EU Talent Pool: A New Approach to Migration Management for Europe. OECD Publishing, Paris.
OECD (2019b), Database on Immigrants in OECD Countries 2015/16 (DIOC). Available at: www.oecd.org/els/mig/dioc.htm.
OECD (2019c), The Expression of Interest Model: What Lessons for Migration Management in the EU and Elsewhere?. Migration Policy Debates No 18. OECD Publishing, Paris.
OECD/JRC (2019), The Mobility of Highly Qualified Workers. Migration Data Brief, forthcoming, OECD Publishing: Paris.
Tuccio M. (2019), Measuring and Assessing Talent Attractiveness in OECD Countries. OECD Social, Employment and Migration Working Papers, forthcoming, OECD Publishing: Paris.
Contacts
Jonathan Chaloff International Migration Division, OECD Email: [email protected] Tel: +33 1 45 24 18 49
Jean-Christophe Dumont International Migration Division, OECD Email: [email protected] Tel: +33 1 45 24 92 43
Matthias Mayer Bertelsmann Stiftung Email: [email protected] Tel: +49 5 24 18 18 15 64
Michele Tuccio International Migration Division, OECD Email: [email protected] Tel: +33 1 85 55 45 06
Useful links
www.oecd.org/migration oe.cd/talent-attractiveness
This paper is published under the responsibility of the Secretary-General of the OECD. The opinions expressed and the arguments employed herein do not necessarily reflect the official views of OECD member countries or EU Member States.