Embed Size (px)
Citation preview
HOW DO FRIENDSHIPS FORM?*
DAVID MARMAROS AND BRUCE SACERDOTE
We examine how people form social networks among their peers. We use aunique data set that tells us the volume of email between any two people in thesample. The data are from students and recent graduates of Dartmouth College.First-year students interact with peers in their immediate proximity and formlong-term friendships with a subset of these people. This result is consistent witha model in which the expected value of interacting with an unknown person is low(making traveling solely to meet new people unlikely), while the benefits frominteracting with the same person repeatedly are high. Geographic proximity andrace are greater determinants of social interaction than are common interests,majors, or family background. Two randomly chosen White students interactthree times more often than do a Black student and a White student. However,placing the Black and White student in the same freshman dorm increases theirfrequency of interaction by a factor of three. A traditional “linear in group means”model of peer ability is only a reasonable approximation to the ability of actualpeers chosen when we form the groups around all key factors including distance,race and cohort.
I. INTRODUCTION
It is frequently argued that friends and peers have a largeinfluence on how we behave, how much education we obtain, whatcareer we pursue, and even whom we marry.1 Families self-selectinto certain neighborhoods, and students into certain schoolsbecause of the perceived peer effects as in Hoxby [2000b], Win-ston [1999], and many others. However, less has been written onhow we actually choose and are chosen by a specific group offriends within a neighborhood, school, or workplace.2 We find thatlong-term friendships grow from chance meetings and that smalland random differences in proximity have a big impact on ourcircle of friends.
One reason for the lack of studies on friendship is the scarcity
* 6106 Rockefeller, Dartmouth College, Hanover, NH 03755. Telephone: 603646 2121. Fax: 603 646 2122. The authors thank the National Science Foundationfor generous funding and thank discussants and seminar participants at theWharton School, DELTA, Ohio State University, and the NBER for helpful sug-gestions. We thank two anonymous referees and Alberto Alesina, Lawrence Katz,and Edward Glaeser. JEL Classification Codes: I2, J0. Keywords: Social Net-works, Peer Effects.
1. See, for example, Harris [1998], Case and Katz [1991], Evans, Oates, andSchwab [1992], Zimmerman [2003], Hoxby [2000a], and Marmaros and Sacerdote[2002].
2. One exception is Falk and Kosfeld [2003] who study the shape of networksin an experimental setting.
© 2006 by the President and Fellows of Harvard College and the Massachusetts Institute ofTechnology.The Quarterly Journal of Economics, February 2006
79
of large micro data sets in which we can identify who is friendswith whom, with the notable exceptions of Case and Katz [1991]and Holahan, Wilcox, and Burnam [1978].3 We solve this problemby measuring the level of social interaction between any twoindividuals as the volume of email exchanged between the twopeople during the prior thirteen months. The subjects are stu-dents and recent alumni at Dartmouth College. Our exercise isparticularly interesting given the random assignment of studentsto rooms and dorms during their freshman year. The exogenousshock of random assignment allows us to test the power of geo-graphic proximity against other potentially important factors likerace, family background, and common interests like athleticteams.
Our methodology also provides a very direct measure of theamount of racial segregation on a campus. Bowen and Bok [1998]explain that most selective universities have made a major pushduring the last 30 years to increase the racial diversity of theirstudent bodies. However, as argued in Richards [2002], the uni-versities’ objectives may be partially blunted if the White andnon-White groups on campus spend very little time interacting.
In the recent Supreme Court cases addressing affirmativeaction, eight universities (Dartmouth College, Harvard, Yale, andBrown Universities, University of Chicago, Duke University,University of Pennsylvania, and Princeton University) jointlyfiled an amicus brief which emphasized the importance of racialdiversity in the educational process. The brief argues that stu-dents educate each other and that several studies [Bowen andBok 1998; Bowen and Levin 2003; Epstein 2002] demonstratethat cross-racial learning takes place and is valued by studentsand the labor market.
However, other than Duncan, Boisjoly, Kremer, Levy, andEccles [2003a] few large-scale studies actually measure whethermuch interracial interaction is taking place. If anything, theevidence we have from campus newspapers and personal anec-dotes suggests massive amounts of racial segregation on nearlyevery campus. See, for example, Schapiro [2003] describingEmory University or Hills [2003] describing Bryn Mawr.
In a test of Bowen and Levin’s [2003] thesis, we are able to
3. For example, the NLSY and GSS do ask respondents several questionsabout their friends, but not enough to allow the sort of detailed analysis wepropose here.
80 QUARTERLY JOURNAL OF ECONOMICS

ascertain the degree to which athletes or minority students areeither isolated from the rest of campus or systematically inter-acting with peers who have lower academic ability. For example,we show that more than half of a Black student’s interactionstake place with non-Black students.
We add to the existing literature on friendship or socialinteractions in several ways. First, we have a more detailedmeasure of the level of social interaction than has been possiblewith prior studies. Second, we explore the relative importance (indetermining social interactions) of geography, architecture, race,athletic interests, social interests, intellectual interests, and fam-ily background. We explore how the importance of these factorsvaries within- versus across-race and within- versus across-gen-der relationships. And finally we ask whether a linear in meansapproach captures the social influences experienced by a student.
Our regressions and simulations lead us to three relatedconclusions: first, proximity does have a large effect (3�) on thelikelihood of social interaction among individuals, regardless ofrace or family background. However, proximity is not the mostpowerful policy tool for increasing interracial interactions on agiven campus, because the proximity effect is only important overshort distances (i.e., within building). Given the physical realitythat a student can be housed in truly close proximity to only 45 orso other students, it would be difficult to generate large increasesin the total amount of interracial interaction simply throughmore mixing of the housing.4
In contrast, placing two students in the same entering class(cohort) has a 6� effect on the frequency of their interacting, evenif the two students are of a different race or are at different endsof the academic ability distribution. Thus, overall cohort compo-sition is important in determining peer group, and this fact can beused to influence the number of interracial interactions or inter-actions with high SAT scorers experienced by the modal Dart-mouth student.
Second, a simple group means or linear in means model ofpeer influences does not necessarily assign students to their truepeer group, as measured by the number of email interactions. Themajority of existing peer effects studies use a linear in means
4. For an average White student only about 9 percent of her interactions withBlack students involve Black students from her freshman dorm. While proximityincreases the likelihood of interaction for any pair of students, same dorm inter-racial interactions are still a modest fraction of overall interracial interactions.
81HOW DO FRIENDSHIPS FORM?

approach to creating measures of peer background ability or peeroutcomes. Researchers typically use the mean outcome or meanpretreatment characteristic for a group which is assumed torepresent the individual’s peers or friends. For some examples,see Graham [2005], Betts and Zau [2004], Hoxby [2002], and thestudies referenced above. The econometrics of social interactionsliterature including Manski [1993] and Graham and Hahn [2005]uses the linear in means model as a starting point.
A large question for the literature is whether the groupmeans approach approximates the peer influences a student orsubject actually experiences. Studies of peer effects at the uni-versity level [Sacerdote 2001; Zimmerman 2003; Stinebricknerand Stinebrickner 2004; Duncan et al. 2003b; Foster 2003, 2004;Arcidiacono, Foster, and Kinsler 2003] calculate peer means atthe room, hallway, and dorm level. Our data indicate that peergroups constructed in this way can be a reasonable approxima-tion to the true peer groups that form only if we construct peergroups along all dimensions that matter including race, enteringclass, and geographic distance. And we estimate significantlylarger peer effects when we use a more appropriate definition ofpeer group rather than a simple dorm or hallway mean.
Our third conclusion is that having a minority roommate ordormmate does not appear to lead students into a broader socialnetwork of minority students. When a White student is assigneda Black hallmate, she experiences additional interactions withthat hallmate but not with other Black students living elsewhereon campus.
Finally, by looking at the same students over time, we dis-cuss how social interactions change following the students’ de-parture from campus after graduation. The panel aspect of thedata allow one test of the Gaspar-Glaeser thesis [1998] that emailcommunication is a complement to face-to-face communication,rather than a substitute.
I.A. On Peers, Race, and Location
There is a burgeoning literature on peer effects at the ele-mentary, secondary, and postsecondary levels of education.Hoxby [2000a] finds large peer effects in reading and math testscores among elementary school students. Case and Katz [1991]and Evans, Oates, and Schwab [1992] show that peers are influ-ential in determining risky youth behaviors including drug use,criminal activity, and unprotected sex. A series of papers includ-
82 QUARTERLY JOURNAL OF ECONOMICS

ing Sacerdote [2001], Zimmerman [2003], Stinebrickner andStinebrickner [2004], Foster [2003], and Duncan, Boisjoly, Kre-mer, Levy, and Eccles [2002, 2003] use college or universityroommates to examine peer effects on both academic and social(particularly drinking) outcomes.
Like us, several authors including Festinger, Schachter, andBack [1963], Abu-Ghazzeh [1999], and Holahan, Wilcox, and Bur-nam [1978] have emphasized the importance of geographic prox-imity in determining who interacts with whom. Festinger,Schachter, and Back gathered data on social interactions amongnew Massachusetts Institute of Technology students in MIT-owned housing. Glaeser and Sacerdote [2000] show that individ-uals in more dense housing structures are much more likely tointeract with their neighbors.
Duncan, Boisjoly, Kremer, Levy, and Eccles [2003] show thatthe racial composition of freshman housing assignments can havea long-run impact on student attitudes. For example, if student Xis randomly assigned a Black roommate, X is somewhat morelikely to support affirmative action in admissions and societalincome redistribution. We show that housing assignments lead tolong-run social interactions among roommates and dormmatesboth within and across races.
Several psychology researchers have studied the determi-nants of friendship, and the results of Rainio [1966] and Tumaand Hallinan [1979] imply that similarity and status are twoimportant factors. Waller [1938] and Blau [1964] develop modelsin which offers of friendship are made and accepted or rejectedbased on the costs and benefits of the relationship.
I.B. Modeling the Friendship/Peer Group Formation Process
In conducting our analysis, we have in mind a certain modelof how friendships form and blossom. Every potential social in-teraction has associated costs and benefits. The benefits are botha) a flow of information and ideas and b) the utility from sharinga common experience and conversation with another human be-ing. The utility from the common experience component is as-sumed to increase with the number of previous social interactionsthat one has had with this specific person. The costs are the timeit takes to have the face-to-face conversation, phone conversation,or email exchange. Perhaps the biggest time cost of all is finding
83HOW DO FRIENDSHIPS FORM?

out that the other person exists and might be a useful person withwhom to speak.5
Distance presents itself as a big cost when the value of thesocial interaction is unknown and especially if the person withwhom the interaction might take place is unknown. Commonbackground, interests, and race between two people could raise orlower the benefits of a given social interaction. For example, aWhite senior from Newton, MA, may have little in common witha Black freshman from Chicago. This might increase the benefitsof the interaction to both since the two people have disjoint sets ofinformation. On the other hand, if the goals and concerns of thetwo people are also completely orthogonal, then the value of theinteraction may be low despite a large knowledge gap betweenthe two.
With some functional form assumptions, we might write eachagent’s expected utility from a potential interaction as
E�U�� � E� f�information gathered�
� g�shared experience benefit�� � c�time used�,
where g� is a function that increases with the number of previ-ous social interactions and c� is a function of the amount of timespent learning that the other person exists, traveling to theirlocation, and talking to them.
Suppose that E[ f � g] is low mean and high variance forinteractions with new (unknown) peers. Then our agent maxi-mizes utility by soaking up lots of local, low cost social interac-tions. Once she knows someone well, which raises E[ f � g], thenit pays to continue to interact with that friend even if the friendmoves far away. This concept appears to describe our results aswell as those of Festinger, Schachter, and Back [1963].
The alternative hypothesis (which we reject) is that our agentcan predict with some certainty who would be a good future friendor partner for social interaction. If this were true, then she wouldprobably be likely to travel across campus to meet someone newif that person was a good future prospect.
Suppose that interacting with a student of a different race is
5. In theory, student X could walk .7 miles to another part of campus to findout if some other dorm might house a previously unknown peer who can help himwith his calculus problem set, or a new friend who wants to have dinner. Butmaking this trip with no additional information, would be a costly and probablyembarrassing thing for X to do, particularly if the probability of success is low.
84 QUARTERLY JOURNAL OF ECONOMICS
more costly than interacting within race.6 Since the expectedbenefit of interacting with any unknown person is small, even asmall additional cost associated with cross-race interaction couldhave a large effect on the initiation of cross-race friendships. Andthis racial barrier would be self-perpetuating since in our modelpeople derive utility from interacting with the same person re-peatedly. Thus, even small costs associated with race could createa barrier to new social interactions that works in the same man-ner as geographic distance.
There is also a potential free rider problem; everyone in thesociety might agree that more interracial interaction would lowerthe costs of such interaction for everyone. But as an individual Imay ignore this social benefit from my activities. This couldexplain why on modern university campuses students expressboth public and private support for reduced social segregation,and yet high levels of segregation persist (See Reid [2005]).
I.C. Empirical Framework
One goal of our analysis is to estimate the relative impor-tance of geographic distance, racial similarity, family back-ground, and common interests in determining who interacts withwhom.7 We do this by forming all possible pairs of students andasking who emails whom and with what intensity. We run Pois-son regressions of the following form:
E �# of emails between person 1 and person 2� � eX�,
where X� � � B1*(dummies for person 1’s race, varsity athletestatus, gender, Greek status, type of high school, financial aidstatus) � B2*(dummies for person 2’s race, varsity athlete status,gender, Greek status, type of high school, financial aid status) ��3*(dummy for same graduating class) � �4*(dummy for samefreshman dorm) � B5*(interactions of race and same freshmandorm) � B6*(interactions of female with same dorm dummy, racedummies).
Here we combine into a single data point the volume fromperson A sending to person B and B sending to A. But we
6. Indeed the neuroscience literature suggests that White-Black interactionis more stressful than within-race interaction as measured in functional magneticresonance imaging (fMRI) scans [Richeson et al. 2003].
7. We then take these estimates and ask questions, such as, a) how couldpolicy-makers increase levels of interaction across diverse groups, and b) does agroup means approach to peer effects adequately describe the social influencesexperienced by these students.
85HOW DO FRIENDSHIPS FORM?

obtained similar results when we kept A to B and B to A as twodistinct observations.
We run Poisson regressions for two related reasons. First,sending or receiving email is a rare, binomial event which canoccur in any of the instants in time during the sample period. Weare summing up over many instants in time (the sample period isthirteen months long). Thus, the number of emails should have aPoisson distribution. The histogram of the data supports thisconjecture. And when we look at “effects” of right-hand-side vari-ables, the effects appear to be multiplicative rather than additivesuggesting a Poisson or other semi-logarithmic functional form.For example, putting two people in the same dorm and graduat-ing class generally multiplies the expected number of emails by afactor of roughly 10, even for subgroups that have a very differentbaseline expected number of emails.8
In our regression tables we report the regression coefficients,standard errors, and e�(coefficient). The latter tells us how muchthe expected number of emails changes multiplicatively if theright-hand-side variable increases by one. (Since Poisson regres-sion fits the number of emails to the form eX�, increasing x by onemultiplies the predicted value by e�.) For example, the coefficienton “same freshman dorm” is estimated to be 1.3, which meansthat being in the same freshman dorm raises the number ofemails by a factor of 3.7.9
I.D. Do Emails Equal Friendship?
A natural question to ask is whether our email measurecaptures friendship or at least a meaningful level of social inter-action. We believe strongly that within the campus we are study-ing the answer is yes. This conclusion is based upon our ownexperiences and a formal survey of friendship that we conductedin order to validate the emails measure.
Use of the Blitz (Dartmouth’s email) system on campus ispervasive. Virtually all planned face-to-face interaction (for stu-dents, faculty, or staff) is organized over Blitz. Blitz is designedspecifically to deliver intracampus email messages instanta-
8. We are greatly indebted to both referees for suggesting that we switch fromOLS to Poisson.
9. Researchers often rely on the approximation that Poisson coefficientsroughly correspond to percentage changes in the dependent variable. But in ourcase many coefficients of interest are too large in absolute value for this approxi-mation to be helpful.
86 QUARTERLY JOURNAL OF ECONOMICS

neously, so it serves the same purpose as Instant Messagingsoftware which is popular in other organizations. In fact, pairs ofroommates or faculty members with offices on the same hallwayblitz (email) each other a great deal.
In order to demonstrate the strong positive correlation be-tween friendship and email volume between two students, wesurveyed a small subset of the subjects in our data set. We askedstudents to name their five closest friends on campus, knowingthat we could then match this list against their emailing pat-terns. We emailed out 300 surveys and received back roughly 105responses. Thus (for this validation exercise), we have a list ofclose friends for 105 students and email volumes between each ofthese 105 students and all other students.
If a student A considers student B to be a close friend, thenthere is a 75 percent chance that ten or more emails are sentbetween A and B during the thirteen-month period of the study.And the average volume between A and B is 136 messages. If Adoes not consider B to be a close friend, then there is a .2 percentchance that the total volume of emails exceeds ten, and theaverage volume is .21 messages. In short, we observe a strongconnection between email volumes and self-reported friendship.
There are of course important caveats to this conclusion.First, our small survey of friends has only a 30 percent responserate and response is biased toward heavier users of Blitz. So theconnection between emails and friendship may be less strong inthe rest of the population. And smaller email volumes betweentwo students might indicate a working relationship or brief ex-change of information (e.g., times or dates for a meeting) ratherthan a friendship. Readers of this paper can substitute the termsocial interaction for friendship and hopefully still find the resultsmeaningful.10
II. DATA DESCRIPTION
We have the number of email messages sent and receivedamong our users during June 2002 through July 2003. The dataon email volumes are from Dartmouth’s Netblitz email system.NetBlitz is the web-based version of Dartmouth’s email software
10. We were deliberately bold in choosing the paper title because we believethat the qualitative results generalize beyond simply understanding email vol-umes among students at an elite college.
87HOW DO FRIENDSHIPS FORM?

and is frequently used by students and alumni whenever they areoff campus. To be included in the study as a primary user, astudent must have used NetBlitz to check or send email at somepoint during the sample period, and a large fraction of studentsdid so (see below). A single use of NetBlitz gives us access to thatstudent’s entire Dartmouth email history, whether the messageswere created with NetBlitz, or Dartmouth’s standard mail utility(Blitz), or any other email software. We recorded the number ofemail messages between any two students on the system betweenJune 1, 2002, and July 31, 2003.
Whenever a student logged into NetBlitz, and had agreed toparticipate in the study, we captured ID numbers and volumes forthe senders and recipients of their messages from the Inbox, SentMessages folder, and any other folders that the student main-tained. Thus, a single use of NetBlitz provides us with reams ofdata from the student’s on and off campus email use.11 A givenmessage could be picked up from the sender’s account, the recipi-ent’s account, or both. Our algorithm avoids double counting anddistinguishes between sent and received messages.
We label the students using NetBlitz as primary users. Second-ary users are those Dartmouth students who do not use NetBlitz butwho appear in the data set by virtue of sending (or receiving) anemail to (or from) a primary user. A sufficient but not necessarycondition to capture all of a primary user’s correspondence is thatthe user logs in to NetBlitz every six months. We drop the fewprimary users that logged in less frequently than every six months.
We dropped all emails that were sent to more than oneperson. Though such emails are often sent among friends, theemails also are sent to working groups and large organizations inwhich the individual members may have little interest or inter-personal interaction.
Numerous steps were taken to protect the human subjects inthe study. First, as the researchers, our copy of the data did notinclude names but rather unique randomly assigned ID numbers.Second, no information on the content of the email messages wasever collected; we merely collected numbers of messages sent andreceived. Third, all subjects were given informed consent and theopportunity to opt out the study.12
11. In other words, we capture not just volumes sent during that particularsession, but any information in the student’s folders.
12. Eight percent of NetBlitz users opted out of the study.
88 QUARTERLY JOURNAL OF ECONOMICS
In addition to data on email volumes, we also collected foreach student the following data items: SAT scores, name of highschool attended, financial aid status, race, gender, DartmouthGPA as of July 2003, participation in varsity athletics, and abinary variable for membership in a fraternity, sorority, or coedGreek organization. These data are all available in Dartmouth’sBanner database. We are indebted to the Computing ServicesDepartment for merging these student characteristics with ouremail data using student ID numbers.
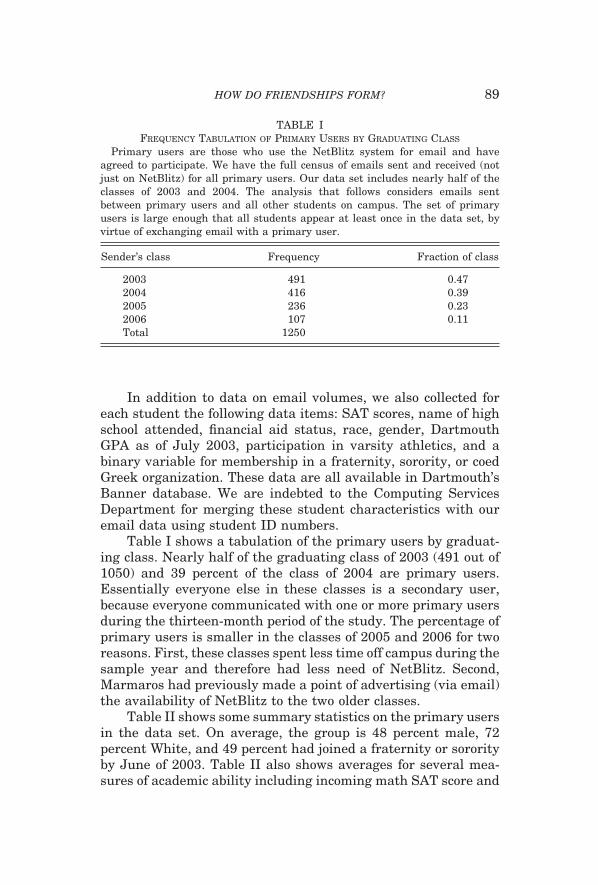
Table I shows a tabulation of the primary users by graduat-ing class. Nearly half of the graduating class of 2003 (491 out of1050) and 39 percent of the class of 2004 are primary users.Essentially everyone else in these classes is a secondary user,because everyone communicated with one or more primary usersduring the thirteen-month period of the study. The percentage ofprimary users is smaller in the classes of 2005 and 2006 for tworeasons. First, these classes spent less time off campus during thesample year and therefore had less need of NetBlitz. Second,Marmaros had previously made a point of advertising (via email)the availability of NetBlitz to the two older classes.
Table II shows some summary statistics on the primary usersin the data set. On average, the group is 48 percent male, 72percent White, and 49 percent had joined a fraternity or sororityby June of 2003. Table II also shows averages for several mea-sures of academic ability including incoming math SAT score and
TABLE IFREQUENCY TABULATION OF PRIMARY USERS BY GRADUATING CLASS
Primary users are those who use the NetBlitz system for email and haveagreed to participate. We have the full census of emails sent and received (notjust on NetBlitz) for all primary users. Our data set includes nearly half of theclasses of 2003 and 2004. The analysis that follows considers emails sentbetween primary users and all other students on campus. The set of primaryusers is large enough that all students appear at least once in the data set, byvirtue of exchanging email with a primary user.
Sender’s class Frequency Fraction of class
2003 491 0.472004 416 0.392005 236 0.232006 107 0.11Total 1250
89HOW DO FRIENDSHIPS FORM?

incoming Academic Index. The Academic Index can range from 60to 240 and is a weighted average of SAT I scores (weight � 1⁄3),SAT II scores (weight � 1⁄3), and rescaled high school class rank(weight � 1⁄3). On average, the primary users exchanged (sent orreceived) 853 messages during the sample period with a standarddeviation of 877 messages.
Three percent of primary users graduated from a New YorkCity specialized (“exam”) high school, meaning Stuyvesant,Brooklyn Tech, Bronx Science, or Hunter College High School.13
Five percent of primary users attended one of the well-known,selective private schools that serves as a major feeder high school
13. Technically, Hunter College High School is not one of the traditionalspecialized high schools that use the same standardized test to admit students(Hunter has its own exam). In practice, Hunter is the one of the top, selective NewYork City public high schools that sends many students to Dartmouth.
TABLE IISUMMARY STATISTICS FOR PRIMARY USERS
Primary users are those who use the NetBlitz system for email and haveagreed to participate. N � 1250. The analysis that follows considers emailssent between primary users and the set of all students.
Variable MeanStd.dev. Min Max
Male 0.48 0.50 0 1Member of fraternity/sorority 0.49 0.50 0 1White (0-1) 0.72 0.45 0 1Black 0.05 0.21 0 1Asian 0.14 0.35 0 1Hispanic 0.06 0.24 0 1Academic index (from admissions) 215.30 13.00 159.67 240.00Cumulative GPA (as of 7/03) 3.38 0.35 1.78 3.99Combined SAT Score 1427.43 103.89 1000 1600Total messages sent and received 853.51 877.68 63 8737Attended NYC specialized high school 0.03 0.17 0 1Attended prep school with strong
Dartmouth connection 0.05 0.22 0 1Receives financial aid 0.53 0.50 0 1Has 1 or more Black freshman
roommates 0.08 0.27 0 1Percent freshman floor Black 0.06 0.08 0 1Percent freshman dorm Black 0.06 0.05 0 0.2Number of freshman dormmates 34.49 17.63 0 91Number of freshman hallmates 9.93 4.88 0 25
90 QUARTERLY JOURNAL OF ECONOMICS

for Dartmouth.14 We use these two high school dummies as indi-cators to tell us something about a student’s background. Fifty-three percent of primary users are financial aid recipients.
Each student has roughly 35 other freshman in their ran-domly assigned freshman dorm. On average, there are ten otherfreshman on one’s freshman hallway.
A natural question to ask is whether the primary users arerepresentative of Dartmouth students as a whole. We addressthis question in Appendix 1 where we compare the primary userswith everybody else (i.e., the secondary users). The primary usersare much more likely to be members of a fraternity or sorority,but this discrepancy is partly due the fact that only 107 freshmanare primary users and the freshman are prohibited from joining.When we compare primary and secondary users who are juniorsor seniors, the difference in fraternity membership is no longerstatistically significant.
Average math SATs for the primary users and secondaryusers are similar at 715 and 706, respectively. And cumulativeGPA is similar across the two groups. Overall, we believe that ourgroup of primary users is large enough and diverse enough toenable us to form conclusions about the behavior of Dartmouthstudents as a group, even though primary users select into oursample by choosing to use NetBlitz.
Black students are significantly underrepresented among theprimary users; 4.9 percent of primary users are Black versus 8.0percent of the secondary users. If the Black secondary users havesignificantly different patterns of interaction than the Black pri-mary users, our results may not generalize across the two groups.Even given this bias, we are still well positioned to study cross-race interaction because the only emails that do not enter ourdata set are those exchanged between two secondary users. Sup-pose that Black students never used Netblitz but that all Whitestudents did. We would end up with the complete census ofWhite-Black email interactions since the set of secondary usersincludes everyone.
We examine the volume of emails exchanged between each
14. We created a dummy equal to 1 for students from private prep schoolsthat fall within the top twenty feeders to schools to Dartmouth (in recent years).The list of schools includes Andover, Exeter, Walt Whitman (MD), Lawrenceville,St. Paul’s, Deerfield, St. Ann’s (NY), Horace Mann, Punahou, Winsor, Trinity(NY), Buckingham, Browne, and Nichols, Dalton School, Pingry School, LoomisChafee, and Collegiate.
91HOW DO FRIENDSHIPS FORM?

primary user and all other students (summing over emails goingin either direction). To do this, we form all possible pairwisecombinations of a primary user and any student in the data set(be they a primary or secondary user). We cross the set of 1250primary users with 4000� students which results in 5.3 millionpairs of students. We then eliminate duplicate observations re-sulting from A to B and B to A potentially being counted asseparate pairs leaving us with 4.2 million unique pairs. Any ofthese 4.2 million possible social connections might be active (i.e.,have email traffic), though in fact about 29,000 of the connectionsare active during the sample period.
For the tables and associated discussion, we label the firstperson in the pair (who is always a primary user) as “Person 1”and the second person in the pair (who may be a primary orsecondary user) as “Person 2.”
Table III shows summary statistics at the pair level. In the
TABLE IIIPAIR LEVEL SUMMARY STATISTICS
We consider all possible pairings of primary users and all Dartmouthstudents. The analysis that follows looks at the volume sent (if any) betweeneach primary user and every student on campus. In the labels below, person 1is the primary user, and person 2 is the other person in the pair (be they aprimary or secondary user).
Variable Obs. MeanStd.dev. Min Max
Talks (0–1) (i.e., email each otherat least once) 4,225,623 0.007 0.083 0 1
Email each other at least 5 timeseach way 4,225,623 0.002 0.048 0 1
Volume sent between persons 1and 2 4,225,623 0.253 9.831 0 3745
Volume sent conditional onvolume �1 29,197 32.381 112.910 2 3745
Persons 1 and 2 are members ofsame class year 4,225,623 0.237 0.425 0 1
Same freshman floor 4,225,623 0.003 0.054 0 1Same freshman dorm building 4,225,623 0.010 0.101 0 1Same freshman year cluster of
buildings 4,225,623 0.031 0.172 0 1Distance between freshman rooms
in thousands of feet 4,225,623 1.421 0.839 0.060 3.273Same major 4,225,623 0.069 0.254 0 1
92 QUARTERLY JOURNAL OF ECONOMICS
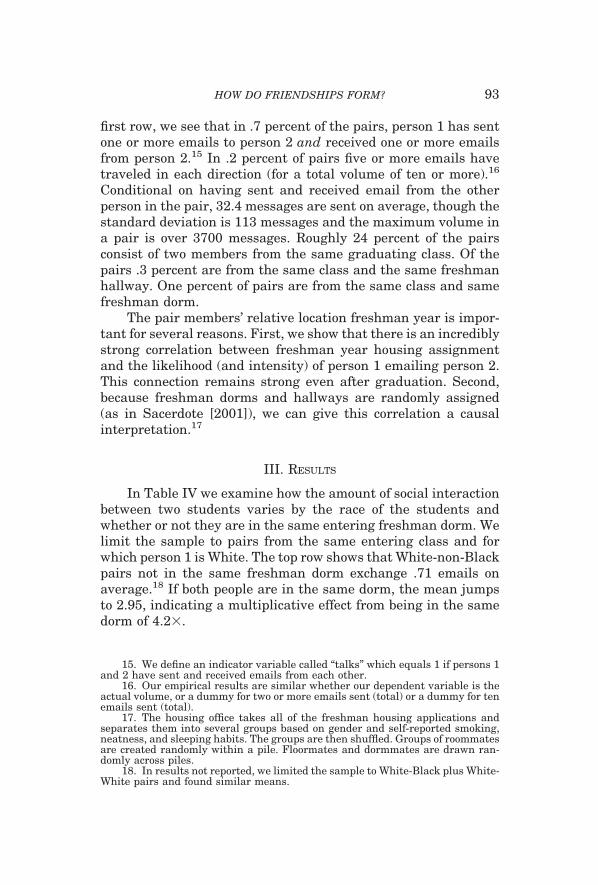
first row, we see that in .7 percent of the pairs, person 1 has sentone or more emails to person 2 and received one or more emailsfrom person 2.15 In .2 percent of pairs five or more emails havetraveled in each direction (for a total volume of ten or more).16
Conditional on having sent and received email from the otherperson in the pair, 32.4 messages are sent on average, though thestandard deviation is 113 messages and the maximum volume ina pair is over 3700 messages. Roughly 24 percent of the pairsconsist of two members from the same graduating class. Of thepairs .3 percent are from the same class and the same freshmanhallway. One percent of pairs are from the same class and samefreshman dorm.
The pair members’ relative location freshman year is impor-tant for several reasons. First, we show that there is an incrediblystrong correlation between freshman year housing assignmentand the likelihood (and intensity) of person 1 emailing person 2.This connection remains strong even after graduation. Second,because freshman dorms and hallways are randomly assigned(as in Sacerdote [2001]), we can give this correlation a causalinterpretation.17
III. RESULTS
In Table IV we examine how the amount of social interactionbetween two students varies by the race of the students andwhether or not they are in the same entering freshman dorm. Welimit the sample to pairs from the same entering class and forwhich person 1 is White. The top row shows that White-non-Blackpairs not in the same freshman dorm exchange .71 emails onaverage.18 If both people are in the same dorm, the mean jumpsto 2.95, indicating a multiplicative effect from being in the samedorm of 4.2�.
15. We define an indicator variable called “talks” which equals 1 if persons 1and 2 have sent and received emails from each other.
16. Our empirical results are similar whether our dependent variable is theactual volume, or a dummy for two or more emails sent (total) or a dummy for tenemails sent (total).
17. The housing office takes all of the freshman housing applications andseparates them into several groups based on gender and self-reported smoking,neatness, and sleeping habits. The groups are then shuffled. Groups of roommatesare created randomly within a pile. Floormates and dormmates are drawn ran-domly across piles.
18. In results not reported, we limited the sample to White-Black plus White-White pairs and found similar means.
93HOW DO FRIENDSHIPS FORM?

When person 1 is White and person 2 is Black, the multipli-cative effect of being in the same freshman dorm is 2.92, butmeasured from a much lower base level of interaction; the meanvolume between a randomly chosen Black student and a ran-domly chosen White classmate is .21 messages for students indifferent dorms and .62 for students in the same dorm.
Next we consider the race effect by comparing rows 1 and 4.Holding constant that both students are in the same dorm (col-umn (2)) and that person 1 is White, the second person beingBlack reduces mean email volume by a factor of 4.76 (i.e., 2.95/.62). For students not in the same dorm, the second student beingBlack reduces email volume by a factor of 3.34.
Table IV also shows the mean probability that the two peopleexchange at least one email in each direction (“talk”). Moving aWhite-Black pair to the same dorm increases the probability oftalking by a factor of 2.63.
We draw several conclusions from this analysis. First, theeffects of race, geography, and being from the same cohort arelarge. White-non-Black pairs have roughly 3–5 times more inter-action than White-Black pairs. When two people are from thesame graduating class, being in the same dorm raises the amountof interaction by a factor of 3 or 4. For White-Black pairs, thepositive effect of being in the same dorm is nearly large enough tooffset the negative race effect; White-Black pairs in the same
TABLE IVMEAN VOLUMES AND PROBABILITIES OF TALKING BY RACE AND GEOGRAPHY
We limit the sample to pairs from the same class and in which person 1 (theprimary user) is White. We stratify by the second person being Black and bybeing in the same freshman dorm. For each pair we compute the mean volume(number of messages sent back and forth) and the probability of talking (i.e.,sending at least one message in each direction).
Person 2 Black?
Same dorm? Ratio (samedorm to
not)No Yes
No Mean (Volume) 0.708 2.947 4.162Mean (Talks?) 0.017 0.054 3.176N 643,294 28,874
Yes Mean (Volume) 0.212 0.619 2.920Mean (Talks?) 0.008 0.021 2.625N 48,182 2,220
94 QUARTERLY JOURNAL OF ECONOMICS

dorm have mean email volumes of .62 versus .71 for White-non-Black pairs not in the same dorm.
Second, the analysis of means suggests we should model theeffects from student characteristics using a multiplicative form(e.g., a Poisson regression) rather than a linear form. The samedorm effect is on the order of a 3–4� increase whether we startfrom the baseline level of a mixed race pair or the higher baselevel of a same race pair. The race effect is on the order of a 3�effect whether we consider interaction within versus across fresh-man dorms.
We next ask how much having a Black freshman roommateor a greater than median percentage of Black students on one’sfreshman hallway increases a student’s interaction with Blackstudents. For all the non-Black students, having a Black room-mate raises the fraction of emails volume exchanged with Blackstudents from 4.4 to 4.9 percent.19 This only amounts to an extrathree emails exchanged with Black students. We show later inthe paper that this increase in emails can easily be accounted forby the extra email volume between White students and their ownBlack roommates. The effects are not suggestive of a multipliereffect in which Black roommates introduce White students to newnetworks of Black students. Living on a hallway with more thanmedian percent Black raises a non-Black student’s fraction ofemails exchanged with Black students from 4.2 percent to 4.7percent.
In Table V we limit the sample to White students and runregressions at the student level. We regress the student’s percentof email volume exchanged with Black students on the percentBlack in her dorm, her hallway, and a dummy for having anyBlack roommate.20 We control for all observed student character-istics including gender, SAT scores, financial aid status, type ofhigh school attended, Greek, and athletic status. Using column(1), a 10 percent increase in the percent Black in a student’s dormleads to a .1 percent increase in volume exchanged with Blackstudents, which translates to .9 messages. This effect is fullyexplained by the same dorm effect for any two students, and neednot imply that having Black dormmates increases a White stu-dent’s likelihood of interacting with Black students outside her
19. We set the dummy for having a Black roommate equal to one if one ormore roommates are Black.
20. The dorm and hallway percent Black calculation excludes the studentherself.
95HOW DO FRIENDSHIPS FORM?
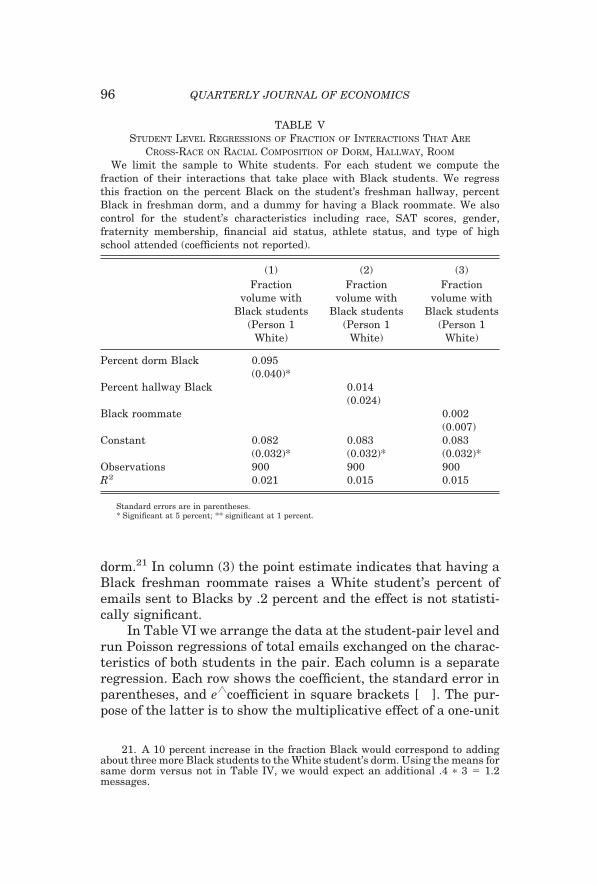
dorm.21 In column (3) the point estimate indicates that having aBlack freshman roommate raises a White student’s percent ofemails sent to Blacks by .2 percent and the effect is not statisti-cally significant.
In Table VI we arrange the data at the student-pair level andrun Poisson regressions of total emails exchanged on the charac-teristics of both students in the pair. Each column is a separateregression. Each row shows the coefficient, the standard error inparentheses, and e�coefficient in square brackets [ ]. The pur-pose of the latter is to show the multiplicative effect of a one-unit
21. A 10 percent increase in the fraction Black would correspond to addingabout three more Black students to the White student’s dorm. Using the means forsame dorm versus not in Table IV, we would expect an additional .4 � 3 � 1.2messages.
TABLE VSTUDENT LEVEL REGRESSIONS OF FRACTION OF INTERACTIONS THAT ARE
CROSS-RACE ON RACIAL COMPOSITION OF DORM, HALLWAY, ROOM
We limit the sample to White students. For each student we compute thefraction of their interactions that take place with Black students. We regressthis fraction on the percent Black on the student’s freshman hallway, percentBlack in freshman dorm, and a dummy for having a Black roommate. We alsocontrol for the student’s characteristics including race, SAT scores, gender,fraternity membership, financial aid status, athlete status, and type of highschool attended (coefficients not reported).
(1) (2) (3)Fraction
volume withBlack students
(Person 1White)
Fractionvolume with
Black students(Person 1
White)
Fractionvolume with
Black students(Person 1
White)
Percent dorm Black 0.095(0.040)*
Percent hallway Black 0.014(0.024)
Black roommate 0.002(0.007)
Constant 0.082 0.083 0.083(0.032)* (0.032)* (0.032)*
Observations 900 900 900R2 0.021 0.015 0.015
Standard errors are in parentheses.* Significant at 5 percent; ** significant at 1 percent.
96 QUARTERLY JOURNAL OF ECONOMICS
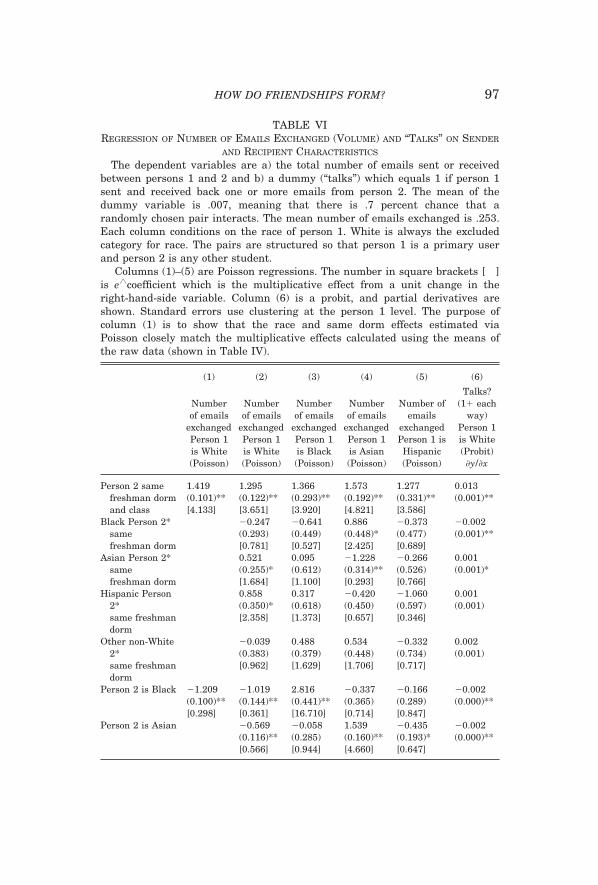
TABLE VIREGRESSION OF NUMBER OF EMAILS EXCHANGED (VOLUME) AND “TALKS” ON SENDER
AND RECIPIENT CHARACTERISTICS
The dependent variables are a) the total number of emails sent or receivedbetween persons 1 and 2 and b) a dummy (“talks”) which equals 1 if person 1sent and received back one or more emails from person 2. The mean of thedummy variable is .007, meaning that there is .7 percent chance that arandomly chosen pair interacts. The mean number of emails exchanged is .253.Each column conditions on the race of person 1. White is always the excludedcategory for race. The pairs are structured so that person 1 is a primary userand person 2 is any other student.
Columns (1)–(5) are Poisson regressions. The number in square brackets [ ]is e�coefficient which is the multiplicative effect from a unit change in theright-hand-side variable. Column (6) is a probit, and partial derivatives areshown. Standard errors use clustering at the person 1 level. The purpose ofcolumn (1) is to show that the race and same dorm effects estimated viaPoisson closely match the multiplicative effects calculated using the means ofthe raw data (shown in Table IV).
(1) (2) (3) (4) (5) (6)
Numberof emails
exchangedPerson 1is White(Poisson)
Numberof emails
exchangedPerson 1is White(Poisson)
Numberof emails
exchangedPerson 1is Black(Poisson)
Numberof emails
exchangedPerson 1is Asian(Poisson)
Number ofemails
exchangedPerson 1 isHispanic(Poisson)
Talks?(1� each
way)Person 1is White(Probit)
�y/�x
Person 2 same 1.419 1.295 1.366 1.573 1.277 0.013freshman dorm (0.101)** (0.122)** (0.293)** (0.192)** (0.331)** (0.001)**and class [4.133] [3.651] [3.920] [4.821] [3.586]
Black Person 2* �0.247 �0.641 0.886 �0.373 �0.002same (0.293) (0.449) (0.448)* (0.477) (0.001)**freshman dorm [0.781] [0.527] [2.425] [0.689]
Asian Person 2* 0.521 0.095 �1.228 �0.266 0.001same (0.255)* (0.612) (0.314)** (0.526) (0.001)*freshman dorm [1.684] [1.100] [0.293] [0.766]
Hispanic Person 0.858 0.317 �0.420 �1.060 0.0012* (0.350)* (0.618) (0.450) (0.597) (0.001)same freshmandorm
[2.358] [1.373] [0.657] [0.346]
Other non-White �0.039 0.488 0.534 �0.332 0.0022* (0.383) (0.379) (0.448) (0.734) (0.001)same freshmandorm
[0.962] [1.629] [1.706] [0.717]
Person 2 is Black �1.209 �1.019 2.816 �0.337 �0.166 �0.002(0.100)** (0.144)** (0.441)** (0.365) (0.289) (0.000)**[0.298] [0.361] [16.710] [0.714] [0.847]
Person 2 is Asian �0.569 �0.058 1.539 �0.435 �0.002(0.116)** (0.285) (0.160)** (0.193)* (0.000)**[0.566] [0.944] [4.660] [0.647]
97HOW DO FRIENDSHIPS FORM?

TABLE VI(CONTINUED)
(1) (2) (3) (4) (5) (6)
Numberof emails
exchangedPerson 1is White(Poisson)
Numberof emails
exchangedPerson 1is White(Poisson)
Numberof emails
exchangedPerson 1is Black(Poisson)
Numberof emails
exchangedPerson 1is Asian(Poisson)
Number ofemails
exchangedPerson 1 isHispanic(Poisson)
Talks?(1� each
way)Person 1is White(Probit)
�y/�x
Person 2 is �0.217 0.683 0.317 0.992 0.000Hispanic (0.097)* (0.234)** (0.237) (0.205)** (0.000)**
[0.805] [1.980] [1.373] [2.697]Person 2 is other �0.533 0.111 �0.802 �0.003 �0.002
non-White (0.179)** (0.475) (0.210)** (0.468) (0.000)**[0.587] [1.117] [0.448] [0.997]
Same class year 1.898 1.762 1.575 1.965 1.608 0.009(0.064)** (0.068)** (0.149)** (0.132)** (0.156)** (0.000)**[6.673] [5.824] [4.831] [7.135] [4.993]
Varsity athlete �0.613 �0.350 �0.405 �0.962 �0.002(Person 1) (0.096)** (0.377) (0.221) (0.245)** (0.000)**
[0.542] [0.705] [0.667] [0.382]Varsity athlete �0.566 �0.731 �1.071 �0.547 �0.002
(Person 2) (0.105)** (0.207)** (0.129)** (0.162)** (0.000)**[0.568] [0.481] [0.343] [0.579]
Both are athletes 1.297 1.296 1.553 1.019 0.010(0.142)** (0.576)* (0.343)** (0.355)** (0.001)**[3.658] [3.655] [4.726] [2.770]
Greek member �0.682 �0.042 �0.179 �0.319 �0.003(Person 1) (0.097)** (0.218) (0.217) (0.247) (0.000)**
[0.506] [0.959] [0.836] [0.727]Greek member �0.207 �0.514 �0.308 �0.107 �0.001
(Person 2) (0.097)* (0.190)** (0.163) (0.250) (0.000)**[0.813] [0.598] [0.735] [0.899]
Both are in 1.382 1.859 1.008 0.842 0.010Greek (0.131)** (0.279)** (0.254)** (0.322)** (0.001)**organizations [3.983] [6.417] [2.740] [2.321]
Same major 0.239 0.093 0.097 0.175 0.002(0.091)** (0.166) (0.194) (0.202) (0.000)**[1.270] [1.097] [1.102] [1.191]
Absolute �0.003 �0.001 �0.001 0.000 0.000difference in (0.000)** (0.001) (0.001) (0.001) (0.000)**SAT scores [0.997] [0.999] [0.999] [1.000]
Person 1 is male �0.150 0.098 �0.148 0.166 0.000(0.069)* (0.209) (0.138) (0.189) (0.000)[0.861] [1.103] [0.862] [1.181]
Person 2 is male �0.333 �0.375 �0.393 �0.572 �0.001(0.049)** (0.151)* (0.109)** (0.134)** (0.000)**[0.717] [0.687] [0.675] [0.564]
98 QUARTERLY JOURNAL OF ECONOMICS

TABLE VI(CONTINUED)
(1) (2) (3) (4) (5) (6)
Numberof emails
exchangedPerson 1is White(Poisson)
Numberof emails
exchangedPerson 1is White(Poisson)
Numberof emails
exchangedPerson 1is Black(Poisson)
Numberof emails
exchangedPerson 1is Asian(Poisson)
Number ofemails
exchangedPerson 1 isHispanic(Poisson)
Talks?(1� each
way)Person 1is White(Probit)
�y/�x
Both are male �0.122 0.086 0.030 0.005 0.003(0.050)* (0.154) (0.109) (0.137) (0.000)**[0.885] [1.090] [1.030] [1.005]
Person 1 went to 0.565 �0.131 �0.647 �1.259 0.002NYC (0.270)* (0.178) (0.250)** (0.289)** (0.001)*exam school [1.759] [0.877] [0.524] [0.284]
Person 2 went to �0.052 �0.045 �0.071 0.341 0.000NYC (0.140) (0.333) (0.301) (0.323) (0.000)exam school [0.949] [0.956] [0.931] [1.406]
Both 1 and 2 1.779 0.389 1.369 0.678 0.003went to (0.643)** (0.522) (0.491)** (0.359) (0.002)NYC examschools
[5.924] [1.476] [3.931] [1.970]
Person 1 went �0.247 �0.045 �0.725 0.026 0.000to fancy prep (0.116)* (0.216) (0.239)** (0.255) (0.000)school [0.781] [0.956] [0.484] [1.026]
Person 2 went 0.173 �0.563 0.079 �0.008 0.000to fancy prep (0.178) (0.222)* (0.190) (0.246) (0.000)school [1.189] [0.569] [1.082] [0.992]
Both 1 and 2 0.536 �0.320 �0.751 0.086 0.004went (0.284) (0.734) (0.731) (0.651) (0.001)**to fancy prepschool
[1.709] [0.726] [0.472] [1.090]
Person 1 on �0.175 �1.101 0.148 �0.230 �0.001financial (0.093) (0.346)** (0.213) (0.264) (0.000)**aid [0.839] [0.333] [1.160] [0.795]
Person 2 on �0.294 �0.583 0.241 �0.848 �0.001financial (0.075)** (0.408) (0.221) (0.260)** (0.000)**aid [0.745] [0.558] [1.273] [0.428]
Both on financial 0.393 1.074 0.028 1.032 0.001aid (0.113)** (0.469)* (0.261) (0.300)** (0.000)**
[1.481] [2.927] [1.028] [2.807]Person 2 is �0.291 �0.001
Black* (0.312) (0.001)Person 1 hasBlackRoommate
[0.748]
Person 2 is 1.516 �3.501 1.624 4.791 0.002Black* % (1.749) (3.765) (4.063) (2.681) (0.004)Black in 1’sfreshman dorm
[4.554] [0.030] [5.073] [120.422]
99HOW DO FRIENDSHIPS FORM?

change in the right-hand-side variable. The omitted categories forperson 1 and 2’s race is always White. The interaction dummiesare constructed such that the coefficients should be multipliedtogether to calculate the total effect. For example, the interactioneffect for person 2 being “Black and in the same class and dorm”is on top of the baseline effects of “same freshman dorm” and“same class.”
In column (1) we limit the sample to pairs in which person 1(the primary user) is White. We regress the number of emails ondummy variables for person 2 being Black, being in the samefreshman dorm, and being in the same freshman class. We showthis simplified specification mainly to verify that the Poissonregressions reproduce the same effects that we observed in themeans of the raw data in Table IV. The regression shows thatbeing in the same freshman dorm multiplies the number ofemails by 4.13. Table IV indicates a multiplicative effect of 4.16.If person 2 is Black, the expected number of emails is multipliedby .299 (a 70 percent reduction), which is also consistent withTable IV.
TABLE VI(CONTINUED)
(1) (2) (3) (4) (5) (6)
Numberof emails
exchangedPerson 1is White(Poisson)
Numberof emails
exchangedPerson 1is White(Poisson)
Numberof emails
exchangedPerson 1is Black(Poisson)
Numberof emails
exchangedPerson 1is Asian(Poisson)
Number ofemails
exchangedPerson 1 isHispanic(Poisson)
Talks?(1� each
way)Person 1is White(Probit)
�y/�x
Person 1’s �1.128 �0.003percent (0.752) (0.002)dorm Black [0.324]
Person 1 has 0.181 0.000a Black (0.144) (0.000)roommate [1.198]
Constant �2.242 �1.140 �2.129 �2.382 �1.666(0.054)** (0.103)** (0.437)** (0.258)** (0.347)**
Observations 3,021,484 2,923,120 192,279 560,120 245,165 2,923,120
Robust standard errors are in parentheses. * significant at 5 percent; ** significant at 1 percent. NYCexam schools included are Stuyvesant, Bronx Science, Brooklyn Tech, and Hunter College High School. Fancyprep schools include Andover, Exeter, Walt Whitman (MD), Lawrenceville, St. Paul’s, Deerfield, St. Ann’s(NY), Horace Mann, Punahou, Winsor, Trinity (NY), Buckingham, Browne and Nichols, Dalton School,Pingry School, Loomis, Chafee, and Collegiate. These are the private high schools that are within the toptwenty feeder high schools to Dartmouth.
100 QUARTERLY JOURNAL OF ECONOMICS

Column (2) again limits the sample to pairs in which person1 is White and includes all characteristics for both students in thepair. Many of our key results can be seen in this column. Being inthe same class year has a multiplicative effect of 5.8.
We include all interactions of person 2’s race and same fresh-man dorm.22 The omitted category for person 2’s race is alwaysWhite. For White-White pairs, being in the same freshman dormhas a multiplicative effect of 3.7 (on top of the same class effect).Interestingly, the interactions of same dorm with race are gener-ally not significantly different from the White-White same dormeffect. In other words, geographic proximity enhances cross-raceinteractions to the same degree that proximity enhances withinrace interactions.
However, there are large negative level effects from person 2being Black when person 1 is White. Overall, White-Black pairsare estimated to have 64 percent fewer interactions (1 minus the.36 shown in square brackets for the “person 2 is Black” estimate).White-Asian pairs have 44 percent fewer interactions, and White-Hispanic pairs have 20 percent fewer interactions.
We turn now to the effects of both students in the pair havingsimilar interests including athletic participation, fraternity andsorority membership, and college majors. Again considering pairswhere person 1 is White, being in the same college major raisesthe number of interactions by 27 percent. This effect is not sta-tistically significant when person 1 is Black, Asian, or Hispanic(columns (3)–(5)).
Being an athlete has a negative level effect on interaction,whether we examine the coefficient for person 1 being an athleteor person 2 being an athlete. However, the interaction term forboth students being athletes has a multiplicative effect of 3.7 onthe number of emails. If person 1 is an athlete and person 2 is not,we find 46 percent fewer emails relative to the base category ofnonathlete-nonathlete pairs. However, athlete-athlete pairs en-joy 13 percent more emails than the base category.23 The effectsfor Greek membership work in much the same way. If only person1 is Greek, there are 49 percent fewer emails relative to non-Greek-non-Greek pairs. If both 1 and 2 are Greek, we see 64percent more emails relative to the base category. Since athletic
22. “Same freshman dorm” always implies same class.23. Here we multiplied the three relevant effects from person 1 is an athlete,
person 2 is an athlete, and the interaction term to get the total effect.
101HOW DO FRIENDSHIPS FORM?

status, Greek status, and majors are all determined endoge-nously, we offer these as descriptive statistics rather than causaleffects. Furthermore, we do not know whether athletes are talk-ing mostly to individuals on their same team or to athletes onother teams. And Greek members may simply be interacting agreat deal with members of their own organization and not withmembers of other organizations.
In the next rows we ask whether differences in academicability reduce the amount of social interaction. We take combinedSAT score (math plus verbal) as a measure of pretreatment aca-demic ability. We look at the effect of the absolute difference inSAT score between person 1 and person 2, controlling for the SATscore for both students. Differences in SAT scores do reduce theamount of interaction between the pair, but the effect is modest insize. A 200 point difference in SATs results in a 0.6 percentreduction in email volume. This effect is only statistically signifi-cant when person 1 is White. The effect is statistically insignifi-cant when person 1 is Black, Asian, or Hispanic. We tried manyalternative specifications such as creating dummies for person 1and person 2’s quartiles of SAT and running the fully interactedspecification. We found no evidence that a particular combinationof SAT scores stimulated or hindered social interaction amongstudents.
We also examine the effects of family background usingdummy variables for three different characteristics. We knowwhether each student is on financial aid, whether they attendedone of New York’s specialized (exam) high schools (Stuyvesant,Bronx Science, Brooklyn Tech, Hunter College High), andwhether they attended one of the elite private high schools that isamong the major feeder schools to Dartmouth. Student pairs whoboth went to a NY exam school exchange 9� as many emails asstudent pairs in the base category. The effect of both studentsattending an elite private school is smaller and not statisticallysignificant.
Some of the large effect on both students attending NY spe-cialized high schools probably stems from the students in the pairknowing each other before enrolling at Dartmouth. If true, thiswould be consistent with our model of friendship formation inwhich once a social connection is established, people derive utilityfrom interacting with the same person over and over again.
If one of the students in the pair is a financial aid recipient andnot the other, the number of emails is reduced by 20 percent, relative
102 QUARTERLY JOURNAL OF ECONOMICS

to the base category of nonaid–nonaid. If both students receivefinancial aid, then the amount of interaction is roughly equal to thebase category. These results are from column (2) which uses pairswhere person 1 is White. When person 1 is Black, Asian, or Hispanic(columns (3)–(5)), no clear pattern emerges from the effects of finan-cial aid status on the level of interaction.
The final rows of Table VI address whether having a Blackdormmate or roommate affects my interracial interactions withBlack students outside my dorm. For pairs in which person 1 isWhite, we include dummy for person 1 having a Black freshmanroommate and the percent Black in 1’s freshman dorm. We theninteract these characteristics for person 1 with a dummy forwhether person 2 is Black. Having a Black roommate or a highpercentage Black in one’s dorm has no statistically significanteffect on a White student’s volume of interactions with Blackstudents in general.24 This is consistent with the student levelanalysis we showed in Table V.
A separate question is whether or not minority studentsbecome socially isolated if they are grouped together in the samefreshman rooms or dorms. In results not reported here we findthat for Black students, having a Black roommate or increasedpercent Black in one’s dorm does not increase the volume ofinteractions with other Black students outside of one’s dorm.
Columns (3)–(5) limit the sample to pairs in which person 1is Black, Asian, and Hispanic, respectively. In general, many ofthe key results from column (2) remain. For example, there is alarge same freshman dorm effect that increases the number ofemails sent by a factor of between 3.5 and 5. The same dorm effectis largest for pairs in which person 1 is Asian. There is a large andpositive same race effect for Black students. In column (3) whereperson 1 is Black, the coefficient on person 2 being Black is 2.816which means that email volume is increased by a factor of 16.7.This same race effect is much larger than the same race attrac-tion experienced by other groups.
In column (6) we switch the dependent variable to a dummyvariable for person 1 having sent and received at least one emailfrom person 2. The mean of this dummy is .007 meaning that .7percent of pairs are in active email communication (“talking”). Welimit the sample to pairs in which person 1 is White. We run a
24. There is still of course the direct effect that being close to any student ofany race makes one more likely to interact with that particular student.
103HOW DO FRIENDSHIPS FORM?

probit regression and report partial derivatives. We find resultsthat are qualitatively similar to the Poisson regression in column(2). Being in the same freshman dorm raises the probability oftalking by 1.3 percent which indicates that the same dorm effectincreases the probability of talking by a factor of 2.9. The inter-actions between “same dorm” and person 2’s race are generallysmall indicating that the same dorm effect on talking is the samemagnitude both within and across races. White-Asian pairs havea slightly larger same dorm effect than White-White pairs whileWhite-Black pairs have a slightly smaller effect. There are stilllarge and statistically significant level effects from person 2’srace. For White-Black pairs, the likelihood of talking falls by .2percent relative to White-White pairs.
In Table VII we investigate more closely the effect of distanceand how this effect changes from freshman to senior year. Welimit the sample to pairs in which person 1 is White. To measuregeographic distance in more detail, we include dummies for samefreshman year room, floor (hallway), dorm, and cluster of dorms.At Dartmouth, a cluster of dorms is a collection of 2–4 buildingsthat are connected by common rooms, porches, or outdoor breeze-ways. We also include the physical distance between the fresh-man year rooms of person 1 and person 2, measured in thousandsof feet. We include all the same student characteristics used inTable VI (race, gender, graduating class, fraternity membership,etc.) but only report coefficients on the distance measures.
Sharing the same freshman year dorm (but not the samehallway) doubles the number of emails sent (column (1)) andincreases the probability of talking by .3 percent (column (2)).Sharing the same floor delivers a 2.3� effect over and above the2.0� effect from being in the same dorm. Being in the same roomadds an additional effect of 3.1�. This means that freshman yearroommates share 14.3 times as many emails relative to tworandomly chosen classmates who are not from the same freshmandorm.25
Being in the same cluster has no additional effect, nor doesthe linear measure of distance. This means that proximity onlyhas a significant effect at very close distances. We show belowthat this fact limits the degree to which proximity can be used bypolicy-makers to create shifts in the overall amount intergroup
25. The regression controls for but does not report the effect from the twostudents being in the same class.
104 QUARTERLY JOURNAL OF ECONOMICS

interaction that occurs. This result is confirmed in Figure I inwhich we graph the average volume of email exchanged amongpairs against their residential distances freshman year. Distanceis quite important but only at close distances.
In columns (3) and (4) we run the Poisson regression sepa-rately for freshmen and seniors. As one would expect, the fresh-
TABLE VIITHE EFFECT OF DISTANCE ON THE AMOUNT OF INTERACTION AND HOW THE EFFECTS
OF DISTANCE DEGRADE WITH TIME
Sample is limited to pairs in which person 1 is White. The dependent variablesare the total volume exchanged between person 1 and person 2 during September2002–July 2003 and a dummy for “has sent and received 1 or more emails.”Columns (1), (3), and (4) are Poisson regressions. Standard errors use clustering atthe person 1 level. The number in square brackets [ ] is e�coefficient. This is themultiplicative effect on the predicted number of emails for a one unit change in theright-hand-side variable. Column (2) is a probit, and partial derivatives are shown.Column (3) is for freshmen, and (4) is for seniors. The point here is to see thedegree to which the effects of freshman year distance degrade over time.
Regressions also control for (but suppress coefficients for) all Xs in the previoustable include race, financial aid, athletic, fraternity status, same graduating class,etc.
(1) (2) (3) (4)
Totalvolume
(Person 1is White)
Sent atleast 1email
(Person 1 isWhite)
Totalvolume
(Person 1 isa freshmanand White)
Total volume(Person 1 is a
senior andWhite)
Same room 1.134 0.034 1.857 0.971(0.160)** (0.005)** (0.312)** (0.286)**
[3.108] [6.404] [2.641]Same freshman 0.838 0.011 1.649 0.379
year floor (0.217)** (0.001)** (0.375)** (0.375)[2.312] [5.202] [1.461]
Same freshman 0.661 0.003 0.289 0.925year dorm (0.225)** (0.001)** (0.336) (0.408)*
[1.937] [1.335] [2.522]Same freshman 0.237 0.001 0.308 0.471
year cluster of dorms (0.165) (0.000)** (0.403) (0.316)[1.267] [1.361] [1.602]
Freshman year �0.088 0.000 �0.070 0.037residential distance (0.049) 0.000 (0.107) (0.072)in thousands of feet [0.916] [0.932] [1.038]
Observations 2,923,120 2,923,120 230,920 1,094,550
Robust standard errors are in parentheses.* Significant at 5 percent; ** significant at 1 percent.
105HOW DO FRIENDSHIPS FORM?

men show larger effects from freshman year housing distance. Intheir first year, freshman roommates are exchanging 44.6 timesmore emails than two freshmen not in the same dorm. But inter-estingly, the effects of freshman housing are still strong threeyears later. As seniors, former freshman roommates are exchang-ing 9.8 times more emails than two randomly chosen seniors.
This is consistent with our proposed model of friendship inwhich chance meetings lead to long-term bonds between twopeople. At the time of enrollment, a student’s list of Dartmouthsocial connections is a mostly blank slate. Dartmouth randomlycreates a social network by housing freshman together, and thisnetwork shows a great deal of persistence. In results not shownhere, we find that following graduation, former freshmen room-mates and dormmates continue to be much more likely to emaileach other than randomly chosen classmates.
Furthermore, given the panel nature of the data, we are ableto observe the volume of interaction between a pair of studentsduring months when they are both on campus and months where
FIGURE IAverage Volume of Email Sent at Each Distance
The data consist of all pairs of students who entered Dartmouth in the sameyear. Distance refers to the distance between the two students’ freshman rooms.Physical distance is grouped into 22 categories, and we take the average volume(including zeroes) across all pairs within a distance category.
106 QUARTERLY JOURNAL OF ECONOMICS
one of the students is off campus. We find that email volumes aresignificantly higher when both students are on campus and henceable to interact face to face as well as through email. Our pre-ferred interpretation of this fact is that email is a complement toface-to-face interaction. Students can use email to set up face-to-face interaction, or perhaps they get more utility from exchangingemails with someone with whom they have just seen or will seeshortly.
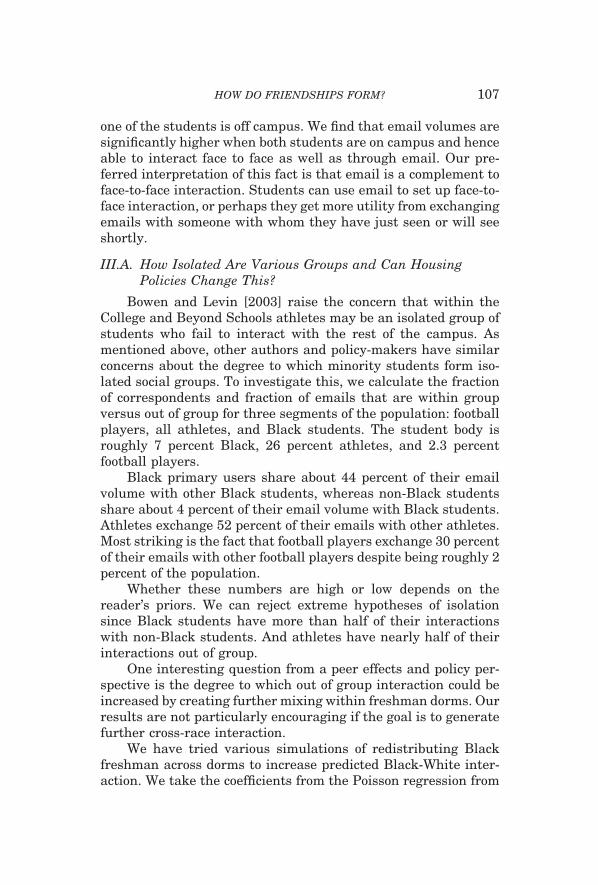
III.A. How Isolated Are Various Groups and Can HousingPolicies Change This?
Bowen and Levin [2003] raise the concern that within theCollege and Beyond Schools athletes may be an isolated group ofstudents who fail to interact with the rest of the campus. Asmentioned above, other authors and policy-makers have similarconcerns about the degree to which minority students form iso-lated social groups. To investigate this, we calculate the fractionof correspondents and fraction of emails that are within groupversus out of group for three segments of the population: footballplayers, all athletes, and Black students. The student body isroughly 7 percent Black, 26 percent athletes, and 2.3 percentfootball players.
Black primary users share about 44 percent of their emailvolume with other Black students, whereas non-Black studentsshare about 4 percent of their email volume with Black students.Athletes exchange 52 percent of their emails with other athletes.Most striking is the fact that football players exchange 30 percentof their emails with other football players despite being roughly 2percent of the population.
Whether these numbers are high or low depends on thereader’s priors. We can reject extreme hypotheses of isolationsince Black students have more than half of their interactionswith non-Black students. And athletes have nearly half of theirinteractions out of group.
One interesting question from a peer effects and policy per-spective is the degree to which out of group interaction could beincreased by creating further mixing within freshman dorms. Ourresults are not particularly encouraging if the goal is to generatefurther cross-race interaction.
We have tried various simulations of redistributing Blackfreshman across dorms to increase predicted Black-White inter-action. We take the coefficients from the Poisson regression from
107HOW DO FRIENDSHIPS FORM?

Table VI column (2). We reassign Black freshmen across dorms todeliver a uniform percent Black in each dorm, for a given classyear. This is a meaningful exercise because the actual randomassignment to groups of 30 to 50 yielded some dorms with as fewas zero or as many as six Black students rather than the roughlythree of a perfectly even distribution. Across the entire campusafter reassigning the Black students’ housing, we predict anadditional 146 emails between White-Black pairs as comparedwith the current White-Black total volume of 16,800 messages.This indicates that each White student would exchange an addi-tional .16 emails with Black students, or a less than 1 percentincrease on the mean of 18–19 emails currently exchanged duringthe sample period.
The intuition for this finding is as follows: we found in TablesIV and VI that placing two freshmen in the same dorm increasestheir email volume by a factor of 3 or 4. However, in the case ofWhite-Black interactions, that increase is from a low base of .2emails. If we could give each White freshman an additional Blackdormmate (say from an all Black dorm if one existed), she wouldexperience the increase of .4 emails to that Black student shownin Table IV. But since we are redistributing the Black students,rather than creating a net increase, we get much less than the .4effect.
An opposite policy experiment to consider would be completesegregation of the Black freshmen. For the average White stu-dent, this would be a loss of about 3 Black dormmates and wouldresult in a reduction of 3 � .4 � 1.2 emails exchanged with Blackstudents. This is again modest relative to the current average ofnineteen emails. Proximity has a strong positive effect, but only 3percent of pairs in the sample share the same freshman dorm andclass. On average, only about 9 percent or so of Black-Whiteemails take place within one’s freshman dorm group.
In contrast, changing the entire class’s composition wouldhave a large effect on my social interactions. A student interacts5–7 times more with a student from her own class than with astudent from a different class. When we add another minoritystudent or high SAT student into a class, every student of 1050 inthe class experiences a large jump in expected interactions withthat student. Adding two Black students to the class would gen-erate another 1.4 emails with Black students for every Whitestudent. Thus, the negative effects of subtracting two Black stu-dents might have a greater effect on total Black-White interac-
108 QUARTERLY JOURNAL OF ECONOMICS

tions than the negative effect of complete housing segregationdiscussed above.
III.B. Does A “Group Means” Model ApproximateSocial Networks?
As discussed above, most peer effects studies assume that anagent is affected by the mean characteristic or outcome of theother individuals in the group. Studies of peer effects in primaryschool often take the classroom as the relevant group and uni-versity level studies may take the cohort-major cell or the fresh-man dormitory as the relevant group. Here we have the opportu-nity to ask how much students actually interact with the otherstudents assigned to their group. We then calculate mean SATscores and Dartmouth GPAs for each student’s dorm group andfor their actual peer group campus wide as demonstrated bywhom they email. We show the correlation between mean testscores (and GPA) for the “actual” group and their freshman dormgroup.
For the freshmen (class of 2006) about 19 percent of totalemails are exchanged with members of their freshman dorm. Thesophomores exchange 16 percent of total emails with classmatesfrom their freshman dorm, and this percentage falls to 8 percentfor the seniors. If instead of weighting by email volume (as above)we ask what fraction of correspondents come from one’s freshmandorm, we get roughly the same answer.
Perhaps the more relevant question for peer effects researchis how correlated “actual” peer ability is with constructed groupability when groups are formed by the econometrician aroundfreshman hallway assignments. To address this, we calculate foreach student average peer SAT scores (and GPA) in four ways.First, we weight peer SATs (GPA) by the volume of email ex-changed with that peer. If zero emails are exchanged, the peerobservation is given zero weight. Second, we calculate mean peerSATs using the simple average over all other students on one’sfreshman hallway, excluding own observation. Third, we calcu-late the mean within one’s hallway and race cell. Finally, wecalculate mean peer SAT weighting by the predicted email vol-ume with that peer. We predict volume using the set of regres-sions in Table VI which include all student characteristics forboth students in a pair. This last measure is intended to be anextreme (though unrealistic) upper bound on what a researcher
109HOW DO FRIENDSHIPS FORM?

could predict about peer ability given all of the right-hand-sidevariables.
The hallway mean SAT score is relatively uncorrelated withthe actual (emails) weighted mean. The correlation is .03. How-ever, the dorm-race mean has a correlation of .29 with the actualweighted mean. The prediction weighted mean of peer SATs hasa correlation of .42 with the actual weighted mean.
The message is that race matters in the formation of peergroups. Even among a relatively homogeneous group of collegestudents (relative to the set of all U. S. college students), raceplays a large role in determining social interactions. If research-ers are seeking to form the most realistic peer groups, one speci-fication to include is one in which peer groups condition on race.Conditioning on all the other right-hand-side variables (gender,fraternity membership, financial aid, status, etc.) AND weightingthese variables by the regression coefficients raises the correla-tion from .29 to .42.
We find a similar message when we examine peer DartmouthGPAs rather than peer SATs. Mean GPA of freshman hallwaygroup has a .08 correlation with actual weighted GPA. Mean GPAfor the dorm-race cell has a correlation of .23 with actualweighted GPA.
In Figure II we examine what fraction of Black students’emails are exchanged with peers in various deciles of the SATdistribution. The horizontal axis shows the decile of the Dart-mouth SAT distribution. The “Actual” line shows that roughly 26percent of emails were exchanged with students in the first decile.The relatively flat line (“Geography”) shows that an equal fractionof emails would fall in each decile if the students’ interactionswere based purely on geography (freshman dorm and room loca-tion). We simulated this distribution by predicting emails forevery pair of students using a Poisson regression which includedonly the geographic variables on the right-hand side. We thencalculated what fraction of predicted emails fell in each decile.
The “Race and Geography” line shows what happens whenBlack students interact based on geography and race. These arecalculated from predicted number of emails where we predictusing a Poisson regression of emails on the race dummies forperson 2, geographic variables, and the interactions of race andsame dorm. Here we see that the addition of the race informationyields a predicted SAT distribution that is close to the actualdistribution. When we predict using all the right-hand-side vari-
110 QUARTERLY JOURNAL OF ECONOMICS

ables, the predicted line lies almost directly on top of the actualline (not shown).
III.C. How Much Does Using a Better Peer Group Proxy AffectEstimated Peer Effects?
Finally, we ask how much measured peer effects change if weswitch from a dorm mean to a mean that weights based by thelevel of interaction (emails). In Table VIII we run linear proba-bility models of own decision to join a fraternity or a sorority onthe peer average decision. We focus on this outcome rather thanon an academic outcome like GPA because previous work (e.g.,Sacerdote [2001], Zimmerman [2003], Duncan et al. [2003b], andFoster [2004]) indicates that peer effects in social outcomes arelarger and more robust than peer effects in academic outcomes.
FIGURE IIActual and Hypothetical SAT Distribution of Black Students’ Peers Weighting
by the Level of Interaction between Each Student and Her PeersThis shows the fraction of Black students’ emails that are exchanged with
students in each decile of the Dartmouth SAT distribution. The line labeled actualshows the true distribution. The flat line labeled “geography” shows what thedistribution would look like if students used only freshman year location (geog-raphy) to determine their peer group. This uses predicted email volumes from aPoisson regression of email volumes on all of the geographic variables. The “raceand geography” line shows the distribution that results if students use both therace and geography to determine their peer group. If we predict email volumesusing all Xs for each student in the pair (not shown on the graph), we get a peerSAT distribution that matches the Actual line almost exactly.
111HOW DO FRIENDSHIPS FORM?

TABLE VIIIPEER EFFECTS IN FRATERNITY MEMBERSHIP
We estimate peer effects in the decision to join a Greek organization usingfour different specifications. In column (1) we run own decision on the averageof the dormmates’ decision as in Sacerdote [2001]. In column (2) we use theaverage decision of all peers where we weight the peer outcome by the amountof email volume exchanged with that peer. In column (3) we follow Foster[2003] by instrumenting for the dorm mean of fraternity membership usingaverage characteristics of randomly assigned dormmates. Instruments aredormmate means of the following variables: combined SAT score, Academicindex, NY exam school status, Prep school status, and Financial aid status.First-stage regressions are shown in Appendix 2. In column (4) we use thesame set of instruments to instrument for the email weighted peer average offraternity membership.
(1) (2) (3) (4)Greek
member(OLS)
Greekmember(OLS)
Greekmember
(IV)
Greekmember
(IV)
Freshman dorm mean of “Greek” 0.711 0.505(0.069)** (0.196)*
Email weighted peer mean of 0.990 0.771“Greek” (0.037)** (0.294)**
Student is Black �0.059 0.036 �0.064 0.012(0.071) (0.058) (0.071) (0.068)
Student is Asian �0.005 0.047 �0.011 0.031(0.040) (0.033) (0.041) (0.040)
Student is Hispanic 0.052 0.068 0.051 0.064(0.059) (0.049) (0.060) (0.050)
Student is other non-White �0.038 �0.032 �0.037 �0.032(0.096) (0.079) (0.096) (0.080)
Varsity athlete (0–1) 0.092 0.024 0.097 0.044(0.033)** (0.027) (0.033)** (0.037)
Sat Score (math � verbal) �0.000 �0.000 �0.000 �0.000(0.000)* (0.000) (0.000)* (0.000)
Male 0.023 0.038 0.020 0.032(0.027) (0.023) (0.028) (0.024)
Went to NYC exam school 0.043 0.009 0.042 0.015(0.081) (0.067) (0.081) (0.068)
Went to fancy prep school 0.101 0.041 0.111 0.062(0.061) (0.051) (0.062) (0.059)
Receives financial aid (0–1) �0.136 �0.063 �0.140 �0.083(0.028)** (0.023)** (0.028)** (0.035)*
Constant 0.704 0.213 0.803 0.393(0.232)** (0.192) (0.249)** (0.315)
Observations 1233 1233 1233 1233R2 0.122 0.399 0.115 0.382
Standard errors are in parentheses.* Significant at 5 percent; ** significant at 1 percent.
112 QUARTERLY JOURNAL OF ECONOMICS

In column (1) we regress a student’s decision to join a frater-nity on the dorm mean for the same outcome and find a coefficientof .71, with a t-statistic of 10.3. If we instead weight the peermean outcome by emails exchanged between the student and theother students on campus, the peer effect coefficient increases to1.0 (column (2)).
This latter coefficient is of course biased by the fact thatstudents sort into their peer groups, and we are not taking ad-vantage of the randomized assignment of freshman housing. As apartial solution, we follow Foster [2003] and instrument for thepeer average of fraternity status using the average backgroundcharacteristics for the randomly assigned peers in a student’sfreshman hallway group. Our instruments for peer group meanoutcomes are the dorm averages of SAT scores, academic index,New York exam high school attendance, prep school attendance,and financial aid status. The first-stage regressions are shown inAppendix 2. In column (1) of Appendix 2 the dependent variableis the dorm average fraternity status, and the instruments pre-dict this outcome with an F statistic of 13.0. In column (2) thedependent variable is the email weighted average of fraternitystatus, and the F statistic is 7.4.
In Table VIII column (3) we regress own fraternity status onthe hallway mean of fraternity status where the instruments arethe hallway mean background characteristics described above.The peer effect coefficient is .51 and is statistically significant. Incolumn (4) we regress own outcome of fraternity status on peeraverage outcome, where the peer outcome is weighted by emailvolumes. We again instrument for peer outcomes using hallwayaverage characteristics. Using our emails to define peer groups,we find a peer effect that is 50 percent larger than that foundusing hallways to define peer groups. However, given the lack ofprecision, we cannot reject that the peer effects coefficients incolumns (3) and (4) are equal.
The message from this exercise is a fairly intuitive one:conventional peer effects estimates may understate the total peerinfluences experienced by an individual because researchersrarely know the true peer group and must therefore form peergroups based on observables like classroom, or dorm assignmentor neighborhood. In our case, the estimated effect increases byabout 50 percent when we use email volumes to first determinewho is interacting with whom before we estimate the peer effect.
113HOW DO FRIENDSHIPS FORM?

IV. CONCLUSION
We find that geographic closeness, racial similarity, familybackground, and common interests like academic majors, Greekorganizations, and varsity athletics all have positive effects onthe likelihood that two students interact. Cross-race interactionsare much less likely than within-race interactions. Two Whitestudents in the same class have about a 2 percent chance ofinteracting whereas a White and a Black student in the sameclass have a .8 percent chance of interacting. Placing either ofthese pairs in the same dorm multiplies the likelihood of inter-action by a factor of 3. Expressed in terms of email volume,randomly chosen White-White pairs send each other about .7emails versus .2 emails for White-Black pairs. Putting either pairin the same dorm raises the volume of email between the two bya factor of 3 or 4.
There does not appear to be any extended network effect inwhich having a Black roommate increases a White student’sinteraction with other Black students outside of her room, hall-way, or dorm. When we simulate different housing policies, itbecomes clear that it is difficult to create meaningful amounts ofadditional interracial interaction simply by moving studentsaround. This is in part because the proximity effect is relevant forvery small distances, so it is impossible to make a given studentcloser to large numbers of other students. The vast majority of astudent’s interracial interactions take place outside her freshmandorm group simply because only 1 percent of other students oncampus share her same freshman dorm.
In contrast, the effects of being in the same entering class onthe amount of interaction are also large in magnitude and operateon a much larger group (roughly 1050 students). Thus, changes inthe racial or SAT makeup of my class could have a large effect onthe characteristics of my peer group. Within the context of thisstudy, differences in ability across students do not create a sizablebarrier to interaction. A low SAT scoring student is almost aslikely to interact with his classmates and dormmates as any otherstudent.
These facts help explain why colleges and universities go togreat lengths to manage the composition (racial, geographic, ath-letic) of each incoming freshman class. Adding a few more inter-national students to a class can have a large effect on the likeli-
114 QUARTERLY JOURNAL OF ECONOMICS
hood that the modal student in that class interacts with one ofthese international students.
We asked whether a linear in means approach is a goodapproximation to constructing a student’s true peer group. Wefind that the mean ability (SAT or GPA) of one’s hallmates is onlymodestly correlated with the mean ability of one’s correspondentsas weighted by email volume. However, if we use the hallway-race cell, we get a much stronger correlation between the groupmean and the mean ability of actual peers as identified throughemail exchanges.
Overall, the study indicates that small differences in locationcan have large impacts in the amount that the two people inter-act. We posit that this is because small distance costs matterwhen the other person and hence the benefit of the interaction isunknown. Race appears to be a real barrier to interaction, but thepositive effects of proximity on interaction can offset the negativeeffects of two people being from a different race.
Proximity, race, family background, and interests all deter-mine who interacts with whom. And these interactions blossominto friendships which can have a profound influence on our lives,our career choices, and perhaps our preferences.
115HOW DO FRIENDSHIPS FORM?
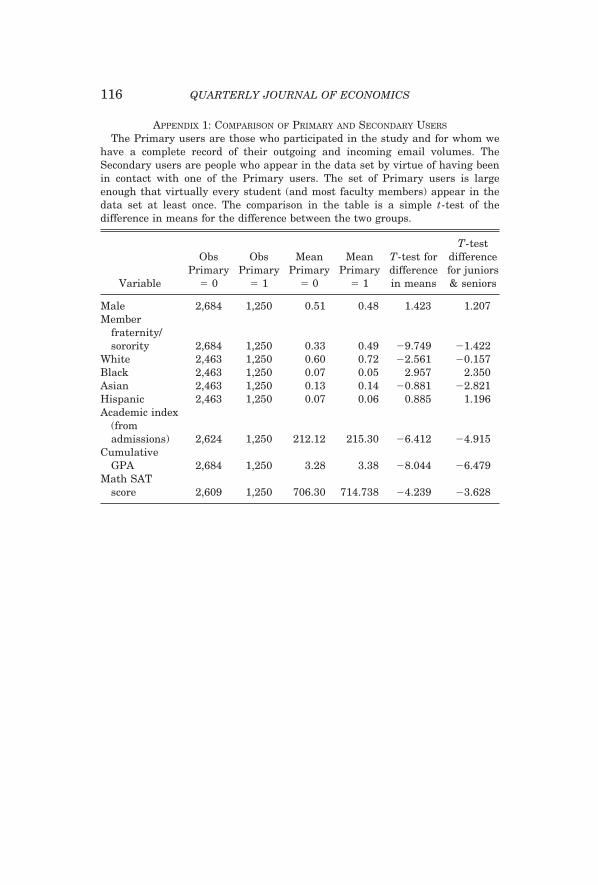
APPENDIX 1: COMPARISON OF PRIMARY AND SECONDARY USERS
The Primary users are those who participated in the study and for whom wehave a complete record of their outgoing and incoming email volumes. TheSecondary users are people who appear in the data set by virtue of having beenin contact with one of the Primary users. The set of Primary users is largeenough that virtually every student (and most faculty members) appear in thedata set at least once. The comparison in the table is a simple t-test of thedifference in means for the difference between the two groups.
Variable
ObsPrimary
� 0
ObsPrimary
� 1
MeanPrimary
� 0
MeanPrimary
� 1
T-test fordifferencein means
T-testdifferencefor juniors& seniors
Male 2,684 1,250 0.51 0.48 1.423 1.207Member
fraternity/sorority 2,684 1,250 0.33 0.49 �9.749 �1.422
White 2,463 1,250 0.60 0.72 �2.561 �0.157Black 2,463 1,250 0.07 0.05 2.957 2.350Asian 2,463 1,250 0.13 0.14 �0.881 �2.821Hispanic 2,463 1,250 0.07 0.06 0.885 1.196Academic index
(fromadmissions) 2,624 1,250 212.12 215.30 �6.412 �4.915
CumulativeGPA 2,684 1,250 3.28 3.38 �8.044 �6.479
Math SATscore 2,609 1,250 706.30 714.738 �4.239 �3.628
116 QUARTERLY JOURNAL OF ECONOMICS

DARTMOUTH COLLEGE
APPENDIX 2: FIRST-STAGE REGRESSIONS FOR TABLE VIIITable VIII columns (3) and (4) use average background characteristics of
randomly assigned dormmates to instrument for the freshman dorm mean offraternity status (“Greek”) and the peer mean of fraternity status where thepeer average is weighted by email volumes.
(1) (2)Freshmandorm meanof “Greek”
Peer mean of“Greek” using emailvolumes as weights
Dorm average SATs 0.002 0.001(0.000)** (0.001)
Dorm average academic index �0.014 �0.006(0.003)** (0.005)
Dorm average of NYC exam school status �0.617 �0.640(0.194)** (0.319)*
Dorm average for prep school status �0.810 �0.005(0.129)** (0.212)
Dorm average for financial aid status �0.601 �0.302(0.057)** (0.094)**
Black (0–1) �0.009 �0.111(0.028) (0.045)*
Asian (0–1) �0.026 �0.071(0.016) (0.026)**
Hispanic (0–1) �0.003 �0.019(0.023) (0.038)
Other non-White (0–1) �0.011 �0.013(0.037) (0.061)
Varsity athlete (0–1) 0.016 0.079(0.013) (0.021)**
Combined SAT score 0.000 �0.000(0.000) (0.000)*
Male (0–1) �0.012 �0.022(0.011) (0.017)
Went to NYC exam school (0–1) �0.005 0.033(0.031) (0.052)
Went to fancy prep school (0–1) 0.035 0.093(0.024) (0.039)*
Financial aid status (0–1) �0.011 �0.081(0.011) (0.018)**
Constant 1.780 1.131(0.371)** (0.610)
Observations 1233 1233R2 0.138 0.083F(15, 1217) � 13.02 7.37
Standard errors are in parentheses.* Significant at 5 percent; ** significant at 1 percent.
117HOW DO FRIENDSHIPS FORM?

REFERENCES
Abu-Ghazzeh, Tawfiq M., “Housing Layout, Social Interaction, and the Place ofContact in Abu-Nuseir, Jordan,” Journal of Environmental Psychology, XIX(1999), 41–73.
Alesina, Alberto, Reza Baqir, and Caroline M. Hoxby, “Political Jurisdictions inHeterogeneous Communities,” Journal of Political Economy, CXII (2004),348–396.
Amicus Brief of Harvard University, Brown University, University of Chicago,Dartmouth College, Duke University, the University of Pennsylvania, Prince-ton University, and Yale University, Case Numbers 02-241 and 02-516,Barbara Grutter v. Lee Bollinger, et al., Supreme Court of the United States,2003.
Arcidiacono, Peter, Gigi Foster, and Joshua Kinsler, “Estimating Spillovers in theClassroom with Panel Data,” mimeo, Duke University, 2004.
Betts, Julian R., and Andrew Zau, “Peer Groups and Academic Achievement:Panel Evidence from Administrative Data,” Working Paper from Universityof California, San Diego and Public Policy Institute of California, 2004.
Blau, Peter Michael, Exchange and Power in Social Life (New York: Wiley, 1964).Bowen, William G., and Derek Bok, The Shape Of The River: Long-Term Conse-
quences Of Considering Race In College And University Admissions (Prince-ton, NJ: Princeton University Press, 1998).
Bowen, William G., and Sarah A. Levin, Reclaiming The Game: College SportsAnd Educational Values (Princeton, NJ: Princeton University Press, 2003).
Case, Anne C., and Lawrence F. Katz, “The Company You Keep: The Effect ofFamily and Neighborhood on Disadvantaged Youths,” National Bureau ofEconomic Research Working Paper No. 3705, 1991.
Duncan, Greg, Johanne Boisjoly, Michael Kremer, Daniel Levy, and JacquelynneS. Eccles, “Empathy or Antipathy? The Consequences of Racially and SociallyDiverse Peers on Attitudes and Behaviors,” Joint Center for Poverty ResearchWorking Paper No. 326, February 2003a.
Duncan, Greg, Johanne Boisjoly, Michael Kremer, Daniel Levy, and JacquelynneS. Eccles, “Peer Effects in Binge Drinking among College Students,” mimeo,Northwestern University, December 2003b.
Epstein, Richard, “A Rational Basis for Affirmative Action: A Shaky But ClassicalLiberal Defense,” Michigan Law Review, C (2002), 2036–2053.
Evans, William N., Wallace E. Oates, and Robert M. Schwab, “Measuring PeerGroup Effects: A Study of Teenage Behavior,” Journal of Political Economy,C (1992), 966–991.
Falk, Armin, and Michael Kosfield, “It’s All about Connections: Evidence onNetwork Formation,” mimeo, University of Zurich, 2003.
Festinger, Leon, Stanley Schachter, and Kurt Back, Social Pressures In InformalGroups: A Study Of Human Factors In Housing (Stanford, CA: StanfordUniversity Press, 1963).
Foster, Jennifer, “Peerless Performers,” mimeo, University of South Australia,2003.
——, “It’s Not Your Peers, and It’s Not Your Friends: Some Progress towardUnderstanding the Educational Peer Effect Mechanism,” mimeo, Universityof South Australia, 2004.
Gaspar, Jess, and Edward Glaeser, “Information Technology and the Future ofCities,” Journal of Urban Economics, XLIII (1998), 136–156.
Glaeser, Edward, and Bruce Sacerdote, “The Social Consequences of Housing,”Journal of Housing Economics, IX (2000), 1–23.
Graham, Bryan S., “Essays on the Econometrics of Social Interactions throughExcess Variance Contrasts,” Ph.D. thesis, Harvard University, 2005.
Graham, Bryan S., and Jinyong Hahn, “Identification and Estimation of theLinear-in-Means Model of Social Interactions,” Economics Letters, LXXXVIII(2005), 1–6.
Harris, Judith Rich, The Nurture Assumption: Why Children Turn out the WayThey Do (New York, NY: The Free Press, 1998).
Hills, Lindsay Marie, “A Thin Line between Red and Green: Emerging Patterns in
118 QUARTERLY JOURNAL OF ECONOMICS

Group Preference an Exploration at Bryn Mawr College,” Bryn Mawr SeniorThesis, 2003.
Holahan, C. J., B. L. Wilcox, and M. A. Burnam, “Social Satisfaction and Friend-ship Formation as a Function of Floor Level in High-Rise Student Housing,”Journal of Applied Psychology, LXIII (1978), 527–529.
Hoxby, Caroline M., “Peer Effects in the Classroom: Learning from Gender andRace Variation,” National Bureau of Economic Research Working Paper No.7866, 2000a.
——, “Does Competition among Public Schools Benefit Students and Taxpayers?”American Economic Review, XL (2000b), 1209–1238.
Manski, Charles F., “Identification of Endogenous Social Effects: The ReflectionProblem,” Review of Economic Studies, LX (1993), 531–542.
Marmaros, David, and Bruce Sacerdote, “Peer Effects in Occupational Choice,”European Economic Review, XLVI (2002), 870–879.
Rainio, K., “A Study of Sociometric Group Structure: An Application of a Stochas-tic Theory of Social Interaction,” in J. Berger, M. Zelditch, and B. Anderson,Sociological Theories in Progress, Vol. 1 (Boston, MA: Houghton Mifflin,1966).
Reid, Stuart A., “Students Question True Diversity of Campus,” The Dartmouth,CLXII (February 4, 2005), 1.
Richards, Phillip, “Prestigious Colleges Ignore the Inadequate IntellectualAchievement of Black Students,” The Chronicle of Higher Education, XLIX(September 13, 2002), B11.
Richeson, Jennifer A., Abigail A. Baird, Heather L. Gordon, Todd F. Heatherton,Carrie L. Wyland, Sophie Trawalter, and J. Nicole Shelton, “An Fmri Inves-tigation of the Impact of Interracial Contact on Executive Function,” NatureNeuroscience, VI (2003), 1323–1328.
Sacerdote, Bruce I., “Peer Effects with Random Assignment,” Quarterly Journal ofEconomics, CXVI (2001), 681–704.
Schapiro, Amy, “Unlocking Emory’s Racial Segregation,” The Emory Wheel,LXXXV (April 4, 2003).
Stinebrickner, Todd, and Ralph Stinebrickner, “What Can Be Learned about PeerEffects Using College Roommates? Evidence from New Survey Data andStudents From Disadvantaged Backgrounds,” mimeo, 2004.
Tuma, Nancy B., and Maureen T. Hallinan, “The Effects of Sex, Race and Achieve-ment on Schoolchildren’s Friendships,” Social Forces, LVII (1979),1265–1285.
Waller, Willard, The Family: A Dynamic Interpretation (New York, NY: Dryden,1938).
Winston, Gordon C., “Subsidies, Hierarchy and Peers: The Awkward Economics ofHigher Education,” Journal of Economic Perspectives, XIII (1999), 13–36.
Zimmerman, David J., “Peer Effects in Academic Outcomes: Evidence from aNatural Experiment,” Review of Economics and Statistics, LXXXV (2003),9–23.
119HOW DO FRIENDSHIPS FORM?