Embed Size (px)
Citation preview
Katharina Santos das Dores Licenciada em Biologia
How do cancer cells cope with supernumerary centrosomes?
Dissertação para obtenção do Grau de Mestre em
Bioquímica para a Saúde
Orientador: Doutora Gaëlle Marteil, Instituto Gulbenkian de Ciência Co-orientador: Doutora Mónica Bettencourt-Dias Instituto Gulbenkian de Ciência
Novembro de 2015
Katharina Santos das Dores Licenciada em Biologia
How do cancer cells cope with supernumerary centrosomes?
Dissertação para obtenção do Grau de Mestre em
Bioquímica para a Saúde
Orientador: Doutora Gaëlle Marteil, Instituto Gulbenkian de Ciência Co-orientador: Doutora Mónica Bettencourt-Dias, Instituto Gulbenkian de Ciência
Elo de Ligação: Prof. Doutora Maria Teresa Nunes Mangas Catarino, Faculdade de Ciência e Tecnologia, Universidade Nova de Lisboa
Júri:
Presidente: Prof. Doutora Maria Teresa Nunes Mangas Catarino Arguente: Doutora Elsa Clara Carvalho Logarinho Santos Vogal: Doutora Gaëlle Marteil
Faculdade de Ciências e Tecnologias da Universidade Nova de Lisboa
Novembro 2015
iii
“How do cancer cells cope with supernumerary centrosomes?”
Copyright Katharina Santos das Dores, FCT/UNL, UNL
A Faculdade de Ciências e Tecnologia e a Universidade Nova de Lisboa têm o direito, perpétuo e
sem limites geográficos, de arquivar e publicar esta dissertação, a partir de Janeiro de 2018, através
de exemplares impressos reproduzidos em papel ou de forma digital, ou por qualquer outro meio
conhecido ou que venha a ser inventado, e de a divulgar através de repositórios científicos e de
admitir a sua cópia e distribuição com objetivos educacionais ou de investigação, não comerciais,
desde que seja dado crédito ao autor e editor.

v
Acknowledgements
First of all, I want to thank Dr. Mónica Bettencourt-Dias for accepting me in the group. Thank
you for your supervision, for the fruitful discussions, for helping me to grow and think as a scientist and
for advising me with decisions for my future.
Next I want to thank my co-supervisor Dr. Gaëlle Marteil for all the help and dedication. Thank
you for teaching me so many new and interesting things, for being my lab-mommy, for taking so much
time from your own work and private time for our discussions, for all the laughs. Thank you for your
motivation and your confidence in me in times when I didn’t have much. Thank you for being a friend!
I also want to thank my Master’s coordinator Professor Teresa Catarino for all the help she
provided. Thank you for your constant concern and for always answering timely to my “9000” e-mails.
A “thank you” to the whole team of the CCR Lab: for all your help, fruitful discussions and
good jokes. Especially to Paulo and Mariana, thanks for always helping with the little, but not less
important things. I also want to thank the UIC of the IGC, especially Nuno Pimpão, for teaching me
how to work with the microscopes and helping me out when the machines were against me.
Maria, my “special” BFF. It’s rare to find a person as crazy and silly as me and I’m so glad
that we found each other! Thank you for all the moments inside and outside the Lab, for always having
a nice thing to say: “Don’t get mad, get glad!”, for all the good laughs and all the good parties. Thank
you for all the discussions and for always being happy to help. Thank you for all your help with the flow
cytometry, without you this part of the project wouldn’t have been possible!
“Criança” Catarina, thank you for being such a good friend. We only met one year ago but we
get each other. Thank you for all the discussions, work and not-work related, and for all your help!
I also want to thank Ana Stankovic, for teaching me how to work with Illustrator (that changed
my figure-making life) and for being a good friend. Thank you for always being concerned and for
always having a fun comment for everything!
To my “other” friends at the IGC, Lindeza, Andreia and Ana Catarina, thank you for all the fun
lunches and for your company at the seminars. But thank you especially for the discussions, the big
laughs and for letting me vent. A big thank you, as well, to Mihailo (or Mihálo), my “Espanish” friend,
Sascha and Susana, for all the good laughs.
A huge thank you to my family, especially my parents and my sister (and Davidi): for always
believing in me and for all your support (on so many levels). Thank you for all the laughs and helping
me to forget the stress and problems for a little while. Thank you for your interest in my work, even
though you don’t understand most of what I do. Thank you for always being there, I love you guys!
I also want to thank my uncle, for making it possible to live so close to work for nine months of
my Master’s thesis. It was such a huge help!
I want to thank all of my long-time friends, Flávio, Sardinha, Daniela, Ana Hamma and all the
others that don’t fit on this page, for always being there and wanting to go out and do something.
Thanks Mestre, for all your musical distraction. Music makes my life more special! I also want to thank
my Bro Lipa. Even though we’re not together that often, it’s always as if it had been yesterday. And to
my “migas”, Leo and Ricardo: thank you for all the useful and silly talks, for the best Master’s year, for
the discussions about our thesis’ and our futures. Thank you for your constant moral support!
And last but not at all the least, I want to thank Nuno, the best (boy)friend one could wish for.
Thank you for being so near, even though you’ve been far most of this last year. Thank you for all your
honesty and your support. Thank you for being there all the time, lifting me up when I needed! Thank
you for all your patience and help reading and re-reading! Thank you for being part of my life and
making it more special!

vii
Resumo
O cancro é uma doença que mata uma em cada cinco pessoas por ano nas sociedades
ocidentais, motivando os médicos a procurarem novos métodos de diagnóstico, prognósticos e
terapêuticos para melhorar o tratamento de pacientes. Há mais de um século, Theodor Boveri sugeriu
que alterações numéricas no centrossoma, o principal centro organizador de microtúbulos em células
animais, causam divisões celulares anormais e a formação de tumores. Centrossomas adicionais
promovem divisões celulares defeituosas que podem originar mais do que duas células filhas não
viáveis. No entanto, muitas vezes as células cancerígenas conseguem dividir-se com sucesso ao
agruparem os seus centrossomas adicionais. O nosso trabalho anterior demonstrou que defeitos nos
centrossomas ocorrem com grande frequência no painel de linhas celulares de cancro NCI-60 e que o
agrupamento (clustering) de centrossomas é o principal mas não o único mecanismo para lidar com a
amplificação centrossomal. Os objetivos desta tese foram investigar a) quão frequente é o
mecanismo de agrupamento dos centrossomas no painel NCI-60, b) os mecanismos alternativos e
respetiva ocorrência, e c) como as células se dividem através de mecanismos alternativos. Para
responder a estas questões, analisámos a capacidade de clustering de 27 linhas celulares de cancro,
recorrendo a imagens de imunofluorescência de células mitóticas com amplificação centrossomal.
Este trabalho demonstrou que o agrupamento de centrossomas ocorre frequentemente em cancro e
realçou, pela primeira vez, a presença de mecanismos alternativos em cancro, isto é extrusão ou
inativação de centrossomas. Para além disso, observou-se que a maioria das células dividem de
forma bipolar, combinando diferentes mecanismos para lidar com a amplificação centrossomal. Mais
estudos serão necessários para compreender a regulação dos mecanismos alternativos a níveis
celulares e moleculares, visto que estes representam “tendões de Aquiles” para as células
cancerígenas, podendo ser explorados para o desenvolvimento de novos medicamentos seletivos
para cancro.
Palavras-chave: amplificação centrossomal, cancro, mitose, clustering, extrusão centrossomal, inativação centrossomal

ix
Abstract
Cancer kills one in five people each year in western societies, therefore clinicians are eager to
find novel diagnostic, prognostic and therapeutic tools to predict outcomes and treat patients. More
than a century ago, Theodor Boveri suggested that numerical abnormalities in the centrosome, the
major Microtubule Organizing Centre (MTOC) in animal cells, cause abnormal cell division and tumour
formation. Extra centrosomes promote aberrant cell divisions, which can induce the formation of more
than two non-viable daughter cells. However cancer cells often divide successfully and survive by
clustering (i.e. gathering) their supernumerary centrosomes. Our previous work has indeed shown that
centrosome defects are widespread in the NCI-60 panel of cancer cell lines and that centrosome
clustering is the main but not the sole coping mechanism with centrosome amplification. With this
thesis, I wanted to investigate a) how widespread clustering is in the NCI-60 panel, b) what alternative
coping mechanisms exist and how widespread they are, and c) how cells divide in presence of
alternative mechanisms. To answer these questions, we screened the centrosome clustering ability of
27 cancer cell lines using immunofluorescence images of mitotic cells displaying centrosome
amplification. This work showed that centrosome clustering is widespread in cancer and highlighted
the presence of alternative mechanisms, i.e. centrosome extrusion and inactivation, for the first time in
cancer. Furthermore, I observed that most of the cell lines divide in a bipolar fashion by combining the
different coping mechanisms. Further studies are now required to highlight the cellular and molecular
machineries regulating the alternative mechanisms as they represent exploitable Achilles’ heels of
cancer cells for the development of innovative drugs to selectively kill cancer.
Keywords: Centrosome amplification, Cancer, Mitosis, Clustering, Centrosome extrusion,
Centrosome inactivation

xi
Index 1. Introduction ................................................................................................................................1
1.1. The Cell Cycle ....................................................................................................................1
1.1.1. Phases of the Cell Cycle ..............................................................................................1
1.1.2. Cell cycle Regulation ....................................................................................................2
1.1.2.1. Kinases ....................................................................................................................2
1.1.2.2. Checkpoints .............................................................................................................3
1.2. The Cytoskeleton ...............................................................................................................3
1.3. The Centriole......................................................................................................................5
1.3.1. Structure and Composition ...........................................................................................5
1.3.2. Centriole associated structures ....................................................................................5
1.3.2.1. The Centrosome ......................................................................................................5
1.3.2.2. The Cilium ................................................................................................................6
1.3.3. The Duplication Cycle ..................................................................................................7
1.4. Centrosomes and Cancer ..................................................................................................8
1.4.1. Centrosome abnormalities............................................................................................9
1.4.2. Clustering .................................................................................................................. 10
1.4.2.1. Regulation .............................................................................................................. 10
1.4.2.2. Cancer therapy ...................................................................................................... 11
1.5. Objectives ........................................................................................................................ 13
2. Materials and Methods ............................................................................................................. 14
2.1. Coping Mechanisms Screen ........................................................................................... 14
2.1.1. Cell culture ................................................................................................................. 14
2.1.2. Immunofluorescence .................................................................................................. 14
2.1.3. Image acquisition and analysis ................................................................................... 14
2.2. Live imaging .................................................................................................................... 15
2.2.1. Generation of stable cell lines .................................................................................... 15
2.2.2. Cell synchronization ................................................................................................... 16
2.2.2.1. Mitotic shake-off ..................................................................................................... 16
2.2.2.2. S-phase arrest ....................................................................................................... 16
2.2.2.3. Flow cytometry ....................................................................................................... 16
2.2.3. Live-cell imaging ........................................................................................................ 17
3. Results...................................................................................................................................... 18
3.1. Previous work .................................................................................................................. 18
3.2. How widespread is centrosome clustering in the NCI-60 cell line panel? .................... 19
3.2.1. Strategy ..................................................................................................................... 19
3.2.2. Clustering is widespread in cancer ............................................................................. 20
3.3. How widespread are alternative coping mechanisms? ................................................. 25
3.3.1. Strategy ..................................................................................................................... 25
3.3.2. Alternative coping mechanisms are widespread in cancer .......................................... 27
3.3.3. Coping mechanisms are highly present in cancer cells ............................................... 30
xii
3.4. How do cells that have centriole amplification and lack clustering ability divide? ...... 32
3.4.1. Strategy ..................................................................................................................... 32
3.4.2. Preliminary Results .................................................................................................... 32
4. Discussion................................................................................................................................ 35
5. References ............................................................................................................................... 39
6. Supplementary Material ........................................................................................................... 44
xiii
Figures Figure 1.1 – The cell cycle phases ...................................................................................................1 Figure 1.2 – Scheme of the microtubule ..........................................................................................4 Figure 1.3 – The cartwheel................................................................................................................5 Figure 1.4 – The centrosome ............................................................................................................6 Figure 1.5 – The cilium......................................................................................................................6 Figure 1.6 – The centrosome cycle ..................................................................................................8 Figure 1.7 – Scheme of centrosome amplification ..........................................................................9 Figure 1.8 – Scheme of centrosome clustering. ............................................................................ 10 Figure 3.1 – Scheme of centrosome clustering ............................................................................. 19 Figure 3.2 – Types of cells present in the NCI-60 panel ................................................................ 19 Figure 3.3 – Clustering is widespread in cancer ........................................................................... 21 Figure 3.4 – 27 cell lines have >10% of amplification .................................................................... 22 Figure 3.5 – One centriolar marker leads to false positives .......................................................... 23 Figure 3.6 – Half of the cancer cell lines have high and intermediate clustering abilities........... 24 Figure 3.7 – Moderate positive correlation beteween the clustering and the amplification percentages..................................................................................................................................... 25 Figure 3.8 – Alternative coping mechanisms present in the NCI-60 cell panel ............................ 26 Figure 3.9 – Alternative mechanisms are widespread in cancer .................................................. 29 Figure 3.10 – Clustering percentage is underestimated ............................................................... 30 Figure 3.11 – Coping mechanisms are highly present in cancer cells ......................................... 31 Figure 3.12 – Preliminary result – Cells with supernumerary centrosomes failed to divide and died .................................................................................................................................................. 33 Figure 3.13 – Preliminary result – Inactive supernumary centriole migrates away from the spindle ............................................................................................................................................. 34 Figure 4.1 – Summary of mechanisms to cope with centrosome amplification .......................... 38 Supplementary Figure 6.1 – Death curves. .................................................................................... 47 Supplementary Figure 6.2 – Example of FACS results ................................................................. 47 Supplementary Figure 6.3 – Quantification of cells positive for centrin-GFP and H2B-RFP ....... 48 Supplementary Figure 6.4 – Correlation between total clustering percentage and total alternative mechanism percentage. ............................................................................................... 48 Supplementary Figure 6.5 – Correlation between tissue of origin and clustering or alternative mechanisms. ................................................................................................................................... 49 Supplementary Figure 6.6 – Mitotic shake-off ............................................................................... 50 Supplementary Figure 6.7 – S-phase arrest.................................................................................. 51


xv
Tables Supplementary Table 6.1 – The NCI-60 panel of cancer cell lines ................................................ 44 Supplementary Table 6.2 – List of the NCI-60 cell lines cultured for this study .......................... 46

xvii
Abbreviations % – Percentage
°C – degree Celsius
µg – micrograms
µl – microliters
µm – micrometers
µM – micromolar
APC/C – Anaphase Promoting Complex/Cyclosome
Cdk – Cyclin dependent kinase
Cep – Centrosomal protein
CIN – Chromosome Instability
CP – Centrosomal Protein
CPAP – Centrosomal Protein 4.1-Associated Protein
CPC – Chromosomal Passenger Complex
DNA – Deoxyribonucleic Acid
Eg – Kinesin family member 11
EtOH – Ethanol
FACS – Fluorescence Activated Cell Sorting
FBS – Fetal Bovine Serum
GFP – Green Fluorescent Protein
GTP – Guanosine triphosphate
H2B – Histone 2B
HSET – Kinesin-like protein HSET
HURP – Hepatoma Up-Regulated Protein
Ig – Immunoglobulin
KIFC1 – Kinesin Family Member C1
KLP – Kinesin-like protein
MAP – Microtubule Associated Protein
mg – milligrams
mL – millilitres
mm – millimetres
mM – millimolar
ms – milliseconds
MTOC – Microtubule Organizing Centre
NCI – National Cancer Institute
OFD – oral-facial-digital syndrome
ng – nanograms
nm – nanometres
nM – nanomolar
xviii
PARP – Poly ADP Ribose Polymerase
PBS – Phosphate Buffered Saline
PCM – Pericentriolar Material
Plk – Polo like-kinase
POC – POC1 centriolar protein homolog
PSA – Penicillin, Streptomycin, Amphotericin
RFP – Red Fluorescent Protein
RNAse – Ribonuclease
rpm – revolutions per minute
SAC – Spindle Assembly Checkpoint
SAS – Spindle Assembly
SPICE – Spindle and Centriole-associated protein
STIL – SCL-Interrupting Locus protein
U – units
V – Volt
1
1. Introduction
1.1. The Cell Cycle
Each cell in somatic proliferating human tissues matures and divides in two genetically
identical daughter cells through a process denominated cell cycle (Figure 1.1). To successfully
achieve this process, cellular contents (DNA and organelles) have to be duplicated and equally
segregated between the two daughter cells. The cell cycle takes around 24 hours in normal fast
proliferative human cells and is divided in two phases: interphase, the longest phase, and the division
phase called mitosis1–3
.
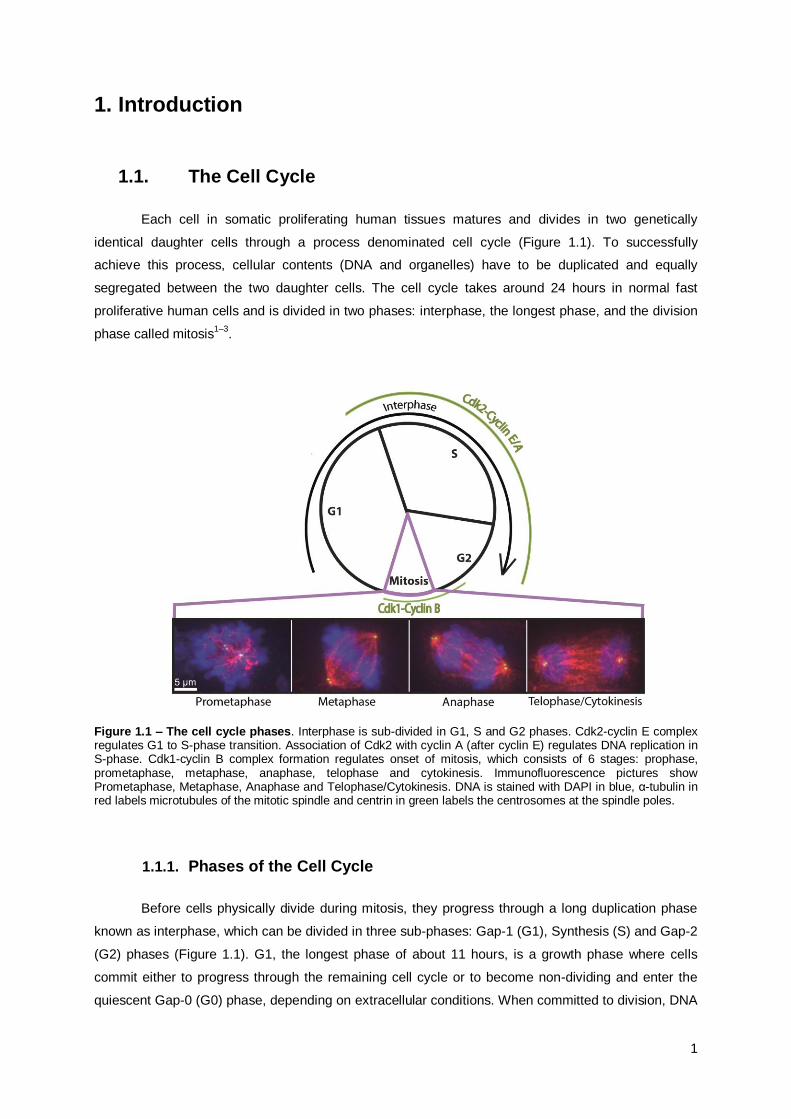
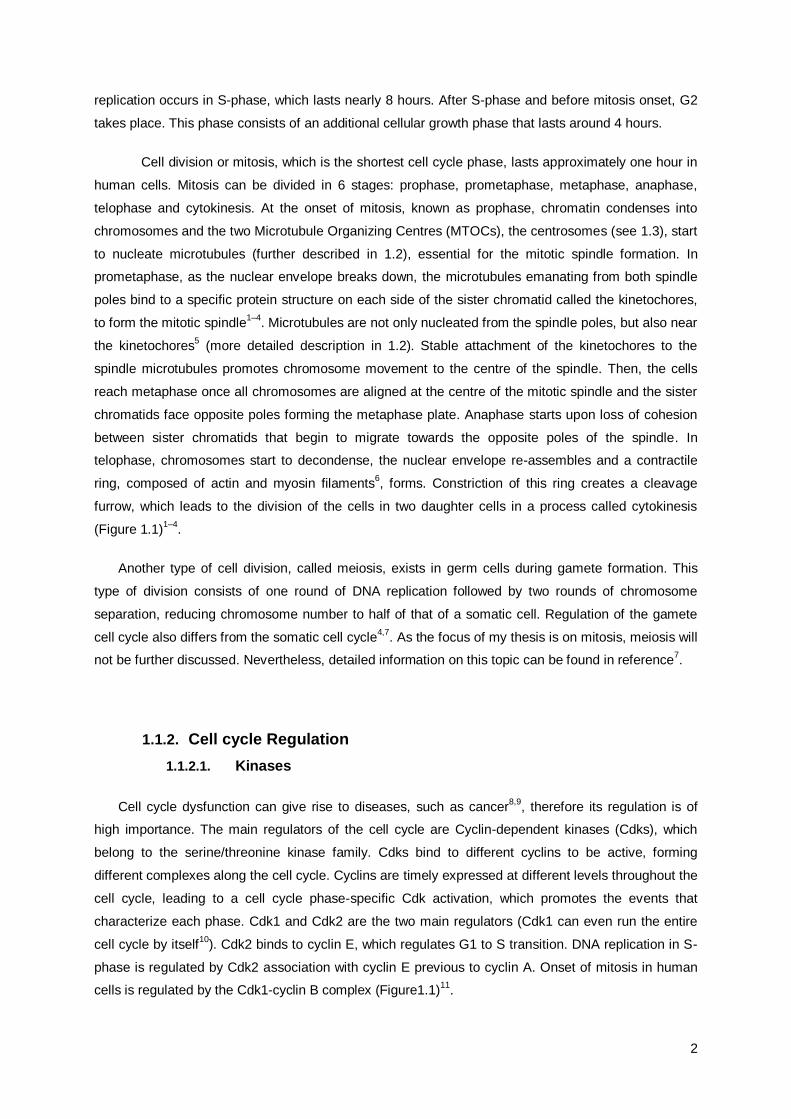
Figure 1.1 – The cell cycle phases. Interphase is sub-divided in G1, S and G2 phases. Cdk2-cyclin E complex regulates G1 to S-phase transition. Association of Cdk2 with cyclin A (after cyclin E) regulates DNA replication in S-phase. Cdk1-cyclin B complex formation regulates onset of mitosis, which consists of 6 stages: prophase, prometaphase, metaphase, anaphase, telophase and cytokinesis. Immunofluorescence pictures show Prometaphase, Metaphase, Anaphase and Telophase/Cytokinesis. DNA is stained with DAPI in blue, α-tubulin in red labels microtubules of the mitotic spindle and centrin in green labels the centrosomes at the spindle poles.
1.1.1. Phases of the Cell Cycle
Before cells physically divide during mitosis, they progress through a long duplication phase
known as interphase, which can be divided in three sub-phases: Gap-1 (G1), Synthesis (S) and Gap-2
(G2) phases (Figure 1.1). G1, the longest phase of about 11 hours, is a growth phase where cells
commit either to progress through the remaining cell cycle or to become non-dividing and enter the
quiescent Gap-0 (G0) phase, depending on extracellular conditions. When committed to division, DNA
2
replication occurs in S-phase, which lasts nearly 8 hours. After S-phase and before mitosis onset, G2
takes place. This phase consists of an additional cellular growth phase that lasts around 4 hours.
Cell division or mitosis, which is the shortest cell cycle phase, lasts approximately one hour in
human cells. Mitosis can be divided in 6 stages: prophase, prometaphase, metaphase, anaphase,
telophase and cytokinesis. At the onset of mitosis, known as prophase, chromatin condenses into
chromosomes and the two Microtubule Organizing Centres (MTOCs), the centrosomes (see 1.3), start
to nucleate microtubules (further described in 1.2), essential for the mitotic spindle formation. In
prometaphase, as the nuclear envelope breaks down, the microtubules emanating from both spindle
poles bind to a specific protein structure on each side of the sister chromatid called the kinetochores,
to form the mitotic spindle1–4
. Microtubules are not only nucleated from the spindle poles, but also near
the kinetochores5 (more detailed description in 1.2). Stable attachment of the kinetochores to the
spindle microtubules promotes chromosome movement to the centre of the spindle. Then, the cells
reach metaphase once all chromosomes are aligned at the centre of the mitotic spindle and the sister
chromatids face opposite poles forming the metaphase plate. Anaphase starts upon loss of cohesion
between sister chromatids that begin to migrate towards the opposite poles of the spindle. In
telophase, chromosomes start to decondense, the nuclear envelope re-assembles and a contractile
ring, composed of actin and myosin filaments6, forms. Constriction of this ring creates a cleavage
furrow, which leads to the division of the cells in two daughter cells in a process called cytokinesis
(Figure 1.1)1–4
.
Another type of cell division, called meiosis, exists in germ cells during gamete formation. This
type of division consists of one round of DNA replication followed by two rounds of chromosome
separation, reducing chromosome number to half of that of a somatic cell. Regulation of the gamete
cell cycle also differs from the somatic cell cycle4,7
. As the focus of my thesis is on mitosis, meiosis will
not be further discussed. Nevertheless, detailed information on this topic can be found in reference7.
1.1.2. Cell cycle Regulation
1.1.2.1. Kinases
Cell cycle dysfunction can give rise to diseases, such as cancer8,9
, therefore its regulation is of
high importance. The main regulators of the cell cycle are Cyclin-dependent kinases (Cdks), which
belong to the serine/threonine kinase family. Cdks bind to different cyclins to be active, forming
different complexes along the cell cycle. Cyclins are timely expressed at different levels throughout the
cell cycle, leading to a cell cycle phase-specific Cdk activation, which promotes the events that
characterize each phase. Cdk1 and Cdk2 are the two main regulators (Cdk1 can even run the entire
cell cycle by itself10
). Cdk2 binds to cyclin E, which regulates G1 to S transition. DNA replication in S-
phase is regulated by Cdk2 association with cyclin E previous to cyclin A. Onset of mitosis in human
cells is regulated by the Cdk1-cyclin B complex (Figure1.1)11
.
3
The activity of the cyclin-Cdk complexes are also regulated via other mechanisms, such as post-
translational modification of Cdks by a) phosphorylation-dephosphorylation cascades (e.g. inhibitory
phosphorylation of Cdk1 by Wee1/Myt1 prior to mitotic entry), b) interaction with protein inhibitors (e.g.
p21) and c) proteolytic degradation of cyclins. As an example, the Anaphase-Promoting
Complex/Cyclosome (APC/C) targets cyclin B for degradation at the end of metaphase, allowing
mitotic cells to progress through anaphase, telophase and cytokinesis11,12
.
Other protein kinases, such as the Polo-like-kinase (Plk) family, composed of 5 members in
mammals, are also involved in cell cycle regulation. Plks are serine/threonine kinases that have a
Polo-Box Domain. Plk1 has many different roles during mitosis: it is required for centrosome
maturation, the formation of a bipolar spindle, kinetochore function, APC/C regulation and
cytokinesis13–15
. Plk2 is expressed in S-phase and is important for centriole formation16
. Plk3 is
involved in DNA replication17
. Plk5 is involved in cell cycle exit18
(recommended reviews:
references19,20
). Plk4 function will be discussed in detail in 1.3.3. Many other protein kinases21
, such as
Aurora kinases22,23
, also play roles in cell cycle control.
1.1.2.2. Checkpoints
The checkpoints are constitutively active control mechanisms that ensure the correct order of cell
cycle progression. The checkpoints minimize genetic errors and their propagation, by not allowing
progression to the next stage before the previous one has successfully finished. During cell cycle
progression, three checkpoints exist:
G1 or restriction checkpoint: monitors cell size, DNA damage and the extracellular
environment. Upon satisfaction of this checkpoint, the cell is committed to cell division.
DNA damage checkpoint: functions in G1, S and G2 phases. If this checkpoint is not
satisfied in G2, entry in mitosis is impaired24,25
.
Spindle Assembly Checkpoint (SAC): monitors kinetochore-microtubule attachment. As
long as not all kinetochores are attached to microtubules, this checkpoint prevents
anaphase progression by inhibiting APC/C, thus preventing cyclin B and securin
degradation by the proteasome. Only once all kinetochores are attached to microtubules
of the mitotic spindle26,27
, the checkpoint is satisfied allowing progression to anaphase26,27
.
1.2. The Cytoskeleton
The Cytoskeleton is a dynamic network within cells composed of three different types of protein
filaments: actin microfilaments, intermediate filaments and microtubules. Actin microfilaments,
polarized filaments composed of actin proteins, provide shape and robustness to the cell, since they
form the cell-cortex, an actin-rich layer right under the plasma membrane. They are also involved in
cell motility, with the help of myosin motor-proteins. Intermediate filaments are biochemically
4
heterogeneous robust filaments, which can be composed of keratin, desmin, neurofilaments or lamins.
Intermediate filaments give structure and organization to the cell. Microtubules are tubes composed of
tubulin and are involved in organelle organization. They are also involved with motor proteins (e.g.
kinesins and dyneins)1,2
. The Cytoskeleton is an important cellular structure for cell division, since it is
involved in the separation of DNA, due to the microtubules of the mitotic spindle, and of the daughter
cells, caused by a contractile ring composed of actin and myosin. In the scope of my thesis, the focus
will be on the Microtubule Cytoskeleton.
The internal organization of the cell is partly dependent on microtubules. During interphase they
provide an organizational framework to the organelles. Additionally, microtubules are involved in the
transport of vesicles, cellular motility and signalling. In mitosis, they form the mitotic bipolar spindle to
ensure correct segregation of the sister chromatids1. The mitotic spindle consists of three types of
microtubules: astral microtubules, interpolar microtubules and microtubules that emanate from the
kinetochore, denominated K-fibres5. All microtubules are nucleated from the centrosomes, the main
MTOCs of animal cells, but only K-fibres can also be nucleated from the kinetochores. The astral
microtubules are important for spindle positioning since they anchor the spindle poles to the cell
membrane by interacting with the cell cortex. Interpolar microtubules push the two spindle poles apart
allowing anaphase progression1,28,29
. K-fibres connect the kinetochores to the poles and are
responsible for correct sister chromatid segregation1,5,30
.
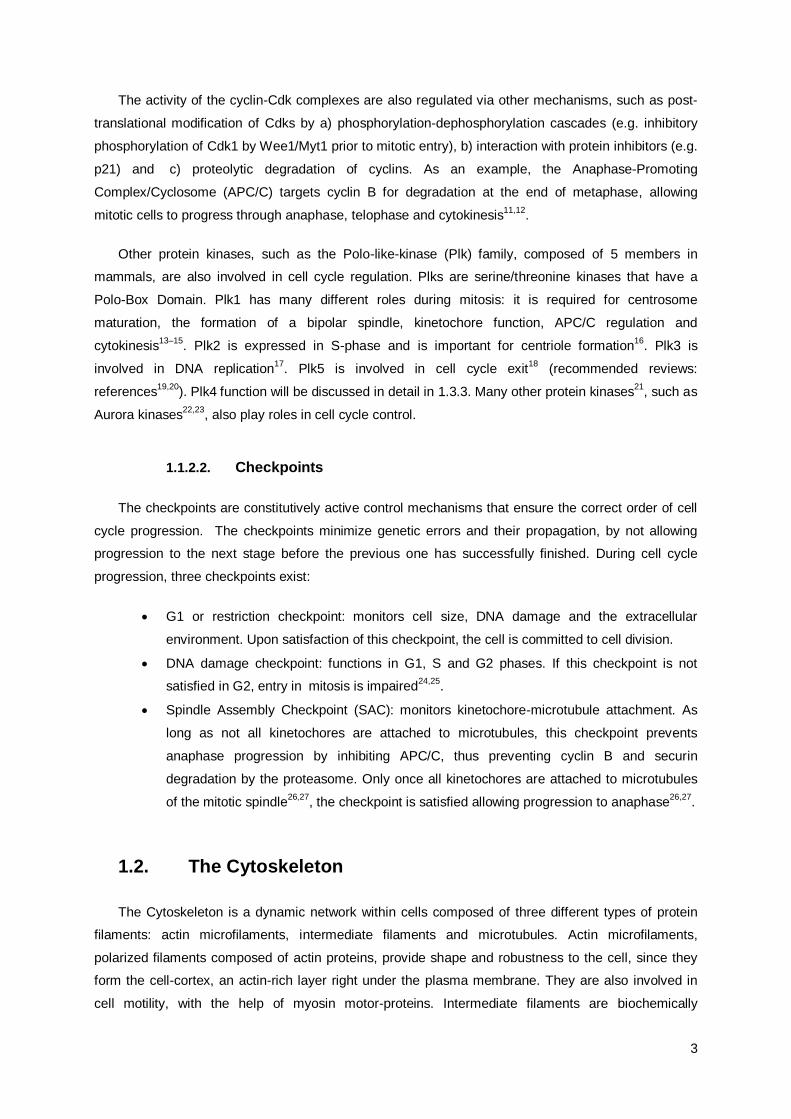
Microtubules are hollow cylindrical structures composed of 13
polarized protofilaments of α-tubulin and β-tubulin heterodimers (Figure
1.2)2,31
. Protofilaments are highly dynamic due to GTP hydrolysis by
tubulin at their ends. Dynamic instability gives rise to alternating periods
of microtubule growth and shrinkage, which is essential for the
reorganization of microtubules during the cell cycle31–33
. The faster
growing end of the protofilament is designated plus end, where β-tubulins
are exposed, while α-tubulins are found at the minus end, which grows
slower 1,2,31
. The minus end is in general attached to a nucleation site, a
MTOC. This nucleation process is dependent on γ-tubulin, a component
of the MTOC1,34
. γ-tubulin is also important for chromosome-mediated
nucleation, independent of MTOCs35
.
Normally, microtubules are found as singlets (or simple microtubule)
in the cell. However, in some structures doublets or triplets (grouped
microtubules) can be found, as is the case of cilia, flagella, basal bodies
and centrioles1.
Figure 1.2 – Scheme of the microtubule. Microtubules are composed of 13 protofilaments of α- and β-tubulins. Image adapted from
2.
5
1.3. The Centriole
1.3.1. Structure and Composition
Centrioles are the building blocks of centrosomes and cilia36
.The centriole is a microtubule-
based barrel-like structure, approximately 500 nm long and 200 nm wide36
. At the proximal end, the
centriole is composed of 9 radial microtubule triplets. Each triplet is composed of a complete A-tubule
(with 13 protofilaments) and two partial B- and C-tubules (with 10 protofilaments). However, the distal
end is composed of microtubule doublets, lacking the C-tubule1,37
. Besides α- and β-tubulin, which
exhibit diverse posttranslational modifications such as polyglutamylation and acetylation38
, the
centriole is also composed of many other proteins such as γ-tubulin39
and the three centrin isotypes in
the lumen40
.
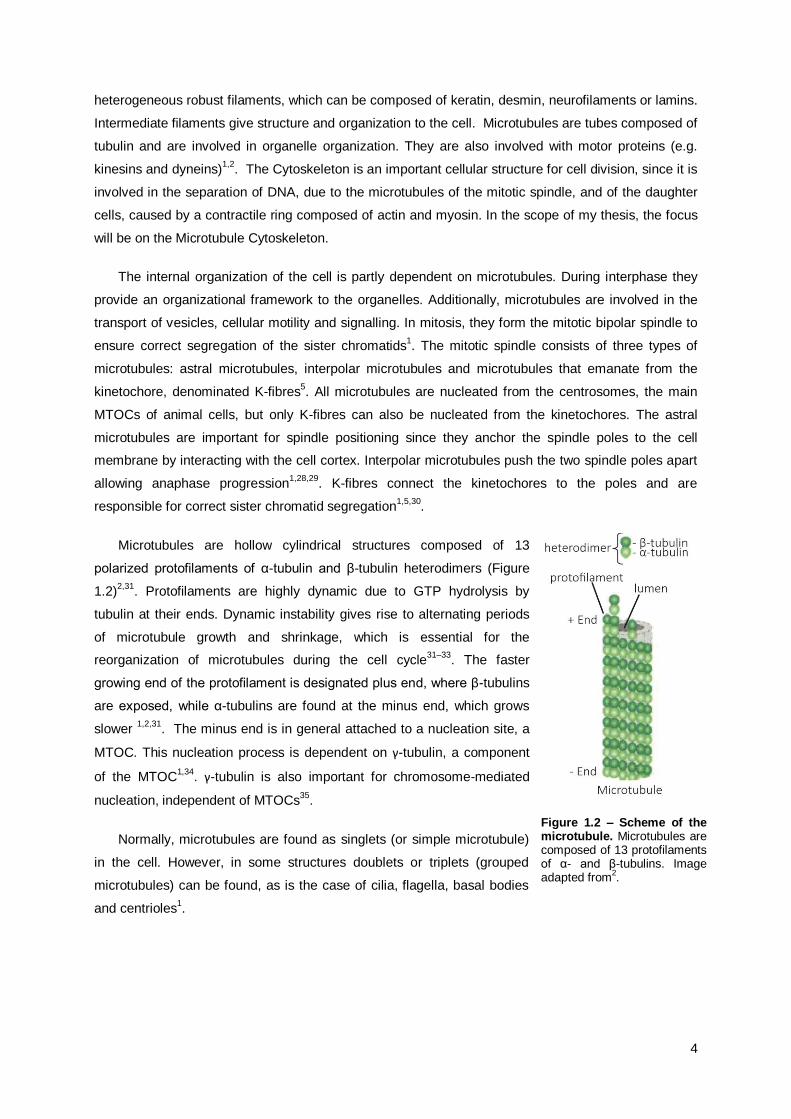
Upon centriole synthesis, the cartwheel is the first structure formed at the proximal end that
establishes the 9-fold symmetry. This process depends on the protein SAS-641
(see topic 1.3.3). The
cartwheel is a structure composed of a central tube from which 9 radial spokes emanate that connect
to the proximal end of the A-tubule of the microtubule triplets (Figure 1.3)42
. A centriole reaches
maturity after 2 cell cycles43
, once it loses the cartwheel44
and acquires sub-distal and distal
appendages45
, structures important for microtubule nucleation and cilia formation, respectively46
.
Figure 1.3 – The cartwheel localizes at the proximal end of the forming centriole. It comprises a central tube from which 9 radial spokes emanate that connect to the triplets. A) Scheme of the cartwheel adapted from
44. B)
Electron Microscopy image of the cartwheel. Scale bar=0.2µm. Adapted from36
.
1.3.2. Centriole associated structures
1.3.2.1. The Centrosome
Centrosomes (Figure 1.4) are the main MTOC of animal cells37
. They are composed of two
orthogonally oriented centrioles, the mother (older centriole) and the daughter, and a surrounding
electron dense protein matrix, denominated pericentriolar material (PCM)36
. PCM is a very dynamic
structure47
and composed of many different types of protein, being pericentrin the first one
described48
. PCM is crucial for microtubule nucleation49
, since it recruits γ-tubulin50
.
6
In interphase, centrosomes localize close to the nucleus51
and are involved in cell
polarization, cell movement and cell adhesion. In mitosis, the centrosomes, which duplicate during the
G1 to S-phase transition (discussed in 1.3.3), separate and organize the mitotic spindle37
. The
centrosome also plays a role in cell cycle regulation, since a vast number of cell cycle proteins bind to
the centrosome. As an example: when centrosomes are removed, cells fail to progress into S-phase
and therefore DNA replication does not occur52
.
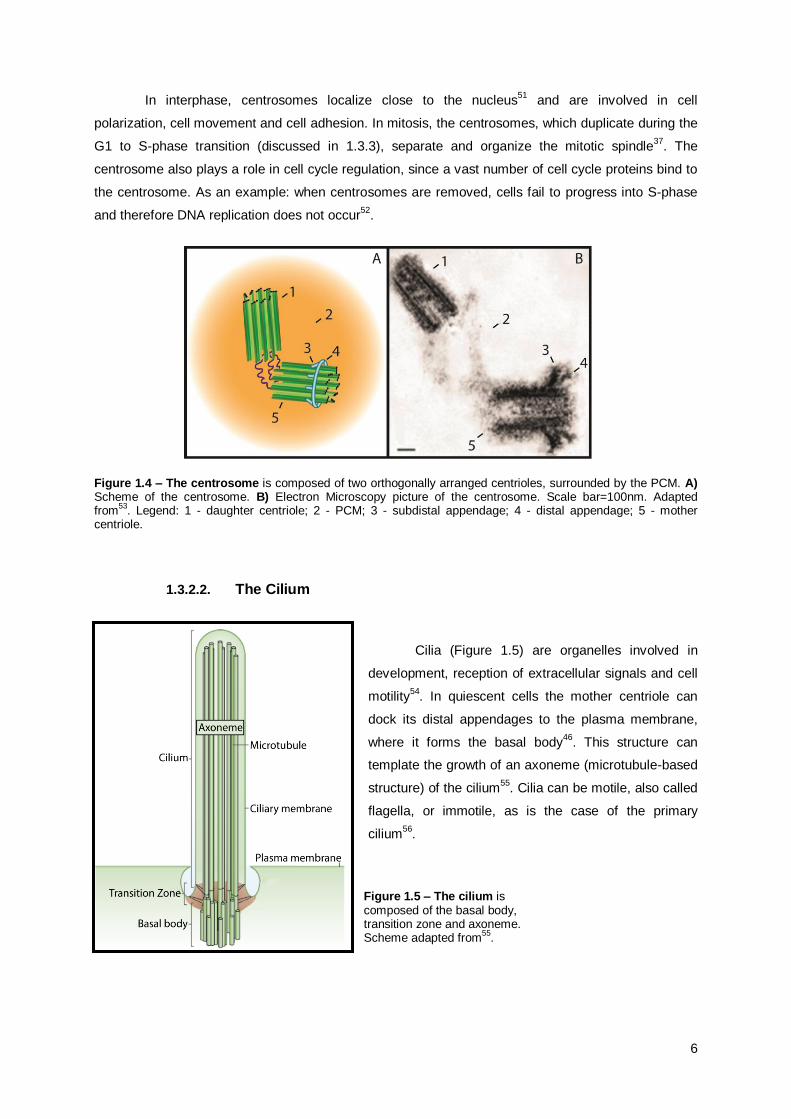
Figure 1.4 – The centrosome is composed of two orthogonally arranged centrioles, surrounded by the PCM. A) Scheme of the centrosome. B) Electron Microscopy picture of the centrosome. Scale bar=100nm. Adapted from
53. Legend: 1 - daughter centriole; 2 - PCM; 3 - subdistal appendage; 4 - distal appendage; 5 - mother
centriole.
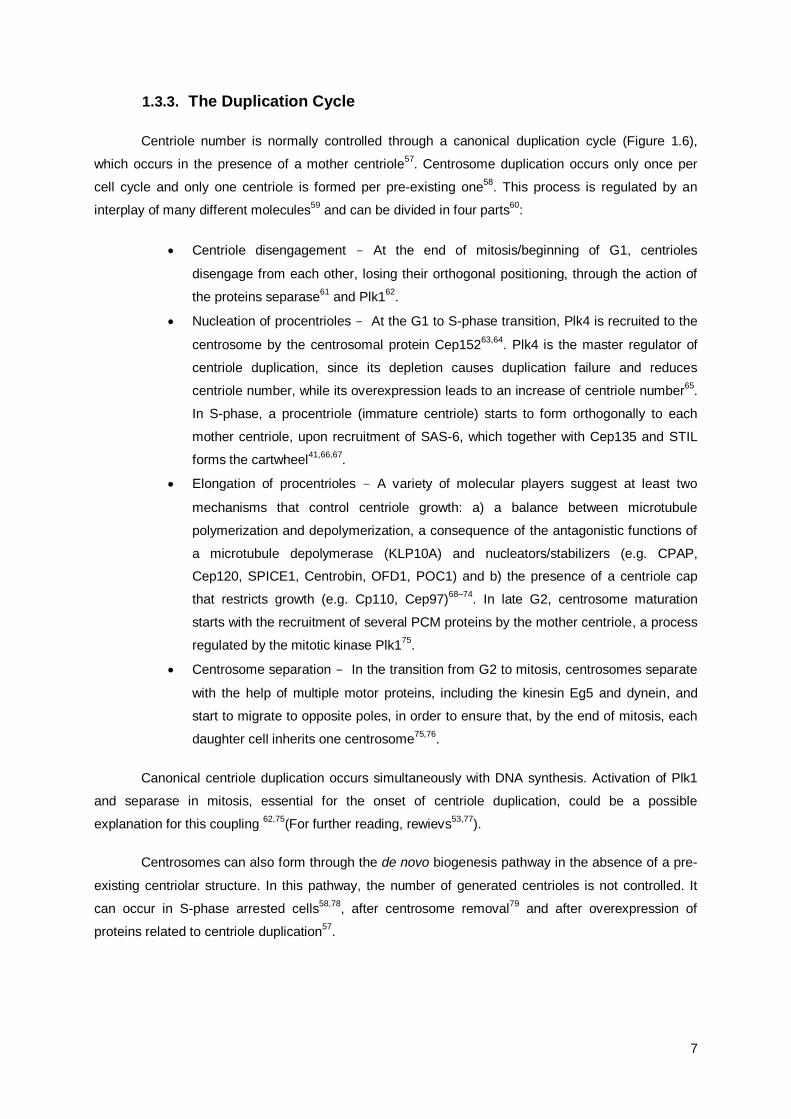
1.3.2.2. The Cilium
Cilia (Figure 1.5) are organelles involved in
development, reception of extracellular signals and cell
motility54
. In quiescent cells the mother centriole can
dock its distal appendages to the plasma membrane,
where it forms the basal body46
. This structure can
template the growth of an axoneme (microtubule-based
structure) of the cilium55
. Cilia can be motile, also called
flagella, or immotile, as is the case of the primary
cilium56
.
Figure 1.5 – The cilium is composed of the basal body, transition zone and axoneme. Scheme adapted from
55.
7
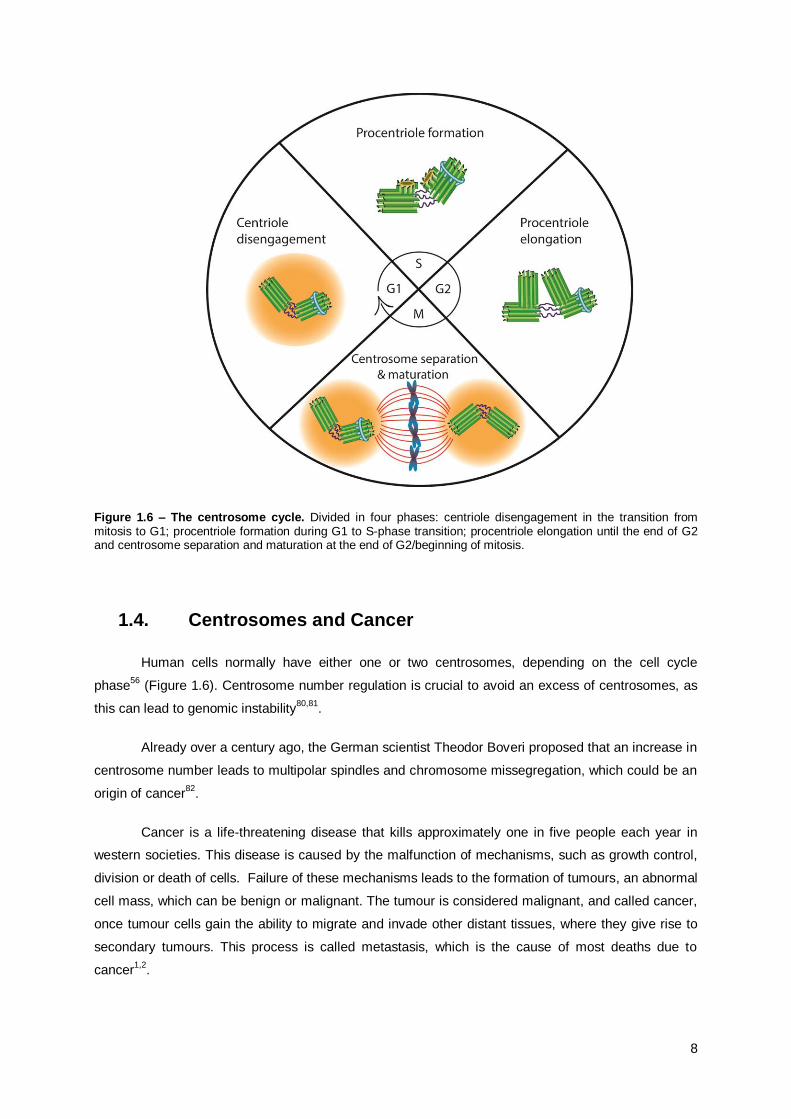
1.3.3. The Duplication Cycle
Centriole number is normally controlled through a canonical duplication cycle (Figure 1.6),
which occurs in the presence of a mother centriole57
. Centrosome duplication occurs only once per
cell cycle and only one centriole is formed per pre-existing one58
. This process is regulated by an
interplay of many different molecules59
and can be divided in four parts60
:
Centriole disengagement - At the end of mitosis/beginning of G1, centrioles
disengage from each other, losing their orthogonal positioning, through the action of
the proteins separase61
and Plk162
.
Nucleation of procentrioles - At the G1 to S-phase transition, Plk4 is recruited to the
centrosome by the centrosomal protein Cep15263,64
. Plk4 is the master regulator of
centriole duplication, since its depletion causes duplication failure and reduces
centriole number, while its overexpression leads to an increase of centriole number65
.
In S-phase, a procentriole (immature centriole) starts to form orthogonally to each
mother centriole, upon recruitment of SAS-6, which together with Cep135 and STIL
forms the cartwheel41,66,67
.
Elongation of procentrioles – A variety of molecular players suggest at least two
mechanisms that control centriole growth: a) a balance between microtubule
polymerization and depolymerization, a consequence of the antagonistic functions of
a microtubule depolymerase (KLP10A) and nucleators/stabilizers (e.g. CPAP,
Cep120, SPICE1, Centrobin, OFD1, POC1) and b) the presence of a centriole cap
that restricts growth (e.g. Cp110, Cep97)68–74
. In late G2, centrosome maturation
starts with the recruitment of several PCM proteins by the mother centriole, a process
regulated by the mitotic kinase Plk175
.
Centrosome separation - In the transition from G2 to mitosis, centrosomes separate
with the help of multiple motor proteins, including the kinesin Eg5 and dynein, and
start to migrate to opposite poles, in order to ensure that, by the end of mitosis, each
daughter cell inherits one centrosome75,76
.
Canonical centriole duplication occurs simultaneously with DNA synthesis. Activation of Plk1
and separase in mitosis, essential for the onset of centriole duplication, could be a possible
explanation for this coupling 62,75
(For further reading, rewievs53,77
).
Centrosomes can also form through the de novo biogenesis pathway in the absence of a pre-
existing centriolar structure. In this pathway, the number of generated centrioles is not controlled. It
can occur in S-phase arrested cells58,78
, after centrosome removal79
and after overexpression of
proteins related to centriole duplication57
.
8
Figure 1.6 – The centrosome cycle. Divided in four phases: centriole disengagement in the transition from mitosis to G1; procentriole formation during G1 to S-phase transition; procentriole elongation until the end of G2 and centrosome separation and maturation at the end of G2/beginning of mitosis.
1.4. Centrosomes and Cancer
Human cells normally have either one or two centrosomes, depending on the cell cycle
phase56
(Figure 1.6). Centrosome number regulation is crucial to avoid an excess of centrosomes, as
this can lead to genomic instability80,81
.
Already over a century ago, the German scientist Theodor Boveri proposed that an increase in
centrosome number leads to multipolar spindles and chromosome missegregation, which could be an
origin of cancer82
.
Cancer is a life-threatening disease that kills approximately one in five people each year in
western societies. This disease is caused by the malfunction of mechanisms, such as growth control,
division or death of cells. Failure of these mechanisms leads to the formation of tumours, an abnormal
cell mass, which can be benign or malignant. The tumour is considered malignant, and called cancer,
once tumour cells gain the ability to migrate and invade other distant tissues, where they give rise to
secondary tumours. This process is called metastasis, which is the cause of most deaths due to
cancer1,2
.
9
1.4.1. Centrosome abnormalities
Centrosome abnormalities have been described in many different types of cancer83
.
Nevertheless, to date, it is not clear whether these abnormalities can be at the origin of cancer or are
rather its consequence. Centrosome abnormalities can be found in premalignant tumours (i.e. early
low grade tumour)80
, suggesting a role in tumour initiation. However, centrosome abnormalities are
also highly associated with malignant tumours and poor prognosis83
, implying they may be a
consequence of cancer progression.
There are two types of centrosome abnormalities: structural and numerical defects84
.
Structural abnormalities can be subdivided in defects in centriolar size or in the amount of PCM. The
origin of these defects are still unclear, however changes in gene expression related to centriolar
length, such as CPAP85
, are interesting possible explanations.
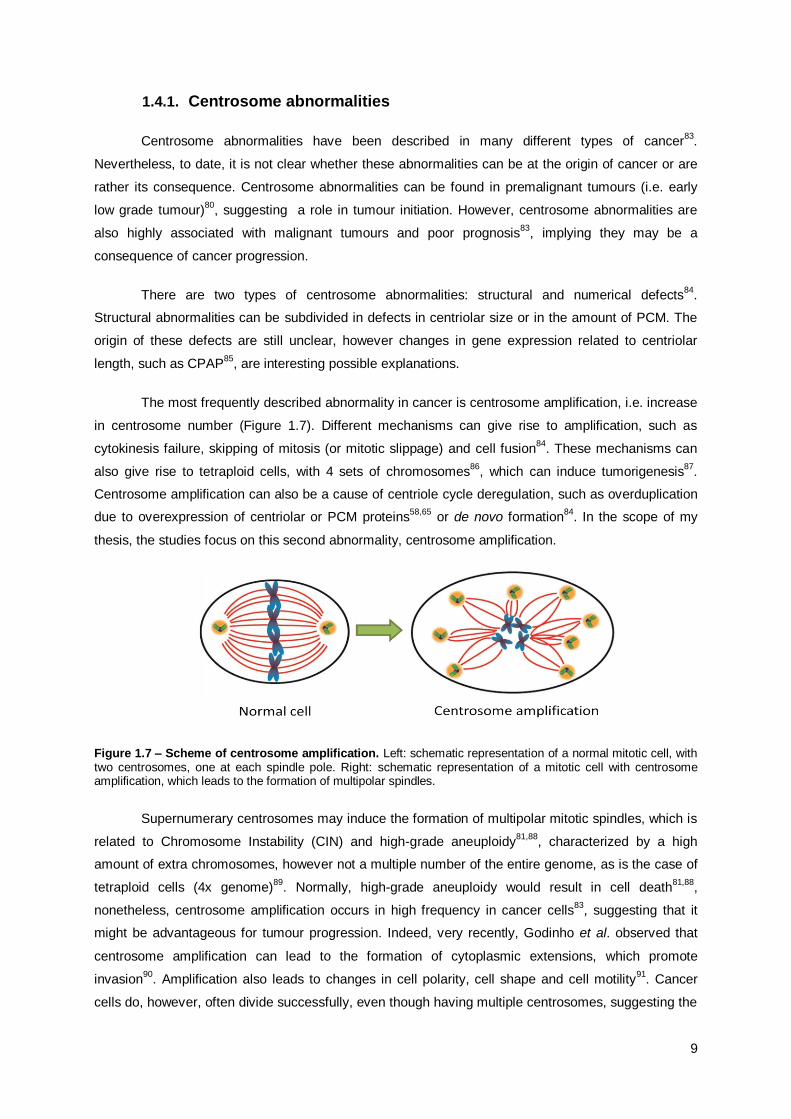
The most frequently described abnormality in cancer is centrosome amplification, i.e. increase
in centrosome number (Figure 1.7). Different mechanisms can give rise to amplification, such as
cytokinesis failure, skipping of mitosis (or mitotic slippage) and cell fusion84
. These mechanisms can
also give rise to tetraploid cells, with 4 sets of chromosomes86
, which can induce tumorigenesis87
.
Centrosome amplification can also be a cause of centriole cycle deregulation, such as overduplication
due to overexpression of centriolar or PCM proteins58,65
or de novo formation84
. In the scope of my
thesis, the studies focus on this second abnormality, centrosome amplification.
Figure 1.7 – Scheme of centrosome amplification. Left: schematic representation of a normal mitotic cell, with two centrosomes, one at each spindle pole. Right: schematic representation of a mitotic cell with centrosome amplification, which leads to the formation of multipolar spindles.
Supernumerary centrosomes may induce the formation of multipolar mitotic spindles, which is
related to Chromosome Instability (CIN) and high-grade aneuploidy81,88
, characterized by a high
amount of extra chromosomes, however not a multiple number of the entire genome, as is the case of
tetraploid cells (4x genome)89
. Normally, high-grade aneuploidy would result in cell death81,88
,
nonetheless, centrosome amplification occurs in high frequency in cancer cells83
, suggesting that it
might be advantageous for tumour progression. Indeed, very recently, Godinho et al. observed that
centrosome amplification can lead to the formation of cytoplasmic extensions, which promote
invasion90
. Amplification also leads to changes in cell polarity, cell shape and cell motility91
. Cancer
cells do, however, often divide successfully, even though having multiple centrosomes, suggesting the
10
existence of adaptation mechanisms that promote their survival. One such mechanism is the gathering
or clustering of supernumerary centrosomes at the two spindle-poles, ensuring a pseudo-bipolar cell
division92
(Figure 1.8).
Other mechanisms developed to cope with supernumerary centrosomes are centrosome loss
or inactivation. Inactivation of centrosomes was described in flies and is characterized by the loss of
PCM, which leads to lower microtubule nucleation93
. Loss of the centrosome occurs in the oocyte, to
ensure that, upon fertilization, the fertilized egg only has one centrosome94
. During this process
centrosomes also lose the ability to nucleate microtubules95
. However, the presence of alternative
mechanisms has not been yet reported in cancer cells.
1.4.2. Clustering
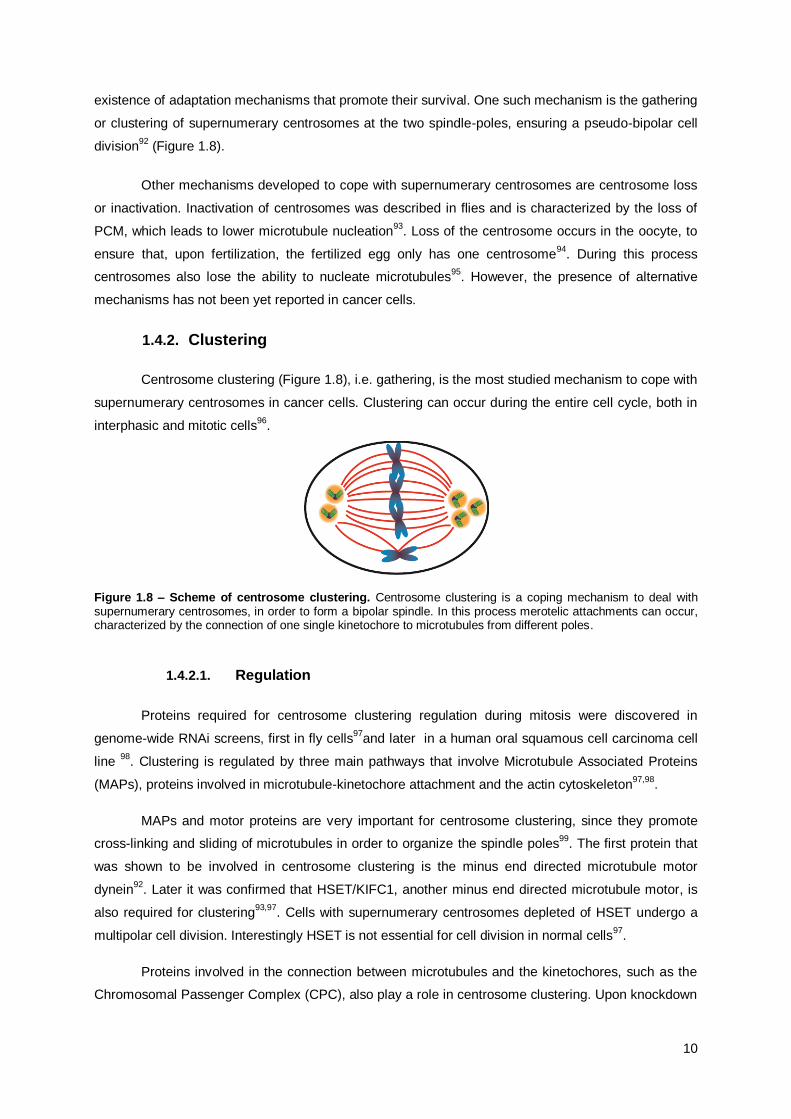
Centrosome clustering (Figure 1.8), i.e. gathering, is the most studied mechanism to cope with
supernumerary centrosomes in cancer cells. Clustering can occur during the entire cell cycle, both in
interphasic and mitotic cells96
.
Figure 1.8 – Scheme of centrosome clustering. Centrosome clustering is a coping mechanism to deal with supernumerary centrosomes, in order to form a bipolar spindle. In this process merotelic attachments can occur, characterized by the connection of one single kinetochore to microtubules from different poles.
1.4.2.1. Regulation
Proteins required for centrosome clustering regulation during mitosis were discovered in
genome-wide RNAi screens, first in fly cells97
and later in a human oral squamous cell carcinoma cell
line 98
. Clustering is regulated by three main pathways that involve Microtubule Associated Proteins
(MAPs), proteins involved in microtubule-kinetochore attachment and the actin cytoskeleton97,98
.
MAPs and motor proteins are very important for centrosome clustering, since they promote
cross-linking and sliding of microtubules in order to organize the spindle poles99
. The first protein that
was shown to be involved in centrosome clustering is the minus end directed microtubule motor
dynein92
. Later it was confirmed that HSET/KIFC1, another minus end directed microtubule motor, is
also required for clustering93,97
. Cells with supernumerary centrosomes depleted of HSET undergo a
multipolar cell division. Interestingly HSET is not essential for cell division in normal cells97
.
Proteins involved in the connection between microtubules and the kinetochores, such as the
Chromosomal Passenger Complex (CPC), also play a role in centrosome clustering. Upon knockdown
11
of the CPC, cells with supernumerary centrosomes form multipolar spindles, due to defective
attachments between microtubules and kinetochores98
. Hepatoma up-regulated protein (HURP), a
MAP involved in the stabilization of K-fibres, organizes and maintains spindle bipolarity, which is
important for centrosome clustering100
.
Depletion of the Augmin Complex, which is important for the recruitment of γ-tubulin at the
microtubules101
, also leads to multipolar spindle formation since spindle tension is lost98
. Abnormal
spindle tension and kinetochore attachment, which occur in the presence of multipolar spindles,
activates the SAC, delaying mitosis27
. This delay is necessary to allow sufficient time for centrosome
clustering102
. Thus, proper functioning of the SAC is necessary for clustering97
. It was also shown that
the APC/C is also required for centrosome clustering, since its depletion leads to multipolar
spindles103
.
The actin cytoskeleton and actin-dependent forces also play a role in the formation of the
bipolar spindle, given that they are involved in positioning of the mitotic spindle104
. Actin-depletion
leads to the formation of multipolar spindles97
. Moreover, retraction fibres, actin-based extensions
involved in the adhesion of mitotic cells to the extracellular matrix, are involved in spindle
orientation105
. They originate pulling forces and depending on the number of retraction fibres and the
angle between them, cells are forced to form either multipolar or bipolar spindles97
. Recently it was
shown that the positioning of centrosomes at the retraction fibres is dependent on myosin-10106
.
Importantly, clustering of supernumerary centrosomes can still lead to the formation of CIN.
During the process of clustering, where transient multipolar spindles exist, merotelic attachments
frequently happen. This attachment is characterized by the connection of one single kinetochore to
microtubules from different poles (Figure 1.8). Most of the times these errors are not recognized by the
SAC and chromosome loss can occur, inducing low-grade aneuploidy81
.
1.4.2.2. Cancer therapy
Two of the major challenges in cancer therapy are to discover: a) new diagnostic and
prognostic tools and b) specific features of cancer cells to selectively kill them, avoiding the side
effects on normal cells usually observed with many existing cancer drugs, such as microtubule
targeting agents107
. Amongst these features, centrosome clustering is an appealing process since
some of its regulators, such as HSET, are only essential for cancer cells97
.
Supporting this, the inhibition of centrosome clustering, performed in three different studies,
affected only cancer cells and not normal cells108–110
. Moreover, drugs inducing multipolar division
formation, a consequence of centrosome clustering inhibition, are under development (e.g.
penanthrene-derived PARP inhibitor111
or GF-15). The latter one was shown to decrease tumour
growth in mice xenografts112
.
12
However, even if centrosome clustering is an exploitable Achilles’ heel of cancer cells to
develop innovative drugs, its frequency in cancer remains undetermined. Moreover, alternative
mechanisms to cope with centrosome amplification, as centrosome inactivation and loss described in
flies and oocytes93,94
, may occur. Therefore, new studies are required to determine the mechanisms
that cancer cells with extra centrosomes use to divide in a pseudo-bipolar fashion. Understanding
these mechanisms at the cellular and molecular level might provide novel avenues to diagnose and
selectively target cancer.
13
1.5. Objectives
The objective of my work described in this Master’s thesis was to understand the coping
mechanisms that exist in cancer cells with supernumerary centrosomes.
In previous work from the laboratory, a screening of the NCI-60 panel of cancer cell lines was
performed in order to study the incidence of centrosome abnormalities in number and length, their
origins and consequences, as well as the mechanisms used by cancer cells to cope with centrosome
amplification. This screen showed that centrosome abnormalities are widespread in this panel.
Moreover it was observed that centrosome clustering is a main, but not only coping-mechanism.
However, the frequency of centrosome clustering still remains undetermined and the existence
of alternative mechanisms has not been studied in cancer cells. Based on this previous work, the
project was divided in three aims:
1. Determine the clustering ability of 52 cancer cell lines (see Supplementary Table 6.1)
from the NCI-60 panel.
2. Evaluate the presence of other non-described coping mechanisms, such as
centrosome loss or inactivation.
3. Characterise these novel mechanisms by following mitotic cell fate using live imaging,
in cell lines lacking the clustering ability.
Understanding these novel coping mechanisms is essential to determine if and how they could
be used to find new therapeutic avenues to selectively target cancer.
14
2. Materials and Methods
2.1. Coping Mechanisms Screen
2.1.1. Cell culture
Cell lines were cultured in their respective media (see Supplementary Table 6.2)
supplemented with 10% Fetal Bovine Serum (FBS, Biowest) and PSA, an antibiotic (100 U/mL
Penicillin and 0.1 mg/mL Streptomycin) and antimycotic (0.25 µg/mL Amphotericin B) solution from
Sigma.
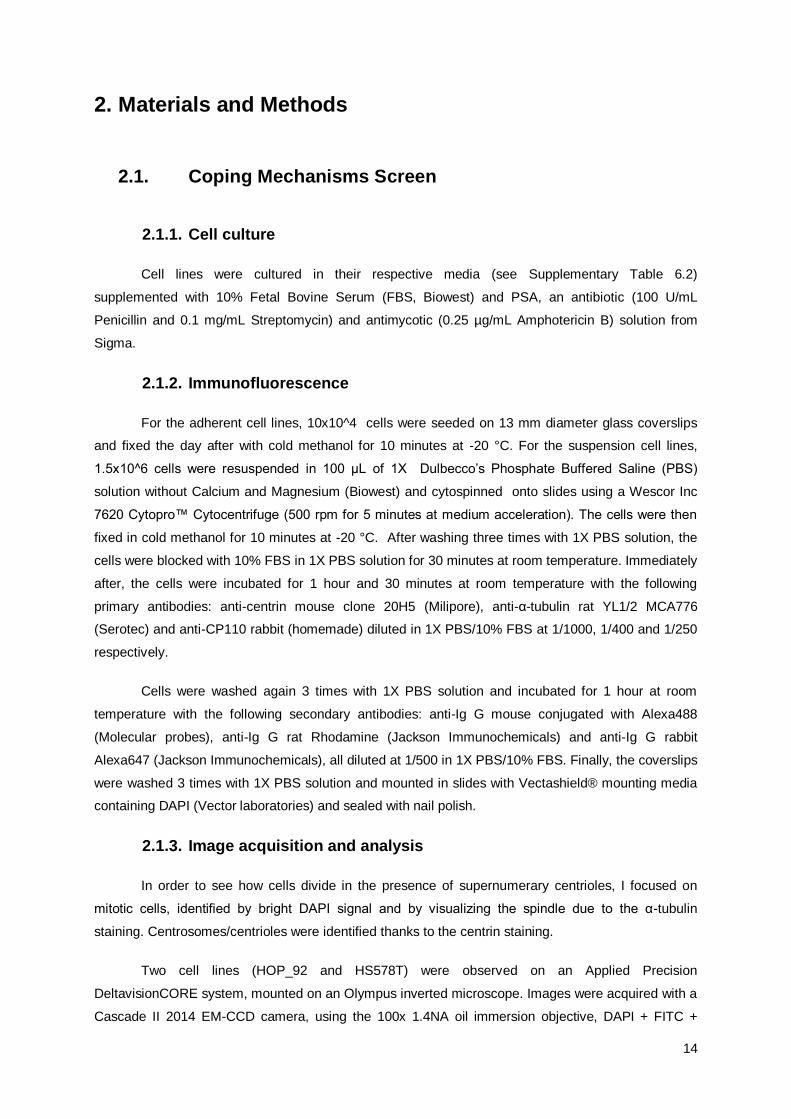
2.1.2. Immunofluorescence
For the adherent cell lines, 10x10^4 cells were seeded on 13 mm diameter glass coverslips
and fixed the day after with cold methanol for 10 minutes at -20 °C. For the suspension cell lines,
1.5x10^6 cells were resuspended in 100 µL of 1X Dulbecco’s Phosphate Buffered Saline (PBS)
solution without Calcium and Magnesium (Biowest) and cytospinned onto slides using a Wescor Inc
7620 Cytopro™ Cytocentrifuge (500 rpm for 5 minutes at medium acceleration). The cells were then
fixed in cold methanol for 10 minutes at -20 °C. After washing three times with 1X PBS solution, the
cells were blocked with 10% FBS in 1X PBS solution for 30 minutes at room temperature. Immediately
after, the cells were incubated for 1 hour and 30 minutes at room temperature with the following
primary antibodies: anti-centrin mouse clone 20H5 (Milipore), anti-α-tubulin rat YL1/2 MCA776
(Serotec) and anti-CP110 rabbit (homemade) diluted in 1X PBS/10% FBS at 1/1000, 1/400 and 1/250
respectively.
Cells were washed again 3 times with 1X PBS solution and incubated for 1 hour at room
temperature with the following secondary antibodies: anti-Ig G mouse conjugated with Alexa488
(Molecular probes), anti-Ig G rat Rhodamine (Jackson Immunochemicals) and anti-Ig G rabbit
Alexa647 (Jackson Immunochemicals), all diluted at 1/500 in 1X PBS/10% FBS. Finally, the coverslips
were washed 3 times with 1X PBS solution and mounted in slides with Vectashield® mounting media
containing DAPI (Vector laboratories) and sealed with nail polish.
2.1.3. Image acquisition and analysis
In order to see how cells divide in the presence of supernumerary centrioles, I focused on
mitotic cells, identified by bright DAPI signal and by visualizing the spindle due to the α-tubulin
staining. Centrosomes/centrioles were identified thanks to the centrin staining.
Two cell lines (HOP_92 and HS578T) were observed on an Applied Precision
DeltavisionCORE system, mounted on an Olympus inverted microscope. Images were acquired with a
Cascade II 2014 EM-CCD camera, using the 100x 1.4NA oil immersion objective, DAPI + FITC +
15
TRITC + Cy5 fluorescence filtersets. These images were then deconvolved with the Applied
Precision's softWorx software.
The remaining cell lines were observed on a commercial Nikon High Content Screening
microscope, based on Nikon Ti. Images were acquired with an Andor Zyla 4.2 sCMOS camera, using
a 100x 1.49NA oil immersion objective, DAPI + FITC + TRITC + Cy5 fluorescence filtersets and
controlled with the Nikon Elements software. These images were deconvolved with the AutoQuant X3
software. All the images were taken as Z-stacks in a range of 10-14 µm, with a distance between
planes of 0.2 µm.
The number of centrioles was quantified using the maximum intensity projections of the centrin
and CP110 stainings using FIJI (ImageJ) software. Only centrioles positive for both markers were
analyzed. 30 mitotic cells with centriole amplification (cells with >4 centrioles) were quantified per cell
line. Figures were built using Adobe Photoshop and Adobe Illustrator.
2.2. Live imaging
2.2.1. Generation of stable cell lines
To generate cell lines stably expressing a fluorescent centriolar marker, we transfected
5x10^6 cells of HS578T and Hop_92 with either 5 µg of pCMV-Centrin-GFP (with backbone pEGFP-
N1, kind gift from Andrew Fry), or a control plasmid to assess the transfection efficiency, pLJ499-
EYFP (kind gift from Lars Jansen’s laboratory), using the Neon® Transfection system. In a second
experiment, cells were co-transfected with 4 µg CMV-Centrin-GFP and 4 µg pJAG285-H2B-mRFP
(DNA marker, constructed by Jagesh Shah, Harvard Medical School, kind gift from Lars Jansen’s
laboratory), in order to obtain cells labelled for both centrioles and DNA. For HS587T we used the
following parameters: 1050 V Pulse voltage, 20 ms pulse width and 3 pulses113
. No protocol was
available for Hop_92, therefore we adapted the protocol of the lung cancer cell line A549114
, using the
following parameters: 1100 V Pulse voltage, 20 ms pulse width and 2 pulses.
As the centrin-GFP plasmid carries a geneticin-resistance gene, the stably transfected cells
were selected during 14 days with 100 µg/mL Geneticin (Gibco) for HS578T and 250 µg/mL for
Hop_92. These concentrations were previously established, to induce death of 100% of the non-
transfected cells after 14 days of treatment (Supplementary Figure 6.1). After the two weeks of
selection, we reduced the concentration of geneticin to half, to maintain our stable cell lines
expressing centrin-GFP.
For the cells co-transfected with centrin-GFP and H2B-mRFP, an additional step of selection
was performed, using Fluorescence-Activated Cell Sorting (FACS) (Supplementary Figure 6.2). For
this purpose, cells were resupended in a 1X PBS solution with 10% FBS. All the cells presenting red
16
fluorescence were selected at the MoFlo (Dako Cytomation) cytometer, and the data was analyzed
with the Dako Summit v4.3® software.
To estimate the percentage of cells expressing centrin-GFP and/or H2B-mRFP
(Supplementary Figure 6.3), cells were prepared for immunofluorescence as described in 2.1.2 with
slight modifications. For the primary antibodies, the coverslips were incubated with CP110 antibody
and/or GFP-booster (Chromotek), diluted in 1X PBS/10% FBS at 1/250 and 1/200, respectively.
Regarding the secondary antibodies, coverslips were incubated with anti-IgG rabbit antibodies,
conjugated with either Rhodamin (Jackson Immunochemicals) for the cells only transfected with
centrin-GFP, or Alexa 647 for the double-transfected cells, both diluted 1/500 in 1X PBS/10% FBS.
2.2.2. Cell synchronization
2.2.2.1. Mitotic shake-off
In order to increase the mitotic cell population, mitotic cells were collected through a mitotic
shake-off, i.e. taping and shaking of the flask115
. For live imaging, 7x10^4 cells were seeded in 35 mm
glass bottom dishes (MAtTEK) in Leibovitz’s L-15 medium, supplemented with 10% FBS and PSA
(see 2.1.1), to be imaged 2 days after. To follow the quality of the cell synchronization, cells were
seeded in a 6-well plate for flow cytometry (2.2.2.3). Three time-points were collected for Flow
Cytometry: T0=an asynchronous/control population (cells before the shake-off), T1=cells after the
mitotic shake-off and T2=cells of the following mitosis, which should be more or less 53.8 hours
after116
.
2.2.2.2. S-phase arrest
Another synchronization method was tested to increase the mitotic cells population, namely
cells were first arrested in S-phase and then released into mitosis117
. For this purpose, 15x10^4
HS578T centrin-GFP H2B-mRFP cells were seeded either in 6-well plates for Flow Cytometry
(2.2.2.3), to follow the quality of synchronization, or in 35 mm glass bottom dishes for live imaging. To
arrest in S-phase, cells were treated the day after seeding for 19 hours with 2 mM thymidine (Sigma)
and then released for 11.5 hours with 24 µM deoxycytidine (Sigma) after washing 3 times with 1X PBS
for 5 minutes and 2 times with the respective medium (see Supplementary Table 6.2). After 8 hours,
cells were imaged. Throughout the treatment several time-points for flow cytometry were taken: T0=19
hours after thymidine treatment, T1=4 hours after release, T2=8 hours after release, T3=11.5 hours
after release and an asynchronous/control population (cells before treatment).
2.2.2.3. Flow cytometry
Cells that were collected at several time points were centrifuged at 1000 rpm for 5 minutes
and resuspended in 10% 1X PBS solution in 70% EtOH. After 30 minutes of incubation at 4 °C, cells
were centrifuged, washed in 1X PBS, centrifuged and finally incubated for 30 minutes at 37 °C in a 1X
17
PBS solution with 1% Propidium Iodide (Sigma) and 0.1% RNase A (Qiagen). The samples DNA
content was acquired in a FACScan (Becton Dickinson) cytometer, plotted and analyzed on FlowJo
(Tree Star Inc.).
2.2.3. Live-cell imaging
Cells were grown in 35 mm glass bottom dishes in Leibovitz’s L-15 medium, supplemented
with 10% FBS and PSA (see 2.1.1). 2 hours before imaging, 100 nM of the microtubule label SiR-
tubulin (Spyrochrome) was added to the cells. Live imaging was performed on the Applied Precision
DeltavisionCORE system and on the Roper TIRF microscope, based on the Nikon Eclipse Ti-E. On
this last microscope, images were acquired with a Photometrics 512 EMCCD camera, using a 100x
1.49NA oil immersion objective, FITC + TRITC + Cy5 fluorescence filtersets and controlled with the
Metamorph software. The images were taken as Z-stacks in a range of 15-30 µm, with a distance
between planes of 0.3 µm for a 10 minute interval during 2 hours.
18
3. Results
3.1. Previous work
To study centrosome abnormalities in cancer, our laboratory previously performed a
systematic survey of centriole number and structure in a set of 60 human cancer cell lines derived
from 9 tissues (NCI-60, see Supplementary Table 6.1). The study was executed in two parts,
denominated the primary and the secondary screen.
The primary screen was performed to quantify centriole number and length in the
aforementioned 60 cancer cell lines and a control non-cancerous cell line, Retinal Pigment
Epithelium (RPE). To minimize variability in length and number, this survey focused on mitotic
cells since they have a fixed number (4) of fully elongated centrioles. For this purpose cells
were stained with a centrin antibody to label the centrioles and with two other markers useful
to identify mitotic cells: a α-tubulin antibody that labels the microtubules of the mitotic spindle
and DAPI to stain DNA. To quantify centriole number and length, 50 to 60
immunofluorescence images of mitotic cells were taken for each cell line.
The secondary screen was executed to validate the centrosome abnormalities observed in the
primary screen. For this screen, a second centriolar marker, CP110, was used in all the cell
lines with abnormalities (52 out of the 60 cell lines of the NCI60 panel, see Supplementary
Table 6.1) to ascertain that the centrin-positive structure observed in the primary screen are
bona fide centrioles.
Altogether, these two screens showed that defects in centrosome number and length, are
present in many of the cancer types and that centriole elongation is a novel cause of centrosome
amplification in cancer. Moreover, this study also suggested that centrosome clustering is a major, but
not the only coping mechanism in cells with supernumerary centrosomes. Additionally, the importance
of a second centriolar marker was established, since some cell lines had a significant difference in
centriole number when comparing the primary with the secondary screen.
The frequency of centrosome clustering still remains undetermined and the existence of
alternative mechanisms has not been studied in cancer cells. Based on the results of the screening,
the main questions of my Master’s thesis project were to understand:
1) How widespread is centrosome clustering in cancer?
2) How widespread are alternative coping mechanisms?
3) How do cells that have centriole amplification and lack clustering ability divide?
19
3.2. How widespread is centrosome clustering in the NCI-60
cell line panel?
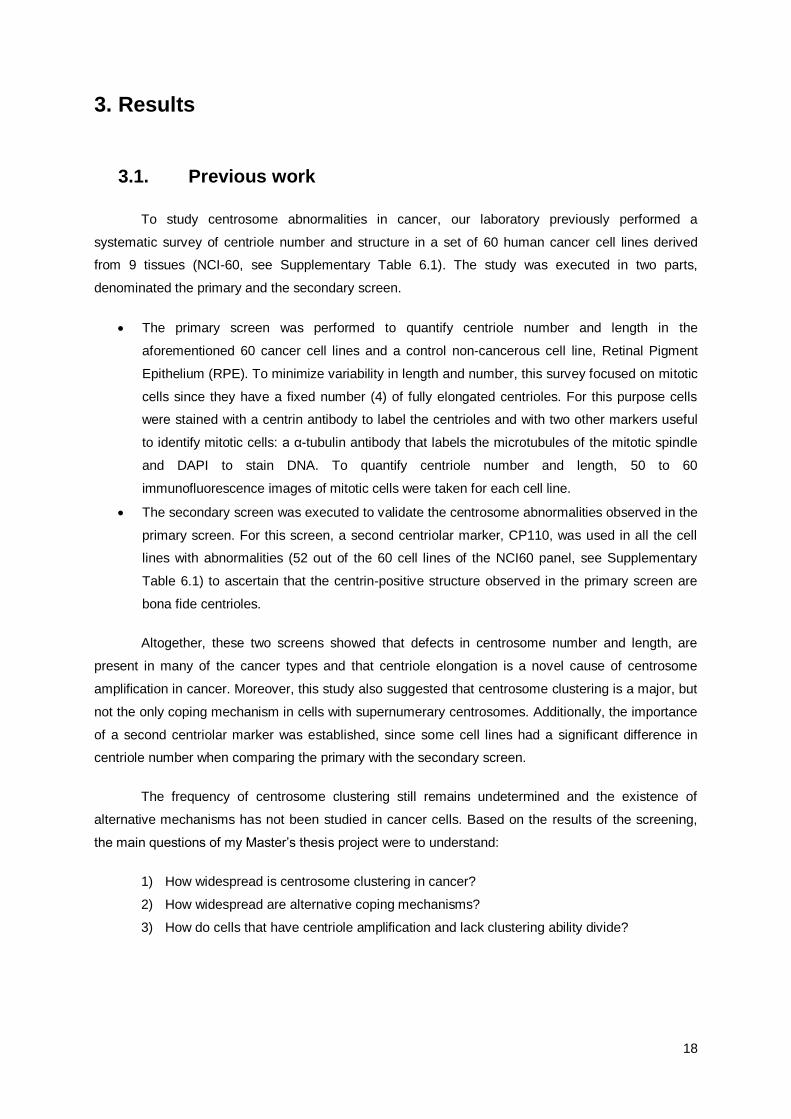
The first aim of my thesis was to determine how widespread centrosome clustering is in
cancer. As explained previously, clustering is the gathering of supernumerary centrosomes in two
opposite poles in order to form a pseudo-bipolar spindle92
(Figure 3.1).
Figure 3.1 – Scheme of centrosome clustering. Centrosome clustering is a coping mechanism in which cells gather their supernumerary centrosomes in two opposite poles in order to form a bipolar spindle.
3.2.1. Strategy
In order to determine how widespread clustering is in the NCI-60, I scored all the
immunofluorescence images of the secondary screen (2957 images) manually (see Material and
Methods section for details). For each cell, I annotated the number of centrioles, i.e. co-localization
between centrin and CP110 markers, the number of poles and the number of centrioles per pole. I
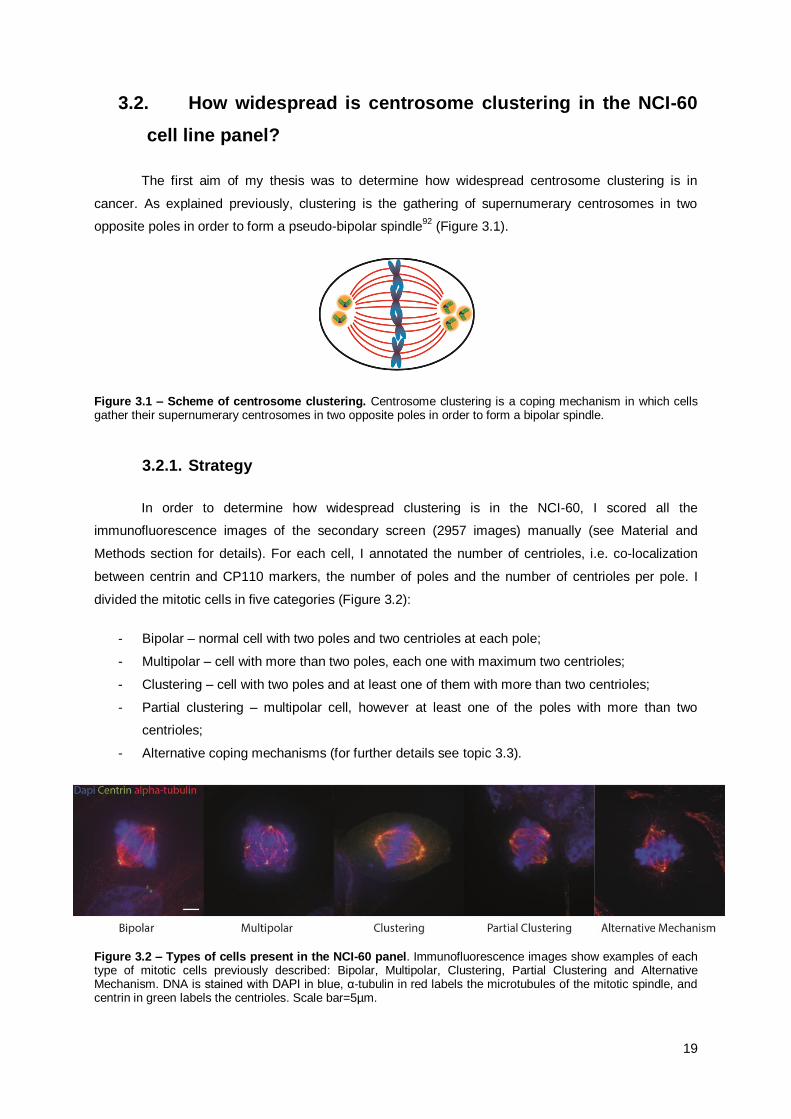
divided the mitotic cells in five categories (Figure 3.2):
- Bipolar – normal cell with two poles and two centrioles at each pole;
- Multipolar – cell with more than two poles, each one with maximum two centrioles;
- Clustering – cell with two poles and at least one of them with more than two centrioles;
- Partial clustering – multipolar cell, however at least one of the poles with more than two
centrioles;
- Alternative coping mechanisms (for further details see topic 3.3).
Figure 3.2 – Types of cells present in the NCI-60 panel. Immunofluorescence images show examples of each type of mitotic cells previously described: Bipolar, Multipolar, Clustering, Partial Clustering and Alternative Mechanism. DNA is stained with DAPI in blue, α-tubulin in red labels the microtubules of the mitotic spindle, and centrin in green labels the centrioles. Scale bar=5µm.
20
After grouping all the 2957 cells in their respective categories, I calculated the percentage of
cells with the ability to cluster, at least partially, supernumerary centrioles in each cell line (Figure 3.3).
3.2.2. Clustering is widespread in cancer
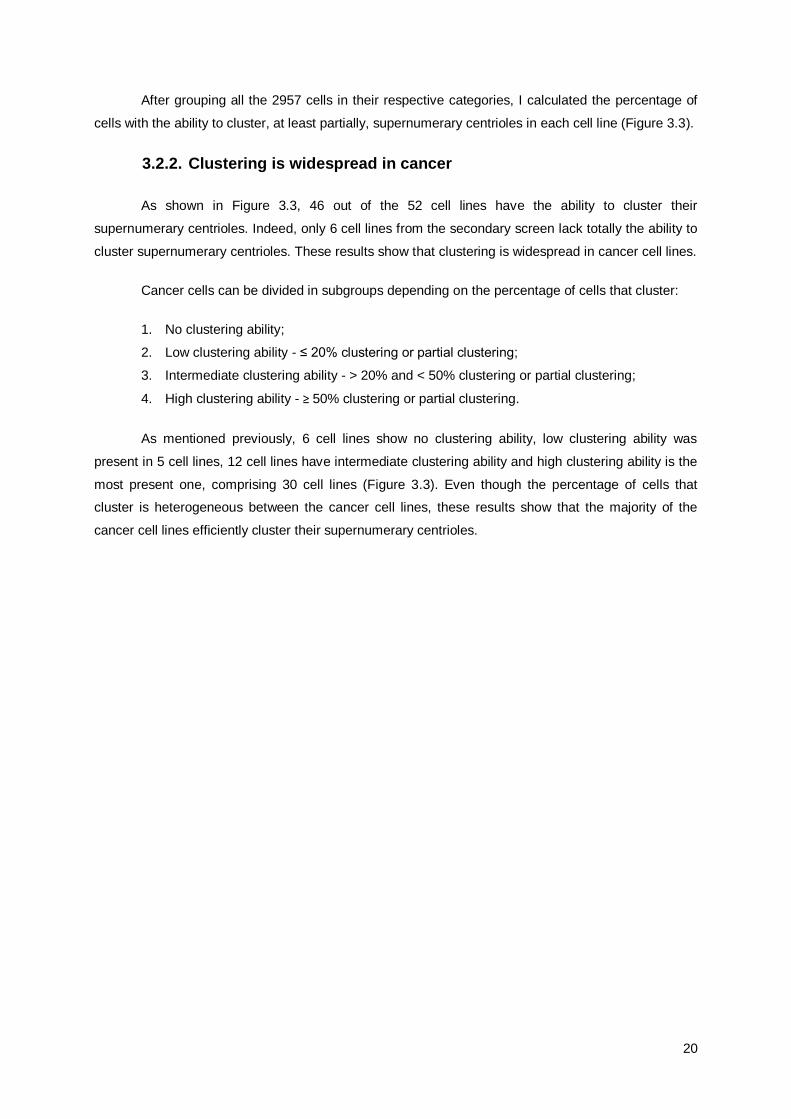
As shown in Figure 3.3, 46 out of the 52 cell lines have the ability to cluster their
supernumerary centrioles. Indeed, only 6 cell lines from the secondary screen lack totally the ability to
cluster supernumerary centrioles. These results show that clustering is widespread in cancer cell lines.
Cancer cells can be divided in subgroups depending on the percentage of cells that cluster:
1. No clustering ability;
2. Low clustering ability - ≤ 20% clustering or partial clustering;
3. Intermediate clustering ability - > 20% and < 50% clustering or partial clustering;
4. High clustering ability - ≥ 50% clustering or partial clustering.
As mentioned previously, 6 cell lines show no clustering ability, low clustering ability was
present in 5 cell lines, 12 cell lines have intermediate clustering ability and high clustering ability is the
most present one, comprising 30 cell lines (Figure 3.3). Even though the percentage of cells that
cluster is heterogeneous between the cancer cell lines, these results show that the majority of the
cancer cell lines efficiently cluster their supernumerary centrioles.
21
Figure 3.3 – Clustering is widespread in cancer. A) Representative immunofluorescence images of the different types of mitosis observed in the cell lines. RPE, the control, with a bipolar spindle, HOP_92, a cell line without clustering ability and the cell lines SKMEL_28 and MDA_MB_435 with high clustering ability. DNA is stained with DAPI in blue, α-tubulin in red labels the microtubules of the mitotic spindle, and centrin in green labels the centrioles. Scale bar=5µm. B) This graph shows the clustering and partial clustering percentages of all the 52 cell lines from the secondary screen and the control cell line RPE. “N” refers to the amount of cells with amplification, used to calculate the percentages, of the total of mitotic cells used for the secondary screen. The categories show different clustering abilities: no, low (≤20%), intermediate (>20% and <50%) and high clustering ability (≥50%).
Unfortunately, in most of the cell lines, the number of cells with centriole amplification is too
low to reach statistical significance. To circumvent this problem, I used the biological material from the
secondary screen to take 30 immunofluorescence images exclusively of mitotic cells with centrosome
amplification for most of the cell lines except HOP_62, COLO205 and HL_60 (a sufficient number of
cells in mitosis with amplification was already reached in the secondary screen). In addition, as some
cell lines showed very little amplification (1 or 2 cells), I focused on the cell lines with more than 10%
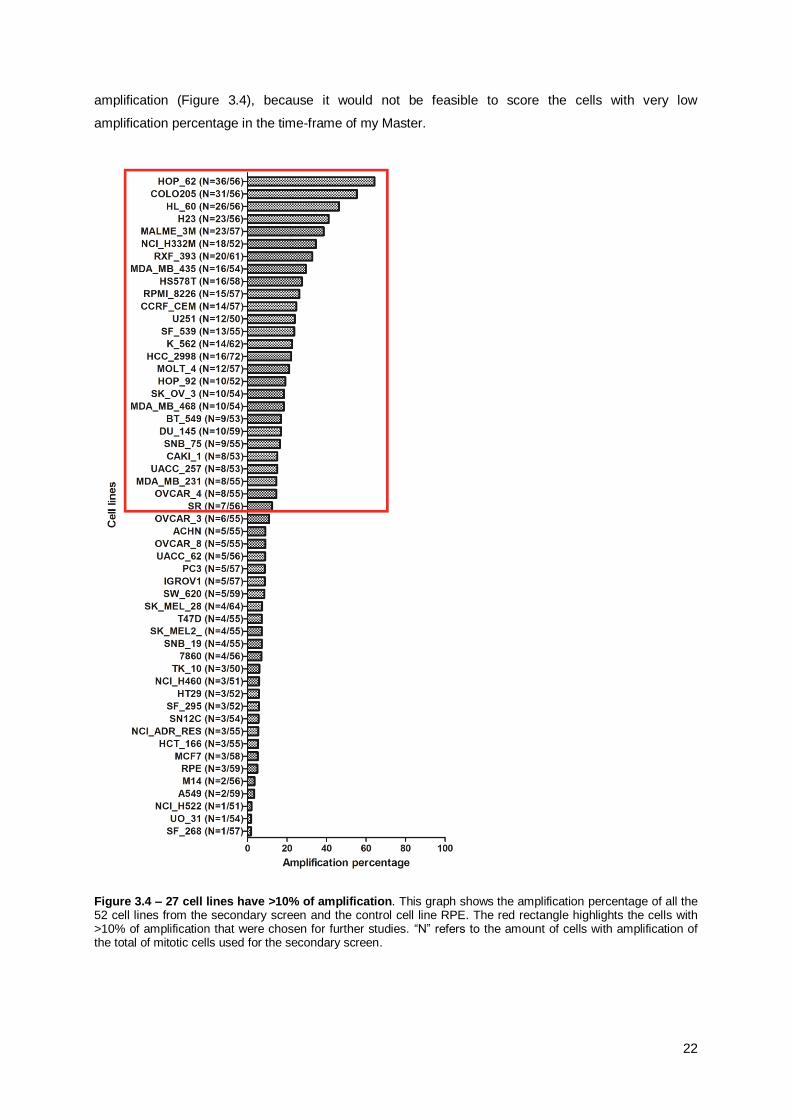
22
amplification (Figure 3.4), because it would not be feasible to score the cells with very low
amplification percentage in the time-frame of my Master.
Figure 3.4 – 27 cell lines have >10% of amplification. This graph shows the amplification percentage of all the 52 cell lines from the secondary screen and the control cell line RPE. The red rectangle highlights the cells with >10% of amplification that were chosen for further studies. “N” refers to the amount of cells with amplification of the total of mitotic cells used for the secondary screen.
23
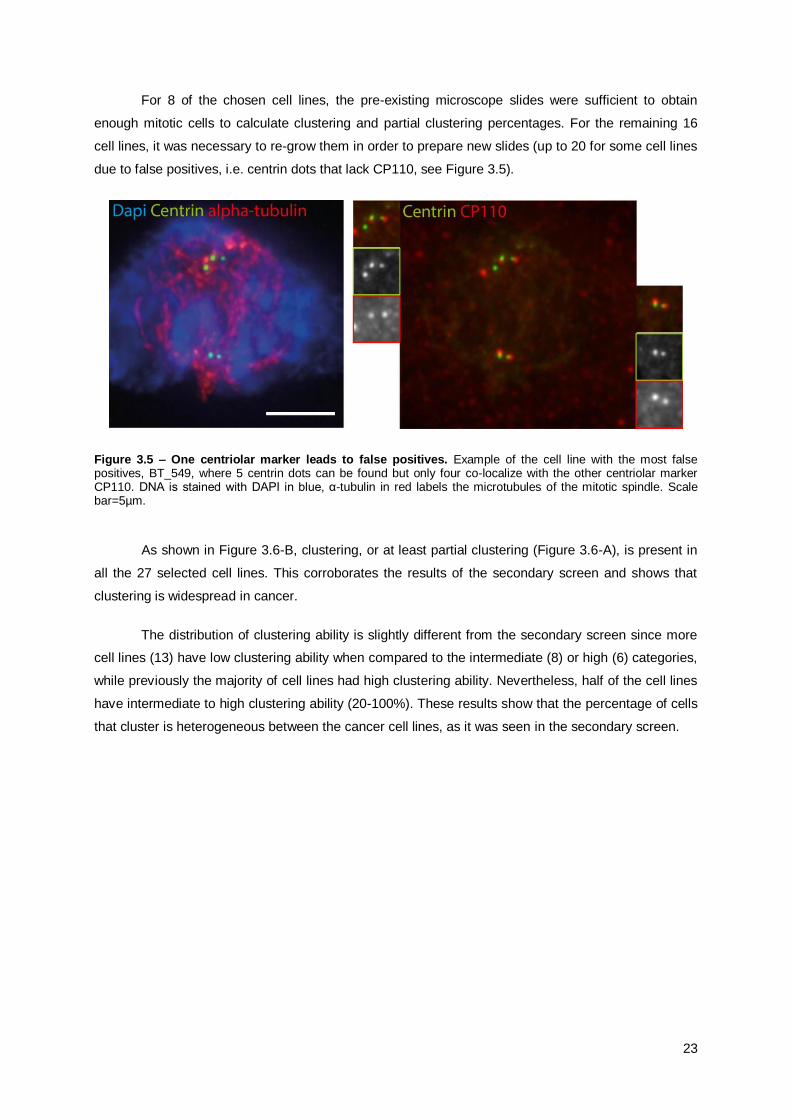
For 8 of the chosen cell lines, the pre-existing microscope slides were sufficient to obtain
enough mitotic cells to calculate clustering and partial clustering percentages. For the remaining 16
cell lines, it was necessary to re-grow them in order to prepare new slides (up to 20 for some cell lines
due to false positives, i.e. centrin dots that lack CP110, see Figure 3.5).
Figure 3.5 – One centriolar marker leads to false positives. Example of the cell line with the most false positives, BT_549, where 5 centrin dots can be found but only four co-localize with the other centriolar marker CP110. DNA is stained with DAPI in blue, α-tubulin in red labels the microtubules of the mitotic spindle. Scale bar=5µm.
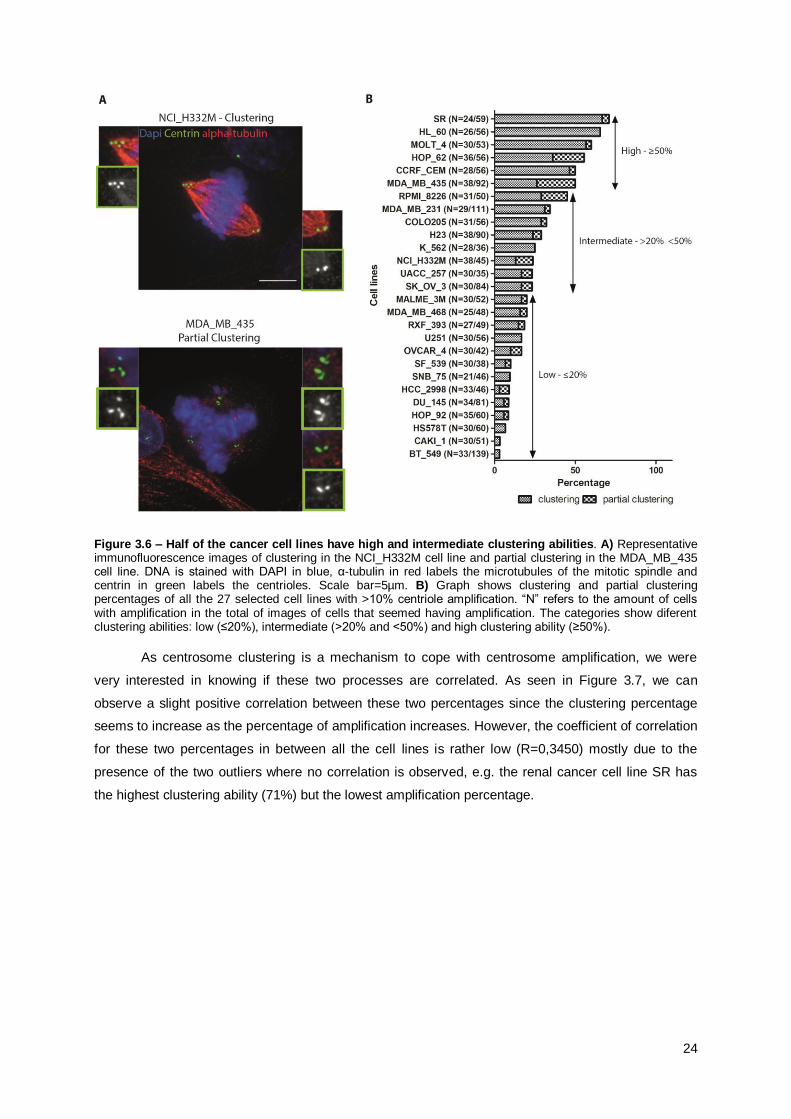
As shown in Figure 3.6-B, clustering, or at least partial clustering (Figure 3.6-A), is present in
all the 27 selected cell lines. This corroborates the results of the secondary screen and shows that
clustering is widespread in cancer.
The distribution of clustering ability is slightly different from the secondary screen since more
cell lines (13) have low clustering ability when compared to the intermediate (8) or high (6) categories,
while previously the majority of cell lines had high clustering ability. Nevertheless, half of the cell lines
have intermediate to high clustering ability (20-100%). These results show that the percentage of cells
that cluster is heterogeneous between the cancer cell lines, as it was seen in the secondary screen.
24
Figure 3.6 – Half of the cancer cell lines have high and intermediate clustering abilities. A) Representative immunofluorescence images of clustering in the NCI_H332M cell line and partial clustering in the MDA_MB_435 cell line. DNA is stained with DAPI in blue, α-tubulin in red labels the microtubules of the mitotic spindle and centrin in green labels the centrioles. Scale bar=5µm. B) Graph shows clustering and partial clustering percentages of all the 27 selected cell lines with >10% centriole amplification. “N” refers to the amount of cells with amplification in the total of images of cells that seemed having amplification. The categories show diferent clustering abilities: low (≤20%), intermediate (>20% and <50%) and high clustering ability (≥50%).
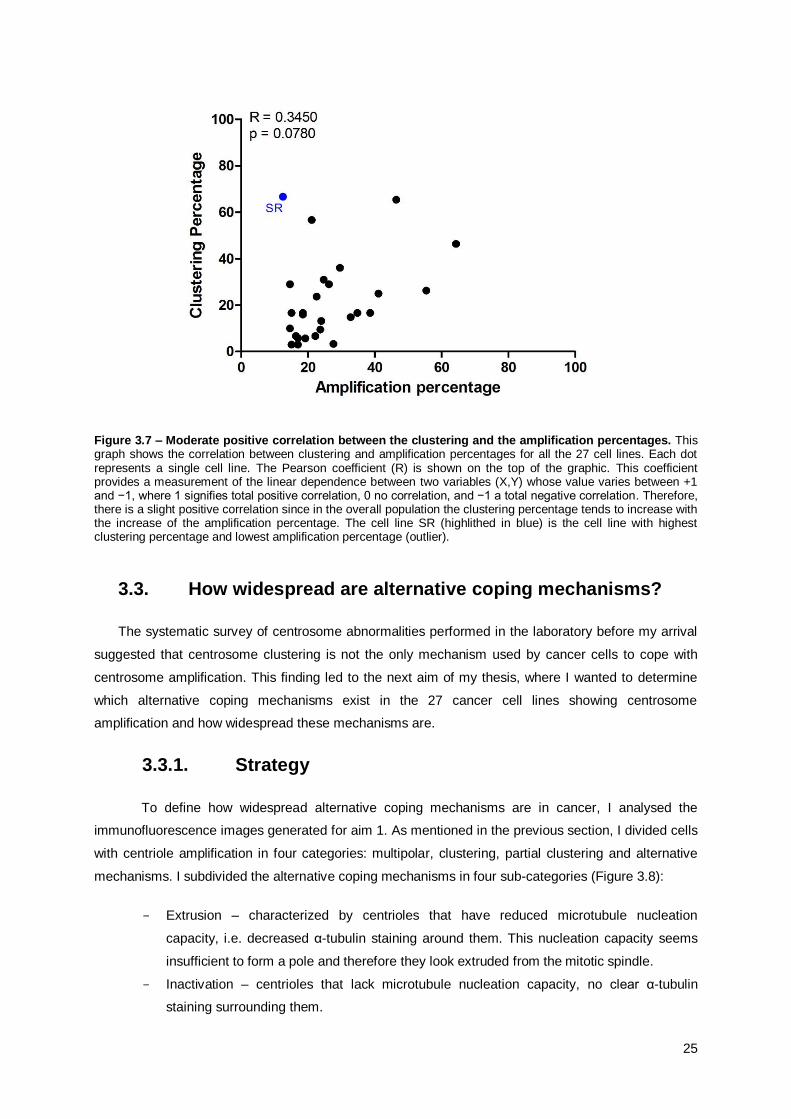
As centrosome clustering is a mechanism to cope with centrosome amplification, we were
very interested in knowing if these two processes are correlated. As seen in Figure 3.7, we can
observe a slight positive correlation between these two percentages since the clustering percentage
seems to increase as the percentage of amplification increases. However, the coefficient of correlation
for these two percentages in between all the cell lines is rather low (R=0,3450) mostly due to the
presence of the two outliers where no correlation is observed, e.g. the renal cancer cell line SR has
the highest clustering ability (71%) but the lowest amplification percentage.
25
Figure 3.7 – Moderate positive correlation between the clustering and the amplification percentages. This graph shows the correlation between clustering and amplification percentages for all the 27 cell lines. Each dot represents a single cell line. The Pearson coefficient (R) is shown on the top of the graphic. This coefficient provides a measurement of the linear dependence between two variables (X,Y) whose value varies between +1 and −1, where 1 signifies total positive correlation, 0 no correlation, and −1 a total negative correlation. Therefore, there is a slight positive correlation since in the overall population the clustering percentage tends to increase with the increase of the amplification percentage. The cell line SR (highlithed in blue) is the cell line with highest clustering percentage and lowest amplification percentage (outlier).
3.3. How widespread are alternative coping mechanisms?
The systematic survey of centrosome abnormalities performed in the laboratory before my arrival
suggested that centrosome clustering is not the only mechanism used by cancer cells to cope with
centrosome amplification. This finding led to the next aim of my thesis, where I wanted to determine
which alternative coping mechanisms exist in the 27 cancer cell lines showing centrosome
amplification and how widespread these mechanisms are.
3.3.1. Strategy
To define how widespread alternative coping mechanisms are in cancer, I analysed the
immunofluorescence images generated for aim 1. As mentioned in the previous section, I divided cells
with centriole amplification in four categories: multipolar, clustering, partial clustering and alternative
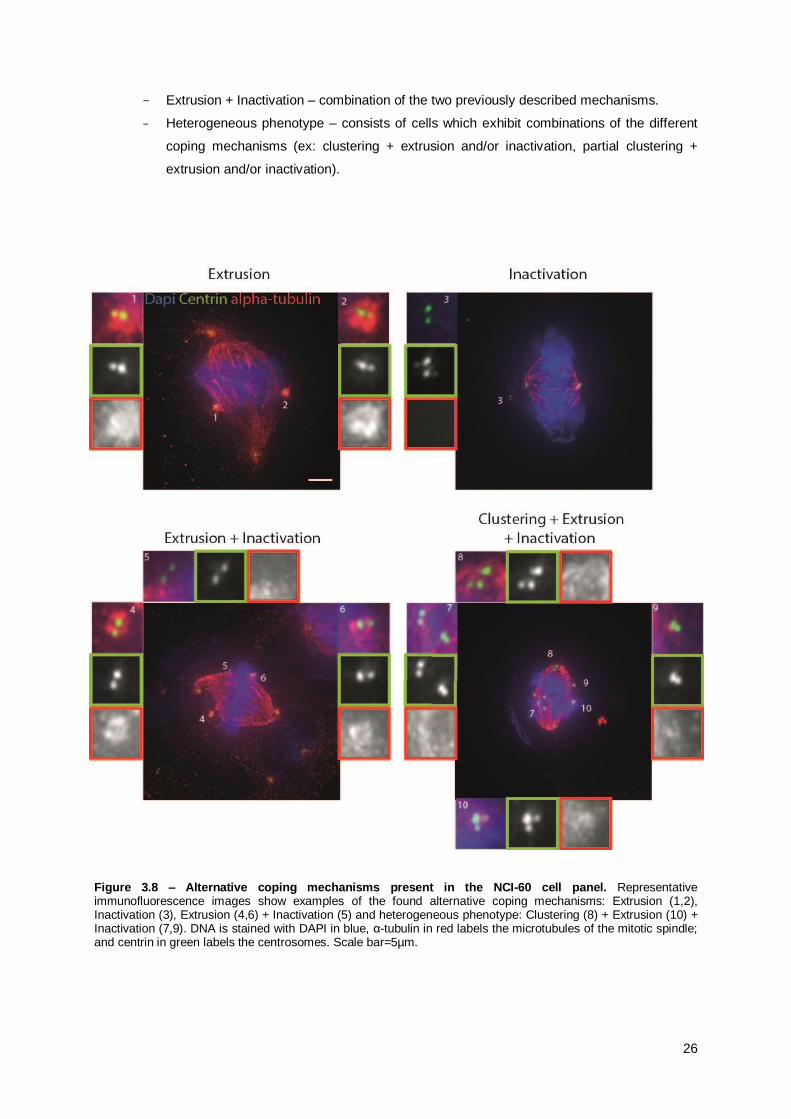
mechanisms. I subdivided the alternative coping mechanisms in four sub-categories (Figure 3.8):
- Extrusion – characterized by centrioles that have reduced microtubule nucleation
capacity, i.e. decreased α-tubulin staining around them. This nucleation capacity seems
insufficient to form a pole and therefore they look extruded from the mitotic spindle.
- Inactivation – centrioles that lack microtubule nucleation capacity, no clear α-tubulin
staining surrounding them.
26
- Extrusion + Inactivation – combination of the two previously described mechanisms.
- Heterogeneous phenotype – consists of cells which exhibit combinations of the different
coping mechanisms (ex: clustering + extrusion and/or inactivation, partial clustering +
extrusion and/or inactivation).
Figure 3.8 – Alternative coping mechanisms present in the NCI-60 cell panel. Representative immunofluorescence images show examples of the found alternative coping mechanisms: Extrusion (1,2), Inactivation (3), Extrusion (4,6) + Inactivation (5) and heterogeneous phenotype: Clustering (8) + Extrusion (10) + Inactivation (7,9). DNA is stained with DAPI in blue, α-tubulin in red labels the microtubules of the mitotic spindle; and centrin in green labels the centrosomes. Scale bar=5µm.
27
3.3.2. Alternative coping mechanisms are widespread in
cancer
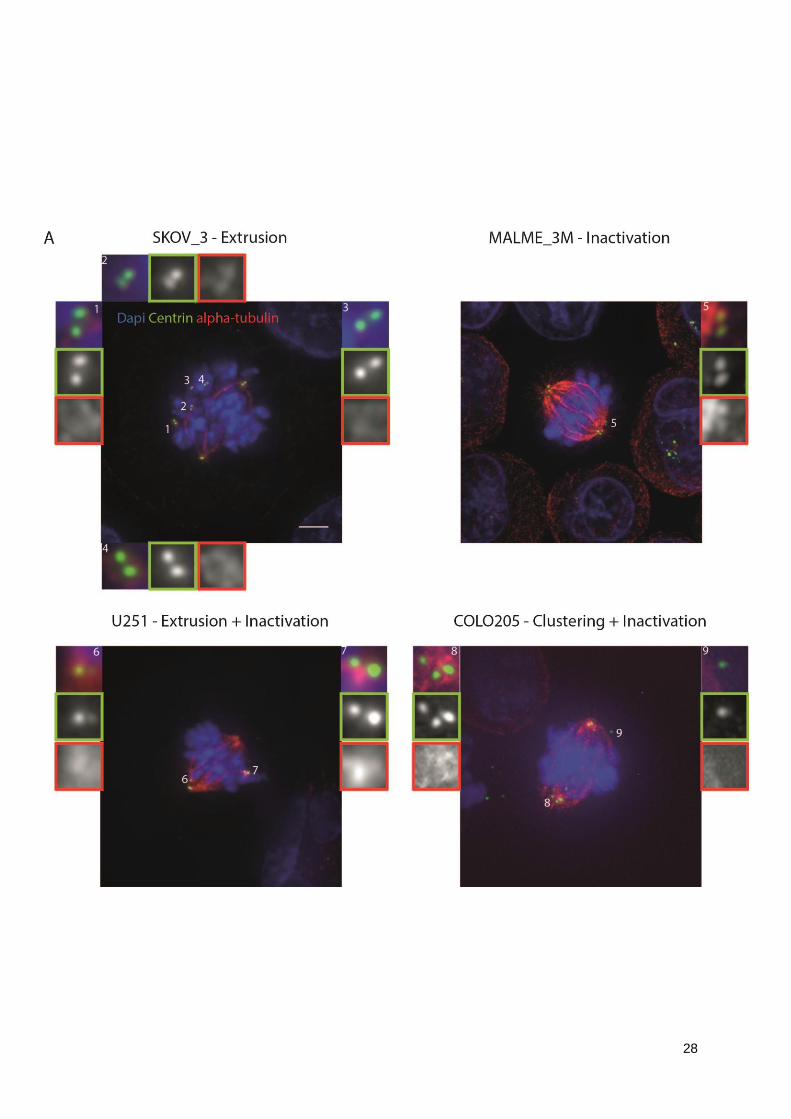
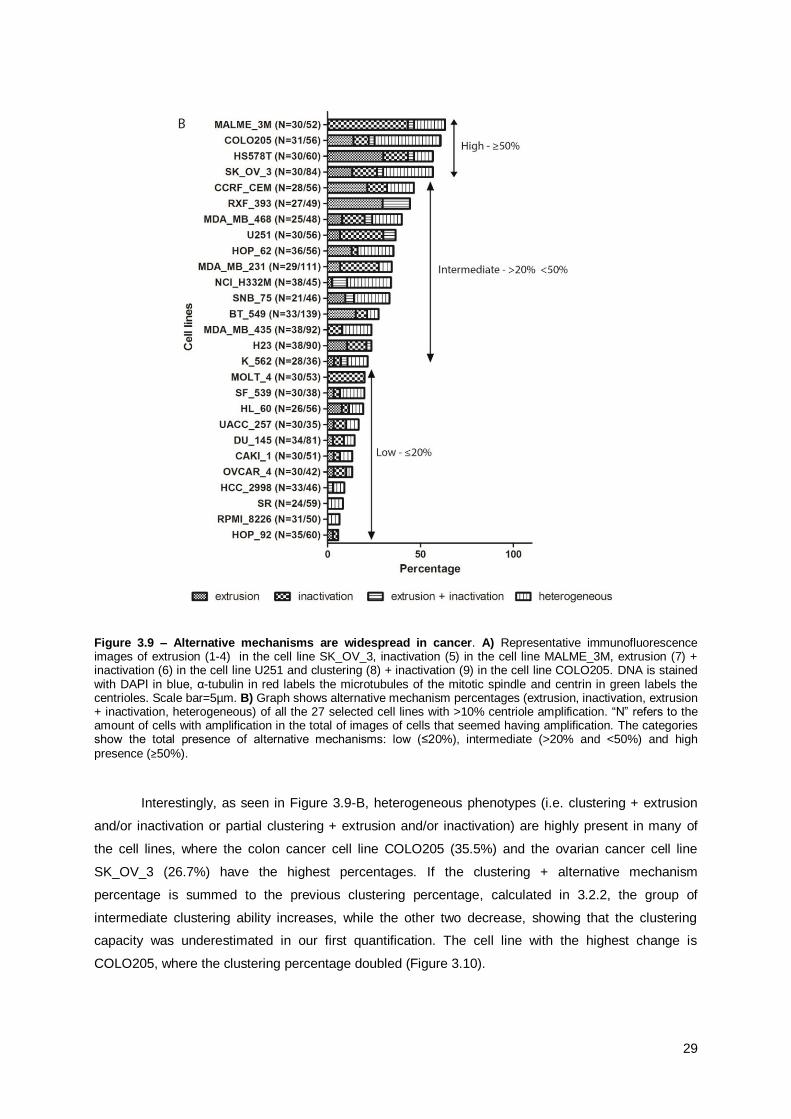
As shown in Figure 3.9-B, all the 27 cancer cell lines present alternative mechanisms to cope
with their supernumerary centrosomes.
The cell lines can be sub-divided in different categories according to their total percentage of
alternative mechanisms:
1. 0%: No presence of alternative mechanisms;
2. ≤ 20%: Low presence of alternative mechanisms;
3. > 20% and < 50%: Intermediate presence of alternative mechanisms;
4. ≥ 50%: High presence of alternative mechanisms.
None of the 27 cell lines had absence of alternative mechanism, 11 cell lines had low
presence, 12 had intermediate and 4 had high presence of alternative mechanisms. Altogether these
results show that the presence of alternative mechanisms to cope with centrosome amplification,
namely inactivation and extrusion, is widespread in cancer cells.
Extrusion is highly present in the breast cancer cell line HS578T (30%) and renal cancer cell
line RXF_393 (29.6%). The melanoma cell line MALME_3M (Figure 3.9-B) is the cell line with the
highest incidence of inactivation (43.3%). The combination of extrusion and inactivation is rather rare,
having RXF_393 the highest percentage (14.8%).
28
29
Figure 3.9 – Alternative mechanisms are widespread in cancer. A) Representative immunofluorescence images of extrusion (1-4) in the cell line SK_OV_3, inactivation (5) in the cell line MALME_3M, extrusion (7) + inactivation (6) in the cell line U251 and clustering (8) + inactivation (9) in the cell line COLO205. DNA is stained with DAPI in blue, α-tubulin in red labels the microtubules of the mitotic spindle and centrin in green labels the centrioles. Scale bar=5µm. B) Graph shows alternative mechanism percentages (extrusion, inactivation, extrusion + inactivation, heterogeneous) of all the 27 selected cell lines with >10% centriole amplification. “N” refers to the amount of cells with amplification in the total of images of cells that seemed having amplification. The categories show the total presence of alternative mechanisms: low (≤20%), intermediate (>20% and <50%) and high
presence (≥50%).
Interestingly, as seen in Figure 3.9-B, heterogeneous phenotypes (i.e. clustering + extrusion
and/or inactivation or partial clustering + extrusion and/or inactivation) are highly present in many of
the cell lines, where the colon cancer cell line COLO205 (35.5%) and the ovarian cancer cell line
SK_OV_3 (26.7%) have the highest percentages. If the clustering + alternative mechanism
percentage is summed to the previous clustering percentage, calculated in 3.2.2, the group of
intermediate clustering ability increases, while the other two decrease, showing that the clustering
capacity was underestimated in our first quantification. The cell line with the highest change is
COLO205, where the clustering percentage doubled (Figure 3.10).
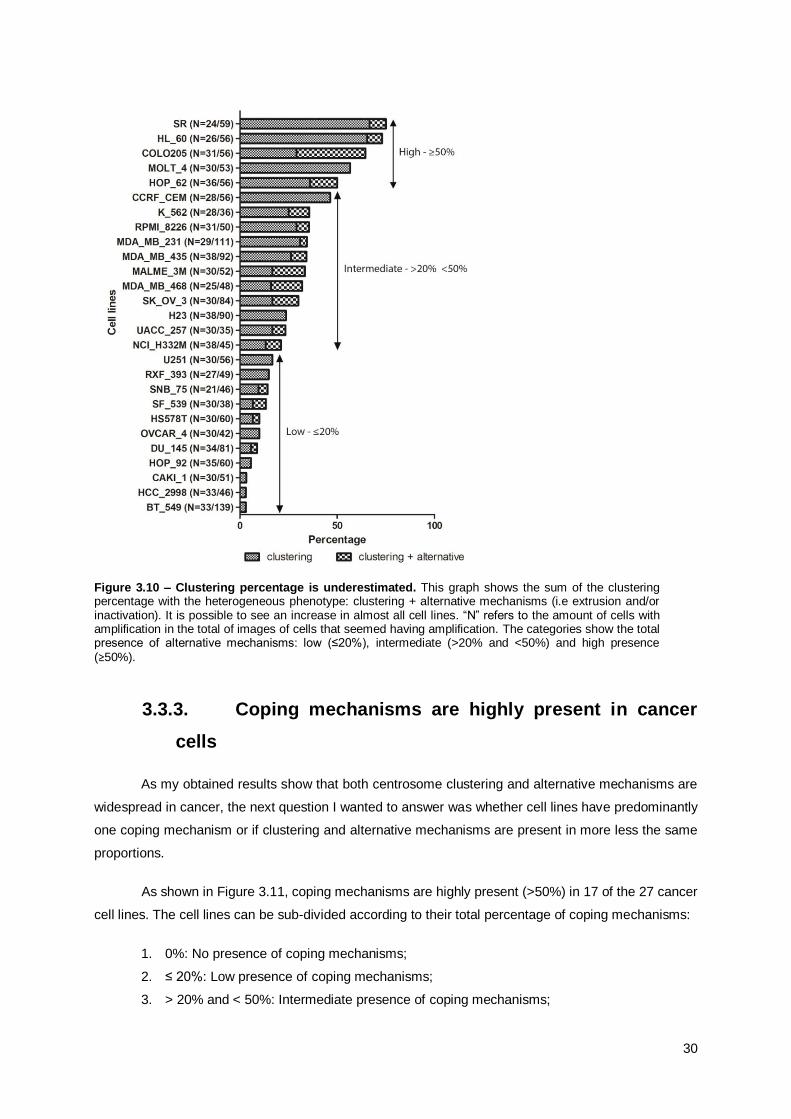
30
Figure 3.10 – Clustering percentage is underestimated. This graph shows the sum of the clustering percentage with the heterogeneous phenotype: clustering + alternative mechanisms (i.e extrusion and/or inactivation). It is possible to see an increase in almost all cell lines. “N” refers to the amount of cells with amplification in the total of images of cells that seemed having amplification. The categories show the total presence of alternative mechanisms: low (≤20%), intermediate (>20% and <50%) and high presence
(≥50%).
3.3.3. Coping mechanisms are highly present in cancer
cells
As my obtained results show that both centrosome clustering and alternative mechanisms are
widespread in cancer, the next question I wanted to answer was whether cell lines have predominantly
one coping mechanism or if clustering and alternative mechanisms are present in more less the same
proportions.
As shown in Figure 3.11, coping mechanisms are highly present (>50%) in 17 of the 27 cancer
cell lines. The cell lines can be sub-divided according to their total percentage of coping mechanisms:
1. 0%: No presence of coping mechanisms;
2. ≤ 20%: Low presence of coping mechanisms;
3. > 20% and < 50%: Intermediate presence of coping mechanisms;
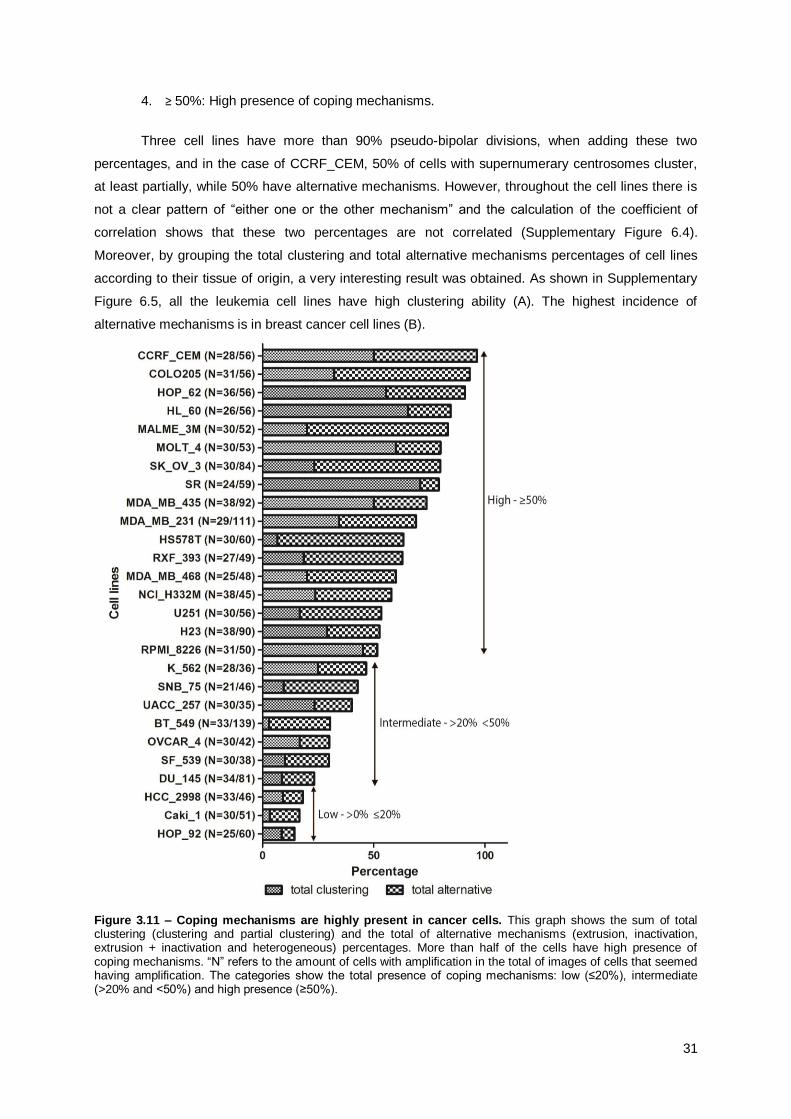
31
4. ≥ 50%: High presence of coping mechanisms.
Three cell lines have more than 90% pseudo-bipolar divisions, when adding these two
percentages, and in the case of CCRF_CEM, 50% of cells with supernumerary centrosomes cluster,
at least partially, while 50% have alternative mechanisms. However, throughout the cell lines there is
not a clear pattern of “either one or the other mechanism” and the calculation of the coefficient of
correlation shows that these two percentages are not correlated (Supplementary Figure 6.4).
Moreover, by grouping the total clustering and total alternative mechanisms percentages of cell lines
according to their tissue of origin, a very interesting result was obtained. As shown in Supplementary
Figure 6.5, all the leukemia cell lines have high clustering ability (A). The highest incidence of
alternative mechanisms is in breast cancer cell lines (B).
Figure 3.11 – Coping mechanisms are highly present in cancer cells. This graph shows the sum of total clustering (clustering and partial clustering) and the total of alternative mechanisms (extrusion, inactivation, extrusion + inactivation and heterogeneous) percentages. More than half of the cells have high presence of coping mechanisms. “N” refers to the amount of cells with amplification in the total of images of cells that seemed having amplification. The categories show the total presence of coping mechanisms: low (≤20%), intermediate (>20% and <50%) and high presence (≥50%).
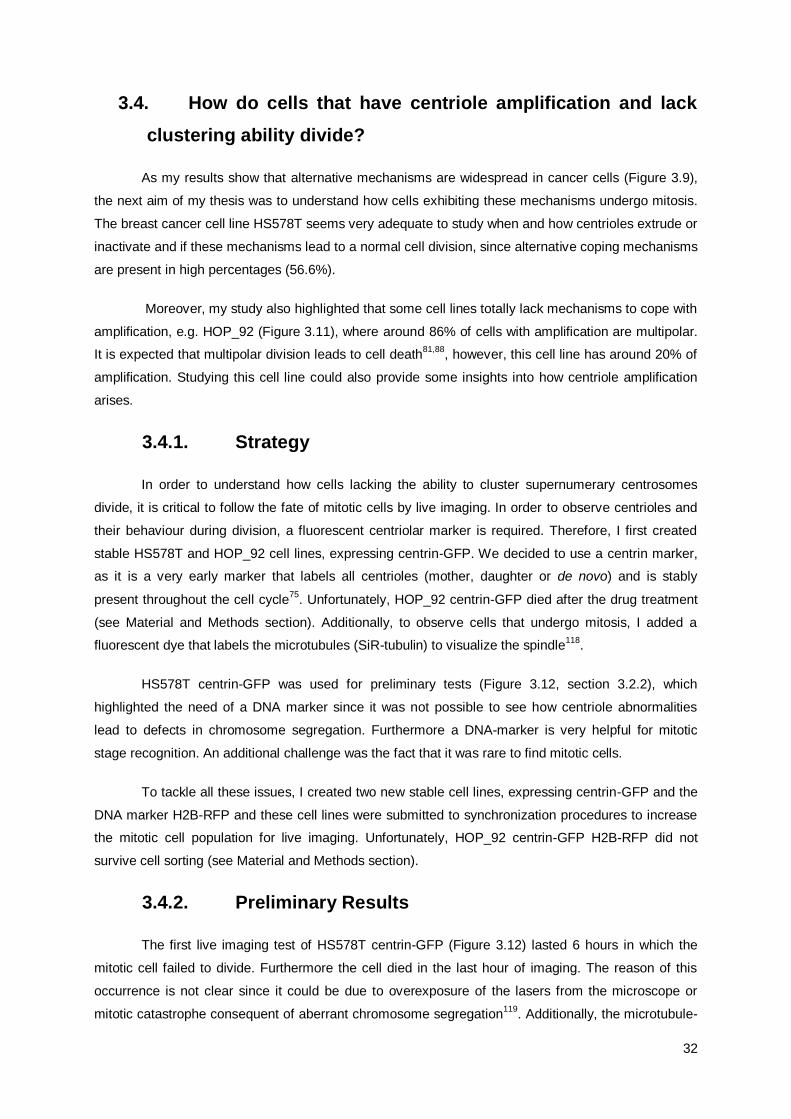
32
3.4. How do cells that have centriole amplification and lack
clustering ability divide?
As my results show that alternative mechanisms are widespread in cancer cells (Figure 3.9),
the next aim of my thesis was to understand how cells exhibiting these mechanisms undergo mitosis.
The breast cancer cell line HS578T seems very adequate to study when and how centrioles extrude or
inactivate and if these mechanisms lead to a normal cell division, since alternative coping mechanisms
are present in high percentages (56.6%).
Moreover, my study also highlighted that some cell lines totally lack mechanisms to cope with
amplification, e.g. HOP_92 (Figure 3.11), where around 86% of cells with amplification are multipolar.
It is expected that multipolar division leads to cell death81,88
, however, this cell line has around 20% of
amplification. Studying this cell line could also provide some insights into how centriole amplification
arises.
3.4.1. Strategy
In order to understand how cells lacking the ability to cluster supernumerary centrosomes
divide, it is critical to follow the fate of mitotic cells by live imaging. In order to observe centrioles and
their behaviour during division, a fluorescent centriolar marker is required. Therefore, I first created
stable HS578T and HOP_92 cell lines, expressing centrin-GFP. We decided to use a centrin marker,
as it is a very early marker that labels all centrioles (mother, daughter or de novo) and is stably
present throughout the cell cycle75
. Unfortunately, HOP_92 centrin-GFP died after the drug treatment
(see Material and Methods section). Additionally, to observe cells that undergo mitosis, I added a
fluorescent dye that labels the microtubules (SiR-tubulin) to visualize the spindle118
.
HS578T centrin-GFP was used for preliminary tests (Figure 3.12, section 3.2.2), which
highlighted the need of a DNA marker since it was not possible to see how centriole abnormalities
lead to defects in chromosome segregation. Furthermore a DNA-marker is very helpful for mitotic
stage recognition. An additional challenge was the fact that it was rare to find mitotic cells.
To tackle all these issues, I created two new stable cell lines, expressing centrin-GFP and the
DNA marker H2B-RFP and these cell lines were submitted to synchronization procedures to increase
the mitotic cell population for live imaging. Unfortunately, HOP_92 centrin-GFP H2B-RFP did not
survive cell sorting (see Material and Methods section).
3.4.2. Preliminary Results
The first live imaging test of HS578T centrin-GFP (Figure 3.12) lasted 6 hours in which the
mitotic cell failed to divide. Furthermore the cell died in the last hour of imaging. The reason of this
occurrence is not clear since it could be due to overexposure of the lasers from the microscope or
mitotic catastrophe consequent of aberrant chromosome segregation119
. Additionally, the microtubule-
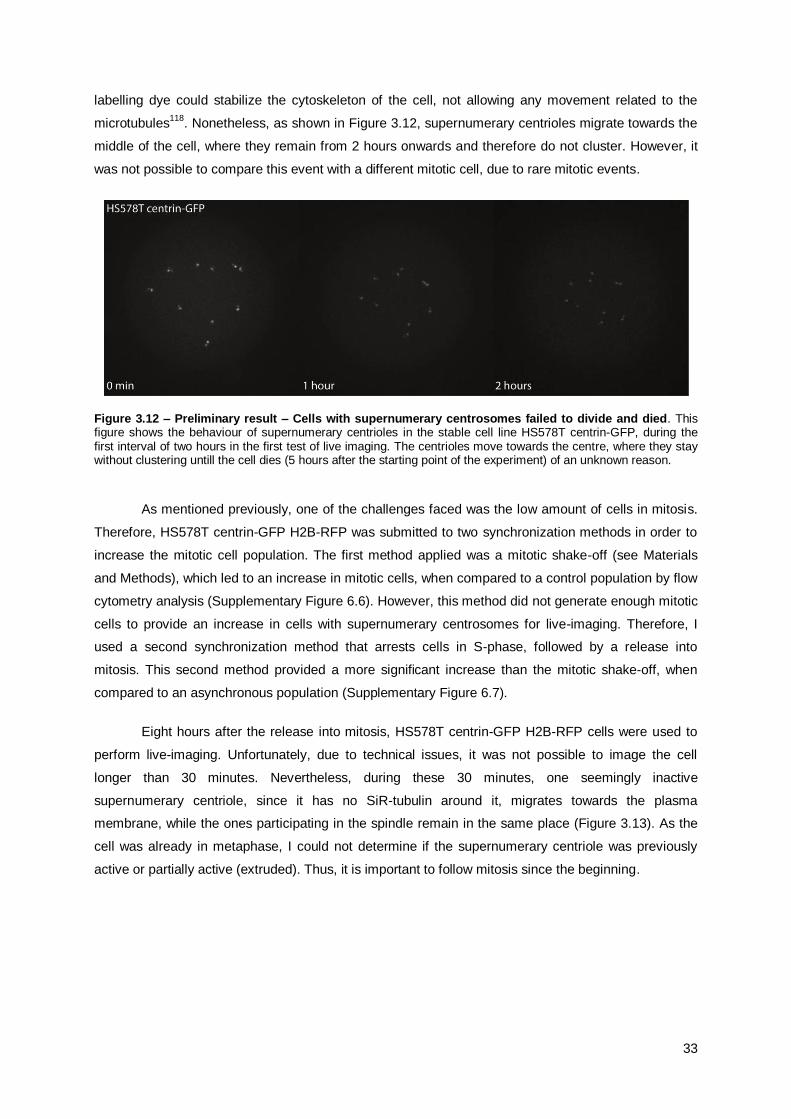
33
labelling dye could stabilize the cytoskeleton of the cell, not allowing any movement related to the
microtubules118
. Nonetheless, as shown in Figure 3.12, supernumerary centrioles migrate towards the
middle of the cell, where they remain from 2 hours onwards and therefore do not cluster. However, it
was not possible to compare this event with a different mitotic cell, due to rare mitotic events.
Figure 3.12 – Preliminary result – Cells with supernumerary centrosomes failed to divide and died. This figure shows the behaviour of supernumerary centrioles in the stable cell line HS578T centrin-GFP, during the first interval of two hours in the first test of live imaging. The centrioles move towards the centre, where they stay without clustering untill the cell dies (5 hours after the starting point of the experiment) of an unknown reason.
As mentioned previously, one of the challenges faced was the low amount of cells in mitosis.
Therefore, HS578T centrin-GFP H2B-RFP was submitted to two synchronization methods in order to
increase the mitotic cell population. The first method applied was a mitotic shake-off (see Materials
and Methods), which led to an increase in mitotic cells, when compared to a control population by flow
cytometry analysis (Supplementary Figure 6.6). However, this method did not generate enough mitotic
cells to provide an increase in cells with supernumerary centrosomes for live-imaging. Therefore, I
used a second synchronization method that arrests cells in S-phase, followed by a release into
mitosis. This second method provided a more significant increase than the mitotic shake-off, when
compared to an asynchronous population (Supplementary Figure 6.7).
Eight hours after the release into mitosis, HS578T centrin-GFP H2B-RFP cells were used to
perform live-imaging. Unfortunately, due to technical issues, it was not possible to image the cell
longer than 30 minutes. Nevertheless, during these 30 minutes, one seemingly inactive
supernumerary centriole, since it has no SiR-tubulin around it, migrates towards the plasma
membrane, while the ones participating in the spindle remain in the same place (Figure 3.13). As the
cell was already in metaphase, I could not determine if the supernumerary centriole was previously
active or partially active (extruded). Thus, it is important to follow mitosis since the beginning.
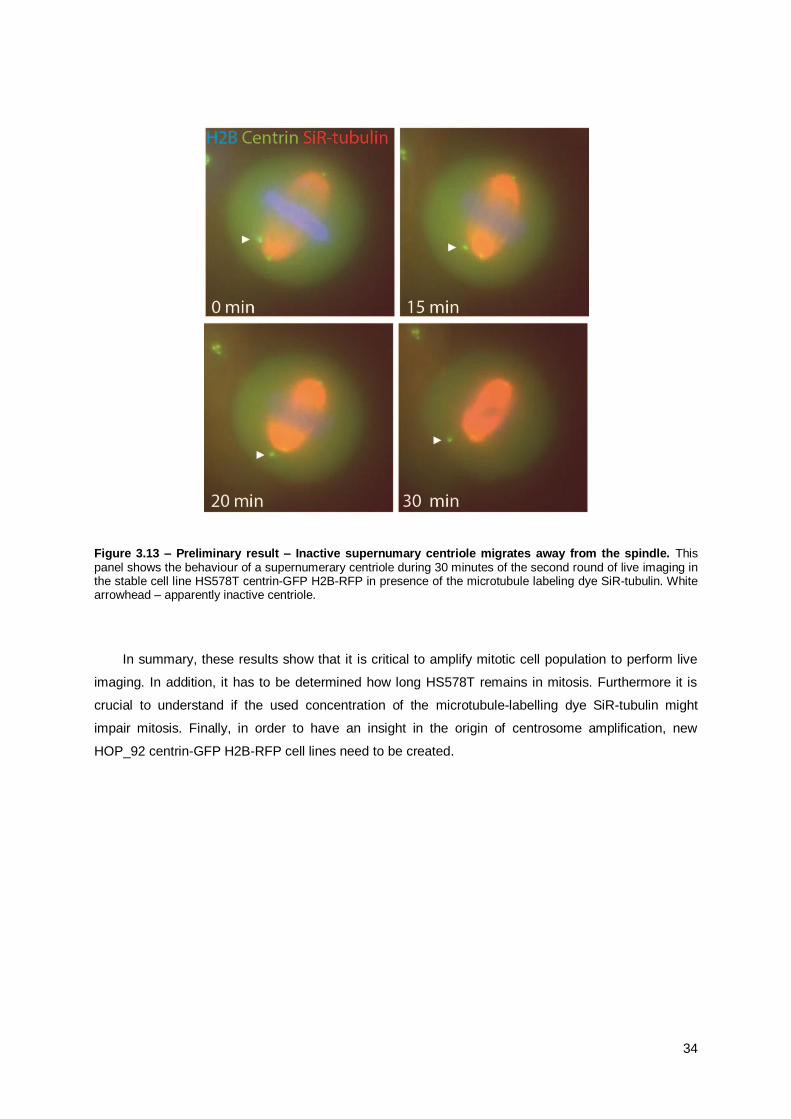
34
Figure 3.13 – Preliminary result – Inactive supernumary centriole migrates away from the spindle. This panel shows the behaviour of a supernumerary centriole during 30 minutes of the second round of live imaging in the stable cell line HS578T centrin-GFP H2B-RFP in presence of the microtubule labeling dye SiR-tubulin. White arrowhead – apparently inactive centriole.
In summary, these results show that it is critical to amplify mitotic cell population to perform live
imaging. In addition, it has to be determined how long HS578T remains in mitosis. Furthermore it is
crucial to understand if the used concentration of the microtubule-labelling dye SiR-tubulin might
impair mitosis. Finally, in order to have an insight in the origin of centrosome amplification, new
HOP_92 centrin-GFP H2B-RFP cell lines need to be created.
35
4. Discussion
Supernumerary centrosomes have been associated with cancer for longer than a century82
.
An increase in centriolar number might cause the formation of multipolar mitotic spindles, which is
related to CIN and high-grade aneuploidy and normally leads to cell death81,88
. Cancer cells do,
however, often divide successfully, suggesting the existence of adaptation mechanisms to cope with
centrosome amplification. One such mechanism is the clustering, i.e. gathering, of supernumerary
centrosomes at the two spindle-poles, ensuring a pseudo-bipolar cell division92
. A previous systematic
survey of the NCI-60 panel of cancer cell lines showed that centriole amplification is a hallmark of
cancer (Marteil et al, in preparation120
) and that clustering of supernumerary centrosomes is a major,
but not the only coping mechanism. Nevertheless, the frequency of clustering in cancer still remains
undetermined and the presence of alternative mechanisms in cancer has not been studied yet.
In this study, I unveiled that centrosome clustering is widespread in cancer cells by analyzing
immunofluorescence images of mitotic cells displaying centrosome amplification from 27 different
cancer cell lines (see Figure 3.4 and Figure 3.6-B). These results reinforce the idea of using clustering
as a target for cancer therapy. Moreover, I observed a positive correlation between centrosome
amplification and clustering (Figure 3.7). Interestingly, a recent study showed that the protein KIFC1,
which is crucial for centrosome clustering, is upregulated in breast cancer121
and recent work showed
that breast cancer has centrosome amplification (Vaz et al, in preparation). This suggests a positive
selection pressure for clustering in cells that have amplification. Additionally, I observed a
heterogeneity in the clustering ability within each cell line since only a sub-population of cells can
cluster their supernumerary centrioles. We envisage two main possible reasons explaining this
heterogeneity: a) cells exhibiting different clustering ability are in different mitotic stages and/or b) cell
lines are genetically heterogeneous. Supporting a), it is well described that cells cluster their
supernumerary centrosomes in prometaphase to allow bipolar spindle formation in metaphase96
.This
suggests that the cells lacking clustering ability in our study could be false-negatives, namely
prometaphase in the process of clustering their supernumerary centrosomes. Consequently, the
annotation of the mitotic stage and its correlation with the clustering ability is now critical to validate a).
Nevertheless, this heterogeneity could also be genetically defined. To test this, we will perform
evolution assays in which we will isolate clones from several cancer cell lines displaying centrosome
amplification and determine the clustering ability of each clone after several generations. If the
clustering ability is homogeneous within each clone but heterogeneous between clones, hypothesis b)
should be validated.
Recent screens showed that centrosome clustering is regulated by MAPS, proteins involved in
the microtubule-kinetochore attachment and by the actin cytoskeleton97,98
. Our survey of centrosome
clustering cell lines allowed to group the 27 cancer cell lines according to their ability, or not, to cluster
supernumerary centrosomes (see Figure 3.6-B). These results provide us now with the unique
opportunity to better characterise centrosome clustering at the molecular and cellular levels. To do
this, we first want to investigate the publicly available gene expression and proteomics data of the

36
NCI-60 panel122,123
to highlight potential new regulators of centrosome clustering. We will focus on the
molecules whose expression is specifically upregulated in the cell lines that cluster centrosomes or
downregulated in the lines that lack this ability, suggesting they could be important players in
clustering. Second, we want to further take advantage of these discoveries to better understand how
the ability to cluster supernumerary centrosomes is conferred at the cellular level. My results show that
all the leukemia cell lines have a strong clustering ability (Supplementary Figure 6.5). Interestingly, a
previous study showed that retraction fibres, keeping cells attached to the substrate when they round
up in mitosis, can influence the clustering ability. The angles and the number of retraction fibres of
cells can indeed force cells to cluster or not their supernumerary centrioles inducing bipolar or a
multipolar spindle pole formation, respectively97
. Since leukemia cells grow in suspension, i.e. are non
adherent, they do not form retraction fibres. This suggests that the geometry of retraction fibres could
be preventing centrosome clustering in cell lines that were shown to lack this ability, such as HOP_92.
To test this, we will plate these cells on fibronectin micropatterns, forcing different spindle shapes105
, to
see if cells will gain the ability to cluster supernumerary centrosomes. In addition, the expression of
the protein Myosin-10 will be investigated in the cell lines that fail to cluster by comparing publicly
available gene expression and proteomics data of the NCI-60 panel122,123
, since it was recently
discovered that this protein is involved in centrosome positioning at the retraction fibres106
.
Furthermore we also want to observe the actin cytoskeleton in the leukemia cell lines by
immunofluorescence and live imaging to see how the centrosomes and the spindle are positioned.
My survey also revealed that alternative mechanisms to cope with supernumerary
centrosomes are widespread in cancer (Figure 3.9-B). We found centrosomes with an apparent
decrease in microtubule nucleation capacity excluded from the spindle. This mechanism was
denominated centrosome extrusion. A similar phenotype was recently reported in BT_549, a breast
cancer cell line, where supernumerary active centrosomes were shown to be transiently displaced
from the mitotic spindle during metaphase until anaphase transition, allowing bipolar spindle
formation124
. Interestingly, my survey showed that this cell line lacks the ability to cluster, but around
27% of cells with supernumerary centrosomes present alternative mechanisms. The reported
centrosome phenotype in BT_549 seems to have functional PCM and microtubule nucleation capacity.
Further experiments are now required to a) analyse if these characteristics are common to all extruded
centrioles and b) highlight the molecular and cellular regulators of this mechanism. The second
alternative mechanism found in the cancer cell lines is centrosome inactivation. Inactive centrosomes
fail to nucleate microtubules and are not necessarily excluded from the mitotic spindle. Centrosome
inactivation has already been described in fly neuroblasts and is characterized by a decrease in PCM
content and microtubule nucleation capacity93
. This inactivation seemed transient as centrosomes
regain activity in the beginning of anaphase125
. It is now critical to study whether the inactivated
centrioles in cancer cells share the same characteristics as the one found in neuroblasts. To better
characterise centrosome extrusion and inactivation we will follow similar strategies as the ones used
to characterise the activity of centrosomes in BT_549124
, by i) quantifying the PCM content of
centrioles in several cell lines with alternative mechanisms by immunofluorescence microscopy, and ii)
performing microtubule regrowth assays. Second, we will follow the behaviour of extruded and
37
inactivated centrioles during mitosis by live imaging. During my Master’s, I performed some
preliminary tests with the breast cancer cell line HS578T and I could visualize an apparently inactive
centriole migrating away from the mitotic spindle (see Figure 3.13). However further experiments are
required to optimize problems that were encountered such as the low number of mitotic cells, which
will be improved by testing synchronization methods. Finally the third strategy will be to analyse the
gene expression and proteomics data in cell lines with alternative coping mechanisms to highlight their
potential regulators.
During this work, I also found that some cell lines, such as HOP_92, apparently do not have
any coping mechanisms (86% multipolar) suggesting that these cells die84
. Intriguingly, these cells still
have a significant percentage of cells displaying centriole amplification (20%). Studying this cell line
could provide insights into how centriole amplification arises, since a broad range of mechanisms such
as cell fusion, cytokinesis failure and overduplication of centrioles can induce amplification84
. To
understand these mechanisms, we wanted to follow mitotic cell fate by live-imaging. Unfortunately, we
were unable to perform preliminary tests until now, since HOP_92 cells did not survive the selection
methods. Therefore, optimizations are needed to find the minimal concentration of geneticin that kills
100% of HOP_92 cells.
Altogether, my results showed that the majority of cancer cells have the ability to divide in a
pseudo-bipolar fashion using centrosome clustering and/or alternative mechanisms (see Figure 3.11
and Figure 4.1). These results reinforce the strategies of using clustering as a target for cancer
therapy and offers new putative targets, centrosome extrusion and inactivation. For instance, some
drugs targeting centrosome clustering have already been developed111,112
and inhibitors of the protein
HSET, which is critical for centrosome clustering in cancer cells but not necessary for normal cell
division, are under development110
. As a consequence, a better understanding of the coping
mechanisms at the cellular and molecular level is of high importance to provide novel molecular
entities that could be used in diagnosis (e.g. upregulated gene) or therapeutics. Interestingly, some
regulators seem to be shared amongst the coping mechanisms. Indeed, the depletion of HSET not
only prevents centrosome clustering but also leads to a reduction in extruded centrioles97,124
. This
offers the unique opportunity of targeting all the coping mechanisms at once. Finally, these results
need to be validated in vivo by investigating the gene expression of the regulators of the coping
mechanisms, as it was recently performed for HSET/KIFC1, which was shown to be upregulated in
human malignant breast cancer121
.
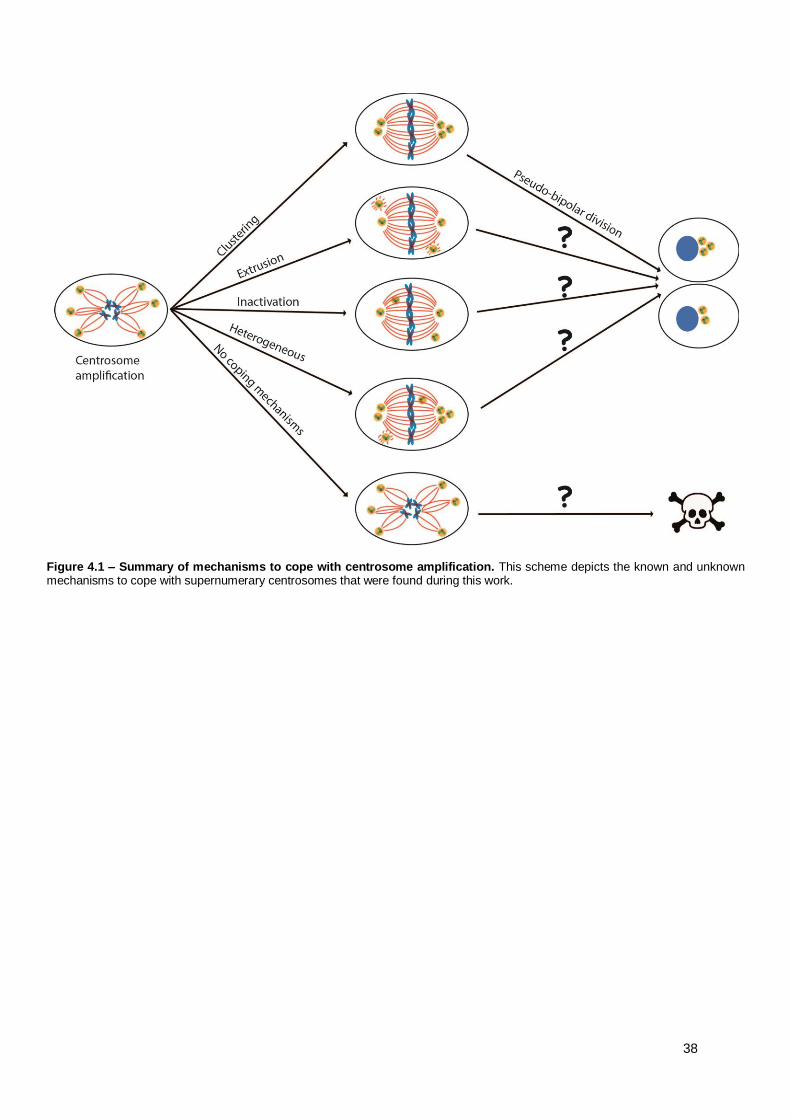
38
Figure 4.1 – Summary of mechanisms to cope with centrosome amplification. This scheme depicts the known and unknown mechanisms to cope with supernumerary centrosomes that were found during this work.
39
5. References
1. Lodish, H. et al. Molecular Cell Biology. (W. H. Freeman and Company, 2013). 2. Alberts, B. et al. Molecular Biology of the Cell. (Garland Science, 2008). 3. Cooper, G. M. The Cell - A Molecular Approach. (Sunderland (MA) - Sinauer Associates,
2000). 4. Nurse, P. A long twentieth century of the cell cycle and beyond. Cell 100, 71–78 (2000). 5. Meunier, S. & Vernos, I. Microtubule assembly during mitosis - from distinct origins to distinct
functions? J. Cell Sci. 125, 2805–2814 (2012). 6. Robinson, D. N. & Spudich, J. a. Mechanics and regulation of cytokinesis. Curr. Opin. Cell Biol.
16, 182–188 (2004). 7. Ohkura, H. Meiosis: An Overview of Key Differences from Mitosis. Cold Spring Harb. Perspect.
Biol. 7, a015859 (2015). 8. Yang, S. et al. CDK1 Phosphorylation of YAP Promotes Mitotic Defects and Cell Motility and Is
Essential for Neoplastic Transformation. Cancer Res. 73, 6722–6733 (2013). 9. Malumbres, M. & Barbacid, M. Cell cycle, CDKs and cancer: a changing paradigm. Nat. Rev.
Cancer 9, 153–166 (2009). 10. Santamaría, D. et al. Cdk1 is sufficient to drive the mammalian cell cycle. Nature 448, 811–815
(2007). 11. Morgan, D. O. CYCLIN-DEPENDENT KINASES: Engines, Clocks, and Microprocessors. Annu.
Rev. Cell Dev. Biol. 13, 261–291 (1997). 12. Pines, J. Mitosis: A matter of getting rid of the right protein at the right time. Trends Cell Biol.
16, 55–63 (2006). 13. Nigg, E. a. Polo-like kinases: positive regulators of cell division from start to finish. Curr. Opin.
Cell Biol. 10, 776–783 (1998). 14. Barr, F. a, Silljé, H. H. W. & Nigg, E. a. Polo-like kinases and the orchestration of cell division.
Nat. Rev. Mol. Cell Biol. 5, 429–440 (2004). 15. Zitouni, S., Nabais, C., Jana, S. C., Guerrero, A. & Bettencourt-Dias, M. Polo-like kinases:
structural variations lead to multiple functions. Nat. Rev. Mol. Cell Biol. 15, 433–452 (2014). 16. Chang, J., Cizmecioglu, O., Hoffmann, I. & Rhee, K. PLK2 phosphorylation is critical for CPAP
function in procentriole formation during the centrosome cycle. EMBO J. 29, 2395–2406 (2010).
17. Xie, S. et al. Plk3 functionally links DNA damage to cell cycle arrest and apoptosis at least in part via the p53 pathway. J. Biol. Chem. 276, 43305–43312 (2001).
18. De Cárcer, G. et al. Plk5, a polo box domain-only protein with specific roles in neuron differentiation and glioblastoma suppression. Mol. Cell. Biol. 31, 1225–1239 (2011).
19. Van De Weerdt, B. C. M. & Medema, R. H. Polo-like kinases: A team in control of the division. Cell Cycle 5, 853–864 (2006).
20. De Cárcer, G., Manning, G. & Malumbres, M. From Plk1 to Plk5: Functional evolution of Polo-like kinases. Cell Cycle 10, 2255–2262 (2011).
21. Bettencourt-Dias, M. et al. Genome-wide survey of protein kinases required for cell cycle progression. Nature 432, 980–987 (2004).
22. Barr, A. R. & Gergely, F. Aurora-A: the maker and breaker of spindle poles. J. Cell Sci. 120, 2987–2996 (2007).
23. Vader, G. & Lens, S. M. a. The Aurora kinase family in cell division and cancer. Biochim. Biophys. Acta 1786, 60–72 (2008).
24. Hartwell, L. H. & Weinert, T. a. Checkpoints: controls that ensure the order of cell cycle events. Science 246, 629–634 (1989).
25. Johnson, D. G. & Walker, C. L. Cyclins and cell cycle checkpoints. Annu. Rev. Pharmacol. Toxicol. 39, 295–312 (1999).
26. Rieder, C. L. Mitosis in vertebrates: The G2/M and M/A transitions and their associated checkpoints. Chromosom. Res. 19, 291–306 (2011).
27. Lara-Gonzalez, P., Westhorpe, F. G. & Taylor, S. S. The spindle assembly checkpoint. Curr. Biol. 22, R966–R980 (2012).
28. Rosenblatt, J. Spindle assembly: asters part their separate ways. Nat. Cell Biol. 7, 219–222 (2005).
29. Magidson, V. et al. The spatial arrangement of chromosomes during prometaphase facilitates spindle assembly. Cell 146, 555–567 (2011).
40
30. O’Connell, C. B., Lončarek, J., Kaláb, P. & Khodjakov, A. Relative contributions of chromatin and kinetochores to mitotic spindle assembly. J. Cell Biol. 187, 43–51 (2009).
31. Desai, a & Mitchison, T. J. Microtubule polymerization dynamics. Annu. Rev. Cell Dev. Biol. 13, 83–117 (1997).
32. Cassimeris, L. U., Walker, R. A., Pryer, N. K. & Salmon, E. D. Dynamic Instability of Microtubules. BioEssays 7, 149–154 (1987).
33. Burbank, K. S. & Mitchison, T. J. Microtubule dynamic instability. Curr. Biol. 16, 516–517 (2006).
34. Kollman, J. M., Merdes, A., Mourey, L. & Agard, D. a. Microtubule nucleation by γ-tubulin complexes. Nat. Rev. Mol. Cell Biol. 12, 709–721 (2011).
35. Mishra, R. K., Chakraborty, P., Arnaoutov, A., Fontoura, B. M. a & Dasso, M. The Nup107-160 complex and gamma-TuRC regulate microtubule polymerization at kinetochores. Nat. Cell Biol. 12, 164–169 (2010).
36. Bornens, M., Paintrand, M., Berges, J., Marty, M. C. & Karsenti, E. Structural and chemical characterization of isolated centrosomes. Cell Motil. Cytoskeleton 8, 238–249 (1987).
37. Bettencourt-Dias, M. & Glover, D. M. Centrosome biogenesis and function: centrosomics brings new understanding. Nat. Rev. Mol. Cell Biol. 8, 451–463 (2007).
38. Million, K. et al. Polyglutamylation and polyglycylation of alpha- and beta-tubulins during in vitro ciliated cell differentiation of human respiratory epithelial cells. J. Cell Sci. 112 ( Pt 2, 4357–4366 (1999).
39. Fu, J. & Glover, D. M. Structured illumination of the interface between centriole and peri-centriolar material. Open Biol. 2, 120104–120104 (2012).
40. Laoukili, J. et al. Differential expression and cellular distribution of centrin isoforms during human ciliated cell differentiation in vitro. J. Cell Sci. 113 ( Pt 8, 1355–1364 (2000).
41. Nakazawa, Y., Hiraki, M., Kamiya, R. & Hirono, M. SAS-6 is a Cartwheel Protein that Establishes the 9-Fold Symmetry of the Centriole. Curr. Biol. 17, 2169–2174 (2007).
42. Guichard, P., Chrétien, D., Marco, S. & Tassin, A.-M. Procentriole assembly revealed by cryo-electron tomography. EMBO J. 29, 1565–1572 (2010).
43. Avidor-Reiss, T. & Gopalakrishnan, J. Building a centriole. Curr. Opin. Cell Biol. 25, 1–6 (2013). 44. Strnad, P. & Gönczy, P. Mechanisms of procentriole formation. Trends Cell Biol. 18, 389–396
(2008). 45. Bornens, M. Centrosome composition and microtubule anchoring mechanisms. Curr. Opin. Cell
Biol. 14, 25–34 (2002). 46. Hoyer-Fender, S. Centriole maturation and transformation to basal body. Semin. Cell Dev. Biol.
21, 142–147 (2010). 47. Gosti-testul, F., Marty, M., Berges, J., Maunoury, R. & Bornens, M. Identification of
centrosomal proteins in a human lymphoblastic cell line. EMBO J. 5, 2545–2550 (1986). 48. Doxsey, S. J., Stein, P., Evans, L., Calarco, P. D. & Kirschner, M. Pericentrin, a highly
conserved centrosome protein involved in microtubule organization. Cell 76, 639–650 (1994). 49. Woodruff, J. B., Wueseke, O. & Hyman, A. a. Pericentriolar material structure and dynamics.
Philos. Trans. R. Soc. B Biol. Sci. 369, 20130459–20130459 (2014). 50. Dictenberg, J. B. et al. Pericentrin and gamma-tubulin form a protein complex and are
organized into a novel lattice at the centrosome. J. Cell Biol. 141, 163–174 (1998). 51. Manneville, J.-B. & Etienne-Manneville, S. Positioning centrosomes and spindle poles: looking
at the periphery to find the centre. Biol. Cell 98, 557–565 (2006). 52. Doxsey, S., Zimmerman, W. & Mikule, K. Centrosome control of the cell cycle. Trends Cell Biol.
15, 303–311 (2005). 53. Fu, J., Hagan, I. M. & Glover, D. M. The Centrosome and Its Duplication Cycle. Cold Spring
Harb. Perspect. Biol. 7, a015800 (2015). 54. Goetz, S. C. & Anderson, K. V. The primary cilium: a signalling centre during vertebrate
development. Nat. Rev. Genet. 11, 331–344 (2010). 55. Ishikawa, H. & Marshall, W. F. Ciliogenesis: building the cell’s antenna. Nat. Rev. Mol. Cell
Biol. 12, 222–234 (2011). 56. Bettencourt-Dias, M., Hildebrandt, F., Pellman, D., Woods, G. & Godinho, S. a. Centrosomes
and cilia in human disease. Trends Genet. 27, 307–315 (2011). 57. Rodrigues-Martins, a, Riparbelli, M., Callaini, G., Glover, D. M. & Bettencourt-Dias, M.
Revisiting the role of the mother centriole in centriole biogenesis. Science 316, 1046–1050 (2007).
58. Loncarek, J., Hergert, P., Magidson, V. & Khodjakov, A. Control of daughter centriole formation by the pericentriolar material. Nat. Cell Biol. 10, 322–328 (2008).
41
59. Balestra, F., Strnad, P., Flückiger, I. & Gönczy, P. Discovering regulators of centriole biogenesis through siRNA-based functional genomics in human cells. Dev. Cell 25, 555–571 (2013).
60. Vorobjev, I. a & Chentsov, Y. S. Centrioles in the cell cycle. I. Epithelial cells. Ontogenez 18, 478–483 (1982).
61. Tsou, M.-F. B. & Stearns, T. Mechanism limiting centrosome duplication to once per cell cycle. Nature 442, 947–951 (2006).
62. Tsou, M. B. et al. Polo Kinase and Separase Regulate the Mitotic Licensing of Centriole Duplication in Human Cells. Dev. Cell 17, 344–354 (2009).
63. Cizmecioglu, O. et al. Cep152 acts as a scaffold for recruitment of Plk4 and CPAP to the centrosome. J. Cell Biol. 191, 731–739 (2010).
64. Hatch, E. M., Kulukian, A., Holland, A. J., Cleveland, D. W. & Stearns, T. Cep152 interacts with Plk4 and is required for centriole duplication. J. Cell Biol. 191, 721–729 (2010).
65. Bettencourt-Dias, M. et al. SAK/PLK4 is required for centriole duplication and flagella development. Curr. Biol. 15, 2199–2207 (2005).
66. Lin, Y.-C. et al. Human microcephaly protein CEP135 binds to hSAS-6 and CPAP, and is required for centriole assembly. EMBO J. 32, 1141–54 (2013).
67. Kratz, a.-S., Barenz, F., Richter, K. T. & Hoffmann, I. Plk4-dependent phosphorylation of STIL is required for centriole duplication. Biol. Open 4, 370–377 (2015).
68. Delgehyr, N. et al. Klp10A, a microtubule-depolymerizing kinesin-13, cooperates with CP110 to control drosophila centriole length. Curr. Biol. 22, 502–509 (2012).
69. Comartin, D. et al. CEP120 and SPICE1 cooperate with CPAP in centriole elongation. Curr. Biol. 23, 1360–1366 (2013).
70. Schmidt, T. I. et al. Control of Centriole Length by CPAP and CP110. Curr. Biol. 19, 1005–1011 (2009).
71. Lin, Y. N. et al. CEP120 interacts with CPAP and positively regulates centriole elongation. J. Cell Biol. 202, 211–219 (2013).
72. Spektor, A., Tsang, W. Y., Khoo, D. & Dynlacht, B. D. Cep97 and CP110 Suppress a Cilia Assembly Program. Cell 130, 678–690 (2007).
73. Gudi, R., Zou, C., Li, J. & Gao, Q. Centrobin-tubulin interaction is required for centriole elongation and stability. J. Cell Biol. 193, 711–725 (2011).
74. Singla, V., Romaguera-Ros, M., Garcia-Verdugo, J. M. & Reiter, J. F. Ofd1, a Human Disease Gene, Regulates the Length and Distal Structure of Centrioles. Dev. Cell 18, 410–424 (2010).
75. Wang, W. J., Soni, R. K., Uryu, K. & Tsou, M. F. B. The conversion of centrioles to centrosomes: Essential coupling of duplication with segregation. J. Cell Biol. 193, 727–739 (2011).
76. Van Heesbeen, R. G. H. P., Raaijmakers, J. a., Tanenbaum, M. E. & Medema, R. H. Nuclear envelope-associated dynein cooperates with Eg5 to drive prophase centrosome separation. Commun. Integr. Biol. 6, 1–4 (2013).
77. Nigg, E. A. & Stearns, T. The centrosome cycle: Centriole biogenesis, duplication and inherent asymmetries. Nat. Cell Biol. 13, 1154–1160 (2011).
78. Khodjakov, A. et al. De novo formation of centrosomes in vertebrate cells arrested during S phase. J. Cell Biol. 158, 1171–1181 (2002).
79. Uetake, Y. et al. Cell cycle progression and de novo centriole assembly after centrosomal removal in untransformed human cells. J. Cell Biol. 176, 173–182 (2007).
80. Pihan, G. a., Wallace, J., Zhou, Y. & Doxsey, S. J. Centrosome abnormalities and chromosome instability occur together in pre-invasive carcinomas. Cancer Res. 63, 1398–1404 (2003).
81. Ganem, N. J., Godinho, S. a & Pellman, D. A mechanism linking extra centrosomes to chromosomal instability. Nature 460, 278–282 (2009).
82. Brinkley, B. R. & Goepfert, T. M. Supernumerary centrosomes and cancer: Boveri’s hypothesis resurrected. Cell Motil. Cytoskeleton 41, 281–288 (1998).
83. Chan, J. Y. A clinical overview of centrosome amplification in human cancers. Int. J. Biol. Sci. 7, 1122–1144 (2011).
84. Godinho, S. A. & Pellman, D. Causes and consequences of centrosome abnormalities in cancer. Philos. Trans. R. Soc. B Biol. Sci. 369, 20130467–20130467 (2014).
85. Kohlmaier, G. et al. Overly Long Centrioles and Defective Cell Division upon Excess of the SAS-4-Related Protein CPAP. Curr. Biol. 19, 1012–1018 (2009).
86. Ganem, N. J., Storchova, Z. & Pellman, D. Tetraploidy, aneuploidy and cancer. Curr. Opin. Genet. Dev. 17, 157–162 (2007).
42
87. Fujiwara, T. et al. Cytokinesis failure generating tetraploids promotes tumorigenesis in p53-null cells. Nature 437, 1043–1047 (2005).
88. Schvartzman, J.-M., Sotillo, R. & Benezra, R. Mitotic chromosomal instability and cancer: mouse modelling of the human disease. Nat. Rev. Cancer 10, 102–115 (2010).
89. Pfau, S. J. & Amon, A. Chromosomal instability and aneuploidy in cancer: from yeast to man. EMBO Rep. 13, 515–527 (2012).
90. Godinho, S. a et al. Oncogene-like induction of cellular invasion from centrosome amplification. Nature 510, 167–71 (2014).
91. Kushner, E. J. et al. Excess centrosomes disrupt endothelial cell migration via centrosome scattering. J. Cell Biol. 206, 257–272 (2014).
92. Quintyne, N. J., Reing, J. E., Hoffelder, D. R., Gollin, S. M. & Saunders, W. S. Spindle multipolarity is prevented by centrosomal clustering. Science 307, 127–129 (2005).
93. Basto, R. et al. Centrosome Amplification Can Initiate Tumorigenesis in Flies. Cell 133, 1032–1042 (2008).
94. Cunha-Ferreira, I., Bento, I. & Bettencourt-Dias, M. From zero to many: Control of centriole number in development and disease. Traffic 10, 482–498 (2009).
95. Mikeladze-Dvali, T. et al. Analysis of centriole elimination during C. elegans oogenesis. Development 139, 1670–1679 (2012).
96. Ring, D., Hubble, R. & Kirschner, M. Mitosis in a cell with multiple centrioles. J. Cell Biol. 94, 549–556 (1982).
97. Kwon, M. et al. Mechanisms to suppress multipolar divisions in cancer cells with extra centrosomes. Genes Dev. 22, 2189–2203 (2008).
98. Leber, B. et al. Proteins required for centrosome clustering in cancer cells. Sci. Transl. Med. 2, 33ra38 (2010).
99. Karsenti, E. & Vernos, I. The mitotic spindle: a self-made machine. Science 294, 543–547 (2001).
100. Breuer, M. et al. HURP permits MTOC sorting for robust meiotic spindle bipolarity, similar to extra centrosome clustering in cancer cells. J. Cell Biol. 191, 1251–1260 (2010).
101. Uehara, R. et al. The augmin complex plays a critical role in spindle microtubule generation for mitotic progression and cytokinesis in human cells. Proc. Natl. Acad. Sci. U. S. A. 106, 6998–7003 (2009).
102. Yang, Z., Lončarek, J., Khodjakov, A. & Rieder, C. L. Extra centrosomes and/or chromosomes prolong mitosis in human cells: Control of mitotic cells. Nat. Cell Biol. 10, 748–751 (2008).
103. Drosopoulos, K., Tang, C., Chao, W. C. H. & Linardopoulos, S. APC/C is an essential regulator of centrosome clustering. Nat. Commun. 5, 3686 (2014).
104. Kunda, P. & Baum, B. The actin cytoskeleton in spindle assembly and positioning. Trends Cell Biol. 19, 174–179 (2009).
105. Théry, M. et al. The extracellular matrix guides the orientation of the cell division axis. Nat. Cell Biol. 7, 947–953 (2005).
106. Kwon, M., Bagonis, M., Danuser, G. & Pellman, D. Direct Microtubule-Binding by Myosin-10 Orients Centrosomes toward Retraction Fibers and Subcortical Actin Clouds. Dev. Cell 34, 323–337 (2015).
107. Jordan, M. A. & Wilson, L. Microtubules as a Target for Anticancer Drugs. Nat. Rev. Cancer 4, 253–265 (2004).
108. Kawamura, E. et al. Identification of novel small molecule inhibitors of centrosome clustering in cancer cells. Oncotarget 4, 1763–1776 (2013).
109. Wu, J. et al. Discovery and Mechanistic Study of a Small Molecule Inhibitor for Motor Protein KIFC1. ACS Chem. Biol. 8, 2201–2208 (2013).
110. Watts, C. a. et al. Design, synthesis, and biological evaluation of an allosteric inhibitor of HSET that targets cancer cells with supernumerary centrosomes. Chem. Biol. 20, 1399–1410 (2013).
111. Castiel, A. et al. A phenanthrene derived PARP inhibitor is an extra-centrosomes de-clustering agent exclusively eradicating human cancer cells. BMC Cancer 11, 412 (2011).
112. Raab, M. S. et al. GF-15, a novel inhibitor of centrosomal clustering, suppresses tumor cell growth in vitro and in vivo. Cancer Res. 72, 5374–5385 (2012).
113. HS578T Electroporation Protocol. at <https://www.thermofisher.com/content/dam/LifeTech/migration/en/filelibrary/cell-culture/neon-protocols.par.87214.file.dat/hs-578t-breast.pdf>
114. A549 Electroporation Protocol. at <https://www.thermofisher.com/content/dam/LifeTech/migration/en/filelibrary/cell-culture/neon-protocols.par.43800.file.dat/a549-lung.pdf>
43
115. Schorl, C. & Sedivy, J. M. Analysis of cell cycle phases and progression in cultured mammalian cells. Methods 41, 143–150 (2007).
116. NCI-60 cell lines Methadata. at <http://discover.nci.nih.gov/cellminer/celllineMetadata.do> 117. Whitfield, M. L. et al. Stem-loop binding protein, the protein that binds the 3’ end of histone
mRNA, is cell cycle regulated by both translational and posttranslational mechanisms. Mol. Cell. Biol. 20, 4188–4198 (2000).
118. Lukinavičius, G. et al. Fluorogenic probes for live-cell imaging of the cytoskeleton. Nat. Methods 11, 731–3 (2014).
119. Castedo, M. et al. Cell death by mitotic catastrophe: a molecular definition. Oncogene 23, 2825–2837 (2004).
120. Marteil, G. et al. Fragmentation of long centrioles generates extra centrosomes in cancer. Prep. 121. Li, Y. et al. KIFC1 is a novel potential therapeutic target for breast cancer. Cancer Biol. Ther.
(2015). doi:10.1080/15384047.2015.1070980 122. Shankavaram, U. T. et al. CellMiner: a relational database and query tool for the NCI-60 cancer
cell lines. BMC Genomics 10, 277 (2009). 123. Gholami, A. M. et al. Global proteome analysis of the NCI-60 cell line panel. Cell Rep. 4, 609–
620 (2013). 124. Kleylein-Sohn, J. et al. Acentrosomal spindle organization renders cancer cells dependent on
the kinesin HSET. J. Cell Sci. (2012). doi:10.1242/jcs.107474 125. Marthiens, V., Piel, M. & Basto, R. Never tear us apart - the importance of centrosome
clustering. J. Cell Sci. 125, 3281–3292 (2012).
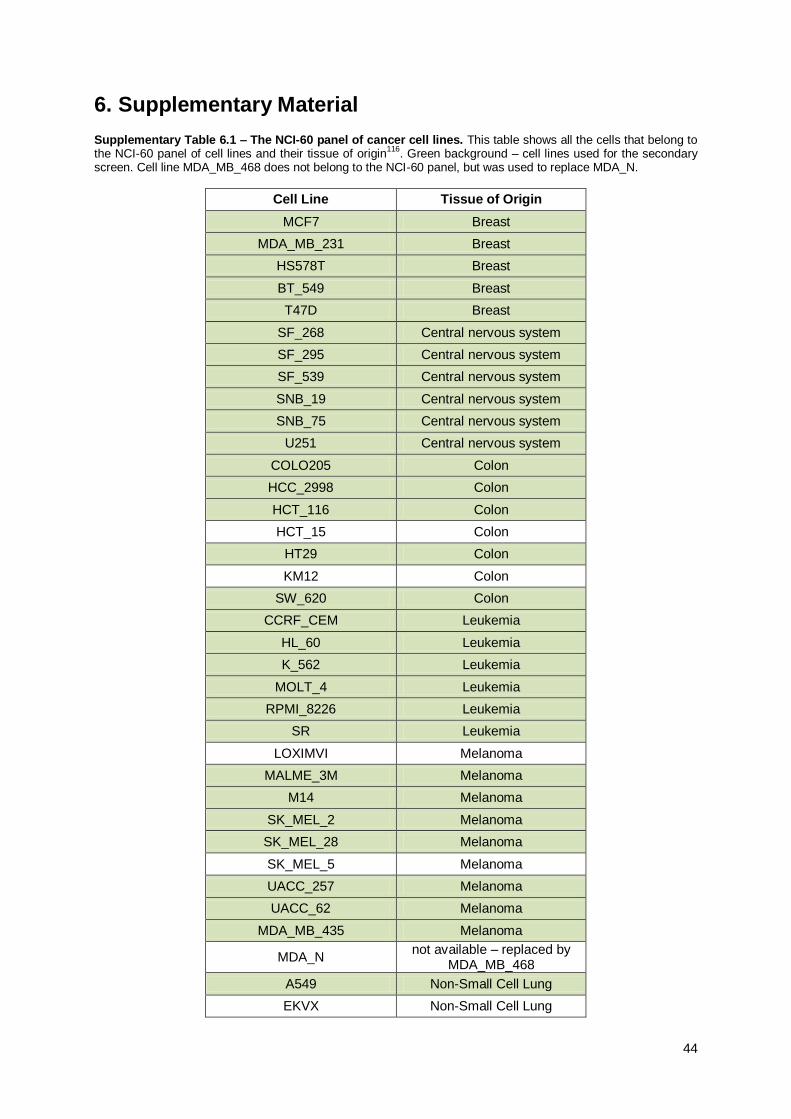
44
6. Supplementary Material
Supplementary Table 6.1 – The NCI-60 panel of cancer cell lines. This table shows all the cells that belong to the NCI-60 panel of cell lines and their tissue of origin
116. Green background – cell lines used for the secondary
screen. Cell line MDA_MB_468 does not belong to the NCI-60 panel, but was used to replace MDA_N.
Cell Line Tissue of Origin
MCF7 Breast
MDA_MB_231 Breast
HS578T Breast
BT_549 Breast
T47D Breast
SF_268 Central nervous system
SF_295 Central nervous system
SF_539 Central nervous system
SNB_19 Central nervous system
SNB_75 Central nervous system
U251 Central nervous system
COLO205 Colon
HCC_2998 Colon
HCT_116 Colon
HCT_15 Colon
HT29 Colon
KM12 Colon
SW_620 Colon
CCRF_CEM Leukemia
HL_60 Leukemia
K_562 Leukemia
MOLT_4 Leukemia
RPMI_8226 Leukemia
SR Leukemia
LOXIMVI Melanoma
MALME_3M Melanoma
M14 Melanoma
SK_MEL_2 Melanoma
SK_MEL_28 Melanoma
SK_MEL_5 Melanoma
UACC_257 Melanoma
UACC_62 Melanoma
MDA_MB_435 Melanoma
MDA_N not available – replaced by
MDA_MB_468
A549 Non-Small Cell Lung
EKVX Non-Small Cell Lung
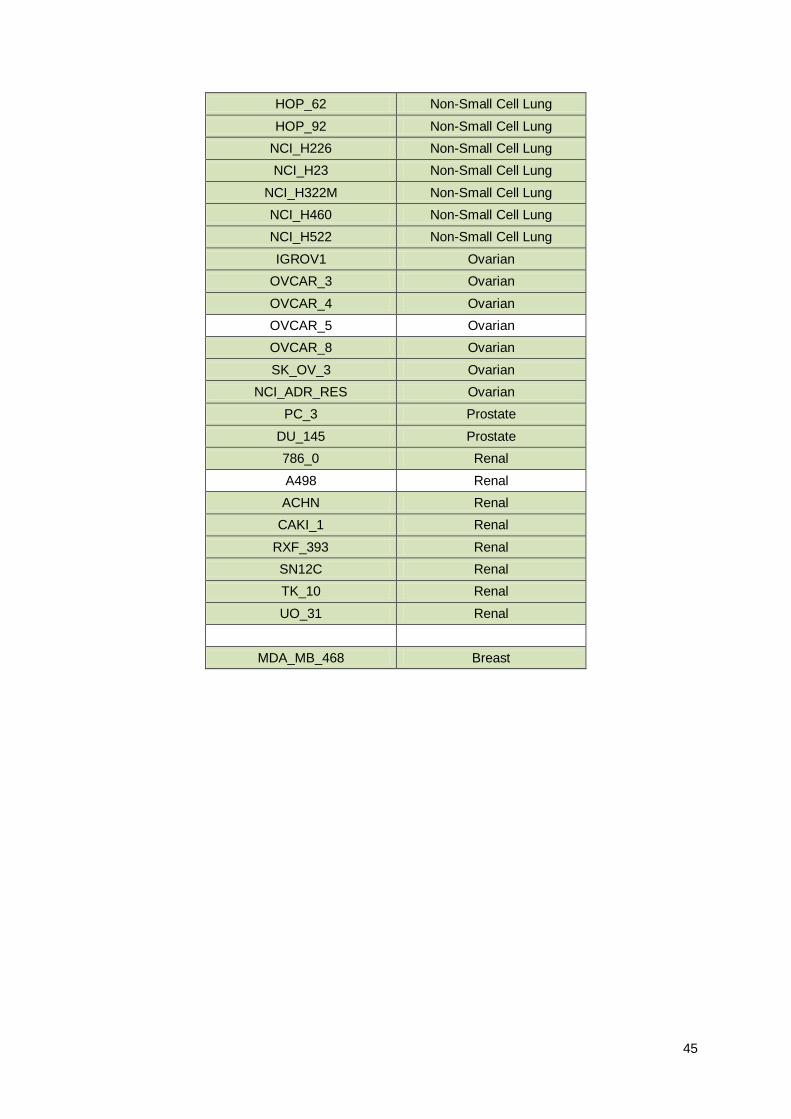
45
HOP_62 Non-Small Cell Lung
HOP_92 Non-Small Cell Lung
NCI_H226 Non-Small Cell Lung
NCI_H23 Non-Small Cell Lung
NCI_H322M Non-Small Cell Lung
NCI_H460 Non-Small Cell Lung
NCI_H522 Non-Small Cell Lung
IGROV1 Ovarian
OVCAR_3 Ovarian
OVCAR_4 Ovarian
OVCAR_5 Ovarian
OVCAR_8 Ovarian
SK_OV_3 Ovarian
NCI_ADR_RES Ovarian
PC_3 Prostate
DU_145 Prostate
786_0 Renal
A498 Renal
ACHN Renal
CAKI_1 Renal
RXF_393 Renal
SN12C Renal
TK_10 Renal
UO_31 Renal
MDA_MB_468 Breast
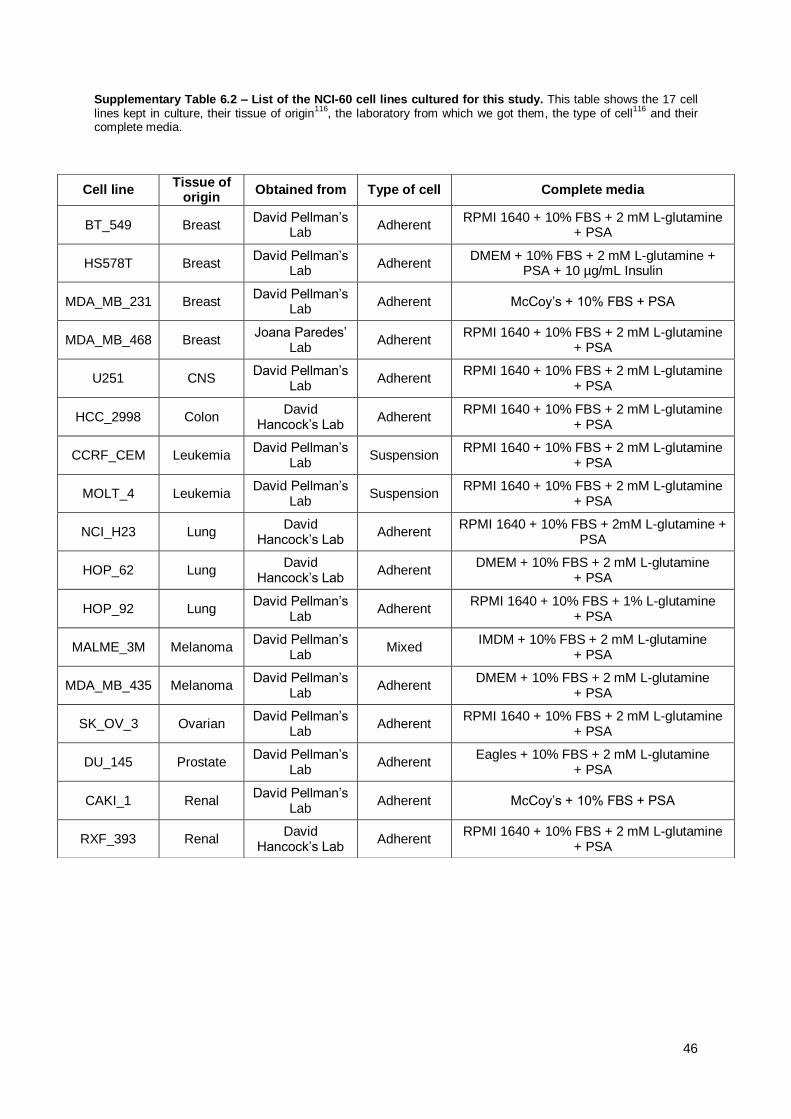
46
Supplementary Table 6.2 – List of the NCI-60 cell lines cultured for this study. This table shows the 17 cell lines kept in culture, their tissue of origin
116, the laboratory from which we got them, the type of cell
116 and their
complete media.
Cell line Tissue of
origin Obtained from Type of cell Complete media
BT_549 Breast David Pellman’s
Lab Adherent
RPMI 1640 + 10% FBS + 2 mM L-glutamine + PSA
HS578T Breast David Pellman’s
Lab Adherent
DMEM + 10% FBS + 2 mM L-glutamine + PSA + 10 µg/mL Insulin
MDA_MB_231 Breast David Pellman’s
Lab Adherent McCoy’s + 10% FBS + PSA
MDA_MB_468 Breast Joana Paredes’
Lab Adherent
RPMI 1640 + 10% FBS + 2 mM L-glutamine + PSA
U251 CNS David Pellman’s
Lab Adherent
RPMI 1640 + 10% FBS + 2 mM L-glutamine + PSA
HCC_2998 Colon David
Hancock’s Lab Adherent
RPMI 1640 + 10% FBS + 2 mM L-glutamine + PSA
CCRF_CEM Leukemia David Pellman’s
Lab Suspension
RPMI 1640 + 10% FBS + 2 mM L-glutamine + PSA
MOLT_4 Leukemia David Pellman’s
Lab Suspension
RPMI 1640 + 10% FBS + 2 mM L-glutamine + PSA
NCI_H23 Lung David
Hancock’s Lab Adherent
RPMI 1640 + 10% FBS + 2mM L-glutamine + PSA
HOP_62 Lung David
Hancock’s Lab Adherent
DMEM + 10% FBS + 2 mM L-glutamine + PSA
HOP_92 Lung David Pellman’s
Lab Adherent
RPMI 1640 + 10% FBS + 1% L-glutamine + PSA
MALME_3M Melanoma David Pellman’s
Lab Mixed
IMDM + 10% FBS + 2 mM L-glutamine + PSA
MDA_MB_435 Melanoma David Pellman’s
Lab Adherent
DMEM + 10% FBS + 2 mM L-glutamine + PSA
SK_OV_3 Ovarian David Pellman’s
Lab Adherent
RPMI 1640 + 10% FBS + 2 mM L-glutamine + PSA
DU_145 Prostate David Pellman’s
Lab Adherent
Eagles + 10% FBS + 2 mM L-glutamine + PSA
CAKI_1 Renal David Pellman’s
Lab Adherent McCoy’s + 10% FBS + PSA
RXF_393 Renal David
Hancock’s Lab Adherent
RPMI 1640 + 10% FBS + 2 mM L-glutamine + PSA

47
Supplementary Figure 6.1 – Death curves. A) Death curve of cell line HS578T. Geneticin antibiotic experiment was performed during 14 days and concentration of 100 µg/mL was chosen (minimal concentration that induces death in 100% of non-transformed cells). B) Death curve of HOP_92. 250 µg/mL is the lowest concentration that induces 100% of cell death.
Supplementary Figure 6.2 – Example of FACS results. This graph shows the relative abundance of cells positive for RFP. The grey curve represents the negative control and the red curve represents HS578T centrin-GFP histone-RFP. The part of the red curve that does not co-localize with the grey curve, corresponds to the RFP-positive cells.
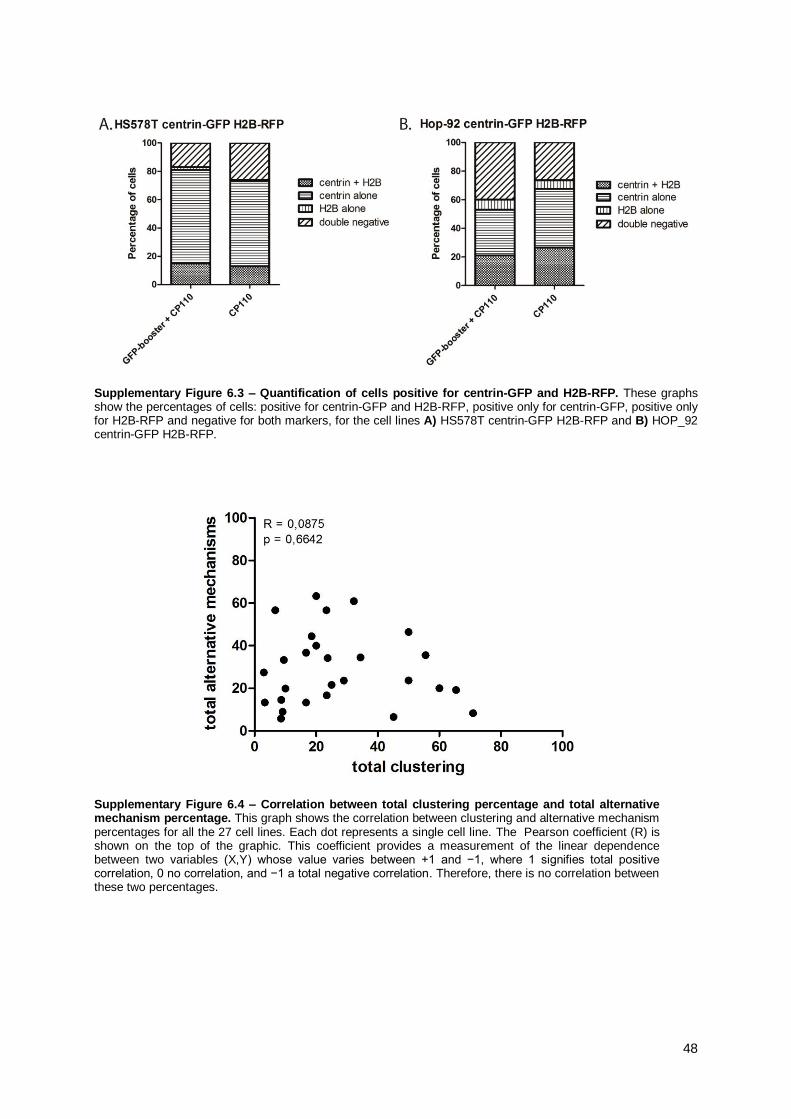
48
Supplementary Figure 6.3 – Quantification of cells positive for centrin-GFP and H2B-RFP. These graphs show the percentages of cells: positive for centrin-GFP and H2B-RFP, positive only for centrin-GFP, positive only for H2B-RFP and negative for both markers, for the cell lines A) HS578T centrin-GFP H2B-RFP and B) HOP_92 centrin-GFP H2B-RFP.
Supplementary Figure 6.4 – Correlation between total clustering percentage and total alternative mechanism percentage. This graph shows the correlation between clustering and alternative mechanism percentages for all the 27 cell lines. Each dot represents a single cell line. The Pearson coefficient (R) is shown on the top of the graphic. This coefficient provides a measurement of the linear dependence between two variables (X,Y) whose value varies between +1 and −1, where 1 signifies total positive correlation, 0 no correlation, and −1 a total negative correlation. Therefore, there is no correlation between these two percentages.
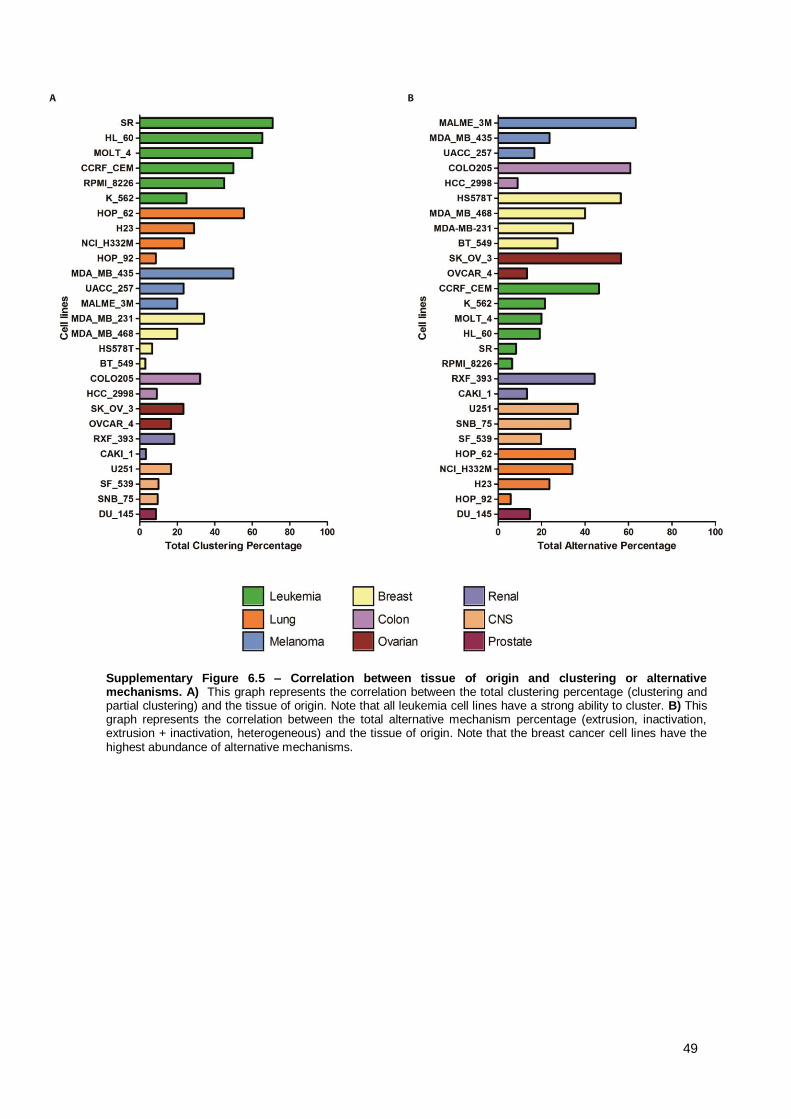
49
Supplementary Figure 6.5 – Correlation between tissue of origin and clustering or alternative mechanisms. A) This graph represents the correlation between the total clustering percentage (clustering and partial clustering) and the tissue of origin. Note that all leukemia cell lines have a strong ability to cluster. B) This graph represents the correlation between the total alternative mechanism percentage (extrusion, inactivation, extrusion + inactivation, heterogeneous) and the tissue of origin. Note that the breast cancer cell lines have the highest abundance of alternative mechanisms.
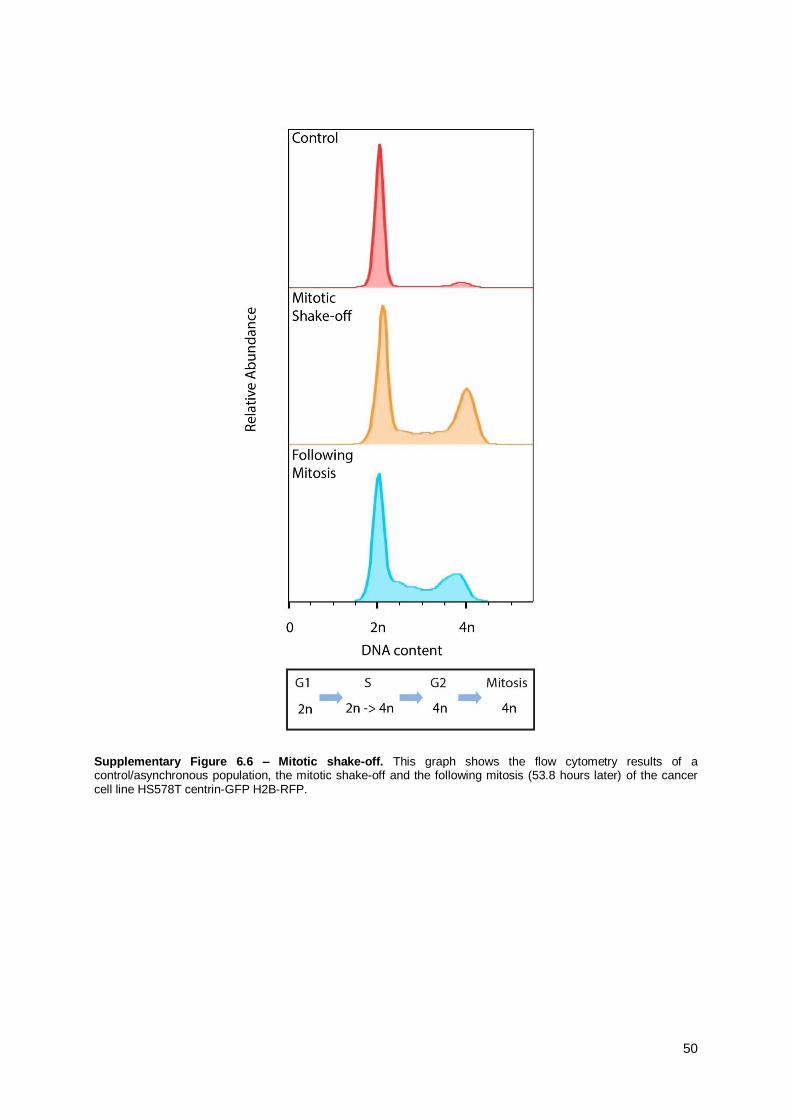
50
Supplementary Figure 6.6 – Mitotic shake-off. This graph shows the flow cytometry results of a control/asynchronous population, the mitotic shake-off and the following mitosis (53.8 hours later) of the cancer cell line HS578T centrin-GFP H2B-RFP.
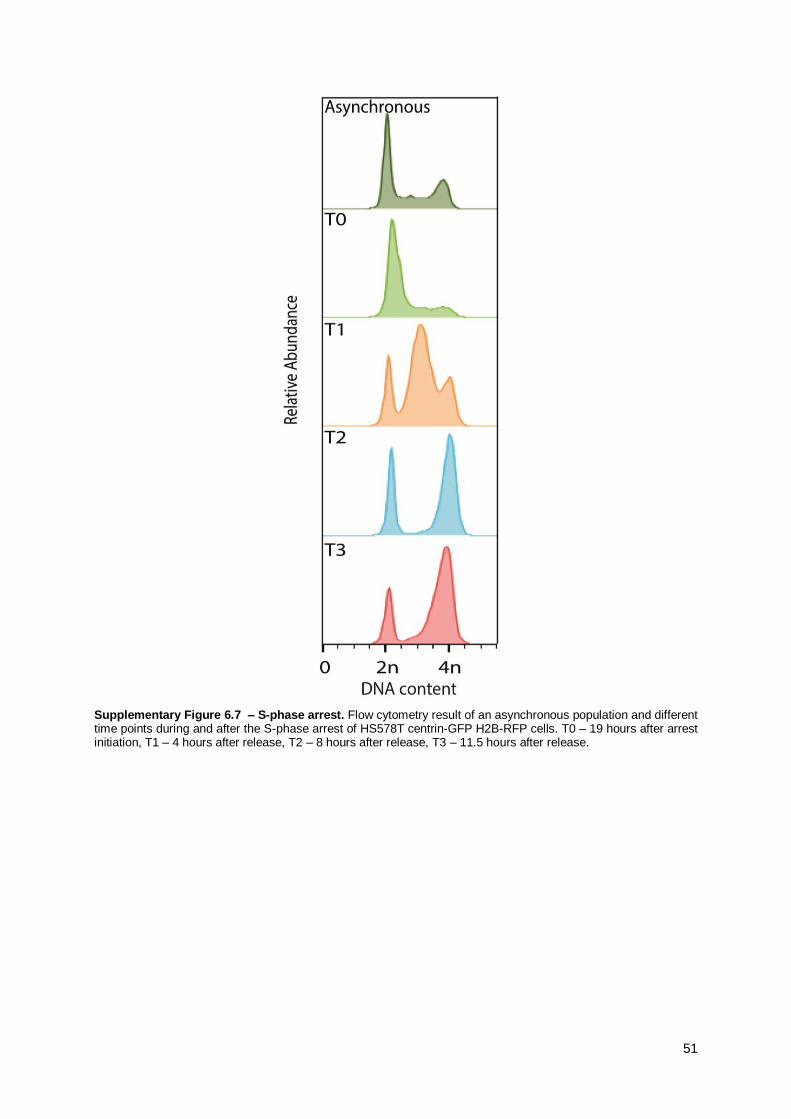
51
Supplementary Figure 6.7 – S-phase arrest. Flow cytometry result of an asynchronous population and different time points during and after the S-phase arrest of HS578T centrin-GFP H2B-RFP cells. T0 – 19 hours after arrest initiation, T1 – 4 hours after release, T2 – 8 hours after release, T3 – 11.5 hours after release.