Embed Size (px)
Citation preview
How dilute are dilute solutions in extensional flows?C. Clasen, J. P. Plog, W.-M. Kulicke, M. Owens, C. Macosko, L. E. Scriven, M. Verani,
and G. H. McKinley
Citation: Journal of Rheology (1978-present) 50, 849 (2006); doi: 10.1122/1.2357595 View online: http://dx.doi.org/10.1122/1.2357595 View Table of Contents: http://scitation.aip.org/content/sor/journal/jor2/50/6?ver=pdfcov Published by the The Society of Rheology Articles you may be interested in The rheology of dilute solutions of flexible polymers: Progress and problems J. Rheol. 49, 1 (2005); 10.1122/1.1835336 The effect of (2-hydroxypropyl)--cyclodextrin on rheology of hydrophobically end-cappedpoly(ethylene glycol) aqueous solutions J. Rheol. 48, 23 (2004); 10.1122/1.1631422 Transient extensional rheology of wormlike micelle solutions J. Rheol. 47, 1227 (2003); 10.1122/1.1603242 Extensional stress growth and stress relaxation in entangled polymer solutions J. Rheol. 47, 269 (2003); 10.1122/1.1530625 Effect of branching on the rheological properties of solutions of aromatic etherimidecopolymers J. Rheol. 45, 1245 (2001); 10.1122/1.1389313
Redistribution subject to SOR license or copyright; see http://scitation.aip.org/content/sor/journal/jor2/info/about. Downloaded to IP:
81.101.246.104 On: Fri, 09 May 2014 14:05:38
I
D
H
Wsfifi�euitnrptmtamctpdR
a
b
©J
Redistribution
How dilute are dilute solutions in extensional flows?
C. Clasen,a) J. P. Plog, and W.-M. Kulicke
nstitute of Technical and Macromolecular Chemistry, University of Hamburg,Germany
M. Owens,b) C. Macosko, and L. E. Scriven
epartment of Chemical Engineering and Material Science, University ofMinnesota, Minnesota
M. Verani and G. H. McKinley
atsopoulos Microfluids Laboratory, Massachusetts Institute of Technology,Cambridge, Massachusetts
(Received 15 March 2006; final revision received 16 June 2006�
Synopsis
e investigate the concentration dependence of the characteristic relaxation time of dilute polymerolutions in transient uniaxial elongational flow. A series of monodisperse polystyrene solutions ofve different molecular weights �1.8�106�M �8.3�106 g/mol� with concentrations spanningve orders of magnitude were dissolved in two solvents of differing solvent qualitydiethylphthalate and oligomeric styrene�. Optical measurements with a capillary breakupxtensional rheometer of the rate of filament thinning and the time to breakup in each fluid aresed to determine the characteristic relaxation time. A criterion for a lower sensitivity limit isntroduced, in the form of a minimum concentration cmin necessary for experimental resolution ofhe effects of polymeric viscoelasticity. This criterion is validated by experiment and comparison toumerical calculations with a multimode bead-spring dumbbell model. These calculations alsoationalize previous paradoxical observations of extensional thinning in fluid threads of ultradiluteolymer solutions in which stress relaxation apparently occurred faster than predicted by the Zimmheory. Above this minimum sensitivity limit we show that the effective relaxation time of
oderately dilute solutions �0.01�c /c*�1� in transient extensional flow rises substantially abovehe fitted value of the relaxation time extracted from small amplitude oscillatory shear flow andbove the Zimm relaxation time computed from kinetic theory and intrinsic viscosityeasurements. This effective relaxation time exhibits a power-law scaling with the reduced
oncentration �c /c*� and the magnitude of the exponent varies with the thermodynamic quality ofhe solvent. The scaling of this “self-concentration” effect appears to be roughly consistent to thatredicted when the dynamics of the partially elongated and overlapping polymer chains areescribed within the framework of blob theories for semi-dilute solutions. © 2006 The Society ofheology. �DOI: 10.1122/1.2357595�
�Present address: Department Chemische Ingenieurstechnieken, Katholieke Universiteit Leuven, Belgium; elec-tronic mail: [email protected]
�
Present address: Drug Coating Process Developments, Boston Scientific, Maple Grove, Minnesota.2006 by The Society of Rheology, Inc.849. Rheol. 50�6�, 849-881 November/December �2006� 0148-6055/2006/50�6�/849/33/$27.00
subject to SOR license or copyright; see http://scitation.aip.org/content/sor/journal/jor2/info/about. Downloaded to IP:
81.101.246.104 On: Fri, 09 May 2014 14:05:38
I
iccssdAp
ms
wmwt
tsahotea“le
rmfcwcpem
defpcm
850 CLASEN et al.
Redistribution
. INTRODUCTION
The critical overlap concentration of polymer coils, denoted c*, is one of the mostmportant characteristic values of a polymer solution. It is generally accepted that atoncentrations c /c*�O�1� the steric and frictional interactions of neighboring polymeroils are negligible and the rheological response of the fluid is solely governed by theum of the deformation and hydrodynamic interactions of the isolated polymer coils andolvent which comprise the polymer solution. When these conditions exist, the theoreticalescription of a dilute solution given by the Rouse/Zimm theory is expected to be valid.t higher concentrations the solution becomes semidilute and eventually entangled de-ending on the degree of overlap of adjacent coils and their molar mass.
Graessley �1980� provides a simple definition of c* that is widely accepted for de-arking the boundary separating the physical and rheological definition of dilute and
emidilute polymer solutions
c* =0.77
���, �1�
here ��� is the intrinsic viscosity of the polymer solution which depends on the molarass of the chain according to the Mark–Houwink–Sakurada equation ���=K���M
a,here K��� is a constant and the power-law index 0.5�a�0.8 varies with the quality of
he solvent.However, the definition of diluteness in Eq. �1� is only applicable for polymer coils
hat are not deformed greatly beyond their equilibrium configuration �for example inmall amplitude oscillatory shear �SAOS� flow�. In extensionally-dominated flow fields,t conditions which satisfy the coil-stretch transition ���=1/2� a polymer coil becomesighly extended, leading to an increased interaction volume within which the chains mayverlap, as reported by Dunlap and Leal �1987�. Consequently polymer-polymer interac-ions are possible even at concentrations c /c*�O�1�. The improper use of a near-quilibrium definition to characterize dynamic changes in conformation and the associ-ted rheological responses to deformation has lead to the recent introduction of the termultradilute” solution and a concentration of ultradilution, c�, below which polymer so-utions remain truly dilute even when the polymer chains are deformed well beyond theirquilibrium state �Harrison et al. �1998��.
Characterization of the rheological properties of dilute and ultradilute solutions hasarely been carried out in extensional flows, because the extensional rheometry of poly-er solutions has proven to be an experimental challenge far more complex than per-
orming rheological measurements in a steady or dynamic shear flow. The challenge inharacterizing extensional flows is to create and not disturb a homogeneous flow fieldhile employing a liquid whose rheological properties are simple enough that they can be
ompared with theory. Consequently, new methods for the quantitative study of diluteolymer solutions in extensional flows are desired. Recent developments in non-invasivexperimental methods for characterizing extensional flow fields are reviewed in theonograph by Nguyen and Kausch �1999�.The first mechanical studies of the state of stress for polymer solutions in a well-
efined uniaxial flow field were made by Sridhar et al. �Matta and Tytus �1990�; Sridhart al. �1991�� using the filament stretching device. A comparison of different approachesor realizing this type of experiment �Anna et al. �2001�� showed for the first time theossibility of quantitative determination of the transient extensional viscosity for well-haracterized dilute solutions in a purely uniaxial flow field. A recent overview of fila-
ent stretching rheometry is given in �McKinley and Sridhar �2002��. Filament stretchingsubject to SOR license or copyright; see http://scitation.aip.org/content/sor/journal/jor2/info/about. Downloaded to IP:
81.101.246.104 On: Fri, 09 May 2014 14:05:38
idibC�dtr��c
tedsstwdptIlH�rW�ttsqlcatt
rasTtjttpr
851DILUTE SOLUTIONS IN EXTENSIONAL FLOWS
Redistribution
nstruments are complex and expensive and, furthermore, reliable experiments are veryifficult for low viscosity fluids with zero shear-rate viscosities less than �0.5 Pa s due tonertial and gravitational effects �McKinley and Sridhar �2002��. Recent studies of jetreakup �Christanti and Walker �2001�� and drop pinch-off �Amarouchene et al. �2001�;ooper-White et al. �2002�� as well as the groundbreaking work of Entov and co-workers
Entov et al. �1988�; Bazilevskii et al. �1990, 1997�; Entov and Hinch �1997�� haveemonstrated the efficacy of capillarity-driven thinning flows for the determination ofransient extensional material functions. Capillary-thinning devices have been developedecently by a number of laboratories �Liang and Mackley �1994�; Kolte and Szabo1999�; McKinley and Tripathi �2000�; Stelter and Brenn �2000�; Anna and McKinley2001�; Bazilevskii et al. �2001�; Stelter et al. �2002�� and the dynamics of the elasto-apillary thinning process are reviewed in McKinley �2005�.
It is important to note the distinctions between the dynamics of capillary thinning andhose of filament stretching rheometry for dilute polymer solutions. For example, Guptat al. �2000� investigated the effects of varying the concentration and molar mass ofilute and semidilute polystyrene solutions on the extensional stress growth in filamenttretching experiments. In order to ensure elastic stresses were large enough to be mea-ured accurately and in order to overcome gravitational effects, they had to perform theests at large extension rates �, corresponding to Weissenberg numbers Wi=�0��1here �0 is the longest relaxation time of the polymer solution. In this limit, the chaineformation becomes increasingly affine, and Brownian dynamics simulations and ex-eriments both show that the measured curves of the transient extensional viscosity begino superpose and approach a single limiting curve as a function of strain �Larson �2005��.t is thus very difficult to probe directly the effects of concentration changes on theongest relaxation time of the solution. By contrast, the theoretical analysis by Entov andinch �1997�, in conjunction with supporting experimental data �Anna and McKinley
2001��, shows that the elastocapillary balance achieved in capillary-thinning experimentsesults in a natural stretching rate of �=2/ �3�0� or, equivalently, a Weissenberg number
i=�0�=2/3. This self-selected value is just sufficiently above the critical value of 0.5corresponding to the coil-stretch transition� to keep the polymer chain stretching suchhat the growing elastic stress balances the increasing level of capillary pressure in thehinning cylindrical thread. All of the shorter relaxation modes in the chain experience theame elongation rate �, corresponding to Weissenberg numbers below 0.5, and conse-uently their contributions to the material response decay. The dynamics of elastocapil-ary thinning are therefore controlled directly by the longest relaxation process whichorresponds to the relaxation-controlled unraveling of the entire chain. Capillary thinningnd break-up experiments thus provide a convenient means for probing chain-chain in-eractions as a function of polymer concentration through measurements of the charac-eristic time scale of the solution in a strong extensional flow.
Several investigations of transient elongational behaviour have been reported for aange of different polymers and molar masses �Liang and Mackley �1994�; Bazilevskii etl. �1997�; Stelter and Brenn �2000�; Anna and McKinley �2001�; Anna et al. �2001�� inemidilute to dilute solutions. Recently Bazilevskii et al. �2001�, Stelter et al. �2002� andirtaatmadja et al. �2006� have studied flexible polymers in dilute and ultradilute solu-
ion, finding that the characteristic relaxation time extracted from capillary-thinning oret-thinning experiments continues to depend strongly on the concentration even belowhe critical overlap concentration c*, in contrast to expectations of the Rouse/Zimmheory. In addition, Bazilevskii et al. and Tirtaatmadja et al. observed a power-law de-endency of the relaxation time on the concentration. Similar power-law variations of the
heological properties for apparently dilute aqueous polymer solutions have also beensubject to SOR license or copyright; see http://scitation.aip.org/content/sor/journal/jor2/info/about. Downloaded to IP:
81.101.246.104 On: Fri, 09 May 2014 14:05:38
oSt�0Z
tppsatwab
m�woiIsbatd
I
A
AAaMrsBs
d
wta
852 CLASEN et al.
Redistribution
bserved by Kalashnikov �1994� and by Tam and Tiu �1993�. We also note that whereastelter et al., Tirtaatmadja et al., and Christanti and Walker �2001� all reported relaxation
imes that exceeded the expected relaxation time from the Zimm theory, Bazilevskii et al.2001� also found that for very dilute solutions �down to concentrations as low as.2 ppm� the power-law scaling lead to relaxation times that fell below the predictedimm relaxation time.
In order to resolve this discrepancy, the present paper focuses on a detailed investiga-ion of the capillary-thinning dynamics and breakup for dilute and ultradilute monodis-erse polymer solutions. In order to quantitatively analyze the elastocapillary thinningrocess and extract the longest relaxation time for very dilute solutions it is first neces-ary to reconsider carefully the fluid dynamics of filament thinning, in particular tonswer the question of how much of the tensile stress in the thinning thread is carried byhe polymer and how much by the solvent. In other words, we seek to understand underhat physical conditions a coil-stretch transition that occurs on the molecular scale can
ffect the resulting macroscopic fluid dynamics. This provides an effective distinctionetween a dilute and an ultradilute polymer solution for this particular flow configuration.
In this paper we present experimental investigations of capillary thinning using higholar masses and nearly monodisperse polystyrene samples �1.8�M �8.3106 g/mol�. The chains are dissolved in two different high and low viscosity solventsith qualities ranging from good �diethylphthalate� to near theta conditions �styreneligomer� over a range of concentrations spanning five orders of magnitudes. We thusnvestigate the elongational response under semidilute, dilute, and ultradilute conditions.n addition, numerical calculations �using a multimode FENE-P formulation� of the tran-ient stress evolution in the thinning filament are used to determine the relative contri-ution of the polymer chains to the overall stress balance as a function of concentrationnd molar mass. This enables us to determine the lower sensitivity limit of the capillary-hinning technique and to identify systematic discrepancies that can arise under veryilute conditions.
I. EXPERIMENT AND ANALYSIS METHODS
. Sample preparation
The polystyrene samples were provided by Polysciences Inc., Warrington, PA, �sample: Mw=1.8�106 g/mol, and sample D: Mw=6.0�106 g/mol�, Polymer Laboratories,mherst, MA �sample C: Mw=5.7�106 g/mol and sample E: Mw=8.3�106 g/mol�,
nd also Polymer Standard Services, Ontario, NY �sample B: Mw=2.8�106 g/mol�.olar mass Mw and polydispersity Mw /Mn were verified by size exclusion chromatog-
aphy with a multiangle light scattering detector. Two different batches of oligomerictyrene with a degree of polymerization of �5 �Piccolastic A-5 Resin� as a solvent foroger fluids were provided by Hercules, �Wilmington, DE�. The diethylphthalate �DEP�
olvent was supplied by Merck, �Darmstadt, Germany� and used as received.The solutions of polystyrene in styrene oligomer �Boger fluids� were prepared in two
ifferent ways:�a� Sample A �0.166 wt % �, sample B �0.025 wt % �, and sample D �0.107 wt % �
ere prepared by adding the polymer to the oligomer at room temperature and placinghe samples in an oven at 100 °C, without stirring �samples A and D� and with repeatedgitation �sample B�, until the polymer dissolved over several weeks.
�b� Sample C �0.25 wt % � and sample E �0.1 wt % � were prepared by dissolving the
subject to SOR license or copyright; see http://scitation.aip.org/content/sor/journal/jor2/info/about. Downloaded to IP:
81.101.246.104 On: Fri, 09 May 2014 14:05:38
prs
a
aa
iuGoSpdvsvtpaTaK
B
uN
Tfl
T
853DILUTE SOLUTIONS IN EXTENSIONAL FLOWS
Redistribution
olymer in minute amounts of toluene, mixing with the oligomer and continuous evapo-ation of the toluene at 10 Pa pressure under steady agitation of the sample at 50 °C overeveral weeks, controlling the evaporation process by weight.
The different concentrations used in the experiments were achieved by diluting thebove samples with the respective batch of Piccolastic A-5.
Preparation of the polystyrene/DEP solutions involved dissolving the respectivemount of polymer in the solvent. Homogenization was achieved by slow continuousgitation over a period of time not shorter than 7 days.
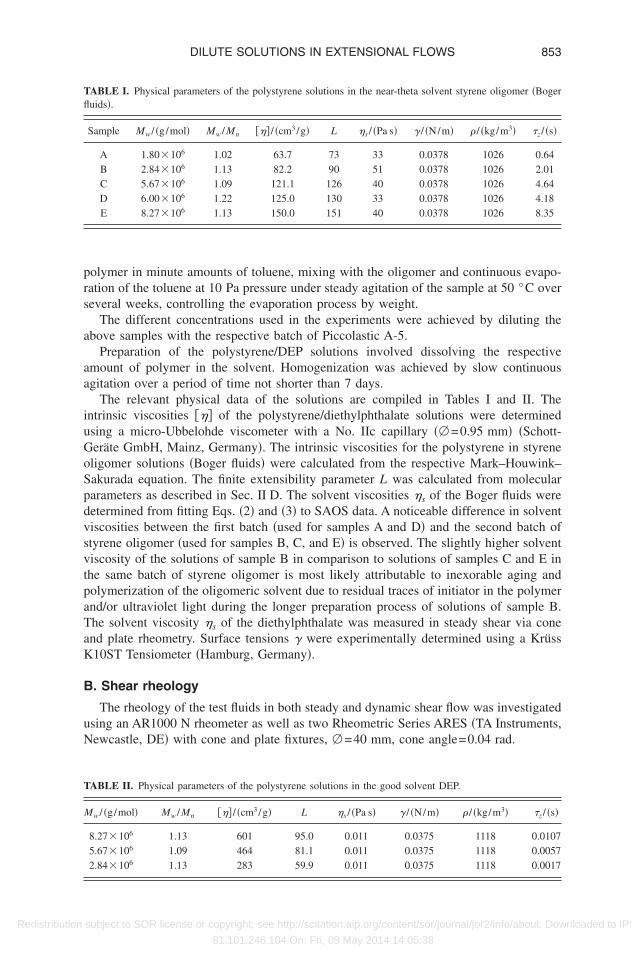
The relevant physical data of the solutions are compiled in Tables I and II. Thentrinsic viscosities ��� of the polystyrene/diethylphthalate solutions were determinedsing a micro-Ubbelohde viscometer with a No. IIc capillary ��=0.95 mm� �Schott-eräte GmbH, Mainz, Germany�. The intrinsic viscosities for the polystyrene in styreneligomer solutions �Boger fluids� were calculated from the respective Mark–Houwink–akurada equation. The finite extensibility parameter L was calculated from moleculararameters as described in Sec. II D. The solvent viscosities �s of the Boger fluids wereetermined from fitting Eqs. �2� and �3� to SAOS data. A noticeable difference in solventiscosities between the first batch �used for samples A and D� and the second batch oftyrene oligomer �used for samples B, C, and E� is observed. The slightly higher solventiscosity of the solutions of sample B in comparison to solutions of samples C and E inhe same batch of styrene oligomer is most likely attributable to inexorable aging andolymerization of the oligomeric solvent due to residual traces of initiator in the polymernd/or ultraviolet light during the longer preparation process of solutions of sample B.he solvent viscosity �s of the diethylphthalate was measured in steady shear via conend plate rheometry. Surface tensions were experimentally determined using a Krüss10ST Tensiometer �Hamburg, Germany�.
. Shear rheology
The rheology of the test fluids in both steady and dynamic shear flow was investigatedsing an AR1000 N rheometer as well as two Rheometric Series ARES �TA Instruments,ewcastle, DE� with cone and plate fixtures, �=40 mm, cone angle=0.04 rad.
ABLE I. Physical parameters of the polystyrene solutions in the near-theta solvent styrene oligomer �Bogeruids�.
Sample Mw / �g/mol� Mw /Mn ��� / �cm3/g� L �s / �Pa s� / �N/m� / �kg/m3� �z / �s�
A 1.80�106 1.02 63.7 73 33 0.0378 1026 0.64B 2.84�106 1.13 82.2 90 51 0.0378 1026 2.01C 5.67�106 1.09 121.1 126 40 0.0378 1026 4.64D 6.00�106 1.22 125.0 130 33 0.0378 1026 4.18E 8.27�106 1.13 150.0 151 40 0.0378 1026 8.35
ABLE II. Physical parameters of the polystyrene solutions in the good solvent DEP.
Mw / �g/mol� Mw /Mn ��� / �cm3/g� L �s / �Pa s� / �N/m� / �kg/m3� �z / �s�
8.27�106 1.13 601 95.0 0.011 0.0375 1118 0.01075.67�106 1.09 464 81.1 0.011 0.0375 1118 0.00572.84�106 1.13 283 59.9 0.011 0.0375 1118 0.0017
subject to SOR license or copyright; see http://scitation.aip.org/content/sor/journal/jor2/info/about. Downloaded to IP:
81.101.246.104 On: Fri, 09 May 2014 14:05:38
blas
waBa
wpdl
Fdapdmgr
c�bia�p
C
veetd
854 CLASEN et al.
Redistribution
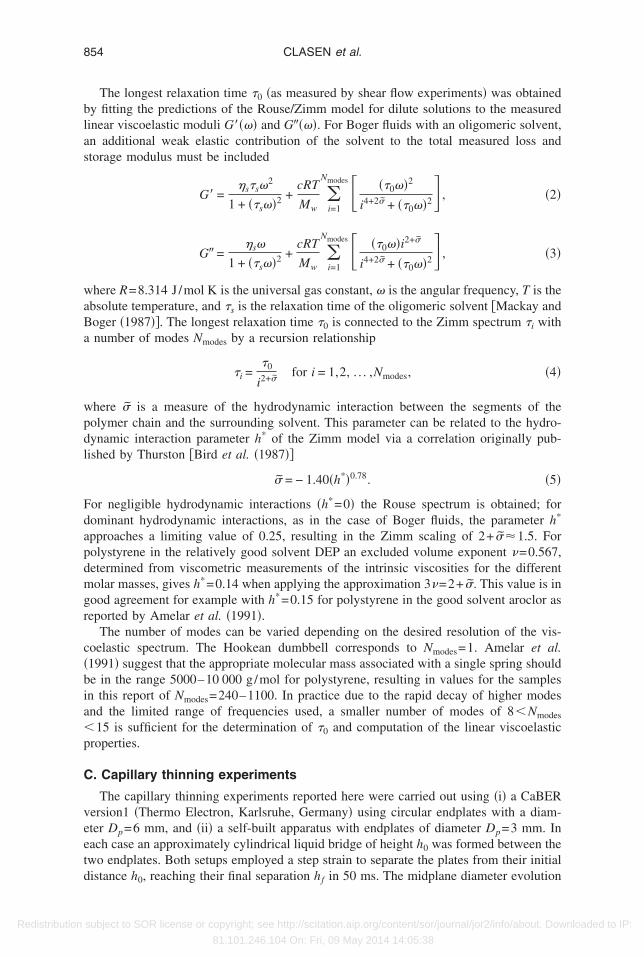
The longest relaxation time �0 �as measured by shear flow experiments� was obtainedy fitting the predictions of the Rouse/Zimm model for dilute solutions to the measuredinear viscoelastic moduli G���� and G����. For Boger fluids with an oligomeric solvent,n additional weak elastic contribution of the solvent to the total measured loss andtorage modulus must be included
G� =�s�s�
2
1 + ��s��2 +cRT
Mw�i=1
Nmodes � ��0��2
i4+2� + ��0��2� , �2�
G� =�s�
1 + ��s��2 +cRT
Mw�i=1
Nmodes � ��0��i2+�
i4+2� + ��0��2� , �3�
here R=8.314 J /mol K is the universal gas constant, � is the angular frequency, T is thebsolute temperature, and �s is the relaxation time of the oligomeric solvent �Mackay andoger �1987��. The longest relaxation time �0 is connected to the Zimm spectrum �i withnumber of modes Nmodes by a recursion relationship
�i =�0
i2+�for i = 1,2, . . . ,Nmodes, �4�
here � is a measure of the hydrodynamic interaction between the segments of theolymer chain and the surrounding solvent. This parameter can be related to the hydro-ynamic interaction parameter h* of the Zimm model via a correlation originally pub-ished by Thurston �Bird et al. �1987��
� = − 1.40�h*�0.78. �5�
or negligible hydrodynamic interactions �h*=0� the Rouse spectrum is obtained; forominant hydrodynamic interactions, as in the case of Boger fluids, the parameter h*
pproaches a limiting value of 0.25, resulting in the Zimm scaling of 2+ �1.5. Forolystyrene in the relatively good solvent DEP an excluded volume exponent =0.567,etermined from viscometric measurements of the intrinsic viscosities for the differentolar masses, gives h*=0.14 when applying the approximation 3 =2+ �. This value is in
ood agreement for example with h*=0.15 for polystyrene in the good solvent aroclor aseported by Amelar et al. �1991�.
The number of modes can be varied depending on the desired resolution of the vis-oelastic spectrum. The Hookean dumbbell corresponds to Nmodes=1. Amelar et al.1991� suggest that the appropriate molecular mass associated with a single spring shoulde in the range 5000–10 000 g/mol for polystyrene, resulting in values for the samplesn this report of Nmodes=240–1100. In practice due to the rapid decay of higher modesnd the limited range of frequencies used, a smaller number of modes of 8�Nmodes
15 is sufficient for the determination of �0 and computation of the linear viscoelasticroperties.
. Capillary thinning experiments
The capillary thinning experiments reported here were carried out using �i� a CaBERersion1 �Thermo Electron, Karlsruhe, Germany� using circular endplates with a diam-ter Dp=6 mm, and �ii� a self-built apparatus with endplates of diameter Dp=3 mm. Inach case an approximately cylindrical liquid bridge of height h0 was formed between thewo endplates. Both setups employed a step strain to separate the plates from their initial
istance h0, reaching their final separation hf in 50 ms. The midplane diameter evolutionsubject to SOR license or copyright; see http://scitation.aip.org/content/sor/journal/jor2/info/about. Downloaded to IP:
81.101.246.104 On: Fri, 09 May 2014 14:05:38
wciumPt
wa
D
fttt�
olTcdlscp
fgoit
dl
855DILUTE SOLUTIONS IN EXTENSIONAL FLOWS
Redistribution
as followed using a laser micrometer �CaBER� or a Cohu charge coupled device �CCD�amera recording at 30 frames/s �self-built apparatus�. The aspect ratio increases from annitial value �0=h0 /Dp to a final aspect ratio � f =hf /Dp. In the present experiments wese �0=0.5 and � f =1.3 �CaBER� or �0=1.0 and � f =2.5 �self-built apparatus� to mini-ize the pertubative effects of gravitational forces and fluid inertia �Slobozhanin anderales �1993�� and thus to keep the height h0 of the fluid sample on the order of or below
he capillary length lcap,
h0 � lcap =
g�6�
ith the surface tension and the fluid density . For further details on the geometry andspect ratios see Rodd et al. �2005�.
. Numerical calculations of elastocapillary thinning
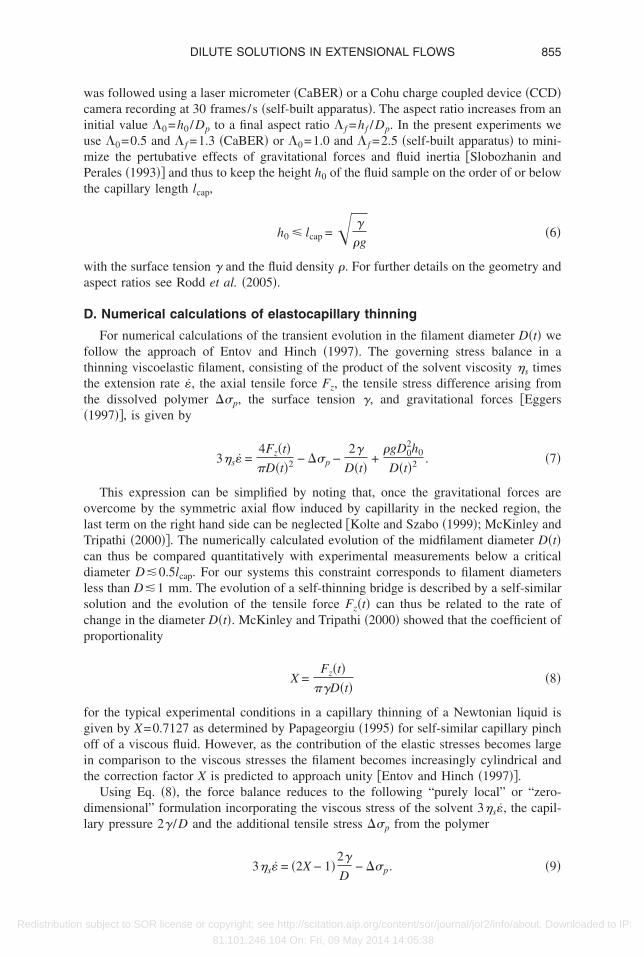
For numerical calculations of the transient evolution in the filament diameter D�t� weollow the approach of Entov and Hinch �1997�. The governing stress balance in ahinning viscoelastic filament, consisting of the product of the solvent viscosity �s timeshe extension rate �, the axial tensile force Fz, the tensile stress difference arising fromhe dissolved polymer ��p, the surface tension , and gravitational forces �Eggers1997��, is given by
3�s� =4Fz�t��D�t�2 − ��p −
2
D�t�+
gD02h0
D�t�2 . �7�
This expression can be simplified by noting that, once the gravitational forces arevercome by the symmetric axial flow induced by capillarity in the necked region, theast term on the right hand side can be neglected �Kolte and Szabo �1999�; McKinley andripathi �2000��. The numerically calculated evolution of the midfilament diameter D�t�an thus be compared quantitatively with experimental measurements below a criticaliameter D�0.5lcap. For our systems this constraint corresponds to filament diametersess than D�1 mm. The evolution of a self-thinning bridge is described by a self-similarolution and the evolution of the tensile force Fz�t� can thus be related to the rate ofhange in the diameter D�t�. McKinley and Tripathi �2000� showed that the coefficient ofroportionality
X =Fz�t�
�D�t��8�
or the typical experimental conditions in a capillary thinning of a Newtonian liquid isiven by X=0.7127 as determined by Papageorgiu �1995� for self-similar capillary pinchff of a viscous fluid. However, as the contribution of the elastic stresses becomes largen comparison to the viscous stresses the filament becomes increasingly cylindrical andhe correction factor X is predicted to approach unity �Entov and Hinch �1997��.
Using Eq. �8�, the force balance reduces to the following “purely local” or “zero-imensional” formulation incorporating the viscous stress of the solvent 3�s�, the capil-ary pressure 2 /D and the additional tensile stress ��p from the polymer
3�s� = �2X − 1�2
− ��p. �9�
Dsubject to SOR license or copyright; see http://scitation.aip.org/content/sor/journal/jor2/info/about. Downloaded to IP:
81.101.246.104 On: Fri, 09 May 2014 14:05:38
d
otn�
a
ws
p
toa
s
856 CLASEN et al.
Redistribution
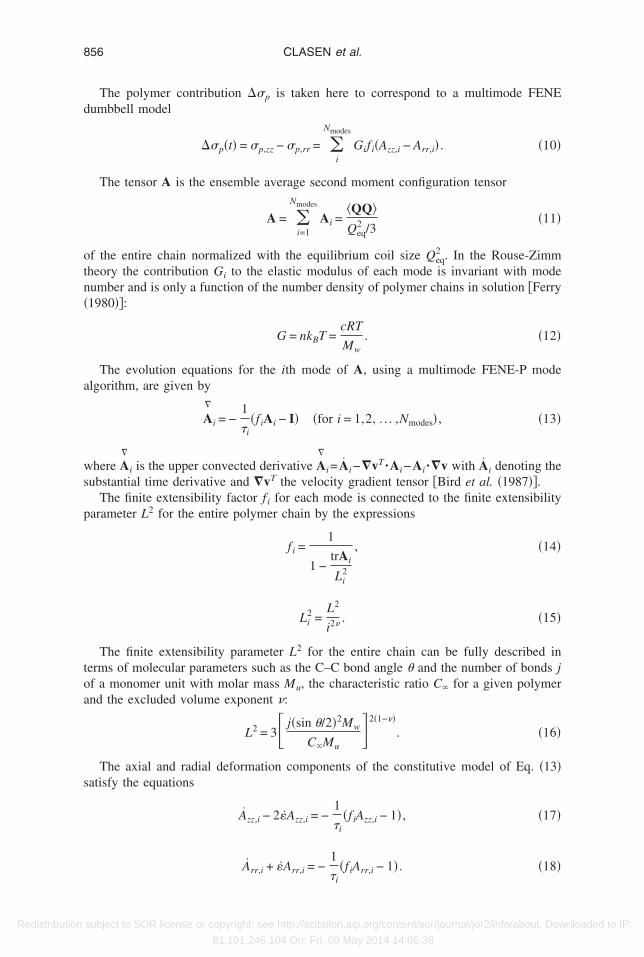
The polymer contribution ��p is taken here to correspond to a multimode FENEumbbell model
��p�t� = �p,zz − �p,rr = �i
Nmodes
Gifi�Azz,i − Arr,i� . �10�
The tensor A is the ensemble average second moment configuration tensor
A = �i=1
Nmodes
Ai =�QQ�Qeq
2 /3�11�
f the entire chain normalized with the equilibrium coil size Qeq2 . In the Rouse-Zimm
heory the contribution Gi to the elastic modulus of each mode is invariant with modeumber and is only a function of the number density of polymer chains in solution �Ferry1980��:
G = nkBT =cRT
Mw. �12�
The evolution equations for the ith mode of A, using a multimode FENE-P modelgorithm, are given by
A�
i = −1
�i�f iAi − I� �for i = 1,2, . . . ,Nmodes� , �13�
here A�
i is the upper convected derivative A�
i= Ai−�vT ·Ai−Ai ·�v with Ai denoting theubstantial time derivative and �vT the velocity gradient tensor �Bird et al. �1987��.
The finite extensibility factor f i for each mode is connected to the finite extensibilityarameter L2 for the entire polymer chain by the expressions
f i =1
1 −trAi
Li2
, �14�
Li2 =
L2
i2 . �15�
The finite extensibility parameter L2 for the entire chain can be fully described inerms of molecular parameters such as the C–C bond angle � and the number of bonds jf a monomer unit with molar mass Mu, the characteristic ratio C� for a given polymernd the excluded volume exponent :
L2 = 3� j�sin �/2�2Mw
C�Mu�2�1− �
. �16�
The axial and radial deformation components of the constitutive model of Eq. �13�atisfy the equations
Azz,i − 2�Azz,i = −1
�i�f iAzz,i − 1� , �17�
Arr,i + �Arr,i = −1
�f iArr,i − 1� . �18�
�isubject to SOR license or copyright; see http://scitation.aip.org/content/sor/journal/jor2/info/about. Downloaded to IP:
81.101.246.104 On: Fri, 09 May 2014 14:05:38
pbl
o
scpssc
httian
s�r=
tt
tbdd�svN�t
857DILUTE SOLUTIONS IN EXTENSIONAL FLOWS
Redistribution
The time-varying deformation rate � in a capillary thinning experiment can be ex-ressed in terms of the rate of necking of the diameter D through the continuity equationy equating the local velocity gradients at the mid-plane in the axial and radial directions,eading to
� =− 2
DD . �19�
This expression, when combined with the force balance from Eq. �9� and the definitionf elastic stress in Eq. �10�, defines the overall stress balance
�2X − 1�2
D= 3�s� +
cRT
Mw�i=1
Nmodes
f i�Azz,i − Arr,i� . �20�
Equations �17�–�20� form a coupled set of ordinary differential equations that can beolved numerically to describe the temporal evolution of the midfilament diameter duringapillary thinning. Input parameters are given by the independently measured physicalarameters of the polymer chain and the solution �molar mass Mw, finite extensibility L2,urface tension , density , solution viscosity �0, and solvent viscosity �s� and the initialtate of the filament after cessation of the sudden extension �initial diameter D0 and initialonformation Azz,i
0 �.We set Nmodes=8 for the following calculations. The �low� number of modes chosen
ere is justifiable by noting that during the period when elastic stresses dominate filamenthinning the self-selected Weissenberg number for the flow is Wi=�0�=2/3, and is de-ermined by the longest mode �Entov and Hinch �1997��. All other modes Ni for�1 are in a relaxed state since their respective Weissenberg numbers �given by Eq. �4��re below 0.5 until very near the end of the stretching process. These modes therefore doot contribute significantly to the total stress.
The unknown initial conformation and the initial stretch of the polymer after the steptrain can be estimated according to the procedure proposed by Anna and McKinley2001�. We assume that all three terms in Eq. �9� initially balance each other during theearrangement of the fluid column at the cessation of the initial stretch. By replacing �2/ �3�0� in the viscous contribution we obtain
2
D0−
2�s
�0=
cRT
Mw�i=1
Nmodes
Azz,i0 . �21�
For the numerical calculations we assume an even distribution of the initial deforma-ion over all modes; however, the numerical solutions were not sensitive to the choice ofhis initial deformation.
The parameter X in Eqs. �8� and �20� is not constant over time. As the contribution ofhe elastic stresses becomes large in comparison to the viscous stresses the filamentecomes increasingly cylindrical and the factor X should approach unity. A self-consistentetermination of the axial force in the filament FZ�t� requires a full one- or two-imensional numerical analysis of the thinning dynamics �Yao et al. �2000�; Clasen et al.2006�� which is beyond the scope of the present study. The effect of varying X is rathermall; however, for consistency in the numerical calculations, we retain the factor X forery low polymer concentrations in order to describe accurately the initial part of theewtonian flow region. We adjust X and vary the value from 0.7127 for the pure solvent
c→0� to unity for polymer solutions which show a clear onset of polymeric effects in
he necking process.subject to SOR license or copyright; see http://scitation.aip.org/content/sor/journal/jor2/info/about. Downloaded to IP:
81.101.246.104 On: Fri, 09 May 2014 14:05:38
essdm
E
riwib�t
oinuesc
Fefraf
858 CLASEN et al.
Redistribution
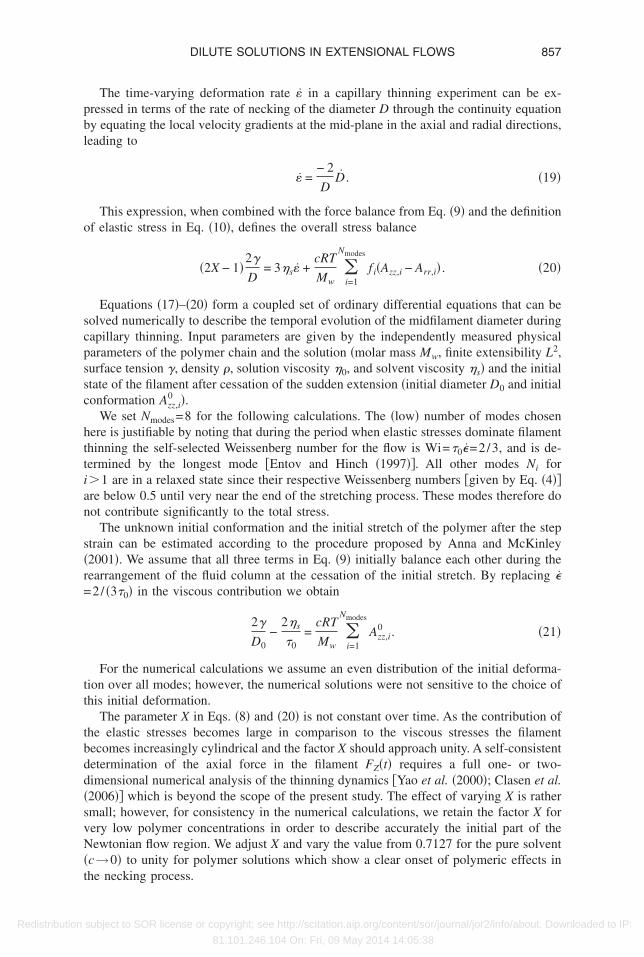
An example of the agreement between experimental measurements of the diametervolution and the corresponding numerical calculations is shown in Fig. 1 for a dilutioneries of the Boger fluid from sample E �Mw=8.3�106 g/mol�, with the concentrationpanning five orders of magnitude. Similar levels of agreement are obtained for eachilution series, and we now proceed to examine how to analyze experimental measure-ents of filament profiles.
. Determination of relaxation times from elastocapillary regime
Although we have just demonstrated above how it is possible to determine the longestelaxation time �0 by fitting the entire capillary thinning data, usually a simpler analysiss employed. As noted by Entov and Hinch �1997� for a viscoelastic polymer solution inhich the chains become highly stretched, Eq. �9� offers the possibility of an elastocap-
llary balance. The viscous stress of the solvent is negligibly small and the filamentecomes a cylindrical thread �X=1�. Provided finite extensibility effects are not importantL2→��, the decay rate in the measured diameter depends only on the longest relaxationime and is given by �Entov and Hinch �1997�; Clasen et al. �2006��:
D�t�D0
= GD0
4�1/3
exp�− t/3�0� . �22�
The additional factor of 2−1/3 in the prefactor of Eq. �22�, obtained from a completene-dimensional self-similar analysis is missing in the original theory due to a simplify-ng approximation in the zero-dimensional theory �Clasen et al. �2006��, though this doesot change the exponential decay rate. The longest relaxation time �0 of the polymersndergoing molecular relaxation-controlled unraveling in the thinning filament can beasily obtained from this relationship by determining the slope of the linear regime in aemilog plot as shown in Fig. 1 by the dashed lines. The validity of this approach and its
IG. 1. Comparison of the numerically calculated evolution in the filament diameter �open symbols� withxperimental data from capillary thinning experiments �closed symbols� for a dilution series of the Boger fluidrom sample E �Mw=8.3�106 g/mol� for different concentrations spanning 0.1�c�1000 ppm. In addition theelaxation times �exp, determined from fitting the elasto-capillary thinning regime �Eq. �22�� of the experiments,nd �num, determined from fitting the numerical calculations �Eqs. �17�–�21�� to the experimental data, are givenor selected concentrations.
onsistency with other methods has been reported in several publications for a range of
subject to SOR license or copyright; see http://scitation.aip.org/content/sor/journal/jor2/info/about. Downloaded to IP:
81.101.246.104 On: Fri, 09 May 2014 14:05:38
d�aPcn
bigfid
gsetebprtIntelbdp
I
A
gestc
fmidbi
ot
859DILUTE SOLUTIONS IN EXTENSIONAL FLOWS
Redistribution
ifferent polymers, molar masses and concentrations in dilute to semidilute solutionsLiang and Mackley �1994�; Bazilevskii et al. �1997�; Stelter and Brenn �2000�; Annand McKinley �2001�; Anna et al. �2001�; Bazilevskii et al. �2001�; Stelter et al. �2002�;log et al. �2005��. In all of these cases, provided there is a sufficiently large polymeroncentration, an elastocapillary balance holds for a long enough period that the expo-ential decay of the filament can be observed and the data regressed to Eq. �22�.
However, as we show in detail later, the more dilute a solution becomes, the harder itecomes to detect a distinct regime of purely exponential thinning. This is because thenitial Newtonian flow and the finite extensibility of the polymer chains cannot be ne-lected during the short intermediate regime of exponential thinning. Nevertheless, linearts of experimental data on a semilog-plot to Eq. �22� are often performed even for veryilute solutions to extract a relaxation time and initially we will follow this procedure.
The numerical calculations described in Sec. II D result in predicted profiles for therowth in the elastic stress and the decay rate of the filament diameter. The latter expres-ion can be compared directly with the experimental observations. In cases for which thexponential decay of the filament could be observed over sufficiently long periods ofime, the longest relaxation time �0 determined from reliable regressions of Eq. �22� toxperimental data and the relaxation time used in numerical calculations coincide as cane seen for example in Fig. 1 for a concentration of 100 ppm. However, for very lowolymer concentrations the numerically predicted profile, calculated using the apparentelaxation time obtained from regressing the data in the very brief period of exponentialhinning, does not match the experimentally observed evolution in the filament diameter.n these cases we use �0 as an adjustable parameter to fit the experiments with theumerical calculations and thus determine the governing relaxation time �0 for filamenthinning. This discrepancy between an apparent longest relaxation time, determined fromxperimental data in the elastocapillary thinning regime according to Eq. �22� �dashedine�, and the longest relaxation time determined by fitting the numerical calculations cane observed in Fig. 1 for a concentration of 10 ppm. In Sec. III we will compare �0 asetermined by Eq. �22� to the value obtained by fitting with numerical calculations androvide a criterion for conditions under which Eq. �22� may be safely used.
II. RESULTS AND DISCUSSION
. Capillary thinning
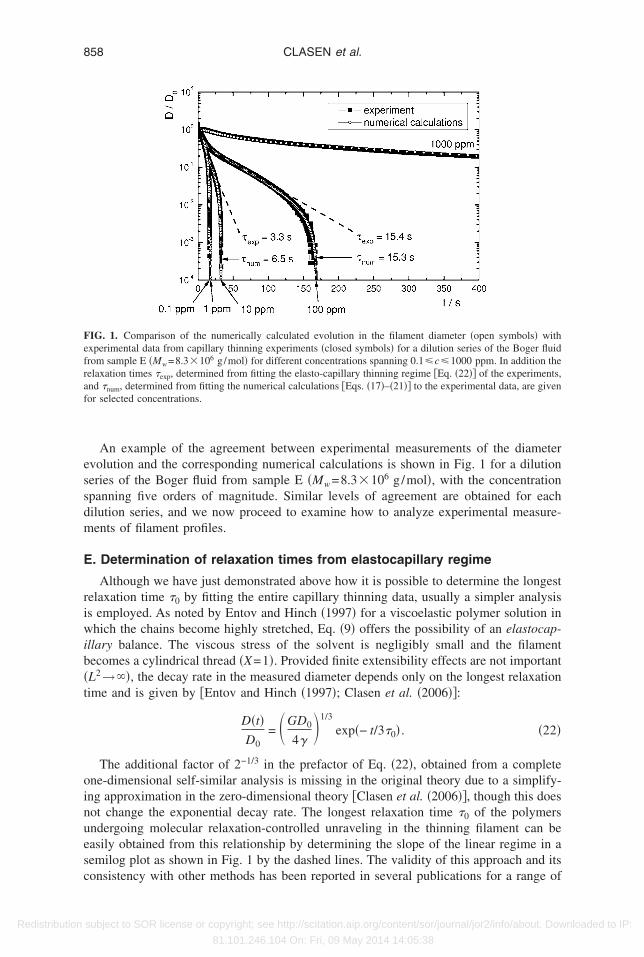
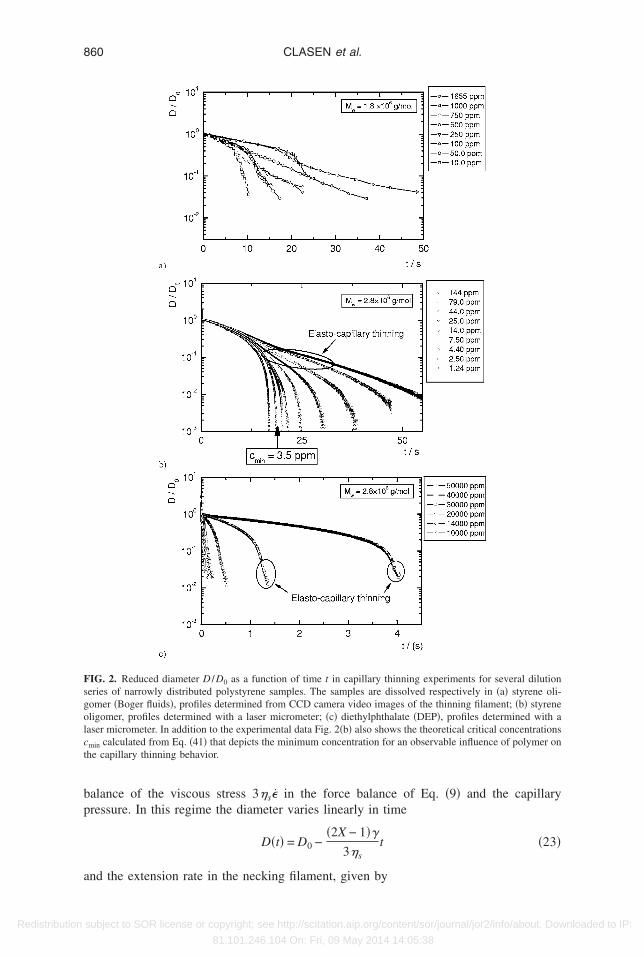
We first present our experimental measurements of capillary thinning in viscous oli-omeric solvents and in the low viscosity DEP solvent. Figure 2 depicts the temporalvolution of the midplane diameter that can be determined experimentally. The figurehows three representative dilution series that demonstrate the critical characteristics ofhe thinning behaviour, the complete data set for all of the capillary thinning experimentsan be found in the Appendix.
Figure 2�a� shows the filament evolution of Boger fluids determined by analyzing stillrames captured by a CCD camera. It is evident that the diameter resolution of thisethod is lower than that of the laser micrometer shown in Fig. 2�b� for Boger fluids and
n Fig. 2�c� for diethylphthalate solutions. However, determination of the exponentialecay of the diameter with time according to Eq. �22� is still possible using Fig. 2�a�ecause the onset of finite extensibility effects occurs below the resolution limit of themaging system.
It can clearly be seen from Figs. 2�a� and 2�b�, that at early times the necking behaviorf all solutions follows the thinning behavior of the Newtonian solvent as expected from
he analysis of Entov and Hinch �1997�. The necking is controlled by a viscocapillarysubject to SOR license or copyright; see http://scitation.aip.org/content/sor/journal/jor2/info/about. Downloaded to IP:
81.101.246.104 On: Fri, 09 May 2014 14:05:38
bp
a
Fsgolct
860 CLASEN et al.
Redistribution
alance of the viscous stress 3�s� in the force balance of Eq. �9� and the capillaryressure. In this regime the diameter varies linearly in time
D�t� = D0 −�2X − 1�
3�st �23�
IG. 2. Reduced diameter D /D0 as a function of time t in capillary thinning experiments for several dilutioneries of narrowly distributed polystyrene samples. The samples are dissolved respectively in �a� styrene oli-omer �Boger fluids�, profiles determined from CCD camera video images of the thinning filament; �b� styreneligomer, profiles determined with a laser micrometer; �c� diethylphthalate �DEP�, profiles determined with aaser micrometer. In addition to the experimental data Fig. 2�b� also shows the theoretical critical concentrations
min calculated from Eq. �41� that depicts the minimum concentration for an observable influence of polymer onhe capillary thinning behavior.
nd the extension rate in the necking filament, given by
subject to SOR license or copyright; see http://scitation.aip.org/content/sor/journal/jor2/info/about. Downloaded to IP:
81.101.246.104 On: Fri, 09 May 2014 14:05:38
s
cepctsralesri
w
to2beB
lactKs
wpu�Eh
m
c
861DILUTE SOLUTIONS IN EXTENSIONAL FLOWS
Redistribution
��t� =2�2X − 1�
3�s
1
D�t��24�
lowly climbs.The polymeric stress associated with the initial conformation Azz,i
0 �Eq. �21��, that isaused by the step strain, decays rapidly during the early stages of thinning since thextension rate is insufficient to keep even the longest mode excited. However, as thinningrogresses the extension rate rises, the polymer coils become extended, and the systemrosses over to a second phase of elastocapillary thinning. In this regime the filamenthins exponentially according to Eq. �22�. It is clear from Fig. 2�b� that this crossoverhifts to earlier times and higher values of D�t� /D0 as the polymer concentration isaised. Finally, at late times, the finite extensibility limit of the unraveling polymer ispproached and the FENE factor f i �Eq. �14�� in the force balance for the filament can noonger be neglected and the thinning behavior deviates from the exponential regime oflastocapillary thinning. In this third phase the decay rate becomes linear again corre-ponding to a viscous liquid with a very high and anisotropic elongational viscosityesulting from the fully extended polymer chains. The filament diameter evolves accord-ng to
D�t� =
�E�tbr − t� , �25�
ith tbr the breakup time and �E the steady uniaxial elongational viscosity.This third phase is not observed for the diethylphthalate solutions in Fig. 2�c� because
he filament diameter drops below the resolution limit of the experiment before the effectsf finite extensibility are observed. The initial phase of viscocapillary thinning in Fig.�c� also shows a strong concentration dependence at higher concentrations. This isecause the viscous resistance to thinning is determined by the viscosity of the totalntangled solution rather than by the pure solvent as is the case for dilute or semi-diluteoger fluids shown in Fig. 2�b�.
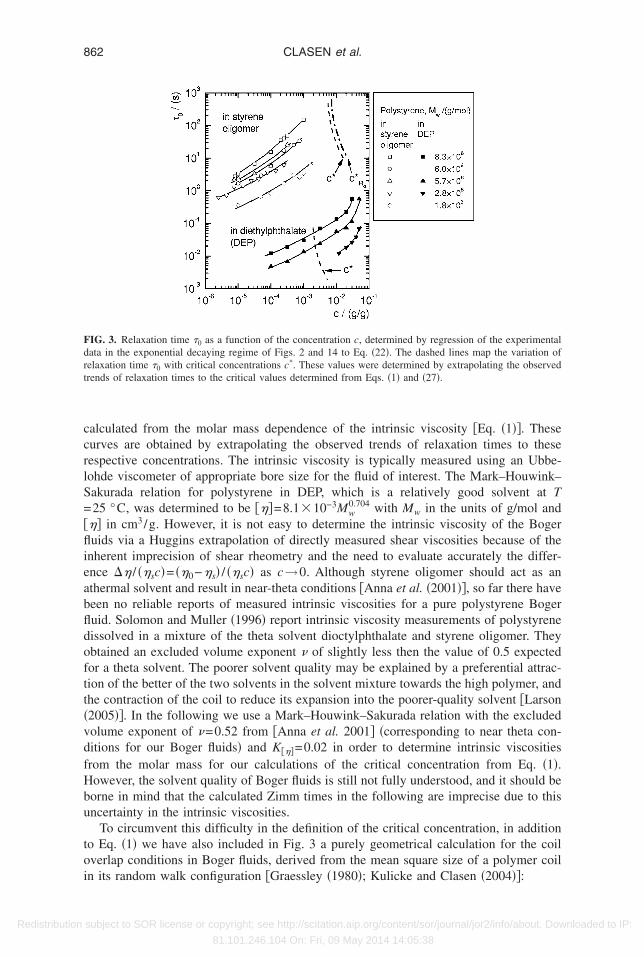
The relaxation times �0 determined by fitting data from the intermediate elastocapil-ary phase in Figs. 2 and 14 to Eq. �22� are shown in Fig. 3. The relaxation times show
strong dependence on the concentration and decrease monotonically with decreasingoncentration. To understand the molar mass dependence, one has to keep in mind thathe styrene oligomers used as solvents in this report had different viscosities �Table I�.inetic theory shows that the longest relaxation time of an isolated polymer coil in dilute
olution is proportional to the solvent viscosity
�0 =1
U��
�p
G=
1
U��
����sMw
RT�26�
here U��=�� /�0 is the universal ratio of the characteristic relaxation time �� of a diluteolymer solution system and the longest relaxation time �0. The numerical value of theniversal ratio depends on the relaxation spectrum of the specific constitutive modelÖttinger �1996�� �with U��=2.39 for theta solvents to U���1.8 for good solvents�. Fromq. �26� it can be seen that for a homologous series of polystyrene solutions the slightlyigher relaxation times of the Boger fluid with Mw=5.7�106 g/mol in comparison to
Mw=6.0�106 g/mol are explained by the higher solvent viscosity of the styrene oligo-er used in this set of fluids �see Table I�.In addition to the experimentally determined relaxation times, Fig. 3 depicts graphi-
*
ally �by broken lines� the expected variation in the critical overlap concentration c assubject to SOR license or copyright; see http://scitation.aip.org/content/sor/journal/jor2/info/about. Downloaded to IP:
81.101.246.104 On: Fri, 09 May 2014 14:05:38
ccrlS=�flieabfldoftt�vdfHbu
toi
Fdrt
862 CLASEN et al.
Redistribution
alculated from the molar mass dependence of the intrinsic viscosity �Eq. �1��. Theseurves are obtained by extrapolating the observed trends of relaxation times to theseespective concentrations. The intrinsic viscosity is typically measured using an Ubbe-ohde viscometer of appropriate bore size for the fluid of interest. The Mark–Houwink–akurada relation for polystyrene in DEP, which is a relatively good solvent at T25 °C, was determined to be ���=8.1�10−3Mw
0.704 with Mw in the units of g/mol and�� in cm3/g. However, it is not easy to determine the intrinsic viscosity of the Bogeruids via a Huggins extrapolation of directly measured shear viscosities because of the
nherent imprecision of shear rheometry and the need to evaluate accurately the differ-nce �� / ��sc�= ��0−�s� / ��sc� as c→0. Although styrene oligomer should act as anthermal solvent and result in near-theta conditions �Anna et al. �2001��, so far there haveeen no reliable reports of measured intrinsic viscosities for a pure polystyrene Bogeruid. Solomon and Muller �1996� report intrinsic viscosity measurements of polystyreneissolved in a mixture of the theta solvent dioctylphthalate and styrene oligomer. Theybtained an excluded volume exponent of slightly less then the value of 0.5 expectedor a theta solvent. The poorer solvent quality may be explained by a preferential attrac-ion of the better of the two solvents in the solvent mixture towards the high polymer, andhe contraction of the coil to reduce its expansion into the poorer-quality solvent �Larson2005��. In the following we use a Mark–Houwink–Sakurada relation with the excludedolume exponent of =0.52 from �Anna et al. 2001� �corresponding to near theta con-itions for our Boger fluids� and K���=0.02 in order to determine intrinsic viscositiesrom the molar mass for our calculations of the critical concentration from Eq. �1�.owever, the solvent quality of Boger fluids is still not fully understood, and it should beorne in mind that the calculated Zimm times in the following are imprecise due to thisncertainty in the intrinsic viscosities.
To circumvent this difficulty in the definition of the critical concentration, in additiono Eq. �1� we have also included in Fig. 3 a purely geometrical calculation for the coilverlap conditions in Boger fluids, derived from the mean square size of a polymer coil
IG. 3. Relaxation time �0 as a function of the concentration c, determined by regression of the experimentalata in the exponential decaying regime of Figs. 2 and 14 to Eq. �22�. The dashed lines map the variation ofelaxation time �0 with critical concentrations c*. These values were determined by extrapolating the observedrends of relaxation times to the critical values determined from Eqs. �1� and �27�.
n its random walk configuration �Graessley �1980�; Kulicke and Clasen �2004��:
subject to SOR license or copyright; see http://scitation.aip.org/content/sor/journal/jor2/info/about. Downloaded to IP:
81.101.246.104 On: Fri, 09 May 2014 14:05:38
cm�
cs
cmccetom�f
863DILUTE SOLUTIONS IN EXTENSIONAL FLOWS
Redistribution
cRG
* =Mw
4
3��RG
2 �3/2NA
. �27�
The radius of gyration RG, assuming near-theta conditions for the Boger fluids, can bealculated from molecular parameters including the C–C bond length b, the monomerolar mass Mu, and the characteristic ratio C� for a given polymer �Kulicke and Clasen
2004��,
RG =b2C�Mw
3Mu. �28�
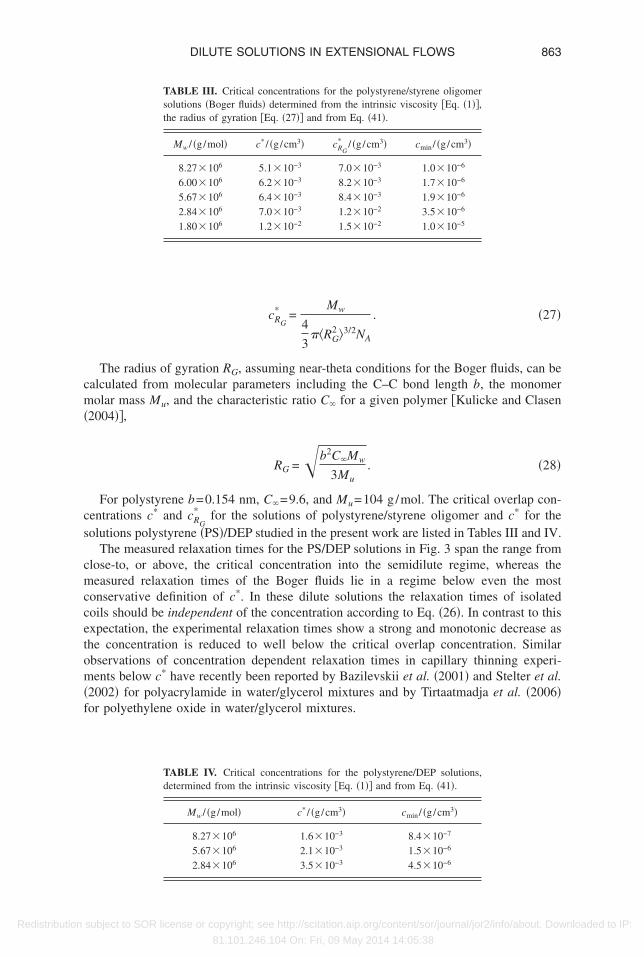
For polystyrene b=0.154 nm, C�=9.6, and Mu=104 g/mol. The critical overlap con-entrations c* and cRG
* for the solutions of polystyrene/styrene oligomer and c* for theolutions polystyrene �PS�/DEP studied in the present work are listed in Tables III and IV.
The measured relaxation times for the PS/DEP solutions in Fig. 3 span the range fromlose-to, or above, the critical concentration into the semidilute regime, whereas theeasured relaxation times of the Boger fluids lie in a regime below even the most
onservative definition of c*. In these dilute solutions the relaxation times of isolatedoils should be independent of the concentration according to Eq. �26�. In contrast to thisxpectation, the experimental relaxation times show a strong and monotonic decrease ashe concentration is reduced to well below the critical overlap concentration. Similarbservations of concentration dependent relaxation times in capillary thinning experi-ents below c* have recently been reported by Bazilevskii et al. �2001� and Stelter et al.
2002� for polyacrylamide in water/glycerol mixtures and by Tirtaatmadja et al. �2006�or polyethylene oxide in water/glycerol mixtures.
TABLE III. Critical concentrations for the polystyrene/styrene oligomersolutions �Boger fluids� determined from the intrinsic viscosity �Eq. �1��,the radius of gyration �Eq. �27�� and from Eq. �41�.
Mw / �g/mol� c* / �g/cm3� cRG
* / �g/cm3� cmin/ �g/cm3�
8.27�106 5.1�10−3 7.0�10−3 1.0�10−6
6.00�106 6.2�10−3 8.2�10−3 1.7�10−6
5.67�106 6.4�10−3 8.4�10−3 1.9�10−6
2.84�106 7.0�10−3 1.2�10−2 3.5�10−6
1.80�106 1.2�10−2 1.5�10−2 1.0�10−5
TABLE IV. Critical concentrations for the polystyrene/DEP solutions,determined from the intrinsic viscosity �Eq. �1�� and from Eq. �41�.
Mw / �g/mol� c* / �g/cm3� cmin/ �g/cm3�
8.27�106 1.6�10−3 8.4�10−7
5.67�106 2.1�10−3 1.5�10−6
2.84�106 3.5�10−3 4.5�10−6
subject to SOR license or copyright; see http://scitation.aip.org/content/sor/journal/jor2/info/about. Downloaded to IP:
81.101.246.104 On: Fri, 09 May 2014 14:05:38
B
imsactd�flmefmao
=rspcr
pts
efit
dcse
w
864 CLASEN et al.
Redistribution
. Small amplitude oscillatory shear
Capillary thinning experiments yield the characteristic relaxation-controlled unravel-ng time associated with strong flows and large molecular deformations. These values
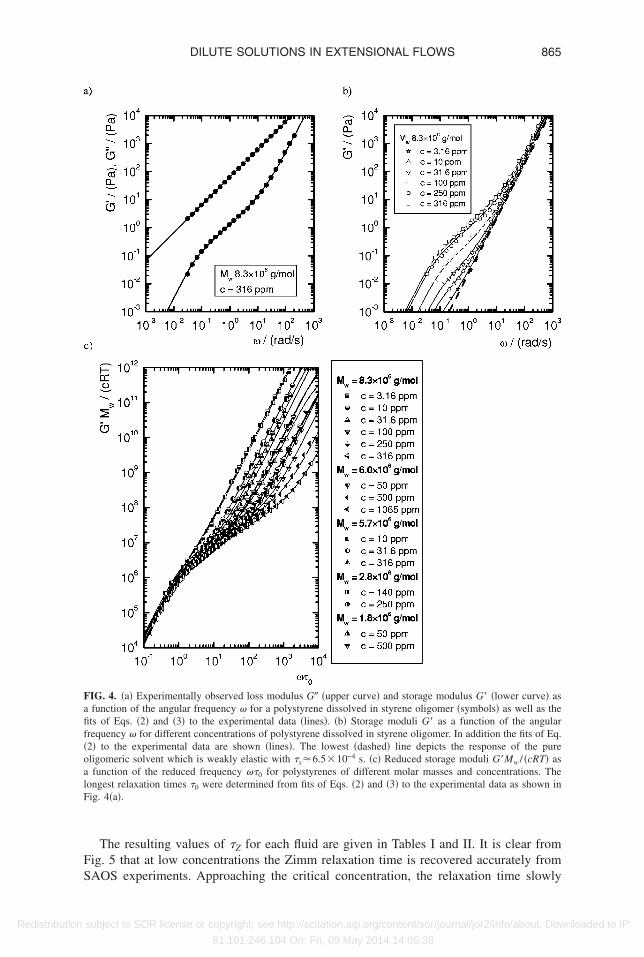
ay also be compared to the relaxation times measured for each fluid in weak flows andmall deformation conditions. Lindner et al. �2003� calculated relaxation times for dilutequeous solutions as low as 250 ppm from normal stress data fitted to an appropriateonstitutive equation, and found good agreement with the expected Zimm relaxationimes. However, for the Boger fluids investigated in this report the elastic response can beirectly observed to even lower concentrations using small amplitude oscillatory shearSAOS� flow �Anna et al. �2001��. The Zimm relaxation times for the polystyrene Bogeruids have been obtained from regressing the expressions for the linear viscoelasticoduli G� and G� �Eqs. �2� and �3�� to the measured experimental data. A representative
xample of the resulting fits to the oscillatory shear data is presented in Fig. 4�a�. At lowrequencies the elastic modulus is dominated by the Zimm spectrum of the high molarass polystyrene solute, allowing for unambiguous determination of the longest relax-
tion time �0, while at high frequencies the response is dominated by the weak elasticityf the oligomeric solvent.
However, with progressively decreasing concentration, the elastic modulus GcRT /Mw of the solute decreases and the contribution of the high molar mass polysty-
ene to the measured elastic moduli is increasingly obscured by the oligomer. This can beeen in the data presented in Fig. 4�b� for a dilution series of a single molar mass ofolystyrene. Consequently, accurate fitting of the Zimm spectrum is hindered at lowoncentrations and the extraction of an accurate longest relaxation time �0 becomes lessobust.
For low frequencies, �s��1, the first term in Eq. �2� can be neglected and the ex-ression reduces to the pure Zimm spectrum. The longest relaxation times obtained fromhe fits for each fluid can then be used to verify the expected scaling of the reducedtorage modulus G�Mw /cRT with the reduced frequency �0�:
G�Mw
cRT� �
i=1
Nmodes � ��0��2
i4+2� + ��0��2� . �29�
Figure 4�c� shows the reduced moduli for the fluids used in the present study thatxhibited sufficient elastic response from the polystyrene solute to perform satisfactoryts to Eq. �2�. The underlying Zimm spectrum can clearly be observed in Fig. 4�c� from
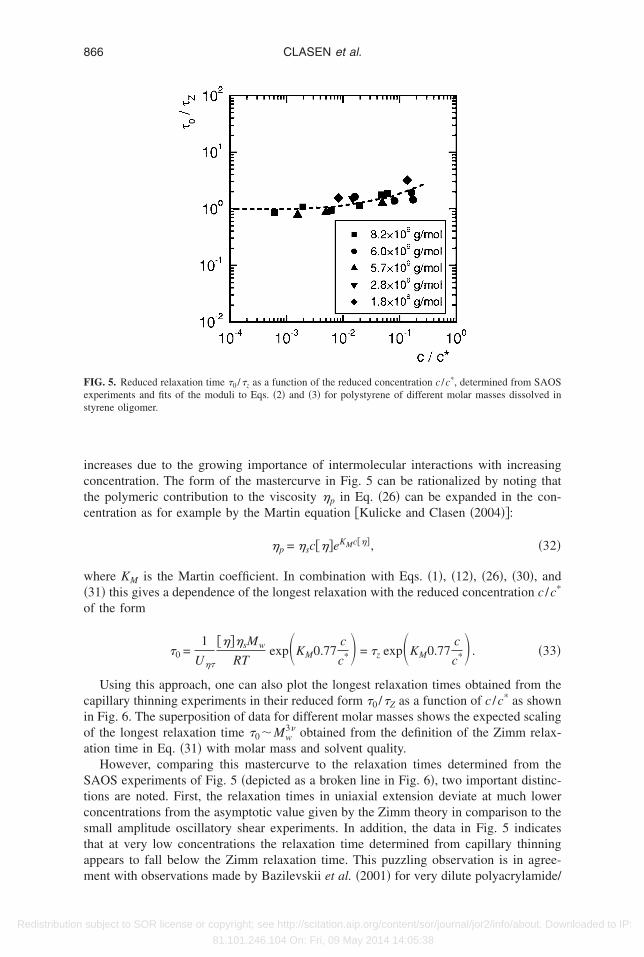
he common mastercurve at low reduced frequencies ��0���1.The longest relaxation times obtained from this analysis are represented in Fig. 5 as
imensionless values �0 /�Z plotted as a function of c /c* �with c* being the criticaloncentration from Eq. �1��. To obtain the Zimm relaxation time �z �assuming a Zimmpectrum for the isolated polymer coil in a solvent�, the universal ratio in Eq. �26� canasily be calculated from Eq. �4� to give
U�� =�i
�i
�0� �
i
1
i2+�, �30�
here � is given by the Thurston relation, Eq. �5�, giving a Zimm relaxation time �Z of
�z =1
�i
12+�
����sMw
RT. �31�
i
subject to SOR license or copyright; see http://scitation.aip.org/content/sor/journal/jor2/info/about. Downloaded to IP:
81.101.246.104 On: Fri, 09 May 2014 14:05:38
FS
Fafif�oalF
865DILUTE SOLUTIONS IN EXTENSIONAL FLOWS
Redistribution
The resulting values of �Z for each fluid are given in Tables I and II. It is clear fromig. 5 that at low concentrations the Zimm relaxation time is recovered accurately from
IG. 4. �a� Experimentally observed loss modulus G� �upper curve� and storage modulus G� �lower curve� asfunction of the angular frequency � for a polystyrene dissolved in styrene oligomer �symbols� as well as thets of Eqs. �2� and �3� to the experimental data �lines�. �b� Storage moduli G� as a function of the angularrequency � for different concentrations of polystyrene dissolved in styrene oligomer. In addition the fits of Eq.2� to the experimental data are shown �lines�. The lowest �dashed� line depicts the response of the pureligomeric solvent which is weakly elastic with �s6.5�10−4 s. �c� Reduced storage moduli G�Mw / �cRT� asfunction of the reduced frequency ��0 for polystyrenes of different molar masses and concentrations. The
ongest relaxation times �0 were determined from fits of Eqs. �2� and �3� to the experimental data as shown inig. 4�a�.
AOS experiments. Approaching the critical concentration, the relaxation time slowly
subject to SOR license or copyright; see http://scitation.aip.org/content/sor/journal/jor2/info/about. Downloaded to IP:
81.101.246.104 On: Fri, 09 May 2014 14:05:38
ictc
w�o
cioa
Stcstam
Fes
866 CLASEN et al.
Redistribution
ncreases due to the growing importance of intermolecular interactions with increasingoncentration. The form of the mastercurve in Fig. 5 can be rationalized by noting thathe polymeric contribution to the viscosity �p in Eq. �26� can be expanded in the con-entration as for example by the Martin equation �Kulicke and Clasen �2004��:
�p = �sc���eKMc���, �32�
here KM is the Martin coefficient. In combination with Eqs. �1�, �12�, �26�, �30�, and31� this gives a dependence of the longest relaxation with the reduced concentration c /c*
f the form
�0 =1
U��
����sMw
RTexp KM0.77
c
c*� = �z exp KM0.77c
c*� . �33�
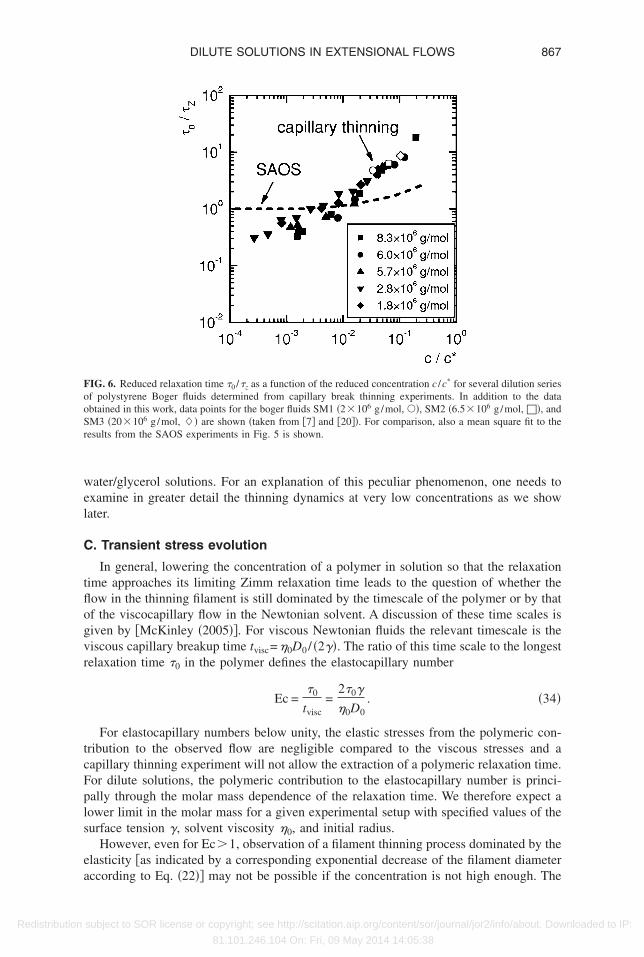
Using this approach, one can also plot the longest relaxation times obtained from theapillary thinning experiments in their reduced form �0 /�Z as a function of c /c* as shownn Fig. 6. The superposition of data for different molar masses shows the expected scalingf the longest relaxation time �0�Mw
3 obtained from the definition of the Zimm relax-tion time in Eq. �31� with molar mass and solvent quality.
However, comparing this mastercurve to the relaxation times determined from theAOS experiments of Fig. 5 �depicted as a broken line in Fig. 6�, two important distinc-
ions are noted. First, the relaxation times in uniaxial extension deviate at much loweroncentrations from the asymptotic value given by the Zimm theory in comparison to themall amplitude oscillatory shear experiments. In addition, the data in Fig. 5 indicateshat at very low concentrations the relaxation time determined from capillary thinningppears to fall below the Zimm relaxation time. This puzzling observation is in agree-
IG. 5. Reduced relaxation time �0 /�z as a function of the reduced concentration c /c*, determined from SAOSxperiments and fits of the moduli to Eqs. �2� and �3� for polystyrene of different molar masses dissolved intyrene oligomer.
ent with observations made by Bazilevskii et al. �2001� for very dilute polyacrylamide/
subject to SOR license or copyright; see http://scitation.aip.org/content/sor/journal/jor2/info/about. Downloaded to IP:
81.101.246.104 On: Fri, 09 May 2014 14:05:38
wel
C
tflogvr
tcFpls
ea
FooSr
867DILUTE SOLUTIONS IN EXTENSIONAL FLOWS
Redistribution
ater/glycerol solutions. For an explanation of this peculiar phenomenon, one needs toxamine in greater detail the thinning dynamics at very low concentrations as we showater.
. Transient stress evolution
In general, lowering the concentration of a polymer in solution so that the relaxationime approaches its limiting Zimm relaxation time leads to the question of whether theow in the thinning filament is still dominated by the timescale of the polymer or by thatf the viscocapillary flow in the Newtonian solvent. A discussion of these time scales isiven by �McKinley �2005��. For viscous Newtonian fluids the relevant timescale is theiscous capillary breakup time tvisc=�0D0 / �2�. The ratio of this time scale to the longestelaxation time �0 in the polymer defines the elastocapillary number
Ec =�0
tvisc=
2�0
�0D0. �34�
For elastocapillary numbers below unity, the elastic stresses from the polymeric con-ribution to the observed flow are negligible compared to the viscous stresses and aapillary thinning experiment will not allow the extraction of a polymeric relaxation time.or dilute solutions, the polymeric contribution to the elastocapillary number is princi-ally through the molar mass dependence of the relaxation time. We therefore expect aower limit in the molar mass for a given experimental setup with specified values of theurface tension , solvent viscosity �0, and initial radius.
However, even for Ec�1, observation of a filament thinning process dominated by thelasticity �as indicated by a corresponding exponential decrease of the filament diameter
IG. 6. Reduced relaxation time �0 /�z as a function of the reduced concentration c /c* for several dilution seriesf polystyrene Boger fluids determined from capillary break thinning experiments. In addition to the databtained in this work, data points for the boger fluids SM1 �2�106 g/mol, ��, SM2 �6.5�106 g/mol, ��, andM3 �20�106 g/mol, �� are shown �taken from �7� and �20��. For comparison, also a mean square fit to theesults from the SAOS experiments in Fig. 5 is shown.
ccording to Eq. �22�� may not be possible if the concentration is not high enough. The
subject to SOR license or copyright; see http://scitation.aip.org/content/sor/journal/jor2/info/about. Downloaded to IP:
81.101.246.104 On: Fri, 09 May 2014 14:05:38
tctPocnts
dEpascncep
tttndsOflaeepodsrcccassZ“r
D
a
868 CLASEN et al.
Redistribution
ransition from the initial balance of capillary and viscous stresses to the balance ofapillary and elastic forces is progressively shifted to later times, as the polymer concen-ration c and the elastic modulus G are progressively reduced �see Eqs. �12� and �20��.hysically, it is clear that if the polymer concentration is too small the elastic stress termn the right hand side of Eq. �20� cannot balance the squeezing action arising fromapillary pressure. Instead viscous stresses from the oligomeric solvent provide the domi-ant resistance to thinning. Because the elastic stresses evolve nonlinearly �exponen-ially� with time, it is not straightforward to determine the crossover conditions from aimple order of magnitude scaling estimate and instead we turn to numerical calculations.
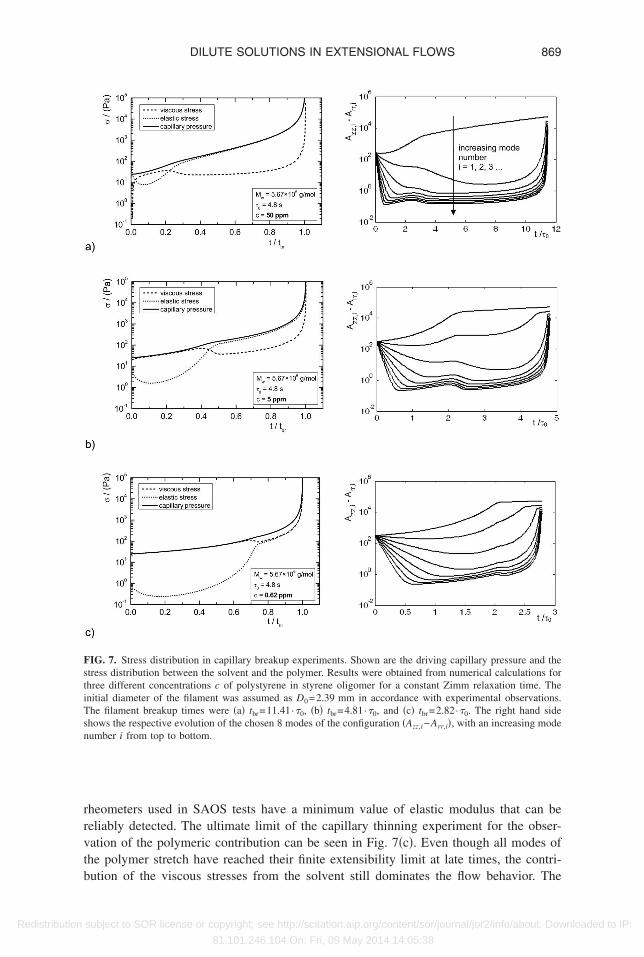
In the left hand column of Figs. 7�a�–7�c� we show the temporal variation in theifferent contributions to the overall stress, obtained from the numerical integration ofqs. �17�–�20�, for three different concentrations of the same polymer. The capillaryressure, which drives the flow, increases monotonically in time and ultimately divergest a critical timescale interpreted as the breakup time, tbr. The dashed and dotted lineshow the relative contributions of the viscous and elastic stresses, respectively. As theoncentration is lowered, the transition from a solvent dominated to an elasticity domi-ated flow shifts to later times during the thinning process. While this shifts the elasto-apillary regime to smaller radii and therefore towards the lower resolution limit of thexperimental setup, it also means a faster approach to the finite extensibility limit of theolymer.
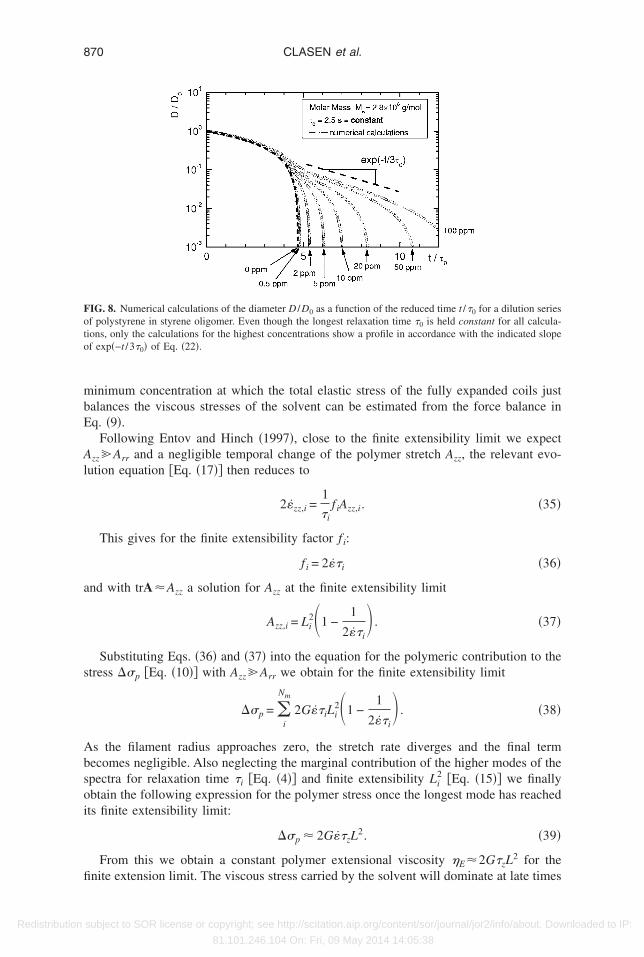
In the right hand column of Figs. 7�a�–7�c� we show the individual modal contribu-ions to the polymer stretch tensor A as a function of time scaled by the longest relaxationime. For the bulk of the capillary thinning process, the majority of the stress is carried byhe longest mode �i=1�. Exponential decay in the radius corresponds directly to expo-ential growth in the principal stretch difference Azz,1−Arr,1 of the longest mode. As theeformation rate diverges close to the singular breakup event, the shorter modes begin totretch rapidly and ultimately all modes approach their relevant finite extensibility limit.nce the higher modes of the configuration A reach their finite extensibility limit, theow pattern again crosses over to a Newtonian-like flow behavior. Extraction of a relax-tion time by a simple exponential fit to Eq. �22� is therefore not possible once finitextensibility effects start to dominate the flow. At low concentrations, the combinedffects of finite extensibility and a low initial concentration or modulus eliminate theossibility of a clear elastocapillary balance at the microscale or a macroscopic detectionf an exponential decay regime in this rheometric device, even though there is a well-efined underlying microscopic relaxation time for the fluid itself. This is also demon-trated in Fig. 8 by a series of numerical calculations for a progressively diluted polysty-ene Boger fluid. The longest relaxation time �0 for these calculations is chosen to beonstant for all dilutions and the value is assumed to agree with the Zimm time �z. As onean see, the breakup times progressively decrease with decreasing concentration. At aoncentration of c=100 ppm �c /c*=0.012� there is a clear region of elastocapillary decaynd a filament decay rate that would agree with the expected rate 1 / �3�0�. However, thelopes of the curves in the intermediate thinning regime appear to become steeper in theemilog plot of Fig. 8 and this suggests apparent relaxation times that are below theimm time used for these calculations. This effect is further amplified by a gradualsmearing out” of the transition from the initial Newtonian thinning to the elastocapillaryegime.
. The critical concentration cmin
It is clear from the above model calculations that capillary thinning instruments have
minimum detectable elasticity limit, in much the same way that conventional torsionalsubject to SOR license or copyright; see http://scitation.aip.org/content/sor/journal/jor2/info/about. Downloaded to IP:
81.101.246.104 On: Fri, 09 May 2014 14:05:38
rrvtb
FstiTsn
869DILUTE SOLUTIONS IN EXTENSIONAL FLOWS
Redistribution
heometers used in SAOS tests have a minimum value of elastic modulus that can beeliably detected. The ultimate limit of the capillary thinning experiment for the obser-ation of the polymeric contribution can be seen in Fig. 7�c�. Even though all modes ofhe polymer stretch have reached their finite extensibility limit at late times, the contri-
IG. 7. Stress distribution in capillary breakup experiments. Shown are the driving capillary pressure and thetress distribution between the solvent and the polymer. Results were obtained from numerical calculations forhree different concentrations c of polystyrene in styrene oligomer for a constant Zimm relaxation time. Thenitial diameter of the filament was assumed as D0=2.39 mm in accordance with experimental observations.he filament breakup times were �a� tbr=11.41·�0, �b� tbr=4.81·�0, and �c� tbr=2.82·�0. The right hand sidehows the respective evolution of the chosen 8 modes of the configuration �Azz,i−Arr,i�, with an increasing modeumber i from top to bottom.
ution of the viscous stresses from the solvent still dominates the flow behavior. The
subject to SOR license or copyright; see http://scitation.aip.org/content/sor/journal/jor2/info/about. Downloaded to IP:
81.101.246.104 On: Fri, 09 May 2014 14:05:38
mbE
Al
a
s
Absoi
fi
Foto
870 CLASEN et al.
Redistribution
inimum concentration at which the total elastic stress of the fully expanded coils justalances the viscous stresses of the solvent can be estimated from the force balance inq. �9�.
Following Entov and Hinch �1997�, close to the finite extensibility limit we expect
zz�Arr and a negligible temporal change of the polymer stretch Azz, the relevant evo-ution equation �Eq. �17�� then reduces to
2�zz,i =1
�if iAzz,i. �35�
This gives for the finite extensibility factor f i:
f i = 2��i �36�
nd with trAAzz a solution for Azz at the finite extensibility limit
Azz,i = Li2 1 −
1
2��i� . �37�
Substituting Eqs. �36� and �37� into the equation for the polymeric contribution to thetress ��p �Eq. �10�� with Azz�Arr we obtain for the finite extensibility limit
��p = �i
Nm
2G��iLi2 1 −
1
2��i� . �38�
s the filament radius approaches zero, the stretch rate diverges and the final termecomes negligible. Also neglecting the marginal contribution of the higher modes of thepectra for relaxation time �i �Eq. �4�� and finite extensibility Li
2 �Eq. �15�� we finallybtain the following expression for the polymer stress once the longest mode has reachedts finite extensibility limit:
��p 2G��zL2. �39�
From this we obtain a constant polymer extensional viscosity �E2G�zL2 for the
IG. 8. Numerical calculations of the diameter D /D0 as a function of the reduced time t /�0 for a dilution seriesf polystyrene in styrene oligomer. Even though the longest relaxation time �0 is held constant for all calcula-ions, only the calculations for the highest concentrations show a profile in accordance with the indicated slopef exp�−t /3�0� of Eq. �22�.
nite extension limit. The viscous stress carried by the solvent will dominate at late times
subject to SOR license or copyright; see http://scitation.aip.org/content/sor/journal/jor2/info/about. Downloaded to IP:
81.101.246.104 On: Fri, 09 May 2014 14:05:38
iTe
se
o
ttnc=
ffvaaca
E
taiatoca�c
aTuat
871DILUTE SOLUTIONS IN EXTENSIONAL FLOWS
Redistribution
f the term 3�s� in Eq. �9� becomes larger than the polymer stress ��p given by Eq. �39�.he polymer contribution to the total stress is thus only observable in capillary thinningxperiments if
2G�zL2
3�s� 1. �40�
Substituting the modulus from Eq. �12�, we derive an expression for the lowest pos-ible polymer concentration for an observable elastic contribution to a capillary breakupxperiment. We denote this concentration cmin and require
c � cmin =3
2
Mw�s
RT�zL2 �41�
r by combining this expression with the Zimm relaxation time given by Eq. �31�:
c � cmin =3
2
U��
���L2 . �42�
At this critical concentration cmin the extended polymer is still contributing partially tohe overall stress at late times, however, this concentration marks the point below whichhe polymer will carry less stress than the solvent even if it is fully extended. It should beoted that cmin differs from the critical overlap concentration c* for the equilibriumonfiguration principally by the factor 1 /L2 since Eq. �42� reduces with Eq. �1� to cmin
1.94U��c* /L2 and cmin is therefore orders of magnitude smaller than c*.
The critical concentrations cmin for the polystyrene solutions can easily be calculatedrom molecular parameters and are shown in Table III. The value of cmin was also chosenor the numerical calculation in Fig. 7�c� and it can clearly be seen that at c=cmin theiscous and polymeric stresses provide the same contribution to the overall stress balancet late times. The critical concentration cmin is also indicated in Figs. 2�b� and 14�b� inddition to the experimental thinning data. This theoretical estimate for the critical con-entration describes quite well the borderline between purely viscous thinning behaviournd the onset of significant elastocapillary effects for all three molar masses.
. Relaxation times from numerical calculations
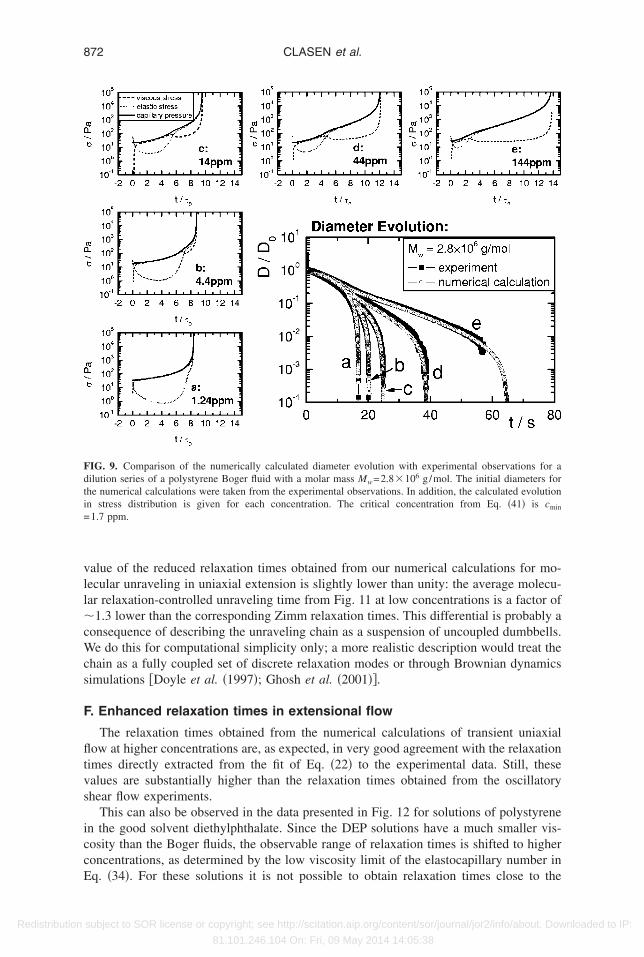
Given these limitations to directly extracting the relaxation time from elastocapillaryhinning, we have also used a different approach to obtain good estimates of the relax-tion times close to the critical concentration limit cmin given by Eq. �41�. Numericalntegrations of Eqs. �17�–�20� for the filament thinning process with the longest relax-tion time �0 as the only adjustable parameter are used to obtain the best agreement withhe experimentally measured filament thinning profiles first presented in Fig. 2. Samplesf the resulting best fits to the experimental data are shown for several decades ofoncentration and two different molar masses in Figs. 9 and 10. It is clear that excellentgreement with the measured diameter data can be achieved by adjusting the value of
0�c�, even though the profiles of the stress evolution are not elastically dominated at lowoncentrations.
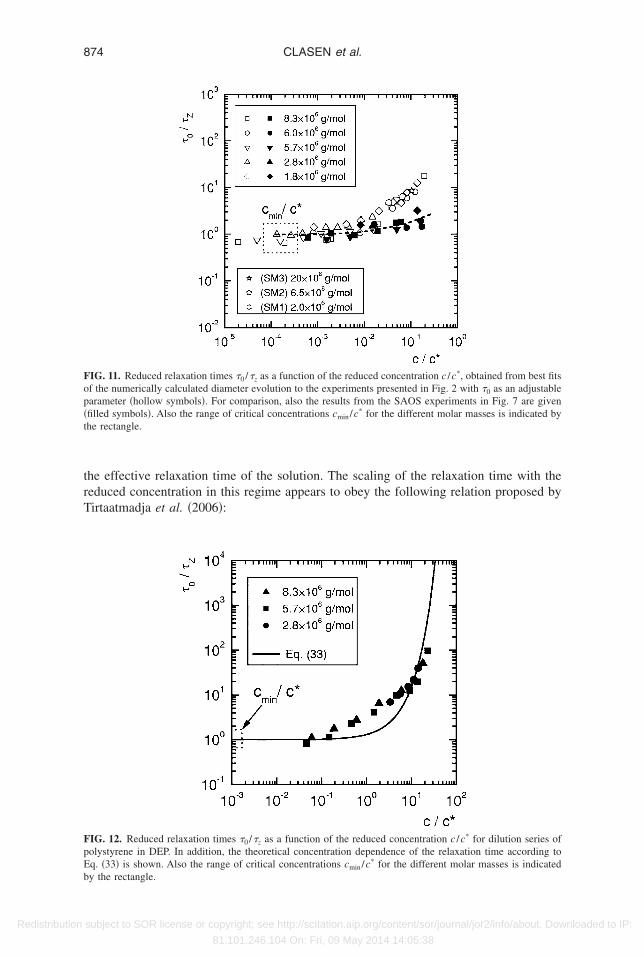
The relaxation times derived from these numerical calculations in Figs. 9 and 10 canlso be used to regenerate the reduced data or master curve originally presented in Fig. 6.hese new results are presented in Fig. 11 and it is clear that the true relaxation time inniaxial extension asymptotically approaches a constant value at low concentrations inccordance with the concentration-independent relaxation times directly measured with
he SAOS experiments at low concentrations. However, one must note that the constantsubject to SOR license or copyright; see http://scitation.aip.org/content/sor/journal/jor2/info/about. Downloaded to IP:
81.101.246.104 On: Fri, 09 May 2014 14:05:38
vll�cWcs
F
fltvs
iccE
Fdti=
872 CLASEN et al.
Redistribution
alue of the reduced relaxation times obtained from our numerical calculations for mo-ecular unraveling in uniaxial extension is slightly lower than unity: the average molecu-ar relaxation-controlled unraveling time from Fig. 11 at low concentrations is a factor of
1.3 lower than the corresponding Zimm relaxation times. This differential is probably aonsequence of describing the unraveling chain as a suspension of uncoupled dumbbells.e do this for computational simplicity only; a more realistic description would treat the
hain as a fully coupled set of discrete relaxation modes or through Brownian dynamicsimulations �Doyle et al. �1997�; Ghosh et al. �2001��.
. Enhanced relaxation times in extensional flow
The relaxation times obtained from the numerical calculations of transient uniaxialow at higher concentrations are, as expected, in very good agreement with the relaxation
imes directly extracted from the fit of Eq. �22� to the experimental data. Still, thesealues are substantially higher than the relaxation times obtained from the oscillatoryhear flow experiments.
This can also be observed in the data presented in Fig. 12 for solutions of polystyrenen the good solvent diethylphthalate. Since the DEP solutions have a much smaller vis-osity than the Boger fluids, the observable range of relaxation times is shifted to higheroncentrations, as determined by the low viscosity limit of the elastocapillary number in
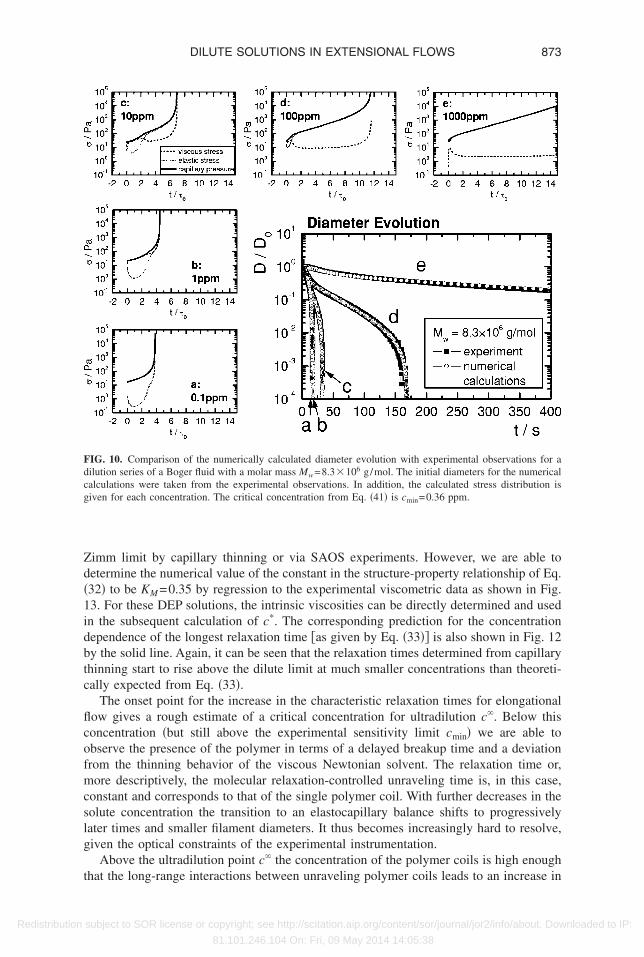
IG. 9. Comparison of the numerically calculated diameter evolution with experimental observations for ailution series of a polystyrene Boger fluid with a molar mass Mw=2.8�106 g/mol. The initial diameters forhe numerical calculations were taken from the experimental observations. In addition, the calculated evolutionn stress distribution is given for each concentration. The critical concentration from Eq. �41� is cmin
1.7 ppm.
q. �34�. For these solutions it is not possible to obtain relaxation times close to the
subject to SOR license or copyright; see http://scitation.aip.org/content/sor/journal/jor2/info/about. Downloaded to IP:
81.101.246.104 On: Fri, 09 May 2014 14:05:38
Zd�1idbtc
flcofmcslg
t
Fdcg
873DILUTE SOLUTIONS IN EXTENSIONAL FLOWS
Redistribution
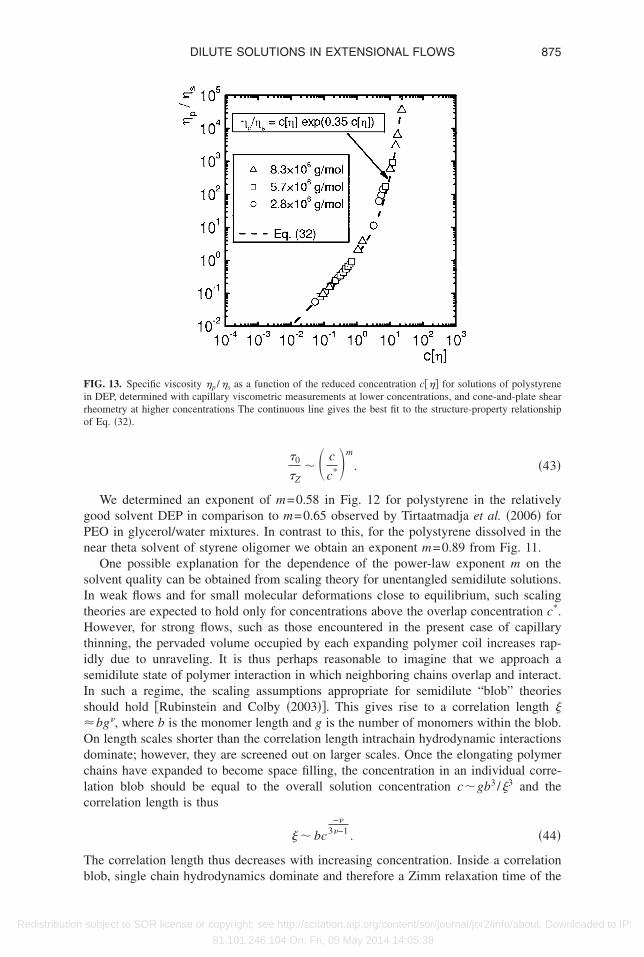
imm limit by capillary thinning or via SAOS experiments. However, we are able toetermine the numerical value of the constant in the structure-property relationship of Eq.32� to be KM =0.35 by regression to the experimental viscometric data as shown in Fig.3. For these DEP solutions, the intrinsic viscosities can be directly determined and usedn the subsequent calculation of c*. The corresponding prediction for the concentrationependence of the longest relaxation time �as given by Eq. �33�� is also shown in Fig. 12y the solid line. Again, it can be seen that the relaxation times determined from capillaryhinning start to rise above the dilute limit at much smaller concentrations than theoreti-ally expected from Eq. �33�.
The onset point for the increase in the characteristic relaxation times for elongationalow gives a rough estimate of a critical concentration for ultradilution c�. Below thisoncentration �but still above the experimental sensitivity limit cmin� we are able tobserve the presence of the polymer in terms of a delayed breakup time and a deviationrom the thinning behavior of the viscous Newtonian solvent. The relaxation time or,ore descriptively, the molecular relaxation-controlled unraveling time is, in this case,
onstant and corresponds to that of the single polymer coil. With further decreases in theolute concentration the transition to an elastocapillary balance shifts to progressivelyater times and smaller filament diameters. It thus becomes increasingly hard to resolve,iven the optical constraints of the experimental instrumentation.
Above the ultradilution point c� the concentration of the polymer coils is high enough
IG. 10. Comparison of the numerically calculated diameter evolution with experimental observations for ailution series of a Boger fluid with a molar mass Mw=8.3�106 g/mol. The initial diameters for the numericalalculations were taken from the experimental observations. In addition, the calculated stress distribution isiven for each concentration. The critical concentration from Eq. �41� is cmin=0.36 ppm.
hat the long-range interactions between unraveling polymer coils leads to an increase in
subject to SOR license or copyright; see http://scitation.aip.org/content/sor/journal/jor2/info/about. Downloaded to IP:
81.101.246.104 On: Fri, 09 May 2014 14:05:38
trT
Fop�t
FpEb
874 CLASEN et al.
Redistribution
he effective relaxation time of the solution. The scaling of the relaxation time with theeduced concentration in this regime appears to obey the following relation proposed byirtaatmadja et al. �2006�:
IG. 11. Reduced relaxation times �0 /�z as a function of the reduced concentration c /c*, obtained from best fitsf the numerically calculated diameter evolution to the experiments presented in Fig. 2 with �0 as an adjustablearameter �hollow symbols�. For comparison, also the results from the SAOS experiments in Fig. 7 are givenfilled symbols�. Also the range of critical concentrations cmin/c* for the different molar masses is indicated byhe rectangle.
IG. 12. Reduced relaxation times �0 /�z as a function of the reduced concentration c /c* for dilution series ofolystyrene in DEP. In addition, the theoretical concentration dependence of the relaxation time according toq. �33� is shown. Also the range of critical concentrations cmin/c* for the different molar masses is indicated
y the rectangle.subject to SOR license or copyright; see http://scitation.aip.org/content/sor/journal/jor2/info/about. Downloaded to IP:
81.101.246.104 On: Fri, 09 May 2014 14:05:38
gPn
sItHtisIsOdclc
Tb
Firo
875DILUTE SOLUTIONS IN EXTENSIONAL FLOWS
Redistribution
�0
�Z� c
c*�m
. �43�
We determined an exponent of m=0.58 in Fig. 12 for polystyrene in the relativelyood solvent DEP in comparison to m=0.65 observed by Tirtaatmadja et al. �2006� forEO in glycerol/water mixtures. In contrast to this, for the polystyrene dissolved in theear theta solvent of styrene oligomer we obtain an exponent m=0.89 from Fig. 11.
One possible explanation for the dependence of the power-law exponent m on theolvent quality can be obtained from scaling theory for unentangled semidilute solutions.n weak flows and for small molecular deformations close to equilibrium, such scalingheories are expected to hold only for concentrations above the overlap concentration c*.owever, for strong flows, such as those encountered in the present case of capillary
hinning, the pervaded volume occupied by each expanding polymer coil increases rap-dly due to unraveling. It is thus perhaps reasonable to imagine that we approach aemidilute state of polymer interaction in which neighboring chains overlap and interact.n such a regime, the scaling assumptions appropriate for semidilute “blob” theorieshould hold �Rubinstein and Colby �2003��. This gives rise to a correlation length �
bg , where b is the monomer length and g is the number of monomers within the blob.n length scales shorter than the correlation length intrachain hydrodynamic interactionsominate; however, they are screened out on larger scales. Once the elongating polymerhains have expanded to become space filling, the concentration in an individual corre-ation blob should be equal to the overall solution concentration c�gb3 /�3 and theorrelation length is thus
� � bc−
3 −1 . �44�
he correlation length thus decreases with increasing concentration. Inside a correlation
IG. 13. Specific viscosity �p /�s as a function of the reduced concentration c��� for solutions of polystyrenen DEP, determined with capillary viscometric measurements at lower concentrations, and cone-and-plate shearheometry at higher concentrations The continuous line gives the best fit to the structure-property relationshipf Eq. �32�.
lob, single chain hydrodynamics dominate and therefore a Zimm relaxation time of the
subject to SOR license or copyright; see http://scitation.aip.org/content/sor/journal/jor2/info/about. Downloaded to IP:
81.101.246.104 On: Fri, 09 May 2014 14:05:38
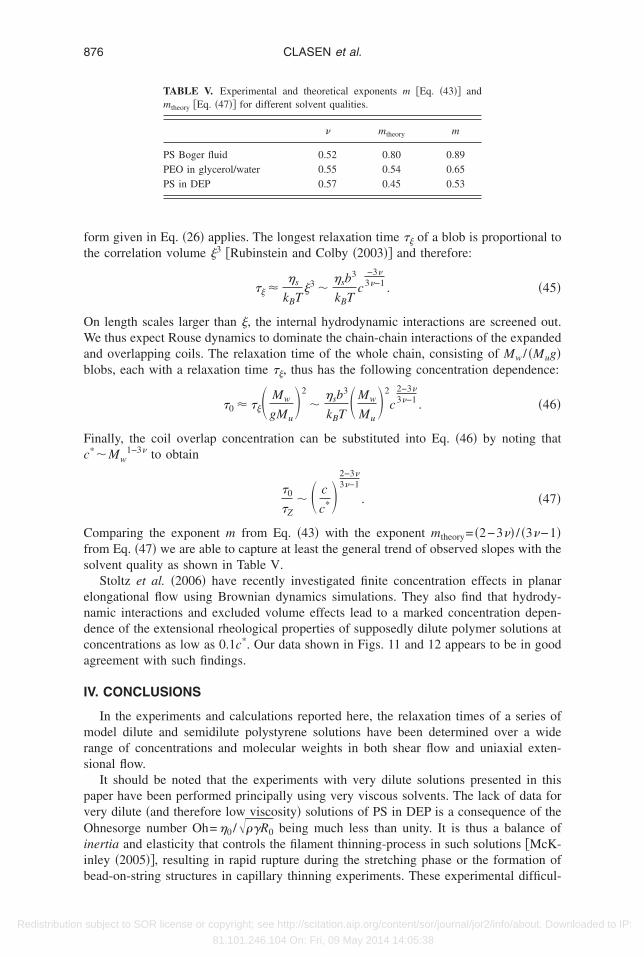
ft
OWab
Fc
Cfs
endca
I
mrs
pvOiib
876 CLASEN et al.
Redistribution
orm given in Eq. �26� applies. The longest relaxation time �� of a blob is proportional tohe correlation volume �3 �Rubinstein and Colby �2003�� and therefore:
�� �s
kBT�3 �
�sb3
kBTc
−3 3 −1 . �45�
n length scales larger than �, the internal hydrodynamic interactions are screened out.e thus expect Rouse dynamics to dominate the chain-chain interactions of the expanded
nd overlapping coils. The relaxation time of the whole chain, consisting of Mw / �Mug�lobs, each with a relaxation time ��, thus has the following concentration dependence:
�0 �� Mw
gMu�2
��sb
3
kBT Mw
Mu�2
c2−3 3 −1 . �46�
inally, the coil overlap concentration can be substituted into Eq. �46� by noting that*�Mw
1−3 to obtain
�0
�Z� c
c*�2−3 3 −1
. �47�
omparing the exponent m from Eq. �43� with the exponent mtheory= �2−3 � / �3 −1�rom Eq. �47� we are able to capture at least the general trend of observed slopes with theolvent quality as shown in Table V.
Stoltz et al. �2006� have recently investigated finite concentration effects in planarlongational flow using Brownian dynamics simulations. They also find that hydrody-amic interactions and excluded volume effects lead to a marked concentration depen-ence of the extensional rheological properties of supposedly dilute polymer solutions atoncentrations as low as 0.1c*. Our data shown in Figs. 11 and 12 appears to be in goodgreement with such findings.
V. CONCLUSIONS
In the experiments and calculations reported here, the relaxation times of a series ofodel dilute and semidilute polystyrene solutions have been determined over a wide
ange of concentrations and molecular weights in both shear flow and uniaxial exten-ional flow.
It should be noted that the experiments with very dilute solutions presented in thisaper have been performed principally using very viscous solvents. The lack of data forery dilute �and therefore low viscosity� solutions of PS in DEP is a consequence of thehnesorge number Oh=�0 /R0 being much less than unity. It is thus a balance of
nertia and elasticity that controls the filament thinning-process in such solutions �McK-nley �2005��, resulting in rapid rupture during the stretching phase or the formation of
TABLE V. Experimental and theoretical exponents m �Eq. �43�� andmtheory �Eq. �47�� for different solvent qualities.
mtheory m
PS Boger fluid 0.52 0.80 0.89PEO in glycerol/water 0.55 0.54 0.65PS in DEP 0.57 0.45 0.53
ead-on-string structures in capillary thinning experiments. These experimental difficul-
subject to SOR license or copyright; see http://scitation.aip.org/content/sor/journal/jor2/info/about. Downloaded to IP:
81.101.246.104 On: Fri, 09 May 2014 14:05:38
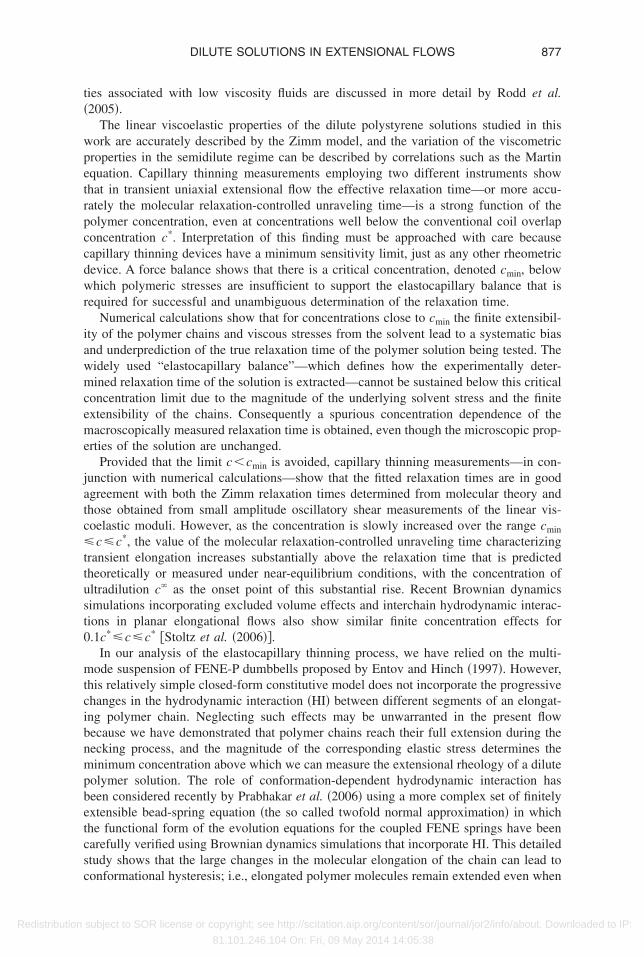
t�
wpetrpccdwr
iawmceme
jatc�ttust0
mtcibnmpbetcsc
877DILUTE SOLUTIONS IN EXTENSIONAL FLOWS
Redistribution
ies associated with low viscosity fluids are discussed in more detail by Rodd et al.2005�.
The linear viscoelastic properties of the dilute polystyrene solutions studied in thisork are accurately described by the Zimm model, and the variation of the viscometricroperties in the semidilute regime can be described by correlations such as the Martinquation. Capillary thinning measurements employing two different instruments showhat in transient uniaxial extensional flow the effective relaxation time—or more accu-ately the molecular relaxation-controlled unraveling time—is a strong function of theolymer concentration, even at concentrations well below the conventional coil overlaponcentration c*. Interpretation of this finding must be approached with care becauseapillary thinning devices have a minimum sensitivity limit, just as any other rheometricevice. A force balance shows that there is a critical concentration, denoted cmin, belowhich polymeric stresses are insufficient to support the elastocapillary balance that is
equired for successful and unambiguous determination of the relaxation time.Numerical calculations show that for concentrations close to cmin the finite extensibil-
ty of the polymer chains and viscous stresses from the solvent lead to a systematic biasnd underprediction of the true relaxation time of the polymer solution being tested. Theidely used “elastocapillary balance”—which defines how the experimentally deter-ined relaxation time of the solution is extracted—cannot be sustained below this critical
oncentration limit due to the magnitude of the underlying solvent stress and the finitextensibility of the chains. Consequently a spurious concentration dependence of theacroscopically measured relaxation time is obtained, even though the microscopic prop-
rties of the solution are unchanged.Provided that the limit c�cmin is avoided, capillary thinning measurements—in con-
unction with numerical calculations—show that the fitted relaxation times are in goodgreement with both the Zimm relaxation times determined from molecular theory andhose obtained from small amplitude oscillatory shear measurements of the linear vis-oelastic moduli. However, as the concentration is slowly increased over the range cmin
c�c*, the value of the molecular relaxation-controlled unraveling time characterizingransient elongation increases substantially above the relaxation time that is predictedheoretically or measured under near-equilibrium conditions, with the concentration ofltradilution c� as the onset point of this substantial rise. Recent Brownian dynamicsimulations incorporating excluded volume effects and interchain hydrodynamic interac-ions in planar elongational flows also show similar finite concentration effects for.1c*�c�c* �Stoltz et al. �2006��.
In our analysis of the elastocapillary thinning process, we have relied on the multi-ode suspension of FENE-P dumbbells proposed by Entov and Hinch �1997�. However,
his relatively simple closed-form constitutive model does not incorporate the progressivehanges in the hydrodynamic interaction �HI� between different segments of an elongat-ng polymer chain. Neglecting such effects may be unwarranted in the present flowecause we have demonstrated that polymer chains reach their full extension during theecking process, and the magnitude of the corresponding elastic stress determines theinimum concentration above which we can measure the extensional rheology of a dilute
olymer solution. The role of conformation-dependent hydrodynamic interaction haseen considered recently by Prabhakar et al. �2006� using a more complex set of finitelyxtensible bead-spring equation �the so called twofold normal approximation� in whichhe functional form of the evolution equations for the coupled FENE springs have beenarefully verified using Brownian dynamics simulations that incorporate HI. This detailedtudy shows that the large changes in the molecular elongation of the chain can lead to
onformational hysteresis; i.e., elongated polymer molecules remain extended even whensubject to SOR license or copyright; see http://scitation.aip.org/content/sor/journal/jor2/info/about. Downloaded to IP:
81.101.246.104 On: Fri, 09 May 2014 14:05:38
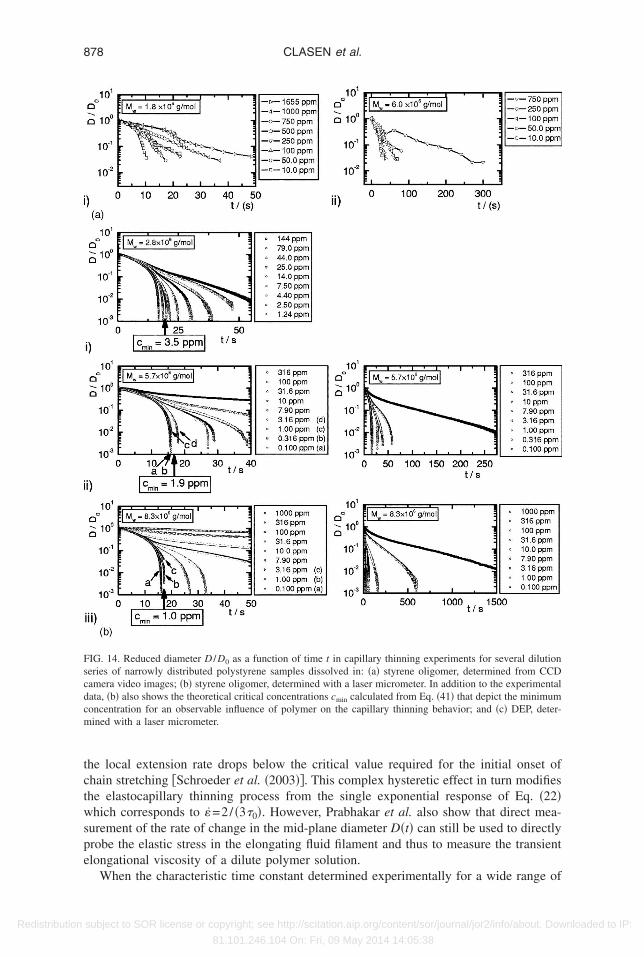
tctwspe
Fscdcm
878 CLASEN et al.
Redistribution
he local extension rate drops below the critical value required for the initial onset ofhain stretching �Schroeder et al. �2003��. This complex hysteretic effect in turn modifieshe elastocapillary thinning process from the single exponential response of Eq. �22�hich corresponds to �=2/ �3�0�. However, Prabhakar et al. also show that direct mea-
urement of the rate of change in the mid-plane diameter D�t� can still be used to directlyrobe the elastic stress in the elongating fluid filament and thus to measure the transientlongational viscosity of a dilute polymer solution.
IG. 14. Reduced diameter D /D0 as a function of time t in capillary thinning experiments for several dilutioneries of narrowly distributed polystyrene samples dissolved in: �a� styrene oligomer, determined from CCDamera video images; �b� styrene oligomer, determined with a laser micrometer. In addition to the experimentalata, �b� also shows the theoretical critical concentrations cmin calculated from Eq. �41� that depict the minimumoncentration for an observable influence of polymer on the capillary thinning behavior; and �c� DEP, deter-ined with a laser micrometer.
When the characteristic time constant determined experimentally for a wide range of
subject to SOR license or copyright; see http://scitation.aip.org/content/sor/journal/jor2/info/about. Downloaded to IP:
81.101.246.104 On: Fri, 09 May 2014 14:05:38
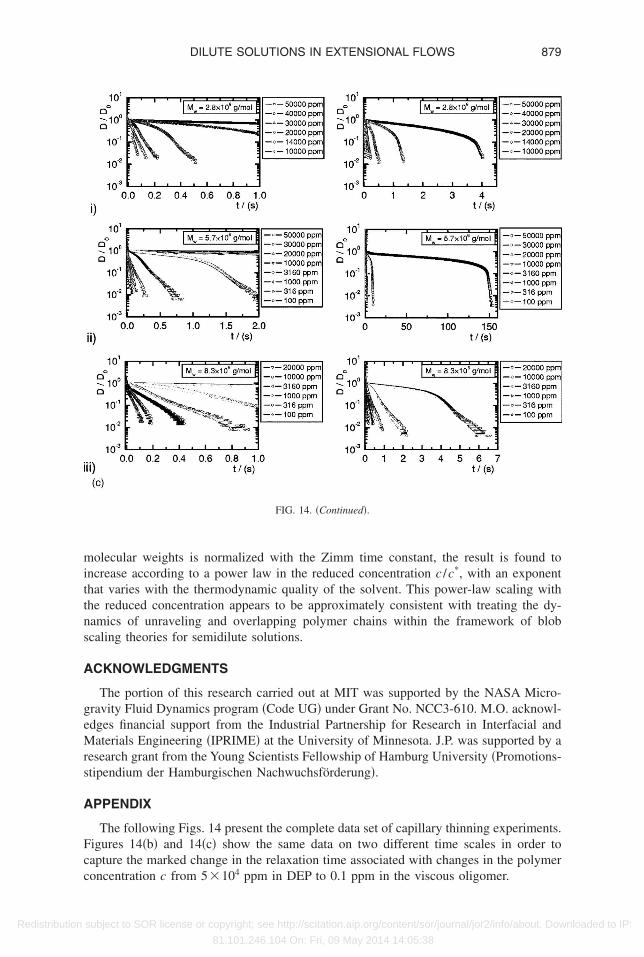
mittns
A
geMrs
A
Fcc
879DILUTE SOLUTIONS IN EXTENSIONAL FLOWS
Redistribution
olecular weights is normalized with the Zimm time constant, the result is found toncrease according to a power law in the reduced concentration c /c*, with an exponenthat varies with the thermodynamic quality of the solvent. This power-law scaling withhe reduced concentration appears to be approximately consistent with treating the dy-amics of unraveling and overlapping polymer chains within the framework of blobcaling theories for semidilute solutions.
CKNOWLEDGMENTS
The portion of this research carried out at MIT was supported by the NASA Micro-ravity Fluid Dynamics program �Code UG� under Grant No. NCC3-610. M.O. acknowl-dges financial support from the Industrial Partnership for Research in Interfacial andaterials Engineering �IPRIME� at the University of Minnesota. J.P. was supported by a
esearch grant from the Young Scientists Fellowship of Hamburg University �Promotions-tipendium der Hamburgischen Nachwuchsförderung�.
PPENDIX
The following Figs. 14 present the complete data set of capillary thinning experiments.igures 14�b� and 14�c� show the same data on two different time scales in order toapture the marked change in the relaxation time associated with changes in the polymer
4
FIG. 14. �Continued�.
oncentration c from 5�10 ppm in DEP to 0.1 ppm in the viscous oligomer.
subject to SOR license or copyright; see http://scitation.aip.org/content/sor/journal/jor2/info/about. Downloaded to IP:
81.101.246.104 On: Fri, 09 May 2014 14:05:38
R
A
A
A
A
B
B
B
B
C
C
C
D
D
E
E
E
F
G
G
G
H
K
K
K
L
L
880 CLASEN et al.
Redistribution
eferences
marouchene, Y., D. Bonn, J. Meunier, and H. Kellay, “Inhibition of the finite-time singularity during droplet
fission of a polymeric fluid,” Phys. Rev. Lett. 86, 3558–3561 �2001�.melar, S., C. E. Eastman, T. P. Lodge, and E. D. Vonmeerwall, “How good is the bead-spring model,” J.
Non-Cryst. Solids 131, 551–555 �1991�.nna, S. L., and G. H. McKinley, “Elasto-capillary thinning and breakup of model elastic liquids,” J. Rheol.
45, 115–138 �2001�.nna, S. L., G. H. McKinley, D. A. Nguyen, T. Sridhar, S. J. Muller, J. Huang, and D. F. James, “An
interlaboratory comparison of measurements from filament-stretching rheometers using common test flu-
ids,” J. Rheol. 45, 83–114 �2001�.azilevskii, A. V., V. M. Entov, M. M. Lerner, and A. N. Rozhkov, “Degradation of polymer solution fila-
ments,” Vysokomol. Soedin., Ser. A Ser. B 39, 474–482 �1997�.azilevskii, A. V., V. M. Entov, and A. N. Rozhkov, “Liquid filament microrheometer and some of its appli-
cations,” Third European Rheology Conference 1990.
azilevskii, A. V., V. M. Entov, and A. N. Rozhkov, “Breakup of an Oldroyd liquid bridge as a method for
testing the rheological properties of polymer solutions,” Vysokomol. Soedin., Ser. A Ser. B 43, 716–726
�2001�.ird, R. B., O. Hassager, R. C. Armstrong, and C. F. Curtiss, Dynamics of Polymeric Liquids—Kinetic Theory
�Wiley, New York, 1987�, Vol. 2.
hristanti, Y., and L. M. Walker, “Surface tension driven jet break up of strain-hardening polymer solutions,”
J. Non-Newtonian Fluid Mech. 100, 9–26 �2001�.lasen, C., J. Eggers, M. A. Fontelos, J. Li, and G. H. McKinley, “The beads-on-string structure of viscoelastic
threads,” J. Fluid Mech. 556, 283–308 �2006�.ooper-White, J. J., J. E. Fagan, V. Tirtaatmadja, D. R. Lester, and D. V. Boger, “Drop formation dynamics of
constant low-viscosity, elastic fluids,” J. Non-Newtonian Fluid Mech. 106, 29–59 �2002�.oyle, P. S., E. S. G. Shaqfeh, and A. P. Gast, “Dynamic simulation of freely draining flexible polymers in
steady linear flows,” J. Fluid Mech. 334, 251–291 �1997�.unlap, P. N., and L. G. Leal, “Dilute polystyrene solutions in extensional flows—Birefringence and flow
modification,” J. Non-Newtonian Fluid Mech. 23, 5–48 �1987�.ggers, J., “Nonlinear dynamics and breakup of free-surface flows,” Rev. Mod. Phys. 69, 865–929 �1997�.ntov, V. M., and E. J. Hinch, “Effect of a spectrum of relaxation times on the capillary thinning of a filament
of elastic liquid,” J. Non-Newtonian Fluid Mech. 72, 31–53 �1997�.ntov, V. M., V. I. Kordonskil, and I. V. Prokhorov, “Rapid stretching of polymer solutions,” Sov. Phys. Dokl.
33, 628–630 �1988�.erry, J. D., Viscoelastic Properties of Polymers, 3rd ed. �Wiley, New York, 1980�.hosh, I., G. H. McKinley, R. A. Brown, and R. C. Armstrong, “Deficiencies of FENE dumbbell models in
describing the rapid stretching of dilute polymer solutions,” J. Rheol. 45, 721–758 �2001�.raessley, W. W., “Polymer chain dimensions and the dependence of viscoelasic properties on the concentra-
tion, molecular weight and solvent power,” Polymer 21, 258–262 �1980�.upta, R. K., D. A. Nguyen, and T. Sridhar, “Extensional viscosity of dilute polystyrene solutions: Effect of
concentration and molecular weight,” Phys. Fluids 12, 1296–1318 �2000�.arrison, G. M., J. Remmelgas, and L. G. Leal, “The dynamics of ultradilute polymer solutions in transient
flow: Comparison of dumbbell-based theory and experiment,” J. Rheol. 42, 1039–1058 �1998�.alashnikov, V. N., “Shear-rate dependent viscosity of dilute polymer-solutions,” J. Rheol. 38, 1385–1403
�1994�.olte, M. I., and P. Szabo, “Capillary thinning of polymeric filaments,” J. Rheol. 43, 609–625 �1999�.ulicke, W.-M., and C. Clasen, Viscosimetry of Polymers and Polyelectrolytes �Springer, Heidelberg, 2004�.arson, R. G., “The rheology of dilute solutions of flexible polymers: Progress and problems,” J. Rheol. 49,
1–70 �2005�.iang, R. F., and M. R. Mackley, “Rheological characterization of the time and strain dependence for poly-
isobutylene solutions,” J. Non-Newtonian Fluid Mech. 52, 387–405 �1994�.
subject to SOR license or copyright; see http://scitation.aip.org/content/sor/journal/jor2/info/about. Downloaded to IP:
81.101.246.104 On: Fri, 09 May 2014 14:05:38
L
M
M
M
M
M
N
Ö
P
P
P
R
R
S
S
S
S
S
S
S
T
T
Y
881DILUTE SOLUTIONS IN EXTENSIONAL FLOWS
Redistribution
indner, A., J. Vermant, and D. Bonn, “How to obtain the elongational viscosity of dilute polymer solutions?”
Physica A 319, 125–133 �2003�.ackay, M. E., and D. V. Boger, “An explanation of the rheological properties of Boger fluids,” J. Non-
Newtonian Fluid Mech. 22, 235–243 �1987�.atta, J. E., and R. P. Tytus, “Liquid stretching using a falling cylinder,” J. Non-Newtonian Fluid Mech. 35,
215–229 �1990�.cKinley, G. H., “Visco-elasto-capillary thinning and breakup of complex fluids,” in: Annual Rheology Re-
views, edited by D. M. Binding and K. Walters �British Society of Rheology, Aberystwyth, 2005�, pp. 1–48.
cKinley, G. H., and T. Sridhar, “Filament-stretching rheometry of complex fluids,” Annu. Rev. Fluid Mech.
34, 375–415 �2002�.cKinley, G. H., and A. Tripathi, “How to extract the Newtonian viscosity from capillary breakup measure-
ments in a filament rheometer,” J. Rheol. 44, 653–670 �2000�.guyen, T. Q., and H. H. Kausch, Flexible Polymer Chains in Elongational Flow: Theory & Experiment
�Springer-Verlag, Berlin, 1999�.ttinger, H. C., Stochastic Processes in Polymeric Liquids �Springer Verlag, Berlin, 1996�.apageorgiou, D. T., “On the breakup of viscous liquid threads,” Phys. Fluids 7, 1529–1544 �1995�.log, J. P., W. M. Kulicke, and C. Clasen, “Influence of the molar mass distribution on the elongational
behaviour of polymer solutions in capillary breakup,” Appl. Rheol. 15, 28–37 �2005�.rabhakar, R., J. R. Prakash, and T. Sridhar, “Effect of configuration-dependent intramolecular hydrodynamic
interaction on elasto-capillary thinning and break-up filaments of dilute polymer solutions,” J. Rheol. �to be
published�.odd, L., T. Scott, J. Cooper-White, and G. H. McKinely, “Cappillary break-up rheometry of low-viscosity
elastic fluids,” Appl. Rheol. 15, 12–27 �2005�.ubinstein, M., and R. H. Colby, Polymer Physics, �Oxford University Press, New York, 2003�.chroeder, C. M., H. P. Babcock, E. S. G. Shaqfeh, and S. Chu, “Observation of polymer conformation
hysteresis in extensional flow,” Science 301, 1515–1519 �2003�.lobozhanin, L. A., and J. M. Perales, “Stability of liquid bridges between equal disks in an axial gravity-field,”
Phys. Fluids A 5, 1305–1314 �1993�.olomon, M. J., and S. J. Muller, “Study of mixed solvent quality in a polystyrene dioctyl phthalate polystyrene
system,” J. Polym. Sci., Part B: Polym. Phys. 34, 181–192 �1996�.ridhar, T., V. Tirtaatmadja, D. A. Nguyen, and R. K. Gupta, “Measurement of extensional viscosity of polymer
solutions,” J. Non-Newtonian Fluid Mech. 40, 271–280 �1991�.telter, M., and G. Brenn, “Validation and application of a novel elongational device for polymer solutions,” J.
Rheol. 44, 595–616 �2000�.telter, M., G. Brenn, A. L. Yarin, R. P. Singh, and F. Durst, “Investigation of the elongational behavior of
polymer solutions by means of an elongational rheometer,” J. Rheol. 46, 507–527 �2002�.toltz, C., J. J. dePablo, and M. D. Graham, “Concentration dependence of shear and extensional rheology of
polymer solutions: Brownian dynamics simulations,” J. Rheol. 50, 137–167 �2006�.am, K. C., and C. Tiu, “Improved correlation for shear-dependent viscosity of polyelectrolyte solutions,” J.
Non-Newtonian Fluid Mech. 46, 275–288 �1993�.irtaatmadja, V., G. H. McKinley, and J. J. Cooper-White, “Drop formation and breakup of low viscosity elastic
fluids: Effects of molecular weight and concentration,” Phys. Fluids 18, 043101 �2006�.ao, M. W., S. H. Spiegelberg, and G. H. McKinley, “Dynamics of weakly strain-hardening fluids in filament
stretching devices,” J. Non-Newtonian Fluid Mech. 89, 1–43 �2000�.
subject to SOR license or copyright; see http://scitation.aip.org/content/sor/journal/jor2/info/about. Downloaded to IP:
81.101.246.104 On: Fri, 09 May 2014 14:05:38