Embed Size (px)
Citation preview
How did Thatcher’s Social and Economic
Agenda Shape Justice in England and Wales?
Stephen Farrall (CCR, Sheffield Univ).
14th May 2015UCL Laws, Bentham House, Endsleigh Gardens,
London, Co-organised with the Howard League for Penal
Reform

Outlining this evening’s talk• Project motivations. • Outlining our framework (and
‘dependent variable’)• How were crime rates related to
Thatcherite social and economic policies?
• What happened when crime rates rose?
• Towards a conclusion …

Great Theories, But …
• Little reference to specific policies or political administrations.
• “Rather too top down” (Loader & Sparks, 2004:17); insufficiently “anchored in politics”, (Feeley, 2003:117).
• ‘Late modernity’ too vague (implies a periodisation of process which may not yet be complete).

Great Theories, But …
• Focus on middle class – little mention of working class.
• Pushing into the background the role of specific social and political actors.
• Lack of rigorous empirical assessment.

Our Approach: Drawing on Historical
Institutionalism • Concerned with illuminating how institutions and institutional
settings mediate the ways in which processes unfold over time. (Thelen and Steinmo, 1992: 2)
• Institutions do not simply ‘channel’ policies; they help to define policy concerns, create the ‘objects’ of policy and shape the nature of the interests in policies which actors may have.
• Attempts to understand how political and policy processes and relationships play out over time coupled with an
appreciation that prior events, procedures and processes will have consequences for subsequent events. • Politics does not simply create policies
policies also create politics
What are the main concepts within HI?
• Path Dependencies: what happened at an earlier point will affect what can happen later. Reversal costs are high and institutional arrangements hard to completely ‘undo’. Policy concerns and interests become constructed within parameters.
• The speed of causal processes and outcomes: there are both fast- and slow-moving causal processes and outcomes (cumulative, threshold and chain causal processes). This radically alters the time-frames of our explanations; takes criminologists away from what Paul Rock has called ‘chronocentricism’.

What are the main concepts within HI?
• Critical junctures: those rare and relatively short-lived periods when institutional arrangements are placed on a particular path. During these periods actors may be able to produce significant change.
• Punctuated equilibrium: long-run stability in policy-making is subject to occasional seismic shifts when existing institutions and issue definitions break down and pressure for change accumulates to the point where is cannot be ignored.

… and what are the problems with it?
• ideas also matter too (not just institutions), so does HI underplay the importance of actors, perhaps?:
• too much focus on reproduction of institutions? (similar to critiques of theories of structuration);
• focus on political elites (little about the populous); • important to remember that not all institutions
will be changed, adapted or maintained and that the speeds of change may be variable too.
• Paper available on request.

Figure 1: Property Crime Per Capita (Home Office Recorded Statistics and BCS)

• Economic policies• Housing policies• Social security
(esp. after 1986)• Education policies (esp. after 1988)
Which policies are we most interested in?

Economic Changes• During the 1970s there was a move
away from the commitment to Keynesian policies and full employment.
• Dramatic economic restructuring overseen by Thatcher governments.
• Consequently, levels of unemployment rose through the 1980s (see Fig 2).
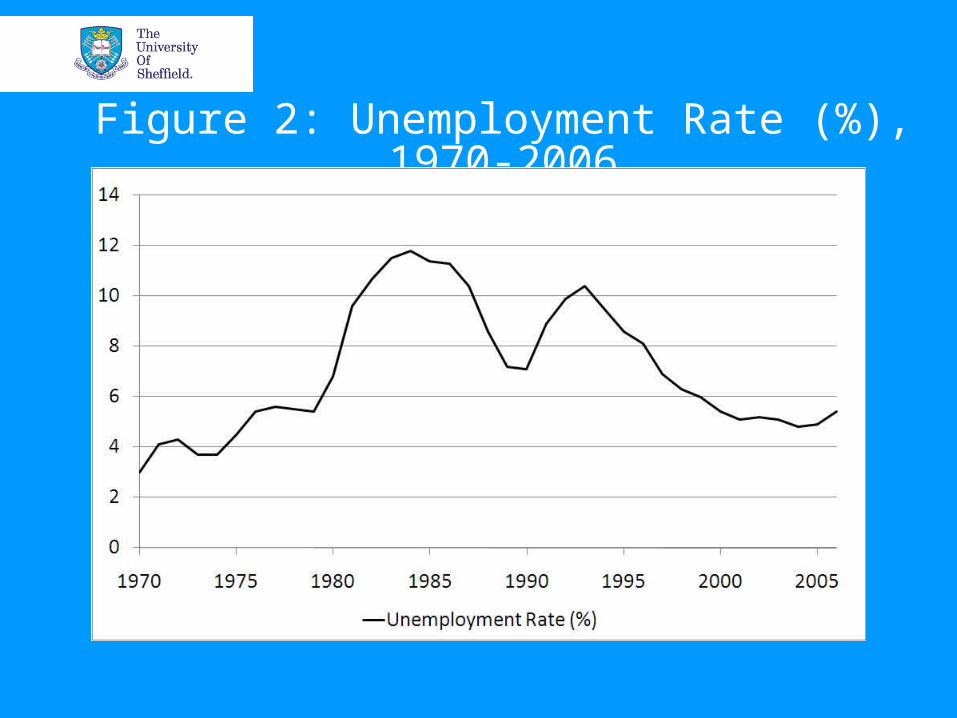
Figure 2: Unemployment Rate (%), 1970-2006

This in turn led to increases in levels of inequality (Figure 3), augmented by changes in taxation policies which favoured the better off.
Economic Changes

Figure 3: Income Inequality (Gini coefficient), 1970-2006

• Using time series analyses for 1961-2006 Jennings et al (2012) find statistically significant relationships for:
1: the unemployment rate on the rate of property crime (consistent with other studies),
2: we also find that the crime-economy link strengthened during this period.
3: (economic inequality just outside bounds of significance).
The Economy and Crime in Post-War Britain

• 1980 Housing Act (+ others): created RTB – saw a huge rise in owner-occupation.
• Created residualisation of council housing; transient/marginalised residents with low levels of employment (Murie, 1997).
Housing Policy
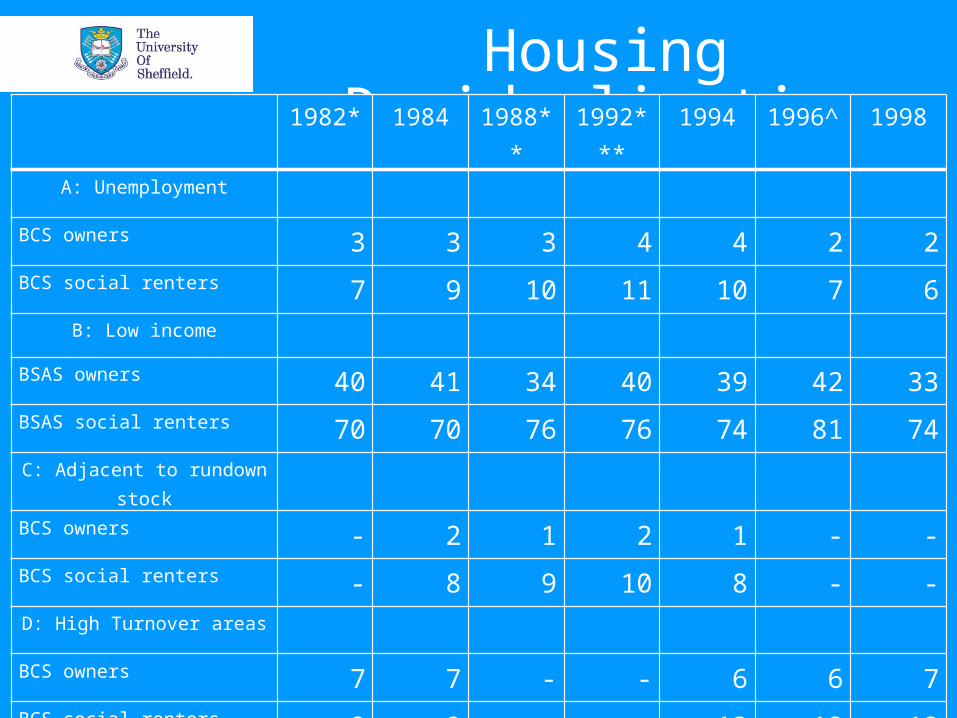
Housing Residualisation 1982* 1984 1988*
*1992*
**1994 1996^ 1998
A: Unemployment
BCS owners 3 3 3 4 4 2 2
BCS social renters 7 9 10 11 10 7 6
B: Low income BSAS owners 40 41 34 40 39 42 33
BSAS social renters 70 70 76 76 74 81 74
C: Adjacent to rundown stock
BCS owners - 2 1 2 1 - -
BCS social renters - 8 9 10 8 - -
D: High Turnover areas
BCS owners 7 7 - - 6 6 7
BCS social renters 9 9 - - 13 12 12

GHS data (ever in past yr) 1972 1973 1980
Owners 2 2 2
Renters 3 3 3
Impact on Domestic Property Crime I (pre-RTB)
GHS data (N in past yr) 1972 1973 1980
Owners (mean) .0219 .02 .02Social renters (mean) .0395 .04 .04Mean difference .0175 .018 .018Sig *** ** **
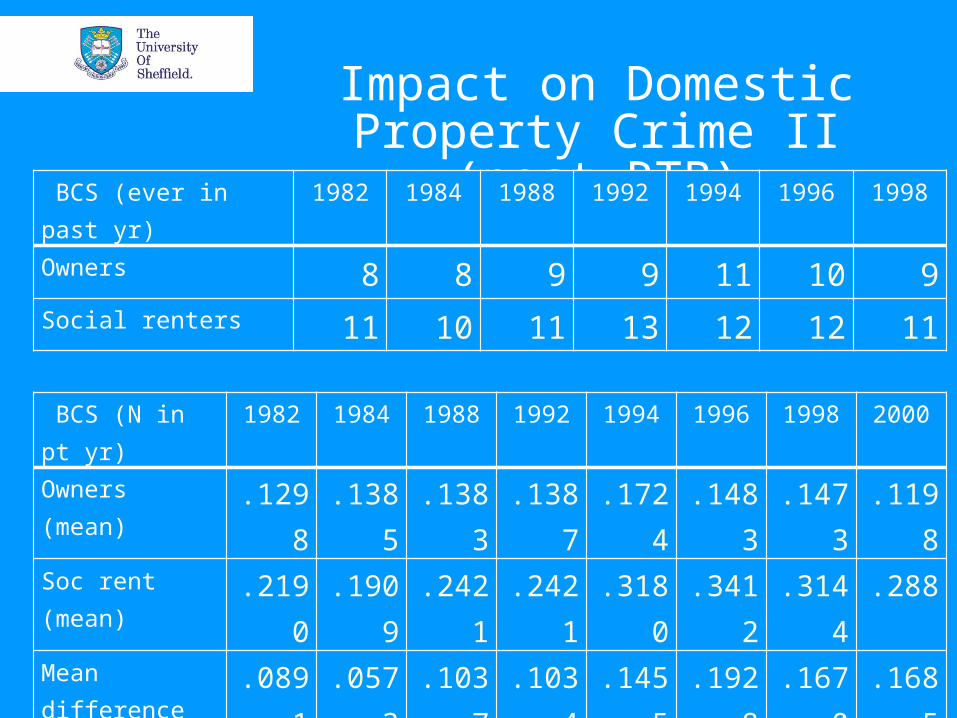
Impact on Domestic Property Crime II (post-
RTB) BCS (ever in past yr)
1982 1984 1988 1992 1994 1996 1998
Owners 8 8 9 9 11 10 9Social renters 11 10 11 13 12 12 11
BCS (N in pt yr)
1982 1984 1988 1992 1994 1996 1998 2000
Owners (mean)
.1298
.1385
.1383
.1387
.1724
.1483
.1473
.1198
Soc rent (mean)
.2190
.1909
.2421
.2421
.3180
.3412
.3144
.288
Mean difference
.0891
.0573
.1037
.1034
.1455
.1928
.1670
.1685
Sig *** ** ** *** *** *** ** **

Impact on Domestic Property Crime
• Complex initial situation of course (see Baldwin and Bottoms, 1976), however RTB contributed to concentration of social and economic need.
• Also to the concentration of crime (paper available on request).

Social Security
• 1980-1985: Some tinkering with the DHSS.
• 1986 Social Security Act based on Fowler Review.
• Following this payments reduced for many individual benefits claimants (whilst total spend increased due to unemployment).
Social Security
• Evidence to suggest that reductions in government expenditure are associated with rises in crime during the 1980s (Reilly and Witt, 1992).
• Jennings et al (2012) suggest that increases in welfare spending is associated with declines in the property crime rate.

Education
• Changes in education policies encouraged schools to exclude children in order to improve place in league tables.
• Exclusions rose during the 1990s, reaching a peak of 12,668 in 1996-97.

Education• Dumped on the streets this fuelled
ASB (Home Office RDS Occ. Paper No. 71).
• The BCS 1992-2006 shows sudden jump of people reporting “teens hanging around” to be a problem from an average of 8% before 2001 to 30% after 2002.
• School exclusions helped to create Labour’s discourse of ASB and need for C&DA 1998.

British Crime Survey ASB items
2
2.5
3
3.5
4
Mea
n
1983 1988 1993 1998 2003 2008 2013
Year
Noisy Neighbours Vandals Teens Hanging AroundRubbish Drunks Race AttackAbandoned Cars
Anti-Social Behaviour (Common Problems)
A ‘Social Storm’ of Harm?
A dynamic factor analysis (1982-2007) of these data:• Retail Price Index• Unemployment rate• Gini• Divorce, Suicide and Abortion rates• Housing Repossessions• Children taken into care

A ‘Social Storm’ of Harm?
Is positively associated with BCS data for …• The N of ALL crimes• The N of property crimes• The N of violent crimes• The N of victims• The N of property victims• The N of violence victims

What happened to crime (etc)?• Rise in crime (Fig 5). This was generally
rising before 1979, but the rate of increase picked up after early 1980s and again in early 1990s.
• Fear of crime rises (tracks crime rates, Fig 6).
• People want to see an increase in spending on the police/prisons (with decrease of spending on social security, Fig 7).

Figure 5: Property Crime Per Capita (Home Office Recorded Statistics and BCS)

Figure 6: Percentage worried about crime (BCS 1982-2005)

Fig 7: Priorities for extra spending (social security vs. police) BSAS 1983-2009

Developments post-1993:• Howard (Home Sec 1993-97) talks tough on
crime.• Prison population rises immediately (Newburn
2007).• Rise in average sentences: Riddell 1989:170;
Newburn 2007:442-4. • Trend continued, appears due to tough
sentences and stricter enforcement. MoJ 2009: 2-3 cites mandatory minimum sentences (aimed at burglars and drug traffickers) as a cause.
• Prison population grew by 2.5% p.a. from 1945 to 1995, but by 3.8% p.a. 1995-2009 (MoJ, 2009: 4).

Increasing Imprisonment
1970 1980 1990 2000 2010year
Prison Popn 1970-2013
Average Prison Popn (Key years):
1970: 39028 1979: 42220 1993: 44552 1994: 48621 2013: 84249

Temporality of Thatcherite Policy
Spillover

Labour Party’s Response• Move to the political right.• ‘Tough on crime, tough on the causes
of crime’.• Focus on ‘young offenders’ (Sch
Exclusions related to?). • Did not oppose Crime (Sentences)
Act 1997 despite it being quite draconian (‘3 strikes’, minimum mandatory sentences).

Labour In GovernmentNeeded to do something about crime because …
a) it actually was a problem (peak was in 1994) but still a source of public concern
b) they needed to be seen to be doing something to avoid being accused of having ‘gone soft on crime again’.
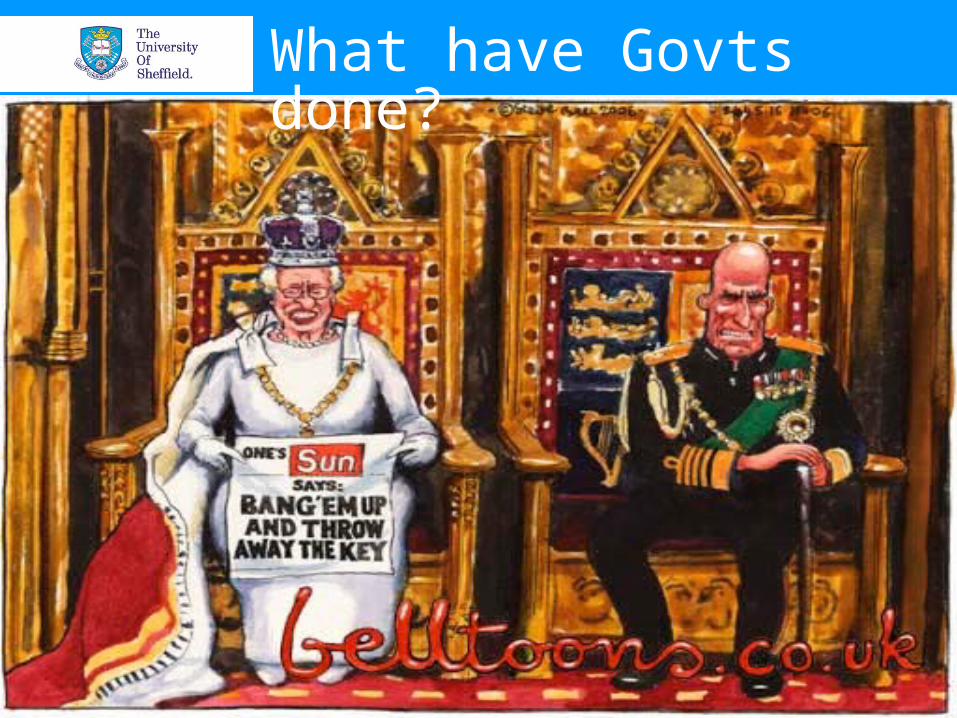
What have Govts done?

What have Govts done?• They devote more time to crime in
it’s expressed policy agenda (Fig 9).• Little sustained interest in crime until
60s (2%).• After 1979 GE rises to 8%. • Big jump again in 1996 (15%). • Thereafter runs at or near to 20%.

Figure 9: Proportion of attention to law and crime in Queen’s Speech (from
policyagendas.org)

Modelling what Govts have done
• Farrall and Jennings (2012) report statistically significant relationships for:
1: national crime rate on Govt attention on crime in Queen’s Speeches, and,
2: effects of public opinion on Govt. attention on crime in Queen’s Speeches.• So the Govt responds to crime rates
and expressions of public concern about crime.
Towards a Conclusion• Thatcherism was a mix of both neo-
liberal and neo-conservative instincts.• Changes which were driven by neo-
liberal instincts (housing, employment, social security and education) led to rises in crime.
• Rises in crime ‘provoked’ a neo-conservative set of responses to crime (‘tougher’ prison sentences).

Towards a Conclusion• Thatcher’s legacy for crime and the
criminal justice system has been the following:
1. Crime rise in 1980s-1990s.
2. New ‘consensus’ on responses to crime.
3. CJS now geared up for high volume crime (but crime rates falling).
• Causes of crime (therefore of justice) extremely complex and intertwined with other social policy arena.

Outline of current workESRC grant : • Analyses of BCS, BSAS, GHS, BES + national level
data. Data sets to be made available autumn 2015.
• 40min documentary film “Generation Right” (Doc Fest 7th June 2015)
• http://www.sheffield.ac.uk/law/research/projects/crimetrajectories
• E-newsletter/Working Papers ([email protected])
• Twittering: @Thatcher_legacy