Embed Size (px)
Citation preview

Copyright © 2008, 2009, 2010 by Bo Becker and Todd Milbourn
Working papers are in draft form. This working paper is distributed for purposes of comment and discussion only. It may not be reproduced without permission of the copyright holder. Copies of working papers are available from the author.
How did increased competition affect credit ratings? Bo Becker Todd Milbourn
Working Paper
09-051
How did increased competition affect credit ratings?
Draft Date: September 15, 2010
Bo Becker and Todd Milbourn*
Abstract. The credit rating industry has historically been dominated by just two agencies, Moody’s and S&P, leading to longstanding legislative and regulatory calls for increased competition. The material entry of a third rating agency (Fitch) to the competitive landscape offers a unique experiment to empirically examine how in fact increased competition affects the credit ratings market. Increased competition from Fitch coincides with lower quality ratings from the incumbents: rating levels went up, the correlation between ratings and market-implied yields fell, and the ability of ratings to predict default deteriorated. We offer several possible explanations for these findings that are linked to existing theories.
Key words: Credit ratings; competition and reputation; information quality
* Harvard Business School (Becker) and Washington University in St Louis (Milbourn). Contact author’s e-mail
address: [email protected]. We wish to thank Pierluigi Balduzzi, Robert Battalio, Doug Diamond, Serdar Dinc, Radhakrishnan Gopalan, Robin Greenwood, Burton Hollifield, Edith Hotchkiss, Dave Ikenberry, Darren Kisgen, Christian Leutz, Joe Mason, Atif Mian, Michael Meltz, Neil Pearson, Mitch Petersen, Joshua Pollet, Raghuram Rajan, Matthew Rhodes-Kopf, Sébastien Michenaud, Antoinette Schoar, and Gary Witt, as well as seminar participants at Helsinki, DePaul-Chicago Federal Reserve, the NBER 2008 Summer Meeting, the NBER 2010 Summer Meeting on Credit Rating Agencies, MIT, Harvard Business School, Boston College, Boston University, Temple University, the Philadelphia Federal Reserve, Standard & Poors’ Academic Council, the CEPR/Einaudi conference on Transparency, Disclosure and Market Discipline in Banking Regulation, and the University of Notre Dame for helpful comments. We also thank both Kangzhen Xie and Lan Xu for excellent research assistance. Any remaining errors are of course our own. An earlier draft of this paper was circulated under the title of “Reputation and competition: evidence from the credit rating industry”.

1
1. Introduction
Credit ratings make information about default likelihoods and recovery rates of a security
widely available, limiting duplication of effort in financial markets. They allow uninformed
investors to quickly assess the broad risk properties of tens of thousands of individual securities
using a single and well-known scale.1 In addition, ratings are relied on extensively in regulation and
private contracting, and as a tool for measuring and limiting risk For example, commercial banks,
insurance companies and pension funds are among the institutions facing regulatory rules based on
credit ratings. Many investors can only hold securities with investment grade ratings (e.g., pension
funds, money market funds) or are required to use different amount of capital based (e.g., insurance
companies) on the ratings of securities they hold. For these reasons, ratings constitute a key channel
of information dissemination in financial markets and are considered important by legislators,
regulators, issuers and investors alike.2 The quality of ratings is therefore quite relevant for the
proper functioning of the financial system.
While the importance of a viable ratings industry seems clear, the provision of accurate
ratings is made more complicated by the peculiar market structure of the industry. First off, the
industry is dominated by only three players – Moody’s, Standard & Poor’s (S&P), and Fitch – with
Fitch only gaining prominence in the past decade or so.3 Second, ratings issued mainly by these
agencies are paid for by the firms being rated. Once produced, ratings are made publicly available
and investors that rely on them use them for free. Users of ratings, such as investors who consider
buying a security, desire accurate ratings. However, firms whose securities are rated prefer
favorable ratings as it directly lowers their cost of capital, and do not necessarily prefer accurate
ones. Since rating agencies’ revenues come from issuers, a basic tension exists between the desire
of raters to please individual paying customers and the raters’ need to maintain the overall precision
and informativeness of credit ratings.
1 The majority of corporate security ratings relate to corporate bonds. Other corporate securities, such as preferred stock,
are frequently rated as well, as are government bonds (at the municipal, state and federal levels) and structured financial products (such as RMBS, CMOs, CDOs, etc.). See Table 1B for an overview of ratings categories.
2 See Graham and Harvey (2001) for a survey of financial executives’ attitudes toward credit ratings, Campbell and Taksler (2003) for recent evidence on the effect of ratings on corporate bond prices, and Tang (2006) for the information transmission of ratings. Kisgen (2006) shows how firm capital structure decisions are affected by rating considerations.
3 The Securities and Exchange Commission (SEC) now recognizes ten firms as Nationally Recognized Statistical Ratings Agencies, thereby granting their ratings regulatory status, but the other seven firms play a much smaller role in the corporate market.

2
The aforementioned features of the industry have raised questions about the quality of the
ratings provided by these incumbent players. In particular, there is a broad consensus among policy
makers and regulators around the potential benefits of increasing competition between ratings
providers as a tool for improving ratings quality. For example, Paul Schott Stevens, the President of
the Investment Company Institute, stated “I firmly believe that robust competition for the credit
rating industry is the best way to promote the continued integrity and reliability of their ratings” 4 in
testimony for a US Senate Committee on Banking, Housing, and Urban Affairs. The empirical
merits of this push for competition are not at all well established, and because of the informationally
opaque setting, the theoretical predictions are ambiguous as well.
In this paper, we wish to examine the effect of increased competition in the ratings industry
and shed some light on the issue of whether or not it tends to improve the quality of ratings. The
corporate debt ratings industry offers a clear instance of increased intertemporal competition as
Fitch grew into a credible player perched to compete with the two incumbents in the corporate debt
market, namely Moody’s and Standard & Poor’s (S&P). Founded in 1913, Fitch’s roots are as old
as these main agencies, but it remained a markedly smaller player until 1989 when a new
management team recapitalized Fitch. This was followed by a merger in 1997 with IBCA Limited,
which specialized in coverage of financial institutions. As noted by Nancy Stroker (Managing
Director of Fitch Ratings), “[t]he merger of Fitch and IBCA represented the first step in our plan to
respond to investors’ needs for an alternative global, full-service ratings agency capable of
successfully competing with Moody’s and S&P across all products and market segments.”5 Fitch’s
continued growth from this year forward was both organic and inorganic, including the acquisitions
of Duff & Phelps Credit Rating (American) and Thomson Bankwatch (Canadian) in 2000. Figure 1
characterizes the evolution of Fitch Ratings over time.
The emergence of Fitch as a larger player manifested itself in a significant increase in their
market share. As detailed later in our data section, we measure the market presence of Fitch by the
fraction of all bond ratings in a particular industry over a period of time (a month or a year) that are
provided by Fitch. Figure 2 highlights that over the decade that we study, starting in the mid-1990s,
Fitch’s share of corporate bond ratings increased substantially. In the median industry, Fitch issued
4 See http://www.financial-planning.com/asset/article/527499/fund-industry-group-calls-more-credit.html. 5 Drawn from the statement of Nancy Stroker, Group Managing Director Fitch Ratings, to the Committee on House
Financial Services Subcommittee on Capital Markets, Insurance and Government Sponsored Enterprises June 29, 2005.

3
less than one in ten ratings in 1997, but approximately a third of ratings by 2007.6 Also critical to
the construction of our empirical tests is the fact that Fitch’s aforementioned growth in the corporate
ratings market has varied considerably across industries. The range of market shares can be seen
from the 25th and 75th percentile lines plotted in Figure 2. Table 1C lists Fitch market share by
industry, comparing the average for the earlier half of our sample (1995-2000) and the later half
(2001-2006). By the end of the sample, Fitch was particularly prominent in Finance, Utilities,
Public Administration, Real Estate, and Retail. Fitch remained relatively less represented in
agriculture, entertainment, other services, and transport. The largest gains during the sample
occurred in Accommodation and Food Services, Real Estate, Construction, Waste Management, and
Retail.
Such increased market presence across a wide array of industries didn’t go unnoticed by the
users of ratings, and institutional acceptance of Fitch’s corporate ratings was cemented by the July
1, 2005 inclusion into the Lehman (now Barclays Capital) Index that differentiates between
investment-grade and junk (high-yield) bonds (see Chen, Lookman, Schürhoff, and Seppi (2010)).
Prior to this change, Lehman assigned the lower of Moody’s or S&P’s rating to any corporate bond,
and thus in situations where one of these two incumbents placed a bond below investment grade
(e.g., BB+) while the other placed it above (e.g. BBB-), the bond would necessarily be classified as
part of the junk-bond index. After this move to include Fitch’s ratings as part of the classification,
index classification was determined by the middle of the three ratings, thereby affording Fitch a full
seat at the corporate ratings table.
In this paper, we examine the impact of increased competition on ratings quality by
exploiting the industry-level variation in Fitch’s market share (see Table 1C). Specifically, we
examine how the quality of ratings issued by the incumbent agencies, S&P and Moody’s, responds
to the new competition presented by Fitch. Empirically, we focus on two dimensions of quality: the
ability of ratings to transmit information to investors and their ability to classify risk. The basic
intuition behind this interpretation of quality is as follows. Ratings that can predict future defaults
and that are correlated with current bond prices perform well in terms of information transmission.
Ratings classifications that are stable (in how they map credit quality to ratings) perform well for
6 Figure 2 plots the 24-month rolling average of Fitch’s market share in the 25th percentile, median, and 75th percentile
industries. Because our sample begins in 2005, the 24 month lag means that the graph starts in 1997. The industries are listed in Table 1C (the specific industries that constitute the 25th percentile, median and 75th percentile lines varies over time).

4
classification purposes. If contracts specifying investment restrictions to securities only of certain
ratings (e.g. investment grade bonds) are to work effectively, ratings categories need to have a
stable meaning. Similarly for regulation that relies on credit ratings (i.e. capital requirements that
vary by ratings category). Thus, the use of ratings in contracts and regulation requires a stable
interpretation of them. In other words, we treat ratings inflation (a general increase in ratings levels)
as lessening the quality of ratings.7 Observe that ratings inflation may hurt the information
transmission of ratings if not all investors are sophisticated. That is, even if some investors are able
to filter out ratings inflation when interpreting them, many other investors may not be, thereby
reducing the value of ratings to precisely those investors who should be able to use them to assess
risk and contract on risk-taking. Also, inflation will make regulation and contracting with ratings
more difficult (since these rely on stable meanings of the categories).
The evidence we uncover appears unequivocally consistent with lower ratings quality as
competition increased. First, ratings issued by S&P and Moody’s rose (moved closer to the top
rating of AAA) as competition increased. Second, the ability of S&P’s and Moody’s ratings to
explain bond yields decreased with competition. In other words, credit ratings are less informative
about the value of bonds when raters face more competition. Third, the ability of firm level ratings
to predict default is lower when Fitch has a higher market share (for data reasons, we use only S&P
ratings for these tests). In one specification, speculative grade firms are 7.7 times as likely to default
within three years as investment grade firms when competition is low (Fitch market share is at the
25th percentile), but only 2.2 times as likely when competition is high (market share at the 75th
percentile).
Interpreting these results as evidence on the causal effect of competition on incumbent
behavior is only valid if competition can be treated as exogenous to the dependent variables we
study. This raises the question of what drives the patterns of growth in this measure, i.e. what
determined cross-industry variation in the growth of Fitch’s market share. One possibility is that
growth was driven by labor market frictions (i.e., staff with the requisite combination of financial
and industry expertise were easier to find in some industries) or luck (some departments at Fitch
were more successful and grew faster). However, there are several possible alternatives. The first
relates to the endogeneity of Fitch’s market share: could the market share in a particular industry be
7 Throughout the rest of the paper, when referring to credit ratings, we will use the term quality in the sense outlined
above: stable category meanings and high correlation with prices and subsequent defaults.

5
driven either directly by future changes in ratings levels or indirectly by some omitted variable that
also affects ratings? We address this concern in several ways. Apart from firm variables, we control
for industry and year fixed effects in all our regressions, ruling out any overall time trends or purely
cross-industry explanations. We also find that Fitch’s growth does not appear related to the most
obvious measures of credit growth. Fitch’s market share is not statistically related to increases in
demand for debt in an industry, the number of ratings issued in an industry, or several measures of
industry profitability (for a range of leads and lags). Thus, it does not appear that Fitch found it
easier to enter in good times (or bad). These results also suggest that the growth in the ratings
market seen over the sample period is not the driver of any of our results.8
Furthermore, our results do not likely reflect selection on who is rated by Fitch (as suggested
by, for instance, theories about ratings shopping). We find that individual bonds which are rated by
Fitch tend to have lower ratings from S&P and Moody’s, the opposite of the aggregate pattern we
observe in which industries where Fitch issues a high share of ratings see higher ratings from S&P
and Moody’s. Therefore, the positive effect of competition on ratings cannot reflect the aggregation
of firm-level selection.
Another possibility is that Fitch might find it easier to enter and grow in industries where
S&P and Moody’s neglect firms and therefore produce uninformative ratings. This would generate
an omitted variables bias producing a correlation between ratings informativeness and competition
(the omitted bias being neglect by the incumbents). This story does not explain our results about
ratings levels, and leaves unexplained the basic issue of why S&P and Moody’s would neglect
certain industries at all.9 Yet another suggestion is that Fitch’s ratings are more in demand when
default is harder to predict, possibly owing to industry opacity or rates of industrial change. This
could also generate the observed pattern of weaker predictive ability for ratings issued when
competition is high. This story does not appear consistent with our findings for the level of ratings
(i.e., why would ratings be higher when default is difficult to predict?). Furthermore, we can
examine the information environment directly by testing the predictive ability of other variables,
such as accounting ratios. It turns out that accounting variables are not worse predictors of firm
8 Revenues and profits of raters grew quickly over the sample period. For example, from 1997 to 2007, roughly
corresponding to our sample period, Moody’s revenues rose from $457 million to $2,259, growing at 17% per year on average.
9 As discussed later with respect to the possibility of ratings shopping in this market, S&P and Moody’s essentially provide full coverage (>99.95%) of any corporate bonds rated by Fitch.

6
default when competition is high. Fitch does not appear to have gained a higher market share when
predicting default was hard. Hence, the weaker predictability of rating likely does not reflect a
particularly difficult information environment.
In a further attempt to compare alternative explanations for our findings, we use an
instrumental variables regression. This should help address more generic endogeneity concerns
regarding Fitch’s market share. We use the predicted market share in each industry from 1996 and
onwards as an instrument by extrapolating from Fitch’s 1995 market share. These tests rely on the
fact that Fitch’s growth was predictably slower in those industries where initial market share was
high (such as for finance and insurance firms), and faster in industries where it was initially low
(such as agriculture and utilities). Because predicted market shares are formed using only
information from 1995, they cannot reflect events late in the sample, so any endogeneity must
involve great foresight by industry participants or very long range reverse causality, which seems
unlikely.
Granting our findings about how competition coincides with worse ratings quality, there are
several potential explanations that derive from a number of theories. First, this pattern could reflect
a reputational mechanism at work, in which future economic rents motivate current (unobserved)
quality. If increasing competition from Fitch reduced expected future rents for the incumbents, the
incentives for quality provision were consequently reduced. Second, it is possible that the empirical
evidence reveals ratings shopping. We consider each of these explanations in turn.
Our findings of reduced ratings quality could be related to a reputation story. Since ratings
predict future default events, which are infrequent and can be far off in the future, feedback about
the accuracy of ratings is slow and imprecise. In this setting, raters’ concern for their reputations as
providers of honest and accurate ratings may help sustain ratings quality (see Cantor and Packer
(1994) and Smith and Ingo (2002)). By providing accurate ratings, they improve future business
opportunities. Industry sources confirm this logic. According to a Bear Stearns & Co equity analyst
in June 2007, S&P claimed that “reputation is more important than revenues”. Bloomberg news
cites Moody’s CEO Raymond McDaniel stating that “we are in a business where reputational
capital is more important”.10 Former executive VP of Moody’s Thomas McGuire stated in 1995 that
10 Bloomberg News March-11-2008, “Moody's, S&P Defer Cuts on AAA Subprime, Hiding Loss”.

7
“what's driving us is primarily the issue of preserving our track record. That's our bread and
butter.”11
There is a rich theoretical literature that argues that the formation of reputations can help
support quality provision in markets where information problems would otherwise preclude it. This
literature has its origins in economics,12 but the role of reputation in financial market outcomes has
been extensively explored as well. For example, Diamond (1989) models the incentives of firms
(borrowers) to develop a reputation for choosing the appropriate project. On the other hand,
Chemmanur and Fulghieri (1994) show how a bank’s desire to acquire a reputation (in their case for
making efficient negotiation versus liquidation decisions) provides them with an incentive to devote
a large amount of resources to information production. However, if the desire to have a positive
reputation is diminished, less investment in information acquisition will occur in equilibrium.13
The implication of Chemmanur and Fulghieri (1994) could certainly be extended to credit
rating agencies. There is also an increasing body of work that specifically examines the role of
reputation among credit rating agencies, both theoretically and empirically. For instance, Goel and
Thakor (2010) characterize how reputational concerns provide a rating agency with incentives to
invest in costly information acquisition. On the empirical side, Covitz and Harrison (2003) provide
strong empirical evidence related to Moody’s and S&P that suggests that reputation effects actually
dominated any conflicts of interest in the industry. Their sample spans 1997-2002, which overlaps
with the early part of our sample when Fitch was only beginning to build up market share in various
industries. Most directly related to our work is that of Bar-Isaac and Shapiro (2010). In a model of
endogenous reputation formation that explicitly characterizes the direct costs of providing high
quality ratings, they show that if reputational losses are lower in the industry owing to perhaps
increased competition, there are lesser incentives to provide accurate ratings. Our empirical results
are exactly in line with the predictions of this model.
11 Institutional investor, 10-1995, “Ratings Trouble”. 12 See Klein and Leffler (1981), Benabou and Laroque (1992), Mailath and Samuelson (2001), Bar-Isaac (2005), and
Bar-Isaac and Tadelis (2008) as examples. Benabou and Laroque (1992) characterize the incentives of an insider to manipulate markets through strategic information disclosures. While credit rating agencies do in fact disclose information to the market, our interpretation of ours findings is not that the rating agencies were intentionally deceiving markets, but instead compromised ratings quality at the margin as competition increased.
13 Not all reputational theories predict that competition will reduce quality. Competition may enhance the effectiveness of the reputational mechanism if the existence of competitive choice is required to make the loss of reputation a real threat, as in Hörner (2002).

8
Since the market for ratings grew so much in recent years, it may be worth asking if the
predictions of the reputational theories are scale-invariant. The reputational theories argue that
competition can threaten quality by reducing future rents, but it appears likely that the massive
expansion in the ratings industry during our sample period generated increases in total rents (see,
e.g., footnote 9 for a sense of the very high sustained growth rates), but these were concentrated in
the structured products market, which is not the focus of our work. That said, the reputational
argument still goes through as long as, holding market size constant, more competition corresponds
to lower rents at the margin. If market size affects the payoff to high quality (more expected future
business, as the firm’s reputation for quality is maintained) and the payoff to low quality (more
business or higher fee revenue from bond issuers) similarly, reputational concerns would appear
unaffected by market size. If the market expansion is temporary, the incentives to cheat may in fact
be enhanced by market growth (since current profits from producing low quality become large
relative to future rents).
A second explanation for our results related to ratings inflation could be the phenomenon of
‘ratings shopping’ that has come to describe the process by which issuers shop around for good
ratings and that ultimately the ratings we observe are the ones that were considered most positive by
issuers. There is presumably greater scope for such shopping if there are more raters from which to
choose. Skreta and Veldkamp (2009) and Bolton, Freixas and Shapiro (2009) both provide
theoretical models of the affect of ratings shopping on the quality of the ratings in the structured
finance market.14 Skreta and Veldkamp show that increases in asset complexity (such as mortgage-
backed securities and CDOs) leads to more ratings shopping and a systematic bias in disclosed
ratings. Bolton et al find that rating agencies are more prone to inflate ratings as the fraction of
naïve investors increases (i.e., those who follow disclosed ratings such as in Boot, Milbourn and
Schmeits (2006)). In both cases, increases in competition further exacerbate the problems.
While both of these theories are compelling in the market for ratings of structured products,
the phenomenon of ratings shopping is likely to matter much less for the firms and corporate
securities whose ratings we examine. As Spatt (2009) points out, ratings shopping can only occur if
the security issuer gets to choose which credit ratings to purchase and have published. Such a
14 Bolton, Shapiro and Freixas (2009) predict that ratings shopping, apart from affecting ratings directly, will also lead
to the sort of competitive dynamics that reduces the effect of reputations in maintaining quality, as suggested by e.g. Bar-Isaac and Shapiro (2010). Hence, their model encompasses both the main explanations for the observed link between quality and competition, albeit not in the corporate security market.

9
luxury is not afforded to corporate issuers since both Moody’s and S&P have a policy of rating
essentially all taxable corporate bonds publicly issued in the US. Thus, even if an issuer refuses to
pay for a rating, the raters publish it anyway as an unsolicited rating, and thereby compromise any
potential advantage of ratings shopping.15 To the extent that shopping consists of some firms adding
Fitch ratings, but no firms eliminating S&P and Moody’s ratings, it won’t affect our key dependent
variable (the level of ratings issued by the incumbents).
Bongaerts, Cremers, and Goetzmann (2010) assess the prevalence of ratings shopping. They
rely on data from 2002-2008 and find no support for ratings shopping in the corporate debt
market.16 Failure to find evidence of ratings shopping in this market is consistent with the earlier
work of Cantor and Packer (1997), Jewell and Livingston (1999) and Covitz and Harrison (2003).
In structured products, which are not included in our sample, the situation is different, because
raters do not have access to the extensive public financial data which enables them to rate corporate
debt based on public sources alone. Issuers of structured products can avoid a rating by withholding
information about the issue from the agencies. In our data, one piece of evidence suggests that
shopping may take place. We find that S&P’s and Moody’s bond ratings are slightly lower for
bonds that have a Fitch rating (controlling for observables). This is consistent with firms seeking
out Fitch when their ratings appear low relative to other measures of credit quality. In other words,
this could be interpreted as evidence for shopping.
However, this type of shopping cannot explain our findings on ratings informativeness and
of how competition coincides with higher ratings. In fact, what we find at the aggregate industry
level – when Fitch has a higher market share of rated bonds outstanding, the ratings of Moody’s and
S&P are higher – is the opposite direction of the bond-level finding – when Fitch rates a bond, it
typically has low rating. Therefore, ratings shopping, which is arguably the most likely cause of
endogeneity, appears to matter in the data, but can be ruled out as an alternative explanation of our
findings that higher competition coincides with more issuer-friendly ratings. If anything, ratings
shopping will lead us to underestimate the effect of competition.
15 Which ratings are unsolicited (and therefore, not paid for by the issuer) is not publicly known. 16 Bongaerts, Cremers, and Goetzmann (2010) find that Fitch ratings tend to be higher than those issued by S&P and
Moody’s, but reject this as evidence of ratings shopping or two important reasons. First, investors do not lower credit spreads in the instances in which Fitch enters a new rating that is higher (which would be the natural desire of the issuer attempting to shop for this third rating). Second, they do not find that Fitch enters with on average higher ratings at the critical investment grade/high yield cutoff.

10
We conclude that competition most likely weakens reputational incentives for providing
quality in the ratings industry, and thereby undermines quality. The reputational mechanism appears
to work best at modest levels of competition. There are a number of caveats and limitations to our
findings, and several qualifications to the conclusions we draw. First, we only consider corporate
ratings, not ratings of CDOs, mortgage-backed securities or other structured products.17 Second, our
findings have limited implications for the efficacy of reputational mechanisms in other imperfectly-
competitive settings, since the ratings industry is particular in many ways. For example, Hong and
Kacperczyk (2008) find positive effects of competition among equity analysts (see also Chevalier
and Ellison (1999) and Hong and Kubik (2003) for work on reputations and equity analysts). These
markets are different in many ways, including the underlying revenue model (equity analysts are
paid indirectly by the institutional investors who use their recommendations, not by the firms they
analyze) and the rate at which feedback occurs (equity analysts make short-term predictions,
whereas many corporate bonds are first rated ten or even twenty years before they mature, before
which time any evaluation of the rating’s accuracy is typically incomplete).18 Third, we disregard
many potentially important aspects of reputation, such as how the reputational mechanism varies
over firms’ life-cycles (see Diamond (1989)) and how entry decisions are made (Mailath and
Samuelson (2001)).
Our findings may shed light on some of the regulatory changes that have been contemplated
and implemented for the credit ratings industry, including increased competition. . Further
competition it is not likely to improve quality. Our findings indicate that quality in the ratings
industry relies on rents that reward reputation-building activities which are costly in the short run.
The reduction of such rents reduces the amount of reputation-building, i.e., high quality production,
in equilibrium. Aside from its effect on incumbent, competition might have other effects, including
reducing monopolistic (or in the case of ratings, oligopolistic) rents, and adding information to
financial markets (since raters sometimes give different ratings).
In structured products, Fitch’s presence was substantial early on, and there is no clear
parallel to the changes we examine in the area of corporate bonds. This of course limits the
17 Doherty, Kartasheva, and Phillips (2008) examine the effect of competitive entry among rating agencies of the
insurance market. In contrast to our findings in the corporate bond arena, they find that going from one to two raters (S&P entered as a competitor to the incumbent A.M. Best) led to improved rating content, using a particular model of what ratings should be for individual cases.
18 Other industries where reputations have been studied empirically include auto mechanics (Hubbard (2002)), online trading (Cabral and Hortaçsu (2006)), and restaurants (Jin and Leslie (2003, 2008)).

11
applicability of our findings to the recent financial crisis, where ratings of structured securities have
been particularly called into question. However, there is a rich literature emerging in this area,
including Coval, Jurek and Stafford (2008), Benmelech and Dlugosz (2009), Bolton, Freixas and
Shapiro (2009), Mathis, McAndrews, and Rochet (2009), and Skreta and Veldkamp (2009).
The rest of the paper is organized as follows. In Section 2, we discuss credit ratings and the
underlying industry in more detail. In Section 3, we present the predictions of various theories, and
the methodology used to test them. We present the data in Section 4 and results in Section 5.
Concluding remarks can be found in Section 6.
2. Credit ratings: business model and regulation
A credit rating is an assessment of the creditworthiness of a corporation or security, based
on the issuer’s quality of assets, its existing liabilities, its borrowing and repayment history and its
overall business performance. Ratings predict the likelihood of default on financial obligations and
the expected repayment in the event of default. There are two main types of ratings. Bond ratings
are provided for a vast majority of publicly-traded bonds in the United States (U.S.). Firm (or
Issuer) ratings are produced by each of the three main agencies for all U.S. public firms that issue
public debt. Credit ratings range from Aaa (or equivalently, AAA) to D (see Table 1B for an
overview of the ratings levels for the three main rating agencies and the numerical value
assignments used in our empirical work)
Issuers seek ratings for a number of reasons, including to improve the marketability or
pricing of their financial obligations, to increase their trustworthiness to business counterparties or
because they wish to sell securities to investors with preferences over ratings. Investors, financial
intermediaries and regulators use ratings as an indicator of the risk and likely repayment of
securities. Also, certain categories of institutional investors are obliged by regulation to rely on
ratings for their investment decisions. For example, the amount of capital required for banks and
insurance companies who own securities varies with the credit rating. There are also regulatory
constraints forcing some investors (e.g., insurance companies and Savings & Loan institutions) to
only hold debt securities of investment grade (i.e., with a rating of BBB or better).
Ratings are typically shared freely by the rating agencies; whose revenues derive from
charges to the firms whose credit quality is being assessed. Fees for bond ratings typically consist of

12
a fixed fee per year coupled with a larger upfront fee, charged when the bond is first rated at time of
issuance.19 Paying for firm ratings is voluntary, although raters will only consider non-public
information provided by the firm itself if they receive payment from the corporate issuer (see Jorion
et al. (2005) regarding raters’ access to non-public information). Rating agencies also provide
various other types of ratings, such as short-term credit opinions and various industry-specific
ratings. They may also derive revenue from selling analysis and other services to investors.
Early on, rating agencies tried an alternative revenue model that charged users of ratings.
This model suffers from being very dependent on the enforcement of contractual limits to how
customers can share ratings information they receive. As pointed out by White (2002), the change
from user-paid to issuer-paid ratings as the dominant model “in the early 1970s coincides with the
spread of low-cost photo-copying”. Rating agencies derive revenue from various sources apart from
issuers’ fees, such as subscriptions to historical data bases.
The Securities and Exchange Commission (SEC) has designated certain firms as “Nationally
Recognized Statistical Rating Organizations” (NRSROs).20 The ratings of these firms can be used
for various regulatory purposes, and many investors will only consider ratings by an NRSRO when
making investment decisions. This may also make entry in the industry more difficult.21 Some
argue, as SEC Commissioner Paul S. Atkins, that “the unintended consequence of the SEC's
approach to credit rating agencies was to limit competition and information flowing to investors.
The legislative history reflects a genuine concern that the SEC facilitated the creation of — and
perpetuated — an oligopoly in the credit rating business. Indeed, today, three NRSRO-designated
firms have more than 90 percent of the market share.”22
3. Hypotheses and methodology
We aim to compare ratings quality under different intensities of competition. Our measures
of quality are based on the idea that ideally, ratings should have a stable meaning and accurately
19 Fees vary with the face value of a bond issue, but usually in a non-linear way (i.e., they are capped). Also, active
issuers may receive quantity discounts. In February, 2008, S&P shared information about their rating fee structure, including that corporate issuers (including industrial and financial service companies) pay “up to 4.25 basis points for most transactions” and that the minimum fee is $67,500. Also, “S&P will consider alternative fee arrangements for volume issuers and other entities that want multi-year ratings services agreements” (Standard and Poor’s 2008).
20 There are ten such agencies since 2008 (see http://www.sec.gov/divisions/marketreg/ratingagency.htm#nrsroorders). 21 See Boot, Milbourn and Schmeits (2006) for both a discussion and model of such investor restrictions to hold only
investment grade debt securities. 22 See “Speech by SEC Commissioner: Remarks to the Institute of International Bankers”, by SEC Commissioner Paul
S. Atkins, March 3, 2008. Link to full speech is here: (http://www.sec.gov/news/speech/2008/spch030308psa.htm)

13
predict defaults. Various users of ratings may in fact have slightly different views on this.
Legislators and regulators rely on ratings categories being consistent over time and across firms and
industries, so that regulation can use ratings to control and limit risk taking. The SEC (2003) wants
to promote “credible and reliable ratings”.23 Consistent ratings criteria may also be attractive for
private contracting (e.g. for bond mutual funds that invest in certain ratings categories). Presumably,
investors generally want ratings that are informative about risk and default.24
We use several complementary approaches to evaluate rating quality. Our first approach
appeals to ratings level. We argue that lower quality ratings will be on average higher ratings, that
is, ratings closer to the AAA end of the spectrum since this must be the universal desire of the
issuers as the subject of the ratings. It is worth recalling why shifts along the rating scale are a
problem. Such shifts may in theory allow similar information transmission. However, the practical
requirements are fairly steep: all investors have to be able to decipher how the market structure is
affecting ratings. In particular, the least sophisticated investors, who likely need ratings the most,
will be the least able to follow time-variation in the meaning of ratings categories. Even if
information transmission is maintained as categories change meaning, regulation and legislation
relying on ratings will be adversely affected. Such rules tend to be slow-moving and not easily
adapted. They therefore require ratings categories to have stable meanings. For these reasons, a shift
in categories may generate considerable difficulty for users of ratings. Summing up, ratings levels
are a natural place to investigate whether rated firms exert pressure on ratings firms, because issuers
are likely to have the direct preferences about the level. Other measures of ratings quality, such as
default prediction, are perhaps more important to the financial system, but less directly related to
issuer preferences. A general increase in ratings levels is a direct implication of competition if
competition leads to ratings reflecting issuer preferences instead of credit quality (as suggested by
reputational models).
There is probably some cross-sectional variation among firms with regards to their
preferences for better ratings. We exploit cross-firm variation in the likely importance of ratings to
various issuers. Specifically, we predict that any effect of competition would be stronger for firms
23Policy makers may also like ratings that do not fluctuate too much, in order to stabilize financial institutions. This is
an aspect of quality where we do not expect competition to be particularly important (since neither issuer nor investor is likely to have a clear preference). We therefore leave this issue out of our empirical work.
24However, current holders of bonds may desire high ratings for the bonds they own. Especially under mark-to-market accounting rules, some investors may prefer not to get bad news in the form of downgrades.

14
with higher leverage as these rely more on debt to finance their operations and investment. Such a
story is consistent with the survey evidence of Graham and Harvey (2001). This allows a
difference-in-difference type test, where we compare the effect of competition on ratings for
different groups of firms. Using a range of measures of leverage, we find that the effect on ratings is
higher for more levered firms, consistent with the idea that ratings tend to reflect issuer preferences
more as competition increases.
Our second approach purports that high quality ratings should be informative about bond
values, and here we use market prices of debt to assess the informativeness of ratings. Lower
quality ratings mean that ratings will reflect things other than expected repayment, and ratings
levels will thus be less correlated with bond yields. We examine the correlation of ratings with bond
yields (conditional on various controls known to correlate with yields). That is, we ask if ratings
contain information about bond values beyond easily observable characteristics such as bond
covenants and firm fixed effects.
Our third and final approach contends that since ratings aim to predict default, we can test
their predictive power econometrically as competition levels change. We relate default events three
years out to current ratings, either to actual ratings categories or simply broad indicators for whether
a firm is assigned an investment grade rating, and allow the effect of ratings to vary with
competition. Ratings are also meant to predict recovery rates in default, but data on these are much
harder to collect (in part because bankruptcy proceedings can be lengthy and their outcomes
complicated).
In all of the above tests, we rely on the use of Fitch’s market share as a measure of
competition, where market share is the number of bond ratings issued by Fitch as a fraction of those
issued by the three raters in total. An advantage of using individual bond ratings is that it affords us
a very large dataset. Another advantage is that the measure is simple and can easily be replicated.
However, this is clearly not an ideal measure of competition, and revenue share would probably be
preferable. Unfortunately, data on prices and revenue is not readily available. As a robustness test,
we have also used an alternative measure of competition, the log of the number of ratings issued by
Fitch in an industry-year. This variable is not mechanically affected by any decisions of S&P and
Moody's and may therefore be considered cleaner than Fitch's market share from an identification

15
standpoint. Results with this alternative measure of competitive pressure are with few exceptions
statistically stronger, and with slightly larger magnitudes than the results presented in the paper.25
4. Data
Data on bond ratings and market shares are drawn from the Mergent Fixed Income
Securities Database (FISD). This database provides both issue- and issuer-specific data. We use
data on ratings by S&P, Moody’s and Fitch of individual issues (bonds) to estimate the market share
of Fitch in each industry-year cell. The total number of bond ratings used to calculate market shares
is approximately 1.1 million. Each bond rating is matched to issuer data such as the main industry
using the issuer’s Cusip. There are more ratings around the year 2000 than in other years, but no
year has fewer than 30,000 ratings. We define Fitch’s market share as the fraction of all bond
ratings in a year-industry cell performed by Fitch, where industries refer to the 2-digit North
American Industry Classification System (NAICS) industries and our sample years run from 1995
to 2006 (some of our tests will not use the first few years of data). Figure 1 presents a moving
average of monthly market shares for Fitch from 1998 to 2006.26 Fitch’s market share increases
especially fast in 2000, coinciding with two acquisitions.27 For each bond rating issued by Moody’s
or Standard and Poor’s, we identify the preceding rating of the same bond, as well as whether the
bond has been rated by Fitch. We have used 4-digit industry classifications with very similar results
throughout, but prefer 2-digit industries for two reasons. First, using larger industries reduces the
noise in market shares estimates, reducing measurement error. Second, it’s not clear that narrow 4-
digit industries are actually competitively distinct (for credit rating agencies competing for
business). The advantage of getting a larger number of distinct observations by using narrower
industries does not seem to compensate for these disadvantages.
Firm ratings, default events, and accounting data are collected from the Compustat Industrial
and Operating Segments databases. Compustat also contains S&P issuer credit ratings, updated
25 It may seem reasonable that Fitch can only exert pressure on the ratings of S&P and Moody’s if Fitch itself on
average offers friendly ratings. Fitch ratings are not included in our samples, but in unreported tests comparing Fitch bond ratings to those issued by the other two rating agencies, Fitch’s ratings are 0.2 steps higher (controlling for bond fixed effects), consistent with competition through ratings levels.
26 In tests, we use the total market share for each industry-year. This figure presents moving averages of total monthly market share across industries in order to provide a sense of the time path of Fitch’s entry.
27 Potentially, market share increases due to organic growth and increases due to acquisitions have different competitive impact, and including data from 2000 may make our results less representative. We have rerun our ratings levels regressions (Tables 3, 4, 6) using only post-2000 data, or all years except 2000, and uncover qualitatively similar results.

16
annually. We define future default events as having a year-end corporate credit rating equal to D in
three years.
We use bond transaction data from the Mergent FISD database to identify bond yields. This
dataset covers all bond acquisitions and disposals (sales, redemptions) since 1995 by insurance
companies. We exclude bonds denominated in foreign currencies, as well as any bonds that are
callable, puttable, convertible, substitutable or exchangeable. We also exclude US issues by foreign
issuers (i.e., Yankee bonds). We drop defaulted bond issues, bonds denominated in foreign
currency, and bonds with refund protection. We drop variable coupon bonds (because their yields to
maturity are harder to calculate). We also require several control variables (such as issuer industry)
to be available, and drop bond trades with very high or very low sales prices to avoid data errors
(this constraint does not affect our results). Most of these restrictions do not reduce the sample size
much. We match each bond transaction to the most recent rating of the bond by Moody’s or S&P,
and throw out any bonds with no ratings in the month preceding the transaction. If there is more
than one rating on the same date, we use the median of the most recent ratings.
The remaining sample of bond transactions consists of a little more than one hundred
thousand observations (each observation corresponds to one trade). For each bond transaction, we
determine the yield to maturity implied by the price at which the trade took place (trades are quoted
in terms of bond prices relative to bond face value), taking care to correctly time the coupons
(typically semi-annual) and final payment. We use a numerical procedure to estimate yields to
maturity. Because of the sample restrictions (e.g., no floating rate bonds), this is straightforward and
fairly fast, and the precise numerical procedure is not critical as determined by several robustness
tests. We calculate yield spreads by subtracting the yield for the government bond with closest
maturity (disregarding the timing of coupon payments) from the yield to maturity. Government
bond yield data is from the Federal Reserve’s H15 reports. For each bond in the sample, we identify
the initial issue yield and match that to an initial credit rating.
An overview of the most important variables is presented in Table 1A. In this table, the
number of observations for Fitch’s market share refers to the number of industry-year cells. Bond
ratings categories are described in Table 1B.

17
5. Empirical results
This section presents our evidence from the various tests of rating quality and how it is
affected by changes in the competitive landscape of rating agencies.
5.1. Bond and firm credit rating levels
The first test concerns the level of firm credit ratings. We regress firm ratings on Fitch’s
market share. Results are presented in Table 2. In column one, no controls are included. Errors are
clustered by industry-year cell, since this is the level at which our variable of interest varies (this
applies to most of our tests). In this sample, there is a significant positive correlation between
Fitch’s market share and the level of credit ratings issued by S&P or Moody’s, suggesting that more
competition pushes ratings toward the higher end of the rating spectrum (i.e., toward AAA). This
pattern is clearly visible in Figure 3 which plots the frequency of each rating for industry-years with
high and low values for Fitch’s market share. As the graph shows, all investment grade ratings (i.e.
BBB- and above) are more common under high competition, and all junk bond ratings (i.e. BB+ and
below) are more common under low competition. In other words, the figure and the regression
analysis offer complementary evidence that competition is correlated with higher ratings.
The estimated coefficients in column one may be unreliable since no controls are included.
In column two, we rectify this by including year and industry dummies. This pushes up the R-
squared, and reduces the coefficient and standard error on competition. The coefficient on Fitch’s
market share remains positive and significant. The magnitude is modest but non-trivial. For a one
standard deviation change in competition (0.142), average ratings are predicted to increase by 0.19.
This corresponds to a one rating step upgrade (e.g., A- to A) of approximately one out of every five
firms. Since the variable used to capture competition is likely to be noisy, the estimated coefficient
is biased toward zero by measurement bias. The true magnitude may therefore be larger than that
implied by our coefficient estimate.28 On the other hand, omitted firm heterogeneity may potentially
bias our findings either way. In column three, we include firm fixed effects (making industry fixed
effects redundant), which absorb most of the variation in the dependent variable (firm ratings are
fairly stable). Thus, the R-squared is now high (firm fixed effects explain over 80% of the variation
in the left hand side variable). This regression also includes eighteen accounting-based firm controls
28 Blume, Lim, and Mackinlay (1998) document a trend toward tougher ratings standards in the period preceding our sample. Because our results include year fixed effects, any time trends in ratings levels are eliminated from the regressions. Average firm ratings are falling slightly over time in our sample.

18
related to firm size, profitability, and indebtedness (see Table 2 for a description of the controls) to
capture any time variation in firms’ performance and credit worthiness. The estimated effect of
competition remains positive and significant, and the implied magnitude is slightly smaller,
corresponding to approximately one in nine firms. The significance of the coefficient is lower (10%
level).
The OLS specifications implicitly treat every step of the left hand side variable as equal.
There is no reason for this to be how ratings categories work, however. In column five, we run an
ordered probit regression instead of OLS. This specification allows each cut-off to be estimated and
so implicitly allows the effect of dependent variables to vary across different parts of the of the
ratings scale. The regression therefore uses data more efficiently (although it may be less robust to
certain econometric problems than OLS). The coefficient on Fitch’s market share remains positive
and significantly different from zero. The marginal effect of competition is estimated to be positive
and significant at the 5% level for the rating categories AAA, AA+, AA, AA-, A+, A, A-, BBB+
and BBB. It is negative and significant at the 10% level for BBB-, and negative and significant at
the 5% level for all lower rating levels (these individual category effects are not reported in Table
2).
As a robustness test, we next collapse the data by industry-year cell, explaining the average
(column five) or median (column six) of firm ratings in the industry and year with average (median)
of all firm controls, as well as industry and year fixed effects. The cell averages are based on
between twenty five and 339 individual firm ratings (industry-years with less than twenty five firms
are excluded). These specifications differ from that in column three in several ways. First, they
avoid concerns about error correlations and repeated sampling of the same firm, since there are only
160 observations. Second, they put much less weight on cells with many bonds (since each
industry-year cell is treated equally), which may have an important effect on the estimated
coefficients if the effect of competition is not homogenous. Third, all within-cell variation is thrown
out. The estimates for Fitch’s market share are significant and positive in both regressions, and
imply magnitudes similar to that implied by the coefficient estimate in column two (a one notch
rating change for one in four or five firms), and significance somewhat higher than in column three.
Overall, the firm rating results contained in Table 2 suggest that ratings become more favorable to
issuers when competition increases.

19
We turn now to ratings of individual bond issues (as opposed to the firms). Such tests should
provide further evidence of how increases in competition among rating agencies affect ratings. For
many purposes, bond ratings matter more than firm ratings since investment regulations tend to
concern instrument and not issuer ratings. Also, thanks to the very large number of observations, we
can control for dynamics more carefully than with firms. In Table 3, we report the estimates of
regressions of the level for individual bond credit ratings on Fitch’s market share. Each observation
is a rating. The number of observations is very large, since many firms have multiple bond issues
outstanding at any given time and since many bonds are rated repeatedly. We include a range of
fixed effects in order to control for observables. In column one, we report a regression of ratings on
Fitch’s market share, controlling for year and industry fixed effects, as well as fixed effects for the
lagged rating of the same bond (i.e., the most recent rating by either S&P or Moody’s, whenever it
occurred) and time to maturity (rounded to the nearest number of years) fixed effects. Competition
enters with a positive sign, suggesting that more competition tends to increase ratings, consistent
with the result for firm ratings. The coefficient on Fitch’s market share implies that a one standard
deviation increase in competition is expected to increase ratings by an average of 0.06 steps (that is,
one in 17 bonds will see an increased rating of one step), a smaller effect than that estimated for
firm level credit ratings). Often, the same bond appears many times in our data. This means we can
include bond issue fixed effects, and estimate the effect of competition holding the subject of the
rating fixed (of course, important aspects of a bond may change through time). In column two, we
include bond issue fixed effects (making industry fixed effects redundant). In this specification,
Fitch’s market share is again positively and significantly related to ratings (the estimated effect is
approximately 20% larger than without bond fixed effects). This result rules out that our findings
are driven by any time-invariant differences between bonds, and is akin to studying changes in
ratings.
The statistically robust link between competition and poor incumbent ratings quality is
consistent with theories where competition causes low quality of ratings, but also with theories that
imply the reverse direction of causality. We attempt to address endogeneity concerns by controlling
for whether a bond is rated by Fitch. Controlling for Fitch’s presence in individual bonds addresses
the concern that Fitch tends to rate bonds with either high or low ratings (and hence that
competition is correlated with the left hand side variable due to reverse causality). In particular, we
might find a positive correlation between competition and ratings if Fitch systematically rates bonds

20
with high ratings. In column three we include a dummy variable equal to one if Fitch has rated the
same bond during the calendar year in question.29 The Fitch dummy enters with a negative sign,
implying that individual bonds receiving a Fitch rating tends to be those where an incumbent
agency’s rating is low (conditional on regression controls). This suggests that if anything, selection
effects will bias the coefficient on Fitch market share downward (since Fitch’s market share will be
higher in industry years where many bonds have a Fitch rating). In other words, whereas bonds in
industry-year cells with a big Fitch presence (what we interpret as competition) tend to receive
higher ratings, the particular bonds that are rated by Fitch within an industry-year cell tend to have
low ratings. The estimated coefficient on Fitch market share is still positive and significant. These
results are consistent with our interpretation that competition increase ratings, while firms with
worse ratings seemingly gravitate towards into using Fitch (tending to generate a negative relation
between Fitch’s presence and ratings levels).30 Adding up selection effects across many bonds
therefore cannot explain our competition finding. The negative coefficient on Fitch’s presence may
be consistent with ratings shopping, if firms tend to ask for a Fitch rating if they are disappointed
with their ratings from S&P and Moody’s, but again, such behavior provides no obvious advantage
to the issuer.
Financial firms issue a large share of corporate bonds. In column four, we exclude issuers
belonging to NAICS 52 from the sample in case bonds in this industry are fundamentally different
from non-financial firms’ bonds. The sample size is cut in approximately half, and the estimated
coefficient is somewhat larger, corresponding to an upgrade of roughly one in ten bonds for a one
standard deviation increase in Fitch’s market share. We next collapse the data by industry-year cell,
as done for firm ratings, explaining the average or median of ratings in the industry and year with
average (median) maturity and lagged ratings, as well as industry and year fixed effects. The cell
averages are based on between ten and 7,914 individual bond ratings (industry-years with less than
ten observations are excluded). Since the variation across cells in the number of bond ratings is even
larger than for firm ratings, collapsed results may differ even more from the full panel results in this
setting. The estimated competition coefficient for both average and median ratings is large and
29 Varying the time window has only a minor impact on the regression results. For example, using a dummy equal to
one for bonds for which Fitch issued a rating ever, or issued a rating at the time of issue, yields very similar regression results (the coefficient on Fitch’s market share is similar).
30 The negative coefficient on the Fitch dummy for individual bonds is less robust to reasonable variations in regression specification than our competition variable.

21
significant (at the 10% level for averages, 1% for medians). The implied magnitudes are larger than
in the individual bond regressions (corresponding to an upgrade of one in three bonds for averages
and two in three bonds for medians). This may reflect any of several factors. First, the method puts
more weight on industry-year cells with few bond ratings. Perhaps the effect of competition is
stronger for industries with limited numbers of bonds outstanding, potentially reflecting the
sophistication of investors. Second, all within-cell variation is thrown out. Third, to the extent that
endogeneity biases coefficients against our findings (because firms are more interested in a third
rating when S&P and Moody’s issue relatively low ratings), the collapsed results may be less
biased. The pattern that firms with lower ratings tend to get a Fitch rating, seen in column three, was
identified within industry-year cells. This pattern may be weaker or absent at the industry level (for
example, because industry level presence is more driven by Fitch’s access to skilled labor).
We next consider cross-sectional variation in the impact of competition on firm ratings. The
effect of competition should be felt more acutely for those firms that are likely to care more about
their ratings. We use firm indebtedness to identify firms with a greater concern for ratings. In Table
4, we interact Fitch’s market share with four measure of indebtedness: leverage (debt over assets),
long-term leverage (long-term debt over assets), a high leverage dummy (leverage is above the
median in the firm’s industry) and debt divided by EBITDA. These specifications allow us to
include industry-year interaction fixed effects (i.e., approximately 400 dummies), thereby reducing
any concern about omitted variables that are correlated with Fitch’s market share and vary within
industries and years. Without exception, the interactions of competition and debt are positive and
highly significant. This suggests that the effect of competition is disproportionately felt for firms
which are more likely to care about their ratings because they rely heavily on debt financing. This
is consistent with the argument that competition makes ratings more responsive to firm preferences.
Regressions of ratings levels, at both the firm and security level, with and without extensive
control variables, estimated either in full or collapsed panels, consistently suggest that a high Fitch
market share coincides with higher ratings. Before we address possible econometric concerns with
these results and then turn to tests of the information content of ratings, we want to emphasize how
problematic ratings inflation is for the use of credit ratings in the financial system. Suppose there
are some sophisticated investors who can filter out ratings inflation and extract the credit
information in ratings that change with competition. This leaves the least informed investors at a

22
disadvantage, thereby diminishing the value of credit ratings to the financial system.31 Secondly, re-
writing contracts and regulation is costly and slow.
5.2. Identification issues raised by ratings level results
There are two main identification concerns with our results. First, certain firms or bonds
might be more likely to be rated and thus show up in our data. Since both S&P and Moody’s have
explicit policies to rate all taxable bonds from US issuers, and also to rate all issuers of such bonds,
there is mostly likely very little selection into being rated at the firm level. Second, Fitch’s market
share may not correspond to a random experiment, causing either reverse causality (Fitch enters
markets with high ratings) or omitted variable bias (some factor drives both higher ratings and entry
by Fitch). We discussed above how the most likely reverse causality works against our findings, as
firms with low ratings are more eager to ask for a third opinion. This pattern is confirmed directly in
bond-level regressions. Hence, reverse causality may bias the coefficient estimates on Fitch’s
market share to zero, but most likely cannot explain our findings. Omitted variable bias is harder to
rule our conclusively. One possibility is that Fitch found it easier to grow their market share in
booming sectors where credit demand was high (perhaps overwhelming the capacity of S&P and
Moody’s to rate bonds). In other words, overall market growth drove an increased market share for
Fitch.
We test this directly by regressing Fitch’s market share on leads and lags of five proxies for
ratings demand in an industry: the number of ratings issued, the log of the total amount of
outstanding debt of Compustat firms in an industry, the annual change in this variable, an asset-
weighted average of the ratio of return of assets (EBITDA over assets) in Compustat firms in the
industry, and the median of ROA across Compustat firms in the industry. We separately regress
each of the industry-year observations of one of the credit demand proxies on Fitch’s market share,
controlling for industry and time fixed effects. Results are presented in Table 5. There seems to be
no correlation between the various measures of demand for credit and Fitch’s market share (one
coefficient out of twenty five is estimated to be significant at the 10% level, which is slightly fewer
than the expected number from a random sample with no relation). These tests do not explain what
drives Fitch’s market share, but shows that ratings demand is not likely a main driver of relative
31 For theories of ratings which rely on non-sophisticated (or naïve) investors, see the work of Boot, Milbourn and
Schmeits (2006) and Bolton, Freixas and Shapiro (2010).

23
market shares.32 Furthermore, the “easy entry in good times” explanation for the ratings results
presented above has no implication for the informativeness of ratings. The reputational theories do,
however. These theories predict that favoring issuers will compromise the information content (i.e.
putting more weight on rater’s preferences when determining ratings implies less weight on rater’s
information about credit quality). We turn to these tests next, and return to the discussion of which
theories are consistent with the various findings after that.
5.3. Bond yields and ratings
The next step is to examine how the information content of ratings responds as competition
changes. To do this, we test how the conditional correlation between ratings and bond yields
responds to competition. The dependent variable is the yield spread to the closest maturity Treasury
bond. Results are reported in Table 6. In column one, we control for a recent credit rating by S&P
or Moody’s as well as Fitch’s market share. We also include industry fixed effects and bond
characteristics as controls (e.g., time to maturity and size of bond issue). Bond trades occur at
different times, and interest rates and risk premia are likely to be an important source of time series
variation in yields, so we include fixed effects for each date (specifically, each month).The
coefficient on credit ratings is negative and significant, confirming that bonds with better credit
ratings trade at lower yields, controlling for other observable factors. The coefficient on the
interaction of credit rating and Fitch’s market share is positive and significant, implying that the
correlation of credit ratings and bond yields is lower when there is more competition. Going from
the 25th to the 75th percentile of competition, the effective coefficient on ratings falls by a third. This
is consistent with the view that competition reduces the information content of ratings. This result is
robust to the inclusion of year-industry fixed effects, as seen in column 2. This regression produces
results that are very similar to the previous specification.33 Next, we exclude speculative grade
bonds, in case they have a different relation to ratings than investment grade bonds. The sample is
only slightly smaller, since most bond trades in the data are of bonds rated investment grade.
Indeed, the effect of ratings is smaller for these firms, although still highly significant. The
32 An alternative way of incorporating these variables is to include them as controls in regressions similar to those in Table 2 and 3. Doing this has a very limited effect on the coefficient estimates on Fitch’s market share. This is also consistent with the interpretation that Fitch’s entry is not simply about market growth.
33 We have also included the interaction of date (i.e., month) fixed effects and the natural log of time to maturity to absorb any variation in how bond premia may vary with bond age (not reported). Also, we have included controls based on estimated bond durations instead of maturities (not reported). These variations have only a marginal impact on the reported regression results.

24
interaction of Fitch’s market share and ratings has a similar magnitude (relative to the average effect
of ratings).In column four, we instead exclude trades of bond rated investment grade and focus
exclusively on speculative grade observations. The coefficient estimate is about 2.9 times higher.
This lines up closely with the standard deviation of the left hand side variable (cf. table 1A), which
is 2.8 times larger (the median of the dependent variable is 3.7 times larger for non-investment
grade bond trades). Thus, the reduced correlation between yields and ratings is comparable for the
two groups of bonds. In other words, the economic magnitude appears fairly similar across
investment and non-investment grade bonds.
These tests are based on trades of bonds, where the same bond can appear multiple times.
One concern is that multiple trades capture the same information. We include bond controls, which
may help reduce such concerns.34 However, a more direct way of addressing this is to look at the
price at issue. The Mergent/FISD database contains yield spreads at issue and we can match these to
early ratings using the same process as for the secondary market trades.35 In column five, we use the
yield spread at issue as dependent variable. As with the data on secondary market trades, the
implied correlation between credit ratings and bond yields is weaker when Fitch’s market share is
higher. The result is highly statistically significant. The magnitude is slightly lower than that found
in the trade data (i.e., column two). However, the standard deviation of yields is lower at issue (the
coefficient is 56% lower, the standard deviation is 37% lower), so the economic magnitude of the
estimates is similar. Across ratings levels and both at issuance and in the secondary market, it
appears that competition reduces the correlation between ratings and bond yields. In other words,
the bond market suggests that ratings are less informative when competition is high.
So far, we have discussed the slope of the relationship between yields and ratings. An
alternative way of assessing the informativeness of ratings is to study how they contribute to the R-
squared. To do this, we run first stage regressions with all controls except ratings, and then regress
residuals from the first stage on bond ratings. In a second stage, done separately for subsamples by
Fitch market share, we can examine how R-squared varies. These tests agree with the t-tests from
regression coefficients. For example, splitting the sample in half by competition, we find that
ratings explain more of the residuals (from a regression on all controls apart from ratings and
34 We have tried clustering errors by bond issue, and consistently get much higher significance than reported in the
tables (where errors are clustered by industry-year combinations). 35 Of course, it is possible that ratings are less (or more) important at issue than for later trades. Thus, there is not
necessarily an expectation that the coefficient will be the same as for secondary market trades.

25
market share). For the high market share sample, the R-squared is 0.081, and for the low market
share sample, 0.141 (the estimated coefficients on ratings are -0.094 and -0.215, respectively,
significantly different from zero and each other). Similar patterns are evident for other sample
splits. In other words, also by this measure we find that ratings are more informative when
competition is low.
The bond yield results show that the correlation of ratings and yields declines as competition
increases. In other words, bond yields (and spreads) are less related to credit ratings when Fitch has
a high market share. In addition, ratings explain more of the variation in yields when competition is
low, consistent with the slope findings. The implication is that credit ratings contain less yield-
relevant information when competition is stronger. This is consistent with theories that predict
lower quality (less informative) ratings when there is more competition.
Ratings shopping, the ability of issuers to choose the best ratings from among a set of
possible rating agencies, also appears consistent with the correlation of Fitch’s market share with
higher ratings levels. If ratings shopping had a really substantial impact on the level of some ratings,
it could potentially explain our findings about informativeness as well (although this may not be
very plausible). However, as mentioned in the introduction, ratings shopping is much more likely
for other agencies than the incumbents, since S&P and Moody’s tend to rate all US corporate bonds
and issuers. Second, when multiple raters issue ratings, they tend to be fairly close to each other, so
the scope even with Fitch’s ratings seems modest.36 Third, although researchers have searched for
it, there is limited evidence for ratings shopping among US corporate bond issuers (see Cantor and
Packer (1997) and Jewell and Livingston (1999)).
5.4. Predicting default
We next examine what is perhaps the most direct measure of informativeness for credit
ratings: their ability to predict defaults. This test is attractive because it directly examines the ability
of ratings to predict the most important credit events. The disadvantage is that corporate defaults are
rare, limiting the power of this test. This limit is likely to be especially problematic for higher
36 Ratings of the other firms provide very visible comparisons for raters, so they may prefer to not deviate too much
from each other. The tactics of ratings is beyond the scope of our paper and does not really relate to the main implications from the reputational models, which concern informativeness and (the average) level of ratings.

26
ratings, where defaults are rare.37 It can be argued that ratings should ideally predict default both
conditionally and unconditionally, i.e., ratings should be informative about raw probabilities
without taking any other information into account, as well as providing predictive power beyond
what easily measurable accounting data can. The information transmission function of ratings
concerns conditional predictability, whereas the risk classification function concerns unconditional
predictability.
Tests of the ability of ratings to predict default at the three year horizon are presented in
Table 7. Using a linear probability models (OLS), we regress indicators of future default on ratings
and control variables. In column one, default in three years is regressed on a dummy for investment
grade rating, Fitch’s market share, and an interaction of these. All three variables are highly
significant. The coefficient on the investment grade dummy is negative and significant at the 1%
level, implying that firms rated investment grade are less likely to default than those rated non-
investment grade. The interaction is positive, meaning that the difference between investment grade
and speculative grade default rates falls with competition. The magnitude of this effect is large.
Speculative grade firms are predicted to be 4.7 times as likely to default in three years as investment
grade firms at median competition, but 7.7 times as likely with low competition (25th percentile,
0.133) and only 2.2 times at high competition (75th percentile, 0.308). In column two, we replace
the investment grade dummy with the numerical rating value (using the Hand, Holthausen and
Leftwich scale), with similar results. The scale uses finer variation, but at the expense of imposing a
particular numerical scale, which may be inappropriate. As it turns out, the fit is slightly better, and
the magnitude of the interaction remains large and significant at the 1% level. The predicted default
probability of a B+ (the most common non-investment grade rating) firm is 2.1 times that of a BBB
rated firm (the most common investment grade rating) at median competition, 2.4 times at low
competition (25th percentile), and 1.5 times at high competition (75th percentile). The information
content of ratings appears much diminished when competition increases.
The results in column one and two are consistent with lower quality ratings when
competition is strong, but may be affected by the absence of controls. We now examine how well
ratings predict default after controlling for observables such as accounting data. In column three,
37 In our sample, there are no default events at the three year horizon for firms rated AA-, AA, AA+ or AAA. There are
186 events that we can map to controls three years before, of which 40 (21.5%) were rated investment grade, and 146 (78.5%) were rated non-investment grade. The highest observed default frequency, 5.6%, is for the ratings category CCC+.

27
year and industry fixed effects are included, as well as the full set of firm controls. The significance
and magnitude of the coefficient estimates for the variables of interest change slightly (the
interaction is now significant at the 1% level). The overall fit of this model is better: the R-squared
is 2.4% (firm controls and the two sets of dummy variables contributes about half of the
improvement each). Going from the 25th percentile of the competition measure to the 75th
percentile, the effective slope on ratings falls by almost two thirds. This establishes several
interesting points. First, defaults are better predicted by ratings together with firm accounting data
than by ratings alone. In other words, ratings are not sufficient statistics for the information in
accounting data. Similarly for time and industry dummies: ratings do not fully incorporate all the
time- and industry-variation in default rates.38 Second, however, after controlling for these
important determinants, corporate ratings still help predict defaults, especially when competition is
limited.
Defaults may be harder to predict in some years and in some industries. This could lead to
smaller differences in default probabilities between investment and non-investment grade firms at
those times or in those industries. To control for this, we include interactions of ratings with all the
year and industry fixed effects. The results are reported in column four. This specification leans
very hard on the data, since there are fifty-three coefficients to estimate39, using a sample with less
than two hundred defaults. The year and industry interactions are not well estimated with joint Chi-
tests of 3.18 (significantly different from zero at the 7.4% level) and 2.07 (significantly different
from zero at the 15.0% level). The model also does no better than the model with firm controls in
terms of R-squared. The coefficient estimate for the interaction of ratings and Fitch’s market share
is slightly lower than the previous regression with firm controls. It remains significant at the 10%
level.
In the last column of Table 7, we collapse data by industry-year cell. The dependent variable
is the fraction of firms in a cell default within three years, and ranges from zero (in about three
quarters of cells) to 0.0144. This is well explained by the linear model, which has an R-squared of
38 This is consistent with cyclical default rates (e.g. Fons 1994). This likely reflects conscious policy by raters.
Adjusting ratings for the business cycle or other factors that simultaneously shift all or most default probabilities would require constantly moving ratings up and down the ratings scale, something raters probably want to avoid.
39 The last few years of the sample are lost due to the three year lag used in defining future defaults, and the corresponding year fixed effects and interactions drop out. Some industries experienced no defaults of public firms during the sample period, so the fixed effect and interactions corresponding to those industries drop out of probit specifications.

28
57%. Since the collapsed data has discarded all within-cell variation in default probabilities, this
regression is identified only from across-cell variation. The coefficient estimate for the ratings –
competition interaction is positive and significant as in the full panel regressions, but of slightly
lower magnitude. The coefficient estimate for ratings drops by 14% going from the 25th to the 75th
percentile of the competition measure.
The regression results for the interaction of Fitch’s market share and credit ratings all
suggest that ratings quality is lower when competition is high. This is consistent with reputational
models predicting less willingness to invest (through quality) in reputations when competition
increases. It may also be consistent with ratings shopping: as competition increases, there are more
ratings to chose from, and the actually published ratings become less representative of the average
credit opinion of raters (as discussed in the introduction, the scope for ratings shopping is probably
limited for US corporate debt, however). We discussed above why reverse causality is unlikely to
explain the higher ratings that coincide with a higher Fitch market share, and also how credit
demand is unlikely to be an important omitted variable. Another possible omitted variable problem
has to do with the precision of ratings. Fitch may have found it easier to gain market share where
credit quality was hard to judge. This could lead simultaneously to poor predictability of ratings and
high Fitch market share. If this mechanism generates our results, we cannot infer that competition is
harmful to ratings quality. We can test the hypothesis that informational opaqueness drives entry
with a measure how difficult it is to predict default. To construct such a measure, we estimate a
linear probability model of default, with firm controls but without ratings, separately for each
industry-year cell, and record the R-squared. Ninety one such cells have at least one default and
twenty observations, allowing us to estimate the model with all eighteen accounting ratios. The R-
squared varies from 0.001 to 0.471. The variation in R-squared has no relation to Fitch’s market
share.40 We can also allow the eighteen controls to interact with Fitch’s market share, and the
interactions are generally insignificant (joint F-stat 0.52 with p-value 0.473 using a model similar to
column three). This suggests that reverse causality driven by preferential Fitch entry into difficult
40 We assessed this in several ways. Regressing R-squareds on market share with year and industry dummies gives a
coefficient of -0.16, with a t-stat of 1.4. Regressing the square root of the R-squareds on market share with year and industry dummies gives a coefficient of -0.03, with a t-stat of 0.5. Weighting by the number of observations in each cell produces similar results (t-stats -0.39 and 0.56). The correlation and rank correlation between market share and the residual of R-squared after controlling for year and industry, are -0.076 (p-value 0.472) and -0.086 (p-value 0.419).

29
information environments is not an important driver of the correlation between Fitch’s market share
and the predictive power of ratings.
5.5. Instrumental Variables
The empirical strategy of this paper relies on industry-level variation in the extent to which
Fitch competes with the incumbent rating agencies. We have argued that endogeneity is unlikely to
explain our results, but may in fact understate the impact of competition on ratings levels. An
econometric approach to addressing endogeneity of the market share is to find an instrument which
is not subject to the same potential problem. We use this approach to repeat the Table 2 tests using
instrumental variables (IV). We employ Fitch’s predicted market share as an instrument for the
actual market share. To construct predicted market share, we begin with Fitch’s market share in an
industry in 1995, and make a linear projection for that industry to the 2006 median market share
(35.5%).41 The intuition of the instrument is that a faster increase in competition is predicted in
those industries where Fitch starts out with a low presence early in the sample.
The start and end years of 1995 and 2006 are excluded. The instrument is highly correlated
with the actual market share (the unconditional correlation is 0.463, significant at the 0.1% level).
Since this measure is predetermined, any concern about endogeneity (e.g., industries with high
ratings attracting faster growth), is much weaker.42 The instrumental variable estimates are
predicted to be smaller than those from OLS if there is positive correlation between ratings and
competition due to reverse causality (i.e., Fitch was attracted to industries with high ratings). This is
the concern we are trying to address. On the other hand, the IV approach will yield a larger
estimated coefficient than OLS if there is negative correlation between ratings and competition
(e.g., due to reverse causality). Based on the negative coefficient on the Fitch dummy in Table 3,
the latter may seem more likely. In other words, ratings shopping would cause OLS to
underestimate the effect of competition on ratings, and IV, being free of this bias, will produce
larger estimates. In addition, the instrument is less volatile than the actual market share, and if this
reduces measurement error, there may be a smaller measurement error bias in our IV estimates.
41 Algebraically, the instrument for year t and industry i is , ,
. , . Instead of 0.353, we have also used 1/3, with similar results.
42 Market shares in 1995 might still be endogenous, but generally, that would tend to yield the opposite bias. This is because a high market share in 1995 predicts a low increase in market share after 1995.

30
Results of IV regressions are reported in Table 8 which replicates the regressions in Table 2
(columns one to four), but replaces OLS with two-stage least squares estimates. The first stage t-stat
and the F-test (not reported) are always significant at the 0.1% level (see Staiger and Stock (1997)).
In column one, with no controls, the estimated coefficient is 5.7, which is larger than the
corresponding OLS coefficient (which is 2.4, cf. Table 2). The estimated coefficient is significant at
the 5% level. In the other columns, regressions with additional controls are reported. The
coefficients are consistently larger than the OLS estimates. The implied magnitudes are on the order
of a one step increase in the ratings of half of all bonds for a one standard deviation increase in
competition. The second column, with industry and year fixed effects provides a coefficient which
is insignificant at the 10% level (although fairly close), while the third and fourth columns, which
include firm fixed effects, produce estimates which are significant at the 1% level. Since the IV
estimates are consistently larger than the OLS estimates, it is likely that some form of endogeneity
is operating against our finding, implying that the true effect of competition may in fact be larger
than the OLS findings suggest. It is also possible that no endogeneity affects our OLS results, but
that measurement error in the measure of competition biases the coefficient toward zero, while the
instrument is less noisy. Again, the higher IV coefficients would be more indicative of the impact of
competition that we have uncovered throughout the paper. The instrumental variables estimates are,
however, more complicated and less consistent across specifications. The most prudent
interpretation of these results may be to confirm the significance of a negative causation from
competition to ratings levels, without inferring too much about magnitudes.
6. Conclusions
Credit ratings perform a function of critical importance to the financial system. We find that
the entry of a third major rating agency coincides with lower overall quality, as measured by both
the levels and informational content of incumbents’ ratings. The negative link between competition
and quality is econometrically robust and unlikely to be explained by the sources of reverse
causality and omitted variables bias we examine. It also appears unlikely that ratings shopping or
growth in overall market share can explain these patterns.
The effect of competition on incumbent quality is of substantial economic magnitude. A one
standard deviation increase in Fitch’s market share is predicted to increase the average firm and
bond rating by between a tenth and half of a step (and increases it significantly more for more

31
highly-levered firms). Moving from the 25th to the 75th percentile of our competition measure
reduces the conditional correlation between ratings and bond yields by about a third and reduces the
conditional predictive power for default events at a three year horizon by two thirds.
Calls for more competition in the ratings industry, such as by the U.S. Department of Justice
(1998, 2009), may deserve a caveat. For regulators and policymakers, it is worth considering that
increasing competition in the ratings industry involves the risk of impairing the reputational
mechanism that seemingly underlies the provision of good quality ratings. There may obviously be
benefits of competition in other areas, including reducing the level of rents in rating agencies and
the additional information provided to financial markets by the additional ratings.

32
References
Bar-Isaac, Heski, 2005, “Imperfect Competition and Reputational Commitment”, Economic Letters, 89(2), November, 167-173.
Bar-Isaac, Heski and Joel Shapiro, 2010, “Ratings Quality over the Business Cycle”, unpublished working paper.
Bar-Isaac, Heski, and Steven Tadelis, 2008, “Seller Reputation”, Foundations and Trends® in Microeconomics 4(4):273-351.
Benabou, Roland and Guy Laroque, 1992, “Using Privileged Information to Manipulate Markets: Insiders, Gurus, and Credibility”, The Quarterly Journal of Economics 107-3, 921.958.
Benmelech, Efraim and Jennifer Dlugosz, 2009, “The Alchemy of CDO Credit Ratings”, Journal of Monetary Economics, 56, p 617-634.
Blume, Marshall E., Felix Lim, and A. Craig Mackinlay, 1998, “The Declining Credit Quality of U.S. Corporate Debt: Myth or Reality?”, Journal of Finance, 1389-1413.
Bolton, Patrick, X Freixas and J Shapiro, 2009, “The Credit Ratings Game”, unpublished manuscript. Bongaerts, Dion, K.J. Martijn Cremers, and William N. Goetzmann, 2010, “Tiebreaker: Certification and
Multiple Credit Ratings”, unpublished working paper. Boot, Arnoud W.A., Todd Milbourn, and Anjolein Schmeits, 2006, “Credit Ratings as Coordination
Mechanisms”, Review of Financial Studies 19-1, 81-118, Spring 2006. Cabral, L. and A. Hortaçsu, 2006, “The dynamics of seller reputation: Theory and evidence from eBay”,
Mimeo, NYU Campbell, John Y. and Glen B. Taksler, 2003, “Volatility and Corporate Bond Yields”, The Journal of
Finance, Vol. 58, No. 6. (Dec.), pp. 2321-2349. Cantor, Richard and Frank Packer, 1994, “The Credit rating Industry”, Federal Reserve of New York
Quarterly Review, 19(2), Summer-Fall, 1-26 Cantor, Richard, and Frank Packer, 1997, “Differences of Opinion and Selection Bias in the Credit Rating
Industry”, Journal of Banking and Finance, 21, pp. 1395–1417. Chemmanur, Thomas J., and Paolo Fulghieri, 1994, “Reputation, Renegotiations, and the Choice between
Bank Loans and Publicly Traded Debt”, The Review of Financial Studies 7-3, 475-506. Chen, Zhihua, Aziz A. Lookman, Norman Schürhoff, and Duane J. Seppi, 2010, “Why Ratings Matter:
Evidence from Lehman’s Index Rating Rule Change”, unpublished working paper. Chevalier, J. and G. Ellison, 1999, “Career concerns of mutual fund managers”, Quarterly Journal of
Economics, 114, 389–432. Coval, Joshua, Jakub Jurek, and Erik Stafford, 2008, “The Economics of Structured Finance”, Harvard
Business School Working Paper 09-060. Covitz, Daniel M, and Paul Harrison, 2003, ‘‘Testing Conflicts of Interest at Bond Rating Agencies with
Market Anticipation: Evidence that Reputation Incentives Dominate’’, working paper, Federal Reserve Board, Washington, DC.
Department of Justice, 1998, Comments of the United States Department of Justice in the Matter of: File No. S7-33-97 Proposed Amendments to Rule 15c3-1 under the Securities Exchange Act of 1934, (March 6).

33
Diamond, Douglas W, 1989, “Reputation Acquisition in Debt Markets“, The Journal of Political Economy, Vol. 97, No. 4 (Aug), pp. 828-862
Doherty, Neil A., Anastasia Kartasheva, and Richard D. Phillips, 2008, “Does Competition Improve Ratings?”, working paper.
Fitch Ratings, 2002, “Fitch Ratings”, letter to the SEC. Fons, Jerome, 1994, “Using default rates to model the term structure of credit risk”, Financial Analyst’s
Journal, September–October, pp. 25-32. Goel, Anand M., and Anjan V. Thakor, 2010, “Credit Ratings and Litigation Risk”, unpublished working
paper. Graham, John and C Harvey, 2001, “The theory and practice of corporate finance: evidence from the field”,
Journal of Financial Economics, 60(2-3), 187-243. Hand, John R. M., Robert W. Holthausen and Richard W. Leftwich, 1992, “The Effect of Bond Rating
Agency Announcements on Bond and Stock Prices”, The Journal of Finance, Vol. 47, No. 2 (June), pp. 733-752.
Holthausen, Robert W. and Richard W. Leftwich, 1986, “The Effect of Bond Rating Changes on Common Stock Prices”, The Journal of Financial Economics, Vol. 17 (September), pp. 57-89.
Hong, H. and J. D. Kubik, 2003, ‘Analyzing the analysts: Career concerns and biased earnings forecasts’. Journal of Finance 58, 313–351.
Hong, Harrison and Marcin Kacperczyk, 2008, “Competition and bias”, working paper. Hubbard, T. N., 2002, “How do buyers motivate experts? Reputational incentives in an auto repair market”,
Journal of Law and Economics, 45, 437–468. Jewell, Jeff and Miles Livingston, 1999, “A Comparison of Bond Ratings from Moody's S&P and Fitch
IBCA”, Financial Markets, Institutions & Instrument, Volume 8 Issue 4, Pages 1 – 45. Jin, G. Z. and P. Leslie, 2003, “The effect of information on product quality: Evidence from restaurants
hygiene grade cards”, Quarterly Journal of Economics 118, 409–451. Jin, G. Z. and P. Leslie, 2008, “Reputational incentives for restaurant hygiene”, American Economic Journal
(Microeconomics), forthcoming. Jorion, Phillippe, Zhu Liu and Charles Shi, 2005, “Informational effects of regulation FD: evidence from
rating agencies”, Journal of Financial Economics, Volume 76, Issue 2, May 2005, Pages 309-330. Kisgen, Darren J., 2006, “Credit Ratings and Capital Structure”, The Journal of Finance, Vol. 61, No. 3,
(May), pp. 1035-1072. Klein, Benjamin and Keith B. Leffler, 1981, “The Role of Market Forces in Assuring Contractual
Performance”, The Journal of Political Economy, Vol. 89, No. 4. (August), pp. 615-641. Mathis, Jerome, James McAndrews, and Jean-Charles Rochet, 2009, “Rating the Raters: Are Reputation
Concerns Powerful Enough to Discipline Rating Agencies?”, Journal of Monetary Economics 56, 657-674.
Mailath, George J., and Larry Samuelson, 2001, “Who Wants a Good Reputation?“, The Review of Economic Studies, Vol. 68, No. 2, April, pp. 415-441
Securities and Exchange Commission, 2003, Report on the Role and Function of Credit Rating Agencies in the Operation of the Securities Markets As Required by Section 702(b) of the Sarbanes-Oxley Act of 2002.

34
Skreta, Vasiliki, and Laura Veldkamp, 2009, “Ratings Shopping and Asset Complexity: A Theory of Ratings Inflation”, Journal of Monetary Economics 56, 678-695.
Smith, Roy C., and Ingo Walter, 2002, “Rating agencies: Is There an Agency Issue”, in Levich, Richard M., Giovanni Majnoni and Carmen Reinhart, eds. Ratings, Rating Agencies and the Global Financial System, Kluwer Academic Publishers, Boston.
Spatt, Chester, 2009, “Discussion of ‘Ratings Shopping and Asset Complexity: A Theory of Ratings Inflation’”, Journal of Monetary Economics 56, 696-699.
Staiger, Douglas and James Stock, 1997, “Instrumental variables regression with weak instruments”, Econometrica, 65(3), 557-586, May.
Standard and Poor’s, 2008, Standard & Poor’s Rating Services U.S. Rating Fees Disclosure, press release (http://www2.standardandpoors.com/spf/pdf/fixedincome/RatingsFees2008.pdf).
Standard and Poor’s, 2009, Understanding Standard & Poor’s Rating Definitions, (http://www2.standardandpoors.com/spf/pdf/fixedincome/Understanding_Rating_Definitions.pdf).
Sylla, Richard, 2002, “An historical primer on the business of credit rating”, in Levich, Richard M., Giovanni Majnoni and Carmen Reinhart, eds. Ratings, Rating Agencies and the Global Financial System, Kluwer Academic Publishers, Boston.
Strausz, Roland, 2005, “Honest certification and the threat of capture”, International Journal of Industrial Organization, 23, 45-62.
Tang, Tony, 2006, “Information Asymmetry and Firms' Credit Market Access: Evidence from Moody's Credit Rating Format Refinement”, University of Chicago working paper.
White, Lawrence, 2002, “The Credit Rating Industry: An Industrial Organization Analysis”, in Levich, Richard M., Giovanni Majnoni and Carmen Reinhart, eds. Ratings, Rating Agencies and the Global Financial System, Kluwer Academic Publishers, Boston.

Figure 1: The Evolution of Fitch Ratings43
43 This figure is based on a figure found at http://www.fitchratings.com/creditdesk/public/group_timeline.cfm
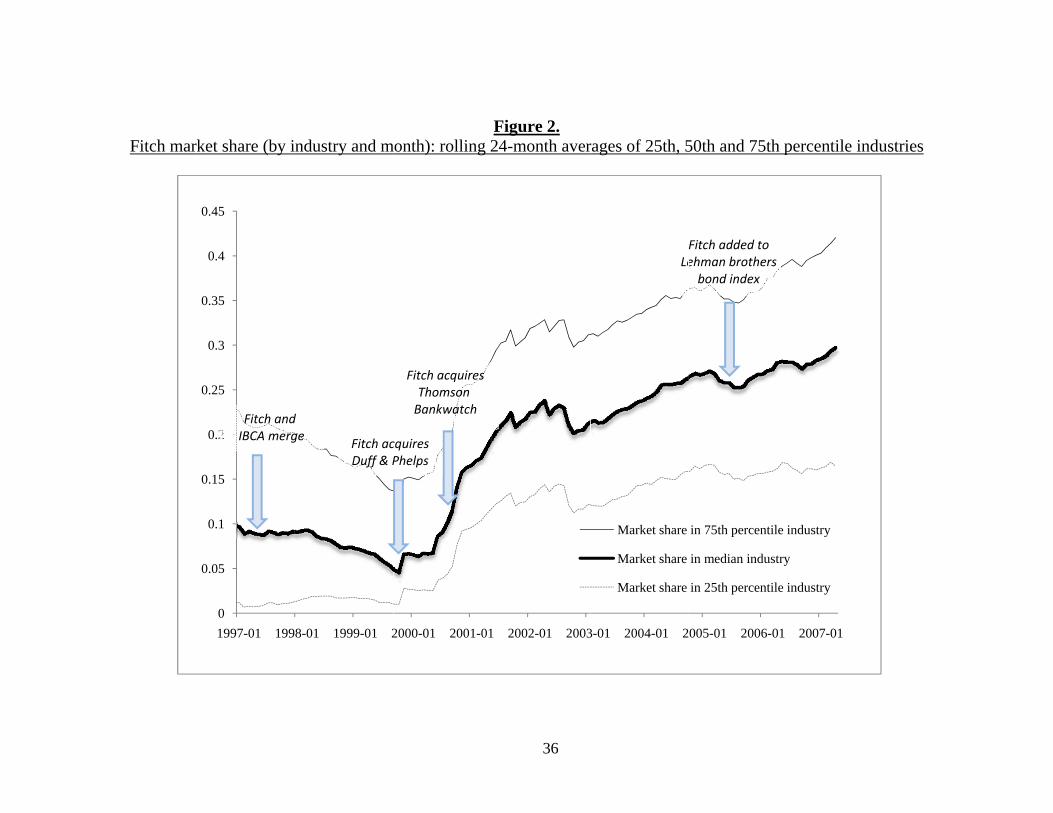
Fitch mark
ket share (by in
0
0.05
0.1
0.15
0.2
0.25
0.3
0.35
0.4
0.45
1997-01 199
Fitch andIBCA merg
ndustry and m
8-01 1999-01 2
d ge Fitch ac
Duff & P
month): rolling 2
2000-01 2001-01
cquiresPhelps
Fitch acquiresThomson Bankwatch
36
Figure 2. 24-month aver
1 2002-01 2003
rages of 25th, 5
3-01 2004-01 2
Market share
Market share
Market share
Le
50th and 75th p
005-01 2006-01
in 75th percentile
in median industry
in 25th percentile
Fitch added toehman brothersbond index
percentile indu
2007-01
industry
y
industry
ustries

37
Figure 3. Firm credit ratings distribution: high and low competition (Fitch market share above and below median)
0%
2%
4%
6%
8%
10%
12%
D C
CC
CC
C-
CC
C
CC
C+ B- B B+ BB-
BB BB+
BBB-
BBB
BBB+ A
- A A+
AA
-
AA
AA
+
AA
A
Low competition
High competition

38
Table 1A: Summary statistics
Firm credit rating
Bond credit rating
Fitch market share
Yield spread
Yield spread –
Investment grade
Yield spread – non-
investment grade
Yield spread
at issue
Leverage Debt/ EBITDA
Default in t+3
Mean 18.092 23.080 0.212 194.6 129.4 530.1 164.9 0.368 3.798 0.010
Median 18 23 0.225 131.3 119.9 447.3 108.0 0.343 2.840 0.000
Standard Deviation 3.930 4.943 0.142 252.7 139.9 390.8 158.3 0.203 4.073 0.101
Observations 19,756 686,990 429 1110,955 92,949 18,006 7,520 19,756 19,300 18,651
Notes: Each column presents the coefficient estimates from an OLS or logistic specification. Intercepts not reported. The sample period is from 1995 until 2006. The left hand side variable is coded as follows: AAA = 28, AA+ = 26, AA = 25, AA- = 42, A+ = 23, A = 22, A- = 21, BBB+ = 20, BBB = 19, BBB- = 18, BB+ = 17, BB= 16, BB- = 15, B+ = 14, B = 13, B- = 12, CCC = 11, CC = 7, and C = 4. Firm characteristics are measured at the end of the previous fiscal year (using accounting data from Compustat). Leverage is debt over total assets. Yield spread is the yield to maturity minus the yield of the closest maturity treasury bond.

39
Table 1B: Ratings scales Rating agency
Rating group Moody's S&P, Fitch
Numerical value assigned* Category definition**
Investment Grade
AAA AAA 28 The obligor's capacity to meet its financial commitment on the obligation is extremely strong. Aa AA 24, 25, 26 The obligor's capacity to meet its financial commitment on the obligation is very strong.
A A 21, 22, 23 Somewhat more susceptible to the adverse effects of changes in circumstances and economic conditions than obligations in higher-rated categories. However, the obligor's capacity to meet its financial commitment on the obligation is still strong.
Baa BBB 18, 19, 20 Exhibits adequate protection parameters. However, adverse economic conditions or changing circumstances are more likely to lead to a weakened capacity of the obligor to meet its financial commitment on the obligation.
Ba BB 15, 16, 17 Obligations rated 'BB', 'B', 'CCC', 'CC', and 'C' are regarded as having significant speculative characteristics. 'BB' indicates the least degree of speculation and 'C' the highest. While such obligations will likely have some quality and protective characteristics, these may be outweighed by large uncertainties or major exposures to adverse conditions.
B B 12, 13, 14
Caa CCC 9, 10, 11
Ca CC 7
C C 4
Default D D -
An obligation in payment default. The 'D' rating category is used when payments on an obligation are not made on the date due even if the applicable grace period has not expired, unless Standard & Poor's believes that such payments will be made during such grace period. The 'D' rating also will be used upon the filing of a bankruptcy petition or the taking of a similar action if payments on an obligation are jeopardized.
* Multiple numerical values for a single rating level represent ratings with a + qualifier, no qualifier, and a - qualifier, respectively. ** Source for ratings definitions is Standard & Poor's Ratings Definitions from 17-Mar-2008.

40
Table 1C: Fitch market share by 2-digit NAICS industry early and late in sample Fitch market share
NAICS Industry name 1995-2000 2001-2006 11 Agriculture, Forestry, Fishing and Hunting 0.09 0.23 21 Mining, Quarrying, and Oil and Gas Extraction 0.22 0.26 22 Utilities 0.29 0.34 23 Construction 0.08 0.28 31 Manufacturing: Food, Textile, Apparel 0.17 0.30 32 Manufacturing: Wood, Paper, Printing, Petroleum, Chemicals, plastics 0.16 0.26 33 Manufacturing: Metals, Machinery, Computers, Electrical, Furniture 0.18 0.28 42 Wholesale Trade 0.15 0.24 44 Retail Trade: Motor Vehicles, Furniture, Electronics, Food, Gas 0.09 0.28 45 Retail Trade: Sporting goods, Books, Florists, Office Supplies, Mail-Order, Vending 0.20 0.40 48 Transportation and Warehousing: Air Transport, Water Transport, Trucks, Pipelines 0.12 0.15 49 Transportation and Warehousing: Messengers, Storage 0.06 0.20 51 Information 0.18 0.28 52 Finance and Insurance 0.30 0.36 53 Real Estate and Rental and Leasing 0.17 0.42 54 Professional, Scientific, and Technical Services 0.18 0.27 55 Management of Companies and Enterprises 0.17 0.34 56 Administrative and Support and Waste Management and Remediation Services 0.12 0.29 61 Educational Services 0.11 0.28 62 Health Care and Social Assistance 0.16 0.27 71 Arts, Entertainment, and Recreation 0.16 0.21 72 Accommodation and Food Services 0.13 0.30 81 Other Services (except Public Administration) 0.12 0.22 92 Public Administration 0.28 0.36
Notes: Row presents the straight average of annual market shares (the main measure of competition), for the earlier and later halves of the sample period. Market share is the fraction of instrument ratings for corporate bonds issued by firms in a 2-digit NAICS industry which have been issued by Fitch, as oppose to Moody’s and S&P.

41
Table 2. Predicting firm credit ratings with Fitch market share
Dependent Variable: firm credit rating
Regression model OLS OLS OLS Ordered Probit OLS - Average by cell
OLS - Median by cell
(1) (2) (3) (4) (5) (6)
Fitch market share 2.395 ** 1.325 ** 0.784 * 0.3615 ** 1.533 *** 1.754 ** (1.123) (0.566) (0.432) (0.156) (0.570) (0.846)
Year Fixed Effects X X X X X Industry Fixed Effects X X X X Firm Fixed Effects X
Firm controls X X X
R2 0.004 0.141 0.900 n/a 0.961 0.914
N N = 19,630 N = 19,630 N = 19,630 N = 19,630 N = 160 N = 160
Notes: Each column presents the coefficient estimates from an OLS or ordered probit specification. Intercepts not reported. The sample period is from 1995 until 2006. The left hand side variable refers to credit opinion ratings by Standard and Poor's and is coded from 28 (AAA) to 1 (D). See Table 1 for details. Fitch market share is the fraction of bond ratings in an industry-year cell performed by Fitch Ratings. Firm characteristics are the log of sales, log of book value of assets, cash divided by total assets (and it's square), EBITDA divided by total assets (and it's square), cash flow over total assets (and it's square), EBITDA over sales (and it's square), cash flow over sales (and it's square), PPE over total assets (and it's square), interest expense over EBITDA (and it's square), debt over total assets (and it's square), all measured at the end of the previous fiscal year (using accounting data from Compustat). Industries are 2-digit level North American Industry Classifications System (NAICS) industries. In columns (5) and (6), data are collapsed by industry-year cell (averages and medians, respectively). Heteroskedasticity-robust standard errors for the coefficient estimates are in parentheses. Errors are clustered by industry*year cell in column (1) to (4).
* significant at 10%; ** significant at 5%; *** significant at 1%

42
Table 3. Predicting bond ratings with Fitch market share
Dependent Variable: bond issue credit rating
Regression model OLS OLS OLS OLS OLS - average OLS - medians
Sample All ratings All ratings All ratings Excludes NAICS52
Collapsed by cell; excludes NAICS 52
Collapsed by cell; excludes NAICS 52
(1) (2) (3) (4) (5) (6)
Fitch market share 0.4187 ** 0.5024 ** 0.5941 *** 0.6793 ** 2.061 * 5.201 *** (0.187) (0.220) (0.198) (0.336) (1.214) (1.782)
Fitch presence (dummy) -0.0938 ** (0.045)
Maturity 0.0312 -0.205 * (0.088) (0.118)
Lagged rating (collapsed) 0.332 *** 0.242 ** (0.095) (0.095)
Year Fixed Effects X X X X X X Industry Fixed Effects X - X - X X Time to maturity Fixed Effects X X X X - - Previous rating Fixed Effects X X X X - - Bond Issue Fixed Effects - X - X - -
R2 0.941 0.959 0.941 0.904 0.908 0.842 N N = 368,811 N = 368,811 N = 368,811 N = 146,366 N = 176 N = 176
Notes: Each column presents the coefficient estimates from an OLS regression. Intercepts not reported. The sample period is from 1995 until 2006, except in columns (5) and (6) which refer to 1996-2006. The left hand side variable refers to credit opinion ratings by Standard and Poor's and is coded from 28 (AAA) to 1 (D). See Table 1 for details. For column (1) to (4), the unit of observation is an individual bond rating. For columns (5) and (6), the unit of observation is industry-year cell, and all variables are the averages (column 5) or medians (column 6) of all observations in that cell. Cells with less than ten bond ratings are excluded. Fitch market share is the fraction of bond ratings in an industry-year cell performed by Fitch Ratings. Fitch rating (dummy) is a dummy variable taking the value one if Fitch issued a rating for the bond issue in the same calendar year as the rating was made. Industries are 2-digit level North American Industry Classifications System (NAICS) industries. Previous rating refers to the same bond issue's preceding rating. Heteroskedasticity-robust standard errors for the coefficient estimates are in parentheses. Errors are clustered by industry*year cell in column (1) to (4).
* significant at 10%; ** significant at 5%; *** significant at 1%

43
Table 4. Predicting rating levels with Fitch market share - interactions with leverage Dependent Variable: firm credit rating Regression model OLS OLS OLS OLS (1) (2) (3) (4)
Fitch market share * leverage 6.010 ***
(1.645) Fitch market share * long term leverage 5.317 ***
(1.708) Fitch market share * high leverage dummyvariable
1.587 ** (0.682)
Fitch market share * Debt/EBITDA 0.3806 ***
(0.129) Debt/EBITDA 0.3221 ***
(0.0483) Firm controls X X X X
Industry * Year Fixed Effects X X X X
R2 0.589 0.599 0.588 0.629 N N = 19,630 N = 19,630 N = 19,630 N = 19,630 Notes: Each column presents the coefficient estimates from an OLS or logistic specification. Intercepts not reported. The sample period is from 1995 until 2006. The left hand side variable refers to firm credit opinion ratingsby Standard and Poor's and is coded from 28 (AAA) to 1 (D). See Table 1 for details. Fitch market share is the fraction of bond ratings in an industry-year cell performed by Fitch Ratings. Firm characteristics are the log of sales, log of book value of assets, cash divided by total assets (and it's square), EBITDA divided by total assets (and it's square), cash flow over total assets (and it's square), EBITDA over sales (and it's square), cash flow over sales (and it's square), PPE over total assets (and it's square), interest expense over EBITDA (and it's square), debt over total assets (and it's square), all measured at the end of the previous fiscal year (using accounting data from Compustat). Leverage is debt over total assets, long term leverage is long-term debt over assets, the high leverage dummy is equal to one if debt over assets is above 0.2324 (the sample median). Industries are 2-digit level North American Industry Classifications System (NAICS) industries. The standard errors for the coefficient estimates are in parentheses and are clustered by industry*year cell. * significant at 10%; ** significant at 5%; *** significant at 1%

44
Table 5. Fitch's market share and segment characteristics Independent Variable: Fitch's market share Dependent variable: # Ratings issued Industry debt ($) Change in ind. debt ($) Industry profitability Ind. profitability (median) Timing of Fitch's market share (1) (2) (3) (4) (5)
Lead (t+2) 0.1831 -0.1079 -0.0885 -0.0108 0.0085 (0.4055) (0.1937) (0.2039) (0.0272) (0.0156) Lead (t+1) 0.0194 0.0824 0.2870 -0.0167 0.0039 (0.4210) (0.1913) (0.1794) (0.0248) (0.0155) Simultaneous (t) 0.1474 -0.0617 -0.1813 -0.0086 0.0112 (0.4151) (0.1739) (0.1541) (0.0251) (0.0158) Lag (t+1) 0.2968 -0.2615 -0.1362 0.0151 -0.0008 (0.3367) (0.1673) (0.1584) (0.0245) (0.0149) Lag (t+2) 0.2015 -0.3075 * 0.1018 0.0213 0.0221 (0.3190) (0.1768) (0.1577) (0.0237) (0.0165) Industry Fixed Effects X X X X X Year Fixed Effects X X X X X N N ≤ 266 N ≤ 266 N ≤ 266 N ≤ 266 N ≤ 266 Notes: Each coefficient estimate refers to one OLS specification (different rows represent regressions which differ only in the timing of the independent variable). Each regression includes year and industry fixed effects. For each regression, the coefficient estimate for Fitch's market share is reported. The sample period is from 1995 until 2006. Number of ratingsissued is the log of the aggregate number of credit ratings issued for bonds in an industry. Industry debt is the log of the total amount of outstanding debt of Compustat firms in an industry. The change in industry debt is the log of industry debt minus it's previous value. Industry profitability is an asset-weighted average of the ratio of EBITDA to assets in Compustat firms in the industry and Industry profitability (median) is the median EBITDA-asset ratio across all Compustat firms in the industry. Fitch market share is the fraction ofbond ratings in an industry-year cell performed by Fitch Ratings. The number of observations is 266 or fewer (some observations are lost due to lags). The standard errors for the coefficient estimates are in parentheses and are heteroskedasticity-robust. * significant at 10%; ** significant at 5%; *** significant at 1%

45
Table 6. Bond yields and ratings - the effect of Fitch market share
Dependent Variable Yield spread Yield spread Yield spread Yield spread Yield spread
Regression model OLS OLS OLS OLS OLS
Sample All trades All trades Inv. Grade only Non-inv. Grade only Initial issue
(1) (2) (3) (4) (5) Credit rating * Fitch market share 0.766 *** 0.968 *** 0.430 *** 1.253 ** 0.430 *** (0.162) (0.214) (0.114) (0.523) (0.) Credit rating -0.569 *** -0.620 *** -0.272 *** -1.102 *** -0.287 ***
(0.162) (0.063) (0.003) (0.164) (0.034) Fitch market share -14.160 **
(3.544) Log of time to maturity -1.174 *** -1.203 *** -1.121 *** -3.414 *** 0.666 ***
(0.168) (0.165) (0.125) (0.493) (0.085) Log of time to maturity, squared 0.251 *** 0.268 *** 0.278 *** 0.495 *** -0.113 ***
(0.035) (0.035) (0.027) (0.115) (0.022) Log of offering amount -0.223 ** -0.302 *** 0.366 *** 0.665 -0.260
(0.101) (0.108) (0.071) (1.581) (0.352) Log of offering amount, squared 0.002 0.006 -0.019 *** -0.018 -0.007
(0.004) (0.004) (0.003) (0.063) (0.015) Date Fixed Effects (Month - Year) X X X X X Industry Fixed Effects X
Year - Industry Fixed Effects X X X X
R2 0.484 0.503 0.444 0.398 0.697 N N = 110,955 N = 110,955 N = 92,949 N = 18,006 N = 7,427
Notes: Each column presents the coefficient estimates from an OLS regression. Intercepts not reported. Each observation is the yield to maturity of a bond in one transaction. The sample period is from 1995 until 2006. The dependent variable is the yield to maturity minus the yield to maturity of the government bond with the closest maturity. Credit ratings are bond credit ratings issued by Standard and Poors and Moody's (reported by FISD), and represent the latest preceding the transaction (if several were issued simultaneously, we use the average), not older than three months. Fitch market share is the fraction of bond ratings in an industry-year cell issued by Fitch Ratings. Industries are 2-digit level North American Industry Classifications System (NAICS) industries. Bonds are excluded if they have non-standard features (see text for details), negative yields or yields above 20%. The standard errors for the coefficient estimates are in parentheses and are clustered by industry*year cell.
* significant at 10%; ** significant at 5%; *** significant at 1%
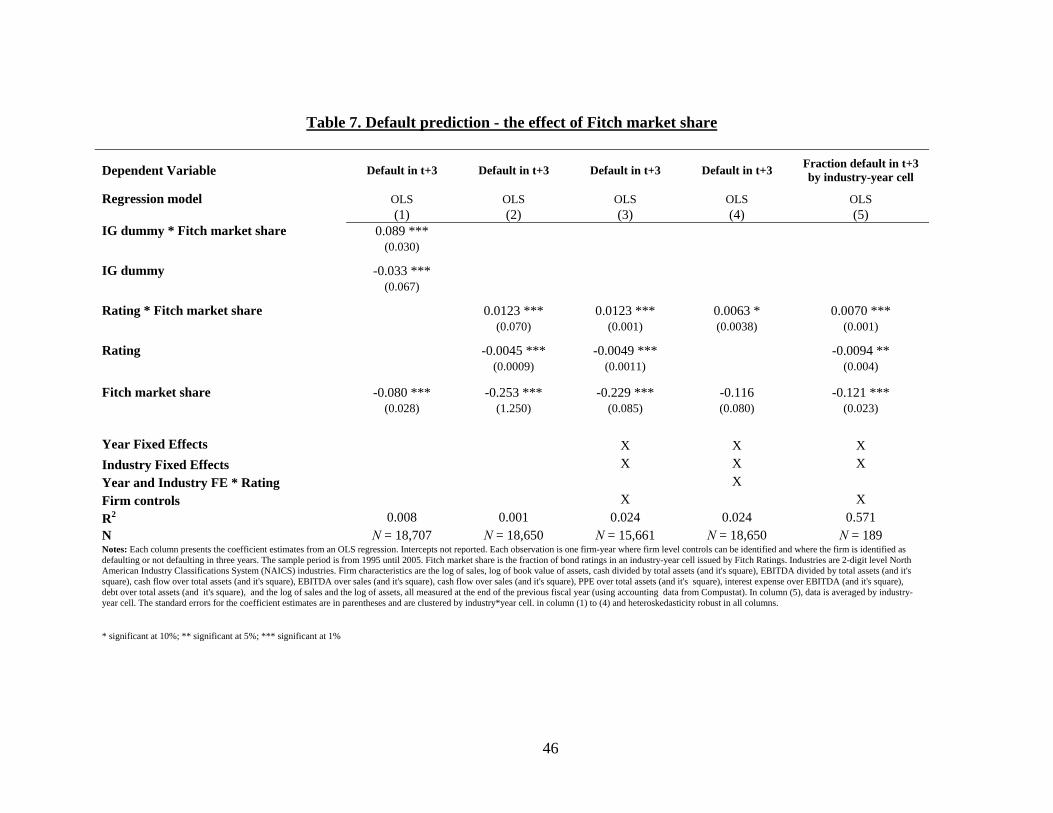
46
Table 7. Default prediction - the effect of Fitch market share
Dependent Variable Default in t+3 Default in t+3 Default in t+3 Default in t+3 Fraction default in t+3 by industry-year cell
Regression model OLS OLS OLS OLS OLS (1) (2) (3) (4) (5)
IG dummy * Fitch market share 0.089 *** (0.030)
IG dummy -0.033 *** (0.067)
Rating * Fitch market share 0.0123 *** 0.0123 *** 0.0063 * 0.0070 *** (0.070) (0.001) (0.0038) (0.001)
Rating -0.0045 *** -0.0049 *** -0.0094 ** (0.0009) (0.0011) (0.004)
Fitch market share -0.080 *** -0.253 *** -0.229 *** -0.116 -0.121 *** (0.028) (1.250) (0.085) (0.080) (0.023)
Year Fixed Effects X X X Industry Fixed Effects X X X Year and Industry FE * Rating X Firm controls X X R2 0.008 0.001 0.024 0.024 0.571 N N = 18,707 N = 18,650 N = 15,661 N = 18,650 N = 189 Notes: Each column presents the coefficient estimates from an OLS regression. Intercepts not reported. Each observation is one firm-year where firm level controls can be identified and where the firm is identified as defaulting or not defaulting in three years. The sample period is from 1995 until 2005. Fitch market share is the fraction of bond ratings in an industry-year cell issued by Fitch Ratings. Industries are 2-digit level North American Industry Classifications System (NAICS) industries. Firm characteristics are the log of sales, log of book value of assets, cash divided by total assets (and it's square), EBITDA divided by total assets (and it's square), cash flow over total assets (and it's square), EBITDA over sales (and it's square), cash flow over sales (and it's square), PPE over total assets (and it's square), interest expense over EBITDA (and it's square), debt over total assets (and it's square), and the log of sales and the log of assets, all measured at the end of the previous fiscal year (using accounting data from Compustat). In column (5), data is averaged by industry-year cell. The standard errors for the coefficient estimates are in parentheses and are clustered by industry*year cell. in column (1) to (4) and heteroskedasticity robust in all columns.
* significant at 10%; ** significant at 5%; *** significant at 1%

47
Table 8. Predicting bond and firm ratings with Fitch market share - Instrumental Variables Dependent Variable: firm credit rating Regression model 2SLS 2SLS 2SLS 2SLS All ratings All ratings All ratings All ratings Second stage (1) (2) (3) (4)
Fitch market share 5.7475 ** 14.290 6.074 *** 11.771 *** (instrumented) (1.941) (10.011) (2.254) (2.299) Year Fixed Effects - X X X Industry Fixed Effects - X X X Firm controls - - - X Firm fixed effects - - X X First stage Predicted market share 0.8815 *** 0.3419 *** 0.2965 *** 0.2910*** (0.0107) (0.0189) (0.0242) (0.0245) First stage R2 0.289 0.719 0.744 0.772 Second stage R2 0.003 0.108 0.882 0.900 N N = 16,810 N = 16,810 N = 16,810 N = 16,810 Notes: Each column presents the coefficient estimates from an OLS or ordered probit specification. Intercepts not reported. The sample period is from 1996 until 2006. The left hand side variable refers to credit opinion ratings by Standard and Poor's and is coded from 28 (AAA) to 1 (D). See Table 1 for details. Fitch market share is the fractionof bond ratings in an industry-year cell performed by Fitch Ratings. Fitch rating (dummy) is a dummy variable taking the value one if Fitch issued a rating for the bond issue in the same calendar year as the rating was made. Industries are 2-digit level North American Industry Classifications System (NAICS) industries. Previous rating refers tothe same bond issue's preceding rating. The standard errors for the coefficient estimates are in parentheses and are clustered by industry*year cell. * significant at 10%; ** significant at 5%; *** significant at 1%


![How did increased competition affect credit ratings? Files/09... · Director of Fitch Ratings), “[t]he merger of Fitch and IBCA represented the first step in our plan to respond](https://img.pdfslide.us/doc/110x75/5ebf5b1277290f735b253af3/how-did-increased-competition-affect-credit-ratings-files09-director-of-fitch.jpg)