Embed Size (px)
Citation preview

How data quality affects poverty and inequality
measurement
PovcalNet team
DECPI
The World Bank
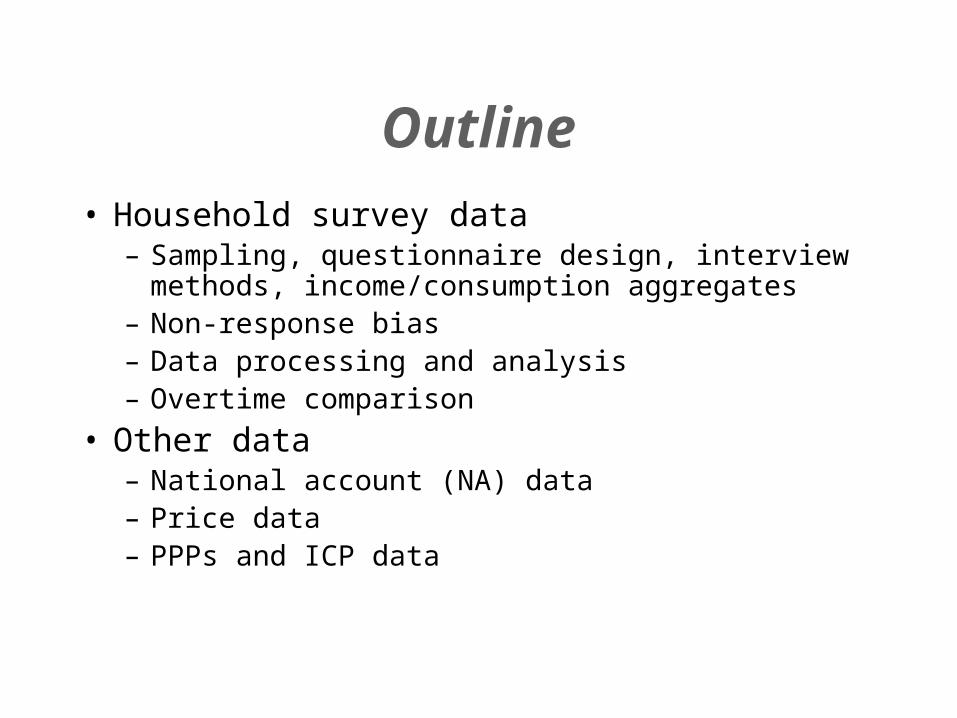
Outline• Household survey data
– Sampling, questionnaire design, interview methods, income/consumption aggregates
– Non-response bias– Data processing and analysis– Overtime comparison
• Other data– National account (NA) data– Price data– PPPs and ICP data

Household survey data
1. Household survey design– Sampling – daily dairy vs. recall – different recall periods– different income/consumption modules– Non-response bias
2. Common problems on data processing3. Common mistakes when calculating poverty
measures

Household survey data: sampling
Malawi 1997 and 2004 household survey
Survey Mean income Gini index Headcount year per person (%) (%)
1997/98 399.2 50.3 65.9
2004 483.3 39.0 42.7

Household survey data: sampling
Malawi 1997 and 2004 household survey
more than 4000 households drop from 1997 sample
Survey # of obs. Mean income Gini index Headcount year per person (%) (%)
1997/98 6586 399.2 50.3 65.9
2004 11280 483.3 39.0 42.7

Household survey data:
sampling • Different sample size/frame will cause comparison
problems.
• Vietnam 2010 survey vs. previous rounds
• India NSS: thick and thin rounds
• Indonesia and other countries
• China 2013 national household survey– census frame vs. legal resident registration
– how to compare with previous rural/urban surveys?

Household survey data: daily dairy vs. recall
Example of China SW poverty monitoring survey 1995-1996
1995 survey: one time recall method
1996 survey: daily dairy method
1995 mean income per capita: 854.56 Yuan
1996 mean income per capita: 992.74 Yuan
Is there 16% increase in per capita income in one year?
10-15% increase is due to the switch from recall to dairy.

Example of China SW poverty monitoring survey
1995-1996 0
.2.4
.6.8
1
0 1000 2000 3000 4000 5000pincome
cdf95inc cdf96inc
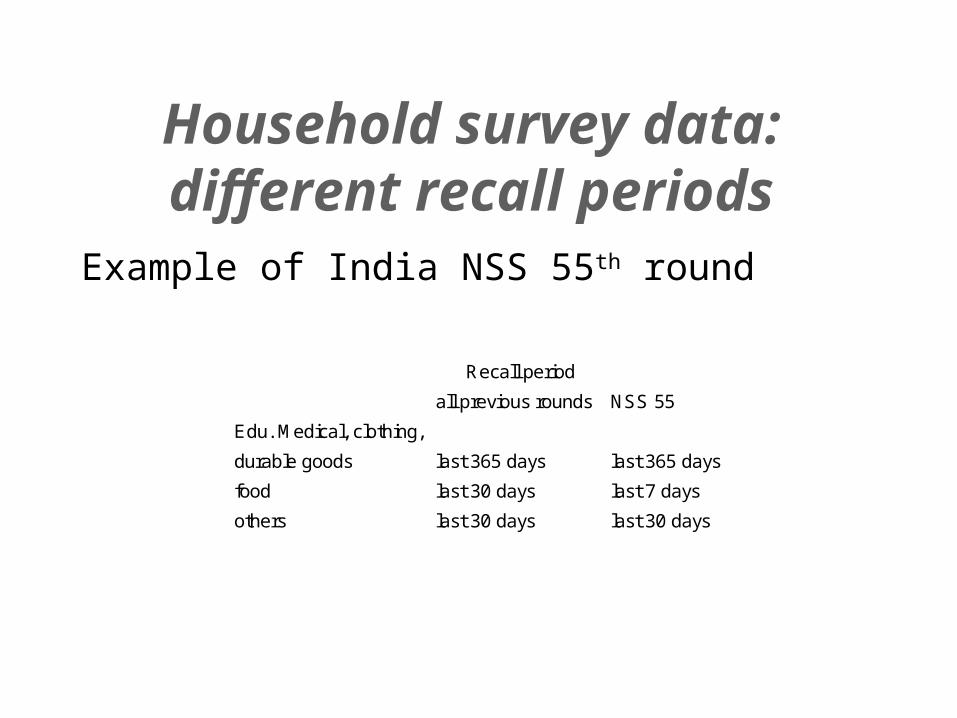
Household survey data: different recall periods
Example of India NSS 55th round
Recall period
all previous rounds NSS 55
Edu. Medical, clothing,
durable goods last 365 days last 365 days
food last 30 days last 7 days
others last 30 days last 30 days

Household survey data: different recall periods
Example of India NSS 55th round
Result: poverty estimates from NSS 55 are incomparable with previous years
Recall period
all previous rounds NSS 55
Edu. Medical, clothing,
durable goods last 365 days last 365 days
food last 30 days last 7 days
others last 30 days last 30 days

Household survey data: different
income/consumption modules
Example of Honduras 1997 and 1999 surveys
income module 1 income module 2Headcount(%) Headcount(%)
1997 24.1 12.0
1999 26.3 10.7

Household survey data: different
income/consumption modules
Example of Honduras:
income module 1 income module 2Headcount(%) Headcount(%)
1997 24.1 12.0
1999 26.3 10.7
2003 n.a 13.8

Different income modules?
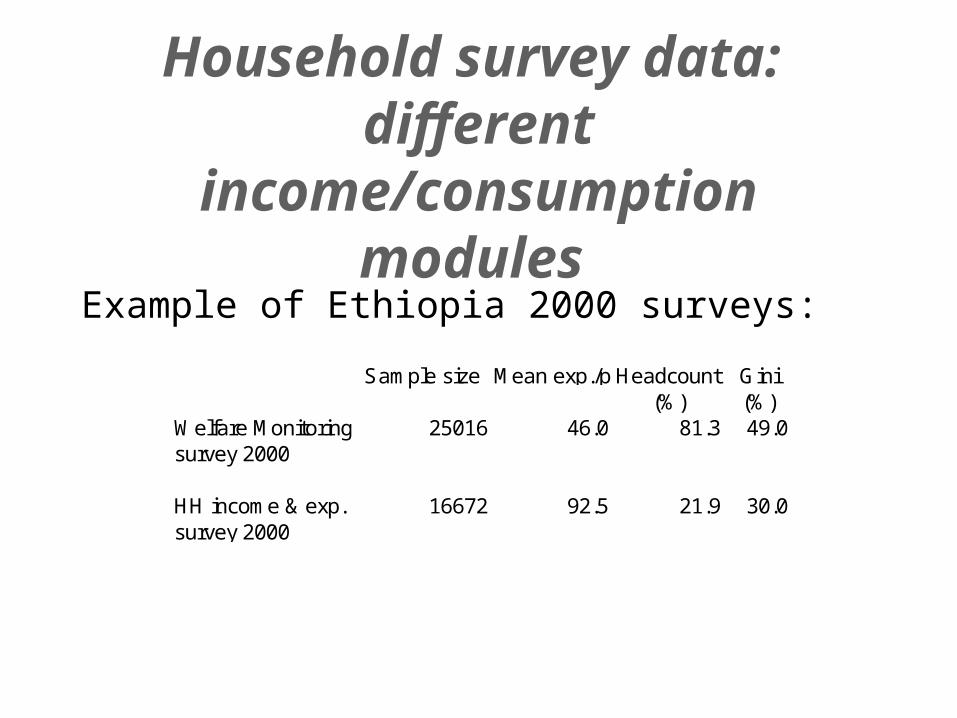
Household survey data: different
income/consumption modules
Example of Ethiopia 2000 surveys:
Sample size Mean exp./p Headcount Gini(%) (%)
Welfare Monitoring 25016 46.0 81.3 49.0survey 2000
HH income & exp. 16672 92.5 21.9 30.0survey 2000

Household survey data: different
income/consumption modules
Example of Ethiopia 2000 surveys:
Reason: different consumption modulesSample size Mean exp./p Headcount Gini
(%) (%)Welfare Monitoring 25016 46.0 81.3 49.0survey 2000
HH income & exp. 16672 92.5 21.9 30.0survey 2000

Nonresponse bias in measuring poverty and
inequality • High nonresponse rates of 10-30% are now
common• LSMS: 0-26% nonresponse (Scott and Steele,
2002)• UK surveys: 15-30%• US: 10-20%• Concerns that the problem might be increasing

Nonresponse bias in measuring poverty and
inequality Compliance is unlikely to be random:• Rich people have:
– higher opportunity cost of time– more to hide (tax reasons)– more likely to be away from home?– multiple earners
• Poorest might also not comply:– alienated from society?– homeless

Probability of being in UHS in 2004/05 plotted
against income (n=235,000)
19
0.2
.4.6
.81
diar
y2=1
if d
iary
1==1
oth
erw
ise
0
-5 0 5 10 15linc
bandwidth = .4
Lowess smoother

Common problems on data processing
1. Income/consumption aggregates
2. Valuing income in kind
3. Missing value
4. Outliers

Income/consumption aggregates
Share (%) of health, rent, durables out of total consumptionsvy year Health Rent Durables
Albania 2008 6.34 0.64 0.19Armenia 2010 4.42 0.00 1.55Azerbaijan 2008 11.99 0.74 2.48Belarus 2010 2.62 8.66 10.73Bulgaria 2007 5.11 1.16 2.04Georgia 2010 9.44 0.83 4.80Kyrgyz 2010 1.80 0.95 1.68Latvia 2009 5.32 6.29 0.00Poland 2010 5.03 0.90 5.88Russia 2009 0.0 0.0 0.0Turkey 2010 2.34 5.11 22.80Ukraine 2010 3.24 0.63 2.43

Income/consumption aggregates

Missing, zero and outliers
• Never mix missing value and zero;• Examples from LAC labor force surveys• Outliers: check carefully and always keep
original records– Income by sources– Sub components of consumptions

Argentina (urban) 2001-2010

Annual income growth of bottom 40% (circa 2005-10)Annual income growth of bottom 40% (circa 2005-10)

Annual per capita GDP growth is less than 1% during same period

Missing and outliers Examples from Colombia 2000 survey – 7% are zero income
0.2
.4.6
.81
0 100000 200000 300000 400000 500000(mean) ypc
cdf0 cdf_non0


Welfare indicator: income vs. consumption –LAC

More than 14% of people with zero income!

Welfare indicator: income vs. consumption –East Asia
$1.25/day $1.25/dayCountry year Income poverty Income Gini exp poverty exp Gini
Philippines 2006 23.0 54.02 22.62 44.04Philippines 2009 19.8 51.76 18.42 42.98
Thailand 2006 3.6 63.65 1.01 42.35Thailand 2009 1.2 60.06 0.38 39.37

Common mistakes on calculating poverty
measures1. Ranking variable
2. Weights• Household weight• Sampling weight
3. Outliers and missing
4. Adult equivalent

National Account data
• GDP
• Private consumption
• Population
• CPI – sample, weights change overtime
• Spatial price
• Currency change over time

PPPs and ICP data
• ICP rounds: 1985, 1993, 1996 and 2005 difference in coverage
• PPPs– PWT PPP and the World Bank’s PPP– GDP PPP and consumption PPP
• PPPP: PPP for the poor

Biases in 2005 ICP
• “Urban bias” in price surveys– China: 11 cities; reasonably representative of urban areas but not rural– Similar problems for Argentina, Brazil, Bolivia, Cambodia, Chile,
Colombia, Pakistan, Peru, Thailand and Uruguay.• Correction using urban/rural poverty line differentials.• India: ICP surveys under-represent rural areas (only 28%)
– Implicit PPPs for urban and rural India (Rs 17 and Rs 11)
• PPP’s for the poor: Deaton and Dupriez have re-weighted the PPPs for sub-sample of countries with the necessary data and find similar results

China
• First time China has participated in the ICP• Urban bias: prices collected from 11 cities• Correction using urban/rural poverty line differential
0
200
400
600
800
1000
1200
1400
1600
r r r r r r r r r r r r r r r r r r r r r r r r r r r r r r r u u u u u u u u u u u u

050
100
150
200
250
Nat
iona
l pov
erty
line
($/
mon
th a
t 200
5 fo
od P
PP)
3 4 5 6 7Log consumption per person at 2005 PPP
Note: See Figure 1
050
100
150
200
Nat
iona
l pov
erty
line
($/
mon
th a
t 200
5 P
PP
)
3 4 5 6 7
Log consumption per person at 2005 PPPNote: See Figure 1
Food PPP Fisher PPPP (Deaton-Dupriez)
Lower poverty line: $22.72 $1 a day line! $31.72