Embed Size (px)
Citation preview
6683 2017
September 2017
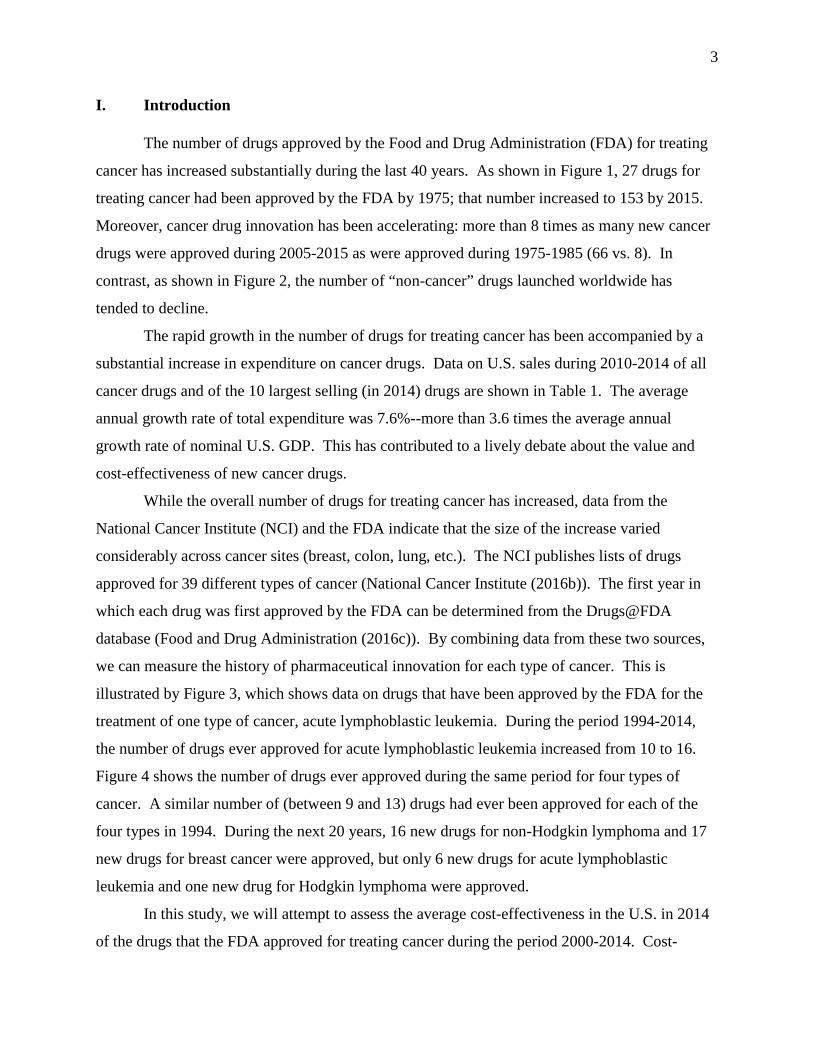
How Cost Effective Are New Cancer Drugs in the U.S.? Frank R. Lichtenberg

Impressum:
CESifo Working Papers ISSN 2364‐1428 (electronic version) Publisher and distributor: Munich Society for the Promotion of Economic Research ‐ CESifo GmbH The international platform of Ludwigs‐Maximilians University’s Center for Economic Studies and the ifo Institute Poschingerstr. 5, 81679 Munich, Germany Telephone +49 (0)89 2180‐2740, Telefax +49 (0)89 2180‐17845, email [email protected] Editors: Clemens Fuest, Oliver Falck, Jasmin Gröschl www.cesifo‐group.org/wp An electronic version of the paper may be downloaded ∙ from the SSRN website: www.SSRN.com ∙ from the RePEc website: www.RePEc.org ∙ from the CESifo website: www.CESifo‐group.org/wp

CESifo Working Paper No. 6683 Category 12: Empirical and Theoretical Methods
How Cost-Effective Are New Cancer Drugs in the U.S.?
Abstract The number of drugs approved by the FDA for treating cancer has increased substantially during the last 40 years. Moreover, cancer drug innovation has been accelerating: more than 8 times as many new cancer drugs were approved during 2005-2015 as were approved during 1975-1985 (66 vs. 8). During the period 2010-2014, the average annual growth rate of cancer drug expenditure was 7.6%--more than 3.6 times the average annual growth rate of nominal U.S. GDP. This has contributed to a lively debate about the value and cost-effectiveness of new cancer drugs. In this study, we attempt to assess the average cost-effectiveness in the U.S. in 2014 of new cancer drugs approved by the FDA during 2000-2014. Cost-effectiveness is measured as the ratio of the impact of new cancer drugs on medical expenditure to their impact on potential years of life lost due to cancer. We use a difference-in-difference research design: we investigate whether there were larger declines in premature mortality from the cancers that had larger increases in the number of drugs ever approved, controlling for the change in cancer incidence and mean age at time of diagnosis. The vast majority of the data we rely on are publicly available.
Frank R. Lichtenberg Columbia University
Graduate School of Business 3022 Broadway, 504 Uris Hall
USA - 10027 New York NY [email protected]

2
Our key findings can be summarized as follows:
• cancer sites with larger increases in the number of drugs ever approved tended to have larger declines in the number of potential years of life lost before ages 75 and 65.
• on average, one additional drug approved for a cancer site reduced the number of potential years of life lost before age 75 by 2.3%.
• new cancer drugs reduced the number of potential years of life lost before age 75 at an average annual rate of 0.93% during the period 1999-2014.
• cancer drugs approved during 2000-2014 are estimated to have reduced the number of potential years of life lost before age 75 in 2014 by 719,133.
• premature mortality in year t is strongly inversely related to the number of drugs approved in years t-3 to t (and earlier years), but unrelated to the number of drugs approved in years t+1 to t+4.
• one additional drug approval increases the odds of surviving at least 5 years after diagnosis by 2.4%.
• new cancer drugs reduced the number of cancer patient hospital days at an average annual rate of 0.83% during the period 1997-2013.
• cancer drugs approved between 1989 and 2005 are estimated to have reduced the number of hospital days in 2013 by 1.55 million, and hospital cost in 2013 by $4.8 billion.
• our baseline estimate of the cost per life-year gained in 2014 from cancer drugs approved during 2000-2014 is $7853. If we completely ignore the estimated reductions in old drug and hospital expenditure, the estimated cost per life-year gained is $17,104. Even the higher estimate would imply that, overall, cancer drug innovation has been highly cost-effective, by the standards of the World Health Organization and other authorities.
3
I. Introduction
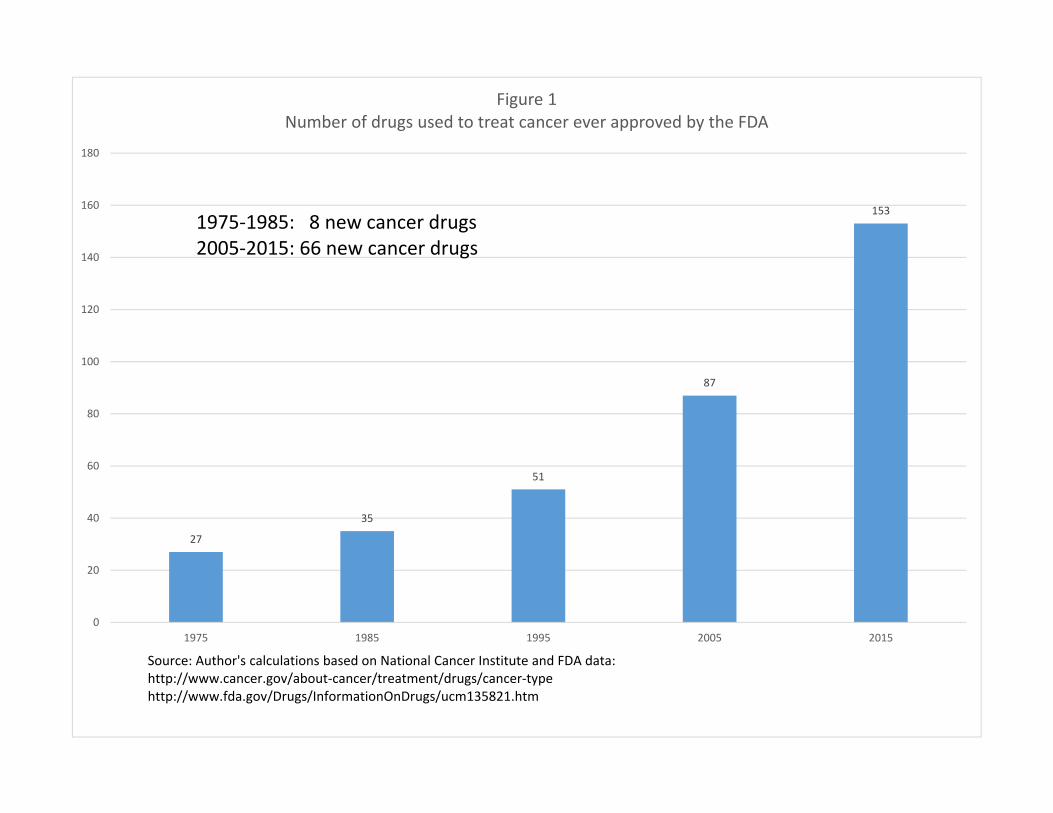
The number of drugs approved by the Food and Drug Administration (FDA) for treating
cancer has increased substantially during the last 40 years. As shown in Figure 1, 27 drugs for
treating cancer had been approved by the FDA by 1975; that number increased to 153 by 2015.
Moreover, cancer drug innovation has been accelerating: more than 8 times as many new cancer
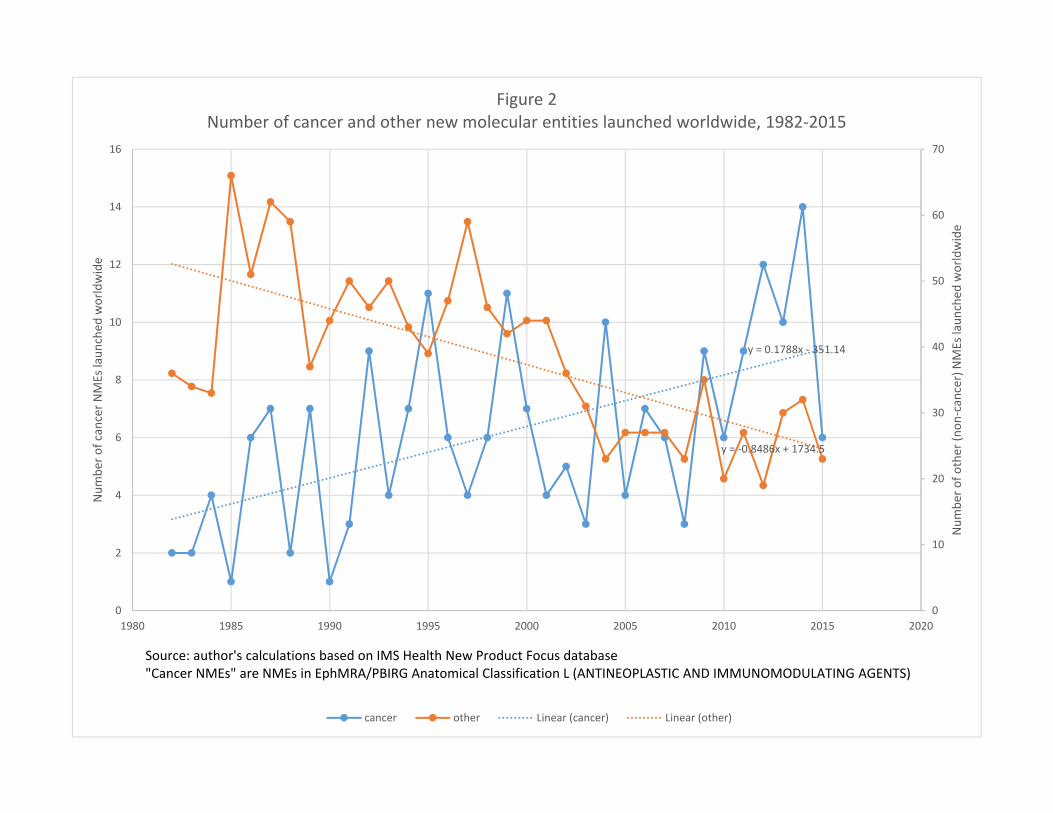
drugs were approved during 2005-2015 as were approved during 1975-1985 (66 vs. 8). In
contrast, as shown in Figure 2, the number of “non-cancer” drugs launched worldwide has
tended to decline.
The rapid growth in the number of drugs for treating cancer has been accompanied by a
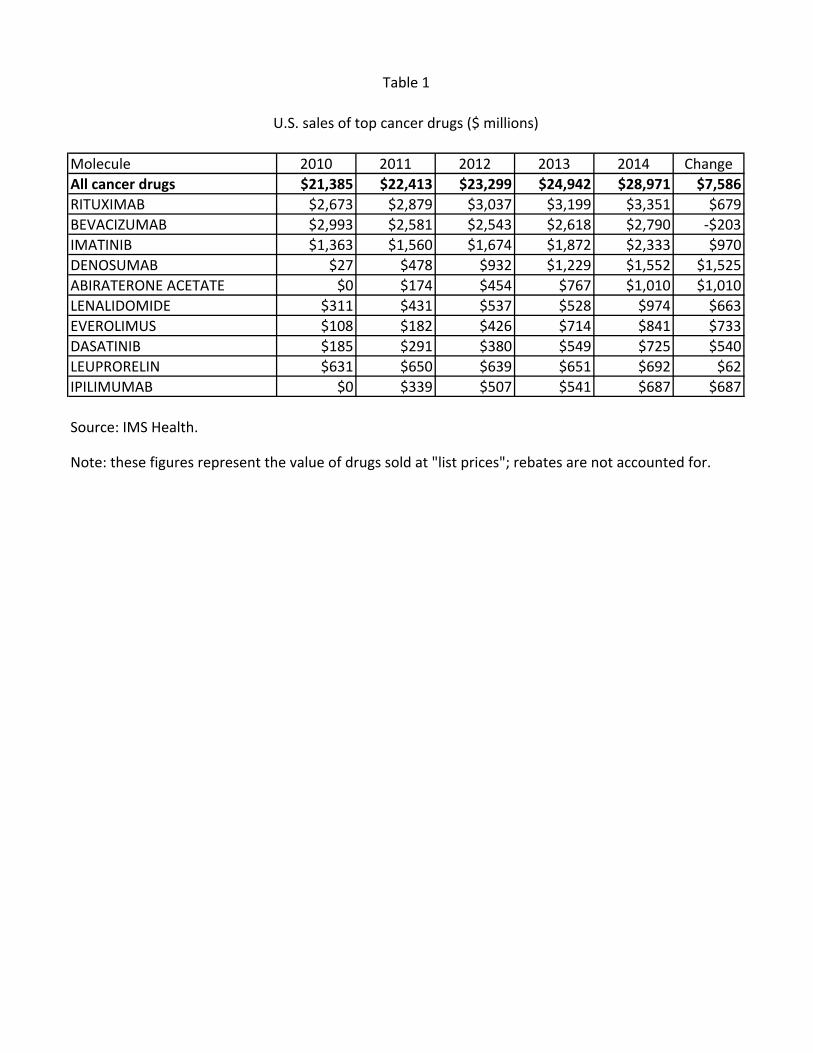
substantial increase in expenditure on cancer drugs. Data on U.S. sales during 2010-2014 of all
cancer drugs and of the 10 largest selling (in 2014) drugs are shown in Table 1. The average
annual growth rate of total expenditure was 7.6%--more than 3.6 times the average annual
growth rate of nominal U.S. GDP. This has contributed to a lively debate about the value and
cost-effectiveness of new cancer drugs.
While the overall number of drugs for treating cancer has increased, data from the
National Cancer Institute (NCI) and the FDA indicate that the size of the increase varied
considerably across cancer sites (breast, colon, lung, etc.). The NCI publishes lists of drugs
approved for 39 different types of cancer (National Cancer Institute (2016b)). The first year in
which each drug was first approved by the FDA can be determined from the Drugs@FDA
database (Food and Drug Administration (2016c)). By combining data from these two sources,
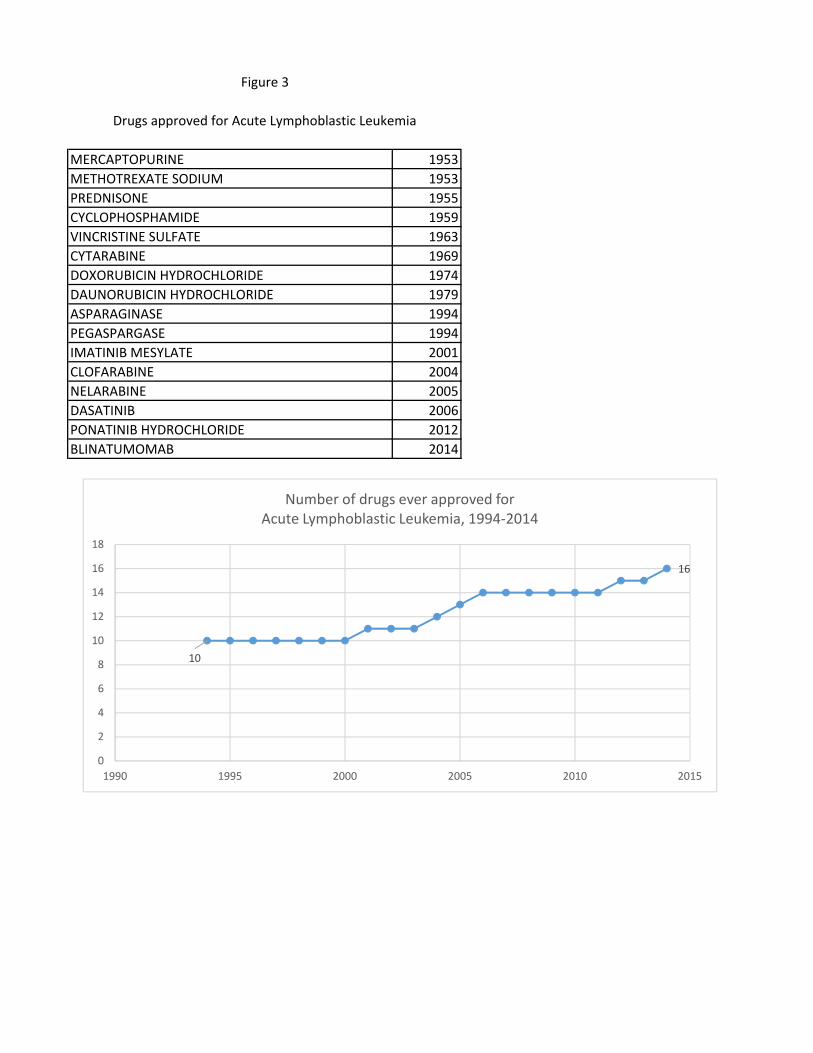
we can measure the history of pharmaceutical innovation for each type of cancer. This is
illustrated by Figure 3, which shows data on drugs that have been approved by the FDA for the
treatment of one type of cancer, acute lymphoblastic leukemia. During the period 1994-2014,
the number of drugs ever approved for acute lymphoblastic leukemia increased from 10 to 16.
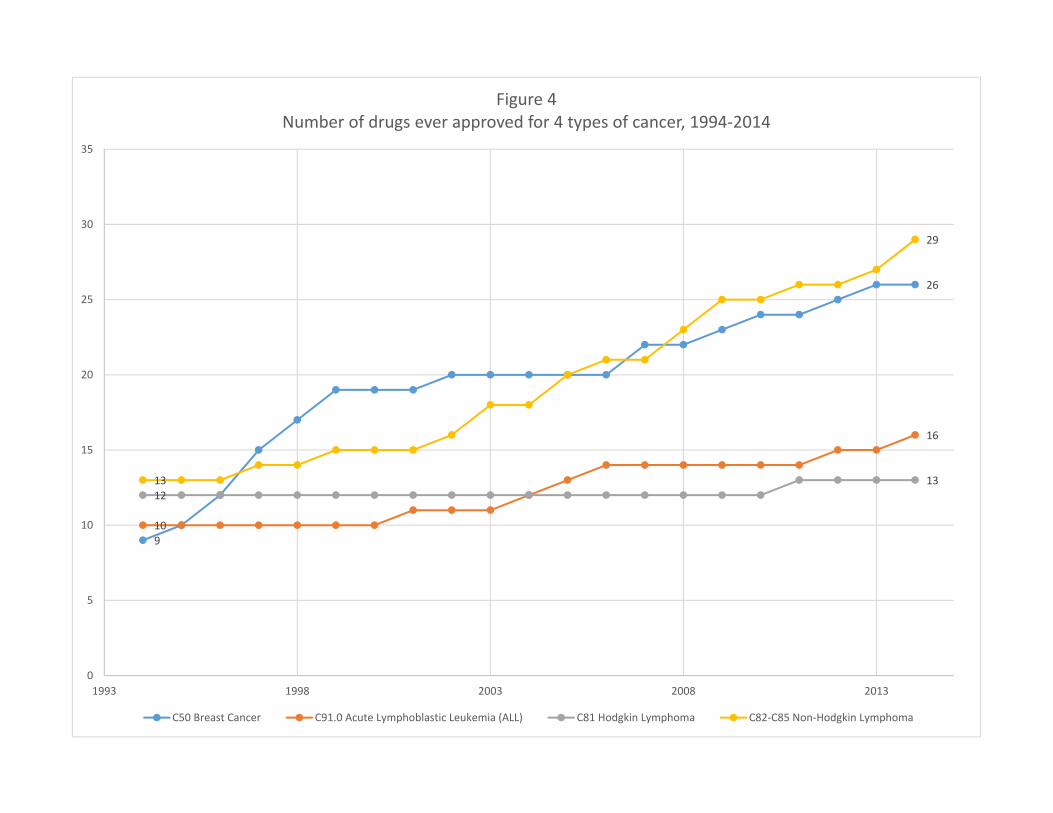
Figure 4 shows the number of drugs ever approved during the same period for four types of
cancer. A similar number of (between 9 and 13) drugs had ever been approved for each of the
four types in 1994. During the next 20 years, 16 new drugs for non-Hodgkin lymphoma and 17
new drugs for breast cancer were approved, but only 6 new drugs for acute lymphoblastic
leukemia and one new drug for Hodgkin lymphoma were approved.
In this study, we will attempt to assess the average cost-effectiveness in the U.S. in 2014
of the drugs that the FDA approved for treating cancer during the period 2000-2014. Cost-
4
effectiveness will be measured as the ratio of the impact of new cancer drugs on medical
expenditure to their impact on potential years of life lost (PYLL) due to cancer.1 To estimate the
impact of the drugs approved during the period 2000-2014 on PYLL (“premature mortality”) due
to cancer in 2014, we will estimate difference-in-differences models using longitudinal data on
the cancer sites defined by the National Cancer Institute (2016b). In essence, we will investigate
whether there were larger declines in mortality from the cancers that had larger increases in the
number of drugs ever approved, controlling for the change in cancer incidence and mean age at
time of diagnosis.2 We will analyze two alternative measures of premature mortality: potential
years of life lost before ages 75 and 65. In addition, we will analyze the impact of the number of
drugs approved on the 5-year observed survival rate, also controlling for the expected survival
rate of non-cancer patients. Some of the estimated models will distinguish between the effects of
“priority-review” drugs—drugs that the FDA believes demonstrate “the potential to provide a
significant improvement in the safety or effectiveness of the treatment, diagnosis, or prevention
of a serious or life-threatening condition” (FDA (2013))—and “standard-review” drugs—drugs
that the FDA believes do not demonstrate such potential.
The effect of drug approvals on cancer mortality may be subject to a lag, so the lag
structure of the relationship will be investigated. As a robustness check, we will also test
whether mortality depends on future drug approvals.
To determine the impact of new cancer drugs on medical expenditure, we will also
estimate difference-in-differences models of hospital utilization. All of the data used to estimate
the models of cancer mortality and hospitalization are produced by U.S. government agencies
and are publicly available.
In Section II, we describe econometric models of cancer patient outcomes. The data
sources used to construct the data to estimate these models are described in Section III.
Empirical results are presented in Section IV. In Section V, we use the estimates along with
other data to produce an estimate of the average cost-effectiveness of new cancer drugs. Section
VI provides a summary and conclusions.
1 Burnet et al (2005) argued that “years of life lost (YLL) from cancer is an important measure of population burden – and should be considered when allocating research funds.” 2 New drug approvals can improve outcomes for 2 reasons. First, the quality of newer products may be higher than the quality of older products, as in “quality ladder” models (see Grossman and Helpman (1991)). Second, “one of the principal means, if not the principal means, through which countries benefit from international trade is by the expansion of varieties” (Broda and Weinstein (2004)).
5
II. Models of premature cancer mortality, survival, and hospitalization
Longevity increase (or declining mortality rates) is a very important part of economic
growth, broadly defined. Nordhaus (2005) argued that “improvements in health status have been
a major contributor to economic welfare over the twentieth century. To a first approximation, the
economic value of increases in longevity in the last hundred years is about as large as the value
of measured growth in non-health goods and services.” The United Nations’ Human
Development Index (HDI) is a composite statistic of life expectancy, education, and income per
capita indicators, which are used to rank countries into four tiers of human development (United
Nations (2016)).
Building on a large collection of previous research by Romer (1990), Grossman and
Helpman (1991), Aghion and Howitt (1992), and others, Jones (2002, p. 221) presented a model
in which “long-run growth is driven by the discovery of new ideas throughout the world.” He
postulated an aggregate production function in which total output depends on the total stock of
ideas available to this economy as well as on physical and human capital.
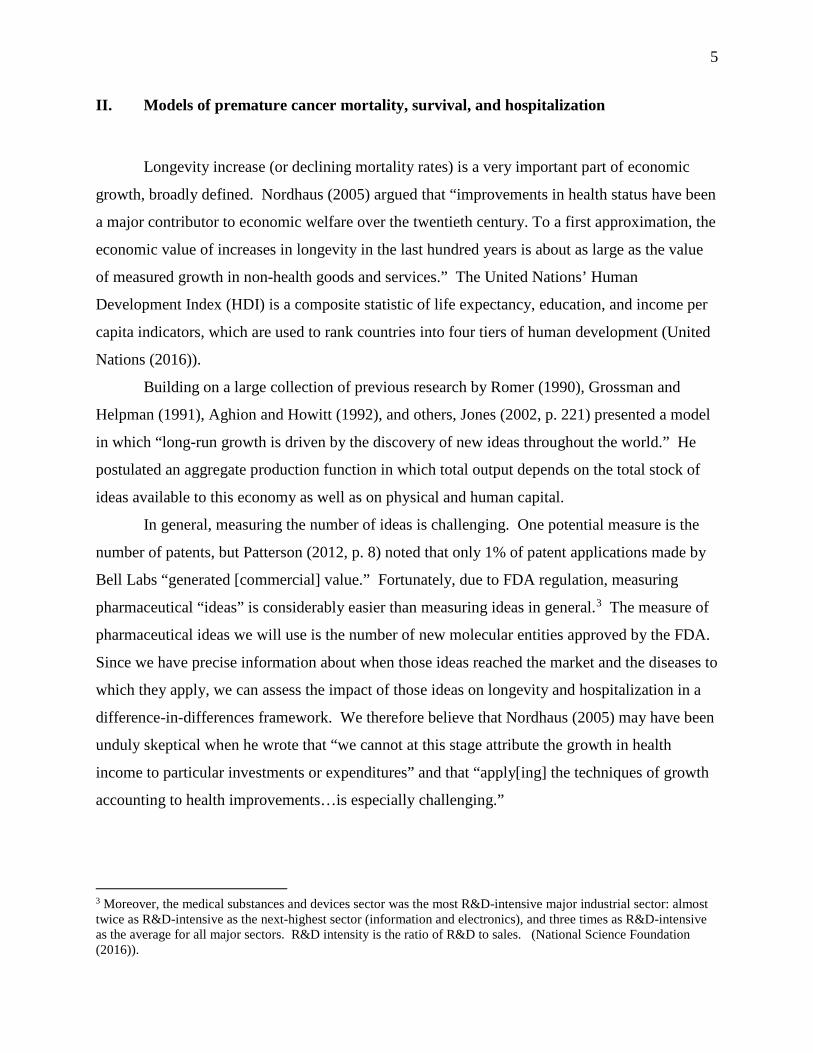
In general, measuring the number of ideas is challenging. One potential measure is the
number of patents, but Patterson (2012, p. 8) noted that only 1% of patent applications made by
Bell Labs “generated [commercial] value.” Fortunately, due to FDA regulation, measuring
pharmaceutical “ideas” is considerably easier than measuring ideas in general.3 The measure of
pharmaceutical ideas we will use is the number of new molecular entities approved by the FDA.
Since we have precise information about when those ideas reached the market and the diseases to
which they apply, we can assess the impact of those ideas on longevity and hospitalization in a
difference-in-differences framework. We therefore believe that Nordhaus (2005) may have been
unduly skeptical when he wrote that “we cannot at this stage attribute the growth in health
income to particular investments or expenditures” and that “apply[ing] the techniques of growth
accounting to health improvements…is especially challenging.”
3 Moreover, the medical substances and devices sector was the most R&D-intensive major industrial sector: almost twice as R&D-intensive as the next-highest sector (information and electronics), and three times as R&D-intensive as the average for all major sectors. R&D intensity is the ratio of R&D to sales. (National Science Foundation (2016)).
6
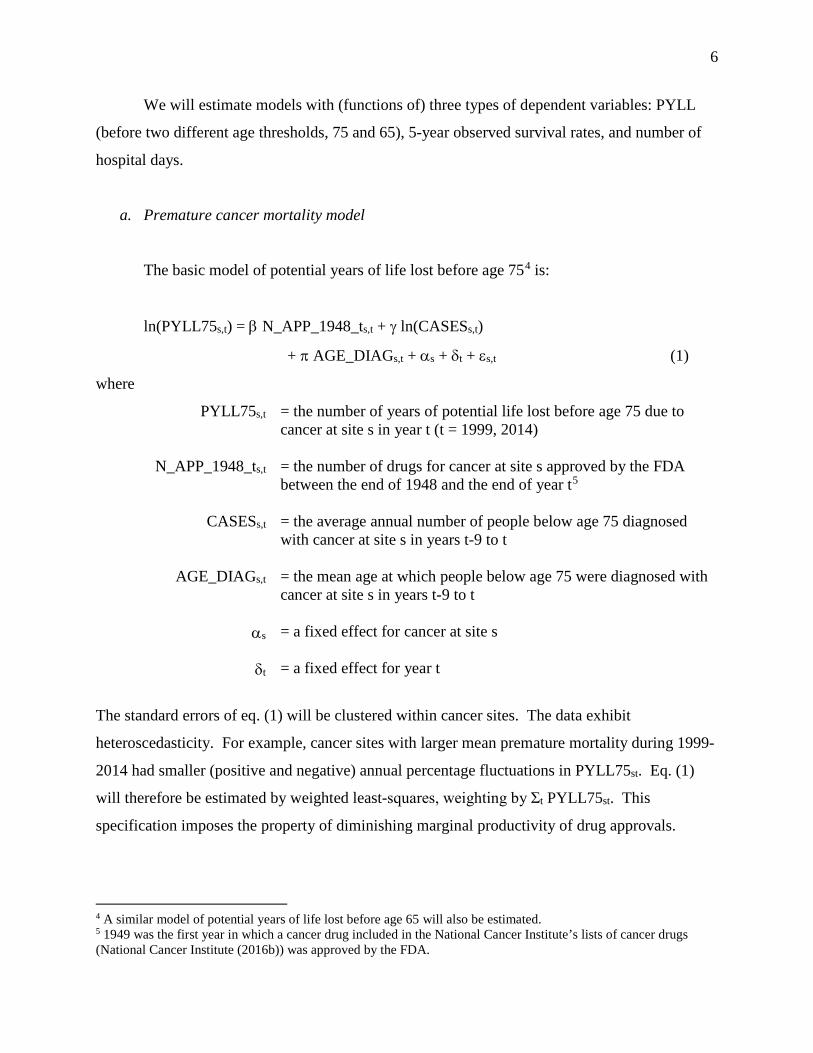
We will estimate models with (functions of) three types of dependent variables: PYLL
(before two different age thresholds, 75 and 65), 5-year observed survival rates, and number of
hospital days.
a. Premature cancer mortality model
The basic model of potential years of life lost before age 754 is:
ln(PYLL75s,t) = β N_APP_1948_ts,t + γ ln(CASESs,t)
+ π AGE_DIAGs,t + αs + δt + εs,t (1)
where
PYLL75s,t = the number of years of potential life lost before age 75 due to cancer at site s in year t (t = 1999, 2014)
N_APP_1948_ts,t = the number of drugs for cancer at site s approved by the FDA between the end of 1948 and the end of year t5
CASESs,t = the average annual number of people below age 75 diagnosed with cancer at site s in years t-9 to t
AGE_DIAGs,t = the mean age at which people below age 75 were diagnosed with cancer at site s in years t-9 to t
αs = a fixed effect for cancer at site s
δt = a fixed effect for year t
The standard errors of eq. (1) will be clustered within cancer sites. The data exhibit
heteroscedasticity. For example, cancer sites with larger mean premature mortality during 1999-
2014 had smaller (positive and negative) annual percentage fluctuations in PYLL75st. Eq. (1)
will therefore be estimated by weighted least-squares, weighting by Σt PYLL75st. This
specification imposes the property of diminishing marginal productivity of drug approvals.
4 A similar model of potential years of life lost before age 65 will also be estimated. 5 1949 was the first year in which a cancer drug included in the National Cancer Institute’s lists of cancer drugs (National Cancer Institute (2016b)) was approved by the FDA.
7
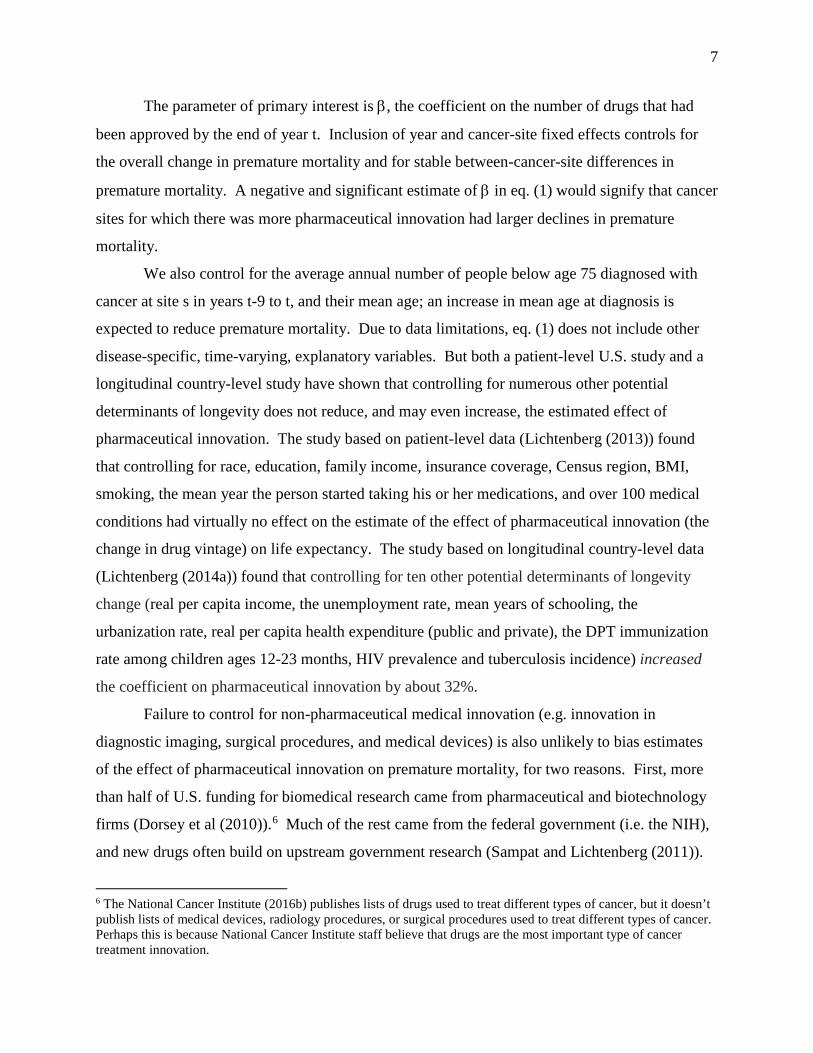
The parameter of primary interest is β, the coefficient on the number of drugs that had
been approved by the end of year t. Inclusion of year and cancer-site fixed effects controls for
the overall change in premature mortality and for stable between-cancer-site differences in
premature mortality. A negative and significant estimate of β in eq. (1) would signify that cancer
sites for which there was more pharmaceutical innovation had larger declines in premature
mortality.
We also control for the average annual number of people below age 75 diagnosed with
cancer at site s in years t-9 to t, and their mean age; an increase in mean age at diagnosis is
expected to reduce premature mortality. Due to data limitations, eq. (1) does not include other
disease-specific, time-varying, explanatory variables. But both a patient-level U.S. study and a
longitudinal country-level study have shown that controlling for numerous other potential
determinants of longevity does not reduce, and may even increase, the estimated effect of
pharmaceutical innovation. The study based on patient-level data (Lichtenberg (2013)) found
that controlling for race, education, family income, insurance coverage, Census region, BMI,
smoking, the mean year the person started taking his or her medications, and over 100 medical
conditions had virtually no effect on the estimate of the effect of pharmaceutical innovation (the
change in drug vintage) on life expectancy. The study based on longitudinal country-level data
(Lichtenberg (2014a)) found that controlling for ten other potential determinants of longevity
change (real per capita income, the unemployment rate, mean years of schooling, the
urbanization rate, real per capita health expenditure (public and private), the DPT immunization
rate among children ages 12-23 months, HIV prevalence and tuberculosis incidence) increased
the coefficient on pharmaceutical innovation by about 32%.
Failure to control for non-pharmaceutical medical innovation (e.g. innovation in
diagnostic imaging, surgical procedures, and medical devices) is also unlikely to bias estimates
of the effect of pharmaceutical innovation on premature mortality, for two reasons. First, more
than half of U.S. funding for biomedical research came from pharmaceutical and biotechnology
firms (Dorsey et al (2010)).6 Much of the rest came from the federal government (i.e. the NIH),
and new drugs often build on upstream government research (Sampat and Lichtenberg (2011)).
6 The National Cancer Institute (2016b) publishes lists of drugs used to treat different types of cancer, but it doesn’t publish lists of medical devices, radiology procedures, or surgical procedures used to treat different types of cancer. Perhaps this is because National Cancer Institute staff believe that drugs are the most important type of cancer treatment innovation.
8
The National Cancer Institute (2015b) says that it “has played an active role in the development
of drugs for cancer treatment for 50 years… [and] that approximately one half of the
chemotherapeutic drugs currently used by oncologists for cancer treatment were discovered
and/or developed” at the National Cancer Institute. Second, previous research based on U.S.
data (Lichtenberg (2014b)) indicates that non-pharmaceutical medical innovation is not
positively correlated across diseases with pharmaceutical innovation.
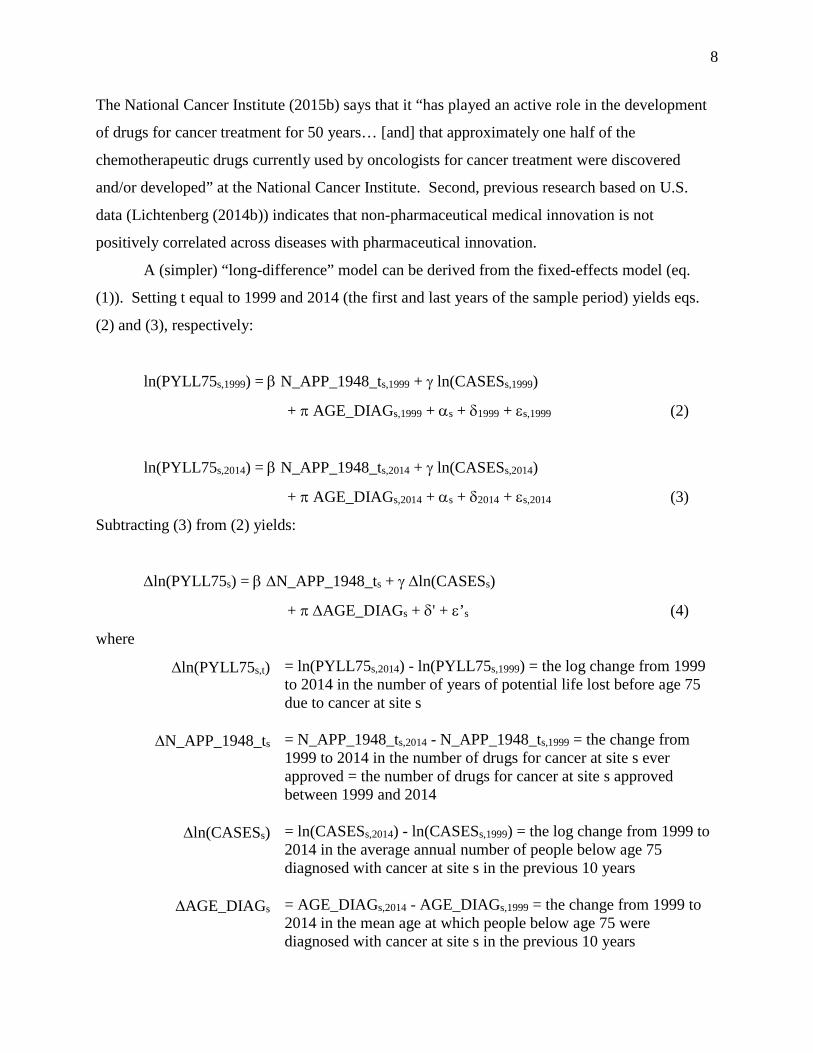
A (simpler) “long-difference” model can be derived from the fixed-effects model (eq.
(1)). Setting t equal to 1999 and 2014 (the first and last years of the sample period) yields eqs.
(2) and (3), respectively:
ln(PYLL75s,1999) = β N_APP_1948_ts,1999 + γ ln(CASESs,1999)
+ π AGE_DIAGs,1999 + αs + δ1999 + εs,1999 (2)
ln(PYLL75s,2014) = β N_APP_1948_ts,2014 + γ ln(CASESs,2014)
+ π AGE_DIAGs,2014 + αs + δ2014 + εs,2014 (3)
Subtracting (3) from (2) yields:
∆ln(PYLL75s) = β ∆N_APP_1948_ts + γ ∆ln(CASESs)
+ π ∆AGE_DIAGs + δ' + ε’s (4)
where
∆ln(PYLL75s,t) = ln(PYLL75s,2014) - ln(PYLL75s,1999) = the log change from 1999 to 2014 in the number of years of potential life lost before age 75 due to cancer at site s
∆N_APP_1948_ts = N_APP_1948_ts,2014 - N_APP_1948_ts,1999 = the change from 1999 to 2014 in the number of drugs for cancer at site s ever approved = the number of drugs for cancer at site s approved between 1999 and 2014
∆ln(CASESs) = ln(CASESs,2014) - ln(CASESs,1999) = the log change from 1999 to 2014 in the average annual number of people below age 75 diagnosed with cancer at site s in the previous 10 years
∆AGE_DIAGs = AGE_DIAGs,2014 - AGE_DIAGs,1999 = the change from 1999 to 2014 in the mean age at which people below age 75 were diagnosed with cancer at site s in the previous 10 years

9
δ' = δ2014 - δ1999 = the difference between the 2014 and 1999 year
fixed effects
In addition to estimating the basic model of years of potential life lost before age 75 (eq.
(1)), we will modify and generalize the model in several different ways. These modifications of
the model will allow us to (1) determine whether drugs approved at different times in the past
have different effects on mortality; (2) perform a falsification test of whether drug approvals
after year t affect mortality in year t; and (3) test whether the approval of priority-review and
standard-review drugs (defined below) have different effects on mortality. Now we will discuss
these modifications in turn.
Heterogeneous effects of drugs approved at different times in the past. The number of drugs
ever approved by the end of year t is the sum of the numbers of drugs approved during sub-
periods prior to year t. For example, N_APP_1948_ts,t is the sum of the number of drugs
approved more than 4 years before and 0-4 years before year t:
N_APP_1948_ts,t = N_APP_1948_t-4s,t + N_APP_t-4_ts,t (5)
where
N_APP_1948_t-4s,t = the number of drugs for cancer at site s approved by the FDA between the end of 1948 and the end of year t-4
N_APP_t-4_ts,t = the number of drugs for cancer at site s approved by the FDA between the end of year t-4 and the end of year t
Substituting (5) into (1) yields:
ln(PYLL75s,t) = β [N_APP_1948_t-4s,t + N_APP_t-4_ts,t]
+ γ ln(CASESs,t) + π AGE_DIAGs,t + αs + δt + εs,t (6)
In eq. (6), the marginal effects on mortality of approvals in both periods are constrained to be
identical. In the following more general model, the marginal effects on mortality of approvals in
the two periods are allowed to differ:
10
ln(PYLL75s,t) = β5+ N_APP_1948_t-4s,t + β0_4 N_APP_t-4_ts,t
+ γ ln(CASESs,t) + π AGE_DIAGs,t + αs + δt + εs,t (7)
The marginal effects of approvals in the two periods are likely to differ, for several reasons.
There are two reasons to expect the magnitude of β0_4 to be smaller than the magnitude of β5+.
First, as shown in Appendix 1, mean utilization of a drug is lower 0-4 years after approval than it
is more than 4 years after approval. Second, there is undoubtedly a lag between utilization of a
drug and its impact on mortality. But another factor would tend to make the magnitude of β0_4
larger than the magnitude of β5+: quality improvement. If newer drugs tend to be of higher
quality than older drugs, a drug approved 0-4 years ago would reduce mortality more than a drug
approved more than 4 years ago, if utilization of the two drugs were equal and if there were no
lag from utilization to mortality reduction.
Effect of future drug approvals. Approvals in different years prior to year t may have different
effects on mortality in year t. Approvals in years after year t should have no effect on mortality
in year t. We will test this by including one additional regressor (N_APP_t_t+4s,t) in the model:
ln(PYLL75s,t) = β5+ N_APP_1948_t-4s,t + β0_4 N_APP_t-4_ts,t
+ βPOST N_APP_t_t+4s,t + γ ln(CASESs,t) + π AGE_DIAGs,t + αs + δt + εs,t (8)
where
N_APP_t_t+4s,t = the number of drugs for cancer at site s approved by the FDA between the end of year t and the end of year t+4
Heterogeneous effects of priority-review and standard-review drugs. When the FDA begins its
review of a new drug application, it designates the drug as either a priority-review drug or a
standard-review drug.7 Priority review designation is assigned to applications for drugs that are
expected to provide significant improvements in the safety or effectiveness of the treatment,
diagnosis, or prevention of serious conditions compared to available therapies. Significant
improvement may be demonstrated by the following examples: (1) evidence of increased
7 63% of the cancer drugs approved during 1949-2015 were given priority review designation. Since the FDA’s classification of a drug (priority vs. standard review) occurs at the beginning of the review process, it may be subject to considerable uncertainty; the fact that some drugs are withdrawn after marketing indicates that even the safety of a drug may not be well understood at the time of approval.
11
effectiveness in treatment, prevention, or diagnosis of condition; (2) elimination or substantial
reduction of a treatment-limiting drug reaction; (3) documented enhancement of patient
compliance that is expected to lead to an improvement in serious outcomes; or (4) evidence of
safety and effectiveness in a new subpopulation. Standard review designation is assigned to
applications for drugs that do not meet the priority-review designation criteria.8
We will estimate the following version of eq. (1) that distinguishes between priority-
review and standard-review drugs:
ln(PYLL75s,t) = βPRI N_PRI_1948_ts,t + βSTD N_STD_1948_ts,t
+ γ ln(CASESs,t) + π AGE_DIAGs,t + αs + δt + εs,t (9)
where
N_PRI_1948_ts,t = the number of priority-review drugs for cancer at site s approved by the FDA between the end of 1948 and the end of year t
N_STD_1948_ts,t = the number of standard-review drugs for cancer at site s approved by the FDA between the end of 1948 and the end of year t
b. 5-year observed survival rate model
In addition to estimating the premature mortality models described above, we will
estimate models of the 5-year survival rate. The observed survival rate is the probability of
surviving from all causes of death for a group of cancer patients under study. For example, it is
the probability that a person diagnosed with cancer at the end of 2008 was still alive at the end of
2013.
Between 2000 and 2008, the 5-year observed survival rate for all cancer sites combined
increased from 55.1% to 59.0%. However, the National Cancer Institute (2015a) points out that
“certain factors may cause survival times to look like they are getting better when they are not.
These factors include lead-time bias and overdiagnosis.”
Lead-time bias. Survival time for cancer patients is usually measured from the day the cancer is diagnosed until the day they die. Patients are often diagnosed after they have signs and symptoms of cancer. If a screening test leads to a diagnosis before a patient has any symptoms, the patient’s survival time is increased because the date of diagnosis is
8 First-in-class drugs are much more likely to receive priority-review status than follow-on drugs, so distinguishing between priority-review and standard-review drugs is similar to distinguishing between first-in-class and follow-on drugs.
12
earlier. This increase in survival time makes it seem as though screened patients are living longer when that may not be happening.9 This is called lead-time bias. It could be that the only reason the survival time appears to be longer is that the date of diagnosis is earlier for the screened patients. But the screened patients may die at the same time they would have without the screening test. Over-diagnosis. Sometimes, screening tests find cancers that don't matter because they would have gone away on their own or never caused any symptoms. These cancers would never have been found if not for the screening test. Finding these cancers is called over-diagnosis. Over-diagnosis can make it seem like more people are surviving cancer longer, but in reality, these are people who would not have died from cancer anyway.
To guard against the risk that lead-time bias and over-diagnosis could bias our estimates of the
effect of pharmaceutical innovation on observed cancer survival, we will control for (changes in)
the number of people diagnosed (incidence) and for the expected survival rate—the survival
probability of a population similar to the patient group with respect to age, sex, race, and
calendar year but free of the specific disease under study (Ederer et al (1961)). We will estimate
the following model:
ln(SURV_OBSs,t/(1 – SURV_OBSs,t)) = β N_APP_1948_ts,t + γ ln(CASESs,t)
+ π ln(SURV_EXPs,t /(1 – SURV_EXPs,t)) + αs + δt + εs,t (10)
where
Eq. (10) will be estimated by weighted least-squares, weighting by CASESs,t. The standard
errors of eq. (10) will be clustered within cancer sites.
9 Some studies have found no mortality benefit from more intensive screening. For example, data from the Prostate, Lung, Colorectal and Ovarian randomized screening trial showed that, after 13 years of follow up, men who underwent annual prostate cancer screening with prostate-specific antigen testing and digital rectal examination had a 12 percent higher incidence of prostate cancer than men in the control group but the same rate of death from the disease. No evidence of a mortality benefit was seen in subgroups defined by age, the presence of other illnesses, or pre-trial PSA testing (National Cancer Institute (2012)).
SURV_OBSs,t = the observed 5-year survival rate of patients diagnosed with cancer at site s in year t (t = 2000, 2008)
SURV_EXPs,t = the expected 5-year survival rate of patients diagnosed with cancer at site s in year t
13
c. Hospital days model
To investigate the impact of cancer drug innovation on hospitalization, we will estimate the
following model:
ln(HOSP_DAYSs,t) = β N_APP_1948_ts,t + γ ln(CASESs,t)
+ π AGE_DIAGs,t + αs + δt + εs,t (11)
where
HOSP_DAYSs,t = the number of hospital days in year t (t = 1998, 2013) for patients whose principal diagnosis was cancer at site s
Eq. (11) will be estimated by weighted least-squares, weighting by Σt HOSP_DAYSs,t. The
standard errors of eq. (11) will be clustered within cancer sites.
III. Data sources
Premature mortality. Data on years of potential life lost before ages 75 and 65, by cancer site
and year (1999-2014), were constructed from data obtained from the Compressed Mortality
database (Centers for Disease Control and Prevention (2016a)). In that database, most deaths are
reported in 10-year age groups. We assumed that deaths in an age group occur at the midpoint of
the age group, e.g. deaths in age group 55-64 occur at age 60.
Drug approvals by cancer site. Lists of drugs approved by the FDA for each type of cancer were
obtained from the National Cancer Institute (2016b). The drugs@FDA database (Food and Drug
Administration (2016c)) was used to determine the year in which each of these drugs was first
approved by the FDA, and whether the drug was designated as priority-review or standard-
review.
Cancer incidence and mean age at diagnosis. Annual data on the number of people diagnosed in
SEER 9 registries with each type of cancer were obtained from SEER Research Data (National
Cancer Institute (2016c)).
14
Observed and expected survival rates. Data on observed and expected survival rates, by cancer
site and year, were obtained from SEER*Stat software Version 8.2.1 (National Cancer Institute
(2016d)).
Hospitalization. Annual data on the number of hospital days for patients with a principal
diagnosis of each type of cancer were obtained from HCUPnet, an on-line query system based on
data from the Healthcare Cost and Utilization Project (Agency for Healthcare Research and
Quality (2016)).
Drug utilization and expenditure. Unpublished data on the quantity (measured in “standard
units”) of and expenditure (before rebates) on cancer drugs, by molecule and year (2010-2014),
were obtained from IMS Health.
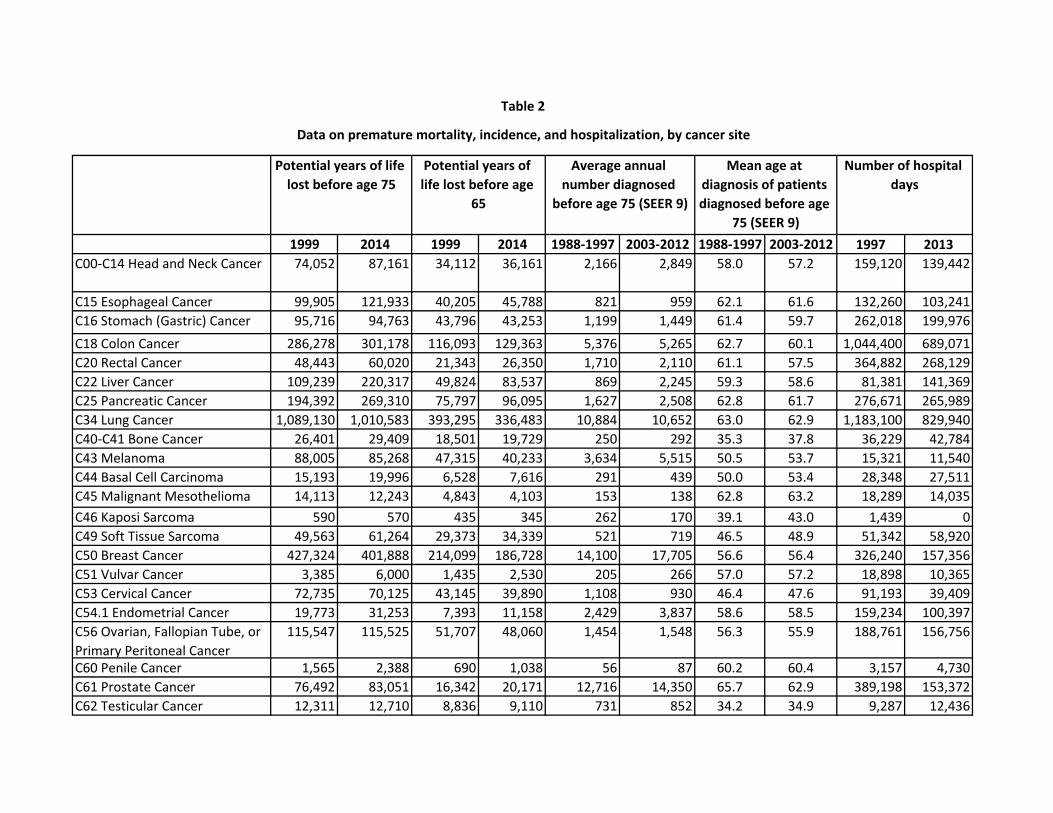
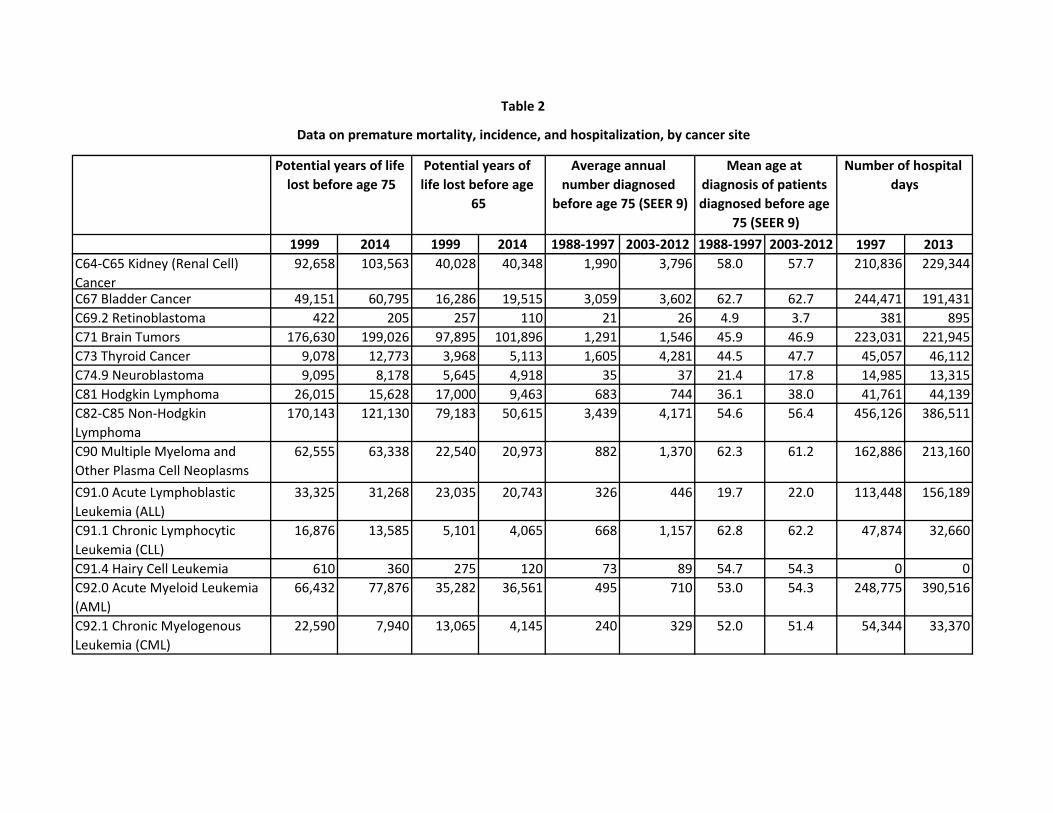
Data on premature mortality, incidence, and hospitalization, by cancer site, are shown in
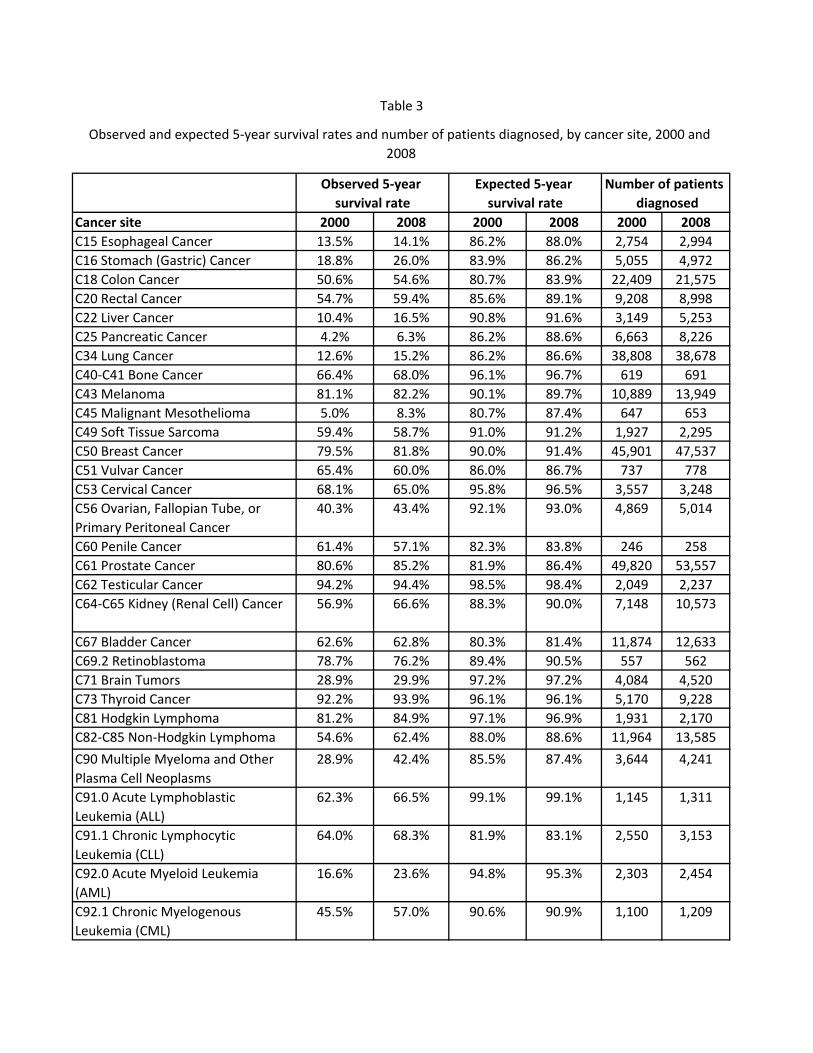
Table 2. Data on observed and expected 5-year survival rates and number of patients diagnosed,
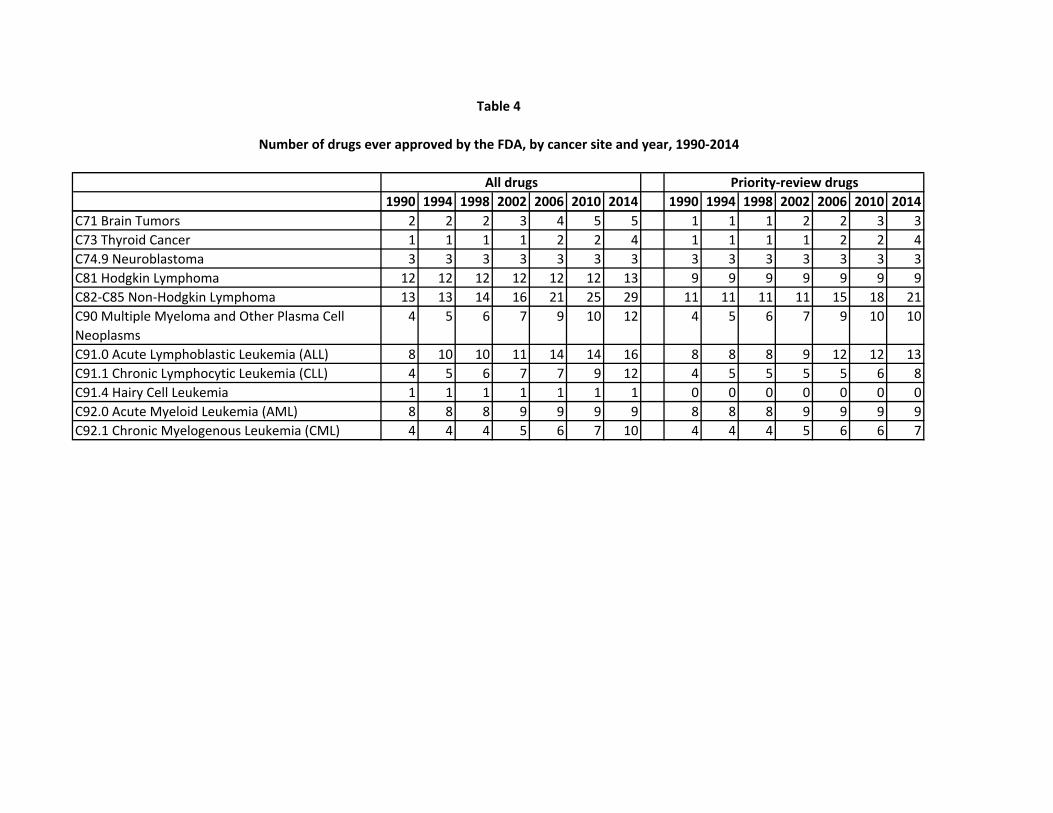
by cancer site in 2000 and 2008, are shown in Table 3. Data on the number of drugs ever
approved by the FDA, by cancer site and year (1990-2014), are shown in Table 4.
IV. Empirical results
a. Premature mortality model estimates
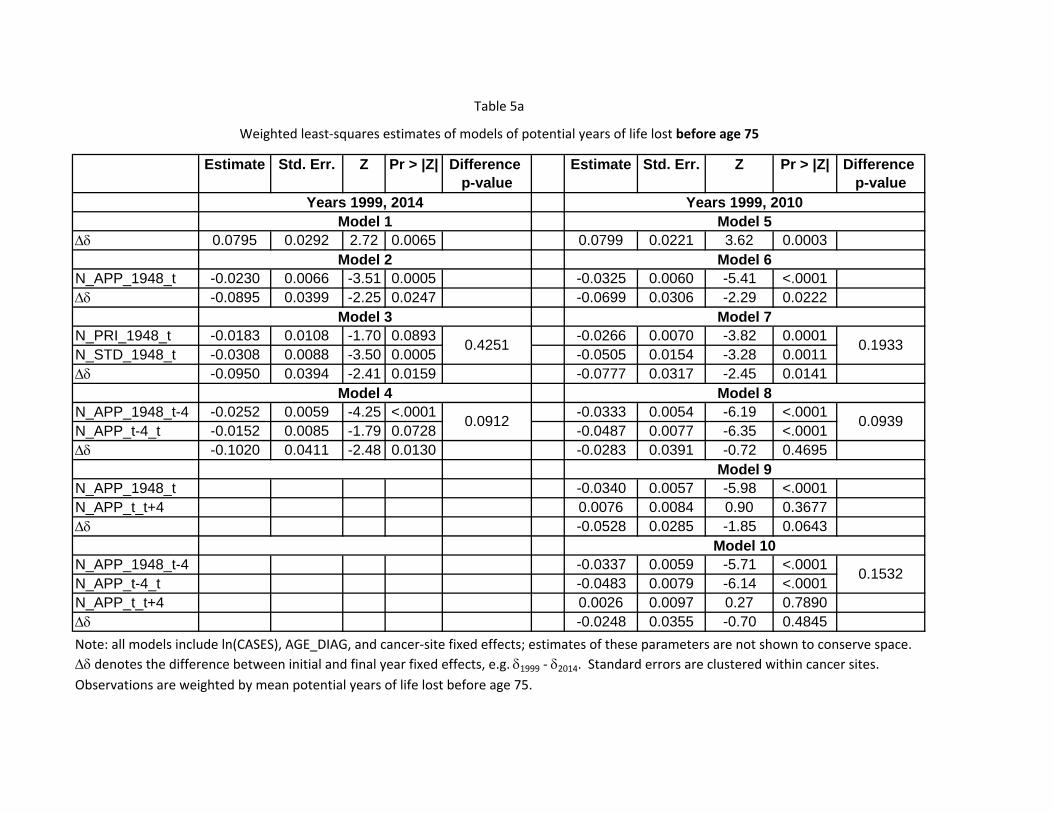
Estimates of models of potential years of life lost before age 75 (eqs. (1), (7), (8), and (9))
are presented in Table 5a. All models include ln(CASES), AGE_DIAG, and cancer-site fixed
effects; estimates of these parameters are not shown to conserve space. As expected, in all
models, the coefficient on ln(CASES) is positive and significant, and the coefficient on
AGE_DIAG is negative and significant. The estimation procedure we use (PROC GENMOD in
SAS) normalizes the final year fixed effect to be equal to zero, so ∆δ denotes the difference
between the initial and final year fixed effects, e.g. δ1999 - δ2014.
In models 1-4, the initial and final years are 1999 and 2014, respectively. These models
are based on the full time span of the mortality data, but they don’t allow us to perform the
falsification test based on future drug approvals. In models 5-10, the initial and final years are
1999 and 2010, respectively; the falsification tests are performed in models 9 and 10.
15
Model 1 in Table 5a provides an estimate of ∆δ (= δ1999 - δ2014) from eq. (1) when
N_APP_1948_t is excluded from the equation. This is an estimate of the weighted mean change
of ln(PYLL75), controlling for the changes in ln(CASES) and AGE_DIAG, but not controlling
for (or holding constant) N_APP_1948_t, i.e. in the presence of pharmaceutical innovation. It
indicates that, controlling for the changes in ln(CASES) and AGE_DIAG, PYLL75 declined by
8.0% between 1999 and 2014.
Model 2 provides estimates of eq. (1) when N_APP_1948_t is included in the equation.
As expected, the coefficient on N_APP_1948_t is negative and highly significant (p-value =
0.0005), indicating that cancer sites with larger increases in the number of drugs ever approved
tended to have larger declines in PYLL75. The point estimate of this coefficient implies that, on
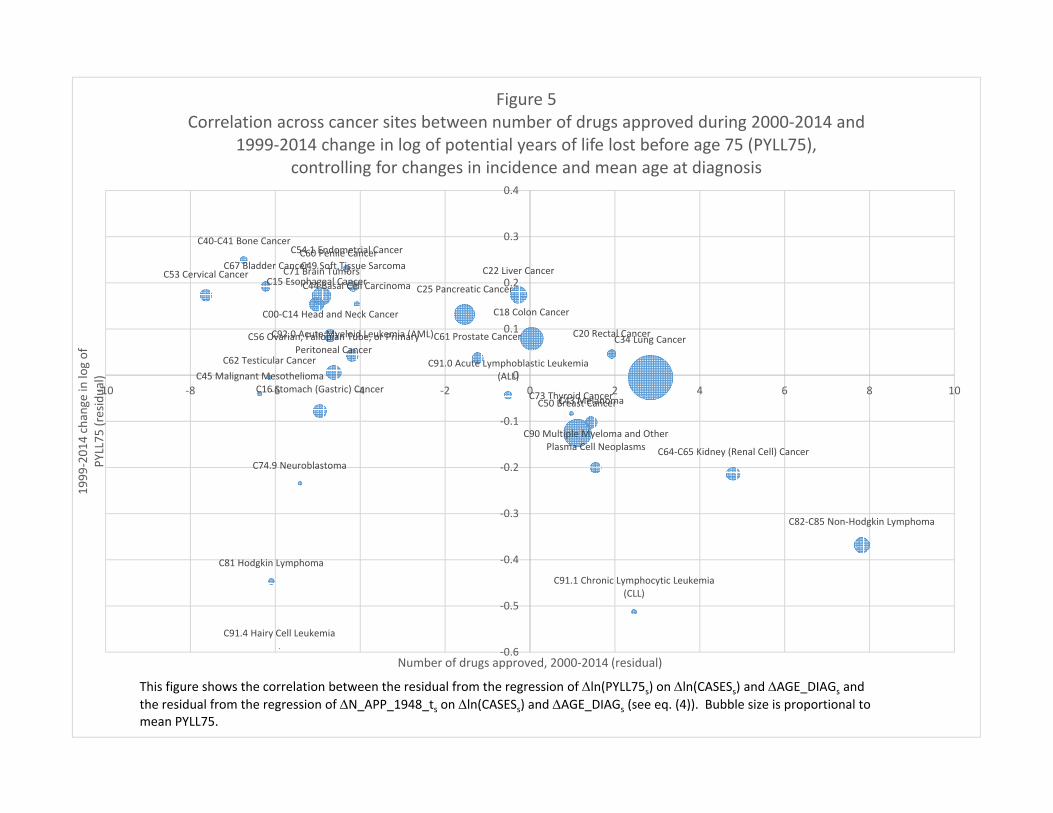
average, one additional drug approved for a condition reduced PYLL75 by 2.3%. Figure 5
shows the correlation across cancer sites between the 1999-2014 change in the number of drugs
ever approved (= the number of drugs approved during 2000-2014) and the 1999-2014 change in
the log of PYLL75, controlling for the changes in incidence and mean age at diagnosis.10 During
the period 1999-2014, PYLL75 due to all types of cancer increased by 4.3%, from 4.23 million
to 4.42 million (Centers for Disease Control and Prevention (2016b)). The population below age
75 increased by 15.4% (from 256.4 million to 299.0 million) during that period, so the premature
cancer mortality rate declined by 11.0% (from 1650 to 1477 per 100,000 population). The
weighted mean number of drugs approved during 2000-2014 was 6.07, so the estimates of model
2 imply that in the absence of pharmaceutical innovation, PYLL75 due to all types of cancer
would have increased by 18.3% (= 4.3% + (.023 * 6.07)), and that the premature cancer
mortality rate would have increased by 2.9% (= 18.3% - 15.4%), although the latter increase is
probably not statistically significantly different from zero. Also, new cancer drugs reduced
PYLL75 at an average annual rate of 0.93% (= (.023 * 6.07) / 15) during the period 1999-2014.
Model 3 in Table 5a corresponds to eq. (9), which distinguishes between priority-review
and standard-review drugs. The difference between the coefficients on priority-review and
standard-review drugs is not statistically significant, so we are unable to reject the null
hypothesis that the two types of drugs had equal effects on PYLL75. Model 4 corresponds to eq.
10 This figure shows the correlation between the residual from the regression of ∆ln(PYLL75s) on ∆ln(CASESs) and ∆AGE_DIAGs and the residual from the regression of ∆N_APP_1948_ts on ∆ln(CASESs) and ∆AGE_DIAGs (see eq. (4)).
16
(7), which distinguishes between drugs approved more than 4 years before year t and drugs
approved 0-4 years before year t. The difference between the coefficients on drugs approved in
the two periods is not statistically significant.
In models 5-10 of Table 5a, the initial and final years are 1999 and 2010. The estimate of
the N_APP_1948_t coefficient in model 6 is larger and more significant than the estimate in
model 2 (based on a longer sample period). Models 7 and 8 show that the differences between
the coefficients on priority-review and standard-review drugs and between the coefficients on
drugs approved more than 4 years before and drugs approved 0-4 years before are again not
statistically significant.
Models 9 and 10 include the number of drugs approved 0-4 years after year t. Model 9
does not distinguish between drugs approved more than 4 years before and drugs approved 0-4
years before year t; model 10 does. As expected, the coefficient on the number of drugs
approved 0-4 years after year t is not significant in either model. In contrast, in model 10 the
coefficient on the number of drugs approved 0-4 years before year t is negative and highly
significant.
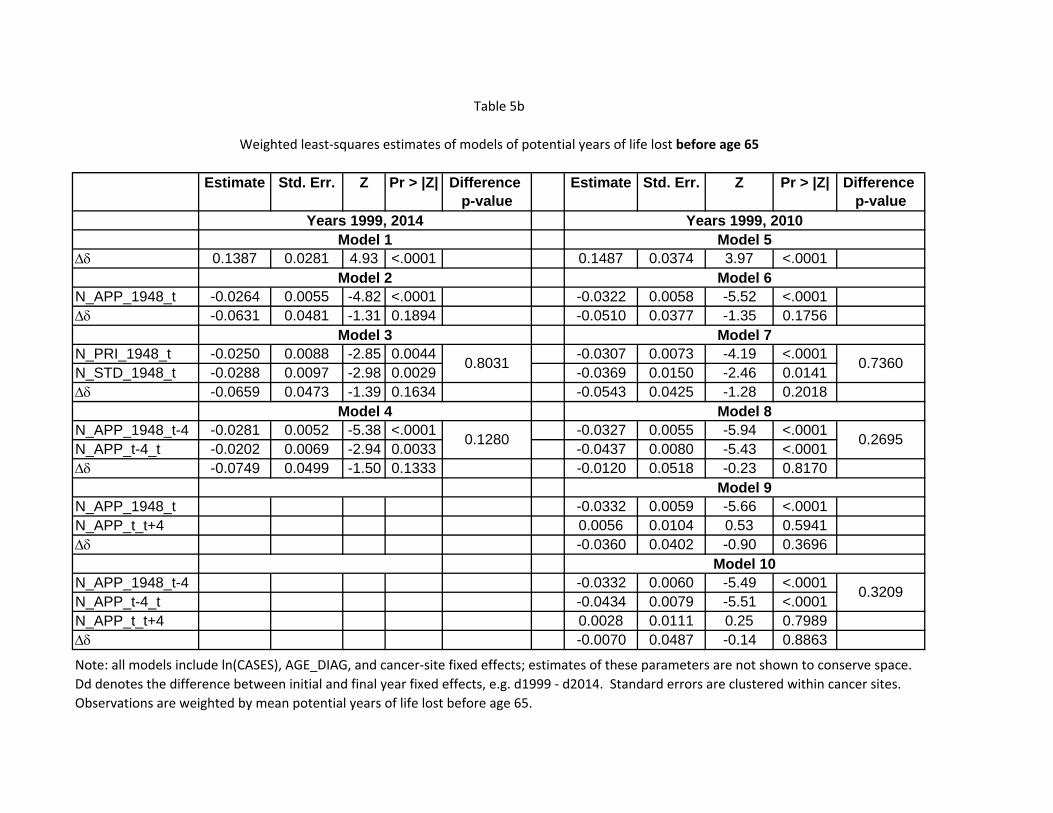
Table 5b presents estimates of models similar to those presented in Table 5a, but in Table
5b the estimates are of models of potential years of life lost before age 65 (PYLL65), rather than
age 75. The estimates in Table 5b are qualitatively similar to the estimates in Table 5a: the
change in log(PYLL65) is strongly inversely related across cancer sites to the number of new
drugs approved; the differences between the coefficients on priority-review and standard-review
drugs and between the coefficients on drugs approved more than 4 years before and drugs
approved 0-4 years before are not statistically significant; and in model 10 the coefficient on the
number of drugs approved 0-4 years after year t is not significant, whereas the coefficient on the
number of drugs approved 0-4 years before year t is negative and highly significant.
b. 5-year observed survival rate model estimates
Estimates of models of the observed 5-year survival rate (eq. (10)) are presented in Table
6. These estimates are based on data for the years 2000 and 2008 from all 18 SEER registries, 5
of which began providing data in 2000. Since the survival rate is “forward-looking,” the 2008
data are the most recent available data. The number of patients diagnosed in all registries
17
increased from 263,848 in 2000 to 287,954 in 2008. Between 2000 and 2008, the observed
survival rate for all cancers combined increased from 56.1% to 60.3%, the expected survival rate
increased from 86.5% to 88.6%, and the relative survival rate increased from 64.9% to 68.0%.
Observations are weighted by number of patients diagnosed. All models in Table 6 include
ln(CASES), ln(SURV_EXP/(1 – SURV_EXP)), and cancer-site fixed effects. As expected, the
coefficients on ln(CASES) and ln(SURV_EXP/(1 – SURV_EXP)) are both positive and highly
significant in all models: observed survival increased more for cancers that had larger increases
in the number of people diagnosed and larger increases in expected survival (e.g. due to earlier
diagnosis).
Model 1 of Table 6 indicates that, holding constant the number of people diagnosed and
the expected survival rate, between 2000 and 2008 the odds of surviving for at least 5 years after
diagnosis increased 10.2% (= exp(δ2008 - δ2000) - 1), although the increase is only marginally
significant (p-value = .0810). Model 2 includes the number of drugs approved until year t
(N_APP_1948_t). The coefficient on this variable is positive and highly significant (p-value =
.0056). The point estimate indicates that one additional drug approval increases the odds of
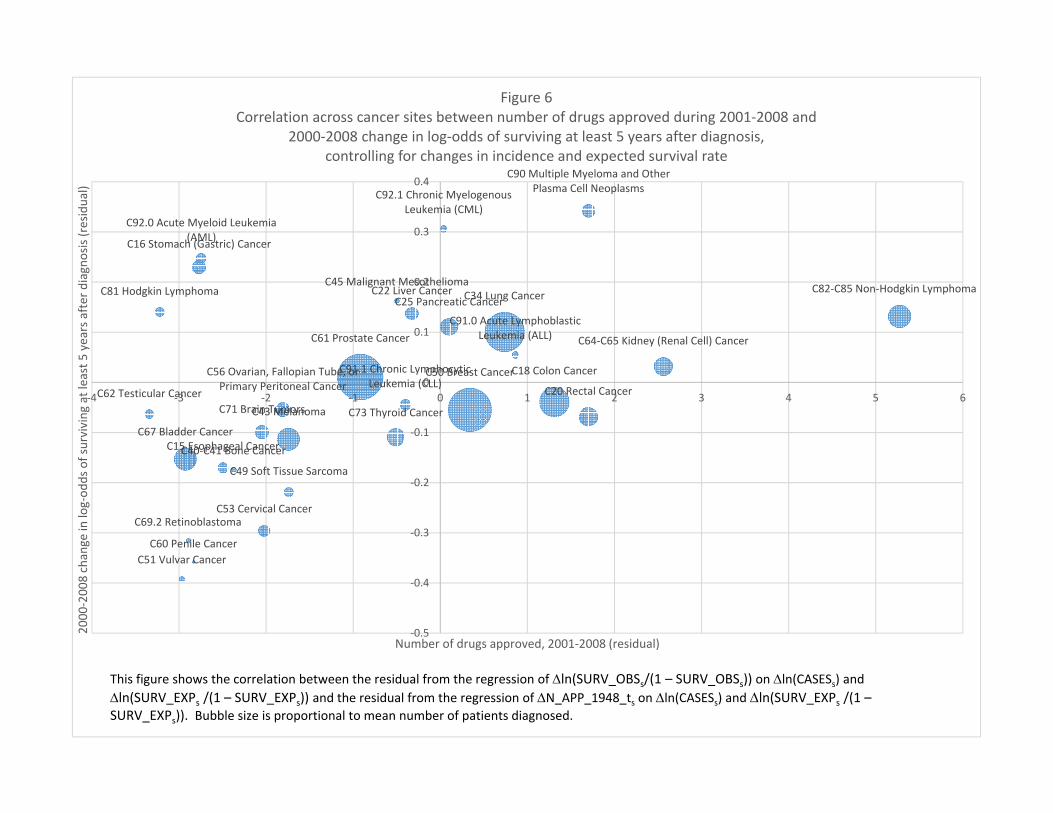
surviving 5 years by 2.4%. Figure 6 shows the correlation across cancer sites between the
number of drugs approved during 2001-2008 and the 2000-2008 change in the log-odds of
surviving at least 5 years after diagnosis, controlling for changes in incidence and the expected
survival rate.
Model 3 distinguishes between priority-review and standard-review drugs. The
coefficient on the former is positive and highly significant, whereas the coefficient on the latter is
negative and marginally significant; the difference between the coefficients is highly significant.
Model 4 distinguishes between drugs approved more than 4 years before and drugs approved 0-4
years before. The coefficients on both variables are positive and significant, but the coefficient
on more recent drug approvals is significantly larger. Model 5 distinguishes between drugs
approved more than 8 years before and drugs approved 0-8 years before. Once again, the
coefficients on both variables are positive and significant, but in this case the difference between
the coefficients is not statistically significant.
18
c. Hospital days model estimates
Now we will present estimates of several versions of the model of cancer patient hospital
days (eq. (11)). The initial and final years of this analysis are 1997 and 2013, respectively.
During that period, the number of cancer patient hospital days declined 22.1%, from 11.7 million
to 9.1 million, despite the fact that the average annual number of patients diagnosed with cancer
in SEER 9 registries increased by 29%. Model 1 of Table 7 indicates that, holding constant the
number of patients diagnosed and their mean age, the number of cancer patient hospital days
declined 32% (= 1 – exp(δ2013 - δ1997)). Model 2 includes the number of drugs approved until
year t. The coefficient on this variable is negative, as expected, but only marginally significant
(p-value = 0.077). Model 3 distinguishes between priority-review and standard-review drugs;
the difference between these coefficients is not significant. Model 4 distinguishes between drugs
approved more than 4 years before and drugs approved 0-4 years before. Only the coefficient on
the number of drugs approved more than 4 years before is statistically significant. Model 5
distinguishes between drugs approved more than 8 years before and drugs approved 0-8 years
before. Only the coefficient on the number of drugs approved more than 8 years before is
statistically significant. The estimate of (δ1997 - δ2013) in model 5 implies that, in the absence of
(lagged) pharmaceutical innovation (i.e. holding constant the number of drugs approved 8 years
before, as well as the number of patients diagnosed and their mean age), the number of hospital
days would have declined by 19.1%. Thus we estimate that lagged pharmaceutical innovation
resulted in a 13.3% decline in the number of cancer patient hospital days during the period 1997-
2013. Also, new cancer drugs reduced the number of cancer patient hospital days at an average
annual rate of 0.83% (= 13.3% / 16) during the period 1997-2013.
V. Cost-effectiveness estimation
Now we will use some of the estimates described in the previous section along with some
other data to produce a baseline estimate of the average cost-effectiveness in 2014 of cancer
drugs approved by the FDA during the period 2000-2014. The cost-effectiveness measure we
will use is cost per life-year gained: the ratio of the cost in 2014 of drugs approved during the
19
period 2000-2014 (net of rebates and two types of “cost offsets”) to the number of life-years
gained in 2014 attributable to those drugs.11
Calculation of cost-effectiveness is described in Table 8. As shown in line 1, according
to the IMS Institute for Healthcare Informatics (2015), total U.S. expenditure (before rebates) on
cancer drugs in 2014 was $32.3 billion.12 Unpublished IMS MIDAS data indicate that 67.7% of
2014 cancer drug expenditure was on drugs approved after 1999 (line 2), so we estimate that
2014 expenditure (before rebates) on cancer drugs approved after 1999 was $21.9 billion (line 3).
However, the net social cost of these drugs is considerably lower than that, for three reasons:
rebates, reduced expenditure on old drugs, and reduced hospital expenditure. We address these
in turn.
Rebates. Drug rebates are believed to be pervasive, but are notoriously difficult to measure.
Herper (2012) provided estimates of the effective rebates on 10 top-selling drugs (but not
specifically cancer drugs) by comparing gross (pre-rebate) sales figures (reported to IMS Health)
to net (post-rebate) sales figures (in company financial statements). Based on that methodology,
he estimated that the weighted average rebate rate was 25%.13 We therefore assume that rebates
on post-1999 cancer drugs amounted to $5.5 billion (line 4 of Table 8). Therefore, net sales of
these drugs was $16.4 billion.
Reduced expenditure on old drugs. Lichtenberg (2014c, p. 465) showed that, in general, "about
one-fourth of the...increase in new drug cost [is] offset by a reduction in old drug cost." Once
again, this estimate was based on data on (outpatient) drugs in general, not specifically on cancer
drugs. But if it also applies to cancer drugs, then the $16.4 billion net expenditure on new cancer
drugs would reduce old cancer drug expenditure by $4.1 billion (line 5).
Reduced hospital expenditure. The estimate of ∆δ in model 1 of Table 7 implies that, holding
constant the number of patients diagnosed and their mean age, HOSP_DAYS declined by 32.4%
(= exp(-∆δ) - 1) between 1997 and 2013. In 1997, HOSP_DAYS was 11.7 million, so this
11 We would prefer to measure cost per quality-adjusted life-year (QALY) gained, but systematic data on the average quality of life of cancer patients, by cancer site and year, are not available. The cost per QALY could be either greater than or less than the cost per life-year, because the number of QALYs gained could be either less than or greater than the number of life-years gained. Although patients’ quality of life in the marginal years (the additional life-years gained) is undoubtedly less than perfect, pharmaceutical innovation may also increase quality of life in the infra-marginal years. 12 This figure is 11% higher than the estimate given in Table 1. To be conservative, we will use the higher figure. 13 Herper (2012) quotes a principal at a pharmaceutical marketing consultancy, who said that “the size of the rebate average[s] about 30% of a medicine’s sales.”
20
represents a HOSP_DAYS reduction of 3.78 million (= 32.4% * 11.7 million). The estimate of
∆δ in model 5 of Table 7 implies that, in the absence of pharmaceutical innovation,
HOSP_DAYS would have declined by 19.1%, or 2.22 million (= 19.1% * 11.7 million). Hence
cancer drugs approved between 1989 and 2005 are estimated to have reduced HOSP_DAYS in
2013 by 1.55 million. In 2013, average cost per cancer patient hospital day was $3076.14
Assuming that hospital costs are proportional to hospital days, this implies that cancer drugs
approved between 1989 and 2005 reduced hospital costs in 2013 by $4.77 billion (= $3076 *
1.55 million). This is shown in line 6 of Table 8.
As shown in line 7, the estimated net social cost of post-1999 cancer drugs in 2014, after
accounting for rebates and reduced expenditure on old drugs and hospital care, is $7.5 billion.
This represents expenditure on all patients. We want to estimate expenditure on patients below
the age of 75, because the denominator of the cost-effectiveness ratio we will use is life-years
gained before age 75. SEER data indicate that about 75% of cancer patients are diagnosed
before the age of 75. As shown in line 8, we will assume that 75% of the net cost of post-1999
cancer drugs in 2014 was on patients below the age of 75,15 so net expenditure on these patients
was $5.6 billion.
The estimates in Table 5 can be used to calculate the number of life-years gained before
age 75 in 2014 from cancer drugs approved during 2000-2014, controlling for changes in
incidence and mean age at diagnosis. The estimate of ∆δ in model 1 of Table 5a implies that,
holding constant the number of patients diagnosed and their mean age, PYLL75 declined by
7.6% (= exp(-∆δ) - 1) between 1999 and 2014. In 1999, PYLL75 was 4.229 million, so this
represents a PYLL75 reduction of 323,186 (= 7.6% * 4.229 million). The estimate of ∆δ in
model 2 of Table 5a implies that, in the absence of pharmaceutical innovation, PYLL75 would
have increased by 9.4%, or 395,947 (= 9.4% * 4.229 million). Hence, as shown in line 9 of
14 The aggregate cost of cancer patient hospitalization was $27.9 billion, and the aggregate number of hospital days was 9.1 million (Agency for Healthcare Research and Quality (2016)). Costs tend to reflect the actual costs of production, while charges represent what the hospital billed for the case. Total charges were converted to costs using cost-to-charge ratios based on hospital accounting reports from the Centers for Medicare and Medicaid Services (CMS). Hospital charges is the amount the hospital charged for the entire hospital stay. It does not include professional (MD) fees. Charges are not necessarily how much was reimbursed. 15 The true fraction of expenditure could be higher or lower. Treatments given to younger patients could be more expensive; on the other hand, people diagnosed before age 75 may continue to receive treatments after age 75.

21
Table 8, cancer drugs approved during 2000-2014 are estimated to have reduced PYLL75 in
2014 by 719,133 (= 323,186 + 395,947).
Our baseline estimate of the cost per life-year gained in 2014 from cancer drugs approved
during 2000-2014 is $7853 (line 10). Performing sensitivity analyses by modifying the estimates
or assumptions described in Table 8 is straightforward. For example, if we completely ignore
the estimated reductions in old drug and hospital expenditure, the estimated cost per life-year
gained is $17,104.
Even the higher estimate would imply that, overall, cancer drug innovation has been
highly cost-effective, by the standards of the World Health Organization and other authorities
(Hirth et al (2000)). The World Health Organization considers interventions whose cost per
quality-adjusted life-year (QALY) gained is less than 3 times per capita GDP to be cost-
effective, and those whose cost per QALY gained is less than per capita GDP to be highly cost-
effective (World Health Organization (2016)); US per capita GDP in 2013 was $53,041.
The cost per life-year gained may be considerably lower outside of the U.S. An analysis
of unpublished data from IMS Health indicates that the average price of cancer drugs outside the
U.S. is about 55% of the U.S. price.16
VI. Summary and conclusions
The number of drugs approved by the FDA for treating cancer has increased substantially
during the last 40 years. Moreover, cancer drug innovation has been accelerating: more than 8
times as many new cancer drugs were approved during 2005-2015 as were approved during
1975-1985 (66 vs. 8). During the period 2010-2014, the average annual growth rate of cancer
drug expenditure was 7.6%--more than 3.6 times the average annual growth rate of nominal U.S.
16 This relative price was calculated by estimating the following model by weighted least squares, weighting by the number of standard units, using 2014 data on 107 molecules: ln(Pmr) = δr + αm + εmr, where Pmr = manufacturer revenue per standard unit of molecule m in region r (r = USA, ROW (rest of the world)).
Parameter Estimate Std. Err. t Value Pr > |t|
δROW - δUSA -0.591 0.093 6.37 <.0001
22
GDP. This has contributed to a lively debate about the value and cost-effectiveness of new
cancer drugs.
In this study, we attempted to assess the average cost-effectiveness in the U.S. in 2014 of
new cancer drugs approved by the FDA during 2000-2014. Cost-effectiveness was measured as
the ratio of the impact of new cancer drugs on medical expenditure to their impact on potential
years of life lost due to cancer. We used a difference-in-difference research design: we
investigated whether there were larger declines in premature mortality from the cancers that had
larger increases in the number of drugs ever approved, controlling for the change in cancer
incidence and mean age at time of diagnosis. The vast majority of the data we relied on are
publicly available.
Our key findings can be summarized as follows:
• cancer sites with larger increases in the number of drugs ever approved tended to have larger declines in the number of potential years of life lost before ages 75 and 65.
• on average, one additional drug approved for a cancer site reduced the number of potential years of life lost before age 75 by 2.3%.
• new cancer drugs reduced the number of potential years of life lost before age 75 at an average annual rate of 0.93% during the period 1999-2014.
• cancer drugs approved during 2000-2014 are estimated to have reduced the number of potential years of life lost before age 75 in 2014 by 719,133
• premature mortality in year t is strongly inversely related to the number of drugs approved in years t-3 to t (and earlier years), but unrelated to the number of drugs approved in years t+1 to t+4.
• one additional drug approval increases the odds of surviving at least 5 years after diagnosis by 2.4%.
• new cancer drugs reduced the number of cancer patient hospital days at an average annual rate of 0.83% during the period 1997-2013.
• cancer drugs approved between 1989 and 2005 are estimated to have reduced the number of hospital days in 2013 by 1.55 million, and hospital cost in 2013 by $4.8 billion.
• our baseline estimate of the cost per life-year gained in 2014 from cancer drugs approved during 2000-2014 is $7853. If we completely ignore the estimated reductions in old drug and hospital expenditure, the estimated cost per life-year gained is $17,104. Even the higher estimate would imply that, overall, cancer drug innovation has been highly cost-effective, by the standards of the World Health Organization and other authorities.
This study is subject to a number of limitations. The measure of pharmaceutical
innovation we used is based on FDA-approved indications of cancer drugs; off-label uses of
drugs were not accounted for. The primary outcome measure analyzed was life-years gained,
rather than quality-adjusted life-years gained. We could not control for cancer-site-specific non-

23
pharmaceutical medical innovations. Although these are likely to be less important sources of
longevity increase than new cancer drugs and may not be correlated with them, measuring and
controlling for other medical innovations would be desirable.
24
Appendix 1
The cancer drug age-utilization profile
We used annual data for the period 2010-2014 on 86 cancer drugs (molecules) to provide
evidence about the drug age-utilization profile, by estimating the following model:
ln(N_SUmn) = ρm + πn + εmn (A1)
where
N_SUmn = the number of standard units of molecule m sold in the U.S. n years after it was approved by the FDA (n = 0, 1,…, 25)
ρm = a fixed effect for molecule m
πn = a fixed effect for age n
The expression exp(πn - π9) is a “relative utilization index”: it is the mean ratio of the quantity of
a cancer drug sold n years after it was approved to the quantity of the same drug sold 9 years
after it was approved.
Estimates of the “relative utilization index” are shown in Appendix Figure 1. These
estimates indicate that it takes about 9 years for a cancer drug to attain its peak level of
utilization. The number of standard units 9 years after FDA approval is about twice as great as
the number of standard units one year after FDA approval. Moreover, Appendix Figure 1
provides a conservative estimate of the slope of the age-utilization profile, because there was
zero utilization of some molecules in the first few years after they were first listed.17
17 Since the dependent variable of eq. (A1) is logarithmic, observations for which N_SUmn = 0 had to be excluded.
25
References Agency for Healthcare Research and Quality (2016). HCUPnet: A tool for identifying, tracking, and analyzing national hospital statistics. Aghion P, Howitt P (1992). “A Model of Growth through Creative Destruction.” Econometrica 60(2): 323–351, March. Broda C, Weinstein DW (2004), Variety Growth and World Welfare, American Economic Review 94(2): 139-144. Burnet NG, Jefferies SJ, Benson RJ, Hunt DP, Treasure FP (2005). Years of life lost (YLL) from cancer is an important measure of population burden – and should be considered when allocating research funds. Br J Cancer 92(2): 241–245, Jan 31.
Centers for Disease Control and Prevention (2016a). Compressed Mortality database. Centers for Disease Control and Prevention (2016b). WISQARS Years of Potential Life Lost (YPLL) Report, 1999 and later. Cho H, Howlader N, Mariotto AB, Cronin KA (2011). Estimating relative survival for cancer patients from the SEER Program using expected rates based on Ederer I versus Ederer II method, Surveillance Research Program, NCI, Technical Report #2011-01,
Dorsey ER, et al (2010). Financial Anatomy of Biomedical Research, 2003-2008. Journal of the American Medical Association 303(2): 137–143.
Ederer F, Axtell LM, Cutler SJ (1961), "The Relative Survival Rate: A Statistical Methodology," Natl Cancer Inst Monogr 6, 101-121,
Food and Drug Administration (2016a). Review Designation Policy: Priority (P) and Standard (S).
Food and Drug Administration (2016b). Fast Track, Breakthrough Therapy, Accelerated Approval, and Priority Review > Priority Review.
Food and Drug Administration (2016c), Drugs@FDA Database. Grossman GM, Helpman E (1991). Innovation and growth in the global economy. Cambridge, MA: MIT Press. Herper M (2012). “Inside The Secret World of Drug Company Rebates,” Forbes, May 10, Hirth RA, Chernew ME, Miller E, Fendrick AM, Weissert WG (2000), Willingness to Pay for a Quality-adjusted Life Year: In Search of a Standard, Med Decis Making 20(3): 332-342, Jul-Sep.

26
IMS Institute for Healthcare Informatics (2015). Medicines Use and Spending Shifts: A Review of the Use of Medicines in the U.S. in 2014, April. Jones CI (2002). “Sources of U.S. Economic Growth in a World of Ideas,” American Economic Review 92 (1): 220-239, March. Lichtenberg FR (2013). The Effect of Pharmaceutical Innovation on Longevity: Patient Level Evidence from the 1996–2002 Medical Expenditure Panel Survey and Linked Mortality Public-use Files. Forum for Health Economics and Policy 16(1): 1–33, January.
Lichtenberg FR (2014a). Pharmaceutical Innovation and Longevity Growth in 30 Developing and High-income Countries, 2000-2009. Health Policy and Technology 3(1): 36-58, March.
Lichtenberg FR (2014b). The impact of pharmaceutical innovation on longevity and medical expenditure in France, 2000–2009. Economics and Human Biology 13: 107-127, March.
Lichtenberg FR (2014c). The impact of pharmaceutical innovation on disability days and the use of medical services in the United States, 1997-2010. Journal of Human Capital 8(4): 432-480, Winter.
National Cancer Institute (2012), Long-Term Trial Results Show No Mortality Benefit from Annual Prostate Cancer Screening, February 17.
National Cancer Institute (2016a). Cancer Screening Overview.
National Cancer Institute (2016b). Drugs Approved for Different Types of Cancer. National Cancer Institute (2016c). SEER Research Data. National Cancer Institute (2016d). SEER*Stat Software.
National Science Foundation (2016), U.S. Corporate R&D: Volume 1: Top 500 Firms in R&D by Industry Category.
Nordhaus, WD (2005). “Irving Fisher and The Contribution of Improved Longevity to Living Standards,” American Journal of Economics and Sociology 64(1): 367-392, January.
Patterson GS (2012). The Business of Ideas: The Highs and Lows of Inventing and Extracting Revenue from Intellectual Property, AuthorHouse, September 14. Romer PM (1990). “Endogenous Technological Change.” Journal of Political Economy 98(5, Pt. 2): S71–S102, October. Sampat BN, Lichtenberg FR (2011). What are the Respective Roles of the Public and Private Sectors in Pharmaceutical Innovation? Health Affairs 30(2): 332-9.

27
United Nations (2016). Human Development Index (HDI) | Human Development Reports. World Health Organization (2016), Cost-effectiveness thresholds.
27
35
51
87
153
0
20
40
60
80
100
120
140
160
180
1975 1985 1995 2005 2015
Figure 1Number of drugs used to treat cancer ever approved by the FDA
1975‐1985: 8 new cancer drugs2005‐2015: 66 new cancer drugs
Source: Author's calculations based on National Cancer Institute and FDA data:http://www.cancer.gov/about‐cancer/treatment/drugs/cancer‐typehttp://www.fda.gov/Drugs/InformationOnDrugs/ucm135821.htm
y = 0.1788x ‐ 351.14
y = ‐0.8486x + 1734.5
0
10
20
30
40
50
60
70
0
2
4
6
8
10
12
14
16
1980 1985 1990 1995 2000 2005 2010 2015 2020
Num
ber o
f other (n
on‐cancer) NMEs laun
ched
worldwide
Num
ber o
f cancer N
MEs laun
ched
worldwide
Figure 2Number of cancer and other new molecular entities launched worldwide, 1982‐2015
cancer other Linear (cancer) Linear (other)
Source: author's calculations based on IMS Health New Product Focus database"Cancer NMEs" are NMEs in EphMRA/PBIRG Anatomical Classification L (ANTINEOPLASTIC AND IMMUNOMODULATING AGENTS)
MERCAPTOPURINE 1953METHOTREXATE SODIUM 1953PREDNISONE 1955CYCLOPHOSPHAMIDE 1959VINCRISTINE SULFATE 1963CYTARABINE 1969DOXORUBICIN HYDROCHLORIDE 1974DAUNORUBICIN HYDROCHLORIDE 1979ASPARAGINASE 1994PEGASPARGASE 1994IMATINIB MESYLATE 2001CLOFARABINE 2004NELARABINE 2005DASATINIB 2006PONATINIB HYDROCHLORIDE 2012BLINATUMOMAB 2014
Figure 3
Drugs approved for Acute Lymphoblastic Leukemia
10
16
0
2
4
6
8
10
12
14
16
18
1990 1995 2000 2005 2010 2015
Number of drugs ever approved for Acute Lymphoblastic Leukemia, 1994‐2014
9
26
10
16
121313
29
0
5
10
15
20
25
30
35
1993 1998 2003 2008 2013
Figure 4Number of drugs ever approved for 4 types of cancer, 1994‐2014
C50 Breast Cancer C91.0 Acute Lymphoblastic Leukemia (ALL) C81 Hodgkin Lymphoma C82‐C85 Non‐Hodgkin Lymphoma
C00‐C14 Head and Neck Cancer
C15 Esophageal Cancer
C16 Stomach (Gastric) Cancer
C18 Colon Cancer
C20 Rectal Cancer
C22 Liver Cancer
C25 Pancreatic Cancer
C34 Lung Cancer
C40‐C41 Bone Cancer
C43 Melanoma
C44 Basal Cell Carcinoma
C45 Malignant Mesothelioma
C49 Soft Tissue Sarcoma
C50 Breast Cancer
C53 Cervical Cancer
C54.1 Endometrial Cancer
C56 Ovarian, Fallopian Tube, or Primary Peritoneal Cancer
C60 Penile Cancer
C61 Prostate Cancer
C62 Testicular Cancer
C64‐C65 Kidney (Renal Cell) Cancer
C67 Bladder CancerC71 Brain Tumors
C73 Thyroid Cancer
C74.9 Neuroblastoma
C81 Hodgkin Lymphoma
C82‐C85 Non‐Hodgkin Lymphoma
C90 Multiple Myeloma and Other Plasma Cell Neoplasms
C91.0 Acute Lymphoblastic Leukemia (ALL)
C91.1 Chronic Lymphocytic Leukemia (CLL)
C91.4 Hairy Cell Leukemia
C92.0 Acute Myeloid Leukemia (AML)
‐0.6
‐0.5
‐0.4
‐0.3
‐0.2
‐0.1
0
0.1
0.2
0.3
0.4
‐10 ‐8 ‐6 ‐4 ‐2 0 2 4 6 8 10
1999
‐201
4 change in log of
PYLL75
(residual)
Number of drugs approved, 2000‐2014 (residual)
Figure 5Correlation across cancer sites between number of drugs approved during 2000‐2014 and
1999‐2014 change in log of potential years of life lost before age 75 (PYLL75),controlling for changes in incidence and mean age at diagnosis
This figure shows the correlation between the residual from the regression of ln(PYLL75s) on ln(CASESs) and AGE_DIAGs and the residual from the regression of N_APP_1948_ts on ln(CASESs) and AGE_DIAGs (see eq. (4)). Bubble size is proportional to mean PYLL75.
C15 Esophageal Cancer
C16 Stomach (Gastric) Cancer
C18 Colon Cancer
C20 Rectal Cancer
C22 Liver CancerC25 Pancreatic CancerC34 Lung Cancer
C40‐C41 Bone Cancer
C43 Melanoma
C45 Malignant Mesothelioma
C49 Soft Tissue Sarcoma
C50 Breast Cancer
C51 Vulvar Cancer
C53 Cervical Cancer
C56 Ovarian, Fallopian Tube, or Primary Peritoneal Cancer
C60 Penile Cancer
C61 Prostate Cancer
C62 Testicular Cancer
C64‐C65 Kidney (Renal Cell) Cancer
C67 Bladder Cancer
C69.2 Retinoblastoma
C71 Brain Tumors C73 Thyroid Cancer
C81 Hodgkin Lymphoma C82‐C85 Non‐Hodgkin Lymphoma
C90 Multiple Myeloma and Other Plasma Cell Neoplasms
C91.0 Acute Lymphoblastic Leukemia (ALL)
C91.1 Chronic Lymphocytic Leukemia (CLL)
C92.0 Acute Myeloid Leukemia (AML)
C92.1 Chronic Myelogenous Leukemia (CML)
‐0.5
‐0.4
‐0.3
‐0.2
‐0.1
0
0.1
0.2
0.3
0.4
‐4 ‐3 ‐2 ‐1 0 1 2 3 4 5 6
2000
‐200
8 change in log‐od
ds of surviving
at least 5 years after diagnosis (residual)
Number of drugs approved, 2001‐2008 (residual)
Figure 6Correlation across cancer sites between number of drugs approved during 2001‐2008 and
2000‐2008 change in log‐odds of surviving at least 5 years after diagnosis,controlling for changes in incidence and expected survival rate
This figure shows the correlation between the residual from the regression of ln(SURV_OBSs/(1 – SURV_OBSs)) on ln(CASESs) and ln(SURV_EXPs /(1 – SURV_EXPs)) and the residual from the regression of N_APP_1948_ts on ln(CASESs) and ln(SURV_EXPs /(1 –SURV_EXPs)). Bubble size is proportional to mean number of patients diagnosed.
Molecule 2010 2011 2012 2013 2014 ChangeAll cancer drugs $21,385 $22,413 $23,299 $24,942 $28,971 $7,586
RITUXIMAB $2,673 $2,879 $3,037 $3,199 $3,351 $679BEVACIZUMAB $2,993 $2,581 $2,543 $2,618 $2,790 ‐$203IMATINIB $1,363 $1,560 $1,674 $1,872 $2,333 $970DENOSUMAB $27 $478 $932 $1,229 $1,552 $1,525ABIRATERONE ACETATE $0 $174 $454 $767 $1,010 $1,010LENALIDOMIDE $311 $431 $537 $528 $974 $663EVEROLIMUS $108 $182 $426 $714 $841 $733DASATINIB $185 $291 $380 $549 $725 $540LEUPRORELIN $631 $650 $639 $651 $692 $62IPILIMUMAB $0 $339 $507 $541 $687 $687
Source: IMS Health.
Table 1
U.S. sales of top cancer drugs ($ millions)
Note: these figures represent the value of drugs sold at "list prices"; rebates are not accounted for.
1999 2014 1999 2014 1988‐1997 2003‐2012 1988‐1997 2003‐2012 1997 2013
C00‐C14 Head and Neck Cancer 74,052 87,161 34,112 36,161 2,166 2,849 58.0 57.2 159,120 139,442
C15 Esophageal Cancer 99,905 121,933 40,205 45,788 821 959 62.1 61.6 132,260 103,241C16 Stomach (Gastric) Cancer 95,716 94,763 43,796 43,253 1,199 1,449 61.4 59.7 262,018 199,976
C18 Colon Cancer 286,278 301,178 116,093 129,363 5,376 5,265 62.7 60.1 1,044,400 689,071C20 Rectal Cancer 48,443 60,020 21,343 26,350 1,710 2,110 61.1 57.5 364,882 268,129C22 Liver Cancer 109,239 220,317 49,824 83,537 869 2,245 59.3 58.6 81,381 141,369C25 Pancreatic Cancer 194,392 269,310 75,797 96,095 1,627 2,508 62.8 61.7 276,671 265,989C34 Lung Cancer 1,089,130 1,010,583 393,295 336,483 10,884 10,652 63.0 62.9 1,183,100 829,940C40‐C41 Bone Cancer 26,401 29,409 18,501 19,729 250 292 35.3 37.8 36,229 42,784C43 Melanoma 88,005 85,268 47,315 40,233 3,634 5,515 50.5 53.7 15,321 11,540C44 Basal Cell Carcinoma 15,193 19,996 6,528 7,616 291 439 50.0 53.4 28,348 27,511C45 Malignant Mesothelioma 14,113 12,243 4,843 4,103 153 138 62.8 63.2 18,289 14,035C46 Kaposi Sarcoma 590 570 435 345 262 170 39.1 43.0 1,439 0C49 Soft Tissue Sarcoma 49,563 61,264 29,373 34,339 521 719 46.5 48.9 51,342 58,920C50 Breast Cancer 427,324 401,888 214,099 186,728 14,100 17,705 56.6 56.4 326,240 157,356C51 Vulvar Cancer 3,385 6,000 1,435 2,530 205 266 57.0 57.2 18,898 10,365C53 Cervical Cancer 72,735 70,125 43,145 39,890 1,108 930 46.4 47.6 91,193 39,409C54.1 Endometrial Cancer 19,773 31,253 7,393 11,158 2,429 3,837 58.6 58.5 159,234 100,397C56 Ovarian, Fallopian Tube, or Primary Peritoneal Cancer
115,547 115,525 51,707 48,060 1,454 1,548 56.3 55.9 188,761 156,756
C60 Penile Cancer 1,565 2,388 690 1,038 56 87 60.2 60.4 3,157 4,730C61 Prostate Cancer 76,492 83,051 16,342 20,171 12,716 14,350 65.7 62.9 389,198 153,372C62 Testicular Cancer 12,311 12,710 8,836 9,110 731 852 34.2 34.9 9,287 12,436
Table 2
Data on premature mortality, incidence, and hospitalization, by cancer site
Potential years of life
lost before age 75
Potential years of
life lost before age
65
Average annual
number diagnosed
before age 75 (SEER 9)
Mean age at
diagnosis of patients
diagnosed before age
75 (SEER 9)
Number of hospital
days
1999 2014 1999 2014 1988‐1997 2003‐2012 1988‐1997 2003‐2012 1997 2013
Table 2
Data on premature mortality, incidence, and hospitalization, by cancer site
Potential years of life
lost before age 75
Potential years of
life lost before age
65
Average annual
number diagnosed
before age 75 (SEER 9)
Mean age at
diagnosis of patients
diagnosed before age
75 (SEER 9)
Number of hospital
days
C64‐C65 Kidney (Renal Cell) Cancer
92,658 103,563 40,028 40,348 1,990 3,796 58.0 57.7 210,836 229,344
C67 Bladder Cancer 49,151 60,795 16,286 19,515 3,059 3,602 62.7 62.7 244,471 191,431C69.2 Retinoblastoma 422 205 257 110 21 26 4.9 3.7 381 895C71 Brain Tumors 176,630 199,026 97,895 101,896 1,291 1,546 45.9 46.9 223,031 221,945C73 Thyroid Cancer 9,078 12,773 3,968 5,113 1,605 4,281 44.5 47.7 45,057 46,112C74.9 Neuroblastoma 9,095 8,178 5,645 4,918 35 37 21.4 17.8 14,985 13,315C81 Hodgkin Lymphoma 26,015 15,628 17,000 9,463 683 744 36.1 38.0 41,761 44,139C82‐C85 Non‐Hodgkin Lymphoma
170,143 121,130 79,183 50,615 3,439 4,171 54.6 56.4 456,126 386,511
C90 Multiple Myeloma and Other Plasma Cell Neoplasms
62,555 63,338 22,540 20,973 882 1,370 62.3 61.2 162,886 213,160
C91.0 Acute Lymphoblastic Leukemia (ALL)
33,325 31,268 23,035 20,743 326 446 19.7 22.0 113,448 156,189
C91.1 Chronic Lymphocytic Leukemia (CLL)
16,876 13,585 5,101 4,065 668 1,157 62.8 62.2 47,874 32,660
C91.4 Hairy Cell Leukemia 610 360 275 120 73 89 54.7 54.3 0 0C92.0 Acute Myeloid Leukemia (AML)
66,432 77,876 35,282 36,561 495 710 53.0 54.3 248,775 390,516
C92.1 Chronic Myelogenous Leukemia (CML)
22,590 7,940 13,065 4,145 240 329 52.0 51.4 54,344 33,370
Cancer site 2000 2008 2000 2008 2000 2008
C15 Esophageal Cancer 13.5% 14.1% 86.2% 88.0% 2,754 2,994C16 Stomach (Gastric) Cancer 18.8% 26.0% 83.9% 86.2% 5,055 4,972C18 Colon Cancer 50.6% 54.6% 80.7% 83.9% 22,409 21,575C20 Rectal Cancer 54.7% 59.4% 85.6% 89.1% 9,208 8,998C22 Liver Cancer 10.4% 16.5% 90.8% 91.6% 3,149 5,253C25 Pancreatic Cancer 4.2% 6.3% 86.2% 88.6% 6,663 8,226C34 Lung Cancer 12.6% 15.2% 86.2% 86.6% 38,808 38,678C40‐C41 Bone Cancer 66.4% 68.0% 96.1% 96.7% 619 691C43 Melanoma 81.1% 82.2% 90.1% 89.7% 10,889 13,949C45 Malignant Mesothelioma 5.0% 8.3% 80.7% 87.4% 647 653C49 Soft Tissue Sarcoma 59.4% 58.7% 91.0% 91.2% 1,927 2,295C50 Breast Cancer 79.5% 81.8% 90.0% 91.4% 45,901 47,537C51 Vulvar Cancer 65.4% 60.0% 86.0% 86.7% 737 778C53 Cervical Cancer 68.1% 65.0% 95.8% 96.5% 3,557 3,248C56 Ovarian, Fallopian Tube, or Primary Peritoneal Cancer
40.3% 43.4% 92.1% 93.0% 4,869 5,014
C60 Penile Cancer 61.4% 57.1% 82.3% 83.8% 246 258C61 Prostate Cancer 80.6% 85.2% 81.9% 86.4% 49,820 53,557C62 Testicular Cancer 94.2% 94.4% 98.5% 98.4% 2,049 2,237C64‐C65 Kidney (Renal Cell) Cancer 56.9% 66.6% 88.3% 90.0% 7,148 10,573
C67 Bladder Cancer 62.6% 62.8% 80.3% 81.4% 11,874 12,633C69.2 Retinoblastoma 78.7% 76.2% 89.4% 90.5% 557 562C71 Brain Tumors 28.9% 29.9% 97.2% 97.2% 4,084 4,520C73 Thyroid Cancer 92.2% 93.9% 96.1% 96.1% 5,170 9,228C81 Hodgkin Lymphoma 81.2% 84.9% 97.1% 96.9% 1,931 2,170C82‐C85 Non‐Hodgkin Lymphoma 54.6% 62.4% 88.0% 88.6% 11,964 13,585C90 Multiple Myeloma and Other Plasma Cell Neoplasms
28.9% 42.4% 85.5% 87.4% 3,644 4,241
C91.0 Acute Lymphoblastic Leukemia (ALL)
62.3% 66.5% 99.1% 99.1% 1,145 1,311
C91.1 Chronic Lymphocytic Leukemia (CLL)
64.0% 68.3% 81.9% 83.1% 2,550 3,153
C92.0 Acute Myeloid Leukemia (AML)
16.6% 23.6% 94.8% 95.3% 2,303 2,454
C92.1 Chronic Myelogenous Leukemia (CML)
45.5% 57.0% 90.6% 90.9% 1,100 1,209
Number of patients
diagnosed
Observed 5‐year
survival rate
Expected 5‐year
survival rate
Table 3
Observed and expected 5‐year survival rates and number of patients diagnosed, by cancer site, 2000 and 2008
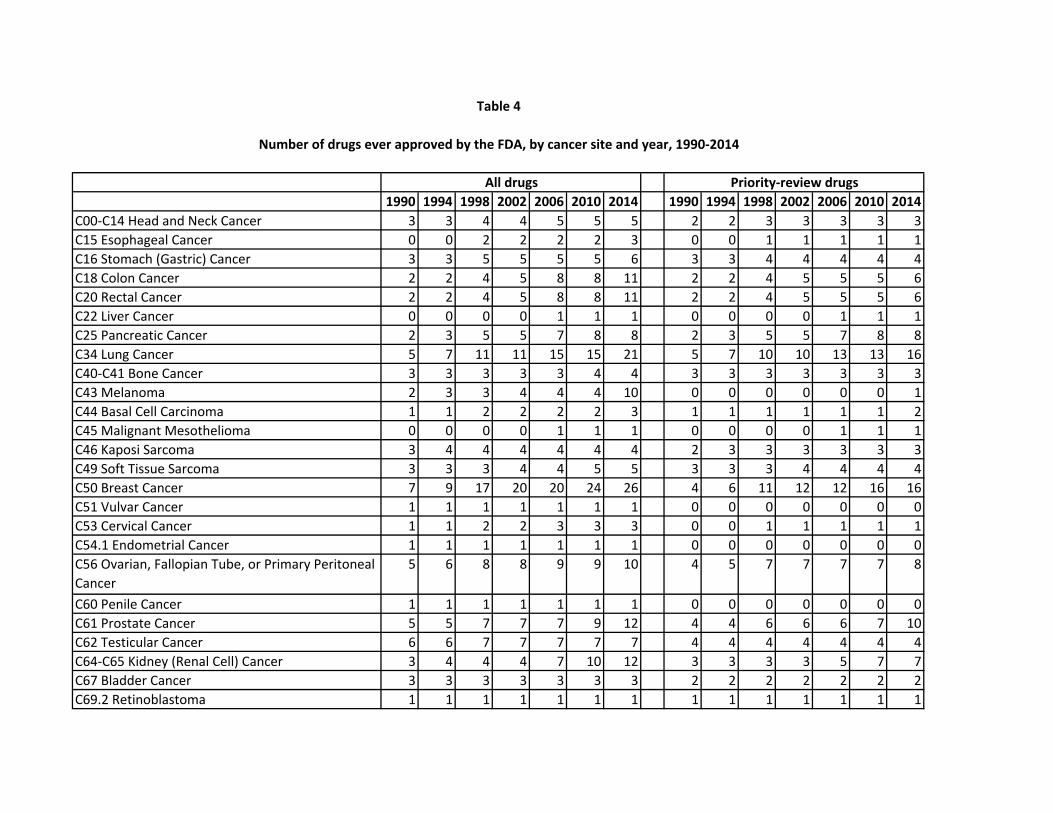
1990 1994 1998 2002 2006 2010 2014 1990 1994 1998 2002 2006 2010 2014
C00‐C14 Head and Neck Cancer 3 3 4 4 5 5 5 2 2 3 3 3 3 3C15 Esophageal Cancer 0 0 2 2 2 2 3 0 0 1 1 1 1 1C16 Stomach (Gastric) Cancer 3 3 5 5 5 5 6 3 3 4 4 4 4 4C18 Colon Cancer 2 2 4 5 8 8 11 2 2 4 5 5 5 6C20 Rectal Cancer 2 2 4 5 8 8 11 2 2 4 5 5 5 6C22 Liver Cancer 0 0 0 0 1 1 1 0 0 0 0 1 1 1C25 Pancreatic Cancer 2 3 5 5 7 8 8 2 3 5 5 7 8 8C34 Lung Cancer 5 7 11 11 15 15 21 5 7 10 10 13 13 16C40‐C41 Bone Cancer 3 3 3 3 3 4 4 3 3 3 3 3 3 3C43 Melanoma 2 3 3 4 4 4 10 0 0 0 0 0 0 1C44 Basal Cell Carcinoma 1 1 2 2 2 2 3 1 1 1 1 1 1 2C45 Malignant Mesothelioma 0 0 0 0 1 1 1 0 0 0 0 1 1 1C46 Kaposi Sarcoma 3 4 4 4 4 4 4 2 3 3 3 3 3 3C49 Soft Tissue Sarcoma 3 3 3 4 4 5 5 3 3 3 4 4 4 4C50 Breast Cancer 7 9 17 20 20 24 26 4 6 11 12 12 16 16C51 Vulvar Cancer 1 1 1 1 1 1 1 0 0 0 0 0 0 0C53 Cervical Cancer 1 1 2 2 3 3 3 0 0 1 1 1 1 1C54.1 Endometrial Cancer 1 1 1 1 1 1 1 0 0 0 0 0 0 0C56 Ovarian, Fallopian Tube, or Primary Peritoneal Cancer
5 6 8 8 9 9 10 4 5 7 7 7 7 8
C60 Penile Cancer 1 1 1 1 1 1 1 0 0 0 0 0 0 0C61 Prostate Cancer 5 5 7 7 7 9 12 4 4 6 6 6 7 10C62 Testicular Cancer 6 6 7 7 7 7 7 4 4 4 4 4 4 4C64‐C65 Kidney (Renal Cell) Cancer 3 4 4 4 7 10 12 3 3 3 3 5 7 7C67 Bladder Cancer 3 3 3 3 3 3 3 2 2 2 2 2 2 2C69.2 Retinoblastoma 1 1 1 1 1 1 1 1 1 1 1 1 1 1
All drugs Priority‐review drugs
Table 4
Number of drugs ever approved by the FDA, by cancer site and year, 1990‐2014
1990 1994 1998 2002 2006 2010 2014 1990 1994 1998 2002 2006 2010 2014
All drugs Priority‐review drugs
Table 4
Number of drugs ever approved by the FDA, by cancer site and year, 1990‐2014
C71 Brain Tumors 2 2 2 3 4 5 5 1 1 1 2 2 3 3C73 Thyroid Cancer 1 1 1 1 2 2 4 1 1 1 1 2 2 4C74.9 Neuroblastoma 3 3 3 3 3 3 3 3 3 3 3 3 3 3C81 Hodgkin Lymphoma 12 12 12 12 12 12 13 9 9 9 9 9 9 9C82‐C85 Non‐Hodgkin Lymphoma 13 13 14 16 21 25 29 11 11 11 11 15 18 21C90 Multiple Myeloma and Other Plasma Cell Neoplasms
4 5 6 7 9 10 12 4 5 6 7 9 10 10
C91.0 Acute Lymphoblastic Leukemia (ALL) 8 10 10 11 14 14 16 8 8 8 9 12 12 13C91.1 Chronic Lymphocytic Leukemia (CLL) 4 5 6 7 7 9 12 4 5 5 5 5 6 8C91.4 Hairy Cell Leukemia 1 1 1 1 1 1 1 0 0 0 0 0 0 0C92.0 Acute Myeloid Leukemia (AML) 8 8 8 9 9 9 9 8 8 8 9 9 9 9C92.1 Chronic Myelogenous Leukemia (CML) 4 4 4 5 6 7 10 4 4 4 5 6 6 7
Estimate Std. Err. Z Pr > |Z| Difference p-value
Estimate Std. Err. Z Pr > |Z| Difference p-value
0.0795 0.0292 2.72 0.0065 0.0799 0.0221 3.62 0.0003
N_APP_1948_t -0.0230 0.0066 -3.51 0.0005 -0.0325 0.0060 -5.41 <.0001 -0.0895 0.0399 -2.25 0.0247 -0.0699 0.0306 -2.29 0.0222
N_PRI_1948_t -0.0183 0.0108 -1.70 0.0893 -0.0266 0.0070 -3.82 0.0001N_STD_1948_t -0.0308 0.0088 -3.50 0.0005 -0.0505 0.0154 -3.28 0.0011 -0.0950 0.0394 -2.41 0.0159 -0.0777 0.0317 -2.45 0.0141
N_APP_1948_t-4 -0.0252 0.0059 -4.25 <.0001 -0.0333 0.0054 -6.19 <.0001N_APP_t-4_t -0.0152 0.0085 -1.79 0.0728 -0.0487 0.0077 -6.35 <.0001 -0.1020 0.0411 -2.48 0.0130 -0.0283 0.0391 -0.72 0.4695
N_APP_1948_t -0.0340 0.0057 -5.98 <.0001N_APP_t_t+4 0.0076 0.0084 0.90 0.3677 -0.0528 0.0285 -1.85 0.0643
N_APP_1948_t-4 -0.0337 0.0059 -5.71 <.0001N_APP_t-4_t -0.0483 0.0079 -6.14 <.0001N_APP_t_t+4 0.0026 0.0097 0.27 0.7890 -0.0248 0.0355 -0.70 0.4845Note: all models include ln(CASES), AGE_DIAG, and cancer‐site fixed effects; estimates of these parameters are not shown to conserve space. denotes the difference between initial and final year fixed effects, e.g. 1999 ‐ 2014. Standard errors are clustered within cancer sites. Observations are weighted by mean potential years of life lost before age 75.
Model 9
Model 10
Years 1999, 2014 Years 1999, 2010
Table 5a
Weighted least‐squares estimates of models of potential years of life lost before age 75
0.1933
0.0939
0.1532
Model 1
Model 2
Model 3
Model 4
Model 5
Model 6
Model 7
0.4251
0.0912
Model 8
Estimate Std. Err. Z Pr > |Z| Difference p-value
Estimate Std. Err. Z Pr > |Z| Difference p-value
0.1387 0.0281 4.93 <.0001 0.1487 0.0374 3.97 <.0001
N_APP_1948_t -0.0264 0.0055 -4.82 <.0001 -0.0322 0.0058 -5.52 <.0001 -0.0631 0.0481 -1.31 0.1894 -0.0510 0.0377 -1.35 0.1756
N_PRI_1948_t -0.0250 0.0088 -2.85 0.0044 -0.0307 0.0073 -4.19 <.0001N_STD_1948_t -0.0288 0.0097 -2.98 0.0029 -0.0369 0.0150 -2.46 0.0141 -0.0659 0.0473 -1.39 0.1634 -0.0543 0.0425 -1.28 0.2018
N_APP_1948_t-4 -0.0281 0.0052 -5.38 <.0001 -0.0327 0.0055 -5.94 <.0001N_APP_t-4_t -0.0202 0.0069 -2.94 0.0033 -0.0437 0.0080 -5.43 <.0001 -0.0749 0.0499 -1.50 0.1333 -0.0120 0.0518 -0.23 0.8170
N_APP_1948_t -0.0332 0.0059 -5.66 <.0001N_APP_t_t+4 0.0056 0.0104 0.53 0.5941 -0.0360 0.0402 -0.90 0.3696
N_APP_1948_t-4 -0.0332 0.0060 -5.49 <.0001N_APP_t-4_t -0.0434 0.0079 -5.51 <.0001N_APP_t_t+4 0.0028 0.0111 0.25 0.7989 -0.0070 0.0487 -0.14 0.8863
Model 10
0.3209
Note: all models include ln(CASES), AGE_DIAG, and cancer‐site fixed effects; estimates of these parameters are not shown to conserve space. Dd denotes the difference between initial and final year fixed effects, e.g. d1999 ‐ d2014. Standard errors are clustered within cancer sites. Observations are weighted by mean potential years of life lost before age 65.
Model 4 Model 8
0.1280 0.2695
Model 9
Model 2 Model 6
Model 3 Model 7
0.8031 0.7360
Table 5b
Weighted least‐squares estimates of models of potential years of life lost before age 65
Years 1999, 2014 Years 1999, 2010Model 1 Model 5

Parameter Estimate Std. Err. Z Pr > |Z| Difference p-value
-0.0971 0.0557 -1.74 0.0810
N_APP_1948_t 0.0240 0.0087 2.77 0.0056 -0.0158 0.0528 -0.30 0.7654
N_PRI_1948_t 0.0471 0.0098 4.82 <.0001N_STD_1948_t -0.0389 0.0200 -1.94 0.0519 -0.0294 0.0491 -0.60 0.5501
N_APP_1948_t-4 0.0353 0.0093 3.78 0.0002N_APP_t-4_t 0.0212 0.0091 2.33 0.0200 -0.0443 0.0569 -0.78 0.4362
N_APP_1948_t-8 0.0257 0.0089 2.88 0.0040N_APP_t-8_t 0.0214 0.0100 2.14 0.0327 -0.0301 0.0594 -0.51 0.6121
Note: all models include ln(CASES), ln(SURV_EXP/(1 – SURV_EXP)), and cancer‐site fixed effects; estimates of these parameters are not shown to conserve space. Standard errors are clustered within cancer sites. Observations are weighted by number of patients diagnosed.
Years 2000, 2008
0.0005
0.0003
0.4546
Model 1
Model 2
Model 3
Model 4
Model 5
Table 6
Weighted least‐squares estimates of models of the observed 5‐year survival rate (eq. (10))

Parameter Estimate Std. Err. Z Pr > |Z| Difference p-value
0.3913 0.0741 5.28 <.0001
N_APP_1948_t -0.0195 0.0110 -1.77 0.0769 0.2789 0.0801 3.48 0.0005
N_PRI_1948_t -0.0351 0.0301 -1.17 0.2439N_STD_1948_t 0.0037 0.04 0.09 0.9268 0.2838 0.078 3.64 0.0003
N_APP_1948_t-4 -0.0224 0.0101 -2.22 0.0265N_APP_t-4_t 0.0211 0.0243 0.87 0.3848 0.2293 0.0859 2.67 0.0076
N_APP_1948_t-8 -0.0291 0.0124 -2.34 0.0192N_APP_t-8_t -0.0028 0.0125 -0.23 0.8213 0.2115 0.0947 2.23 0.0256
Note: all models include ln(CASES), AGE_DIAG, and cancer‐site fixed effects; estimates of these parameters are not shown to conserve space. Standard errors are clustered within cancer sites. Observations are weighted by mean number of hospital days.
0.0610
Years 1997, 2013Model 1
Model 2
Model 4
Model 3
Model 5
0.0854
0.5592
Weighted least‐squares estimates of models of the number of hospital days (eq. (11))
Table 7
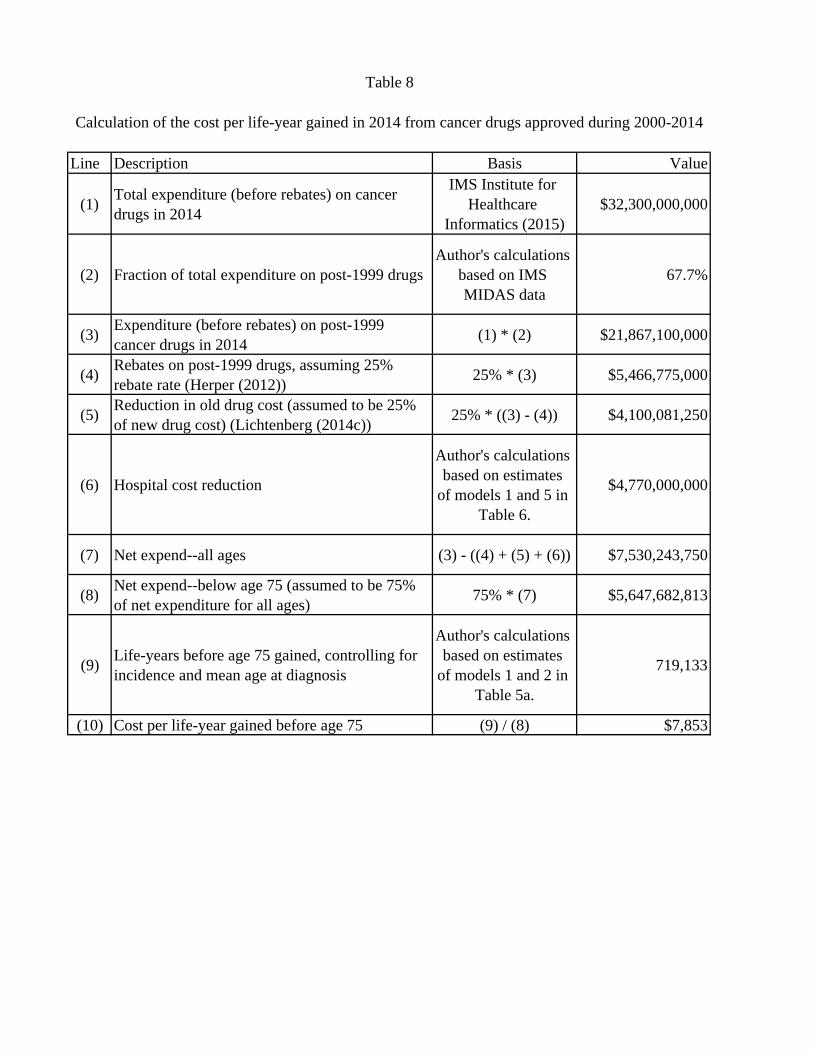
Line Description Basis Value
(1) Total expenditure (before rebates) on cancer drugs in 2014
IMS Institute for Healthcare
Informatics (2015)$32,300,000,000
(2) Fraction of total expenditure on post-1999 drugsAuthor's calculations
based on IMS MIDAS data
67.7%
(3) Expenditure (before rebates) on post-1999 cancer drugs in 2014 (1) * (2) $21,867,100,000
(4) Rebates on post-1999 drugs, assuming 25% rebate rate (Herper (2012)) 25% * (3) $5,466,775,000
(5) Reduction in old drug cost (assumed to be 25% of new drug cost) (Lichtenberg (2014c)) 25% * ((3) - (4)) $4,100,081,250
(6) Hospital cost reduction
Author's calculations based on estimates
of models 1 and 5 in Table 6.
$4,770,000,000
(7) Net expend--all ages (3) - ((4) + (5) + (6)) $7,530,243,750
(8) Net expend--below age 75 (assumed to be 75% of net expenditure for all ages) 75% * (7) $5,647,682,813
(9) Life-years before age 75 gained, controlling for incidence and mean age at diagnosis
Author's calculations based on estimates
of models 1 and 2 in Table 5a.
719,133
(10) Cost per life-year gained before age 75 (9) / (8) $7,853
Table 8
Calculation of the cost per life-year gained in 2014 from cancer drugs approved during 2000-2014
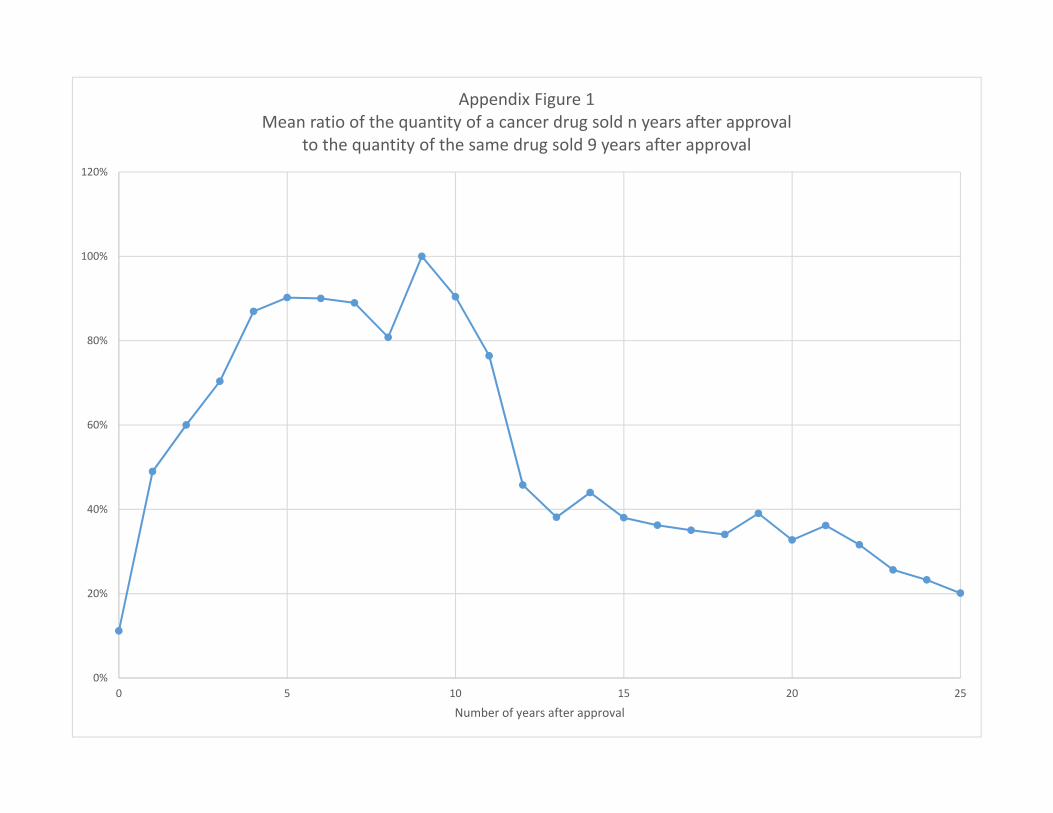
0%
20%
40%
60%
80%
100%
120%
0 5 10 15 20 25
Number of years after approval
Appendix Figure 1Mean ratio of the quantity of a cancer drug sold n years after approval
to the quantity of the same drug sold 9 years after approval