Embed Size (px)
Citation preview
How Cities Network, Learn and Innovate
Woodrow Wilson Center 24 May 2012
Tim Campbell, PhD
Chairman, Urban Age Institute
5/24/2012 Tim Campbell, PhD. Urban Age Institute
2
Content
Beyond Smart Cities Project
A shadow market--Why City Learning?
Gaps in the Literature
Survey of City Learners
Working Hypotheses
Findings and Conclusions
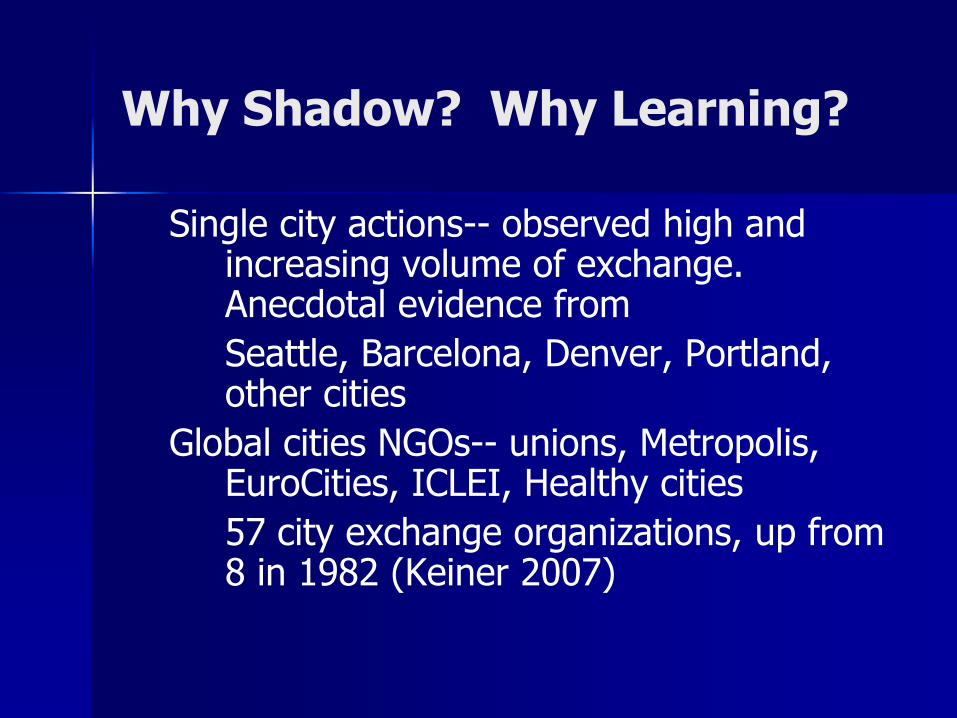
Why Shadow? Why Learning?
Single city actions-- observed high and increasing volume of exchange. Anecdotal evidence from
Seattle, Barcelona, Denver, Portland, other cities
Global cities NGOs-- unions, Metropolis, EuroCities, ICLEI, Healthy cities
57 city exchange organizations, up from 8 in 1982 (Keiner 2007)
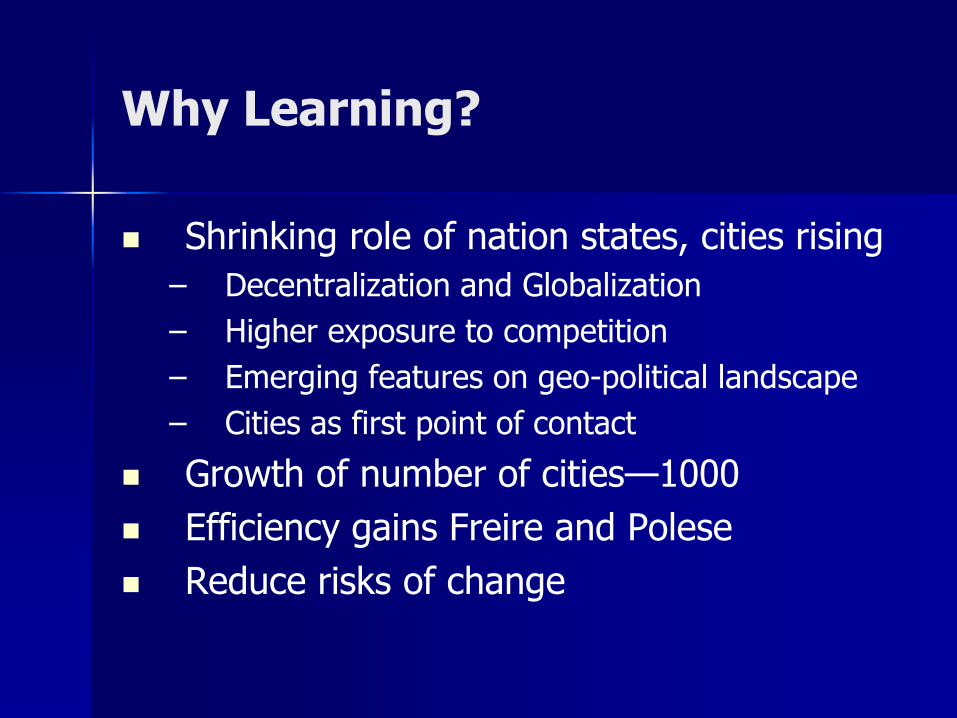
Why Learning?
Shrinking role of nation states, cities rising
– Decentralization and Globalization
– Higher exposure to competition
– Emerging features on geo-political landscape
– Cities as first point of contact
Growth of number of cities—1000
Efficiency gains Freire and Polese
Reduce risks of change
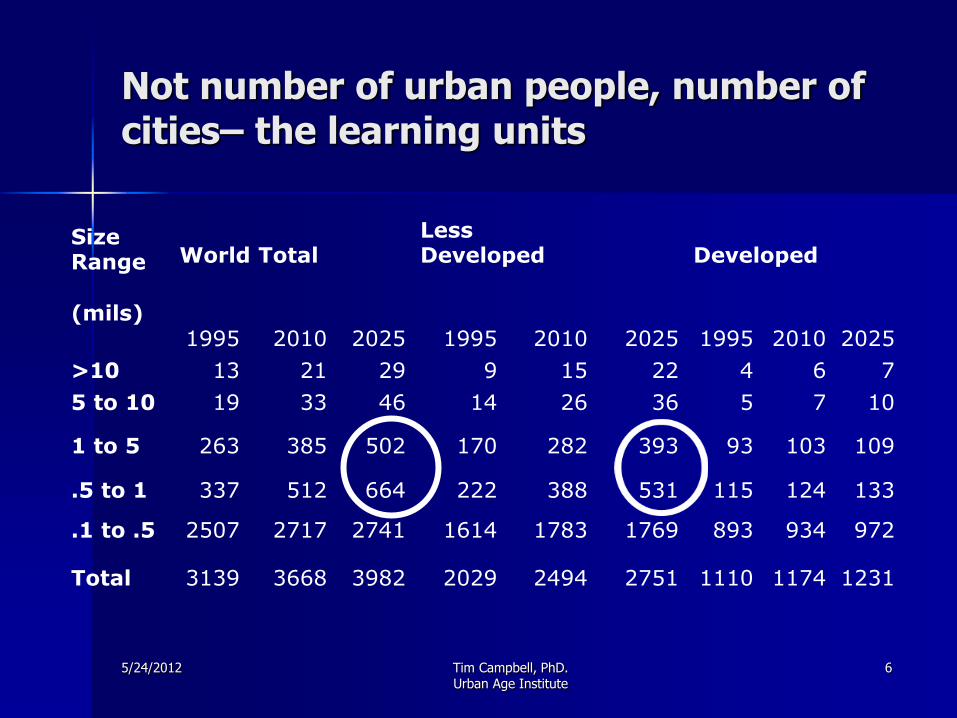
Not number of urban people, number of cities– the learning units
Size Range
(mils)
World Total Less Developed Developed
1995 2010 2025 1995 2010 2025 1995 2010 2025
>10 13 21 29 9 15 22 4 6 7
5 to 10 19 33 46 14 26 36 5 7 10
1 to 5 263 385 502 170 282 393 93 103 109
.5 to 1 337 512 664 222 388 531 115 124 133
.1 to .5 2507 2717 2741 1614 1783 1769 893 934 972
Total 3139 3668 3982 2029 2494 2751 1110 1174 1231
5/24/2012 Tim Campbell, PhD. Urban Age Institute
6
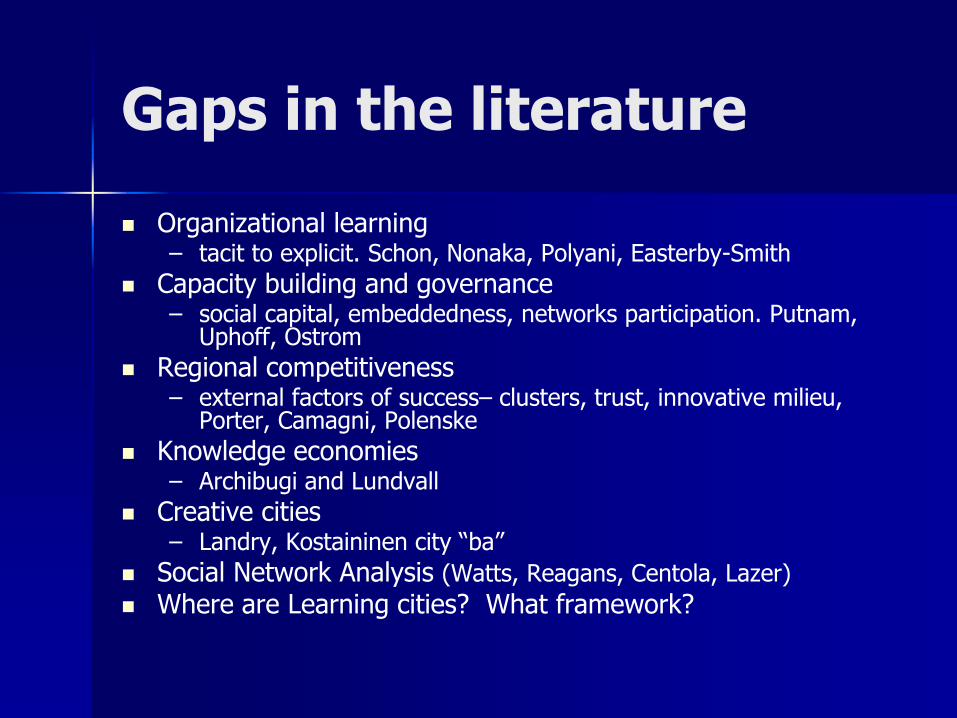
Gaps in the literature
Organizational learning – tacit to explicit. Schon, Nonaka, Polyani, Easterby-Smith
Capacity building and governance – social capital, embeddedness, networks participation. Putnam,
Uphoff, Ostrom
Regional competitiveness – external factors of success– clusters, trust, innovative milieu,
Porter, Camagni, Polenske
Knowledge economies – Archibugi and Lundvall
Creative cities – Landry, Kostaininen city “ba”
Social Network Analysis (Watts, Reagans, Centola, Lazer)
Where are Learning cities? What framework?
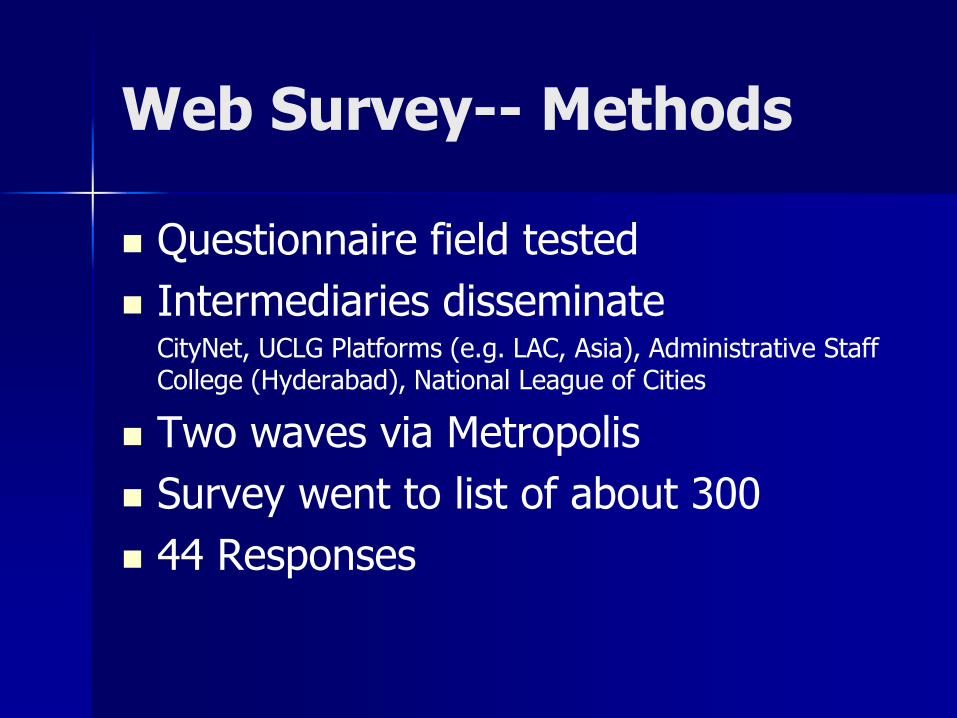
Web Survey-- Methods
Questionnaire field tested
Intermediaries disseminate CityNet, UCLG Platforms (e.g. LAC, Asia), Administrative Staff
College (Hyderabad), National League of Cities
Two waves via Metropolis
Survey went to list of about 300
44 Responses
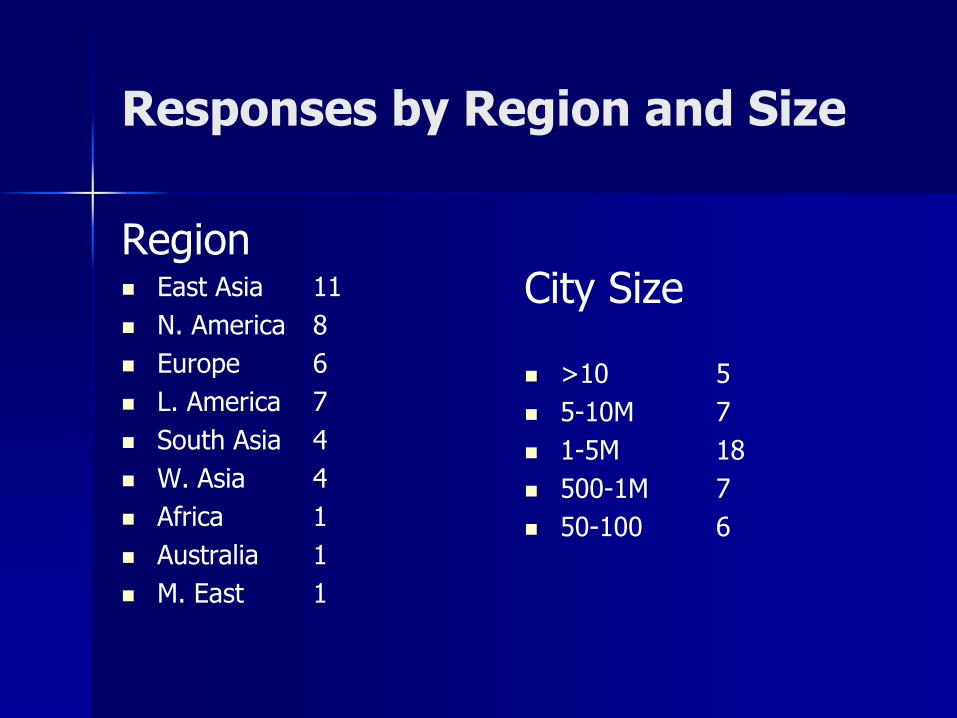
Responses by Region and Size
Region East Asia 11
N. America 8
Europe 6
L. America 7
South Asia 4
W. Asia 4
Africa 1
Australia 1
M. East 1
City Size
>10 5
5-10M 7
1-5M 18
500-1M 7
50-100 6
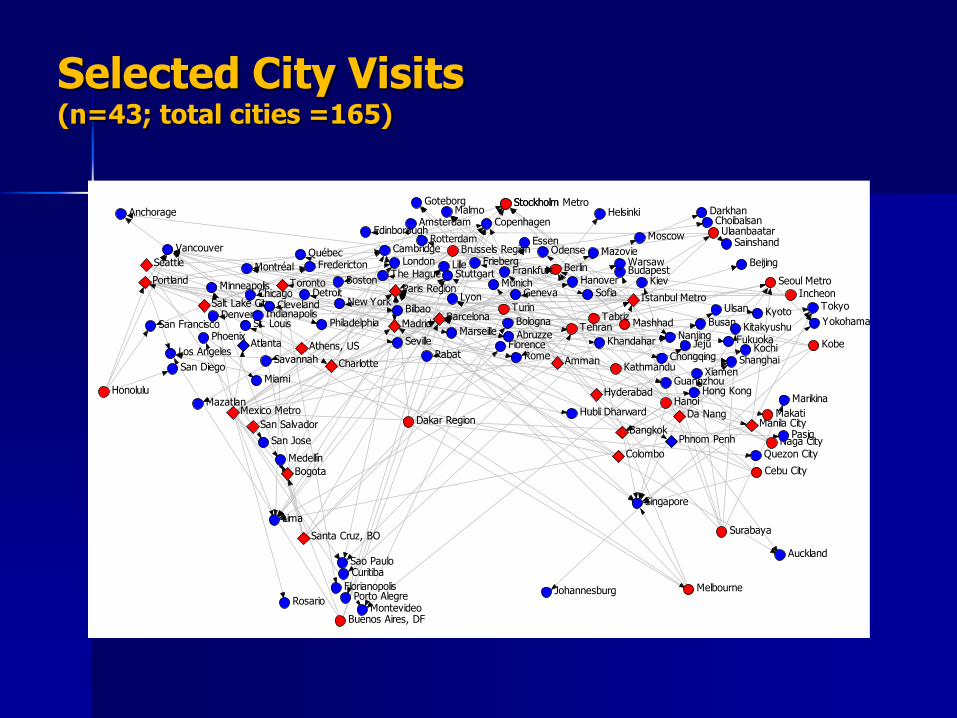
Selected City Visits (n=43; total cities =165)
Amman
Athens, US
Bangkok
Barcelona
Berlin
Bogota
Brussels Region
Buenos Aires, DF
Cebu City
Charlotte
Colombo
Da NangDakar Region
HanoiHonolulu Hyderabad
IncheonIstanbul Metro
Kathmandu
Kobe
Madrid
Manila City
Mashhad
Melbourne
Mexico Metro
Naga City
Paris Region
Phnom Penh
Portland
Salt Lake City
San Salvador
Santa Cruz, BO
Seattle
Seoul Metro
Stockholm
Surabaya
TabrizTehran
Toronto
Turin
Ulaanbaatar
Abruzze
AmsterdamAnchorage
Atlanta
Auckland
Beijing
BilbaoBologna
BostonBudapest
Busan
Cambridge
Chicago
Choibalsan
Chongqing
Cleveland
Copenhagen
Curitiba
Darkhan
Denver
Detroit
EdinboroughEssen
Florence
Florianopolis
FrankfurtFredericton Frieberg
Fukuoka
Geneva
Goteborg
Guangzhou
Hanover
Helsinki
Hong Kong
Hubli Dharward
Indianapolis
Jeju
Johannesburg
Khandahar
Kiev
Kitakyushu
Kochi
Kyoto
Lille
Lima
London
Los Angeles
Lyon
Makati
Malmo
Marikina
Marseille
Mazatlan
Mazovie
Medellín
Miami
Minneapolis
Montevideo
Montréal
Moscow
Munich
Nanjing
New York
Odense
Pasig
Philadelphia
Phoenix
Porto Alegre
Québec
Quezon City
Rabat Rome
Rosario
Rotterdam Sainshand
San Diego
San Francisco
San Jose
Sao Paulo
Savannah
Stockholm Metro
Seville
Shanghai
Singapore
Sofia
St. Louis
StuttgartThe Hague
TokyoUlsan
Vancouver
Warsaw
Xiamen
Yokohama
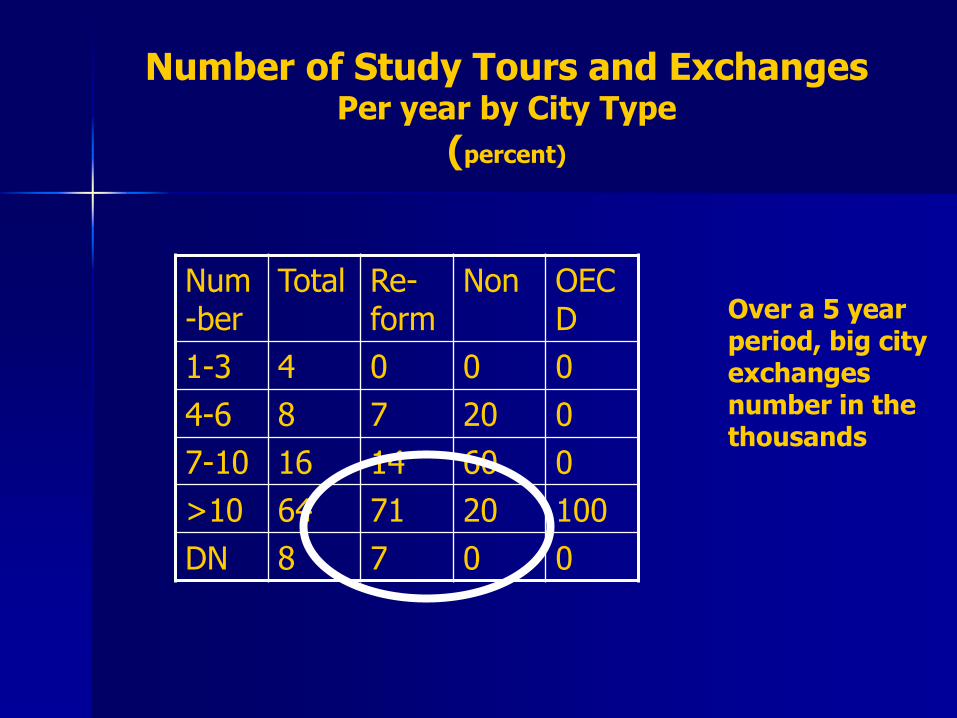
Number of Study Tours and Exchanges Per year by City Type
(percent)
Num-ber
Total Re-form
Non OECD
1-3 4 0 0 0
4-6 8 7 20 0
7-10 16 14 60 0
>10 64 71 20 100
DN 8 7 0 0
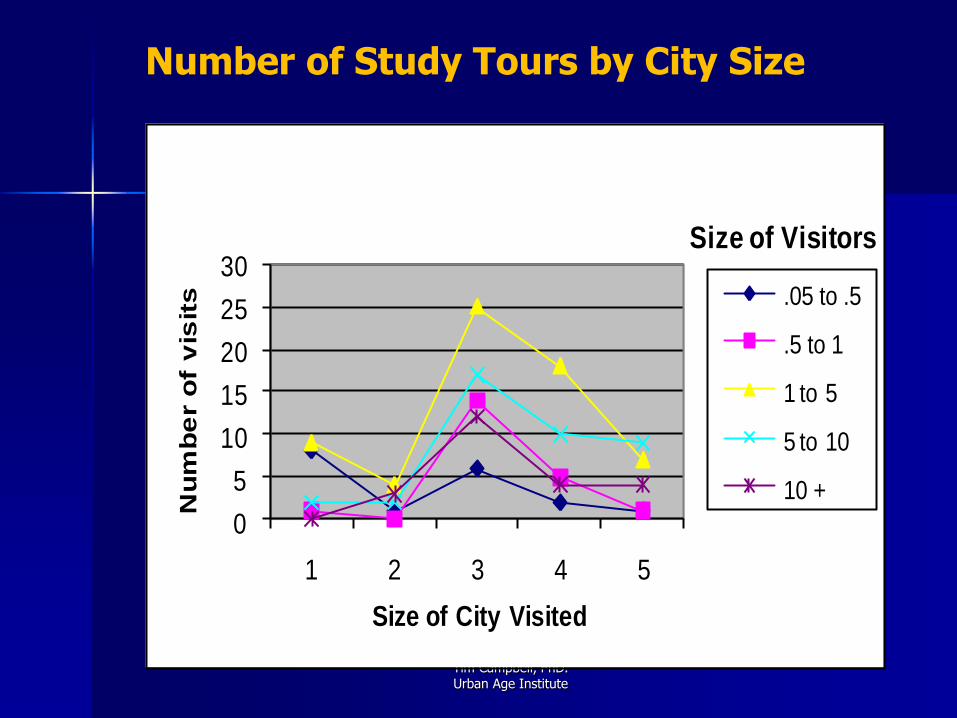
Over a 5 year period, big city exchanges number in the thousands
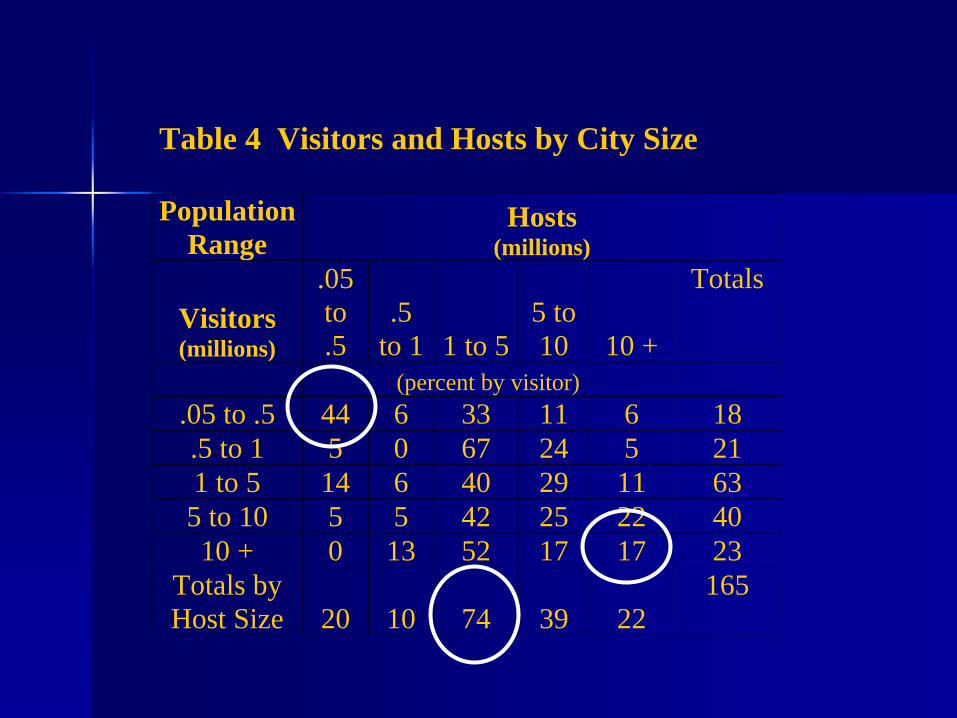
Table 4 Visitors and Hosts by City Size
Population
Range Hosts
(millions)
Visitors (millions)
.05
to
.5
.5
to 1 1 to 5
5 to
10 10 +
Totals
(percent by visitor)
.05 to .5 44 6 33 11 6 18
.5 to 1 5 0 67 24 5 21
1 to 5 14 6 40 29 11 63
5 to 10 5 5 42 25 22 40
10 + 0 13 52 17 17 23
Totals by
Host Size 20 10 74 39 22
165
Tim Campbell, PhD. Urban Age Institute
Number of Study Tours by City Size
0
5
10
15
20
25
30
1 2 3 4 5
Nu
mb
er o
f v
isit
s
Size of City Visited
Size of Visitors
.05 to .5
.5 to 1
1 to 5
5 to 10
10 +
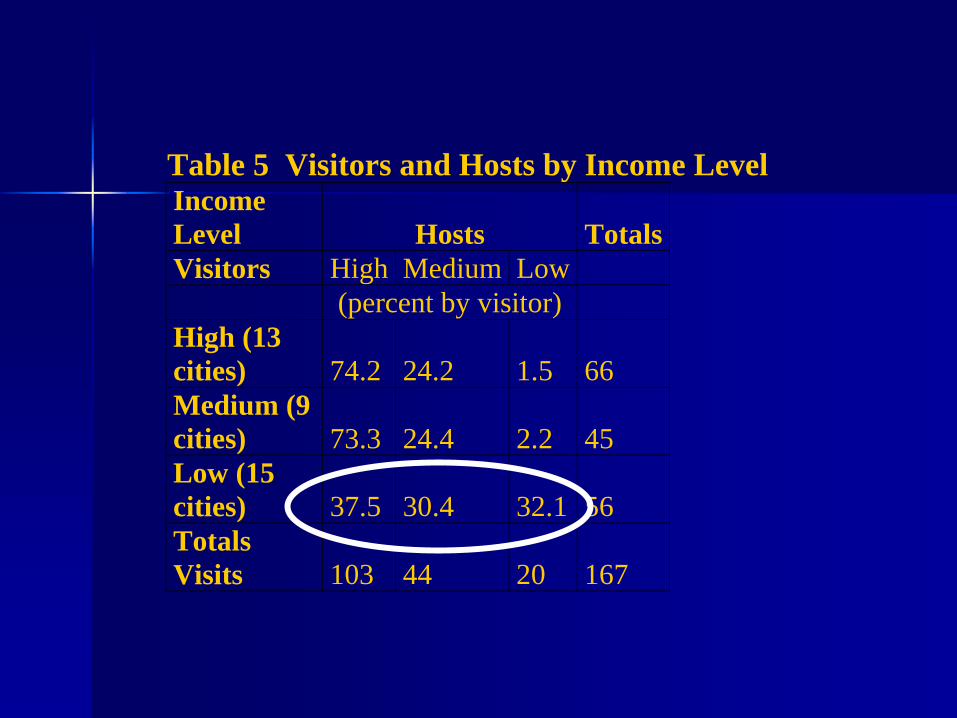
Table 5 Visitors and Hosts by Income Level Income
Level Hosts Totals
Visitors High Medium Low
(percent by visitor)
High (13
cities) 74.2 24.2 1.5 66
Medium (9
cities) 73.3 24.4 2.2 45
Low (15
cities) 37.5 30.4 32.1 56
Totals
Visits 103 44 20 167
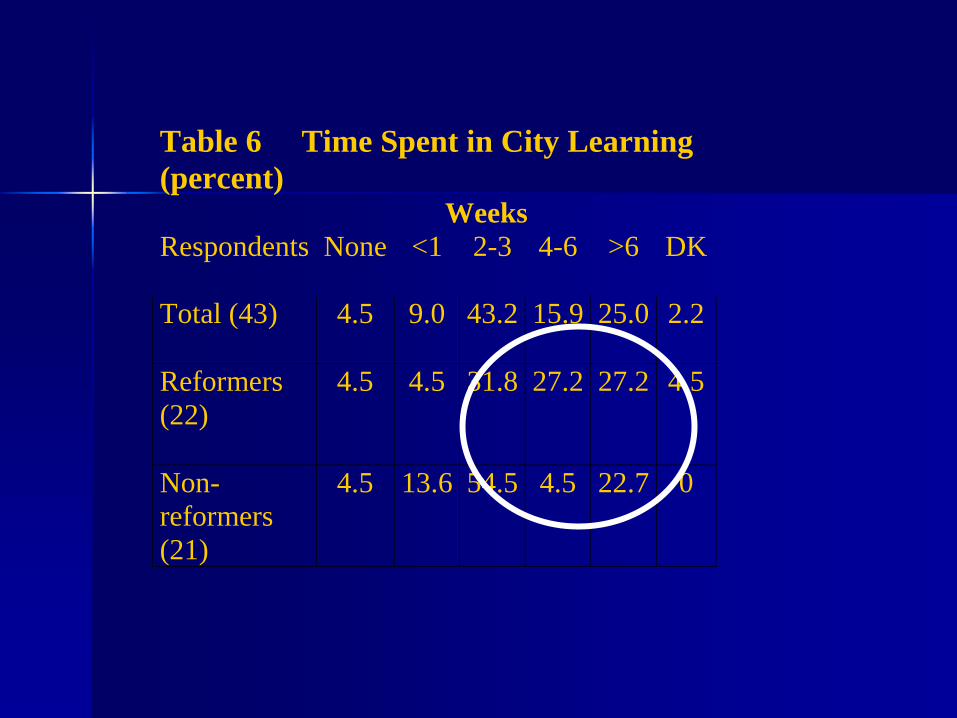
Table 6 Time Spent in City Learning
(percent) Weeks
Respondents None <1 2-3 4-6 >6 DK
Total (43)
4.5 9.0 43.2 15.9 25.0 2.2
Reformers
(22)
4.5 4.5 31.8 27.2 27.2 4.5
Non-
reformers
(21)
4.5 13.6 54.5 4.5 22.7 0
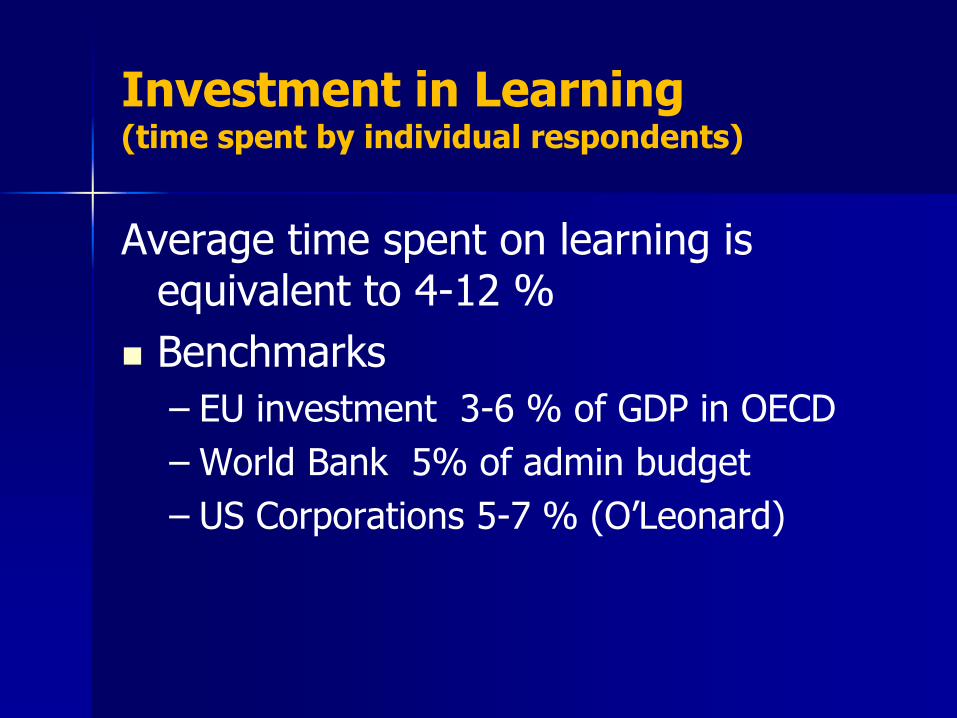
Investment in Learning (time spent by individual respondents)
Average time spent on learning is equivalent to 4-12 %
Benchmarks
– EU investment 3-6 % of GDP in OECD
– World Bank 5% of admin budget
– US Corporations 5-7 % (O’Leonard)
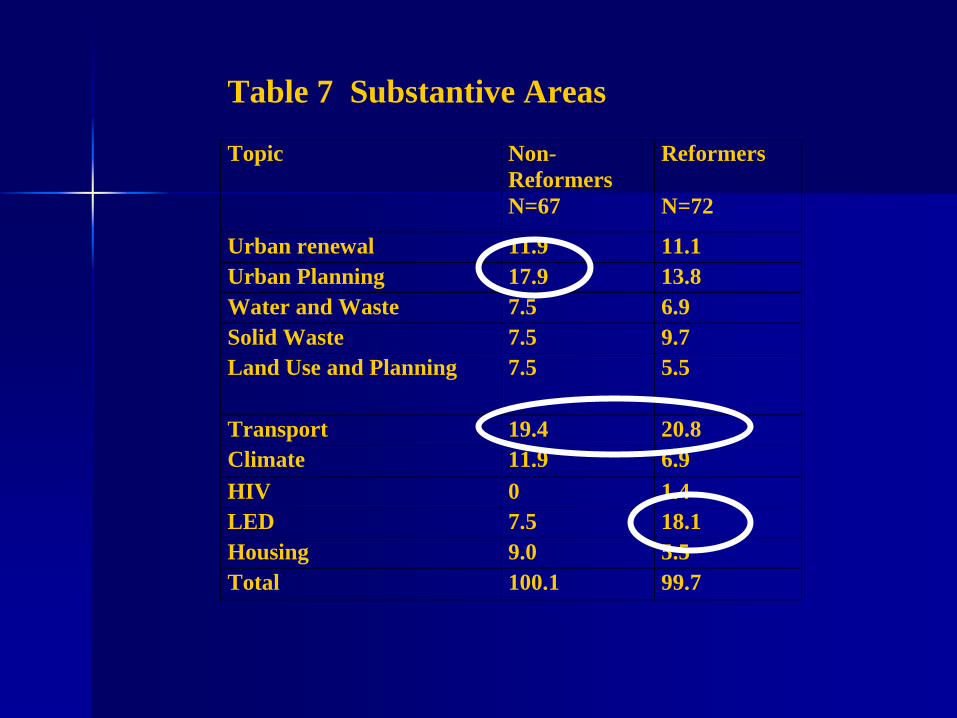
Table 7 Substantive Areas Topic Non-
Reformers
N=67
Reformers
N=72
Urban renewal 11.9 11.1
Urban Planning 17.9 13.8
Water and Waste 7.5 6.9
Solid Waste 7.5 9.7
Land Use and Planning 7.5 5.5
Transport 19.4 20.8
Climate 11.9 6.9
HIV 0 1.4
LED 7.5 18.1
Housing 9.0 5.5
Total 100.1 99.7
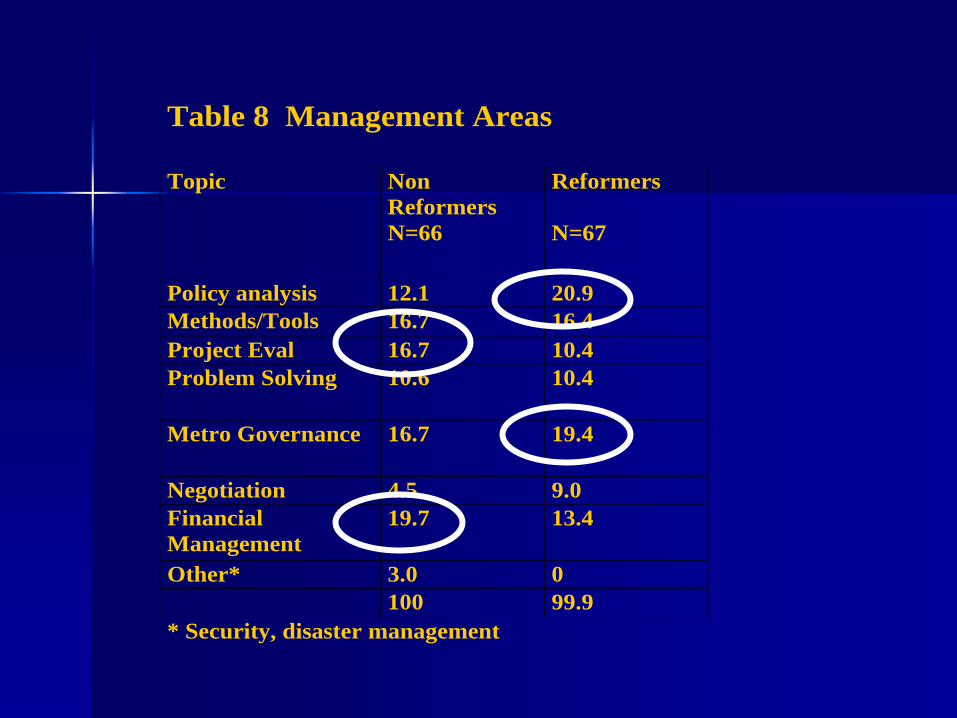
Table 8 Management Areas
Topic Non
Reformers
N=66
Reformers
N=67
Policy analysis 12.1 20.9
Methods/Tools 16.7 16.4
Project Eval 16.7 10.4
Problem Solving 10.6 10.4
Metro Governance 16.7 19.4
Negotiation 4.5 9.0
Financial
Management
19.7 13.4
Other* 3.0 0
100 99.9
* Security, disaster management
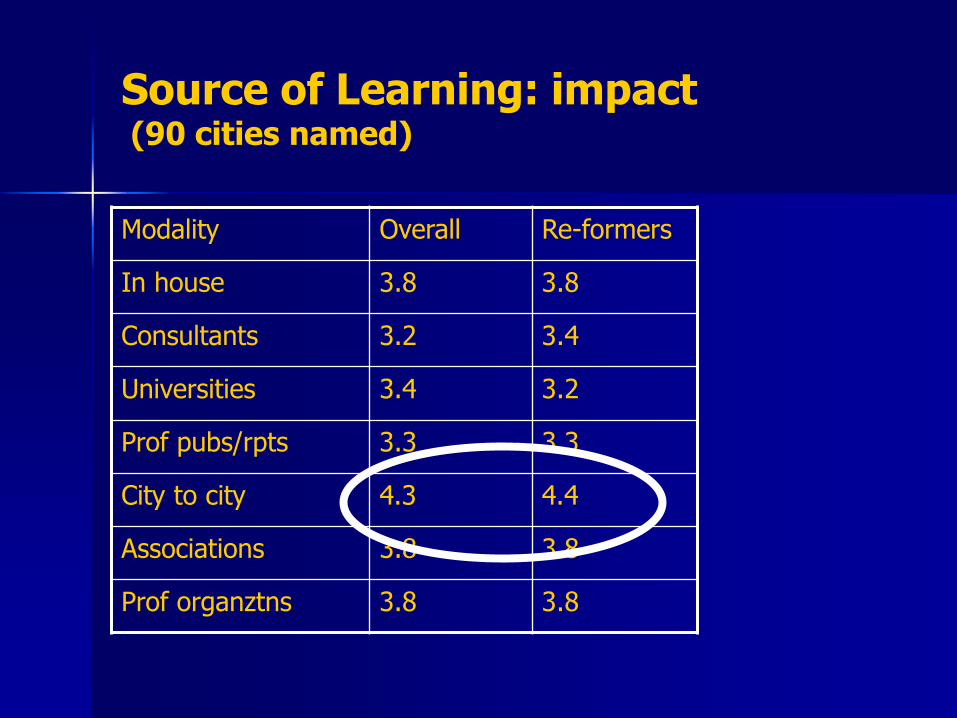
Source of Learning: impact (90 cities named)
Modality Overall Re-formers
In house 3.8 3.8
Consultants 3.2 3.4
Universities 3.4 3.2
Prof pubs/rpts 3.3 3.3
City to city 4.3 4.4
Associations 3.8 3.8
Prof organztns 3.8 3.8
Summing up
Cities are aware of a new, open environment
They are seeking cost-effective ways to learn
They choose learning styles and focusing attention on key areas
Reformers stand out from the pack
5/24/2012 Tim Campbell, PhD. Urban Age Institute
20
Drill down to Cases
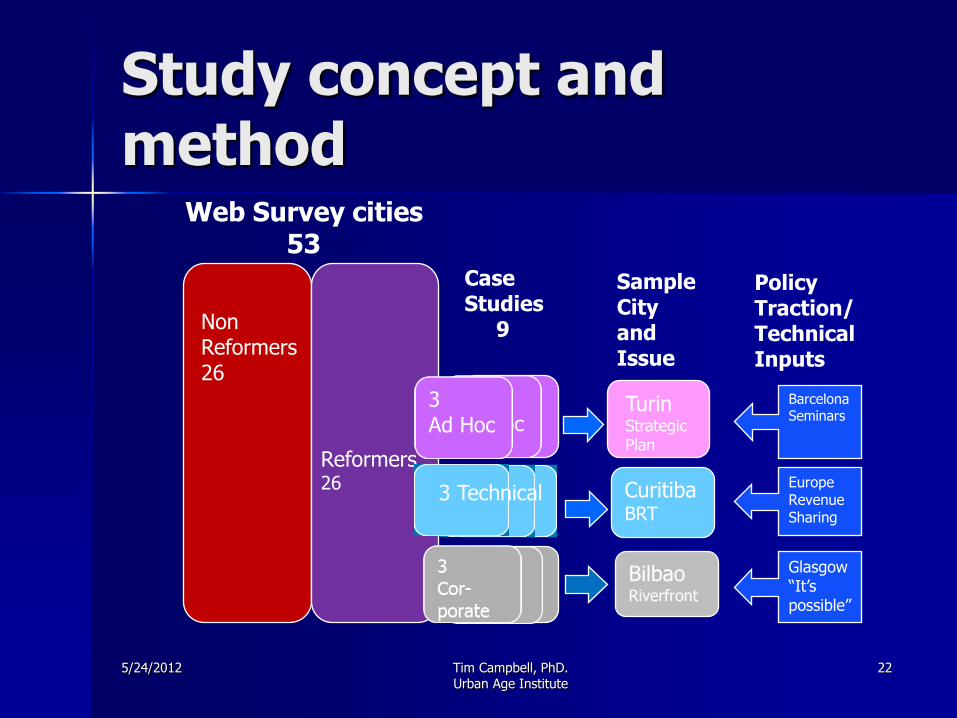
Study concept and method
5/24/2012 Tim Campbell, PhD. Urban Age Institute
22
Bilbao Riverfront
Curitiba BRT
Web Survey cities 53
Non Reformers 26
Turin Strategic Plan
Reformers 26
3 Cor- porate
Case Studies 9
3 Tech
Sample City and Issue
Barcelona Seminars
Policy Traction/ Technical Inputs
Europe Revenue Sharing
Glasgow “It’s possible”
3 Ad Hoc
3 Technical
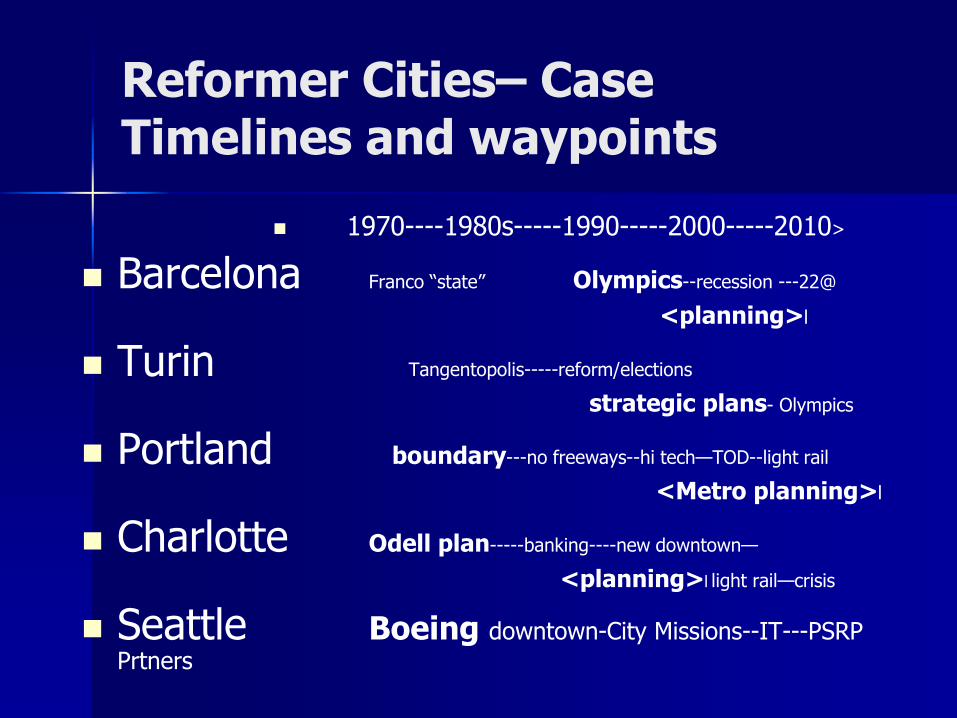
Reformer Cities– Case Timelines and waypoints
1970----1980s-----1990-----2000-----2010>
Barcelona Franco “state” Olympics--recession ---22@
<planning>l
Turin Tangentopolis-----reform/elections
strategic plans- Olympics
Portland boundary---no freeways--hi tech—TOD--light rail
<Metro planning>l
Charlotte Odell plan-----banking----new downtown—
<planning>l light rail—crisis
Seattle Boeing downtown-City Missions--IT---PSRP
Prtners
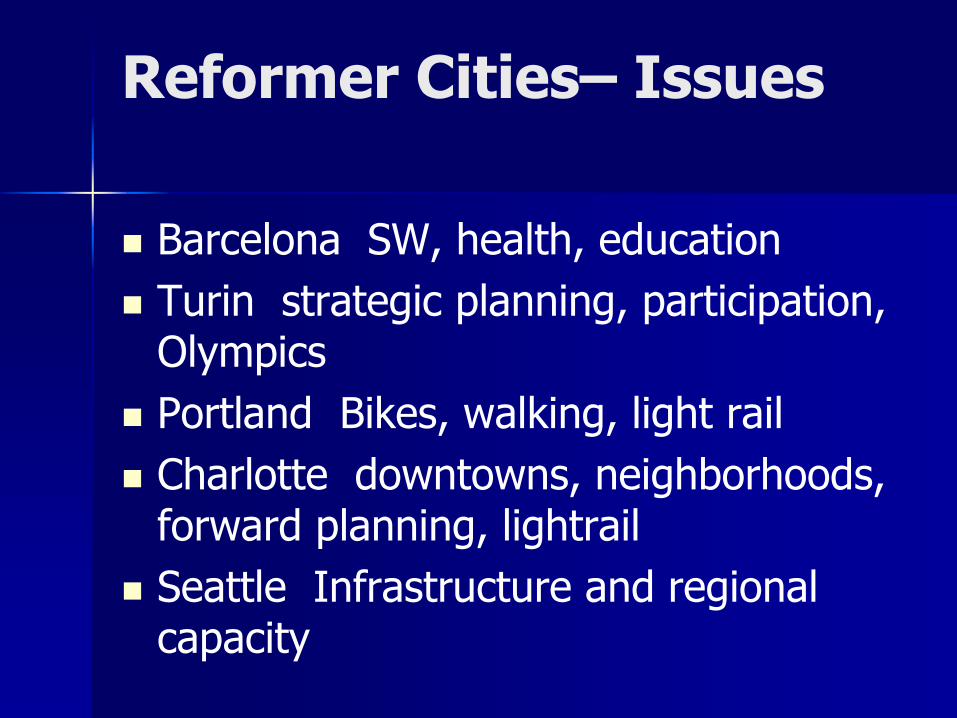
Reformer Cities– Issues
Barcelona SW, health, education
Turin strategic planning, participation, Olympics
Portland Bikes, walking, light rail
Charlotte downtowns, neighborhoods, forward planning, lightrail
Seattle Infrastructure and regional capacity
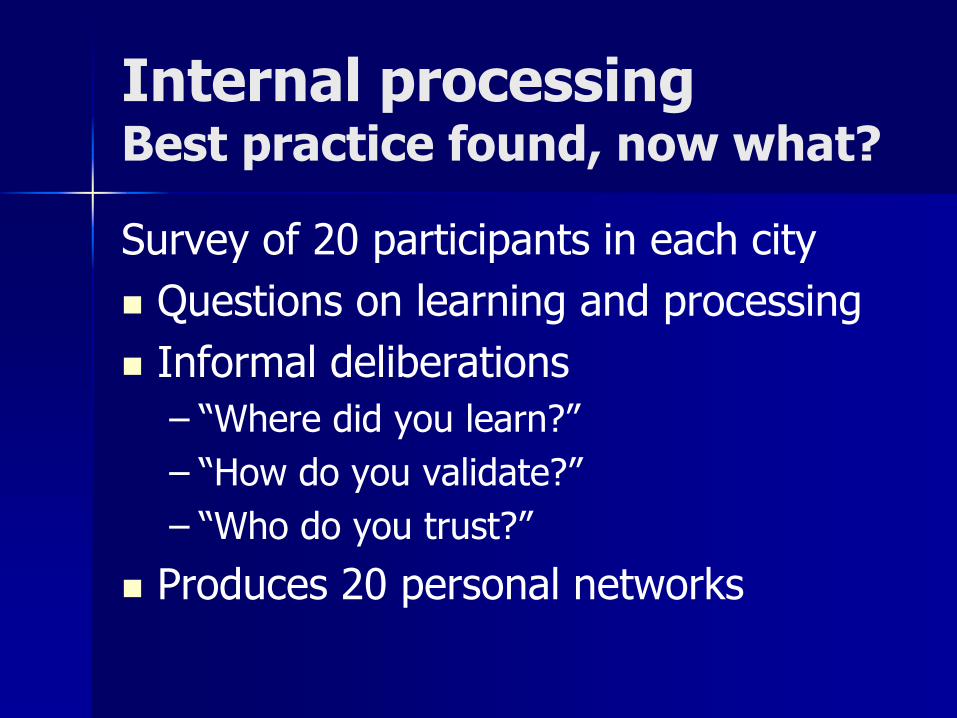
Internal processing Best practice found, now what?
Survey of 20 participants in each city
Questions on learning and processing
Informal deliberations
– “Where did you learn?”
– “How do you validate?”
– “Who do you trust?”
Produces 20 personal networks
What varies in learning?
Knowledge search
Tissue of remembering
Clouds of trust.
Styles of learning
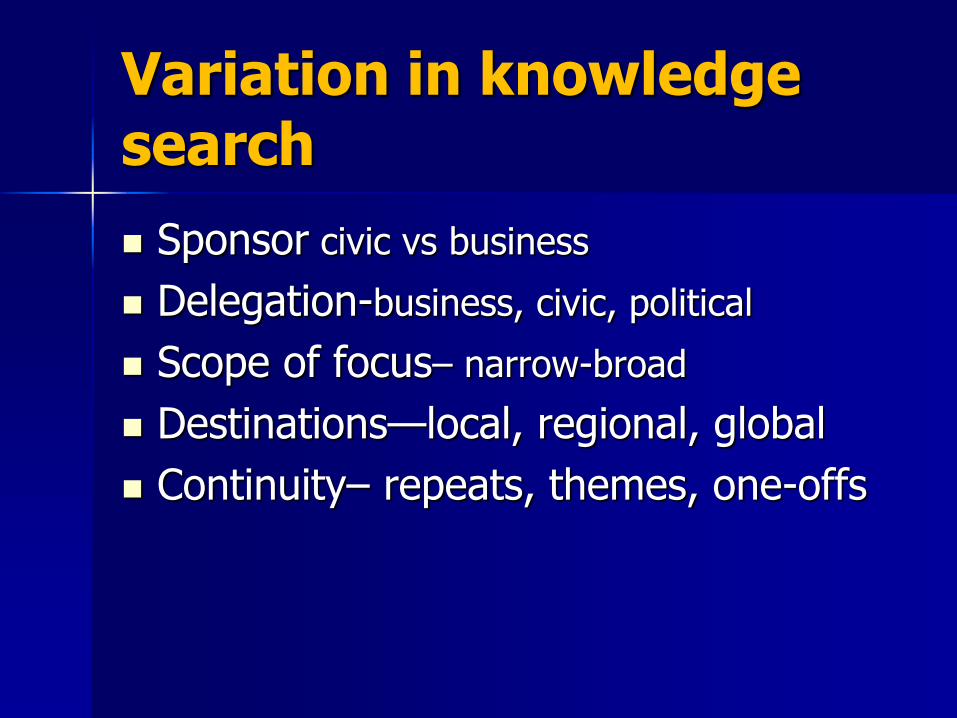
Variation in knowledge search
Sponsor civic vs business
Delegation-business, civic, political
Scope of focus– narrow-broad
Destinations—local, regional, global
Continuity– repeats, themes, one-offs
Tim Campbell, PhD. Urban Age Institute
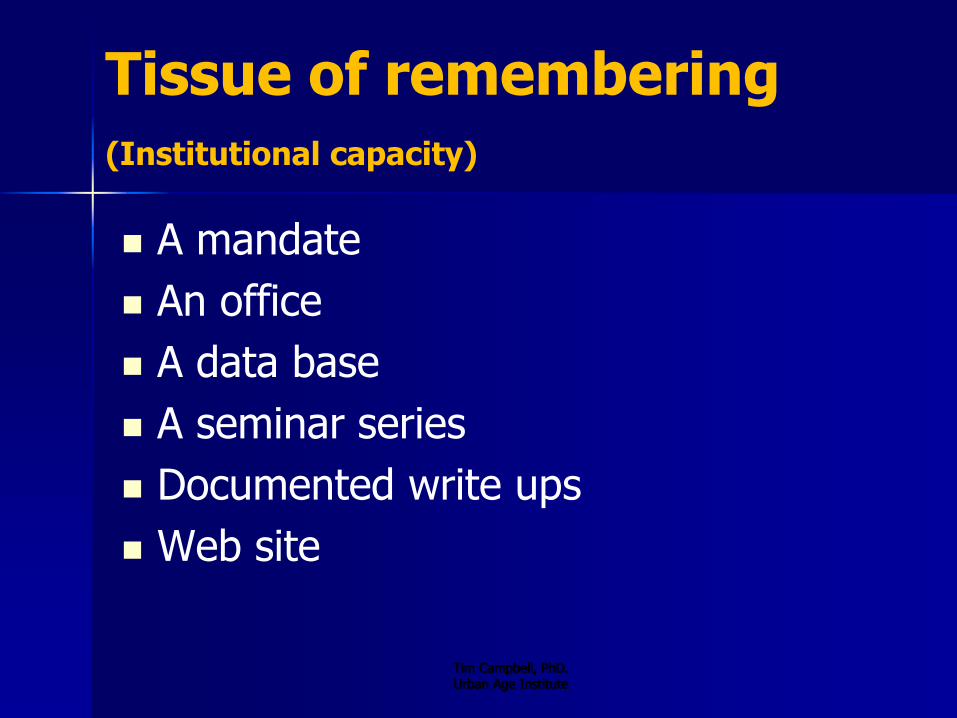
Tissue of remembering (Institutional capacity)
A mandate
An office
A data base
A seminar series
Documented write ups
Web site
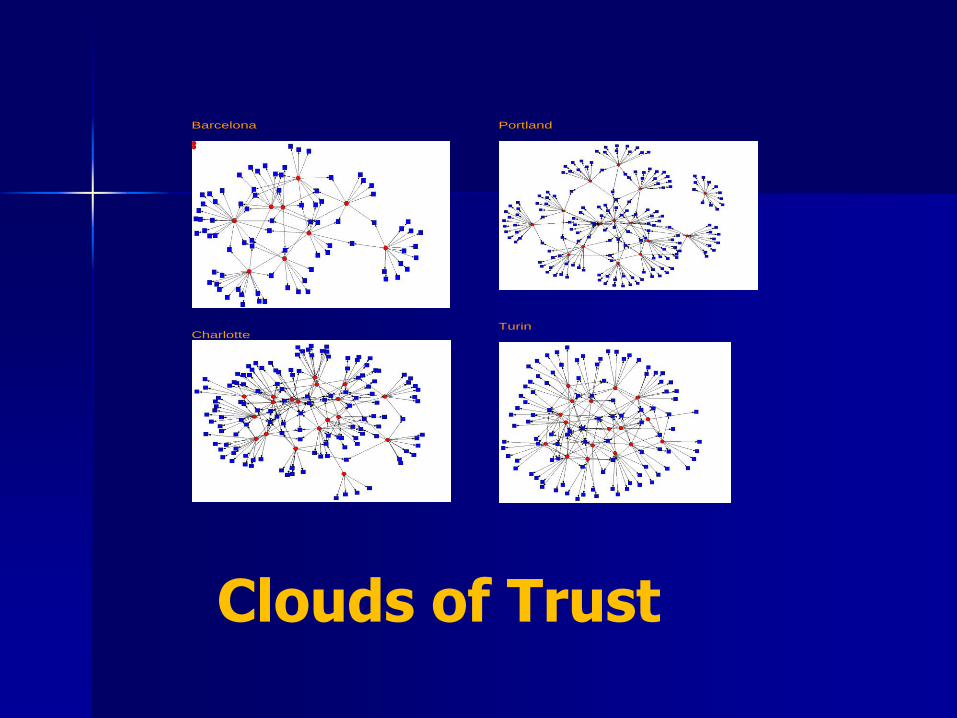
Barcelona
Charlotte
Portland
Turin
Clouds of Trust
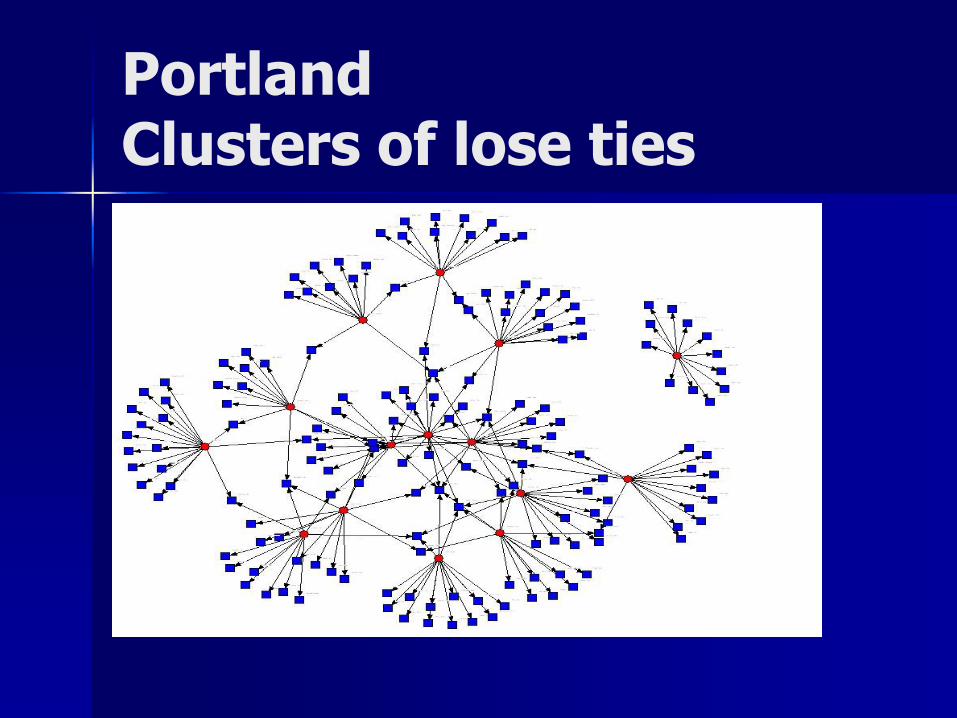
Portland Clusters of lose ties
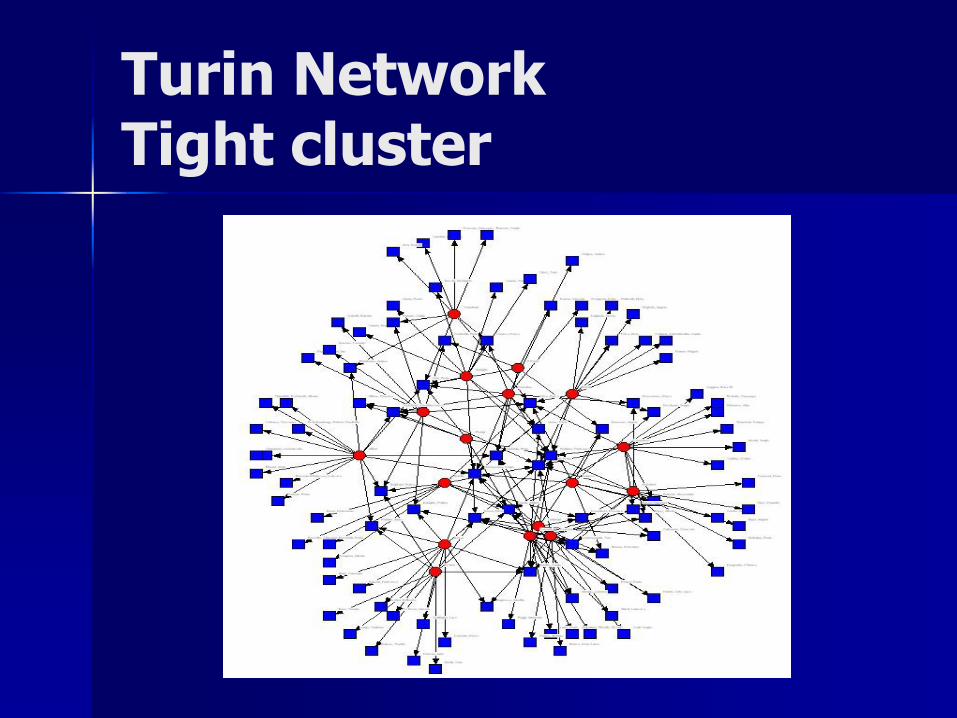
Turin Network Tight cluster
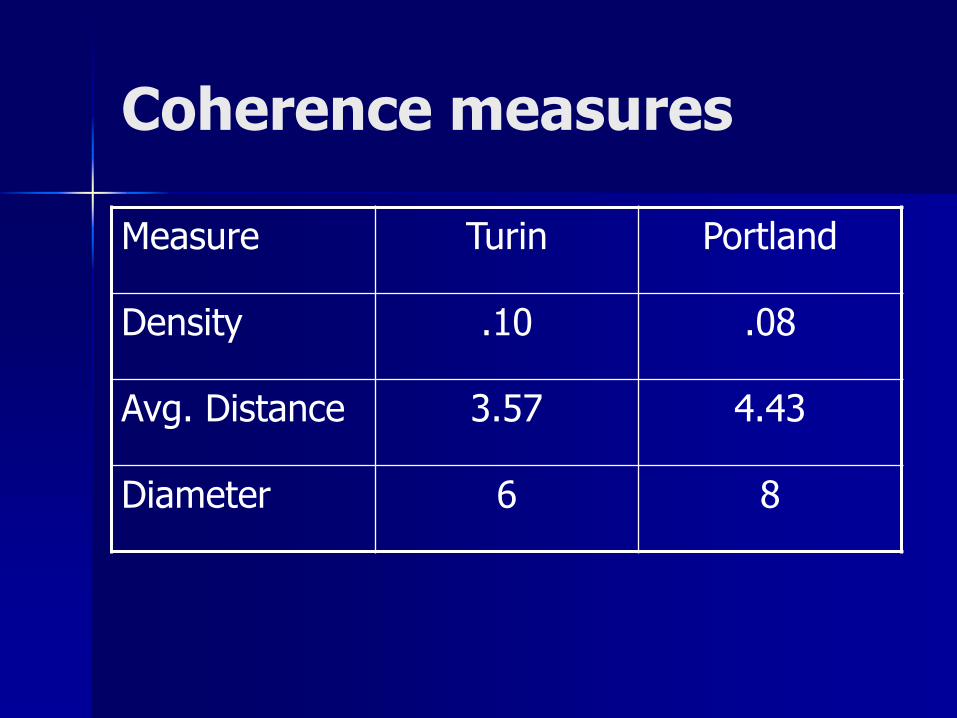
Coherence measures
Measure Turin Portland
Density .10 .08
Avg. Distance 3.57 4.43
Diameter 6 8
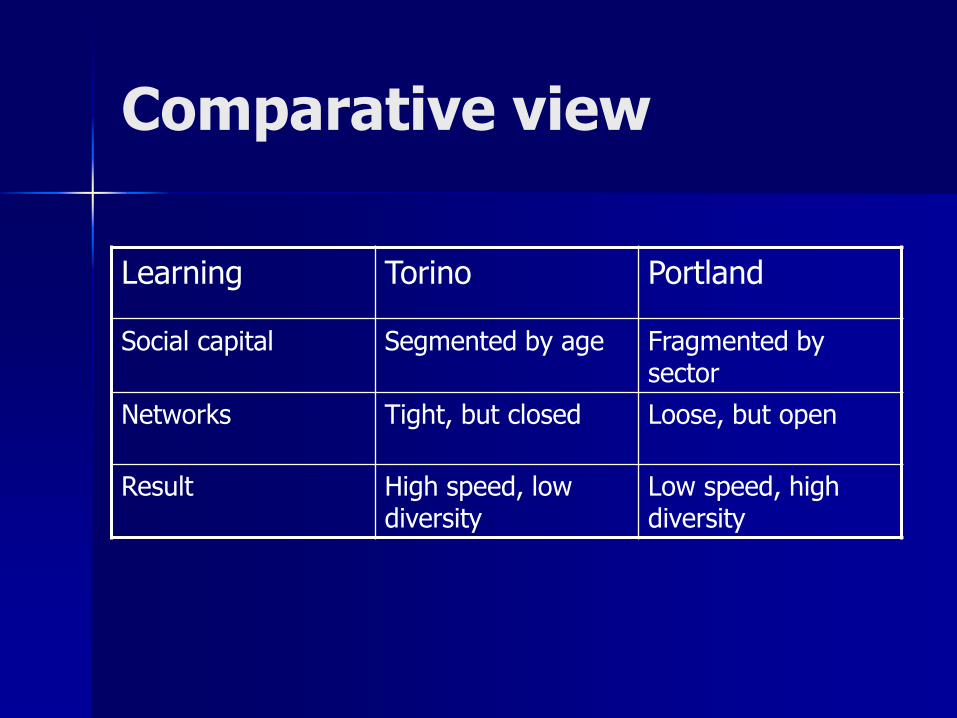
Comparative view
Learning Torino Portland
Social capital Segmented by age Fragmented by sector
Networks Tight, but closed Loose, but open
Result High speed, low diversity
Low speed, high diversity
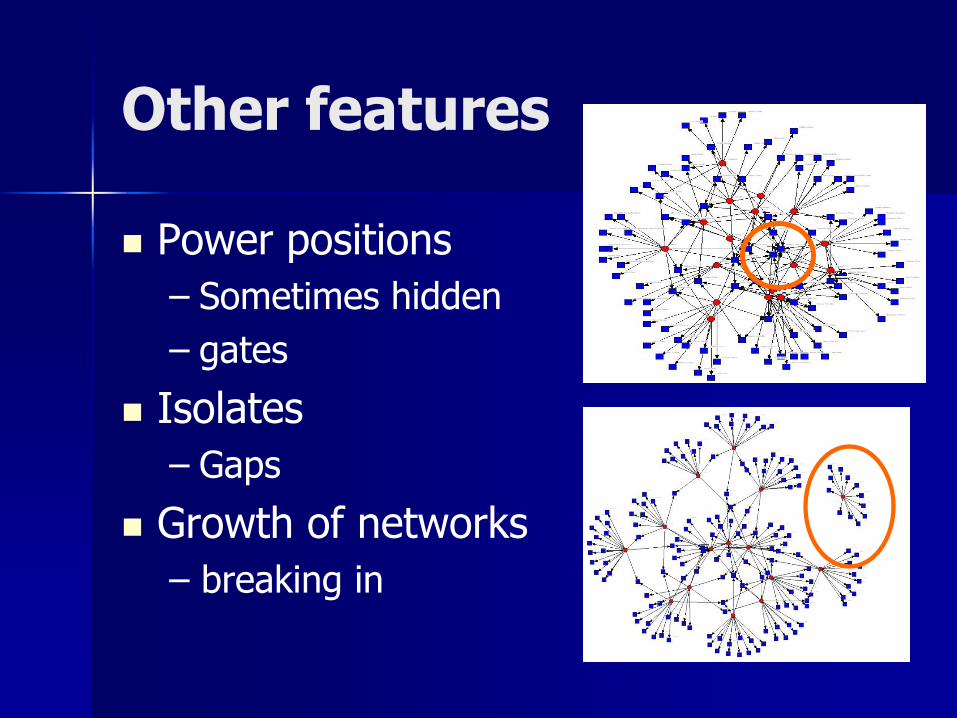
Other features
Power positions
– Sometimes hidden
– gates
Isolates
– Gaps
Growth of networks
– breaking in
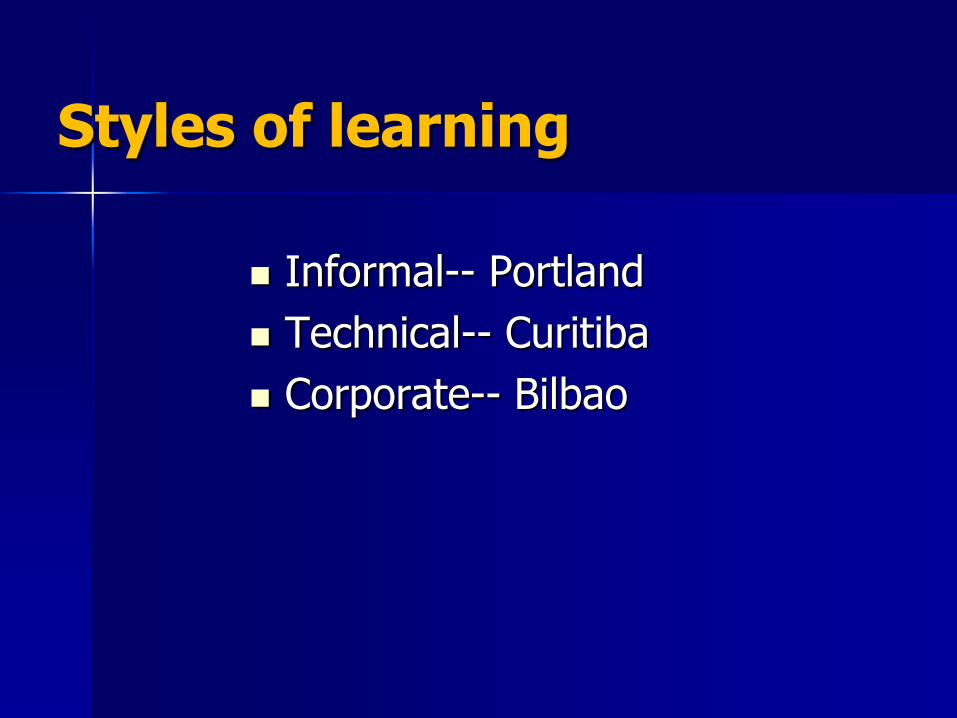
Styles of learning
Informal-- Portland
Technical-- Curitiba
Corporate-- Bilbao
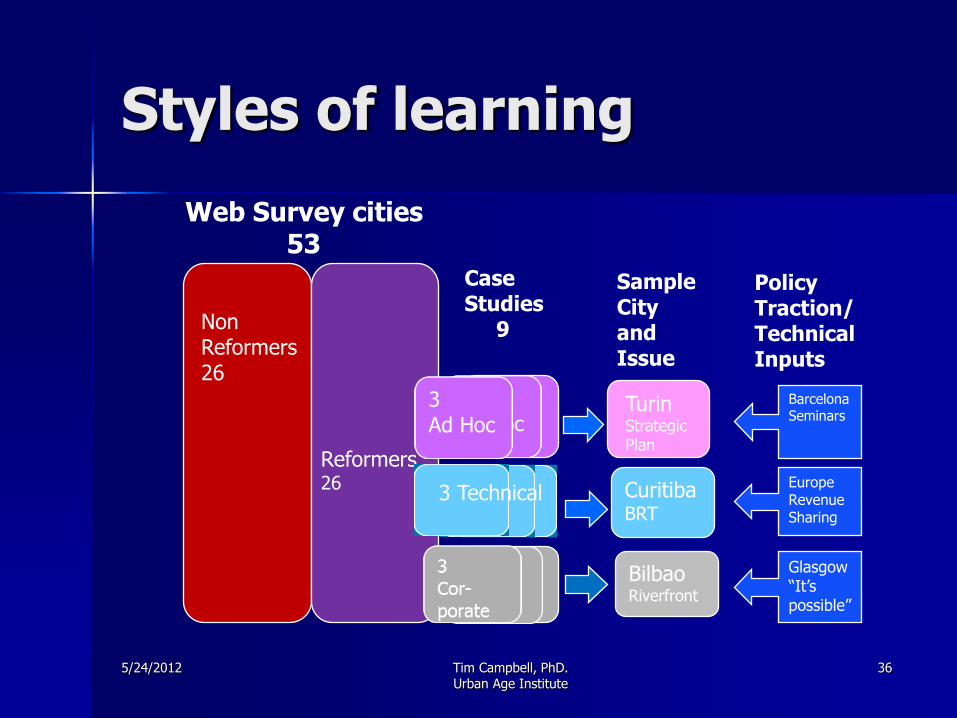
Styles of learning
5/24/2012 Tim Campbell, PhD. Urban Age Institute
36
Bilbao Riverfront
Curitiba BRT
Web Survey cities 53
Non Reformers 26
Turin Strategic Plan
Reformers 26
3 Cor- porate
Case Studies 9
3 Tech
Sample City and Issue
Barcelona Seminars
Policy Traction/ Technical Inputs
Europe Revenue Sharing
Glasgow “It’s possible”
3 Ad Hoc
3 Technical
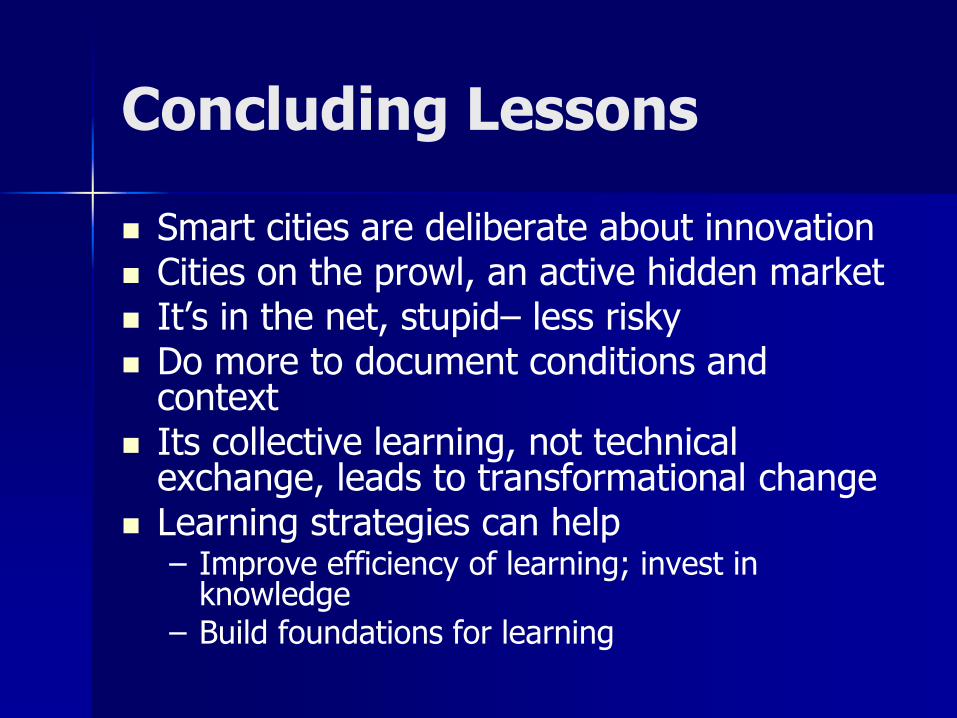
Concluding Lessons
Smart cities are deliberate about innovation Cities on the prowl, an active hidden market It’s in the net, stupid– less risky Do more to document conditions and
context Its collective learning, not technical
exchange, leads to transformational change Learning strategies can help
– Improve efficiency of learning; invest in knowledge
– Build foundations for learning
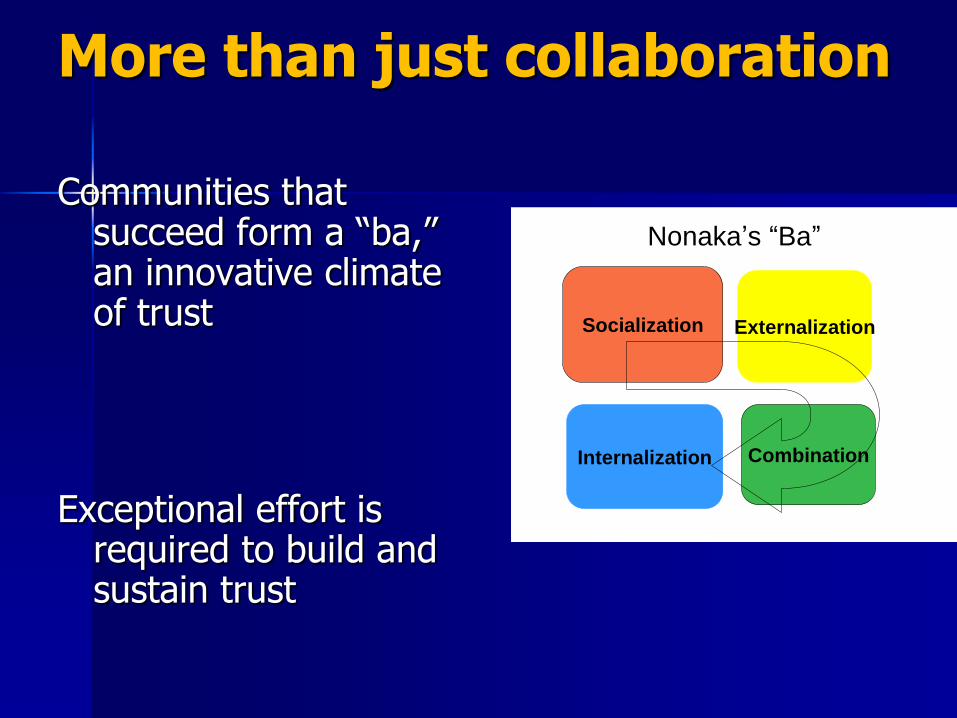
More than just collaboration Communities that
succeed form a “ba,” an innovative climate of trust
Exceptional effort is required to build and sustain trust
Nonaka’s “Ba”
Socialization
Combination
Externalization
Internalization
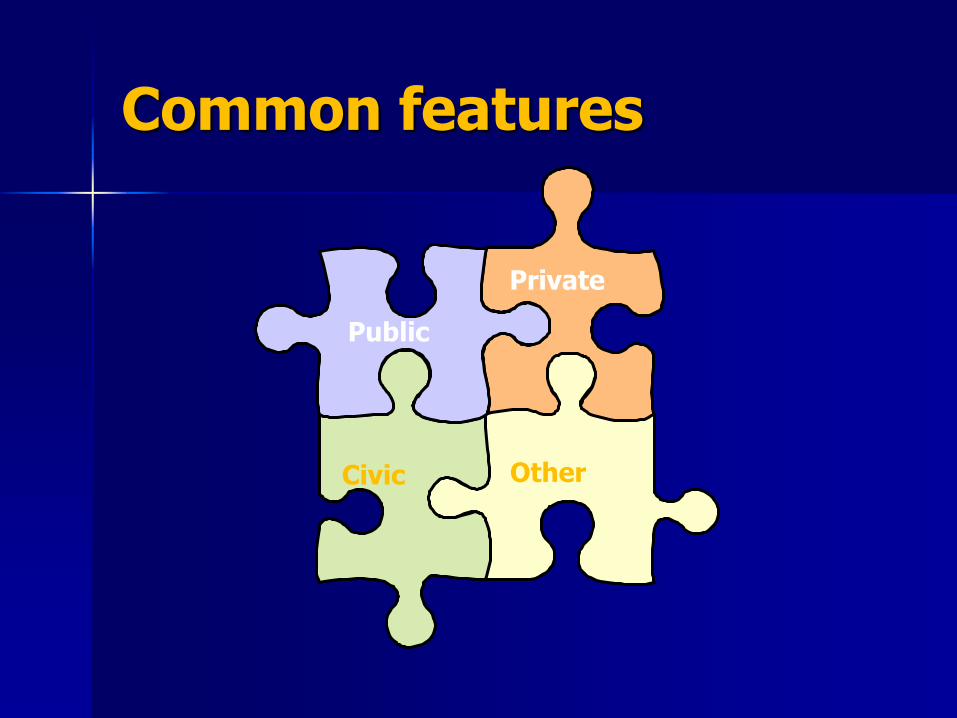
Common features
Private
Other
Civic
Public
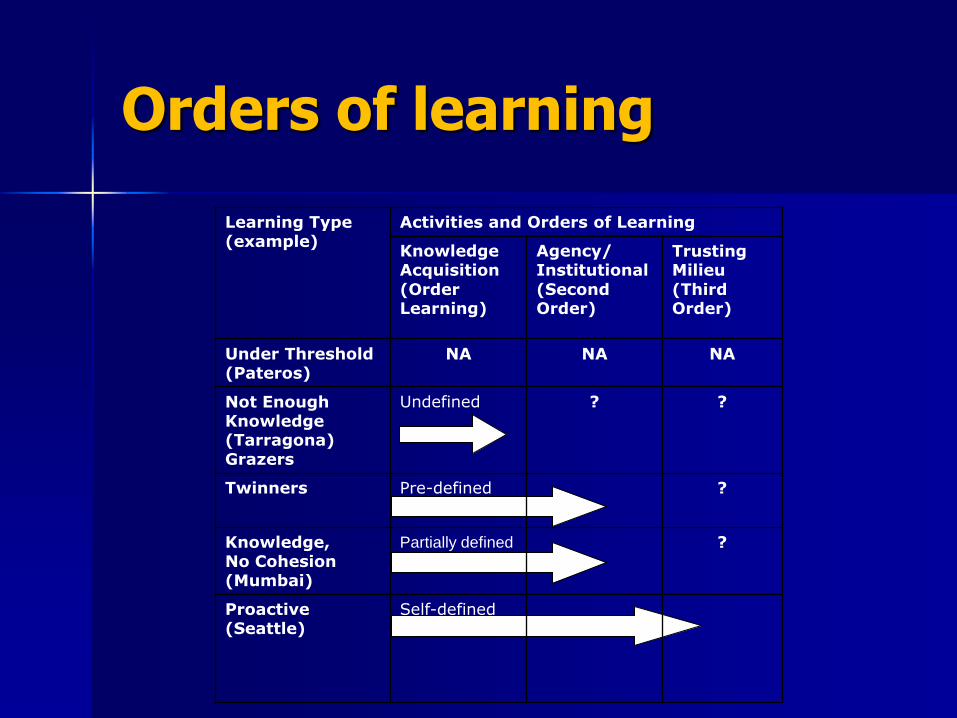
Orders of learning
Learning Type
(example)
Activities and Orders of Learning
Knowledge
Acquisition
(Order Learning)
Agency/
Institutional (Second Order)
Trusting Milieu
(Third Order)
Under Threshold
(Pateros)
NA NA NA
Not Enough Knowledge (Tarragona) Grazers
Undefined ? ?
Twinners Pre-defined ?
Knowledge, No Cohesion
(Mumbai)
Partially defined ?
Proactive
(Seattle)
Self-defined
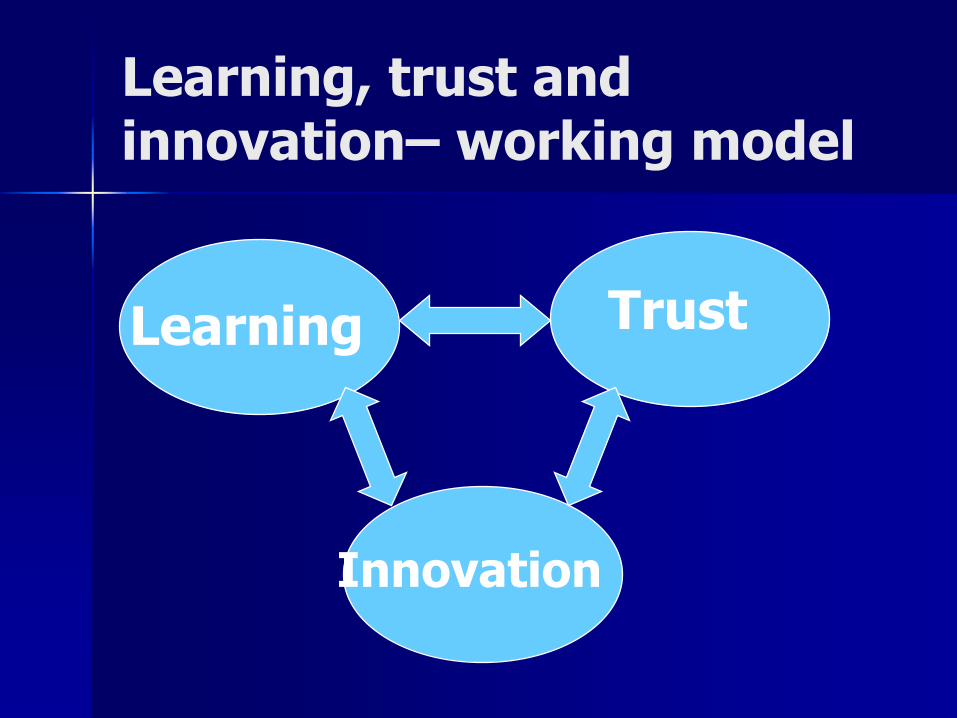
Learning, trust and innovation– working model
Learning Trust
Innovation
Tim Campbell, PhD. Urban Age Institute
Thanks
The Book – www.routledge.com/ Search > Beyond Smart
Cities
– www.beyondsmartcities.org
The speaker
Appendices
5/24/2012 Tim Campbell, PhD. Urban Age Institute
43

Web Survey-- Methods
Questionnaire field tested
Intermediaries disseminate CityNet, UCLG Platforms (e.g. LAC, Asia), Administrative Staff
College (Hyderabad), National League of Cities
Two waves via Metropolis
Survey went to list of about 300
44 Responses

Responses by Region and Size
Region East Asia 11
N. America 8
Europe 6
L. America 7
South Asia 4
W. Asia 4
Africa 1
Australia 1
M. East 1
City Size
>10 5
5-10M 7
1-5M 18
500-1M 7
50-100 6
Cases method
Four reform cities
Panel nominations
Representative players
Interviews
Four pictures of internal, informal networks of trust
Main themes in interviewed cities
Barcelona SW, health, education
Turin strategic planning, participation, Olympics
Portland Bikes, walking, light rail
Charlotte downtowns, neighborhoods, forward planning, light rail, leadership