Embed Size (px)
Citation preview
How can you identifyand evaluate right PE investment opportunities in India?
The better the question. The better the answer.The better the world works.
PE Roundup – 1Q2018 & March‘18

PE Quarterly Roundup – 1Q2018
Page 3
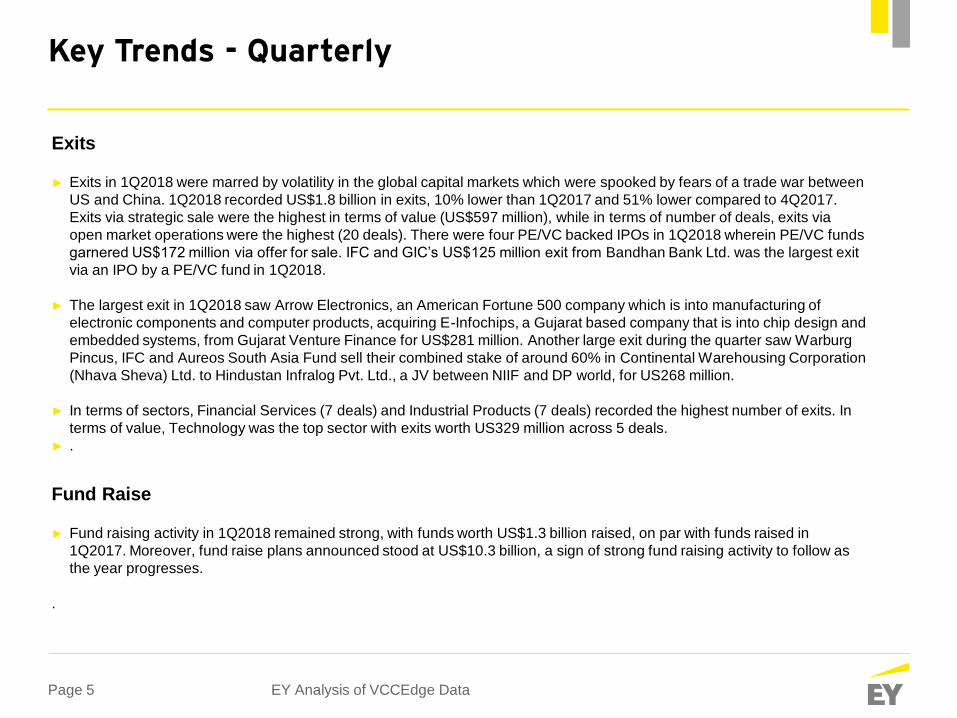
Key Trends - Quarterly
Investments
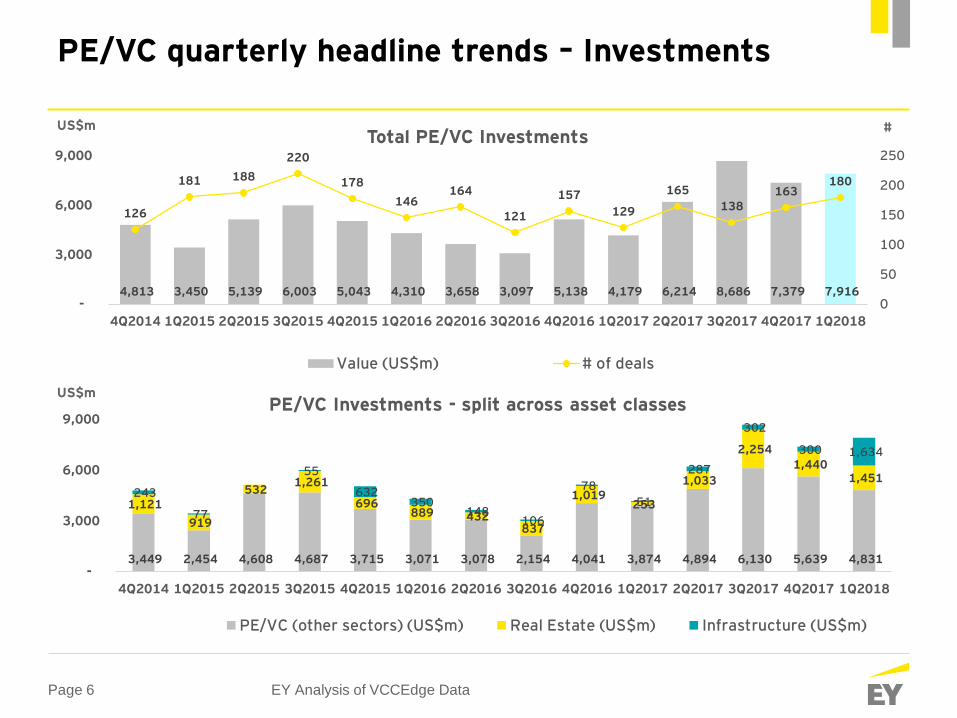
► PE/VC investment activity across asset classes was off to one of the best starts ever in 1Q2018, recording investments
across asset classes worth US$7.9 billion, eclipsing the previous 1Q high of US$4.6 billion seen in 2008 by 72%. It was
also the second best quarter ever since US$8.7 billion recorded in 3Q2017.
► This uptick in 1Q2018 investment levels was primarily aided by US$3.1 billion worth of investments made in the
Infrastructure and Real Estate sectors, which accounted for 39% of all investments in 1Q2018, compared to just US$305
million invested in these asset classes in 1Q2017 and US$1.7 billion in 4Q2017. This was also the highest ever quarterly
investment by the PE/VC industry into Infrastructure and Real Estate.
► Investments in Infrastructure and Real Estate by PE/VC funds in 1Q2018 was more than 50% of the amount invested in
these asset classes in the whole of 2017. Adjusted for these large investments into Infrastructure and Real Estate,
quarterly PE/VC investments have taken a dip in 1Q2018 closing at $4.8 billion after US$5.6 billion in 4Q2017. However,
on a year-on-year basis, 1Q2018 remains the best 1Q for PE/VC investments even after adjusting for these large
investments in Infrastructure and Real Estate.
► There were 13 deals of value greater than US$100 million made in 1Q2018, aggregating to US$5.7 billion and accounting
for 72% of total investments made in 1Q2018, six of which were into Infrastructure and Real Estate, worth almost US$2.7
billion. 4Q2017 and 1Q2017 had 17 and six deals greater than $100 million respectively.
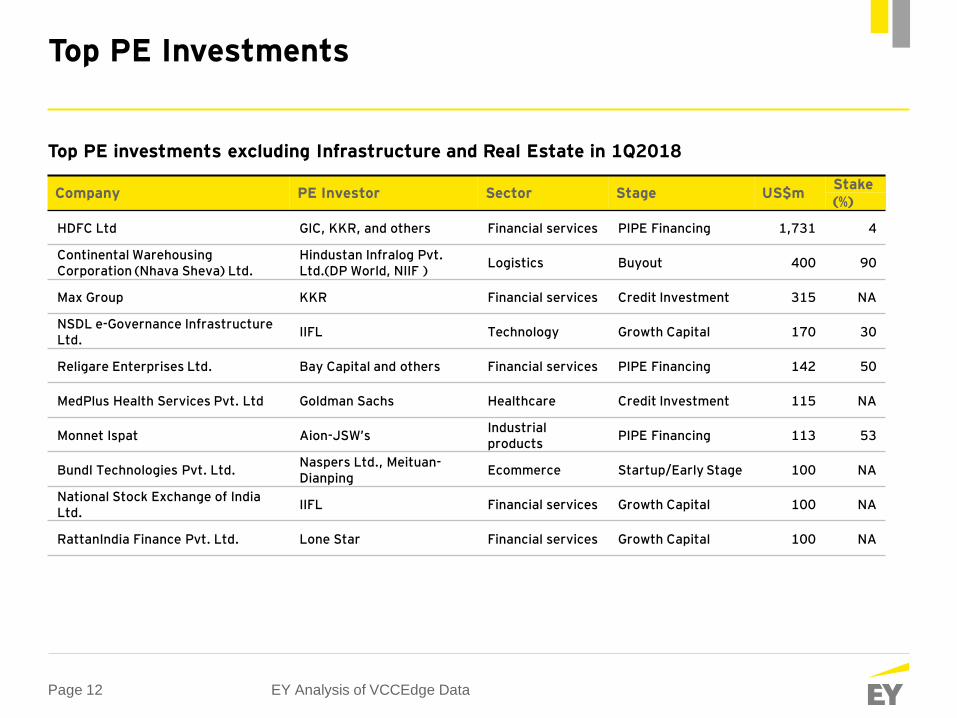
► The largest deal during the quarter saw GIC, KKR and others invest US$1.7 billion into HDFC Ltd., the largest PIPE
investment since Temasek invested about US$2 billion in Bharti Airtel in 2007. 1Q2018 also recorded the first ever
investment by National Investment and Infrastructure Fund (NIIF), India’s sovereign wealth fund wherein Hindustan
Infralog Pvt. Ltd., a JV between NIIF and DP world, bought 90% stake in Continental Warehousing Corporation (Nhava
Sheva) Ltd. for US$400 million. The deal provided an exit to a clutch of early investors including Warburg Pincus, IFC and
others.
EY Analysis of VCCEdge Data
Page 4
Key Trends - Quarterly
Investments (contd.)
► 1Q2018 also recorded the largest PE/VC investment in the Indian Infrastructure asset class, with Macquarie purchasing
tolling rights to 648 kms of national highways from the NHAI for US$1.5 billion. This is India’s first toll-operate-transfer
(TOT) project and is also one of the largest foreign investments in Indian public infrastructure.
► In terms of stage of investment, the Buyouts category received the largest share of investments (34%, US$2.7 billion
across 12 deals), primarily on account of the large Macquarie TOT deal. Out of the 12 buyout deals, six were in the
Infrastructure and Real estate sectors, worth US$2.3 billion. If we exclude Infrastructure and Real Estate investments,
PIPE category (US$2 billion) received the largest share of PE/VC investment. In terms of volume, startup/early stage
investing recorded the highest number of deals (82 deals, accounting for almost 46% of the total deals in 1Q2018).
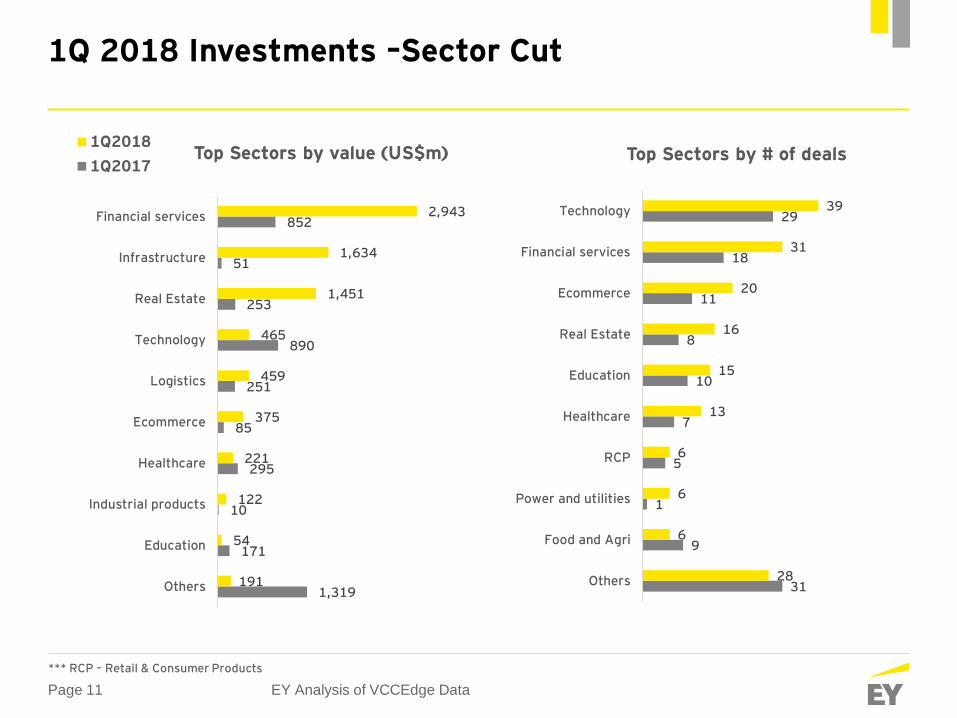
► Notwithstanding the large investments in Infrastructure and Real Estate, carrying forward the trend seen in 2017, the
Financial Services sector garnered highest share of PE/VC investment in 1Q2018, with US$2.9 billion invested across 31
deals, the highest quarterly investment into the sector. 2017 was a record year for Financial Services with investments
worth US$7.2 billion.
EY Analysis of VCCEdge Data
Page 5
Key Trends - Quarterly
Exits
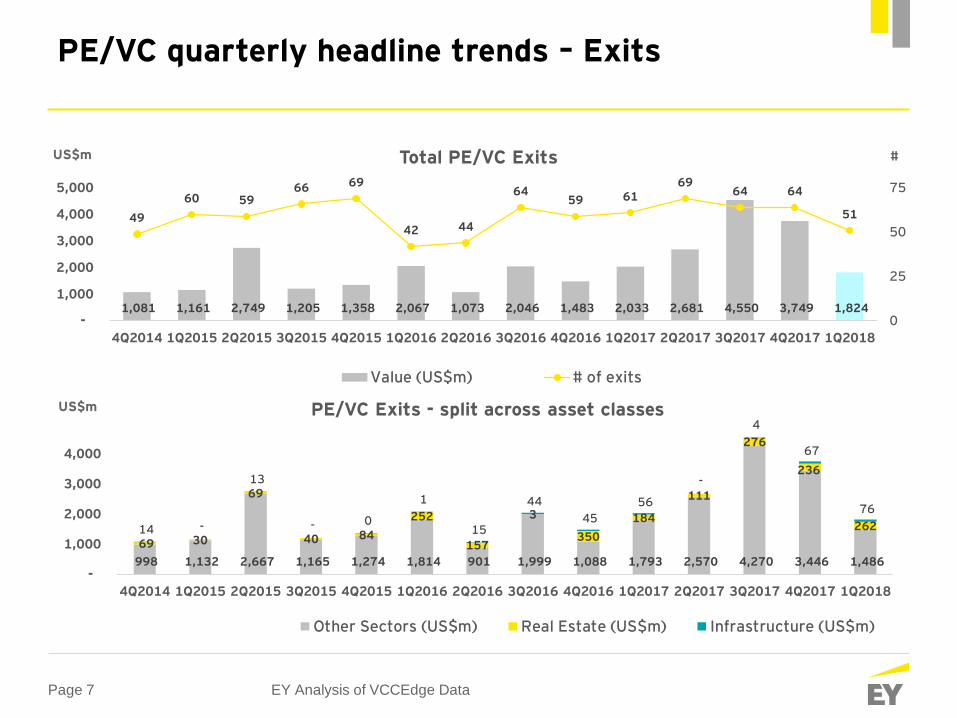
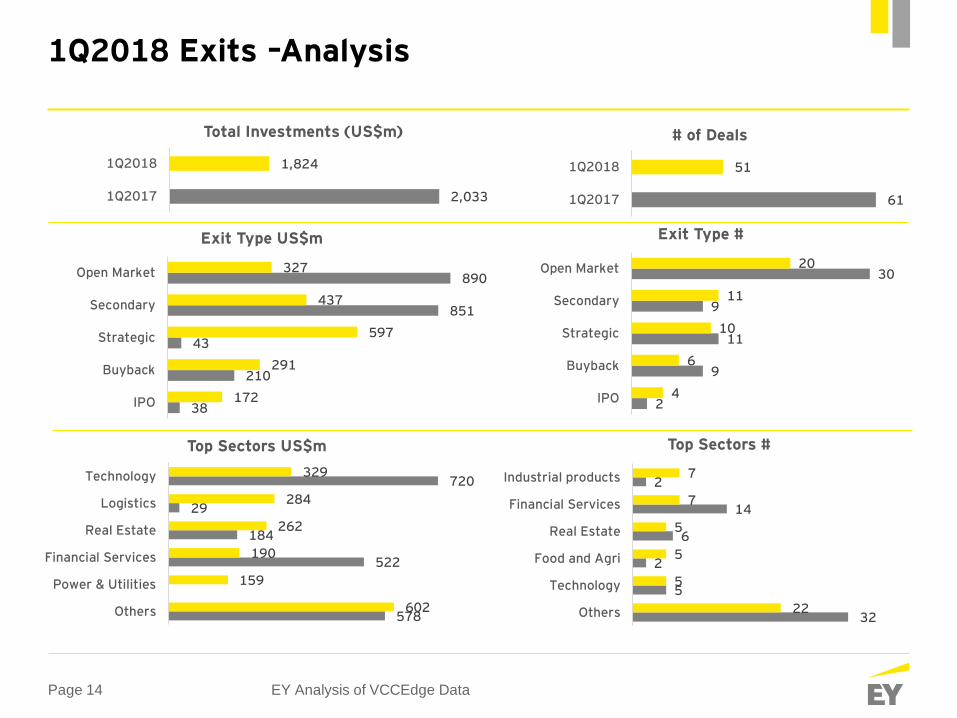
► Exits in 1Q2018 were marred by volatility in the global capital markets which were spooked by fears of a trade war between
US and China. 1Q2018 recorded US$1.8 billion in exits, 10% lower than 1Q2017 and 51% lower compared to 4Q2017.
Exits via strategic sale were the highest in terms of value (US$597 million), while in terms of number of deals, exits via
open market operations were the highest (20 deals). There were four PE/VC backed IPOs in 1Q2018 wherein PE/VC funds
garnered US$172 million via offer for sale. IFC and GIC’s US$125 million exit from Bandhan Bank Ltd. was the largest exit
via an IPO by a PE/VC fund in 1Q2018.
► The largest exit in 1Q2018 saw Arrow Electronics, an American Fortune 500 company which is into manufacturing of
electronic components and computer products, acquiring E-Infochips, a Gujarat based company that is into chip design and
embedded systems, from Gujarat Venture Finance for US$281 million. Another large exit during the quarter saw Warburg
Pincus, IFC and Aureos South Asia Fund sell their combined stake of around 60% in Continental Warehousing Corporation
(Nhava Sheva) Ltd. to Hindustan Infralog Pvt. Ltd., a JV between NIIF and DP world, for US268 million.
► In terms of sectors, Financial Services (7 deals) and Industrial Products (7 deals) recorded the highest number of exits. In
terms of value, Technology was the top sector with exits worth US329 million across 5 deals.
► .
EY Analysis of VCCEdge Data
Fund Raise
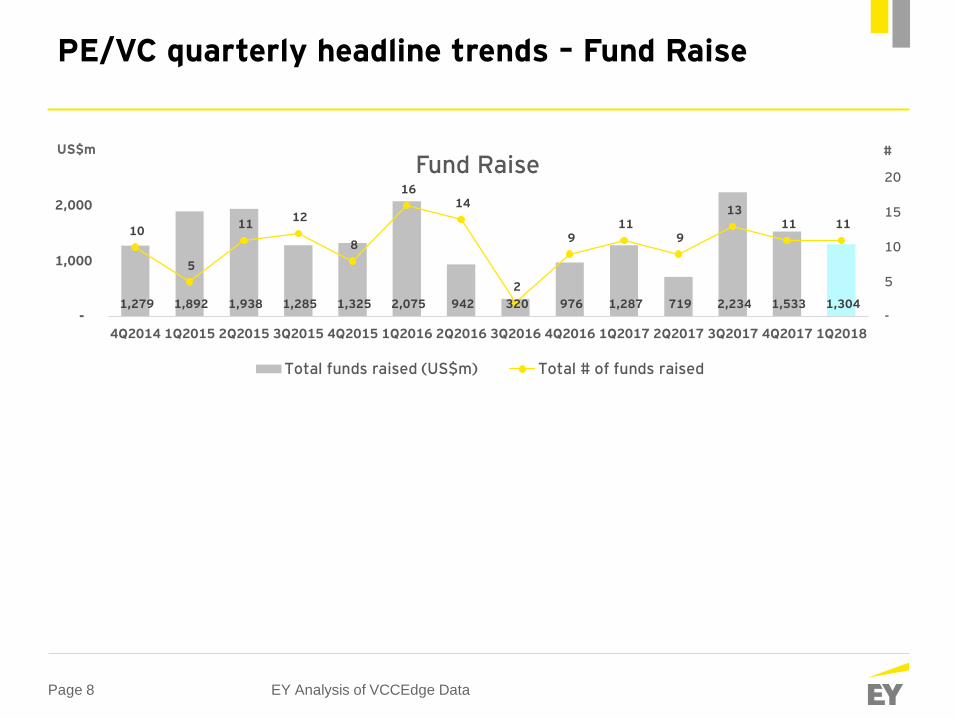
► Fund raising activity in 1Q2018 remained strong, with funds worth US$1.3 billion raised, on par with funds raised in
1Q2017. Moreover, fund raise plans announced stood at US$10.3 billion, a sign of strong fund raising activity to follow as
the year progresses.
.
Page 6 EY Analysis of VCCEdge Data
4,813 3,450 5,139 6,003 5,043 4,310 3,658 3,097 5,138 4,179 6,214 8,686 7,379 7,916
126
181 188
220
178
146164
121
157
129
165
138163
180
0
50
100
150
200
250
-
3,000
6,000
9,000
4Q2014 1Q2015 2Q2015 3Q2015 4Q2015 1Q2016 2Q2016 3Q2016 4Q2016 1Q2017 2Q2017 3Q2017 4Q2017 1Q2018
Total PE/VC Investments
Value (US$m) # of deals
#US$m
3,449 2,454 4,608 4,687 3,715 3,071 3,078 2,154 4,041 3,874 4,894 6,130 5,639 4,831
1,121
919
532 1,261
696 889 432
837
1,019 253
1,033
2,254
1,440 1,451
243
77
55
632 350
148 106
78
51
287
302
300 1,634
-
3,000
6,000
9,000
4Q2014 1Q2015 2Q2015 3Q2015 4Q2015 1Q2016 2Q2016 3Q2016 4Q2016 1Q2017 2Q2017 3Q2017 4Q2017 1Q2018
PE/VC Investments - split across asset classes
PE/VC (other sectors) (US$m) Real Estate (US$m) Infrastructure (US$m)
US$m
PE/VC quarterly headline trends – Investments
Page 7 EY Analysis of VCCEdge Data
1,081 1,161 2,749 1,205 1,358 2,067 1,073 2,046 1,483 2,033 2,681 4,550 3,749 1,824
49
60 5966 69
42 44
6459 61
6964 64
51
0
25
50
75
-
1,000
2,000
3,000
4,000
5,000
4Q2014 1Q2015 2Q2015 3Q2015 4Q2015 1Q2016 2Q2016 3Q2016 4Q2016 1Q2017 2Q2017 3Q2017 4Q2017 1Q2018
Total PE/VC Exits
Value (US$m) # of exits
#US$m
998 1,132 2,667 1,165 1,274 1,814 901 1,999 1,088 1,793 2,570 4,270 3,446 1,486
69 30
69
40 84
252
157
3
350
184
111
276
236
26214 -
13
- 0
1
15
44
45
56
-
4
67
76
-
1,000
2,000
3,000
4,000
4Q2014 1Q2015 2Q2015 3Q2015 4Q2015 1Q2016 2Q2016 3Q2016 4Q2016 1Q2017 2Q2017 3Q2017 4Q2017 1Q2018
PE/VC Exits - split across asset classes
Other Sectors (US$m) Real Estate (US$m) Infrastructure (US$m)
US$m
PE/VC quarterly headline trends – Exits
Page 8 EY Analysis of VCCEdge Data
1,279 1,892 1,938 1,285 1,325 2,075 942 320 976 1,287 719 2,234 1,533 1,304
10
5
11 12
8
16 14
2
9 11
9
13 11 11
-
5
10
15
20
-
1,000
2,000
4Q2014 1Q2015 2Q2015 3Q2015 4Q2015 1Q2016 2Q2016 3Q2016 4Q2016 1Q2017 2Q2017 3Q2017 4Q2017 1Q2018
Fund Raise
Total funds raised (US$m) Total # of funds raised
#US$m
PE/VC quarterly headline trends – Fund Raise
Page 9
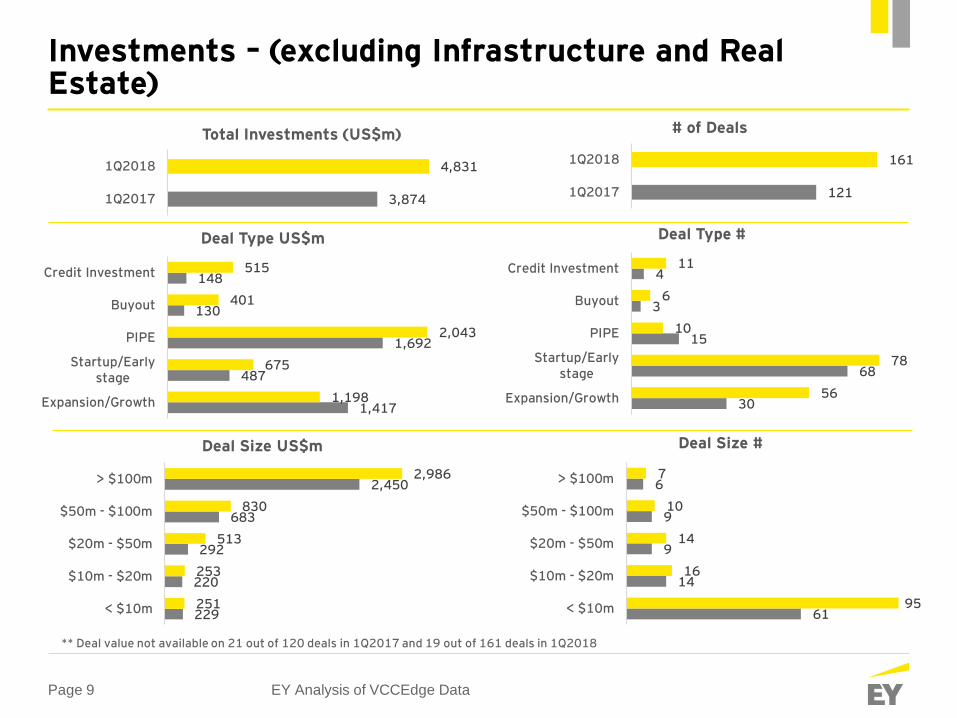
** Deal value not available on 21 out of 120 deals in 1Q2017 and 19 out of 161 deals in 1Q2018
EY Analysis of VCCEdge Data
1,417
487
1,692
130
148
1,198
675
2,043
401
515
Expansion/Growth
Startup/Earlystage
PIPE
Buyout
Credit Investment
Deal Type US$m
229
220
292
683
2,450
251
253
513
830
2,986
< $10m
$10m - $20m
$20m - $50m
$50m - $100m
> $100m
Deal Size US$m
30
68
15
3
4
56
78
10
6
11
Expansion/Growth
Startup/Earlystage
PIPE
Buyout
Credit Investment
Deal Type #
3,874
4,831
1Q2017
1Q2018
Total Investments (US$m)
121
161
1Q2017
1Q2018
# of Deals
61
14
9
9
6
95
16
14
10
7
< $10m
$10m - $20m
$20m - $50m
$50m - $100m
> $100m
Deal Size #
Investments – (excluding Infrastructure and Real Estate)
Page 10 EY Analysis of VCCEdge Data
-
-
169
136
403
8
-
2,316
358
Expansion/Growth
Startup/Earlystage
PIPE
Buyout
CreditInvestment
Deal Type US$m
12
185
108
8
49
70
270
2,687
< $10m
$10m - $20m
$20m - $50m
$50m - $100m
> $100m
Deal Size US$m
1
-
4
4
5
4
-
6
4
Expansion/Growth
Startup/Earlystage
PIPE
Buyout
Credit Investment
Deal Type #
305
3,085
1Q2017
1Q2018
Total Investments (US$m)
9
19
1Q2017
1Q2018
# of Deals
1
5
2
4
3
2
4
6
< $10m
$10m - $20m
$20m - $50m
$50m - $100m
> $100m
Deal Size #
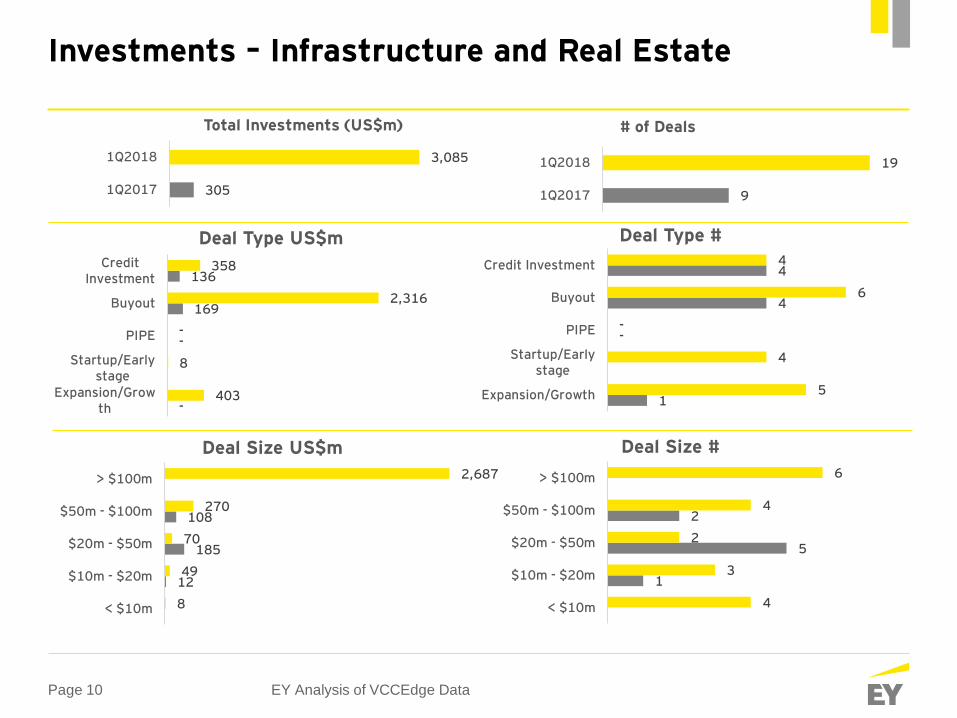
Investments – Infrastructure and Real Estate
Page 11
*** RCP – Retail & Consumer Products
EY Analysis of VCCEdge Data
1,319
171
10
295
85
251
890
253
51
852
191
54
122
221
375
459
465
1,451
1,634
2,943
Others
Education
Industrial products
Healthcare
Ecommerce
Logistics
Technology
Real Estate
Infrastructure
Financial services
Top Sectors by value (US$m)1Q2018
1Q2017
31
9
1
5
7
10
8
11
18
29
28
6
6
6
13
15
16
20
31
39
Others
Food and Agri
Power and utilities
RCP
Healthcare
Education
Real Estate
Ecommerce
Financial services
Technology
Top Sectors by # of deals
1Q 2018 Investments –Sector Cut
Page 12
Top PE investments excluding Infrastructure and Real Estate in 1Q2018
Company PE Investor Sector Stage US$mStake(%)
HDFC Ltd GIC, KKR, and others Financial services PIPE Financing 1,731 4
Continental Warehousing Corporation (Nhava Sheva) Ltd.
Hindustan Infralog Pvt. Ltd.(DP World, NIIF )
Logistics Buyout 400 90
Max Group KKR Financial services Credit Investment 315 NA
NSDL e-Governance Infrastructure Ltd.
IIFL Technology Growth Capital 170 30
Religare Enterprises Ltd. Bay Capital and others Financial services PIPE Financing 142 50
MedPlus Health Services Pvt. Ltd Goldman Sachs Healthcare Credit Investment 115 NA
Monnet Ispat Aion-JSW’s Industrial products
PIPE Financing 113 53
Bundl Technologies Pvt. Ltd.Naspers Ltd., Meituan-Dianping
Ecommerce Startup/Early Stage 100 NA
National Stock Exchange of India Ltd.
IIFL Financial services Growth Capital 100 NA
RattanIndia Finance Pvt. Ltd. Lone Star Financial services Growth Capital 100 NA
EY Analysis of VCCEdge Data
Top PE Investments
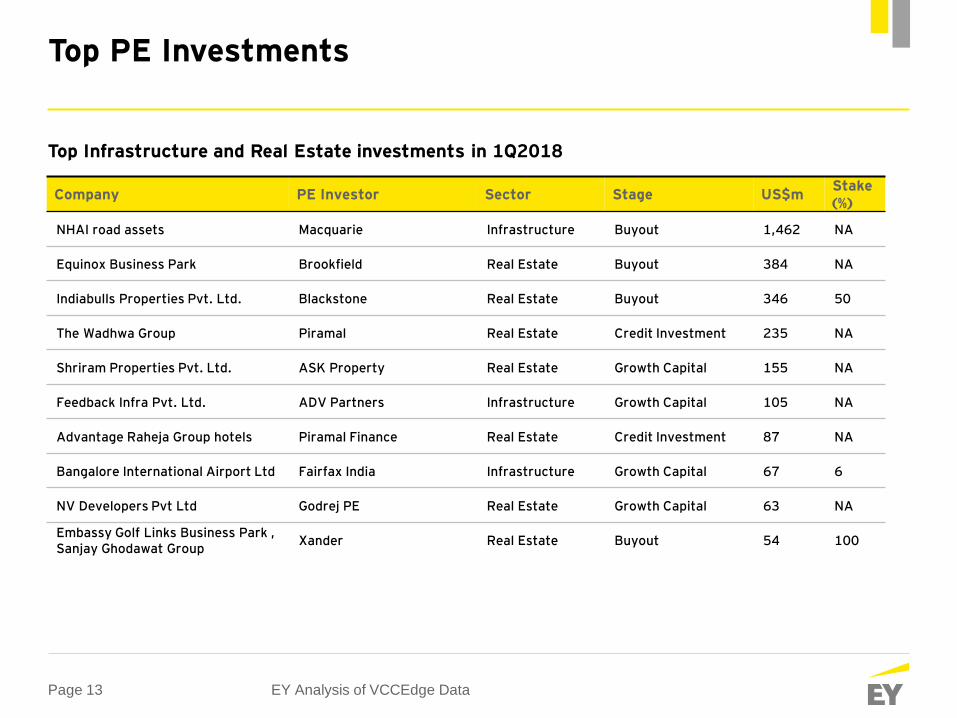
Page 13
Company PE Investor Sector Stage US$mStake(%)
NHAI road assets Macquarie Infrastructure Buyout 1,462 NA
Equinox Business Park Brookfield Real Estate Buyout 384 NA
Indiabulls Properties Pvt. Ltd. Blackstone Real Estate Buyout 346 50
The Wadhwa Group Piramal Real Estate Credit Investment 235 NA
Shriram Properties Pvt. Ltd. ASK Property Real Estate Growth Capital 155 NA
Feedback Infra Pvt. Ltd. ADV Partners Infrastructure Growth Capital 105 NA
Advantage Raheja Group hotels Piramal Finance Real Estate Credit Investment 87 NA
Bangalore International Airport Ltd Fairfax India Infrastructure Growth Capital 67 6
NV Developers Pvt Ltd Godrej PE Real Estate Growth Capital 63 NA
Embassy Golf Links Business Park , Sanjay Ghodawat Group
Xander Real Estate Buyout 54 100
EY Analysis of VCCEdge Data
Top PE Investments
Top Infrastructure and Real Estate investments in 1Q2018
Page 14 EY Analysis of VCCEdge Data
38
210
43
851
890
172
291
597
437
327
IPO
Buyback
Strategic
Secondary
Open Market
Exit Type US$m
578
522
184
29
720
602
159
190
262
284
329
Others
Power & Utilities
Financial Services
Real Estate
Logistics
Technology
Top Sectors US$m
2
9
11
9
30
4
6
10
11
20
IPO
Buyback
Strategic
Secondary
Open Market
Exit Type #
2,033
1,824
1Q2017
1Q2018
Total Investments (US$m)
61
51
1Q2017
1Q2018
# of Deals
32
5
2
6
14
2
22
5
5
5
7
7
Others
Technology
Food and Agri
Real Estate
Financial Services
Industrial products
Top Sectors #
1Q2018 Exits –Analysis
Page 15
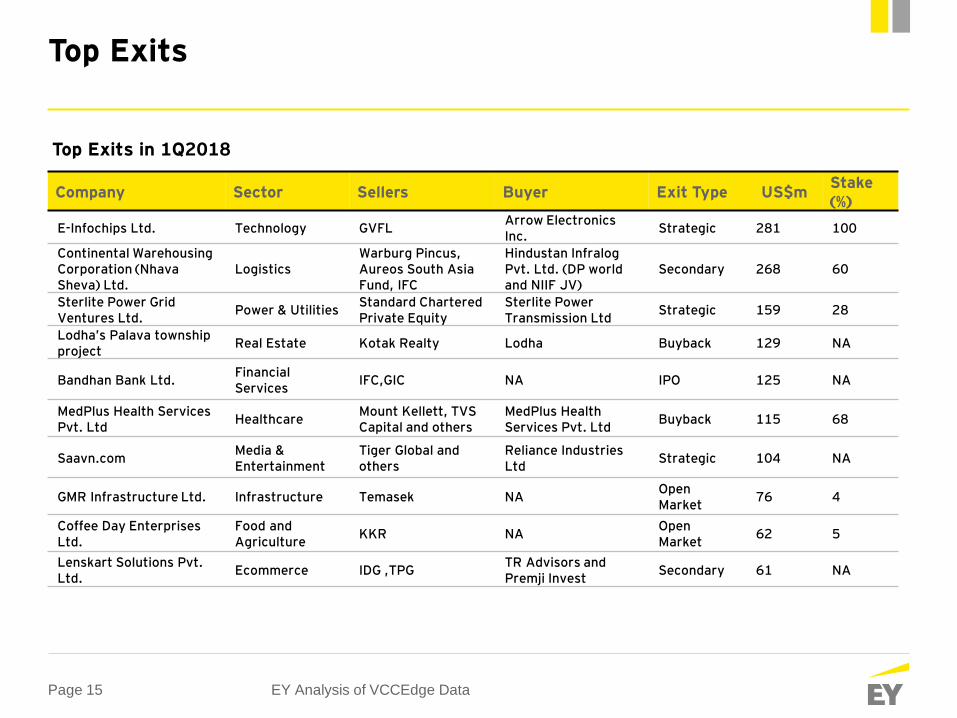
Top Exits in 1Q2018
Company Sector Sellers Buyer Exit Type US$mStake (%)
E-Infochips Ltd. Technology GVFLArrow Electronics Inc.
Strategic 281 100
Continental Warehousing Corporation (NhavaSheva) Ltd.
LogisticsWarburg Pincus, Aureos South Asia Fund, IFC
Hindustan InfralogPvt. Ltd. (DP world and NIIF JV)
Secondary 268 60
Sterlite Power Grid Ventures Ltd.
Power & UtilitiesStandard Chartered Private Equity
Sterlite Power Transmission Ltd
Strategic 159 28
Lodha’s Palava township project
Real Estate Kotak Realty Lodha Buyback 129 NA
Bandhan Bank Ltd.Financial Services
IFC,GIC NA IPO 125 NA
MedPlus Health Services Pvt. Ltd
HealthcareMount Kellett, TVS Capital and others
MedPlus Health Services Pvt. Ltd
Buyback 115 68
Saavn.comMedia & Entertainment
Tiger Global and others
Reliance Industries Ltd
Strategic 104 NA
GMR Infrastructure Ltd. Infrastructure Temasek NAOpen Market
76 4
Coffee Day Enterprises Ltd.
Food and Agriculture
KKR NAOpen Market
62 5
Lenskart Solutions Pvt. Ltd.
Ecommerce IDG ,TPGTR Advisors and Premji Invest
Secondary 61 NA
EY Analysis of VCCEdge Data
Top Exits
Page 16
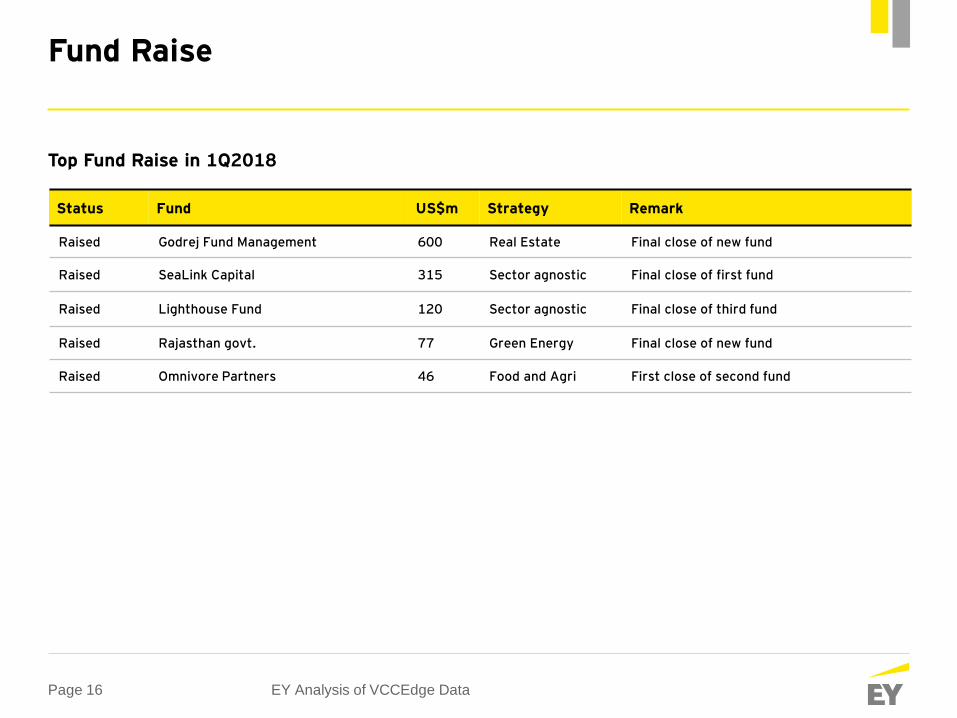
Top Fund Raise in 1Q2018
Status Fund US$m Strategy Remark
Raised Godrej Fund Management 600 Real Estate Final close of new fund
Raised SeaLink Capital 315 Sector agnostic Final close of first fund
Raised Lighthouse Fund 120 Sector agnostic Final close of third fund
Raised Rajasthan govt. 77 Green Energy Final close of new fund
Raised Omnivore Partners 46 Food and Agri First close of second fund
EY Analysis of VCCEdge Data
Fund Raise
PE Monthly Roundup – March’18
Page 18
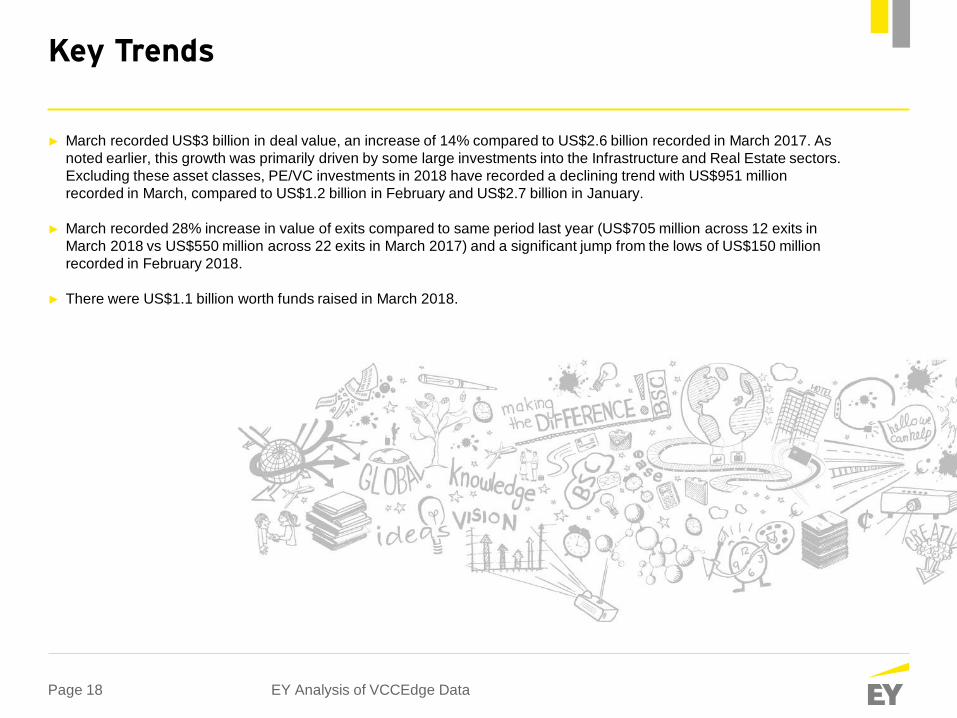
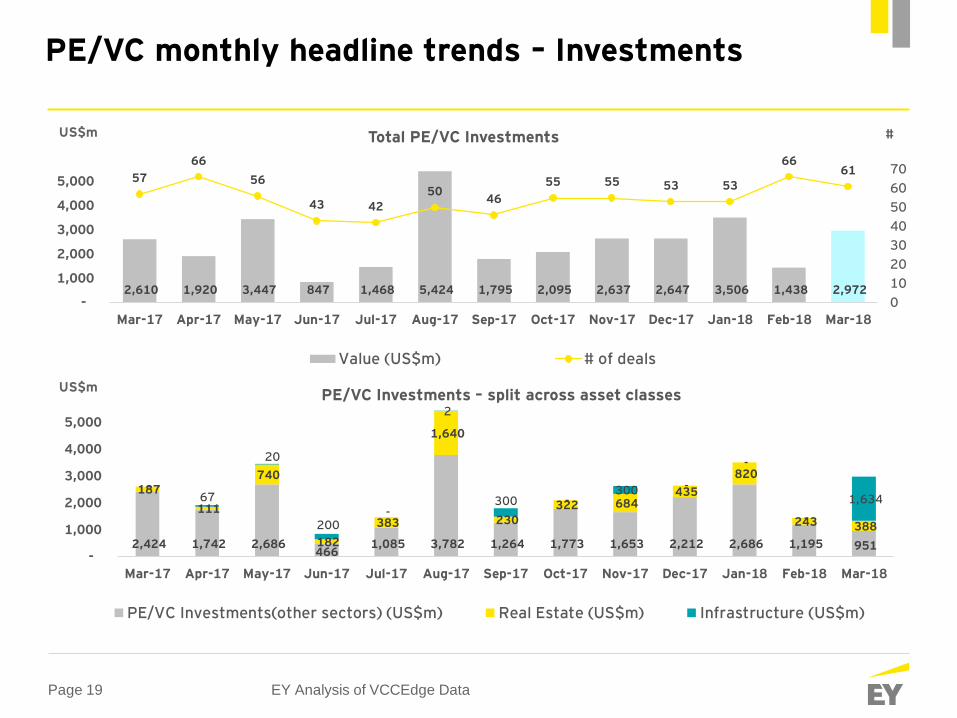
► March recorded US$3 billion in deal value, an increase of 14% compared to US$2.6 billion recorded in March 2017. As
noted earlier, this growth was primarily driven by some large investments into the Infrastructure and Real Estate sectors.
Excluding these asset classes, PE/VC investments in 2018 have recorded a declining trend with US$951 million
recorded in March, compared to US$1.2 billion in February and US$2.7 billion in January.
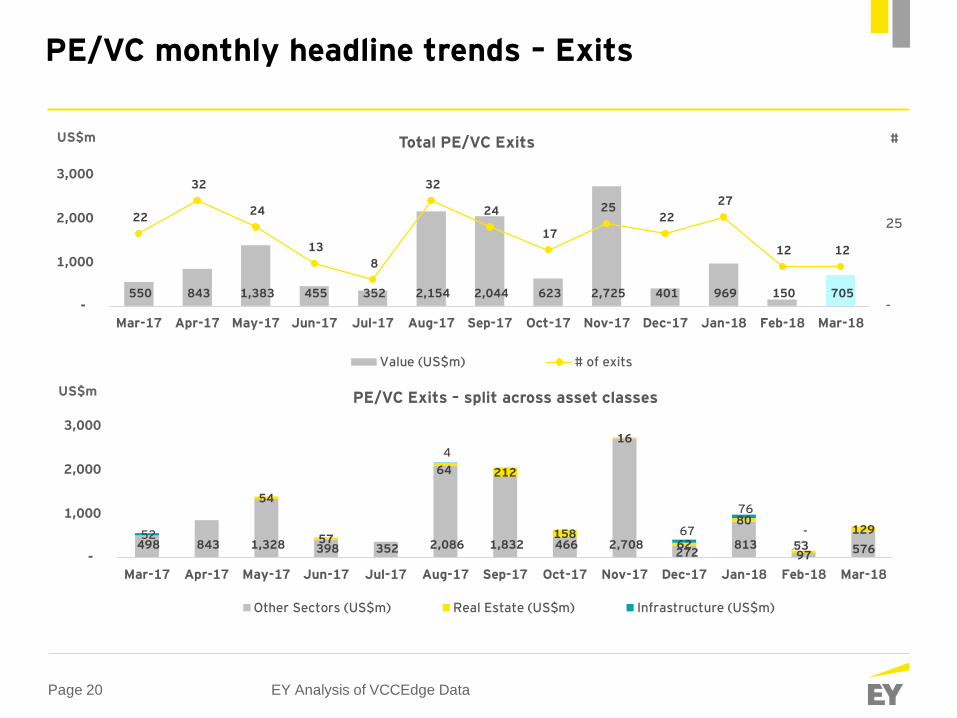
► March recorded 28% increase in value of exits compared to same period last year (US$705 million across 12 exits in
March 2018 vs US$550 million across 22 exits in March 2017) and a significant jump from the lows of US$150 million
recorded in February 2018.
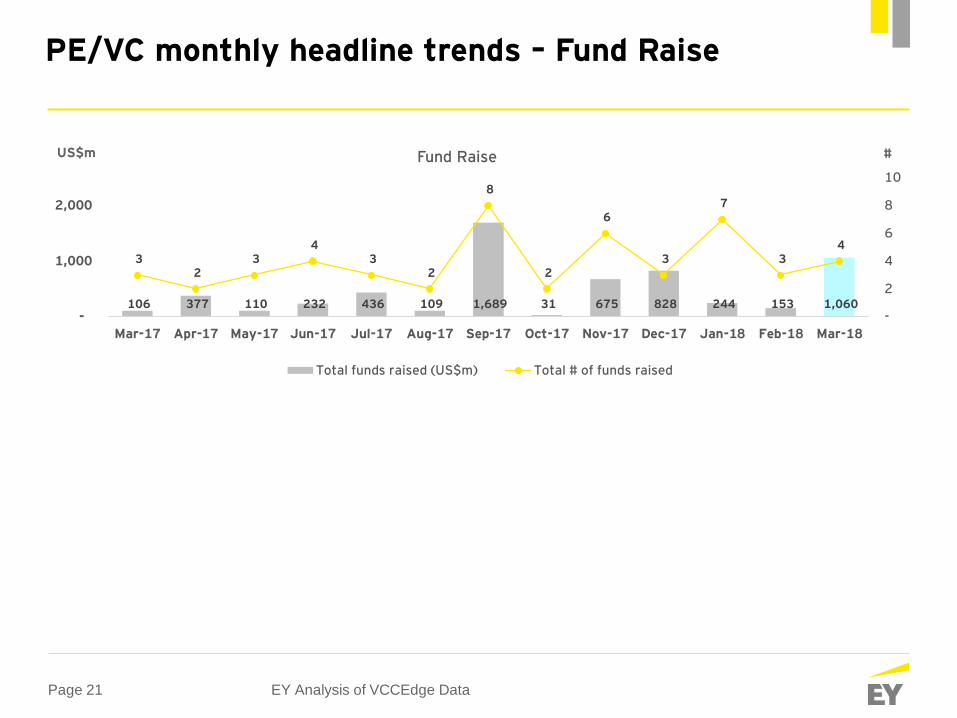
► There were US$1.1 billion worth funds raised in March 2018.
EY Analysis of VCCEdge Data
Key Trends
Page 19
PE/VC monthly headline trends – Investments
EY Analysis of VCCEdge Data
2,610 1,920 3,447 847 1,468 5,424 1,795 2,095 2,637 2,647 3,506 1,438 2,972
57
66
56
43 42
5046
55 55 53 53
6661
0
10
20
30
40
50
60
70
-
1,000
2,000
3,000
4,000
5,000
Mar-17 Apr-17 May-17 Jun-17 Jul-17 Aug-17 Sep-17 Oct-17 Nov-17 Dec-17 Jan-18 Feb-18 Mar-18
Total PE/VC Investments
Value (US$m) # of deals
#US$m
2,424 1,742 2,686 466
1,085 3,782 1,264 1,773 1,653 2,212 2,686 1,195 951
187
111
740
182
383
1,640
230 322 684
435
820
243 388
-67
20
200 -
2
300 -300 -
-
-
1,634
-
1,000
2,000
3,000
4,000
5,000
Mar-17 Apr-17 May-17 Jun-17 Jul-17 Aug-17 Sep-17 Oct-17 Nov-17 Dec-17 Jan-18 Feb-18 Mar-18
PE/VC Investments – split across asset classes
PE/VC Investments(other sectors) (US$m) Real Estate (US$m) Infrastructure (US$m)
US$m
Page 20 EY Analysis of VCCEdge Data
550 843 1,383 455 352 2,154 2,044 623 2,725 401 969 150 705
22
32
24
13
8
32
24
17
25 22
27
12 12
-
25
-
1,000
2,000
3,000
Mar-17 Apr-17 May-17 Jun-17 Jul-17 Aug-17 Sep-17 Oct-17 Nov-17 Dec-17 Jan-18 Feb-18 Mar-18
Total PE/VC Exits
Value (US$m) # of exits
#US$m
498 843 1,328 398 352 2,086 1,832 466 2,708 272
813 97
576
54
57
64 212
158
16
62
80
53
12952
4
67
76
-
-
1,000
2,000
3,000
Mar-17 Apr-17 May-17 Jun-17 Jul-17 Aug-17 Sep-17 Oct-17 Nov-17 Dec-17 Jan-18 Feb-18 Mar-18
PE/VC Exits – split across asset classes
Other Sectors (US$m) Real Estate (US$m) Infrastructure (US$m)
US$m
PE/VC monthly headline trends – Exits
Page 21
PE/VC monthly headline trends – Fund Raise
EY Analysis of VCCEdge Data
106 377 110 232 436 109 1,689 31 675 828 244 153 1,060
3 2
3 4
3 2
8
2
6
3
7
3 4
-
2
4
6
8
10
-
1,000
2,000
Mar-17 Apr-17 May-17 Jun-17 Jul-17 Aug-17 Sep-17 Oct-17 Nov-17 Dec-17 Jan-18 Feb-18 Mar-18
Fund Raise
Total funds raised (US$m) Total # of funds raised
#US$m
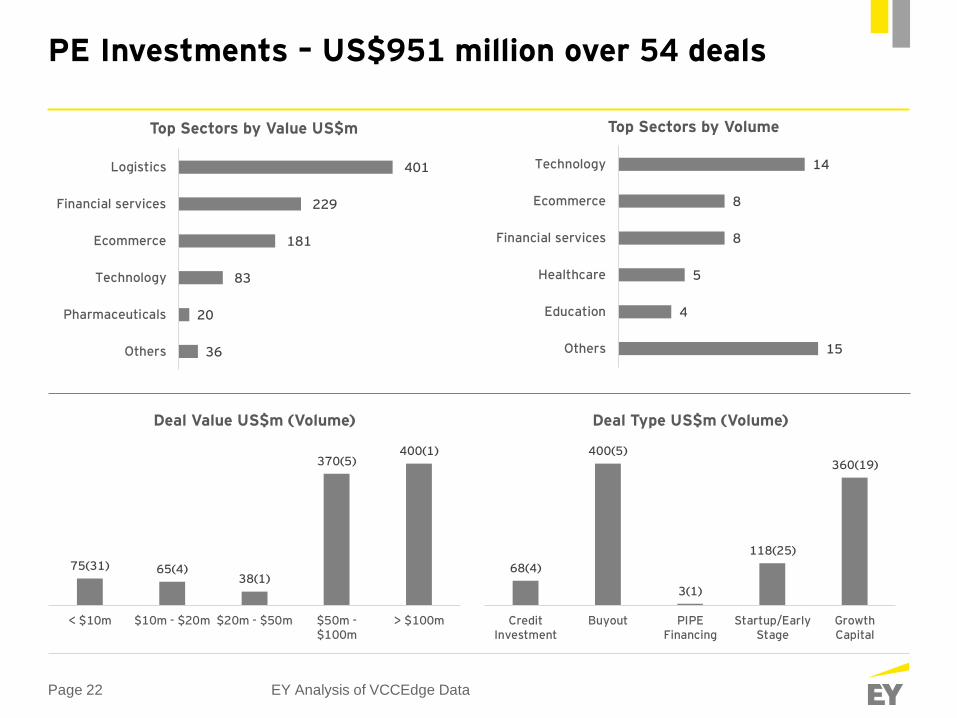
Page 22
75(31) 65(4)38(1)
370(5)400(1)
< $10m $10m - $20m $20m - $50m $50m -$100m
> $100m
Deal Value US$m (Volume)
PE Investments – US$951 million over 54 deals
EY Analysis of VCCEdge Data
68(4)
400(5)
3(1)
118(25)
360(19)
CreditInvestment
Buyout PIPEFinancing
Startup/EarlyStage
GrowthCapital
Deal Type US$m (Volume)
36
20
83
181
229
401
Others
Pharmaceuticals
Technology
Ecommerce
Financial services
Logistics
Top Sectors by Value US$m
15
4
5
8
8
14
Others
Education
Healthcare
Financial services
Ecommerce
Technology
Top Sectors by Volume
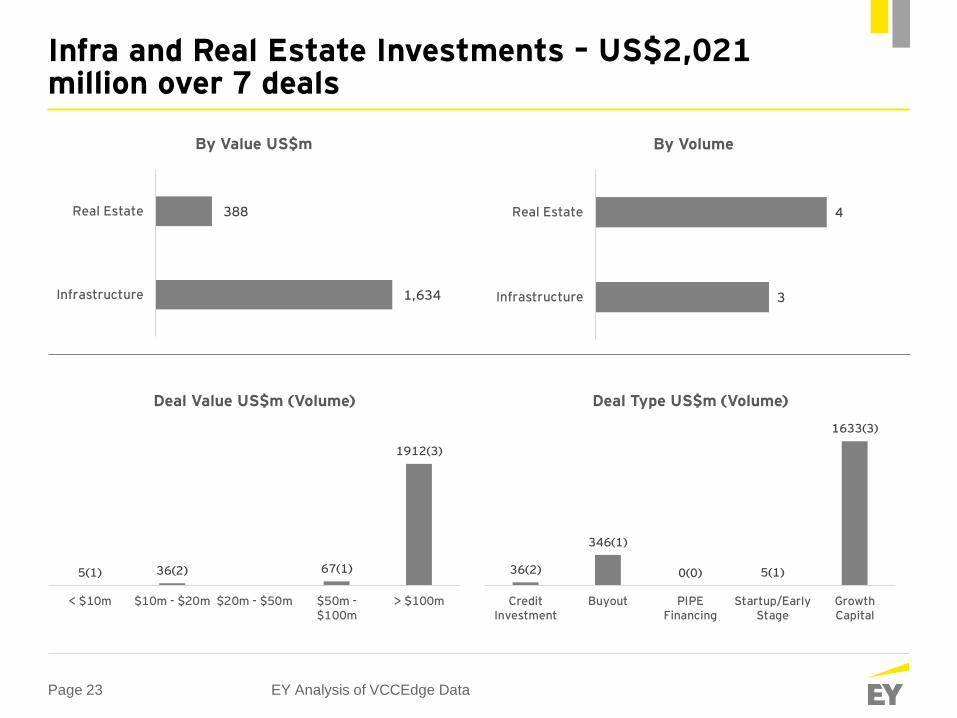
Page 23
5(1) 36(2) 67(1)
1912(3)
< $10m $10m - $20m $20m - $50m $50m -$100m
> $100m
Deal Value US$m (Volume)
Infra and Real Estate Investments – US$2,021 million over 7 deals
EY Analysis of VCCEdge Data
36(2)
346(1)
0(0) 5(1)
1633(3)
CreditInvestment
Buyout PIPEFinancing
Startup/EarlyStage
GrowthCapital
Deal Type US$m (Volume)
1,634
388
Infrastructure
Real Estate
By Value US$m
3
4
Infrastructure
Real Estate
By Volume
Page 24
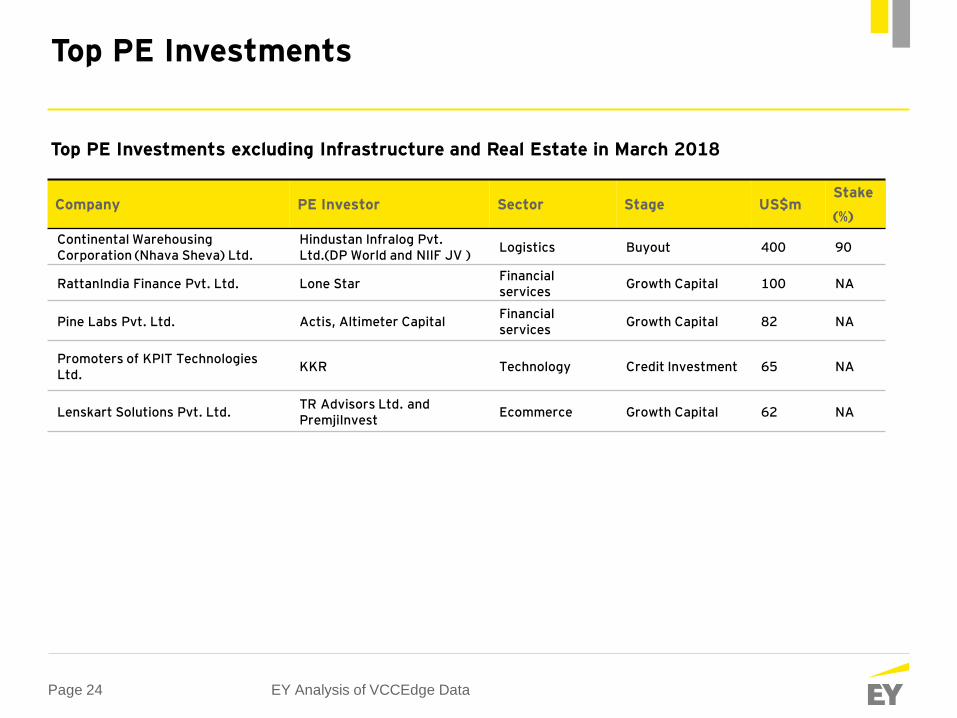
Top PE Investments
Top PE Investments excluding Infrastructure and Real Estate in March 2018
Company PE Investor Sector Stage US$mStake
(%)
Continental Warehousing Corporation (Nhava Sheva) Ltd.
Hindustan Infralog Pvt. Ltd.(DP World and NIIF JV )
Logistics Buyout 400 90
RattanIndia Finance Pvt. Ltd. Lone StarFinancial services
Growth Capital 100 NA
Pine Labs Pvt. Ltd. Actis, Altimeter CapitalFinancial services
Growth Capital 82 NA
Promoters of KPIT Technologies Ltd.
KKR Technology Credit Investment 65 NA
Lenskart Solutions Pvt. Ltd.TR Advisors Ltd. and PremjiInvest
Ecommerce Growth Capital 62 NA
EY Analysis of VCCEdge Data
Page 25
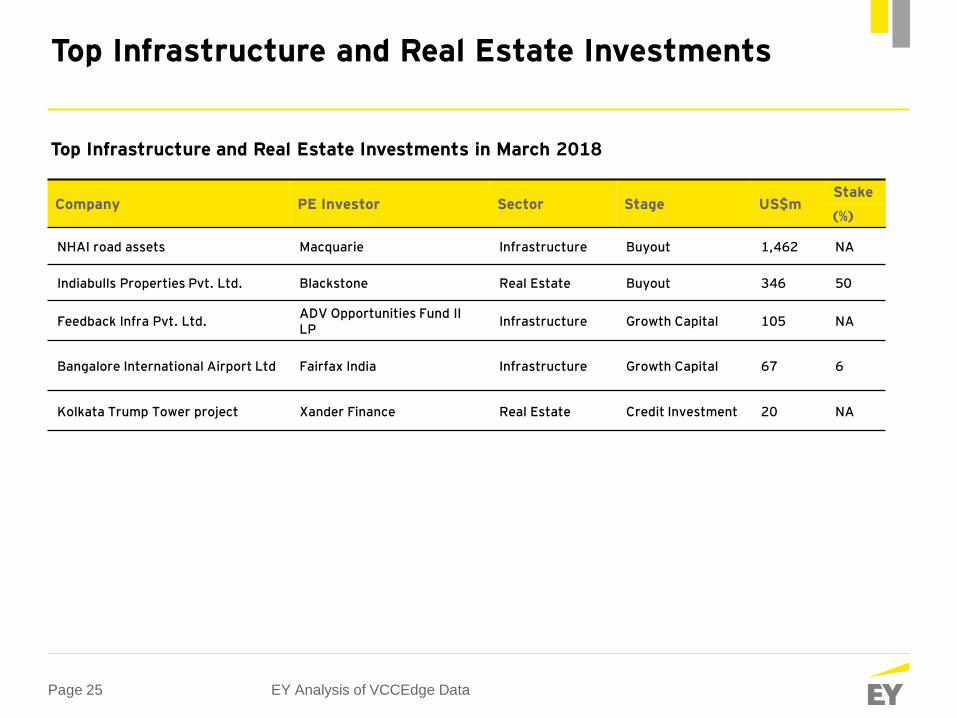
Top Infrastructure and Real Estate Investments
Company PE Investor Sector Stage US$mStake
(%)
NHAI road assets Macquarie Infrastructure Buyout 1,462 NA
Indiabulls Properties Pvt. Ltd. Blackstone Real Estate Buyout 346 50
Feedback Infra Pvt. Ltd.ADV Opportunities Fund II LP
Infrastructure Growth Capital 105 NA
Bangalore International Airport Ltd Fairfax India Infrastructure Growth Capital 67 6
Kolkata Trump Tower project Xander Finance Real Estate Credit Investment 20 NA
EY Analysis of VCCEdge Data
Top Infrastructure and Real Estate Investments in March 2018
Page 26
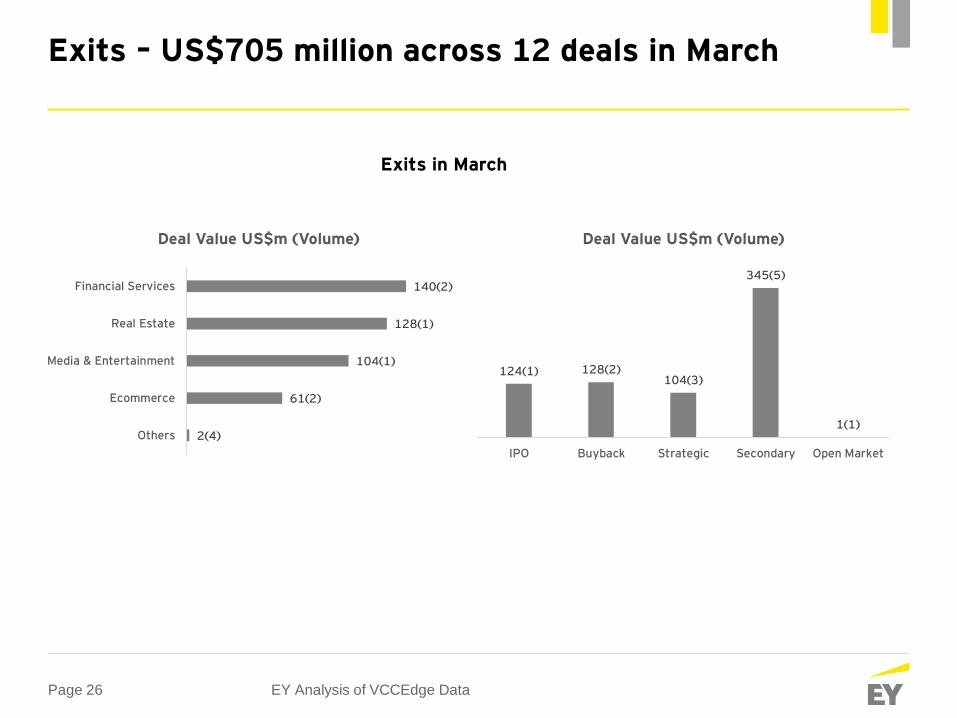
Exits – US$705 million across 12 deals in March
Exits in March
EY Analysis of VCCEdge Data
124(1) 128(2)104(3)
345(5)
1(1)
IPO Buyback Strategic Secondary Open Market
Deal Value US$m (Volume)
2(4)
61(2)
104(1)
128(1)
140(2)
Others
Ecommerce
Media & Entertainment
Real Estate
Financial Services
Deal Value US$m (Volume)
Page 27
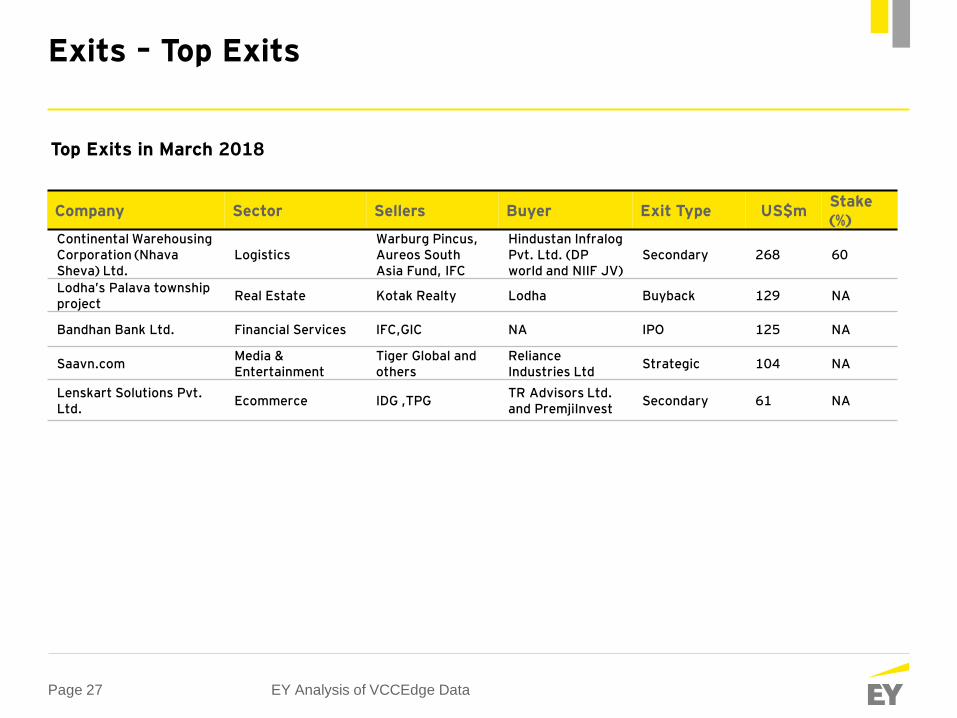
Exits – Top Exits
Company Sector Sellers Buyer Exit Type US$mStake (%)
Continental Warehousing Corporation (NhavaSheva) Ltd.
LogisticsWarburg Pincus, Aureos South Asia Fund, IFC
Hindustan InfralogPvt. Ltd. (DP world and NIIF JV)
Secondary 268 60
Lodha’s Palava township project
Real Estate Kotak Realty Lodha Buyback 129 NA
Bandhan Bank Ltd. Financial Services IFC,GIC NA IPO 125 NA
Saavn.comMedia & Entertainment
Tiger Global and others
Reliance Industries Ltd
Strategic 104 NA
Lenskart Solutions Pvt. Ltd.
Ecommerce IDG ,TPGTR Advisors Ltd. and PremjiInvest
Secondary 61 NA
EY Analysis of VCCEdge Data
Top Exits in March 2018
Page 28
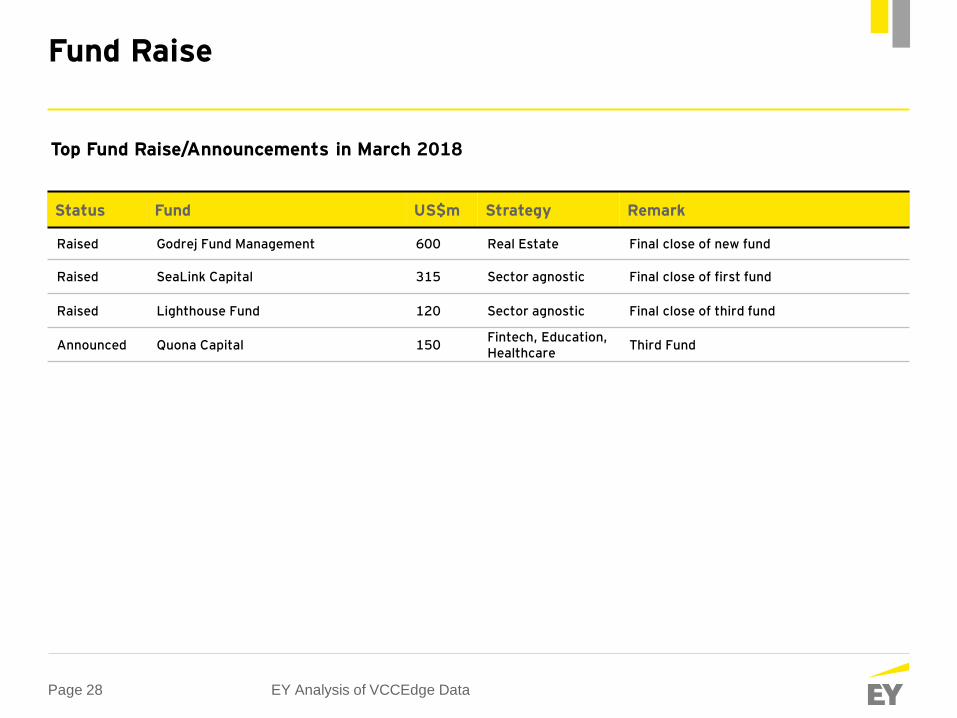
Fund Raise
EY Analysis of VCCEdge Data
Status Fund US$m Strategy Remark
Raised Godrej Fund Management 600 Real Estate Final close of new fund
Raised SeaLink Capital 315 Sector agnostic Final close of first fund
Raised Lighthouse Fund 120 Sector agnostic Final close of third fund
Announced Quona Capital 150Fintech, Education, Healthcare
Third Fund
Top Fund Raise/Announcements in March 2018
Page 29
Ernst & Young LLP
EY | Assurance | Tax | Transactions | Advisory
About EYEY is a global leader in assurance, tax, transaction and advisory services. The insights and quality services we deliver help build trust and confidence in the capital markets and in economies the world over. We develop outstanding leaders who team to deliver on our promises to all of our stakeholders. In so doing, we play a critical role in building a better working world for our people, for our clients and for our communities.
EY refers to the global organization, and may refer to one or more, of the member firms of Ernst & Young Global Limited, each of which is a separate legal entity. Ernst & Young Global Limited, a UK company limited by guarantee, does not provide services to clients. For more information about our organization, please visit ey.com.
Ernst & Young LLP is one of the Indian client serving member firms of EYGM Limited. For more information about our organization, please visit www.ey.com/in.
Ernst & Young LLP is a Limited Liability Partnership, registered under the Limited Liability Partnership Act, 2008 in India, having its registered office at 22 Camac Street, 3rd Floor, Block C, Kolkata – 700016
© 2018 Ernst & Young LLP. Published in India. All Rights Reserved.
This publication contains information in summary form and is therefore intended for general guidance only. It is not intended to be a substitute for detailed research or the exercise of professional judgment. Neither EYGM Limited nor any other member of the global Ernst & Young organization can accept any responsibility for loss occasioned to any person acting or refraining from action as a result of any material in this publication. On any specific matter, reference should be made to the appropriate advisor.
Contacts
Private Equity Services Practice
Vivek SoniPartner and National LeaderE: [email protected]
Dilip DusijaAssociate PartnerE: [email protected]
Narendra Rohira
Partner, Transaction Tax
Nachiket Deo
Partner, Transaction Tax
Subramaniam Krishnan
Partner, Tax & Regulatory Services
Transaction Advisory Services
Amit Khandelwal
Partner and National Leader
Ajay Arora
Partner and National Leader
M&A Practice
Navin Vohra
Partner
Valuation & Business Modeling
Research and Insights
Allwyn D’Souza
Manager
Brand, Marketing and Communications
Pooja Bhalla Mathur
Vice President
Shreya Sharma
Assistant Manager