Embed Size (px)
DESCRIPTION
Undergraduate Group Presentation at Oklahoma State University in Fall 2008.
Citation preview
Ujiro Okiomah
Justin Myers
Odie Freeman
Nuri Hoo
Victor Cantu
Industry Analyst
Environmental Analyst
Quality Analyst
Policy Analyst
Customer Service Analyst
The History The History
The Environment The Environment
Quality Quality
Policy Policy
Price Price
Ujiro OkiomahIndustry Analyst
TEXT TEXT TEXT TEXTOil Production & Gas prices:• U.S. oil production peaked in the 1970’s at 11.3
million barrels a day.
• The Iran-Iraq War forced OPEC to raise oil prices to $34 a barrel, more than 10 time the price in 1972.
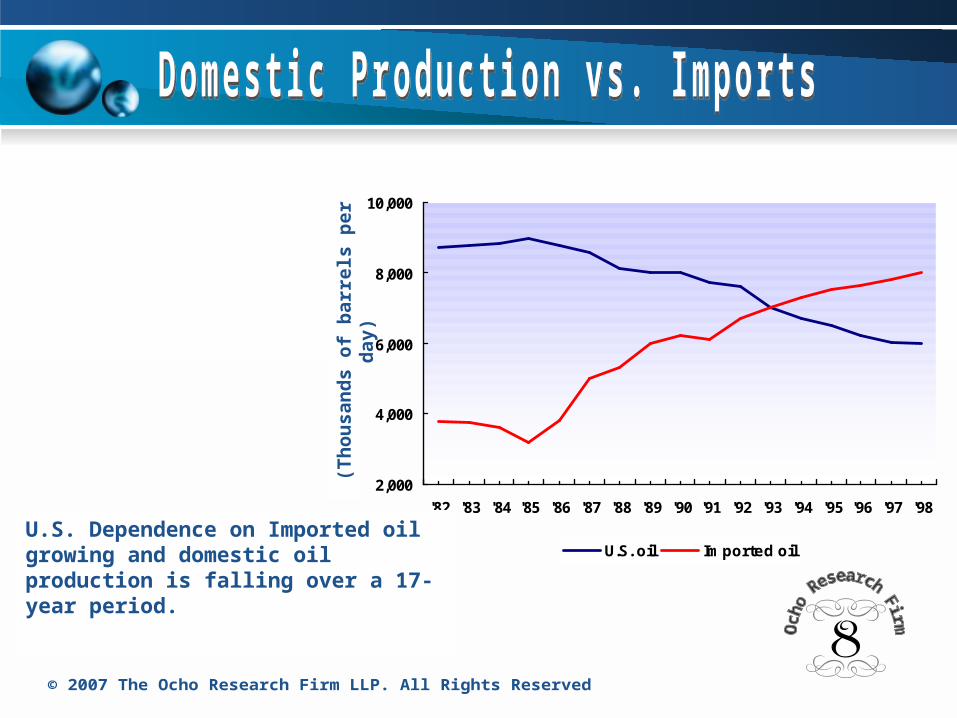
2,000
4,000
6,000
8,000
10,000
'82 '83 '84 '85 '86 '87 '88 '89 '90 '91 '92 '93 '94 '95 '96 '97 '98
U.S. oil Imported oil
(Th
ou
san
ds
of
bar
rels
per
day
)
U.S. Dependence on Imported oil growing and domestic oil production is falling over a 17-year period.
TEXTMergers & Buyouts:• The Arab oil embargo of 1973 rose gas price
higher.• In 1979, Ford bought 25% of Mazda Motor
Company.• In the early 1990, Honda Accord becomes the
nations best selling car.
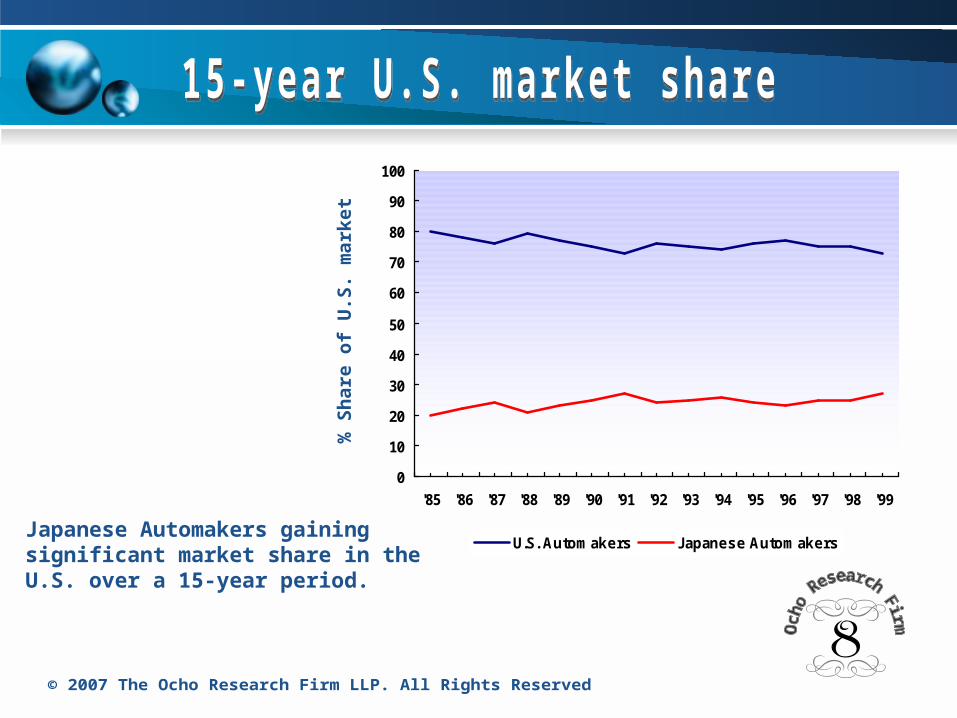
0
10
20
30
40
50
60
70
80
90
100
'85 '86 '87 '88 '89 '90 '91 '92 '93 '94 '95 '96 '97 '98 '99
U.S. Automakers Japanese Automakers
% S
har
e o
f U
.S.
mar
ket
Japanese Automakers gaining significant market share in the U.S. over a 15-year period.
TEXT TEXT TEXT TEXT
“U.S. automakers moved in a direction of production quantity rather than production quality.”
• Brand Extension:
General Motors has 7 brands in production.
Ford Motor Company has 8 brands in production.
Federal Government Intervention:
• In 1979,The nations third largest automaker Chrysler was on the verge of filing for Bankruptcy.
• In 1980, all three automakers posted losses of over $4 billion.
• Chrysler became the largest company in U.S. history to ask for help from the federal government.
The History The History
The Environment The Environment
Quality Quality
Policy Policy
Price Price

Justin MyersEnvironmental Analyst
TEXT TEXT TEXT
TEXT TEXT TEXT
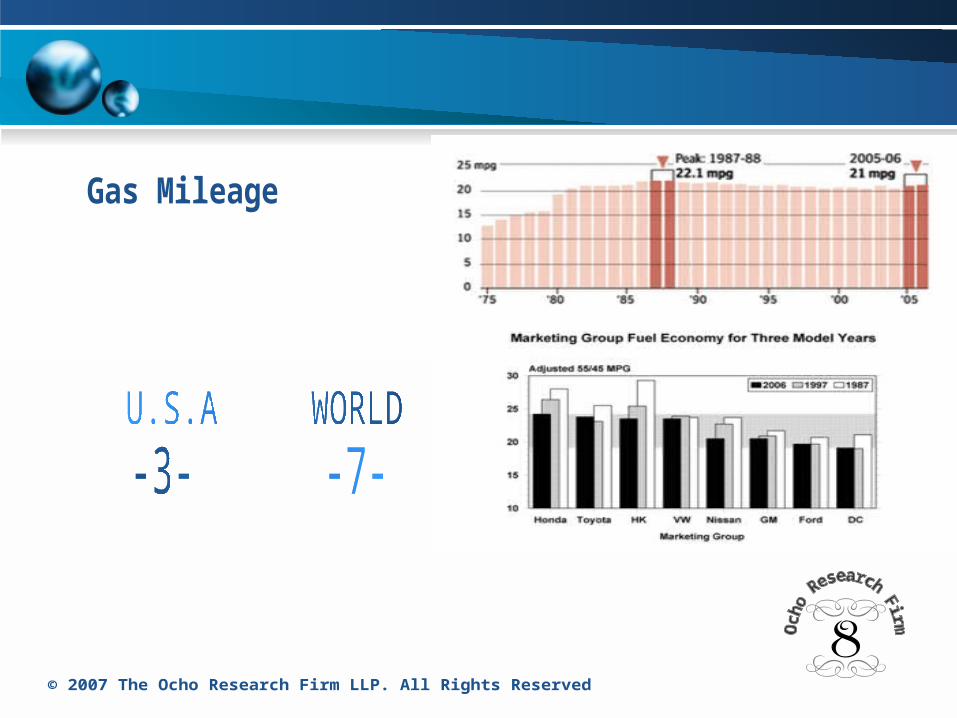
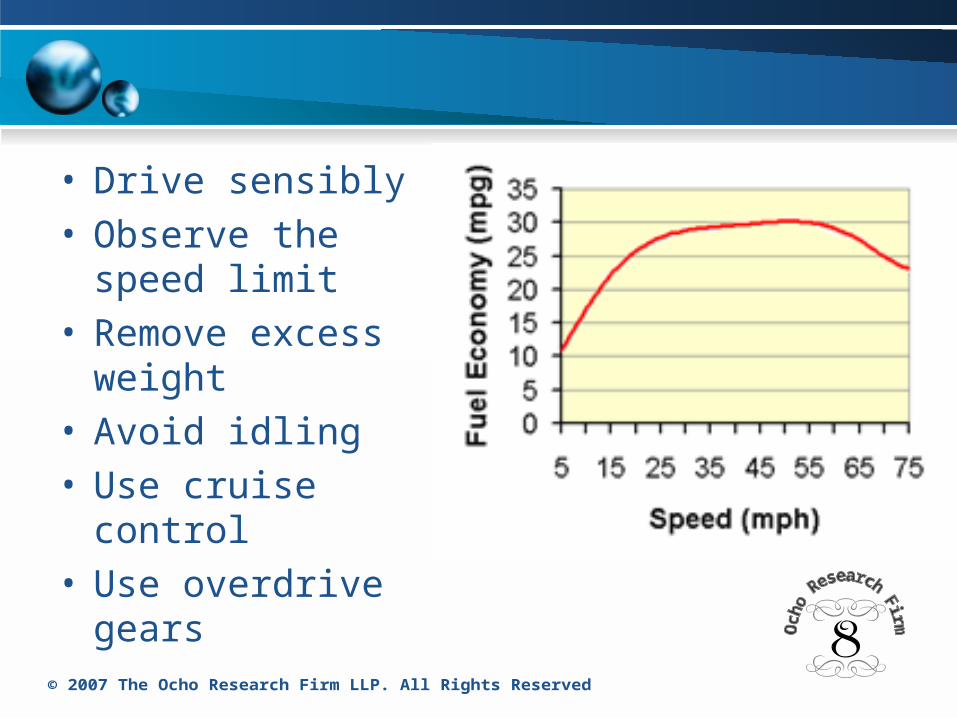
• Drive sensibly• Observe the speed
limit • Remove excess
weight • Avoid idling• Use cruise control• Use overdrive gears
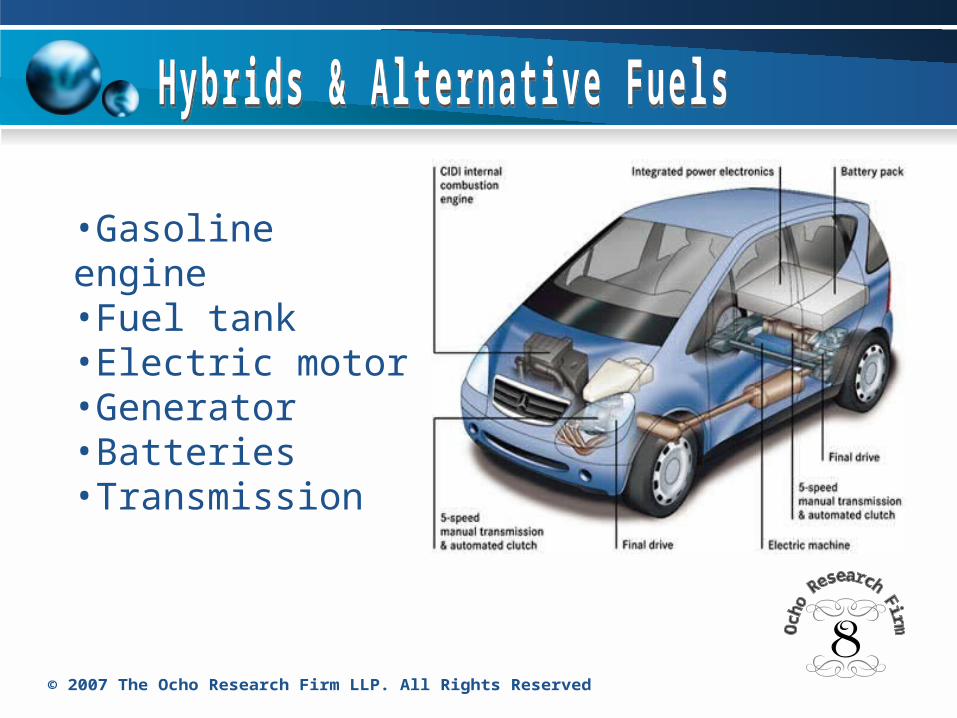
TEXT TEXT TEXT TEXT•Gasoline engine•Fuel tank•Electric motor•Generator•Batteries•Transmission
TEXT TEXT TEXT TEXT
TEXT TEXT TEXT TEXT
•Reduced tailpipe emissions
•Improve gas mileage
•Corporate Average Fuel Economy Standards
•Tax breaks
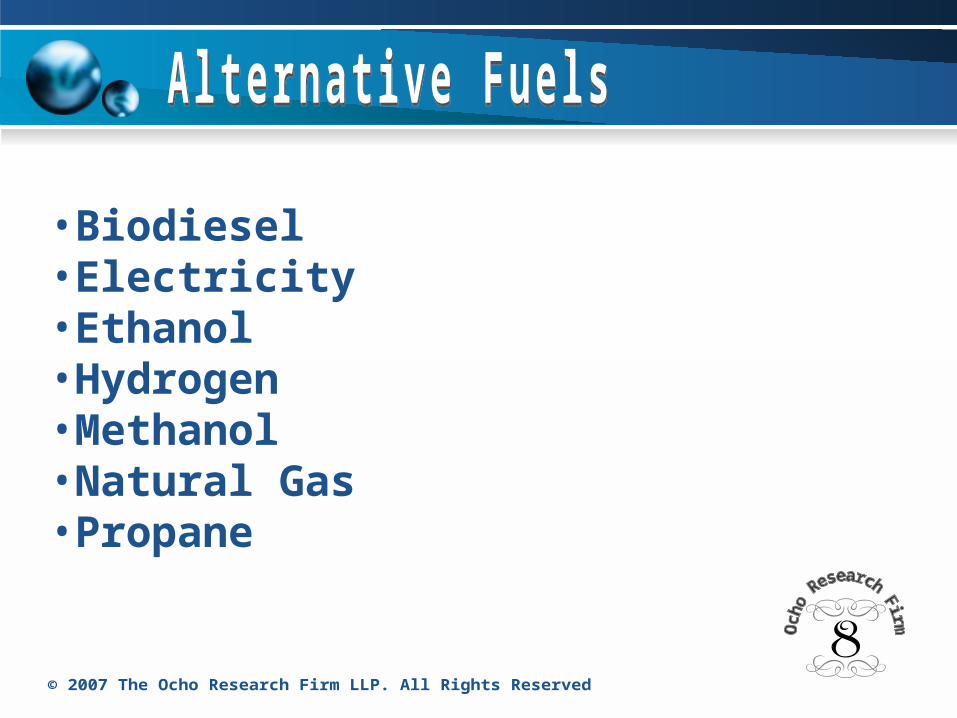
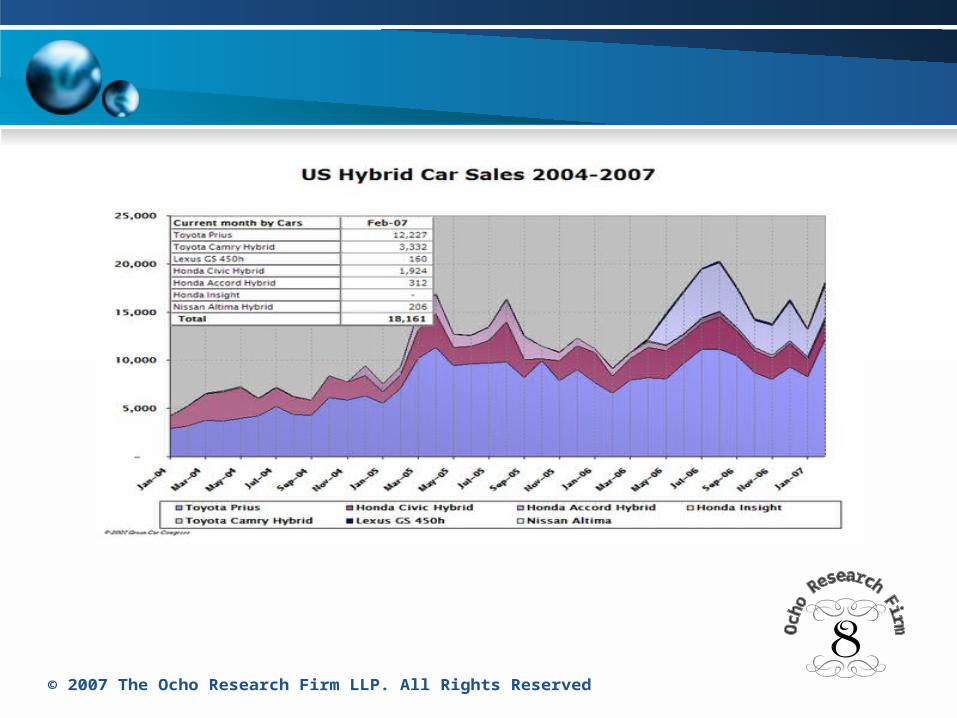
TEXT TEXT TEXT•Biodiesel •Electricity•Ethanol•Hydrogen•Methanol•Natural Gas•Propane

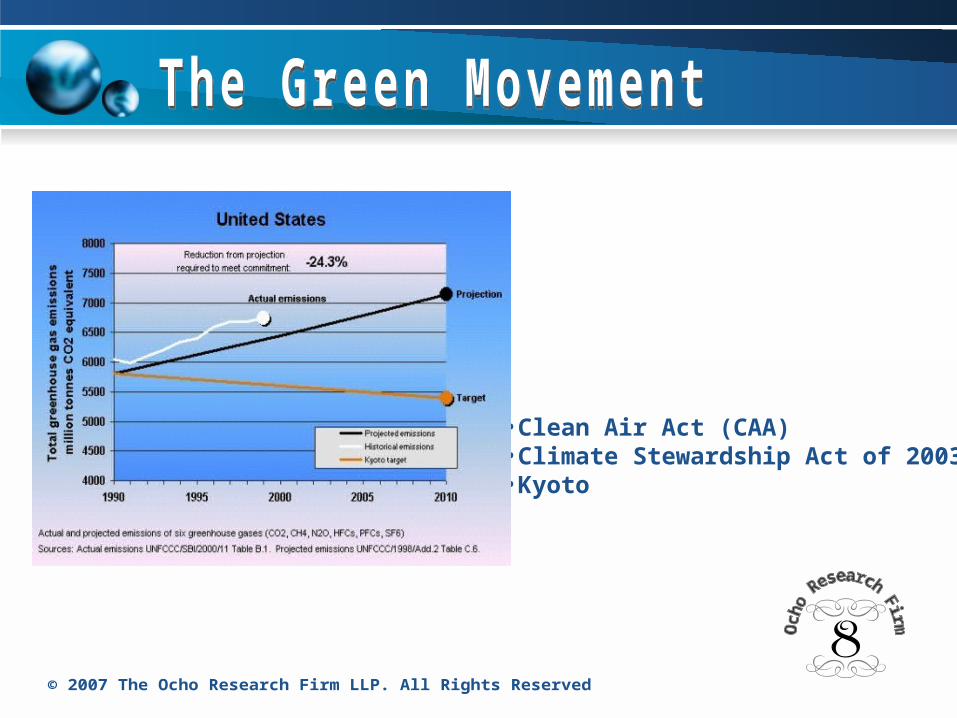
•Clean Air Act (CAA) •Climate Stewardship Act of 2003•Kyoto
The History The History
The Environment The Environment
Quality Quality
Policy Policy
Price Price

Odie FreemanQuality Analyst
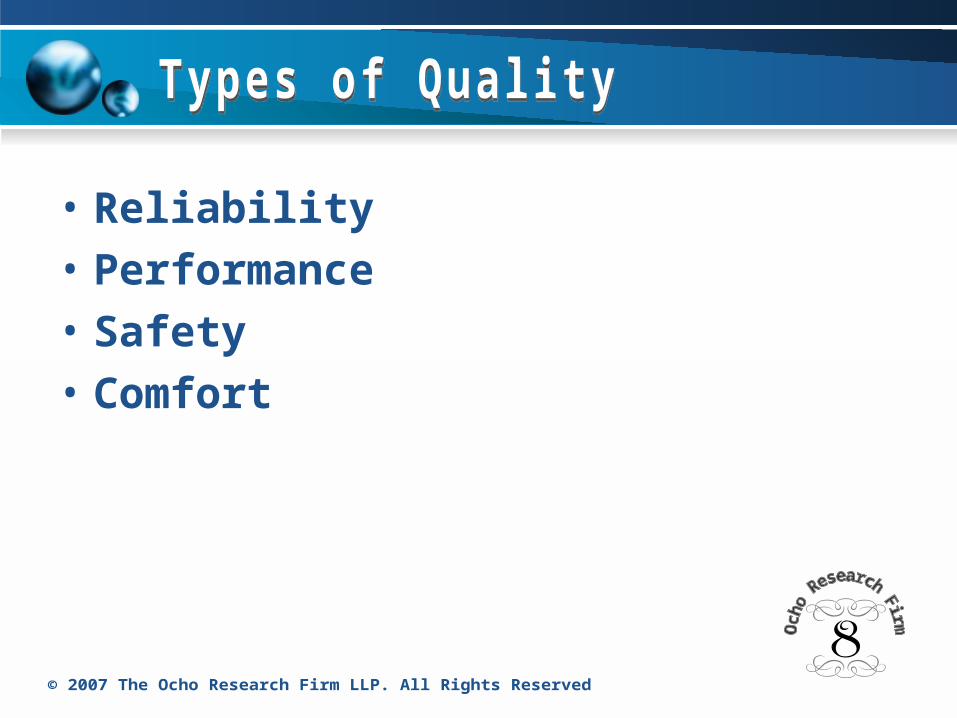
• Reliability
• Performance
• Safety
• Comfort
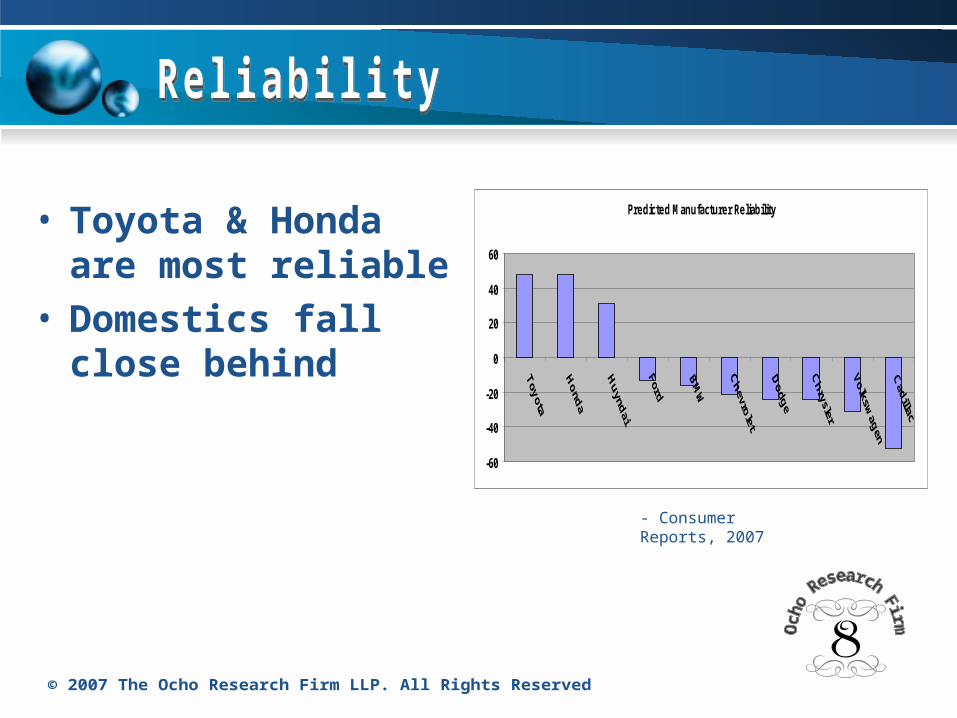
• Toyota & Honda are most reliable
• Domestics fall close behind
Predicted Manufacturer Reliability
-60
-40
-20
0
20
40
60
- Consumer Reports, 2007
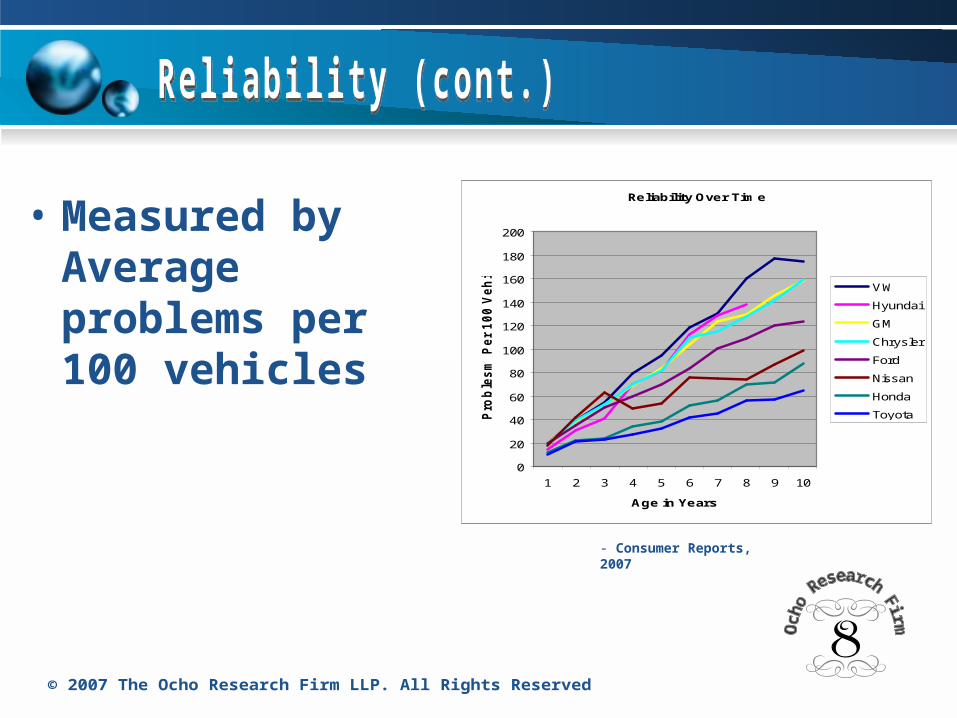
• Measured by Average problems per 100 vehicles
Reliability Over Time
0
20
40
60
80
100
120
140
160
180
200
1 2 3 4 5 6 7 8 9 10
Age in Years
Pro
ble
sm
Per
100 V
eh
icle
s
VW
Hyundai
GM
Chrysler
Ford
Nissan
Honda
Toyota
- Consumer Reports, 2007
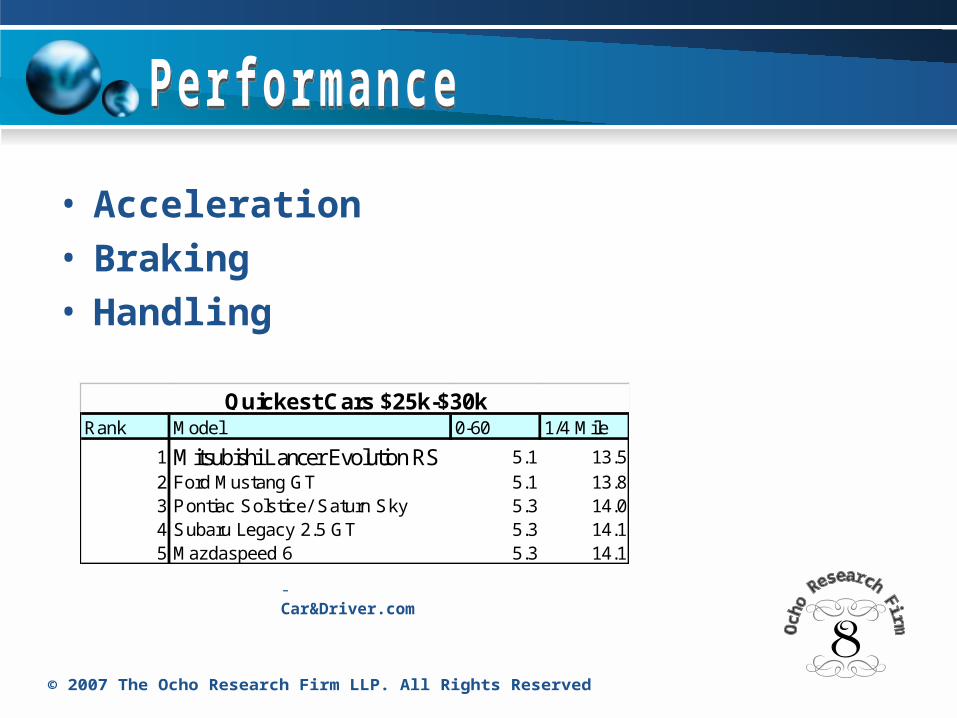
• Acceleration• Braking• Handling
Rank Model 0-60 1/4 Mile
1 Mitsubishi Lancer Evolution RS 5.1 13.52 Ford Mustang GT 5.1 13.83 Pontiac Solstice/ Saturn Sky 5.3 14.04 Subaru Legacy 2.5 GT 5.3 14.15 Mazdaspeed 6 5.3 14.1
Quickest Cars $25k-$30k
- Car&Driver.com
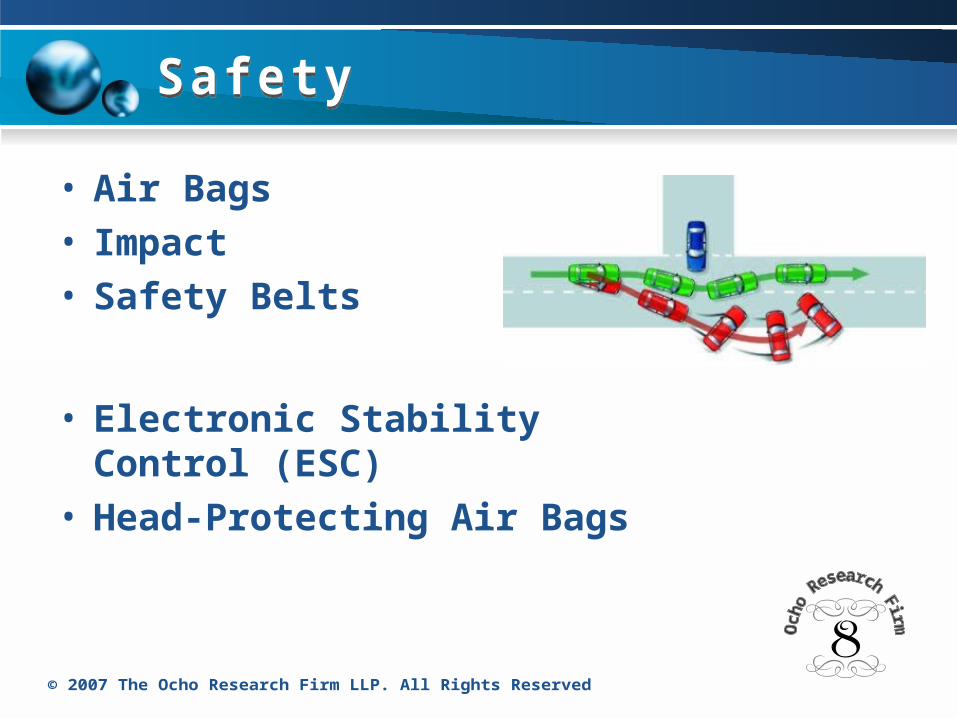
• Air Bags• Impact• Safety Belts
• Electronic Stability Control (ESC)• Head-Protecting Air Bags
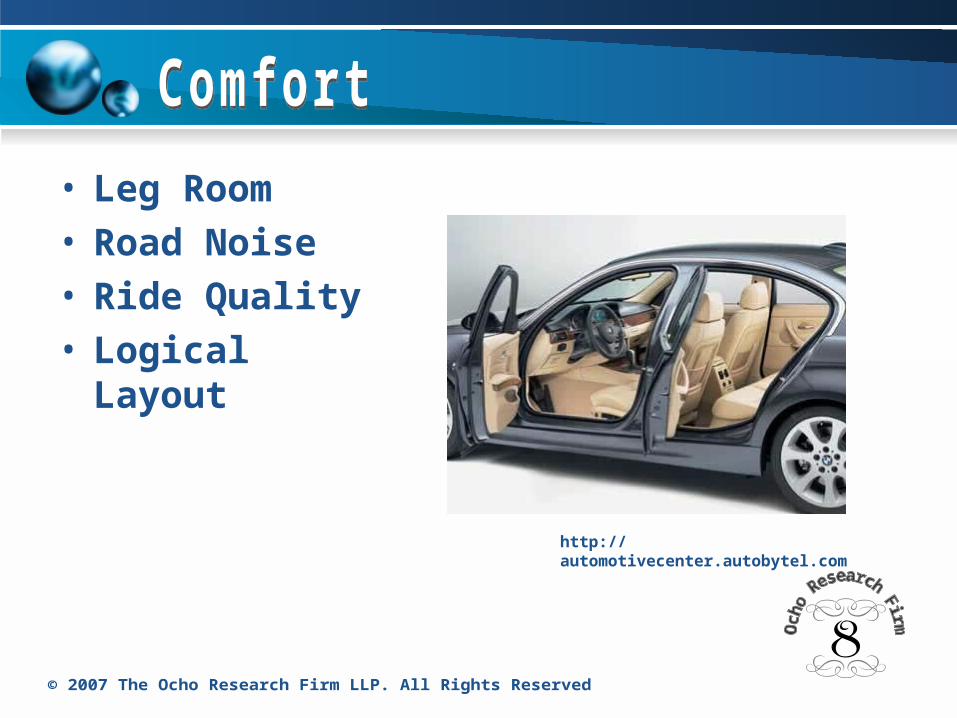
• Leg Room• Road Noise• Ride Quality• Logical Layout
http://automotivecenter.autobytel.com
The History The History
The Environment The Environment
Quality Quality
Policy Policy
Pride Pride
Nuri HooPolicy Analyst
• Declining sales
• Policy of AAA
• Policy of Toyota
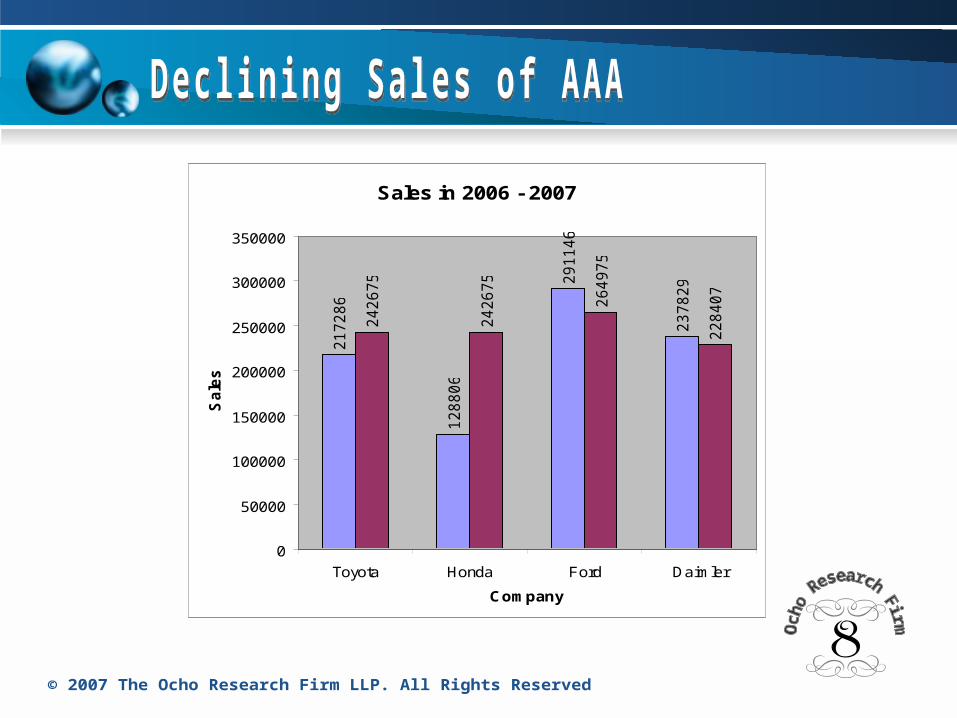
Sales in 2006 - 2007
21
72
86
12
88
06
29
11
46
23
78
29
24
26
75
24
26
75
26
49
75
22
84
07
0
50000
100000
150000
200000
250000
300000
350000
Toyota Honda Ford Daimler
Company
Sa
les
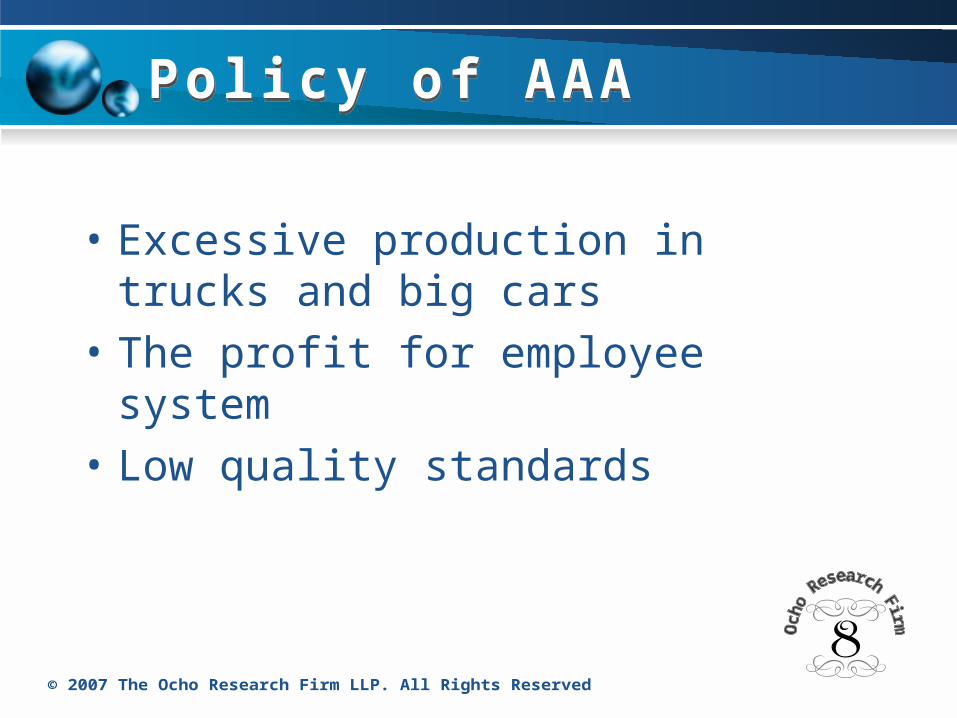
• Excessive production in trucks and big cars
• The profit for employee system
• Low quality standards
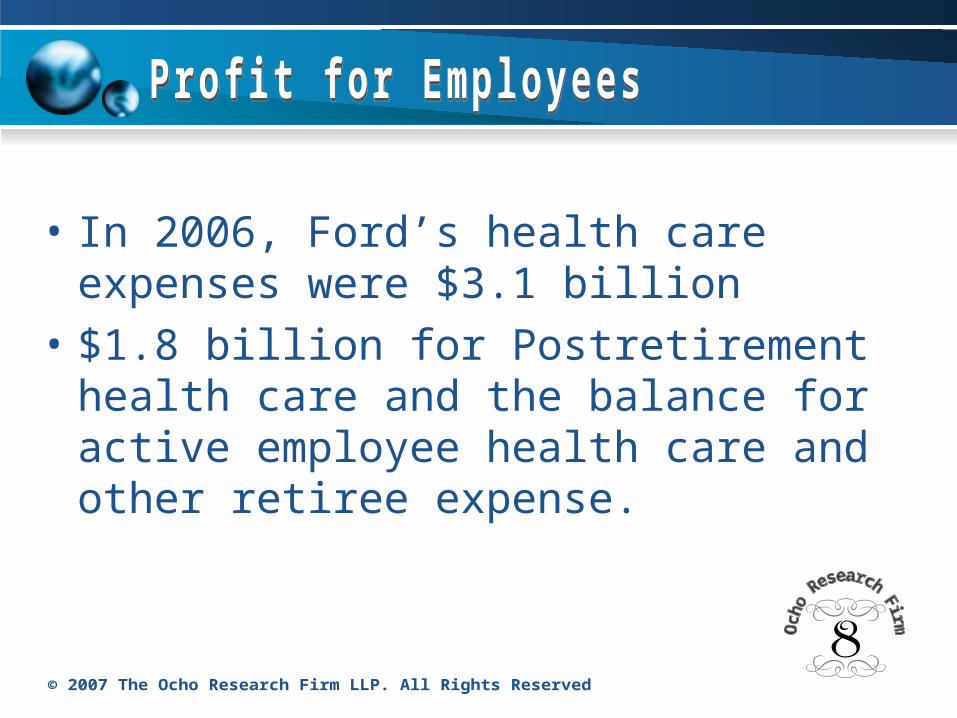
• In 2006, Ford’s health care expenses were $3.1 billion
• $1.8 billion for Postretirement health care and the balance for active employee health care and other retiree expense.
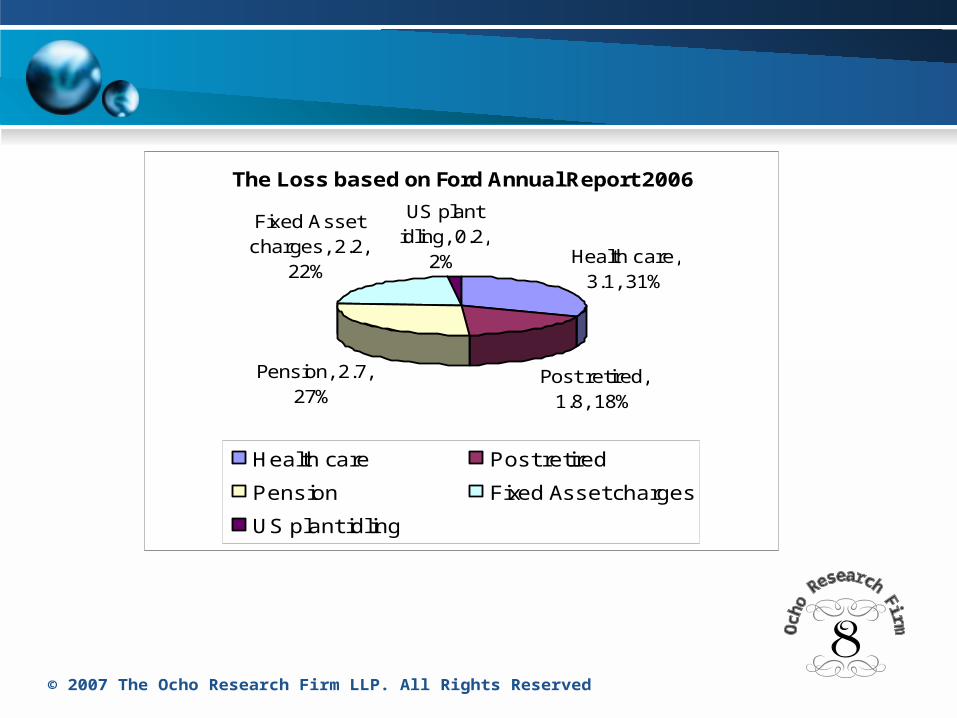
The Loss based on Ford Annual Report 2006
Health care, 3.1, 31%
Post retired, 1.8, 18%
Pension, 2.7, 27%
Fixed Asset charges, 2.2,
22%
US plant idling, 0.2,
2%
Health care Post retired
Pension Fixed Asset charges
US plant idling
• Emphasize on market trend
• Limited profit sharing with their employee
• High quality standards
• Toyota only spent $1.3 billion for their pension and job benefit policy.
• They have a point system for the pension plan:– Service period– Job Title– Performance
The History The History
The Environment The Environment
Quality Quality
PolicyPolicy
PridePride

Victor CantuCustomer Service Analyst
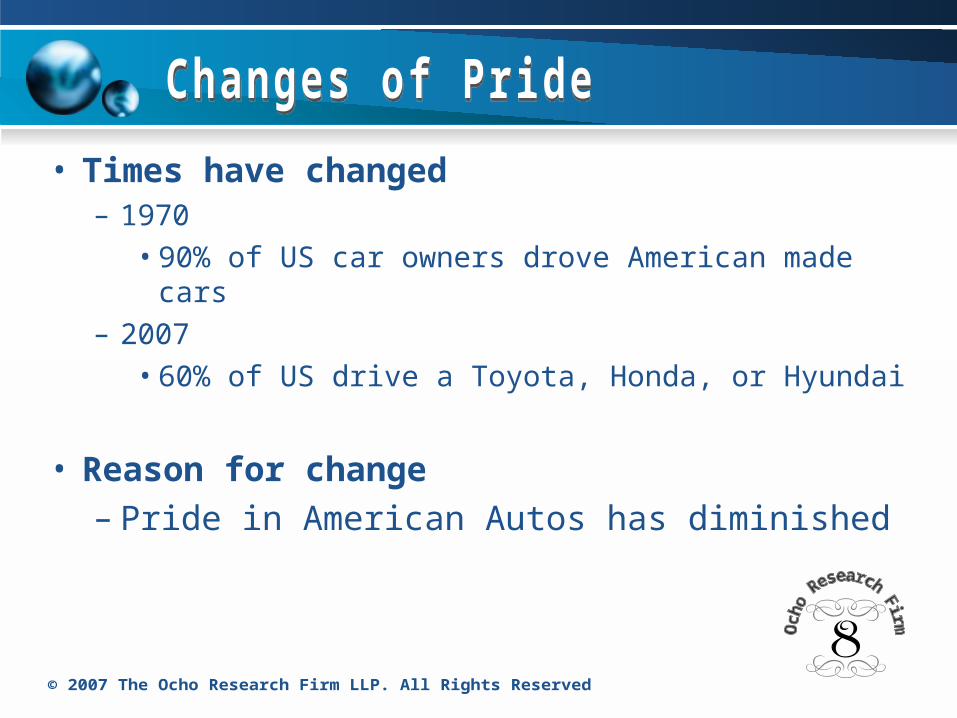
• Times have changed– 1970
• 90% of US car owners drove American made cars– 2007
• 60% of US drive a Toyota, Honda, or Hyundai
• Reason for change – Pride in American Autos has diminished
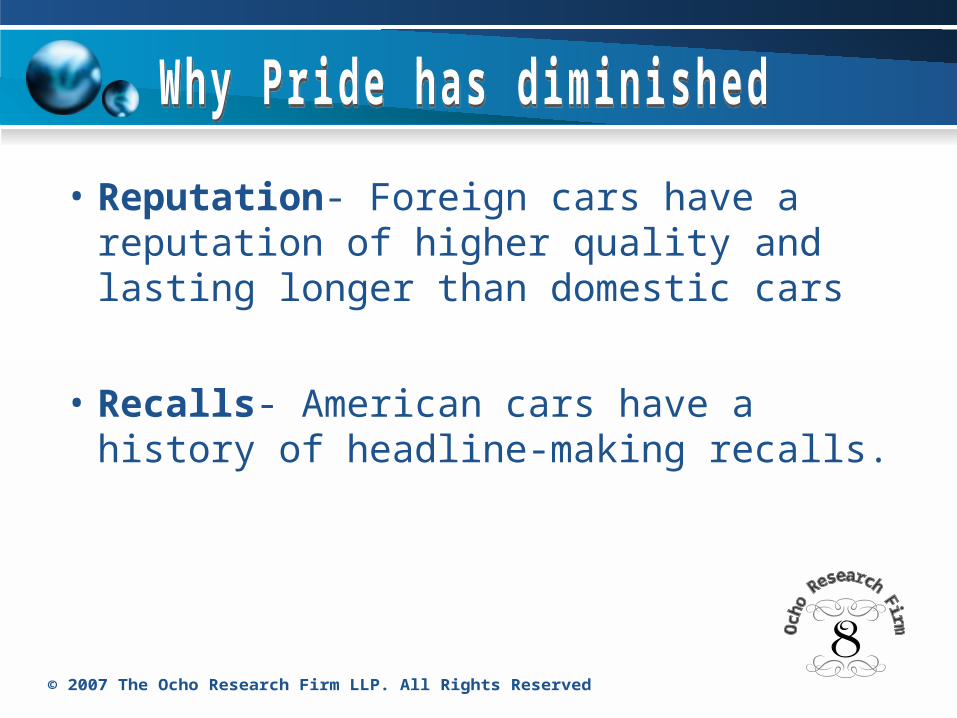
• Reputation- Foreign cars have a reputation of higher quality and lasting longer than domestic cars
• Recalls- American cars have a history of headline-making recalls.
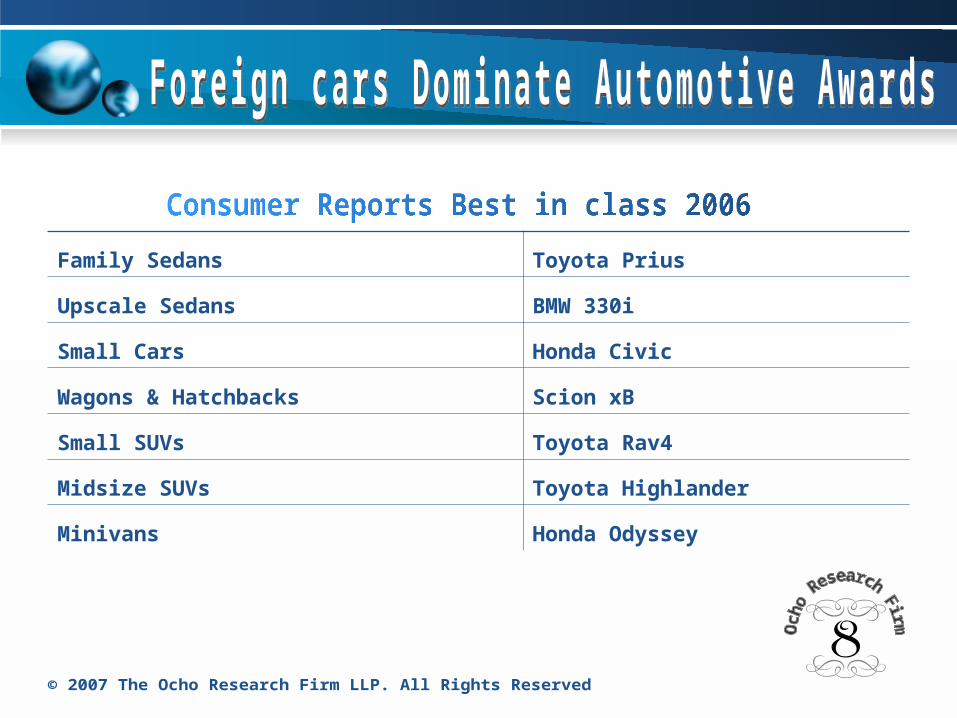
Family Sedans Toyota Prius
Upscale Sedans BMW 330i
Small Cars Honda Civic
Wagons & Hatchbacks Scion xB
Small SUVs Toyota Rav4
Midsize SUVs Toyota Highlander
Minivans Honda Odyssey
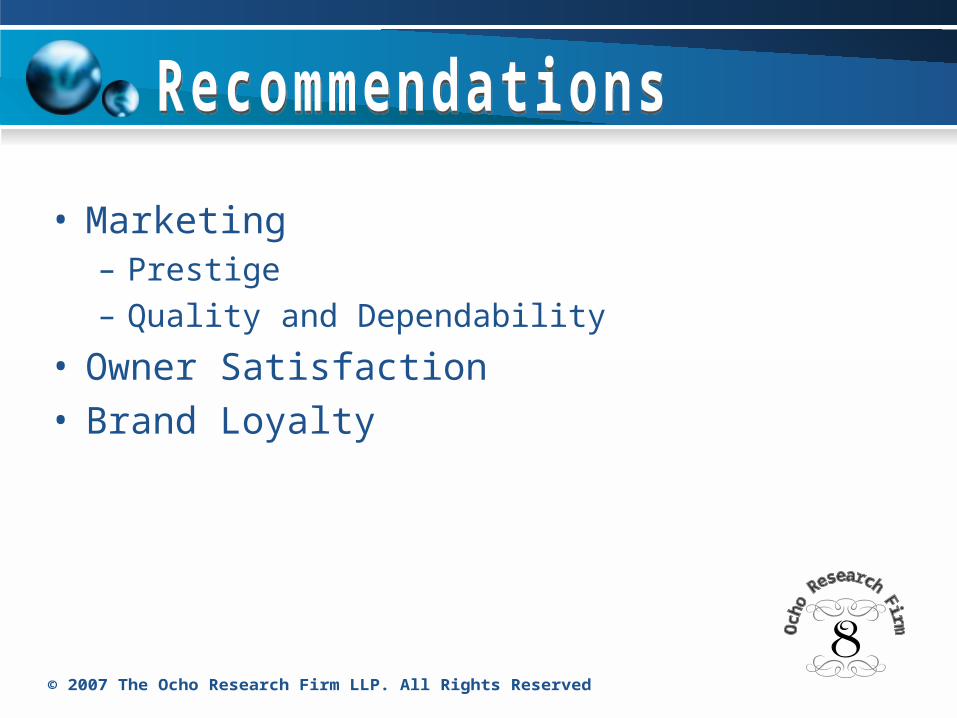
• Marketing– Prestige– Quality and Dependability
• Owner Satisfaction• Brand Loyalty
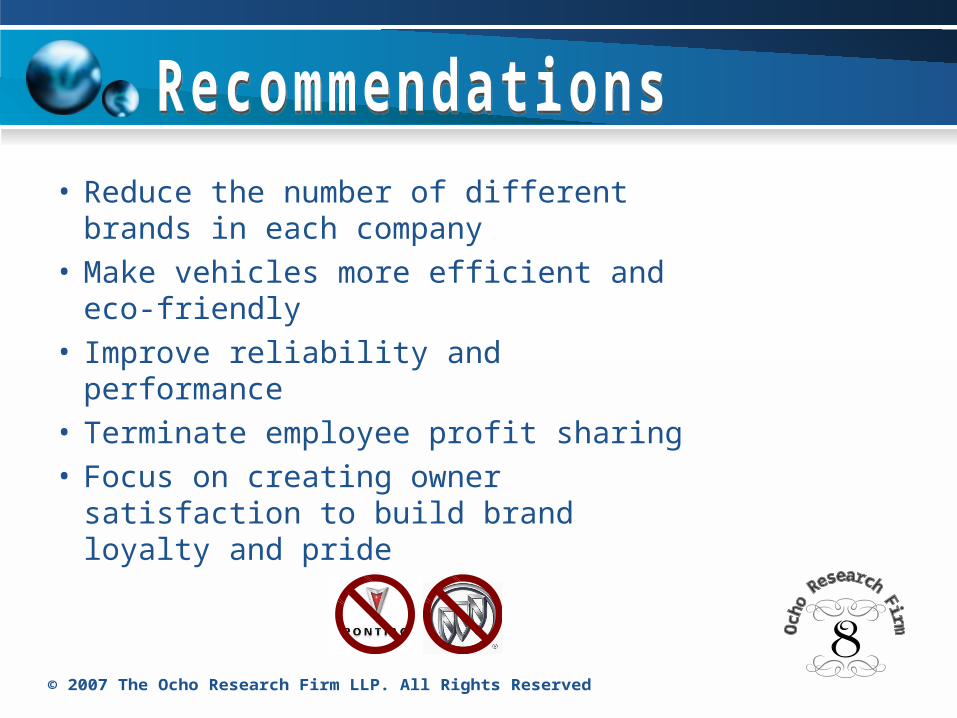
• Reduce the number of different brands in each company
• Make vehicles more efficient and eco-friendly
• Improve reliability and performance• Terminate employee profit sharing • Focus on creating owner satisfaction to
build brand loyalty and pride