Embed Size (px)
Citation preview
Supervisor: Johan Brink and Evangelos Bourelos Master Degree Project No. 2016:169 Graduate School
Master Degree Project in Innovation and Industrial Management
How can IT Contribute to Servitization in Manufacturing
Firms?
An investigation of the strategic role of the IT organization
Klaus Schrenker
I
ABSTRACT
This work adds to the vast body of literature on servitization in manufacturing firms by
investigating the contribution of dynamic capabilities and the strategic role of the IT
organization to servitization. Specifically, the study develops three strategic roles the
IT organization can play, based on an extensive literature review, and designs
indicators which enable the measurement of these roles together with dynamic
capabilities. The theoretical foundations were built by performing an extensive
literature research on servitization, with focus on dynamic capabilities and Information
Technology in particular. Primary data was obtained by executing a web-based survey
to collect data on the degree and importance of servitization, the current role of IT and
the possession of dynamic capabilities in participating companies. Using cross
tabulation and frequency analyses to examine the small sample (N=19), tendencies in
the relationships could be found. Most survey respondents expect an increasing
importance of Product-Service Systems (PSS) and service orientation for their firms in
the future. Manufacturing firms with a strong current service orientation seem to employ
dynamic sensing capabilities. A connection between a high service orientation and
dynamic seizing or reconfiguring capabilities could not be confirmed. Regarding the
role of IT, tendencies towards a positive relationship between a strong Innovation
Enabler role of IT and a high importance of the IT organization for PSS development,
respectively PSS delivery were discovered. Furthermore, the role of IT as a Solution
Integrator appears to be positively related to the importance of IT for PSS delivery. The
study concludes with managerial implications for the strategic role of the IT
organization against the background of servitization and gives suggestions for the
alignment between business and IT.
II
ZUSAMMENFASSUNG
Diese Arbeit trägt zur umfangreichen, aber noch lange nicht vollständigen Sammlung
wissenschaftlicher Arbeiten zum Thema Servitization in Industrieunternehmen bei. Im
Detail wurden der Einfluss von dynamischen Fähigkeiten und der strategischen Rolle
der IT Organisation auf Servitization untersucht. Basierend auf einer umfangreichen
Literaturanalyse wurden drei strategische Rollen entwickelt, die eine IT Organisation
einnehmen kann. Für diese Rollen, sowie für die im Rahmen von Servitization
besonders wichtigen dynamischen Fähigkeiten, wurden Indikatoren konstruiert um
eine Messung zu ermöglichen. Die Sammlung von Primärdaten zur momentanen und
zukünftigen Bedeutung von Produkt-Service Systemen (PSS), der Service
Orientierung, der Bedeutung der IT Organisation für PSS, als auch zu dynamischen
Fähigkeiten und der aktuellen Rolle der IT erfolgte mittels einer Online-Umfrage. Eine
deskriptive Auswertung des leider geringen Rücklaufs (N=19) ergab, dass der Großteil
der befragten Industrieunternehmen für die Zukunft eine zunehmende Bedeutung von
PSS und Service Orientierung erwartet. Umfrageteilnehmer, die eine hohe Service
Orientierung angaben, bestätigten den Besitz von dynamischen Sensing-Fähigkeiten,
während keine Verbindung zwischen einer hohen Service Orientierung und
dynamischen Seizing-, bzw. Reconfiguring-Fähigkeiten nachgewiesen werden konnte.
Bezüglich der Rolle der IT scheinen Charakteristika die eine Innovation Enabler Rolle
klassifizieren, eine positive Beziehung mit der Bedeutung der IT Organisation für die
Entwicklung, als auch Lieferung von PSS zu haben. Die Rolle der IT als Solution
Integrator hingegen scheint einen positiven Einfluss auf die Bedeutung der IT
Organisation für die Lieferung von PSS zu haben. Letztendlich kommt die Studie zu
dem Ergebnis, dass Industrieunternehmen die strategische Rolle der IT Organisation,
im speziellen bezüglich der externen Orientierung und Wertschöpfung überdenken
sollten, um den unterschiedlichen und oft widersprüchlichen Anforderungen von
Servitization gerecht zu werden. Vor diesem Hintergrund wird empfohlen ein
besonderes Augenmerk auf die strategische und funktionale Ausrichtung (Alignement)
zwischen Business und IT zu legen.
III
TABLE OF CONTENTS
ABSTRACT _______________________________________________________________ I
ZUSAMMENFASSUNG ____________________________________________________ II
FIGURES AND TABLES ____________________________________________________ V
ABBREVIATIONS _________________________________________________________ VI
1.1 Problem under Study and Research Gap _____________________________ 1
1.2 Research Questions ______________________________________________ 2
1.3 Outline of the Thesis ______________________________________________ 3
1.4 The Industry Partner - Detecon _____________________________________ 3
2.1 Literature Review Approach ________________________________________ 5
2.2 Servitization _____________________________________________________ 6
2.2.1 Related Terms and Research Communities _______________________ 6
2.2.2 Drivers of Servitization ________________________________________ 8
2.2.3 Forms of Servitization_________________________________________ 9
2.2.4 Challenges in Moving into Services _____________________________ 10
2.2.5 The Service Paradox ________________________________________ 12
2.2.6 Measuring Servitization ______________________________________ 12
2.2.7 The Process of Servitization___________________________________ 13
2.3 Dynamic Capability Framework ____________________________________ 14
2.3.1 The Evolution of Dynamic Capabilities ___________________________ 15
2.3.2 Capability Building __________________________________________ 15
2.3.3 Operational Capabilities ______________________________________ 16
2.3.4 Dynamic Capabilities ________________________________________ 17
2.3.4.1 Sensing Capabilities _________________________________ 18
2.3.4.2 Seizing Capabilities __________________________________ 18
2.3.4.3 Reconfiguring Capabilities ____________________________ 19
2.4 The Role of IT for Servitization _____________________________________ 19
2.4.1 Vision of IT ________________________________________________ 20
2.4.2 Mission of IT _______________________________________________ 22
2.4.3 IT Governance and Degree of Centralization ______________________ 22
2.4.4 IT Controlling - Cost structure of IT _____________________________ 26
3.1 Research Type and Approach _____________________________________ 32
IV
3.2 Hypotheses _____________________________________________________ 32
3.3 Research Methodology ___________________________________________ 33
3.3.1 Quality of the Research ______________________________________ 34
3.3.2 Survey Design _____________________________________________ 35
3.3.3 Data Collection _____________________________________________ 37
3.4 Data Analysis and Demographic Information _________________________ 38
4.1 Survey Results __________________________________________________ 41
4.1.1 General Observations on Servitization ___________________________ 41
4.1.2 Dynamic Capabilities ________________________________________ 42
4.1.3 The Role of IT _____________________________________________ 43
4.2 Conclusion and Managerial Implications ____________________________ 46
4.3 Limitations _____________________________________________________ 50
4.4 Suggestions for Further Research __________________________________ 51
REFERENCES __________________________________________________________ VII
Servitization Survey __________________________________________________ xiv
Survey Data________________________________________________________ xxiii
Demographic Information __________________________________________ xxiii
Servitization Measures _____________________________________________ xxv
Dynamic Capability Measures ______________________________________ xxvii
Role of IT Measures ______________________________________________ xxix
V
FIGURES AND TABLES
Figure 1: The study follows a deductive process _______________________________________ 3
Figure 2: Detecon offices worldwide _________________________________________________ 4
Figure 3: Forms of servitization ____________________________________________________ 10
Figure 4: Architecture of challenges ________________________________________________ 11
Figure 5: The service paradox _____________________________________________________ 12
Figure 6: Organizational capability building __________________________________________ 16
Figure 7: IT Portfolio _____________________________________________________________ 24
Figure 8: IT Governance - Degree of centralization ____________________________________ 26
Figure 9: Areas of IT controlling along the IT process model ____________________________ 28
Figure 10: IT’s value proposition ___________________________________________________ 29
Figure 11: Hypotheses ____________________________________________________________ 33
Figure 12: Survey structure ________________________________________________________ 36
Figure 13: Strategic Alignment Model _______________________________________________ 48
Figure 14: Modified Strategic Alignment Model _______________________________________ 49
Figure 15: Value contribution of IT roles _____________________________________________ 50
Table 1: Literature search keywords _________________________________________________ 5
Table 2: Five forms of servitization _________________________________________________ 10
Table 3: Survey questions for measuring servitization _________________________________ 13
Table 4: Literature for dynamic capability indicators ___________________________________ 17
Table 5: PSS development and delivery _____________________________________________ 20
Table 6: Vision of IT ______________________________________________________________ 22
Table 7: Mission of IT _____________________________________________________________ 22
Table 8: IT Governance ___________________________________________________________ 23
Table 9: Advantages and disadvantages of IT Governance models_______________________ 25
Table 10: Degree of centralization __________________________________________________ 26
Table 11: Center types ____________________________________________________________ 31
Table 12: Cost structure of IT ______________________________________________________ 31
Table 13: Hypotheses ____________________________________________________________ 33
Table 14: Data collection summary _________________________________________________ 38
Table 15: Hypotheses related to dynamic capabilities __________________________________ 43
Table 16: Hypotheses related to the Role of IT ________________________________________ 46
VI
ABBREVIATIONS
DC Dynamic Capability
DCF Dynamic Capability Framework
ERP Enterprise Resource Planning
ICT Information and Communication Technology
IS Information Systems
IT Information Technology
PSS Product Service System
RBV Resource-Based View
RQ Research Question
SAM Strategic Alignment Model
SDL Service Dominant Logic
1
1 INTRODUCTION
Chapter one briefly discusses the problem under study together with its wider
background. The identified research gap is presented, followed by the research
questions aiming to address it. Furthermore, the outline of the study, as well as the
industry partner, are introduced.
1.1 Problem under Study and Research Gap
Industrial manufacturing firms are increasingly driven to abandon their traditional
product-focused business model and move towards a more service-oriented business
model (Teece 2010). Reasons that challenge manufacturers to reassess their business
logic are among others stagnating markets, growing commoditization, new
technological trends, and increasingly demanding customers. (Leseure et al. 2010).
According to Grönroos (2000) "Customers do not look for goods or services per se;
they look for solutions that serve their own value-generating processes" (Grönroos
2000, p.4). In other words, customers increasingly demand complex solutions instead
of separate products and services. The transition from a product-oriented to a service-
oriented business logic in manufacturing firms became known as servitization
(Vandermerwe and Rada 1988).
In recent years, the majority of German and Swiss capital goods industries created
only a small percentage of their total revenue through services (72 percent created
less than 20 percent and 39 percent even less than 10 percent. (Gebauer and Fleisch
2007) Moreover, around 95 percent of the service revenues came from aftersales
activities such as spare parts, maintenance and repair or training services, resulting in
only 5 percent from innovative new services (Mahnel and Friedrich 2005; Gustafsson
et al. 2010). Innovative services in combination with products are expected to play a
crucial role for manufacturers in order to preserve competitiveness in the twenty-first
century (Baines and Lightfoot 2013). Information and communication technology (ICT)
is the foundation for most of these services and their integration with products (Song
et al. 2015; Huang and Rust 2013; Peppard and Ward 2004; Brashear Alejandro et al.
2013; Penttinen and Palmer 2007).
2
Since the late 1980s, interest in the research field of servitization has grown rapidly
(Baines et al. 2009). Major thematic research concerns are product-service
differentiation, competitive strategy, customer value, customer relationships, and
product-service configuration (Lightfoot et al. 2013). Moreover, previous research in
the field has dealt with the transition process (Mathieu 2001b; Penttinen and Palmer
2007) and organizational arrangements (Brashear et al. 2012; Neu and Brown 2005).
Even though several authors acknowledge the essential importance of information and
communication technology as an enabler for servitization (Neu and Brown 2005;
Penttinen and Palmer 2007; Huang and Rust 2013), the contribution of the IT
organization, which is usually responsible for its management has rarely been
investigated in this context. Consequently, the strategic management and strategic
positioning of the IT organization for servitization represents a research gap which this
study aims to examine.
1.2 Research Questions
In order to address the identified research gap, this study puts the strategic role of the
IT organization in manufacturing firms in the focus of attention. The aim is to
differentiate between different strategic roles of the IT organization, develop indicators
that allow the measurement and examination of these roles in relation to servitization
in manufacturing firms. For the purpose of doing so, the context of servitization and
particularly the transition process constitute a necessary framework. The theoretical
background of the study is therefore structured in three parts, as reflected by the
research questions.
RQ1 Understanding Servitization: What are major drivers, forms, and challenges?
RQ2 What are dynamic capabilities and how can they support servitization?
RQ3 Which strategic role should the IT organization play to enable servitization?
First, servitization is discussed with emphasis on major drivers, forms and challenges.
Second, the dynamic capability framework is examined due to its importance for the
transition process. The third part is concerned with the strategic role of IT and its
contribution to servitization. Furthermore, the objective of this study is to connect
3
Information Systems (IS) and Information Technology (IT) research to servitization
research, as well as to give ideas and suggestions for further research.
1.3 Outline of the Thesis
The study takes a deductive logic of reasoning (Figure 1) where theory guides research
and therefore the collection of data intends to revise theory (Bryman and Bell 2011).
Figure 1: The study follows a deductive process (Bryman and Bell 2011)
In the following chapter two, a detailed theoretical background relevant to understand
and connect the complex research fields of servitization and IT / IS research is
provided. The theoretical background forms the basis for generating and analyzing the
empirical results of this research. After the presentation of the research methodology
and a short outline of considerations regarding reliability, replicability and validity,
detailed information about the data collection methods and the data analysis is given
in chapter 3. Consequently, the empirical findings of the study are presented in relation
to the research questions and the theoretical background. Finally, a conclusion is
drawn and managerial implications are discussed, before indicating research
limitations and suggesting ideas and directions for future research.
1.4 The Industry Partner - Detecon
The industry partner of this research project is one of the world’s leading consulting
companies for ICT management consulting. Provided services focus on consulting and
4
the implementation of solutions which are derived from the use of information and
communications technology (ICT). Detecon’s portfolio comprises classic strategy and
organization consulting as well as the planning and implementation of complex,
technological ICT architectures and applications.
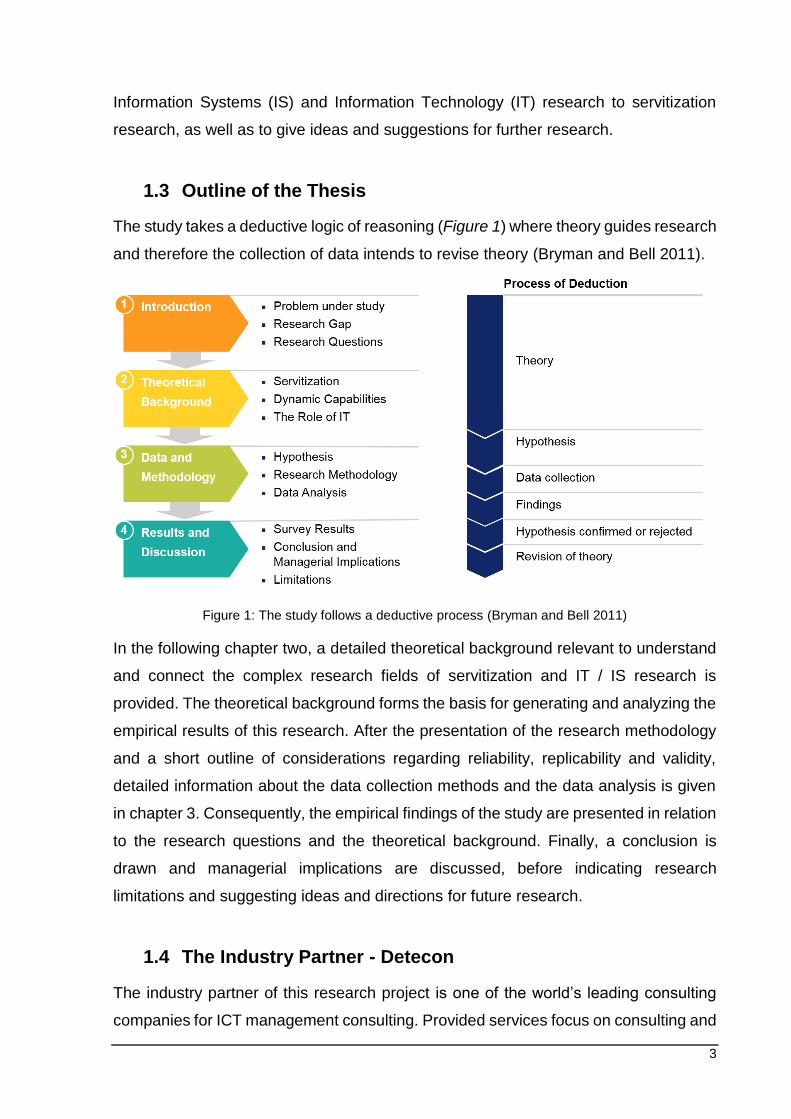
The company was founded in 1977, employs more than 1.200 associates around the
world and has realized more than 20.000 projects for clients in over 165 countries.
Figure 2 gives an overview of Detecon offices worldwide. Detecon is a subsidiary of T-
Systems International, the business customer brand of Deutsche Telekom.
Figure 2: Detecon offices worldwide (Company Presentation)
Due to their expertise in IT Strategy and a strong presence in the manufacturing
industry, Detecon supported this research endeavor.
5
2 THEORETICAL BACKGROUND
In this chapter, a multidisciplinary theoretical background is presented that forms the
basis of analysis for the following empirical study.
2.1 Literature Review Approach
In order to gain a comprehensive view on the analyzed concepts and for determining
the conceptual grounding, a systematic literature review was carried out (Bryman and
Bell 2011). Tranfield et al. (2003) define systematic review as “a replicable, scientific
and transparent process, in other words a detailed technology, that aims to minimize
bias through exhaustive literature searches of published and unpublished studies and
by providing an audit trail of the reviewer’s decisions, procedures and conclusions”
(Tranfield et al. 2003, p.209). Servitization within the wider manufacturing context is a
diverse and complex research field with several distinct research communities and
concepts (Lightfoot et al. 2013; Baines et al. 2009). A categorization and introduction
of the major research communities is given in 2.2.1 Related terms and research
communities. As a basis for the literature review, a search strategy was developed by
identifying relevant keywords, time frame, and data sources. The databases
EBSCOhost, Emerald Insight, ScienceDirect, Scopus, Web of Science, Wiley Online
Library, as well as the search engine Google Scholar were searched using the
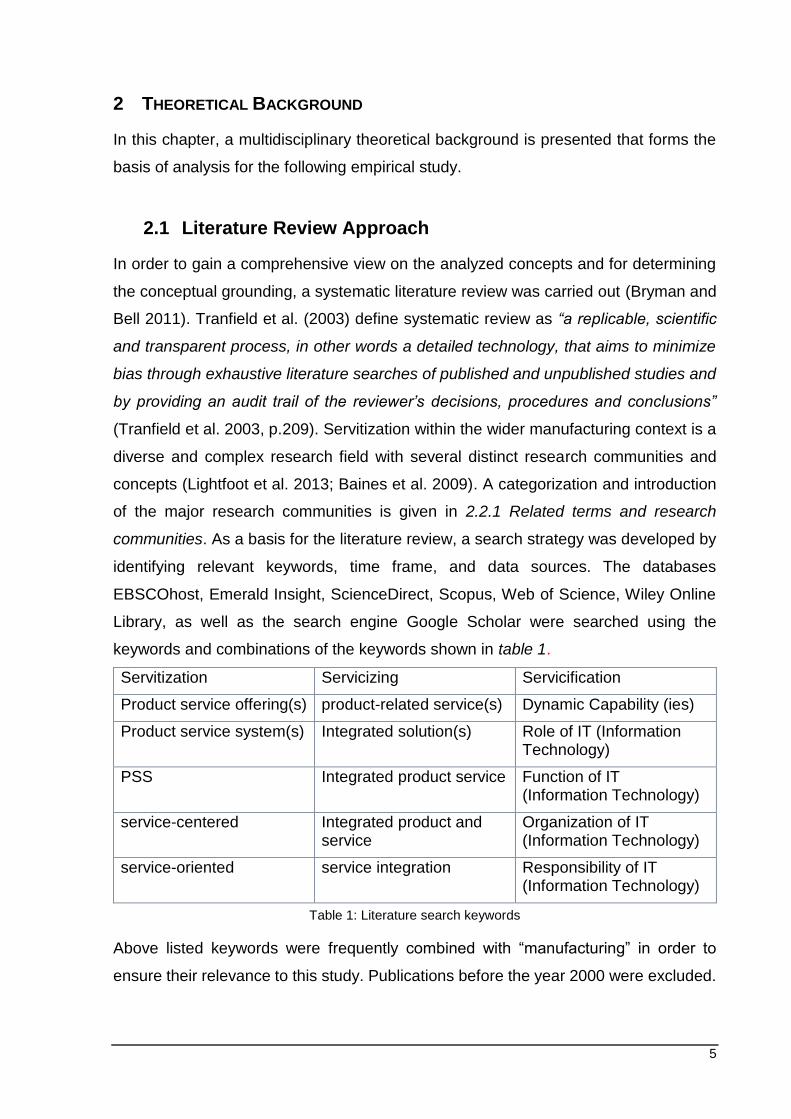
keywords and combinations of the keywords shown in table 1.
Servitization Servicizing Servicification
Product service offering(s) product-related service(s) Dynamic Capability (ies)
Product service system(s) Integrated solution(s) Role of IT (Information Technology)
PSS Integrated product service Function of IT (Information Technology)
service-centered Integrated product and service
Organization of IT (Information Technology)
service-oriented service integration Responsibility of IT (Information Technology)
Table 1: Literature search keywords
Above listed keywords were frequently combined with “manufacturing” in order to
ensure their relevance to this study. Publications before the year 2000 were excluded.
6
Exceptions were made for key literature in the designated fields, such as Vandermerwe
and Rada (1988) definition of servitization.
A large number of articles was found in the selected databases, which can be
rationalized by the complexity of the research endeavor, interrelatedness of the
research fields and the resulting variety of keywords. The different research fields or
research communities addressing servitization will be explained later on in more detail.
Discovered literature was filtered according to “times cited” and downloaded as far as
a full-text version was available. First, duplications were detected and removed,
second the abstracts were considered in order to choose appropriate literature. Initially
the search identified around 250 articles, reports, and books. These could be carefully
filtered to 104 articles and books that were considered for the research inquiry.
2.2 Servitization
The term Servitization was first defined by Vandermerwe and Rada (1988) and is
widely recognized as the process of creating value through adding services to products
(Baines et al. 2009). Since the late 1980s interest in the research field has grown
rapidly, but the evolution of the concept can be traced back as far as the 1960s
(Lightfoot et al. 2013). For the purpose of this study the view of Baines et al. (2009) on
servitization as "...the innovation of an organisations capabilities and processes to
better create mutual value through a shift from selling product to selling Product-
Service Systems." (Baines et al. 2009, p.560) was adapted. Whereby the term “selling”
might be misleading due to numerous new forms of distribution and payment systems.
The following literature analysis aims to provide a holistic view on servitization and to
answer RQ1: Understanding Servitization: What are major drivers, forms, and
challenges?
2.2.1 Related Terms and Research Communities
Existing literature on servitization is complex and diversified. There are five principal
research communities engaging with servitization, each with a different focus and
constitution (Lightfoot et al. 2013). A brief introduction of each community is given in
order to enable an understanding of different ports of departure. The communities are
7
Services Marketing, Service Management, Operations Management, Product-Service
Systems, and Service Science.
In the field of Services Marketing, research focuses primarily on a customer
relationship management perspective of the service provision. A service dominant
logic (SDL) has developed, which proposed that value is defined by and co-created
with customers, rather than embedded in the output of goods (Lightfoot et al. 2013).
Deriving from operations and strategy domains, Service Management has a strong
focus on service culture and service organizations, specifically in contrast to product-
focused organizations (Lightfoot et al. 2013).
The broad field of Operations Management has expanded its scope with focus on
operations management and strategy in the delivery of product and service
combinations. Since the term servitization was first defined by Vandermerwe and Rada
(1988), a growing number of publications are addressing the “servitization of
manufacturing”. Competitive, service-led strategy for manufacturing is a growing area
of interest (Baines et al. 2009; Lightfoot et al. 2013).
The Product-Service Systems (PSS) research community originated in Scandinavia,
is closely connected to social, economic, environmental, and industrial sustainability.
This can be explained by the focus on asset use rather than on asset ownership to
achieve economic growth (Tukker 2004). Even though the research streams within the
communities of operations management and PSS have largely evolved in isolation with
only a few links made by researchers, there is a strong overlap in the concepts relating
to servitization (Lightfoot et al. 2013; Baines et al. 2009; Baines et al. 2007; Tukker and
Tischner 2006).
Service Science is the fifth community contributing to servitization. It is an
interdisciplinary concept and has derived from the Information Systems (IS) sector and
within IBM (Lightfoot et al. 2013). The concept emphasizes service as a system of
interacting components which include people, business, and technology (Chesbrough
and Spohrer 2006).
8
The difficulty of considering and combining literature from these diverse research
communities is to critically reflect on their context and origin.
2.2.2 Drivers of Servitization
Providing services is not new for manufacturing firms. Traditionally, services were often
seen by managers as a necessary evil for the sole purpose of marketing strategies.
The largest share of total value creation came from physical goods and services were
considered as an add-on (Gebauer and Friedli 2005).
Since then, there has been a dramatic change in perspective. The servitization
literature commonly suggests three major driving forces that cause manufacturing
firms to servitize (Baines et al. 2009).
Main financial drivers are a desired higher profit margin and stability of income. Service
revenue is expected to be higher and more resistant to economic downturns.
Especially in some sectors where manufacturers have a high-installed product bases
(Gebauer and Friedli 2005; Oliva and Kallenberg 2003). According to Sawhney et al.
(2004), firms, such as Siemens, GE, and IBM have achieved constant revenues from
services despite a significant decrease in product sales. Strategic drivers are largely
concerned with gaining competitive advantage in increasingly commoditized markets.
Services are becoming a main differentiating factor and set barriers for competitors
since integrated product and service offerings are more difficult to imitate. Higher labor
dependency and lower visibility make competitive advantages achieved through
services more sustainable (Mathieu 2001b; Gebauer and Fleisch 2007; Oliva and
Kallenberg 2003; Lightfoot et al. 2013; Baines et al. 2009) Marketing drivers aim for
selling more products based on the provision of services. The service component is
well known to influence purchasing decisions. In particular in business-to-business
markets, customers increasingly demand services to maintain own flexibility, focus on
core competencies, and reduce technological complexity. Resulting advantages for
suppliers are customer loyalty, repeat-sales, and maybe most importantly, contact
opportunities with customers, which allow to offer other products or services and tailor
solutions based on customers’ needs (Gebauer and Fleisch 2007; Oliva and
Kallenberg 2003; Vandermerwe and Rada 1988; Mathieu 2001a, 2001b).
9
2.2.3 Forms of Servitization
Customer centricity is a key feature of servitization strategies. Oliva and Kallenberg
(2003) consider customer focus as consisting of two elements. First, the shift from
product-oriented offerings to the integration of user’s processes, and second the shift
from transaction-based to relationship-based customer interactions. A variety of
servitization forms with differing features have been identified by the literature along
this “product-service continuum” (Oliva and Kallenberg 2003; Neu and Brown 2005;
Gebauer et al. 2007). The continuum ranges from product orientation where services
are offered purely as add-ons to products, to results orientation where services create
the main part of value with tangible goods as add-ons (Baines et al. 2009; Tukker
2004).
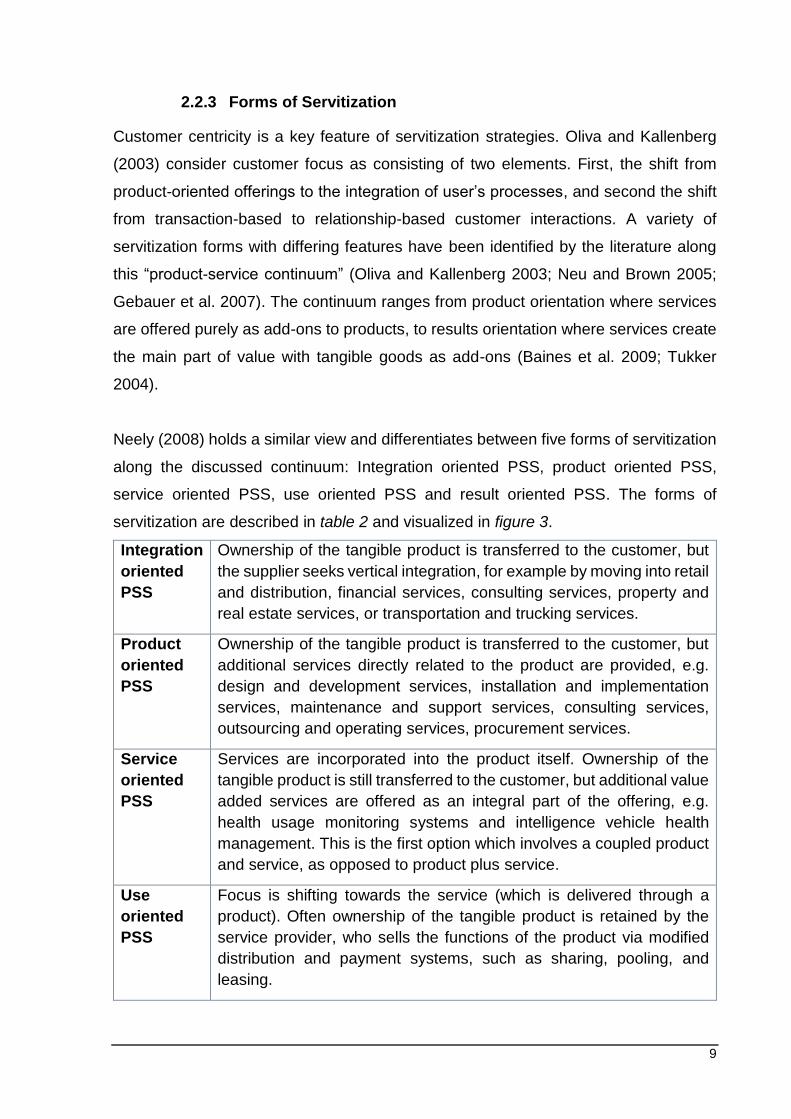
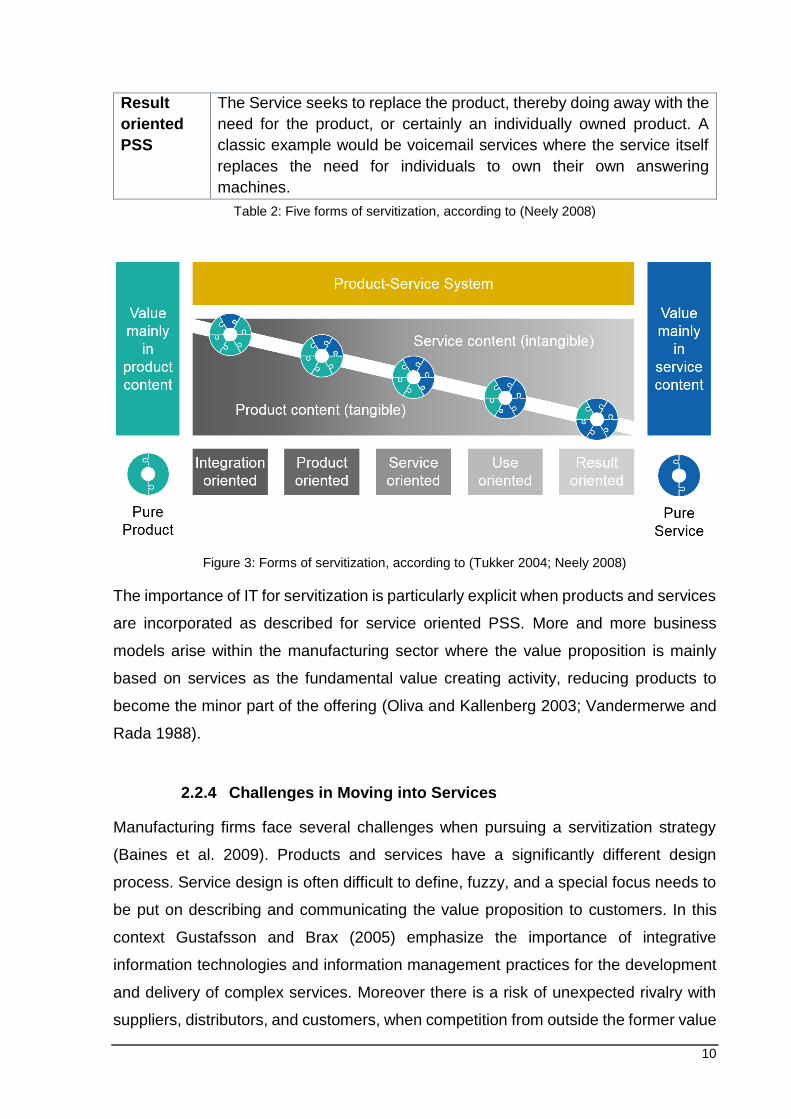
Neely (2008) holds a similar view and differentiates between five forms of servitization
along the discussed continuum: Integration oriented PSS, product oriented PSS,
service oriented PSS, use oriented PSS and result oriented PSS. The forms of
servitization are described in table 2 and visualized in figure 3.
Integration
oriented
PSS
Ownership of the tangible product is transferred to the customer, but
the supplier seeks vertical integration, for example by moving into retail
and distribution, financial services, consulting services, property and
real estate services, or transportation and trucking services.
Product
oriented
PSS
Ownership of the tangible product is transferred to the customer, but
additional services directly related to the product are provided, e.g.
design and development services, installation and implementation
services, maintenance and support services, consulting services,
outsourcing and operating services, procurement services.
Service
oriented
PSS
Services are incorporated into the product itself. Ownership of the
tangible product is still transferred to the customer, but additional value
added services are offered as an integral part of the offering, e.g.
health usage monitoring systems and intelligence vehicle health
management. This is the first option which involves a coupled product
and service, as opposed to product plus service.
Use
oriented
PSS
Focus is shifting towards the service (which is delivered through a
product). Often ownership of the tangible product is retained by the
service provider, who sells the functions of the product via modified
distribution and payment systems, such as sharing, pooling, and
leasing.
10
Result
oriented
PSS
The Service seeks to replace the product, thereby doing away with the
need for the product, or certainly an individually owned product. A
classic example would be voicemail services where the service itself
replaces the need for individuals to own their own answering
machines.
Table 2: Five forms of servitization, according to (Neely 2008)
Figure 3: Forms of servitization, according to (Tukker 2004; Neely 2008)
The importance of IT for servitization is particularly explicit when products and services
are incorporated as described for service oriented PSS. More and more business
models arise within the manufacturing sector where the value proposition is mainly
based on services as the fundamental value creating activity, reducing products to
become the minor part of the offering (Oliva and Kallenberg 2003; Vandermerwe and
Rada 1988).
2.2.4 Challenges in Moving into Services
Manufacturing firms face several challenges when pursuing a servitization strategy
(Baines et al. 2009). Products and services have a significantly different design
process. Service design is often difficult to define, fuzzy, and a special focus needs to
be put on describing and communicating the value proposition to customers. In this
context Gustafsson and Brax (2005) emphasize the importance of integrative
information technologies and information management practices for the development
and delivery of complex services. Moreover there is a risk of unexpected rivalry with
suppliers, distributors, and customers, when competition from outside the former value
11
chain position is not taken into consideration (Vandermerwe and Rada 1988; Oliva and
Kallenberg 2003; Mathieu 2001b). It is not sufficient to merely define a service-oriented
strategy. Organizational structures, processes, and capabilities have to be shaped
accordingly to carry out the strategy. This means implementing service orientation and
customer-centricity for the development, as well as the delivery of services. In this
context, partnering with suppliers and customers becomes increasingly important
(Windahl et al. 2004; Oliva and Kallenberg 2003; Leseure et al. 2010). Mathieu (2001b)
highlights that service management often conflicts with traditional manufacturing
practices, for instance due to the difference in organizational culture. Hence, a shift in
the corporate mindset is necessary to acknowledge and prioritize the importance of
services. The approval of needed resources and management support will require
significant changes to established attitudes and practices (Mathieu 2001b; Oliva and
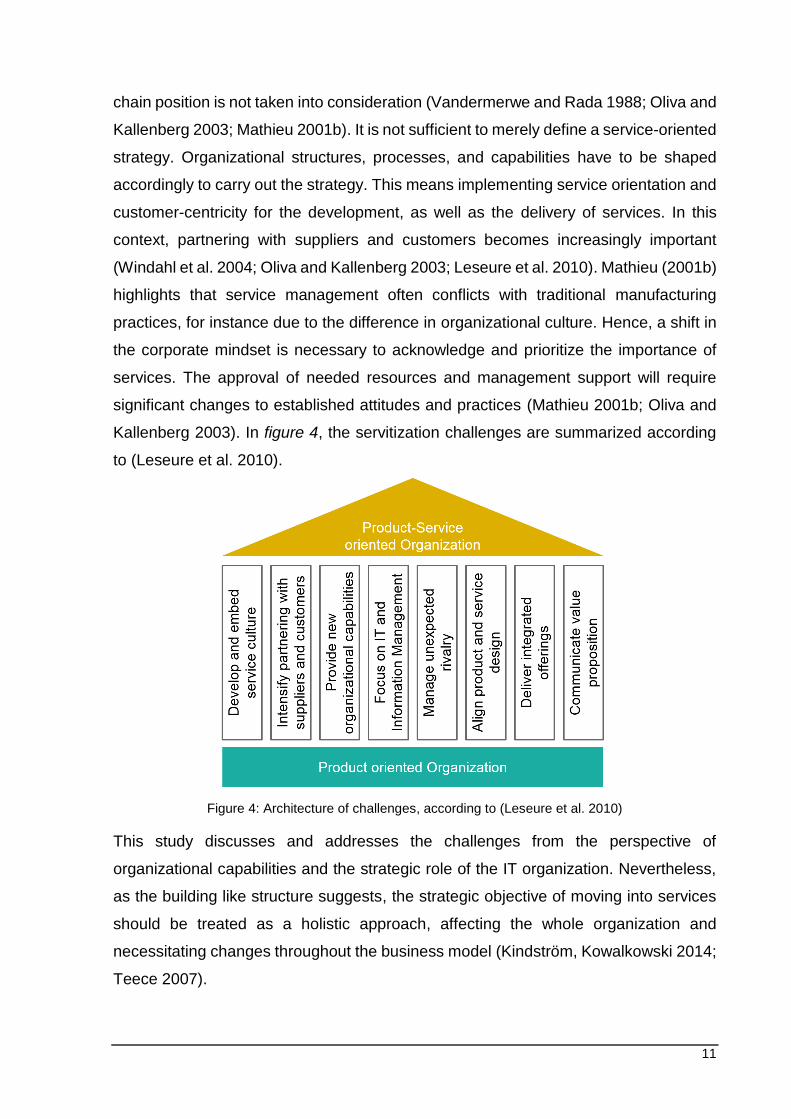
Kallenberg 2003). In figure 4, the servitization challenges are summarized according
to (Leseure et al. 2010).
Figure 4: Architecture of challenges, according to (Leseure et al. 2010)
This study discusses and addresses the challenges from the perspective of
organizational capabilities and the strategic role of the IT organization. Nevertheless,
as the building like structure suggests, the strategic objective of moving into services
should be treated as a holistic approach, affecting the whole organization and
necessitating changes throughout the business model (Kindström, Kowalkowski 2014;
Teece 2007).
12
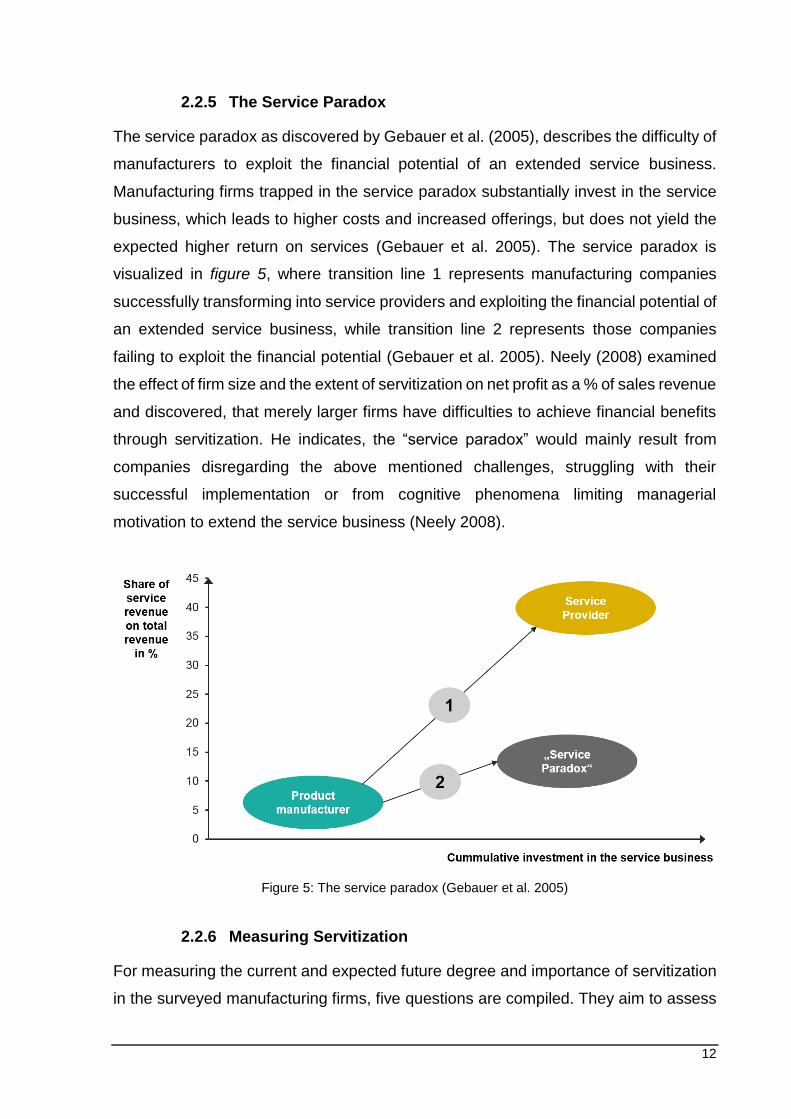
2.2.5 The Service Paradox
The service paradox as discovered by Gebauer et al. (2005), describes the difficulty of
manufacturers to exploit the financial potential of an extended service business.
Manufacturing firms trapped in the service paradox substantially invest in the service
business, which leads to higher costs and increased offerings, but does not yield the
expected higher return on services (Gebauer et al. 2005). The service paradox is
visualized in figure 5, where transition line 1 represents manufacturing companies
successfully transforming into service providers and exploiting the financial potential of
an extended service business, while transition line 2 represents those companies
failing to exploit the financial potential (Gebauer et al. 2005). Neely (2008) examined
the effect of firm size and the extent of servitization on net profit as a % of sales revenue
and discovered, that merely larger firms have difficulties to achieve financial benefits
through servitization. He indicates, the “service paradox” would mainly result from
companies disregarding the above mentioned challenges, struggling with their
successful implementation or from cognitive phenomena limiting managerial
motivation to extend the service business (Neely 2008).
Figure 5: The service paradox (Gebauer et al. 2005)
2.2.6 Measuring Servitization
For measuring the current and expected future degree and importance of servitization
in the surveyed manufacturing firms, five questions are compiled. They aim to assess
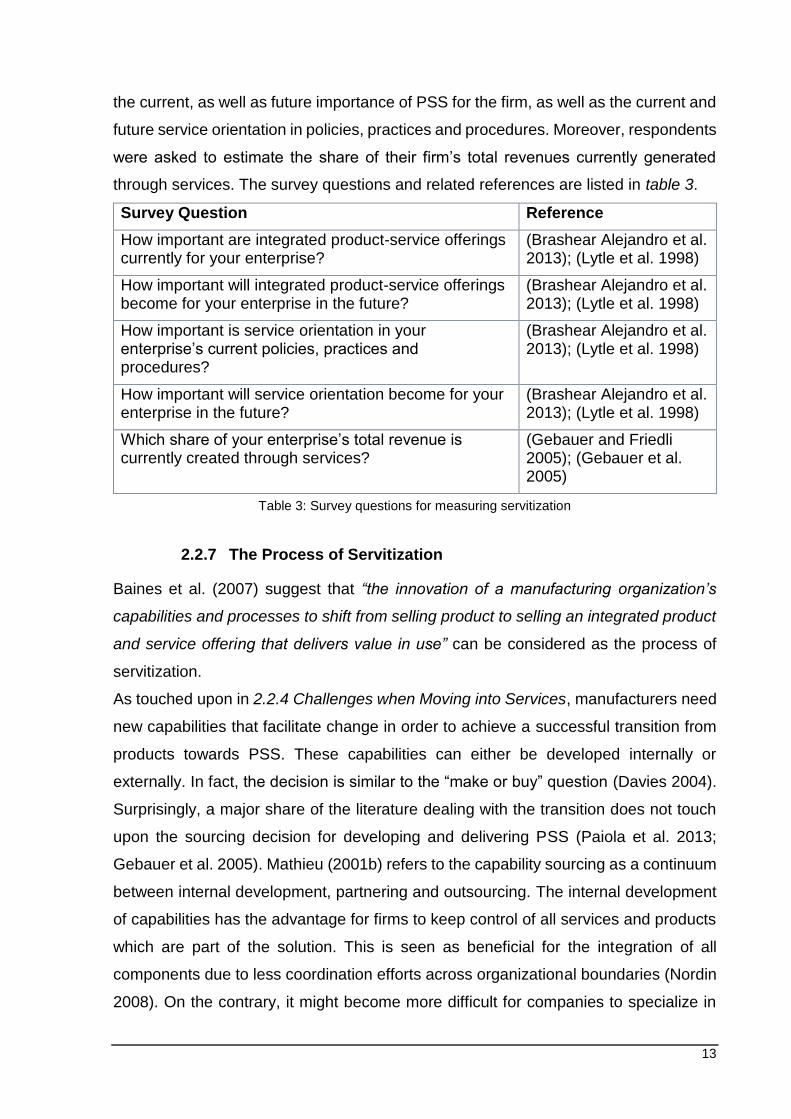
13
the current, as well as future importance of PSS for the firm, as well as the current and
future service orientation in policies, practices and procedures. Moreover, respondents
were asked to estimate the share of their firm’s total revenues currently generated
through services. The survey questions and related references are listed in table 3.
Survey Question Reference
How important are integrated product-service offerings currently for your enterprise?
(Brashear Alejandro et al. 2013); (Lytle et al. 1998)
How important will integrated product-service offerings become for your enterprise in the future?
(Brashear Alejandro et al. 2013); (Lytle et al. 1998)
How important is service orientation in your enterprise’s current policies, practices and procedures?
(Brashear Alejandro et al. 2013); (Lytle et al. 1998)
How important will service orientation become for your enterprise in the future?
(Brashear Alejandro et al. 2013); (Lytle et al. 1998)
Which share of your enterprise’s total revenue is currently created through services?
(Gebauer and Friedli 2005); (Gebauer et al. 2005)
Table 3: Survey questions for measuring servitization
2.2.7 The Process of Servitization
Baines et al. (2007) suggest that “the innovation of a manufacturing organization’s
capabilities and processes to shift from selling product to selling an integrated product
and service offering that delivers value in use” can be considered as the process of
servitization.
As touched upon in 2.2.4 Challenges when Moving into Services, manufacturers need
new capabilities that facilitate change in order to achieve a successful transition from
products towards PSS. These capabilities can either be developed internally or
externally. In fact, the decision is similar to the “make or buy” question (Davies 2004).
Surprisingly, a major share of the literature dealing with the transition does not touch
upon the sourcing decision for developing and delivering PSS (Paiola et al. 2013;
Gebauer et al. 2005). Mathieu (2001b) refers to the capability sourcing as a continuum
between internal development, partnering and outsourcing. The internal development
of capabilities has the advantage for firms to keep control of all services and products
which are part of the solution. This is seen as beneficial for the integration of all
components due to less coordination efforts across organizational boundaries (Nordin
2008). On the contrary, it might become more difficult for companies to specialize in
14
particular capabilities due to the increased number of capabilities. Moreover costs
might be higher compared to external sourcing from the market. Advantages of
external capability development are timeliness and lower fixed costs (Neely 2008).
Nevertheless the risk of losing control over the service component, the risk of
competitive behavior by business partners, and the high integration costs should not
be neglected (Paiola et al. 2013).
A major challenge with the shift from products to PSS is the management of capabilities
that are seen as essential for organizational change in general, and service innovation
in particular (Kindström et al. 2013; Teece 2007). In order to understand these specific
capabilities, the dynamic capability framework is introduced in the following.
2.3 Dynamic Capability Framework
Dynamic capabilities are widely seen as a key to competitive advantage and superior
enterprise performance in rapidly changing and strongly competitive environments
(Teece 2007; Teece et al. 1997; Winter 2003). Recently published literature
increasingly focuses on dynamic capabilities as enabler for servitization (Kindström et
al. 2013; Gustafsson et al. 2010; den Hertog et al. 2010) and as key to business
architecture leading to alignment between business and IT (Ross et al. 2014).
Dynamic Capabilities are a “firm’s ability to integrate, build, and reconfigure internal
and external competences to address rapidly changing environments” (Teece et al.
1997, p. 516).
According to Teece (2007), dynamic capabilities are especially relevant to
multinational enterprises operating in business environments with the following
characteristics:
An environment open to international trade and exposed to rapid technological
change.
Technical change taking place as a complex process, presuming the
combination of multiple inventions to create products and services.
The existence of well-developed markets for the exchange of services and
goods.
15
Poorly developed markets for the exchange of technological and managerial
know-how.
These characteristics can be found in most sectors of the global economy and in
particular in the capital goods and high-technology sector. In these sectors, Teece
(2007) argues, it is not sufficient to focus on process optimization and scale economics
for sustainable success, but rather on the continuous discovery and realization of
internal and external opportunities.
2.3.1 The Evolution of Dynamic Capabilities
The dynamic capability framework (DCF) “is grounded in Kirznerian, Schumpeterian,
and evolutionary theories of economic change…” (Teece 2007, p. 1325) and builds
strongly on the resource-based view (RBV) of the firm (Grant 2010).
With the rise of the RBV and the DCF in the 1990s, the focus of analysis in strategic
management literature shifted from the firm’s position in its external environment, as
provided by porter’s five forces, towards the role played by the internal organization of
the firm (Teece 2007; den Hertog et al. 2010; Grant 2010). In the RBV, a resource is
defined as "...an asset or input to production (tangible or intangible) that an
organization owns, controls, or has access to on a semi-permanent basis" (Helfat,
Peteraf 2003, p. 999). The DCF in contrast, views organizational capabilities as a
complex combination of various resources that express “what a firm can do” (Grant
2010). The major difference between the DCF and the RBV is that the DCF considers
the evolutionary nature of resources and capabilities, while the RBV represents a
rather static perspective (Gustafsson et al. 2010; Teece et al. 1997). According to
Helfat et al. (2009), dynamic capabilities incorporate the capacity to identify the need
or opportunity for change, formulate a response, and implement a course of action.
2.3.2 Capability Building
Capabilities are a coordinated set of tasks that require the integration of actions
performed by various individuals and organizational resources. In order to transform
into organizational capabilities, capabilities need to be routinized through firm specific
managerial and organizational processes (Grant 2010; den Hertog et al. 2010).
Routinization is seen as an essential step since regular and predictable patterns of
16
activity lead to efficiency and reliability. Moreover, evolutionary economists view the
adaptation and replication of organizational routines as fundamental building blocks for
a firm’s development and for managing the trade-off between efficiency and flexibility
(Grant 2010).
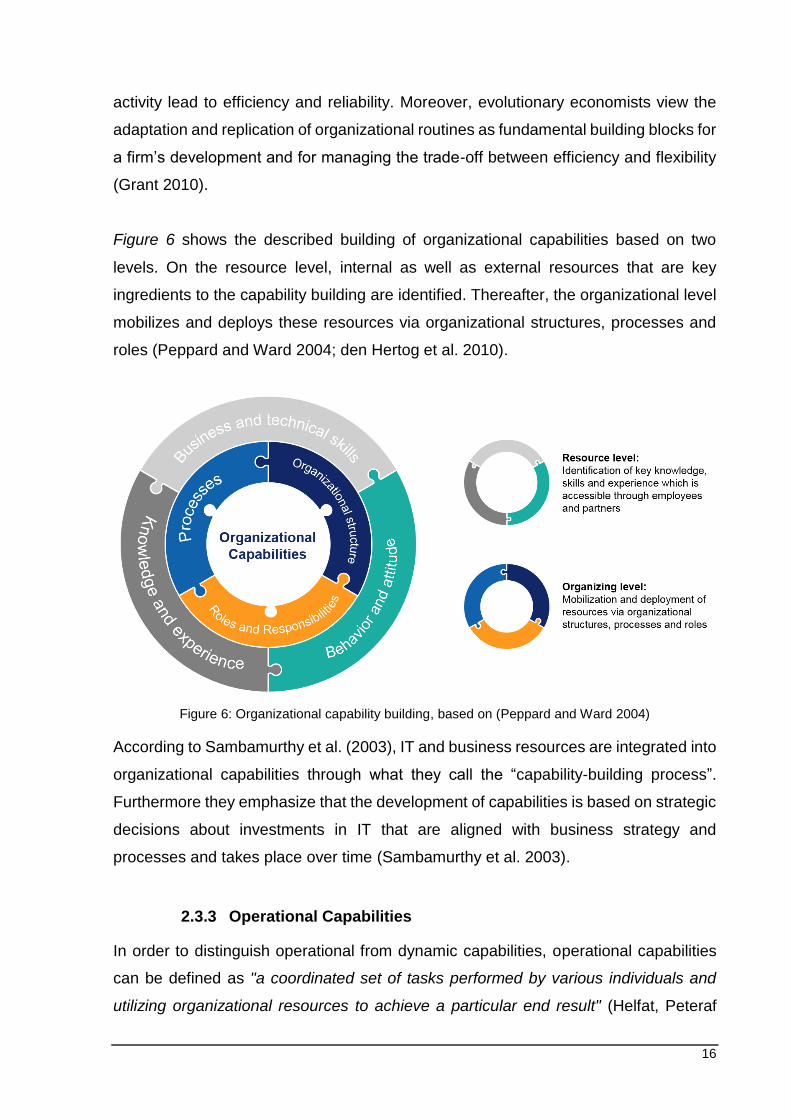
Figure 6 shows the described building of organizational capabilities based on two
levels. On the resource level, internal as well as external resources that are key
ingredients to the capability building are identified. Thereafter, the organizational level
mobilizes and deploys these resources via organizational structures, processes and
roles (Peppard and Ward 2004; den Hertog et al. 2010).
Figure 6: Organizational capability building, based on (Peppard and Ward 2004)
According to Sambamurthy et al. (2003), IT and business resources are integrated into
organizational capabilities through what they call the “capability-building process”.
Furthermore they emphasize that the development of capabilities is based on strategic
decisions about investments in IT that are aligned with business strategy and
processes and takes place over time (Sambamurthy et al. 2003).
2.3.3 Operational Capabilities
In order to distinguish operational from dynamic capabilities, operational capabilities
can be defined as "a coordinated set of tasks performed by various individuals and
utilizing organizational resources to achieve a particular end result" (Helfat, Peteraf
17
2003, p. 999). In other words, operational capabilities ensure a stable base of ongoing
operations for an organization in order to “earn a living at present” (Winter 2003; Teece
2007). While dynamic capabilities, by contrast, do not directly contribute to the output
of a firm, but give direction to operational capabilities (den Hertog et al. 2010; Helfat,
Peteraf 2003).
2.3.4 Dynamic Capabilities
In order to inquire dynamic capabilities, a process was developed for designing single
statements (indicators) that represent a specific category of dynamic capabilities. The
aim was to understand and differentiate between dynamic capabilities and enable their
measurement in the surveyed firms. Thereby RQ2: What are dynamic capabilities and
how can they support servitization?” can be addressed.
Initially, literature focusing on dynamic capabilities was screened for existing dynamic
capabilities. In doing so, attention was paid to separate dynamic capabilities from other
capability concepts which were not considered. As a next step, the discovered dynamic
capabilities were gathered using a comprehensive spreadsheet. In a third step,
redundancies were eliminated and the content was classified following Teece (2007)
division into Sensing, Seizing, and Reconfiguring capabilities.
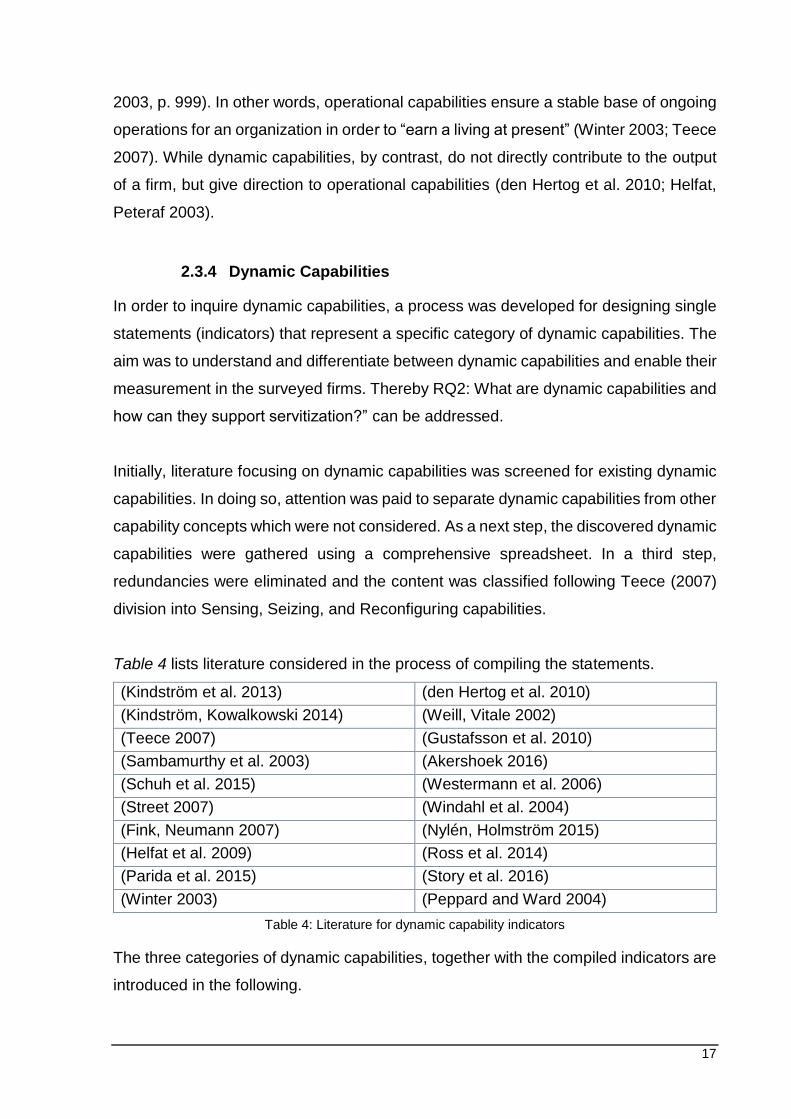
Table 4 lists literature considered in the process of compiling the statements.
(Kindström et al. 2013) (den Hertog et al. 2010)
(Kindström, Kowalkowski 2014) (Weill, Vitale 2002)
(Teece 2007) (Gustafsson et al. 2010)
(Sambamurthy et al. 2003) (Akershoek 2016)
(Schuh et al. 2015) (Westermann et al. 2006)
(Street 2007) (Windahl et al. 2004)
(Fink, Neumann 2007) (Nylén, Holmström 2015)
(Helfat et al. 2009) (Ross et al. 2014)
(Parida et al. 2015) (Story et al. 2016)
(Winter 2003) (Peppard and Ward 2004)
Table 4: Literature for dynamic capability indicators
The three categories of dynamic capabilities, together with the compiled indicators are
introduced in the following.
18
2.3.4.1 Sensing Capabilities
Sensing capabilities detect and shape new technological and market opportunities but
also potential threats. Activities involved are especially scanning, filtering, learning, and
interpreting (Teece 2007; den Hertog et al. 2010; Kindström et al. 2013).
Therefore this study compiled that firms need the following characteristics (indicators)
in order to successfully employ dynamic sensing capabilities:
Continuously capture customer needs and identify target market segments.
Exploit supplier and complementary innovation.
Identify threats and opportunities in the extended value chain and such related
to competitors’ behavior.
Explore new technologies and developments in exogenous science.
Direct internal R&D and select technologies based on above listed sensing
activities.
2.3.4.2 Seizing Capabilities
Seizing capabilities address technological and market opportunities through new
services (Teece 2007). Solely investing into technology is therefore not enough, an
environment has to exist that is capable of sheltering and exploiting new opportunities
as they emerge (Chesbrough 2010; Teece 2010). Organizational designs, structures,
procedures, and incentives need to be shaped to overcome biased judgements that
favor path-dependent decisions and bury opportunities (Teece 2007).
For the successful employment of dynamic seizing capabilities, firms need the
following characteristics (indicators):
Describe the customer solution and the corresponding business model in detail.
Identify connections between existing capabilities and requirements of
emerging opportunities.
Experiment with new service opportunities through close interaction with
customers.
Implement decision making protocols to avoid decision errors and tendencies
for anti-cannibalization.
Select enterprise boundaries to manage complements and to control platforms.
19
Integrate whole business processes of the customer.
2.3.4.3 Reconfiguring Capabilities
The third category, reconfiguring capabilities, match and manage the dependence
between service strategy and organizational design in order to achieve strategic
alignment (Teece 2007). According to Gustafsson et al. (2010), despite numerous
literature on organizational factors for servitization, literature rarely gives guidance on
how to achieve strategic alignment. Strategic alignment is seen as a complex process
demanding ongoing assessment and realignment (Kindström 2010; Helfat et al. 2009).
To successfully employ dynamic reconfiguring capabilities, firms need the following
characteristics (indicators):
Adopt loosely coupled structures and develop integration and coordination
skills.
Achieve incentive alignment and avoid agency issues.
Manage co-specialization so that asset combinations are value enhancing.
Build loyalty and commitment to services.
Establish knowledge management to transfer and integrate know-how.
Scale up successful service innovations based on standardization and
consolidation.
Create a consistent service experience for customers, independent from the
location and involved partners.
2.4 The Role of IT for Servitization
As introduced in the previous chapters Information technology (IT) is a key enabler for
servitization in manufacturing firms (Brashear Alejandro et al. 2013) and essential for
the building of organizational capabilities (Sambamurthy et al. 2003). One could reason
that "the service revolution and the information revolution are two sides of the same
coin" (Rust 2004, p. 24). Or as Huang and Rust (2013) put is: "Service is not new; it is
service plus IT that transforms service." (Huang and Rust 2013, p. 251). IT enables
deeper customer relationships and insights, as well as the provision of complex service
offerings, such as service-oriented, use-oriented, and results-oriented PSS (Penttinen
and Palmer 2007). Examples of IT-enabled services are new service-oriented PSS
20
which depend on the collection, processing, and evaluation of real-time information
about the condition and utilization of the installed base (Kowalkowski, Brehmer 2008).
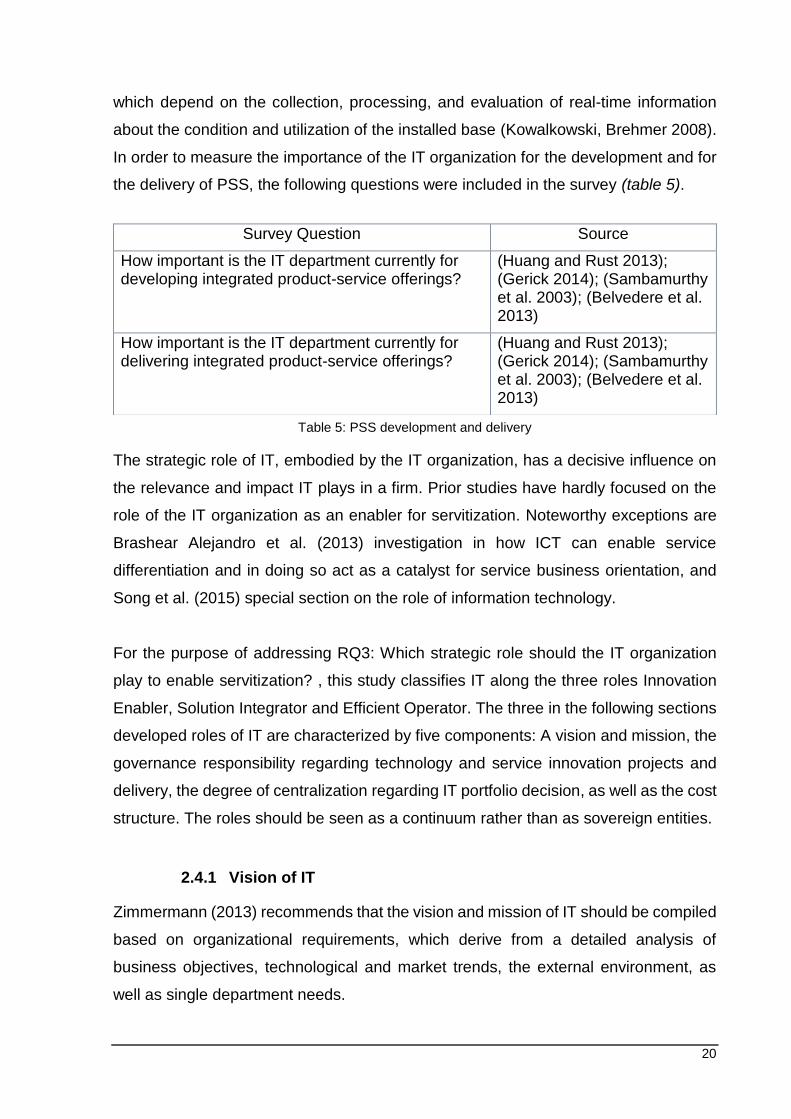
In order to measure the importance of the IT organization for the development and for
the delivery of PSS, the following questions were included in the survey (table 5).
Table 5: PSS development and delivery
The strategic role of IT, embodied by the IT organization, has a decisive influence on
the relevance and impact IT plays in a firm. Prior studies have hardly focused on the
role of the IT organization as an enabler for servitization. Noteworthy exceptions are
Brashear Alejandro et al. (2013) investigation in how ICT can enable service
differentiation and in doing so act as a catalyst for service business orientation, and
Song et al. (2015) special section on the role of information technology.
For the purpose of addressing RQ3: Which strategic role should the IT organization
play to enable servitization? , this study classifies IT along the three roles Innovation
Enabler, Solution Integrator and Efficient Operator. The three in the following sections
developed roles of IT are characterized by five components: A vision and mission, the
governance responsibility regarding technology and service innovation projects and
delivery, the degree of centralization regarding IT portfolio decision, as well as the cost
structure. The roles should be seen as a continuum rather than as sovereign entities.
2.4.1 Vision of IT
Zimmermann (2013) recommends that the vision and mission of IT should be compiled
based on organizational requirements, which derive from a detailed analysis of
business objectives, technological and market trends, the external environment, as
well as single department needs.
Survey Question Source
How important is the IT department currently for developing integrated product-service offerings?
(Huang and Rust 2013); (Gerick 2014); (Sambamurthy et al. 2003); (Belvedere et al. 2013)
How important is the IT department currently for delivering integrated product-service offerings?
(Huang and Rust 2013); (Gerick 2014); (Sambamurthy et al. 2003); (Belvedere et al. 2013)
21
An organizations vision or vision statement generally expresses what an organization
wants to become (Grant 2010). For the purpose of practical implication and to simplify
comprehension, the vision indicators were formulated as actions. Ramiller and
Swanson (2003) observe that from a practitioners perspective "…organizing visions
are important in shaping thinking about the opportunities (and threats) that may lie
ahead, in establishing expectations concerning what constitutes effective, proper, and
up-to-date practice, and in motivating the action that will help to create the future of IT
application and practice." (Ramiller and Swanson 2003, p. 15)
The mission on the other hand defines the purpose of an organization and identifies
the scope to set it apart from other organizations (Pearce II, David 1987).
The characteristics of the three in the following described roles of IT are based on
Peterson (2004a); Peterson (2004b); Guillemette and Paré (2012); Sambamurthy et
al. (2003); Sia et al. (2010); Gottschalk (2004); Gerick (2014); Ross et al. (2010); and
Ross et al. (2011).
When the IT organization embodies the role as an Innovation Enabler, IT is impact
oriented, seeks to deliver value through innovative solutions and drives first mover
advantage. IT as a Solution Integrator is integration oriented and defines new
capabilities together with business to meet time-to-market requirements. Delivery of
leading edge solutions that support new offerings takes place either through internal
development, external contracting or packaged software. The third role of IT as
Efficient Operator is infrastructure oriented and focused on providing IT operations and
solutions with a maximum of reliability and availability. IT meets standard business
requirements and manages cross-unit synergies across the organization.
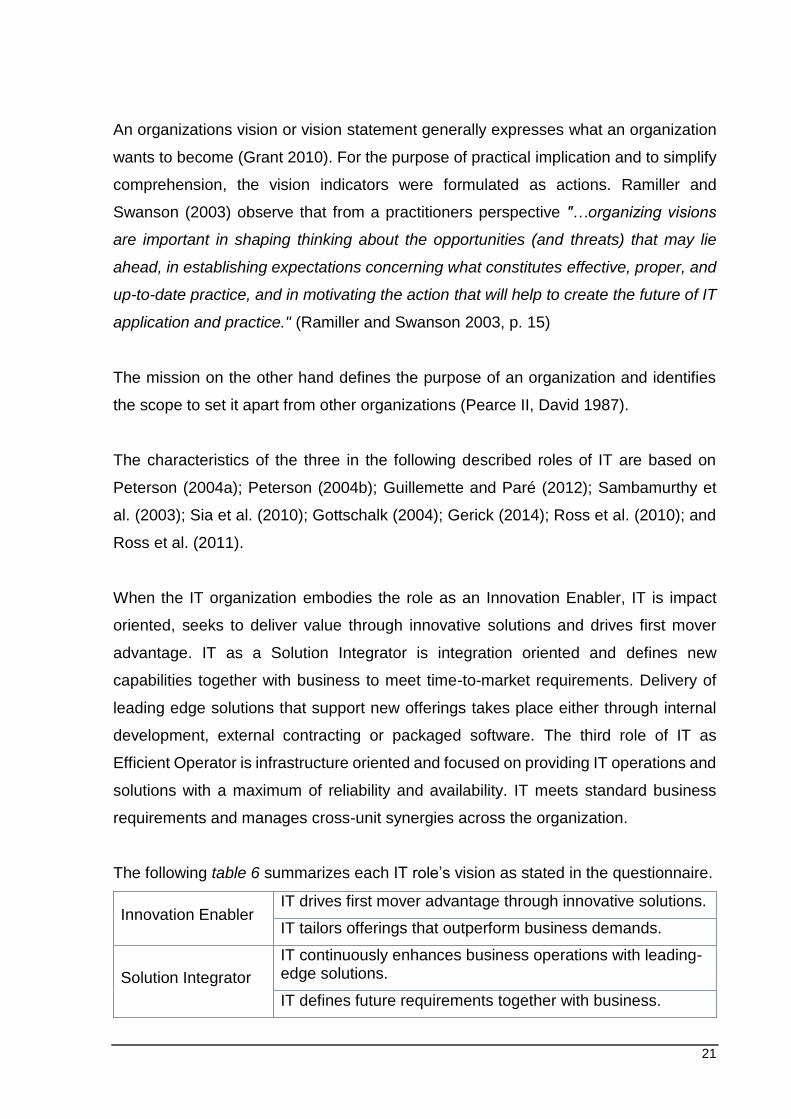
The following table 6 summarizes each IT role’s vision as stated in the questionnaire.
Innovation Enabler IT drives first mover advantage through innovative solutions.
IT tailors offerings that outperform business demands.
Solution Integrator
IT continuously enhances business operations with leading-edge solutions.
IT defines future requirements together with business.
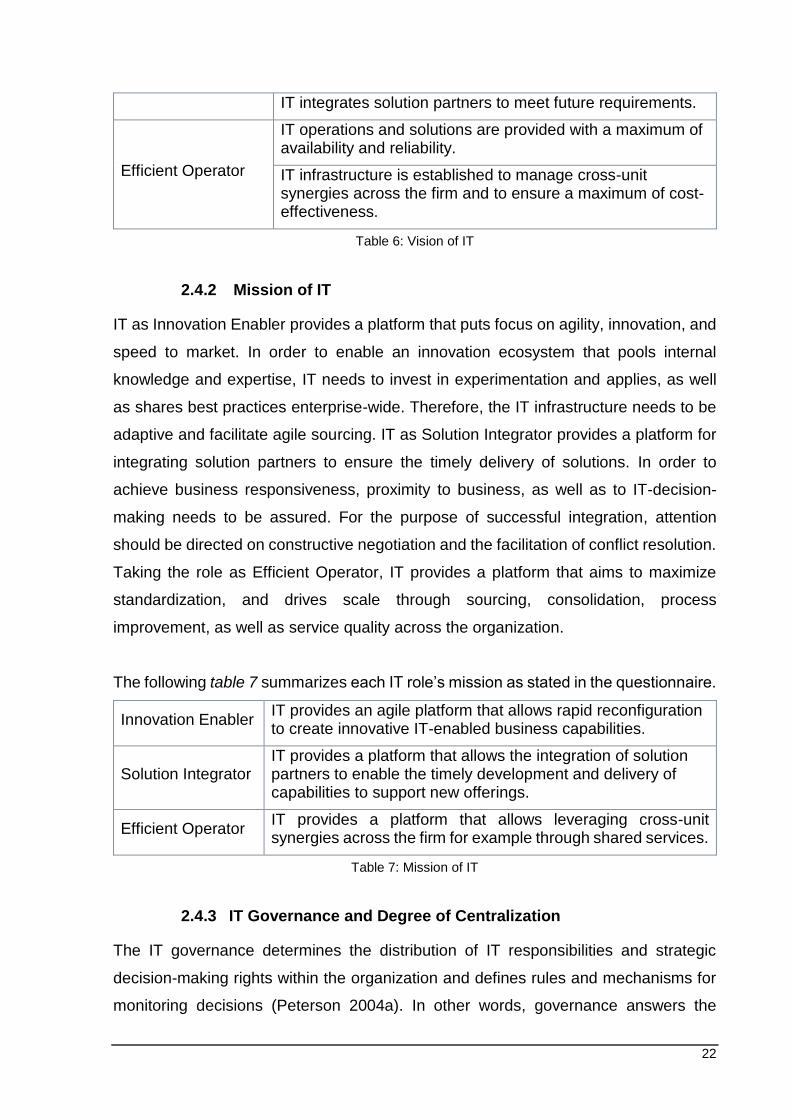
22
IT integrates solution partners to meet future requirements.
Efficient Operator
IT operations and solutions are provided with a maximum of availability and reliability.
IT infrastructure is established to manage cross-unit synergies across the firm and to ensure a maximum of cost-effectiveness.
Table 6: Vision of IT
2.4.2 Mission of IT
IT as Innovation Enabler provides a platform that puts focus on agility, innovation, and
speed to market. In order to enable an innovation ecosystem that pools internal
knowledge and expertise, IT needs to invest in experimentation and applies, as well
as shares best practices enterprise-wide. Therefore, the IT infrastructure needs to be
adaptive and facilitate agile sourcing. IT as Solution Integrator provides a platform for
integrating solution partners to ensure the timely delivery of solutions. In order to
achieve business responsiveness, proximity to business, as well as to IT-decision-
making needs to be assured. For the purpose of successful integration, attention
should be directed on constructive negotiation and the facilitation of conflict resolution.
Taking the role as Efficient Operator, IT provides a platform that aims to maximize
standardization, and drives scale through sourcing, consolidation, process
improvement, as well as service quality across the organization.
The following table 7 summarizes each IT role’s mission as stated in the questionnaire.
Innovation Enabler IT provides an agile platform that allows rapid reconfiguration to create innovative IT-enabled business capabilities.
Solution Integrator IT provides a platform that allows the integration of solution partners to enable the timely development and delivery of capabilities to support new offerings.
Efficient Operator IT provides a platform that allows leveraging cross-unit synergies across the firm for example through shared services.
Table 7: Mission of IT
2.4.3 IT Governance and Degree of Centralization
The IT governance determines the distribution of IT responsibilities and strategic
decision-making rights within the organization and defines rules and mechanisms for
monitoring decisions (Peterson 2004a). In other words, governance answers the
23
questions who makes IT decision and how, rather than which decisions are made
(Weill 2004). Since an organization’s IT portfolio is directed by the governance, it is
considered "the single most important determinant of IT value realization" (Peterson
2004b, p. 37).
In the survey, the inquiry of IT governance is segmented into two parts. The first set of
statements examines the IT organization’s responsibility for technology and service
innovation, whereas the second set of statements looks into the degree of
geographical and managerial diffusion of decision making rights.
IT as Innovation Enabler is responsible for technology and service innovation delivery,
and any projects initiated. Here, IT is to a large extent directly responsible for the firm’s
competitiveness. The Solution Integrator role embodies shared responsibility between
business and IT for technology and service innovation delivery and projects. Acting as
Efficient Operator, IT is responsible for the availability of Information Systems and
Services, but has no own responsibility for technology and service innovation delivery
and projects.
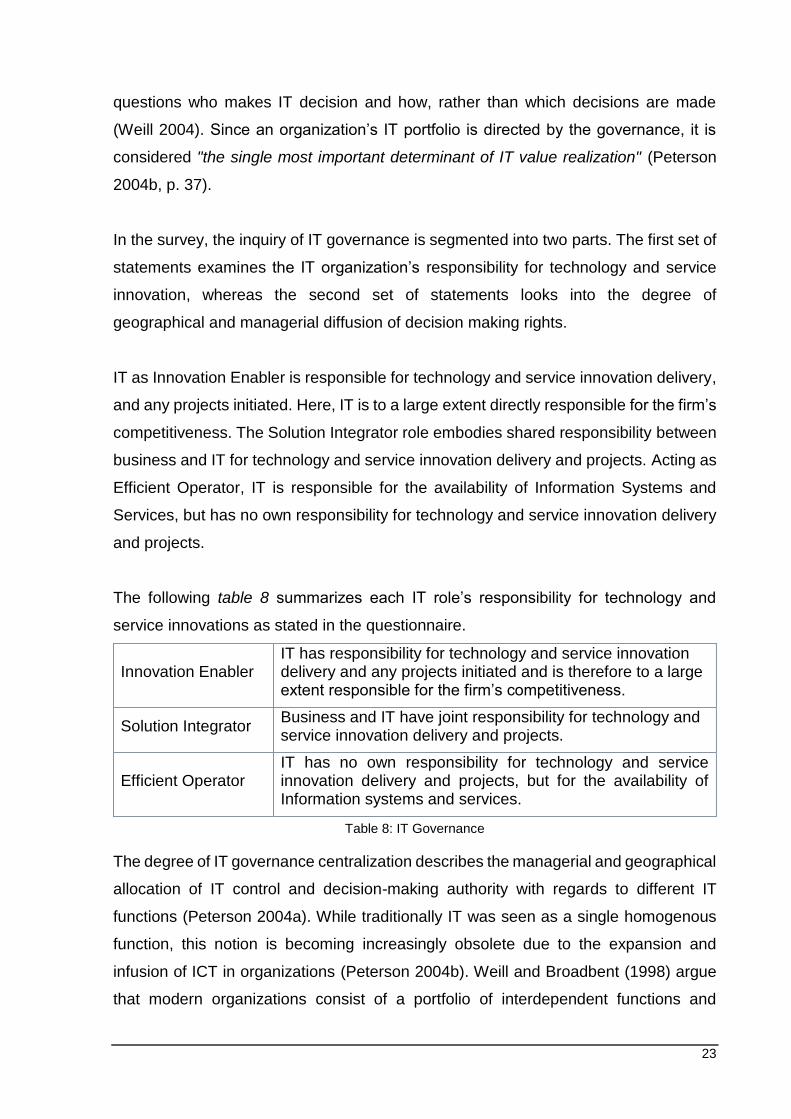
The following table 8 summarizes each IT role’s responsibility for technology and
service innovations as stated in the questionnaire.
Innovation Enabler IT has responsibility for technology and service innovation delivery and any projects initiated and is therefore to a large extent responsible for the firm’s competitiveness.
Solution Integrator Business and IT have joint responsibility for technology and service innovation delivery and projects.
Efficient Operator IT has no own responsibility for technology and service innovation delivery and projects, but for the availability of Information systems and services.
Table 8: IT Governance
The degree of IT governance centralization describes the managerial and geographical
allocation of IT control and decision-making authority with regards to different IT
functions (Peterson 2004a). While traditionally IT was seen as a single homogenous
function, this notion is becoming increasingly obsolete due to the expansion and
infusion of ICT in organizations (Peterson 2004b). Weill and Broadbent (1998) argue
that modern organizations consist of a portfolio of interdependent functions and
24
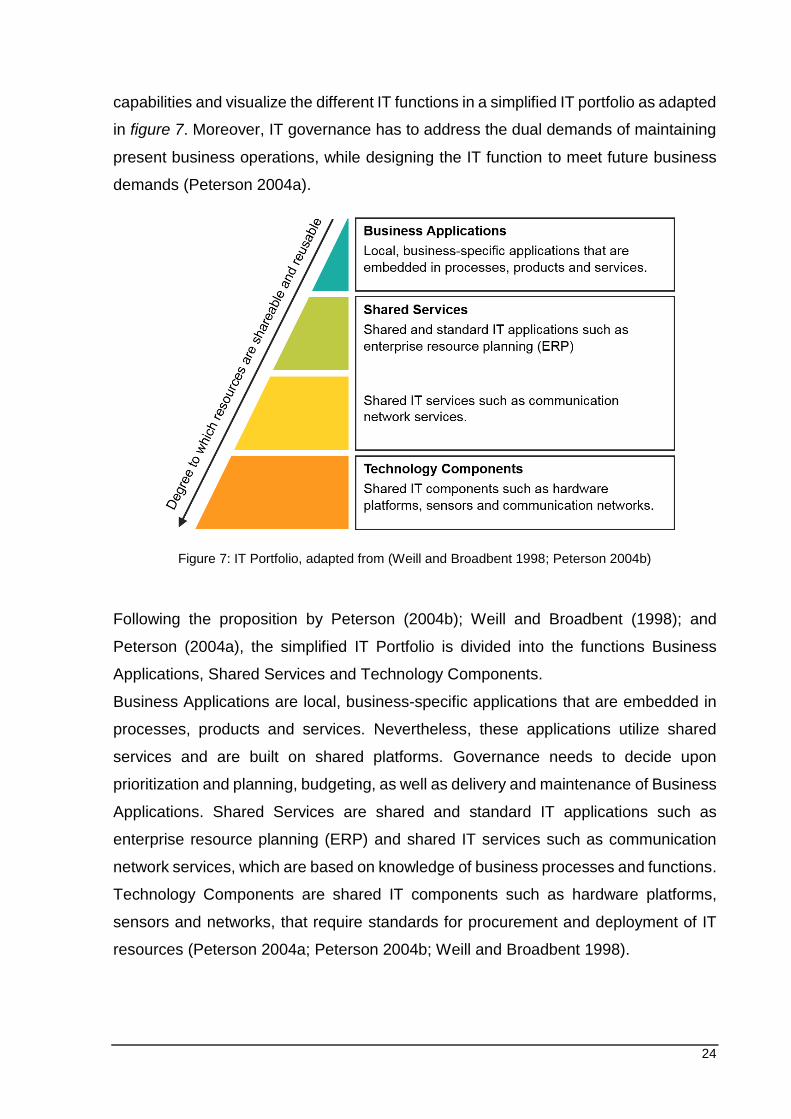
capabilities and visualize the different IT functions in a simplified IT portfolio as adapted
in figure 7. Moreover, IT governance has to address the dual demands of maintaining
present business operations, while designing the IT function to meet future business
demands (Peterson 2004a).
Figure 7: IT Portfolio, adapted from (Weill and Broadbent 1998; Peterson 2004b)
Following the proposition by Peterson (2004b); Weill and Broadbent (1998); and
Peterson (2004a), the simplified IT Portfolio is divided into the functions Business
Applications, Shared Services and Technology Components.
Business Applications are local, business-specific applications that are embedded in
processes, products and services. Nevertheless, these applications utilize shared
services and are built on shared platforms. Governance needs to decide upon
prioritization and planning, budgeting, as well as delivery and maintenance of Business
Applications. Shared Services are shared and standard IT applications such as
enterprise resource planning (ERP) and shared IT services such as communication
network services, which are based on knowledge of business processes and functions.
Technology Components are shared IT components such as hardware platforms,
sensors and networks, that require standards for procurement and deployment of IT
resources (Peterson 2004a; Peterson 2004b; Weill and Broadbent 1998).
25
To each of the three functions the dichotomy of centralization and decentralization can
be applied. In general, centralization leads to greater standardization, specialization
and economies of scale, while decentralization on the other hand enables a greater
agility and responsiveness to specific business needs or “as noted in Teece et al.
(1997), more decentralized organizations with greater local autonomy are less likely to
be blindsided by market and technological developments.” (Teece 2007, p. 1323).
According to Mintzberg (1979), centralization and decentralization should be treated
as two ends of a continuum. In order to balance the benefits and disadvantages of
both, a federal, hybrid governance model is proposed by several authors. Within the
federal IT governance model, Technology Component decisions are centralized and
Business Application decisions are decentralized (Peterson 2004a; Peterson 2004b;
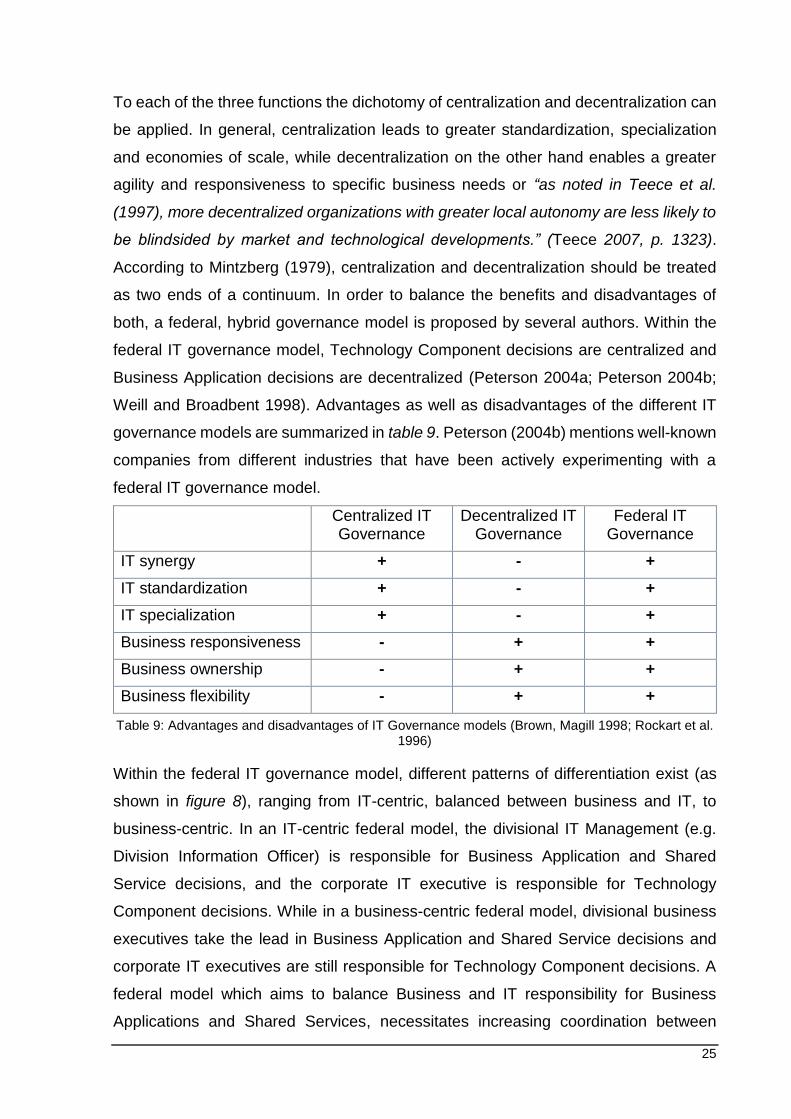
Weill and Broadbent 1998). Advantages as well as disadvantages of the different IT
governance models are summarized in table 9. Peterson (2004b) mentions well-known
companies from different industries that have been actively experimenting with a
federal IT governance model.
Centralized IT Governance
Decentralized IT Governance
Federal IT Governance
IT synergy + - +
IT standardization + - +
IT specialization + - +
Business responsiveness - + +
Business ownership - + +
Business flexibility - + +
Table 9: Advantages and disadvantages of IT Governance models (Brown, Magill 1998; Rockart et al. 1996)
Within the federal IT governance model, different patterns of differentiation exist (as
shown in figure 8), ranging from IT-centric, balanced between business and IT, to
business-centric. In an IT-centric federal model, the divisional IT Management (e.g.
Division Information Officer) is responsible for Business Application and Shared
Service decisions, and the corporate IT executive is responsible for Technology
Component decisions. While in a business-centric federal model, divisional business
executives take the lead in Business Application and Shared Service decisions and
corporate IT executives are still responsible for Technology Component decisions. A
federal model which aims to balance Business and IT responsibility for Business
Applications and Shared Services, necessitates increasing coordination between
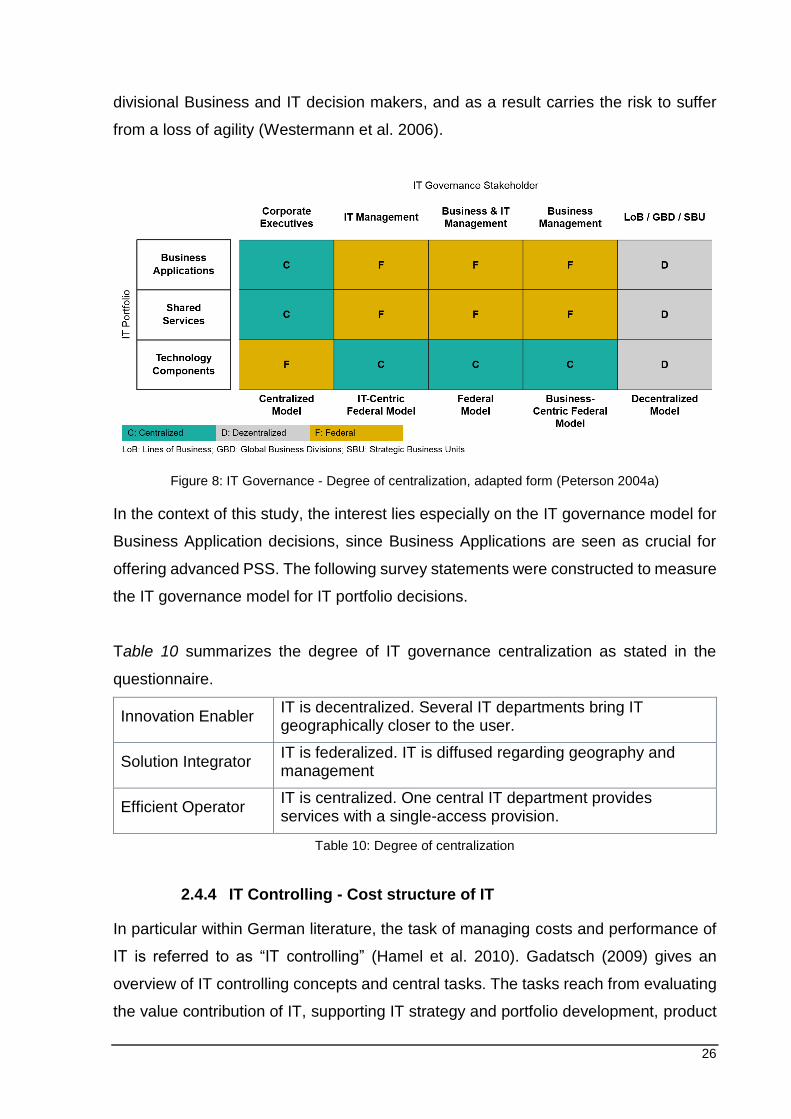
26
divisional Business and IT decision makers, and as a result carries the risk to suffer
from a loss of agility (Westermann et al. 2006).
Figure 8: IT Governance - Degree of centralization, adapted form (Peterson 2004a)
In the context of this study, the interest lies especially on the IT governance model for
Business Application decisions, since Business Applications are seen as crucial for
offering advanced PSS. The following survey statements were constructed to measure
the IT governance model for IT portfolio decisions.
Table 10 summarizes the degree of IT governance centralization as stated in the
questionnaire.
Innovation Enabler IT is decentralized. Several IT departments bring IT geographically closer to the user.
Solution Integrator IT is federalized. IT is diffused regarding geography and management
Efficient Operator IT is centralized. One central IT department provides services with a single-access provision.
Table 10: Degree of centralization
2.4.4 IT Controlling - Cost structure of IT
In particular within German literature, the task of managing costs and performance of
IT is referred to as “IT controlling” (Hamel et al. 2010). Gadatsch (2009) gives an
overview of IT controlling concepts and central tasks. The tasks reach from evaluating
the value contribution of IT, supporting IT strategy and portfolio development, product
27
and project controlling, IT cost and performance accounting, to operational controlling
(Gadatsch 2009). According to Strecker and Kargl (2009), the research field of IT
controlling suffers from a lack of integration, which is expressed through missing
synchronization between research on IT controlling methods and developments in
practice on one hand, and missing synchronization between IT controlling methods
and methods of business and information systems engineering (BISE) on the other
hand.
In 2010, worldwide IT expenditures reached approximately 1.48 trillion US Dollar and
IT budgets represented amounts between 3% and 15% of firm’s revenues, depending
on the business sector (IDC 2010). This magnitude explains why IT management faces
increasing pressure to track the value contribution of IT investments (Hamel et al.
2010). Plannability based on cost transparency and the accountable allocation to the
business are crucial for successful IT Management. IT controlling should therefore
support the interaction and coordination of interests between business and IT, through
enabling high controllability of IT resources and demonstrating the business value
which is added through IT activities. Zimmermann (2013) argue that the identification
of core capabilities and competencies of IT is crucial for cost allocation and
transparency. Nevertheless, it has to be mentioned that the evaluation of IT
investments and resulting value contribution is challenging due to the usually intangible
and complex characteristics of IT services.
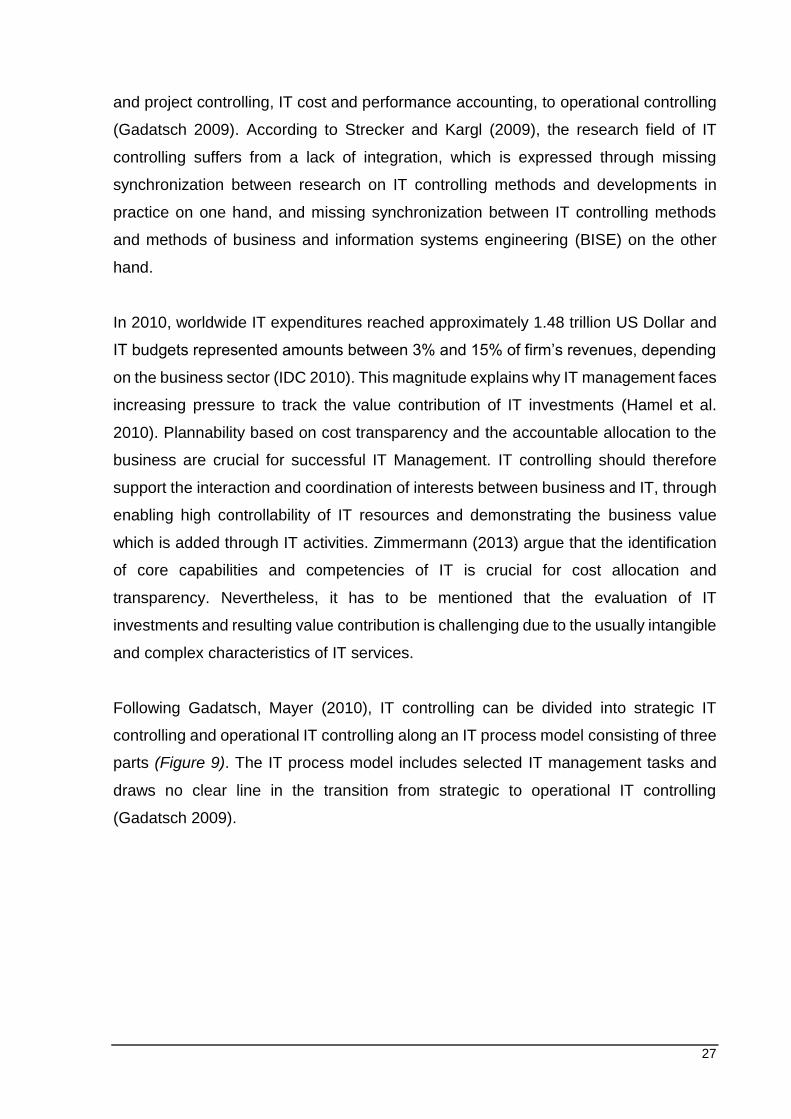
Following Gadatsch, Mayer (2010), IT controlling can be divided into strategic IT
controlling and operational IT controlling along an IT process model consisting of three
parts (Figure 9). The IT process model includes selected IT management tasks and
draws no clear line in the transition from strategic to operational IT controlling
(Gadatsch 2009).
28
Figure 9: Areas of IT controlling along the IT process model (Gadatsch 2009; Gadatsch, Mayer 2010)
In the first process step, IT controlling works together with IT management and
business departments to align IT and business strategy and to ensure that the IT
portfolio is compatible with the IT strategy. Within the IT development process step, IT
controlling supports the compliance of targets, results and budgeting of IT projects.
Efficiency analysis should be carried out for projects, and outsourcing of software
development should be evaluated by IT controlling. In the third process step, IT
controlling supports planning and operation of the IT landscape, which covers all
information systems, services and hardware (Gadatsch 2009).
IS literature often states the interdependency and consequent conflict between IT
development (build function) and IT operations (run function). The build and run
functions are interdependent since the quality and architectural consistency during the
development phase largely effect operating costs. Increasing operating costs on the
other hand often reduce budget available for development projects. Studies conducted
by the MIT Center for Information Systems Research (CISR) found that firms spend
on average 66-68% of their IT budgets on IT operations (Ross et al. 2010).
Due to the increasing penetration of business processes with IT and the rising share
of IT costs relative to the total costs of an enterprise, IT controlling is often falsely
identified with IT cost management. A performance oriented IT controlling approach
on the contrary is expected to facilitate the competitiveness of an enterprise by
improving processes and efficiency of the use of IT (Gadatsch 2009).
29
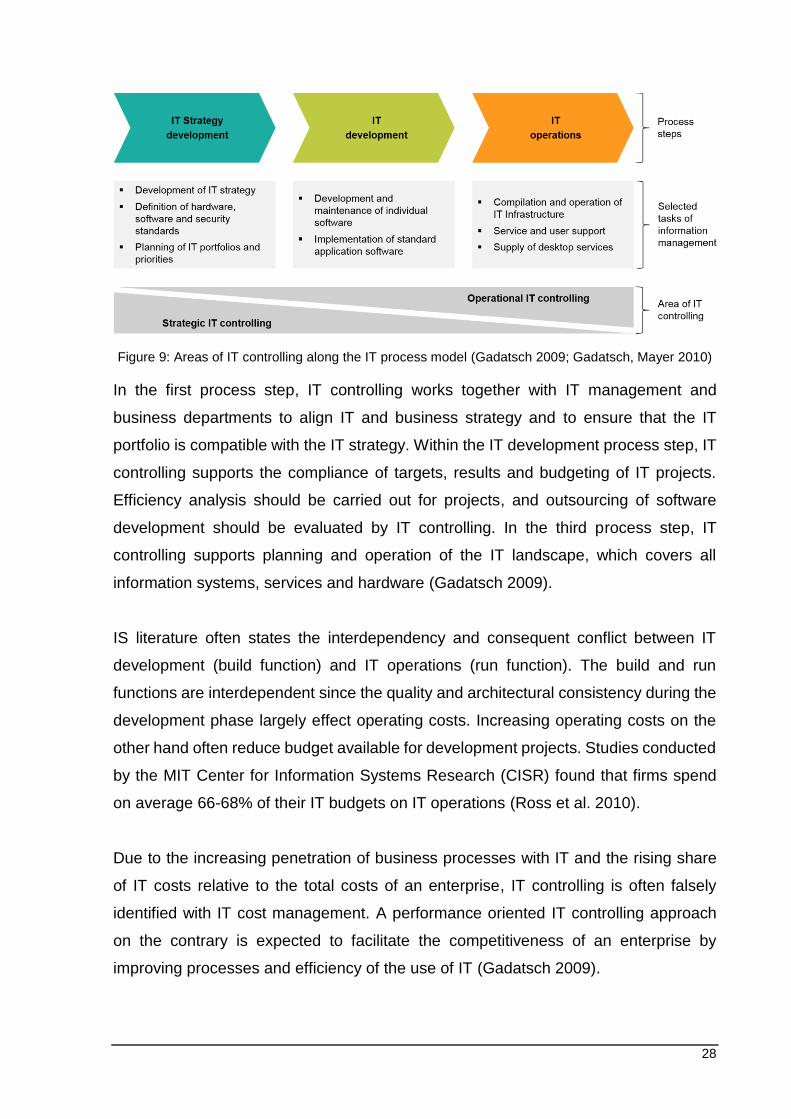
According to Ross et al. (2010), the value proposition of IT will change significantly
from business support and solution delivery towards business process design and
revenue generation. As shown in figure 10, 88% of the surveyed IT executives
indicated that the value proposition of IT will change in the next 3-5 years. Even though
the shift in the value proposition has appeared not as extreme as expected by the
study, a clear tendency can be observed (Ross et al. 2010). The new value proposition
of IT as a revenue generator rather than business support imposes significantly
different requirements on controlling of IT. This trend will certainly not stop at the
organizational boundaries of manufacturing firms.
Figure 10: IT’s value proposition (Ross et al. 2010)
The center concept allows a performance oriented controlling by dividing an
organization in autonomous units (center) with differing market orientation, following
the centralization versus decentralization debate. These autonomous units provide
services to internal and external customers with different performance, responsibility
accounting and basis of assessment. In order to simplify further analysis, the IT
organization is considered as one autonomous unit, even though it could be divided
into several units with again differing cost structures. Following the center concepts
logic, the cost structure of IT discriminates between cost-center (also called expense
center), revenue center, profit center and investment center (Dillerup, Stoi 2013; Frese
et al. 2011).
30
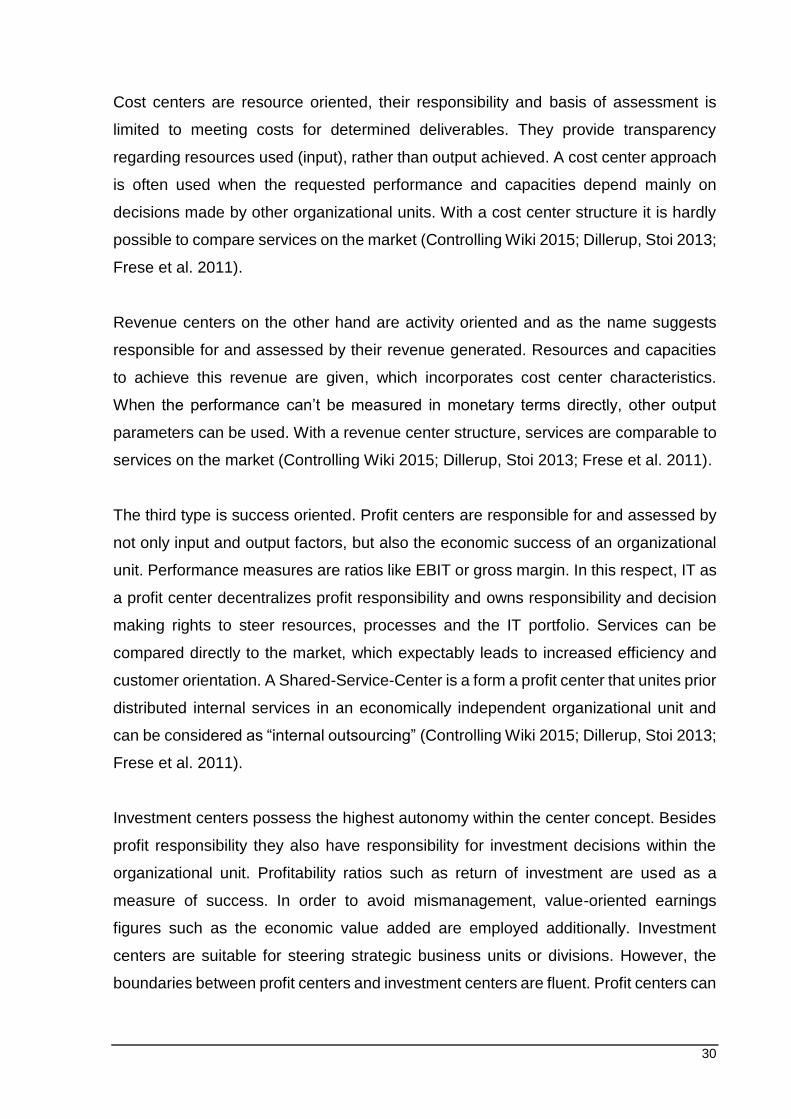
Cost centers are resource oriented, their responsibility and basis of assessment is
limited to meeting costs for determined deliverables. They provide transparency
regarding resources used (input), rather than output achieved. A cost center approach
is often used when the requested performance and capacities depend mainly on
decisions made by other organizational units. With a cost center structure it is hardly
possible to compare services on the market (Controlling Wiki 2015; Dillerup, Stoi 2013;
Frese et al. 2011).
Revenue centers on the other hand are activity oriented and as the name suggests
responsible for and assessed by their revenue generated. Resources and capacities
to achieve this revenue are given, which incorporates cost center characteristics.
When the performance can’t be measured in monetary terms directly, other output
parameters can be used. With a revenue center structure, services are comparable to
services on the market (Controlling Wiki 2015; Dillerup, Stoi 2013; Frese et al. 2011).
The third type is success oriented. Profit centers are responsible for and assessed by
not only input and output factors, but also the economic success of an organizational
unit. Performance measures are ratios like EBIT or gross margin. In this respect, IT as
a profit center decentralizes profit responsibility and owns responsibility and decision
making rights to steer resources, processes and the IT portfolio. Services can be
compared directly to the market, which expectably leads to increased efficiency and
customer orientation. A Shared-Service-Center is a form a profit center that unites prior
distributed internal services in an economically independent organizational unit and
can be considered as “internal outsourcing” (Controlling Wiki 2015; Dillerup, Stoi 2013;
Frese et al. 2011).
Investment centers possess the highest autonomy within the center concept. Besides
profit responsibility they also have responsibility for investment decisions within the
organizational unit. Profitability ratios such as return of investment are used as a
measure of success. In order to avoid mismanagement, value-oriented earnings
figures such as the economic value added are employed additionally. Investment
centers are suitable for steering strategic business units or divisions. However, the
boundaries between profit centers and investment centers are fluent. Profit centers can
31
for instance take investments into account by incorporating them in their definition of
success (Controlling Wiki 2015; Dillerup, Stoi 2013; Frese et al. 2011).
Table 11 summarizes the four center types along their competencies and
characteristics, as well as basis of assessment.
Center Type
Competencies and Characteristics Basis of Assessment
Cost
Center
Performance not clearly measurable Decisions regarding use of resources Predetermined, fixed capacities
Meeting target costs
or
Cost/ Performance ratio
Revenue
Center
Performance is measurable through revenue delivered
Decisions regarding use of resources in fixed cost-revenue-relation
Predetermined, fixed capacities
Revenue
or
output
Profit
Center
Decisions regarding use of earnings Decisions regarding use of resources Predetermined, fixed capacities
Earnings
or
Gross Margin
Investment
Center
Decisions regarding use of earnings Decisions regarding use of resources Decisions regarding capacities and
investments
Return of investment
or
Economic Value Added
Table 11: Center types, according to (Controlling Wiki 2015)
The cost structure of the IT organization is examined in reference to the four center
types. Table 12 summarizes the cost structure of IT as stated in the questionnaire.
Innovation Enabler
IT acts as an investment center, which accounts for all uses of capital. (Achieve value contribution)
IT acts as a profit center, which is responsible for generating its own results and earnings. (Generate profit)
Solution Integrator IT acts as a revenue center, which is responsible for its own revenue. (Generate revenue)
Efficient Operator IT acts as a cost center, which does not produce direct profit and therefore adds to the cost of running an enterprise. (Meet target cost)
Table 12: Cost structure of IT
32
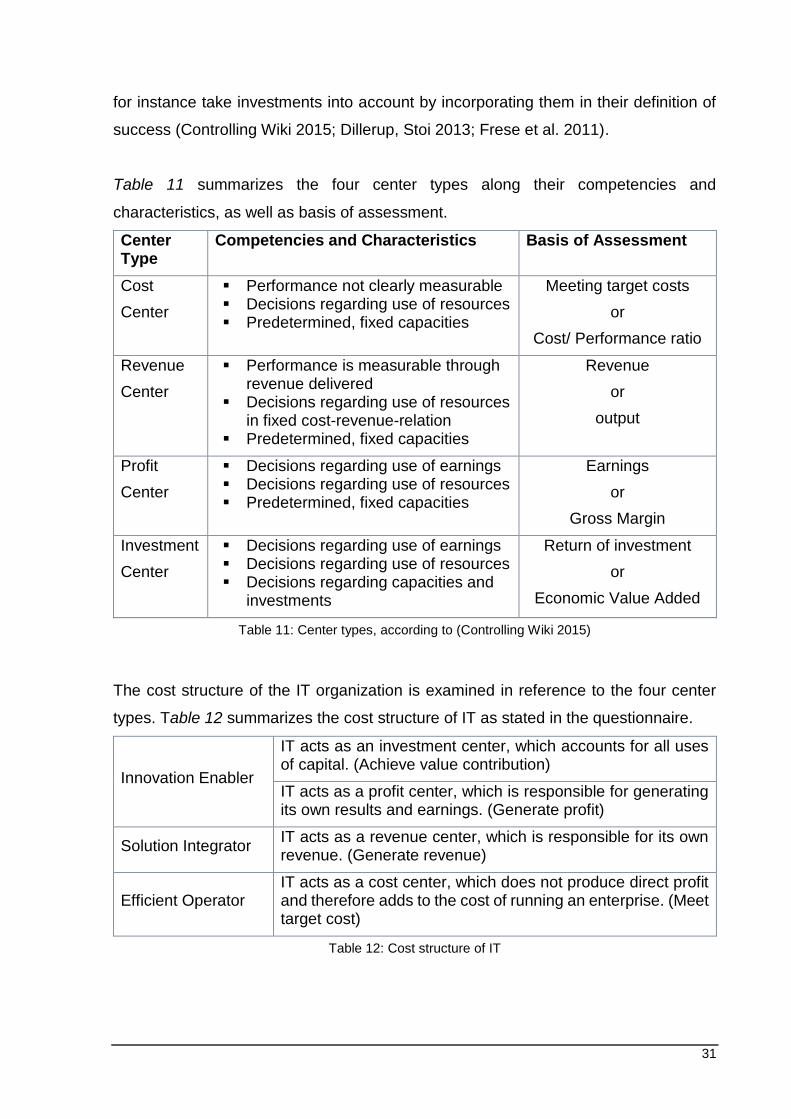
3 DATA AND METHODOLOGY
This section briefly discusses the chosen research type, approach and methodology,
and sets up hypotheses based on the conducted literature review. Moreover it gives
an overview of the survey design, data collection as well as employed data analysis
methods.
3.1 Research Type and Approach
As discussed previously, connecting servitization and the strategic role of IT is a
relatively new practice and lacks empirical research. This study aims to enable a
deeper insight into the phenomenon of servitization by assessing it with regard to the
role of IT and dynamic capabilities within surveyed manufacturing firms. Looking at the
research questions, the quantitative research approach has the objective to add to
answering research questions 2 and 3:
RQ2 What are dynamic capabilities and how can they support servitization?
RQ3 Which strategic role should the IT organization play to enable servitization?
Moreover, it is the objective of this study to generate and discuss a new perspective
on the role of IT and dynamic capabilities in the context of servitization and derive
managerial implications as well as ideas for further research.
3.2 Hypotheses
The conducted literature review connects the dynamic capability framework as well as
the role of IT to servitization and serves as a basis for developing the hypotheses. The
following hypotheses formulate the expected relationships between servitization and
dynamic capabilities, respectively between servitization and the role of IT and thus
address RQ2 and RQ3.
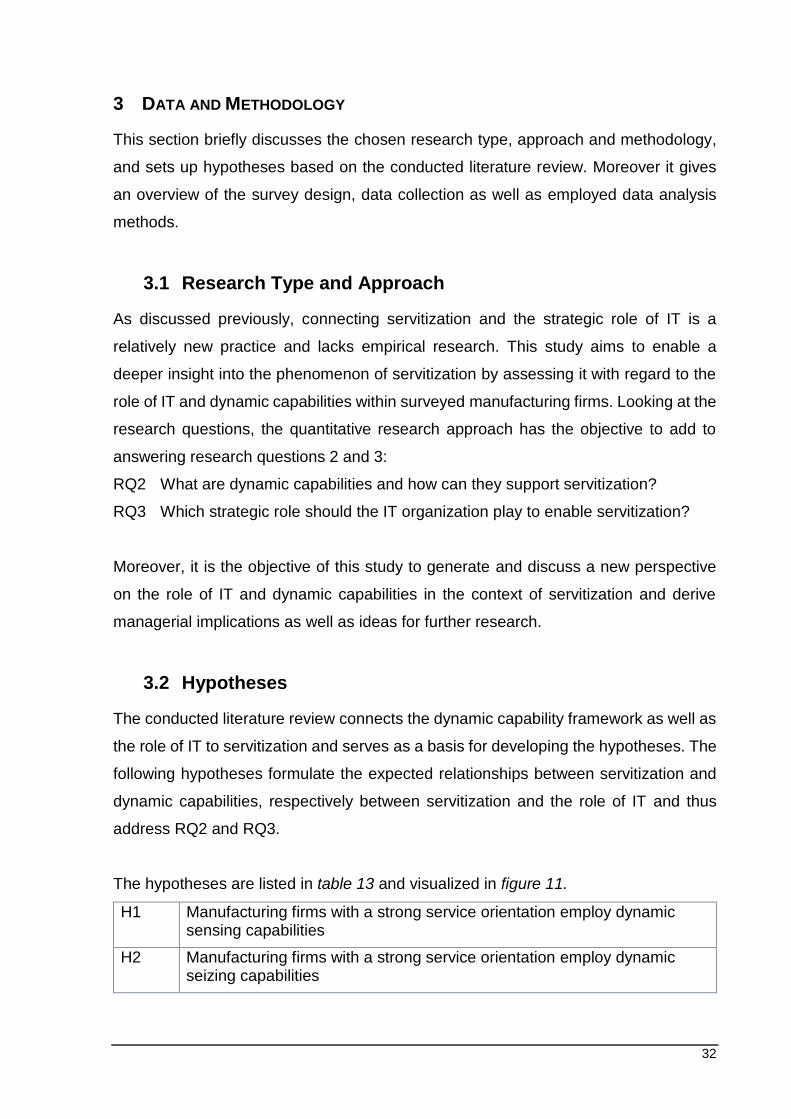
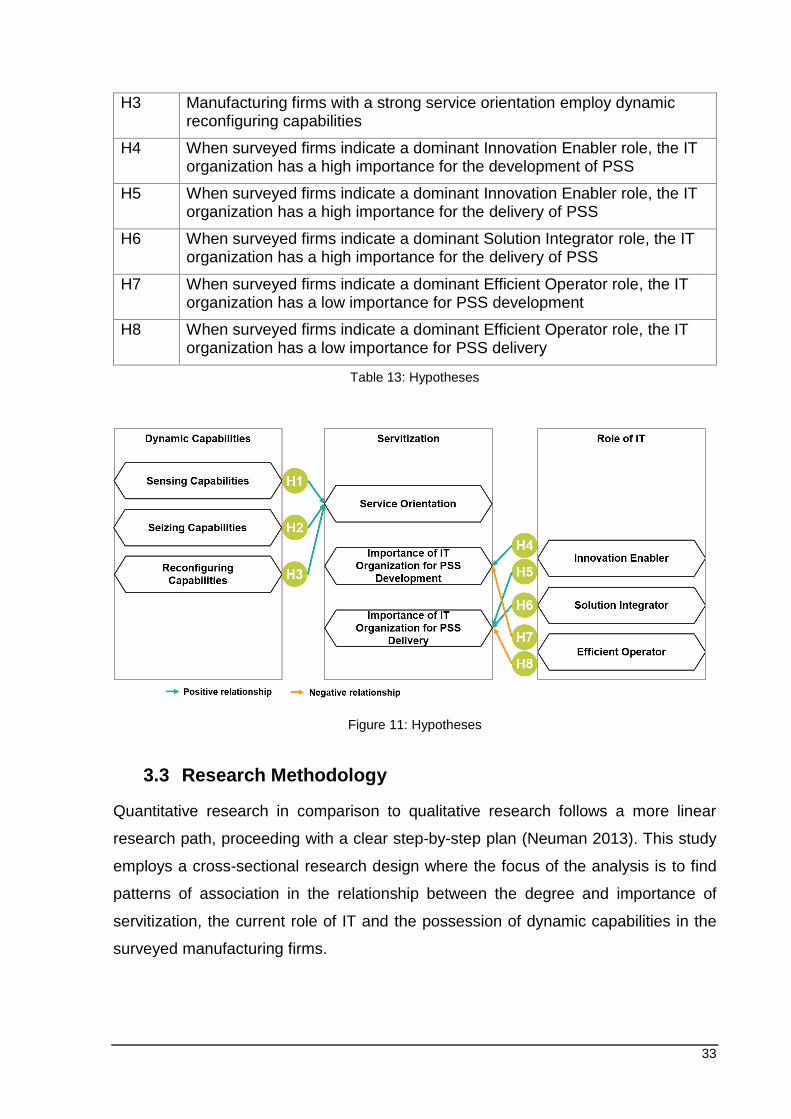
The hypotheses are listed in table 13 and visualized in figure 11.
H1 Manufacturing firms with a strong service orientation employ dynamic sensing capabilities
H2 Manufacturing firms with a strong service orientation employ dynamic seizing capabilities
33
H3 Manufacturing firms with a strong service orientation employ dynamic reconfiguring capabilities
H4 When surveyed firms indicate a dominant Innovation Enabler role, the IT organization has a high importance for the development of PSS
H5 When surveyed firms indicate a dominant Innovation Enabler role, the IT organization has a high importance for the delivery of PSS
H6 When surveyed firms indicate a dominant Solution Integrator role, the IT organization has a high importance for the delivery of PSS
H7 When surveyed firms indicate a dominant Efficient Operator role, the IT organization has a low importance for PSS development
H8 When surveyed firms indicate a dominant Efficient Operator role, the IT organization has a low importance for PSS delivery
Table 13: Hypotheses
Figure 11: Hypotheses
3.3 Research Methodology
Quantitative research in comparison to qualitative research follows a more linear
research path, proceeding with a clear step-by-step plan (Neuman 2013). This study
employs a cross-sectional research design where the focus of the analysis is to find
patterns of association in the relationship between the degree and importance of
servitization, the current role of IT and the possession of dynamic capabilities in the
surveyed manufacturing firms.
34
A cross-sectional research design implies assessing the current situation of several
companies in the same industry at a single point in time in order to discover a
relationship between measured items. Compared to longitudinal designs, the use of a
cross-sectional design requires less effort from research participants and avoids
complications related to finding and maintaining a sample population (Bryman and Bell
2011).
3.3.1 Quality of the Research
While following a quantitative research strategy, several factors should be considered
to ensure reliability, replicability and validity of the findings.
Reliability as a criteria in business research means whether the results are repeatable.
To ensure internal reliability, the indicators that make up the scale or index in this
survey are consistent. The stability of a measure over time is difficult to control due to
the complexity of influencing factors and general limitations in research design (cost
and time). Most researchers therefore appear not to carry out tests for stability (Bryman
and Bell 2011; Backhaus et al. 2016)
Replicability or inter-observer consistency is closely related to reliability and is
concerned with the question of independence from the person carrying out the
research. Hence, applied procedures should be described in great detail as considered
in the following chapters (Neuman 2013).
The third and certainly most important criterion for research is validity. "Validity is
concerned with the integrity of the conclusions", which are produced by the research
(Bryman and Bell 2011, p.42). Measurement validity is primarily applied in quantitative
research and social science research fields and is concerned with the question
whether the measure of a concept really measures the concept. If a concept is not
directly quantifiable, indicators (questions) are necessary that stand for a concept and
therefore allow it’s measurement (Neuman 2013; Bryman and Bell 2011). The
indicators used in the questionnaire were systematically developed throughout the 2.
THEORETICAL FRAMEWORK section of this study. Internal validity relates to
conclusions that are drawn from the causal relationship between two or more variables.
The causality discussion commonly discriminates between independent and
35
dependent variables. Independent variables, such as Sensing Capabilities, Seizing
Capabilities, Reconfiguring Capabilities, Innovation Enabler role, Solution Integrator
role, Efficient Operator role, are expected to have an effect on dependent variables
such as the degree and importance of servitization, and the importance of the IT
organization for PSS development and PSS delivery (Backhaus et al. 2016; Bryman
and Bell 2011). Whereas external validity is concerned with the representativeness of
the selected population and therefore with the potential generalization of findings
beyond a specific case. It has to be mentioned that the generalization of findings
generated by this study is limited due to the partial use of convenience sampling which
is prominent in the field of business and management research (Neuman 2013).
Bryman and Bell (2011, p. 236) argue that "...the sampling would not be representative
of the population, even if everyone participated”. The convenience sample is
represented through an address list containing 450 manufacturing contacts and was
provided by the industry partner.
3.3.2 Survey Design
The survey was designed and administered using the web-based software SoSci
survey (https://www.soscisurvey.de/). The purpose of the survey was to report on the
degree and importance of servitization, possession of dynamic capabilities and the
current role of IT in manufacturing firms by generating quantitative data of
organizational characteristics. Standardized online surveys are the most common
technique to generate and obtain quantitative data, while ensuring sufficient objectivity
of application (Eid et al. 2013). The survey was designed based on an intensive
literature review and after consultation with professional researchers. The structure of
the survey is shown in figure 12 and the full survey as it has been conducted, is
attached in the appendix.
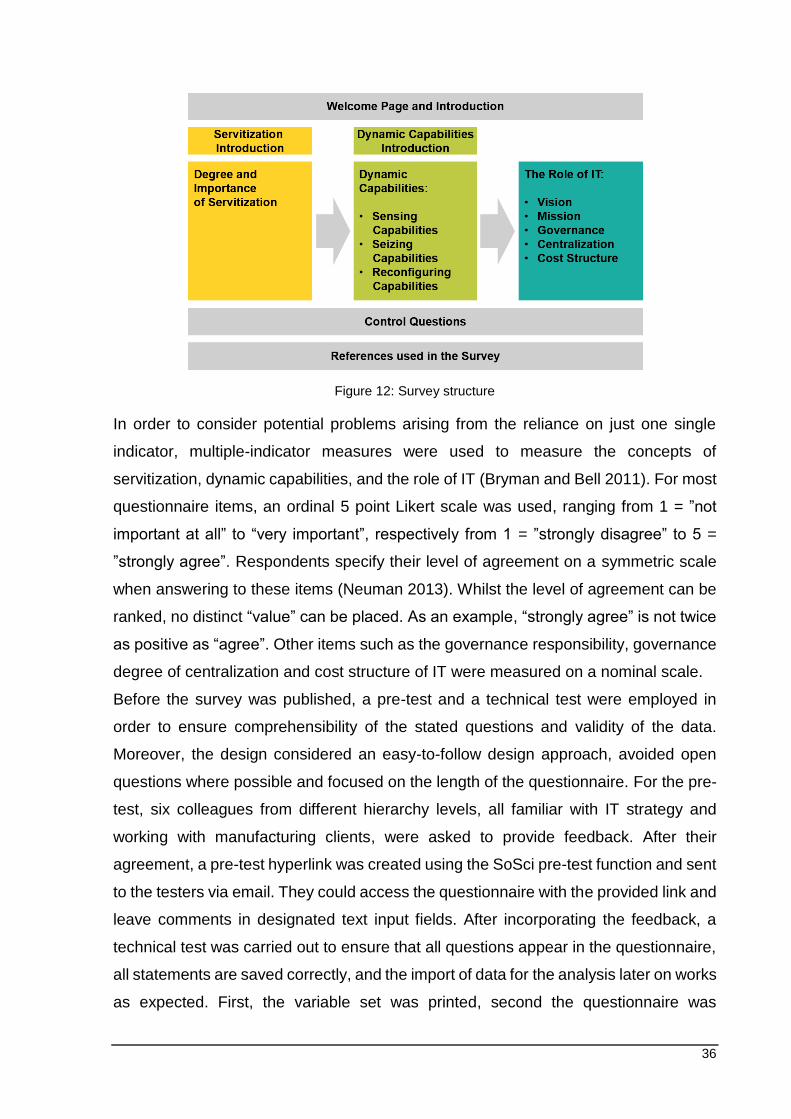
36
Figure 12: Survey structure
In order to consider potential problems arising from the reliance on just one single
indicator, multiple-indicator measures were used to measure the concepts of
servitization, dynamic capabilities, and the role of IT (Bryman and Bell 2011). For most
questionnaire items, an ordinal 5 point Likert scale was used, ranging from 1 = ”not
important at all” to “very important”, respectively from 1 = ”strongly disagree” to 5 =
”strongly agree”. Respondents specify their level of agreement on a symmetric scale
when answering to these items (Neuman 2013). Whilst the level of agreement can be
ranked, no distinct “value” can be placed. As an example, “strongly agree” is not twice
as positive as “agree”. Other items such as the governance responsibility, governance
degree of centralization and cost structure of IT were measured on a nominal scale.
Before the survey was published, a pre-test and a technical test were employed in
order to ensure comprehensibility of the stated questions and validity of the data.
Moreover, the design considered an easy-to-follow design approach, avoided open
questions where possible and focused on the length of the questionnaire. For the pre-
test, six colleagues from different hierarchy levels, all familiar with IT strategy and
working with manufacturing clients, were asked to provide feedback. After their
agreement, a pre-test hyperlink was created using the SoSci pre-test function and sent
to the testers via email. They could access the questionnaire with the provided link and
leave comments in designated text input fields. After incorporating the feedback, a
technical test was carried out to ensure that all questions appear in the questionnaire,
all statements are saved correctly, and the import of data for the analysis later on works
as expected. First, the variable set was printed, second the questionnaire was
37
completed using different browsers (Internet Explorer, Google Chrome, Safari, Firefox)
and selected answer were written down. In a third and final step, the downloaded
dataset was imported in SPSS and compared to the notes made.
3.3.3 Data Collection
This study employs a web-based, quantitative questionnaire in order to collect data of
organizational characteristics, which can be statistically analyzed later on. No
secondary sources are available for most of this data because the measurement
requires deep knowledge of the manufacturing industry and information technology, as
well as service development and delivery in the respective firm.
The survey targeted primarily manufacturing firms that were already established in
their respective market. More specifically, the target population were employees with
knowledge of information technology, service development and delivery, business
development or innovation management activities in their firms. Various demographic
measures (Control Questions), such as the industry, firm age, firm size, organizational
unit of the employee, position of the employee, duration of the employment within the
company, and the age of the employee, allow comprehensive information about the
respondents in the survey. Moreover the experience of the respondent with PSS was
inquired.
The data was collected using multiple channels between the 12th of July 2016 and the
15th of August 2016. The survey was conducted in English in order to avoid
misconceptions of the concepts resulting from translation (Eid et al. 2013) and was
initially sent to an address list containing 450, primarily German manufacturing
contacts, on the 12th of July. A first reminder followed after one week (19th of July) and
a second and final reminder was sent on the 2nd of August. A third reminder was not
sent in order to avoid intrusiveness, taking into account that the provided contacts are
customers of the industry partner. Simultaneously the survey was published twice on
all available corporate social media channels (Facebook, LinkedIn, Twitter, Xing),
including the Xing Alumni network. The first set of postings was made on the 22nd of
July and a second one on the 1st of August. Additionally, the link to the questionnaire
appeared in the quarterly corporate newsletter on the 27th of July. The newsletter is
received by approximately 3500 subscribers. In order to further leverage professional
social media channels, an extensive search for suitable LinkedIn and Xing groups was
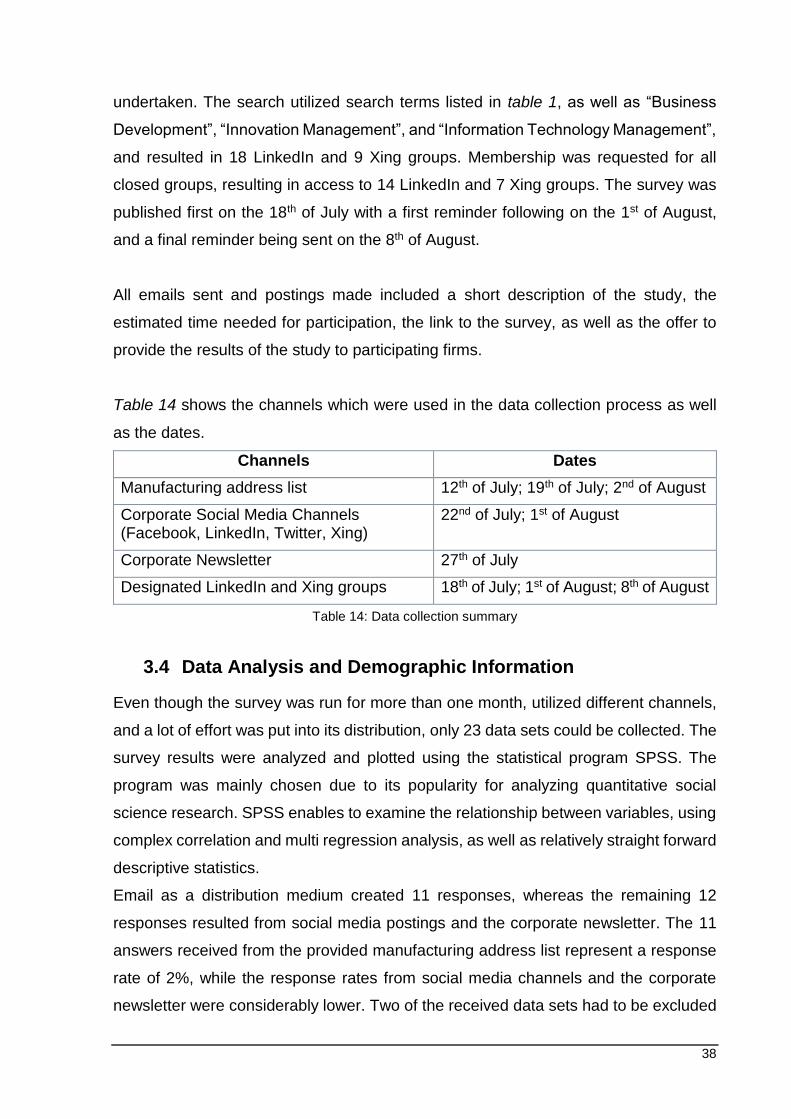
38
undertaken. The search utilized search terms listed in table 1, as well as “Business
Development”, “Innovation Management”, and “Information Technology Management”,
and resulted in 18 LinkedIn and 9 Xing groups. Membership was requested for all
closed groups, resulting in access to 14 LinkedIn and 7 Xing groups. The survey was
published first on the 18th of July with a first reminder following on the 1st of August,
and a final reminder being sent on the 8th of August.
All emails sent and postings made included a short description of the study, the
estimated time needed for participation, the link to the survey, as well as the offer to
provide the results of the study to participating firms.
Table 14 shows the channels which were used in the data collection process as well
as the dates.
Channels Dates
Manufacturing address list 12th of July; 19th of July; 2nd of August
Corporate Social Media Channels (Facebook, LinkedIn, Twitter, Xing)
22nd of July; 1st of August
Corporate Newsletter 27th of July
Designated LinkedIn and Xing groups 18th of July; 1st of August; 8th of August
Table 14: Data collection summary
3.4 Data Analysis and Demographic Information
Even though the survey was run for more than one month, utilized different channels,
and a lot of effort was put into its distribution, only 23 data sets could be collected. The
survey results were analyzed and plotted using the statistical program SPSS. The
program was mainly chosen due to its popularity for analyzing quantitative social
science research. SPSS enables to examine the relationship between variables, using
complex correlation and multi regression analysis, as well as relatively straight forward
descriptive statistics.
Email as a distribution medium created 11 responses, whereas the remaining 12
responses resulted from social media postings and the corporate newsletter. The 11
answers received from the provided manufacturing address list represent a response
rate of 2%, while the response rates from social media channels and the corporate
newsletter were considerably lower. Two of the received data sets had to be excluded
39
due to no information provided regarding the degree and importance of servitization
and two further responses could not be considered because more than 50% of the
questions were left blank. Hence, the resulting sample size is 19 (N=19).
Bryman and Bell (2011) refer to a non-response problem, which is of particular
significance for survey research. Several researchers indicate a declining response
rate to surveys which implies a growing general tendency towards people refusing to
participate in survey research. Nevertheless, due to varying research settings and
respondent types, it is difficult to find consistent evidence for this observed tendency
(Bryman and Bell 2011). A high non-response rate, as experienced in this survey,
implies a sample bias and challenges the researcher to find other ways to analyze the
sample. As a result, descriptive statistics were chosen to quantitatively describe the
main features of the collection of information. Rather than using the data to learn about
a population, descriptive statistics aim to summarize a sample (Eid et al. 2013). In the
following, descriptive statistical methods, such as frequency analysis and cross
tabulation are used with the purpose to discover trends in coherences in the data and
hence reject or not reject the stated hypotheses. Due to the low sample size one has
to expect that the relationship (dependency) between variables has a very low
statistical significance in many cases. Literature suggests at least 50 randomly-
selected participants to keep the estimated margin of error below 15 percentage points.
For a sample size of only 20, the estimated margin of error is 22 percent (Backhaus et
al. 2016). Hence, to address the given research limitations, this study speaks about
trends rather than statistical evidence when answering the stated hypotheses. The
cross tabulations between two ordinal variables, as utilized in this study, show patterns
of association and can moreover reveal the direction of the relationship. A positive
relationship is given when cases with a high independent variable also have high
values on the dependent variable, while a negative relationship refers to situations in
which a high value on the independent variable occurs with a low value on the
dependent variable. In order to provide a directional as well as a symmetric measure
of association for the ordinal variables, Somer’s d was plotted for each investigated
cross table (Neuman 2013). Once again, while interpreting the directional relationship
based on the Somer’s d measure, one has to be aware of the error margin, resulting
from the small sample size. Together with all cross tabulations and Somer’s d outputs,
40
processing summaries that show valid sample sizes as well as missing data are
attached in the appendix.
This section analyzes the demographic structure of the sample. All tables and
descriptive methods used as a basis for the results and interpretations are attached in
the appendix.
Following the industrial classification provided by Detecon, surveyed companies were
divided into the categories “Automotive and Suppliers”, “High-tech”, “Manufacturing”,
“Pharma & Health” and “Other Industry”. Out of 19 respondents, 11 respondents (58%)
worked in the automotive and suppliers industry, 5 in manufacturing, 2 in high-tech,
and 1 respondent didn’t further specify any industry (Demographics Table 1). With
84%, the majority of surveyed firms employs more than 10.000 people (16 out of 19),
while 2 firms employ between 1.001 to 10.000, and 1 firm less than 50 employees
(Demographics Table 2). Respondents held mostly management positions (12 out of
19) (Demographics Table 3) in the organizational units IT (8), Sales (4), Business
Development (2), Innovation Management (1), Strategy (1), and Financial Services (1).
One respondent described his or her organizational unit as “Operation”, whereas
another didn’t answer the question (Demographics Table 4). In their profession, 14 of
the respondents have been confronted with the development of PSS, of which 11
respondents stated that they experienced it in 10 or more cases (Demographics Table
5). Moreover, the respondents’ age ranged from 42 to 68 (Demographics Table 6) and
each respondent worked for at least 4 years for the firm which was subject of the inquiry
(Demographics Table 7).
41
4 RESULTS AND DISCUSSION
In this concluding chapter, the results of the quantitative study are presented and
reflected against the theoretical findings. Managerial implications are derived and a
critical position is taken regarding the limitations of this study. Finally, suggestions and
ideas for further research are given.
4.1 Survey Results
The results of data analysis are presented and reference is made to the hypotheses,
following the general structure of the study. First, general observations on servitization
are presented, before secondly examining dynamic capabilities, and thirdly the role of
IT in relation to servitization.
4.1.1 General Observations on Servitization
As far as the current importance of PSS for the enterprise was not already indicated
with the highest available value “very important”, all except for 2 respondents expect
an increasing importance of PSS in the future. Expressed as a percentage, while
currently 24% of the respondents view PSS as very important for their firm, 76% expect
PSS to be very important in the future (Servitization Table 1 and 2). Similarly, all except
for 3 respondents expect that the service orientation in their enterprise’s policies,
practices and procedures will increase as long as it has not already been indicated
with “very important”. At present 24% of the respondents view service orientation as
very important in their firm’s policies, practices and procedures, whereas 71% estimate
service orientation to be very important in the future (Servitization Table 3 and 4). The
service share, estimated as the percentage of the total revenue of the surveyed firm
generated through services is not further considered due to the incompleteness of the
received data.
The importance of PSS for the surveyed firm was expected to capture a rather external
perspective due to a strong dependence on the industry and competitors behavior,
while the measure “service orientation” is assumed to focus on internal characteristics.
Consequently, the dynamic capability variables were measured against the current
service orientation. Besides examining the degree (service orientation) and importance
(importance of PSS) of servitization, as well as the expected future development of
42
both, the surveyed firms were asked to rate the current importance of their IT
organization for the development of PSS and for the delivery of PSS. While only 7 out
of 19 (37%) respondents assign their IT organization currently an important or very
important role for the development of PSS (Servitization Table 5), the majority (12 out
of 19, or 63%) sees the IT organization currently as important or very important for the
delivery of PSS (Servitization Table 6). Furthermore, the importance of the IT
organization for the delivery of PSS is at least indicated with “moderately important”.
4.1.2 Dynamic Capabilities
Values for the three dynamic capabilities sensing, seizing and reconfiguring were
computed as a mean function of the collected multiple-indicator measures.
Subsequently the three dynamic capabilities were mapped with service orientation as
dependent variable, using the SPSS cross tabulation function in order to identify trends
and address the stated hypotheses. Owing to the small sample, the significance has
to be challenged.
The hypothesis that firms with a strong current service orientation possess dynamic
sensing capabilities was not rejected based on the cross table analysis. 9 out of 11
firms where service orientation is either important or very important clearly confirm to
have dynamic sensing capabilities (Crosstab 1). Additionally, Somer’s d was run to
determine the association between current service orientation and dynamic sensing
capabilities amongst 18 participants. There is a positive relationship (d = .379) between
the ordinal variables with a statistical significance of p = 0.013 (Directional Measures
1).
Furthermore, the hypothesis that firms with a strong service orientation possess
dynamic seizing capabilities was rejected. Only 3 out of 10 respondents who report
current service orientation to be important or very important, clearly indicate to have
dynamic seizing capabilities in their firms (Crosstab 2). The directional measure
analysis reveals a positive relationship with p = .295 but a low approximate significance
of p=0.17 (Directional Measures 2).
Investigation of dynamic reconfiguring capabilities show 5 out of 10 firms with high
service orientation confirming their possession (Crosstab 3). Even though a weak trend
seems to be noticeable, after considering the low significance level of p= 0.201,
hypothesis 3 was rejected (d = 0.275, Directional Measures 3).
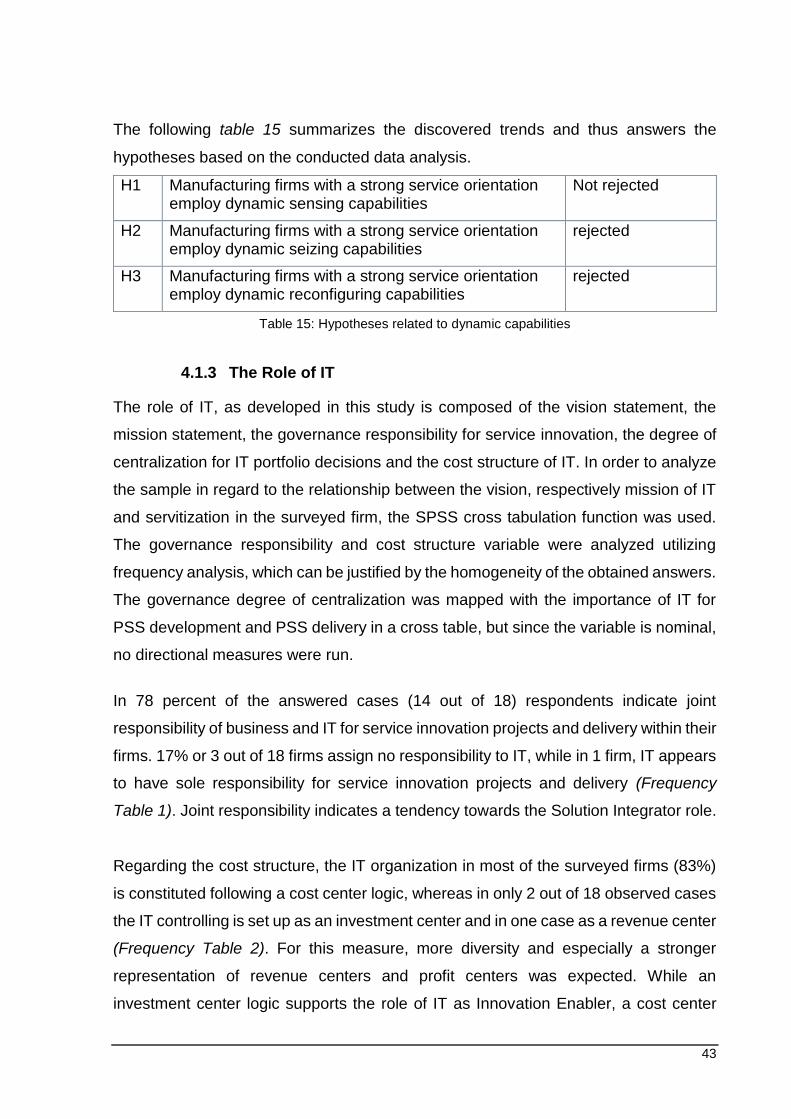
43
The following table 15 summarizes the discovered trends and thus answers the
hypotheses based on the conducted data analysis.
H1 Manufacturing firms with a strong service orientation employ dynamic sensing capabilities
Not rejected
H2 Manufacturing firms with a strong service orientation employ dynamic seizing capabilities
rejected
H3 Manufacturing firms with a strong service orientation employ dynamic reconfiguring capabilities
rejected
Table 15: Hypotheses related to dynamic capabilities
4.1.3 The Role of IT
The role of IT, as developed in this study is composed of the vision statement, the
mission statement, the governance responsibility for service innovation, the degree of
centralization for IT portfolio decisions and the cost structure of IT. In order to analyze
the sample in regard to the relationship between the vision, respectively mission of IT
and servitization in the surveyed firm, the SPSS cross tabulation function was used.
The governance responsibility and cost structure variable were analyzed utilizing
frequency analysis, which can be justified by the homogeneity of the obtained answers.
The governance degree of centralization was mapped with the importance of IT for
PSS development and PSS delivery in a cross table, but since the variable is nominal,
no directional measures were run.
In 78 percent of the answered cases (14 out of 18) respondents indicate joint
responsibility of business and IT for service innovation projects and delivery within their
firms. 17% or 3 out of 18 firms assign no responsibility to IT, while in 1 firm, IT appears
to have sole responsibility for service innovation projects and delivery (Frequency
Table 1). Joint responsibility indicates a tendency towards the Solution Integrator role.
Regarding the cost structure, the IT organization in most of the surveyed firms (83%)
is constituted following a cost center logic, whereas in only 2 out of 18 observed cases
the IT controlling is set up as an investment center and in one case as a revenue center
(Frequency Table 2). For this measure, more diversity and especially a stronger
representation of revenue centers and profit centers was expected. While an
investment center logic supports the role of IT as Innovation Enabler, a cost center
44
logic widely imposes decisional restrictions and compromises sovereignty of the
organizational unit. Therefore, the share of IT organizations following cost center
accounting while addressing a strong Innovation Enabler or Solution Integrator role in
the remaining components is surprising. There was no potential correlation discovered
between the three deviating responses and other items.
Concerning the degree of centralization for IT portfolio decisions, 9 firms have a
decentralized governance model, 6 a federalized model and 3 report a centralized
governance model. One respondent did not provide any answer. Mapping the degree
of centralization against the measures of “importance of the IT organization for the
development of PSS” and “importance of the IT organization for the delivery of PSS”
shows that firms with a high importance of their IT organization for PSS tend to have
either decentralized or federalized governance models in place. 4 out of 6 respondents
with a high importance of IT for PSS development and 7 out of 11 with a high
importance of IT for PSS delivery state a decentralized model, while the remaining 2,
respectively 4 have a federalized model (Crosstab 4 and Crosstab 5). Even though the
centralized model is underrepresented in general, this leads to the assumption that a
centralized governance model, which represents the Efficient Operator role does not
support the contribution of IT to PSS development and delivery.
Following the same approach as for the dynamic capabilities, the IT vision was
constructed as a mean of the multiple-indicator measures. Thereafter, the vision and
mission measures, representing the three roles of IT (Innovation Enabler, Solution
Integrator and Efficient Operator) were put into relation with the importance of the IT
organization for PSS development, respectively PSS delivery. For the analysis, cross
tabulation was used to map the given answers against each other.
Especially respondents (N=19) who indicated a high importance of IT for the
development of PSS seem to agree or strongly agree with the Innovation Enabler
vision (6 out of 7, Crosstab 6). The Somer’s d = .617 determines a strong positive
association between the Innovation Enabler vision and the importance of IT for PSS
development. According to the descriptive analysis, the value is statistically significant
with p < .0005. Nevertheless, the overall confidence level of the sample results is
relatively low due to the low sample size of N=19 (Directional Measures 4). Regarding
the importance of IT for the delivery of PSS and the Innovation Enabler vision, the
45
trend seems to be less distinct with 7 out of 12 responses (Crosstab 8). There is a
positive relationship (d = .368) between the variables which shows a calculated
significance of p= .044 (Directional Measures 5). The cross tabulation for the
importance of the IT organization for PSS development and the Innovation Enabler
mission (d = .595, p < .0005, Directional Measures 10 and Crosstab 12), as well as for
the importance of the IT organization for PSS delivery yield very similar results (d =
.421, p = 0.008, Directional Measures 11 and Crosstab 13).
The Solution Integrator vision examined with the same procedure shows a trend
towards a positive correlation with the importance for PSS delivery, but not for the
importance for PSS development. Respondents who assess the current importance of
their IT organization for PSS delivery as either important or very important tend to
agree or strongly agree with the solution integrator vision (7 out of 12) while the
remaining 5 respondent answered “undecided” (Crosstab 7). The association was
determined with d = .358 and a significance level of .079 after running a Somer’s d
analysis (Directional Measures 7). As one would expect, the cross tabulation for the
Solution Integrator mission yields a very similar outcome for PSS delivery (d = .439, p
= .019, Directional measures 13 and Crosstab 15). Regarding the important and very
important “PSS development” respondents, 4 of 7 respondents agree or strongly agree
with the mission (Crosstab 12). In contrast to the Solution Integrator vision, a positive
relationship (d = .307) and a comparably higher significance (p = .085) were found for
the importance of IT for PSS development and the Solution Integrator mission
(Directional Measures 12).
No trend in the responses could be identified for the Efficient Operator vision and
mission (Crosstab 10 and Directional Measure 8, Crosstab 11 and Directional Measure
9, Crosstab 16 and Directional Measure 14, Crosstab 17 and Directional Measure 15).
As a result of the investigation of the constructed Role of IT measures and the
discovered trends in association with the importance of the IT organization for PSS
development, respectively PSS delivery, Hypotheses H4 to H8 can be answered
(Table 16). It should be stressed once again that the rejection or non-rejection of
hypotheses was based on trends rather than statistically significant
representativeness. Derived from the discovered trends, the hypotheses that a
dominant Innovation Enabler role has a positive relationship with the importance of IT
for PSS development (H4), as well as for the importance of IT for PSS delivery (H5)
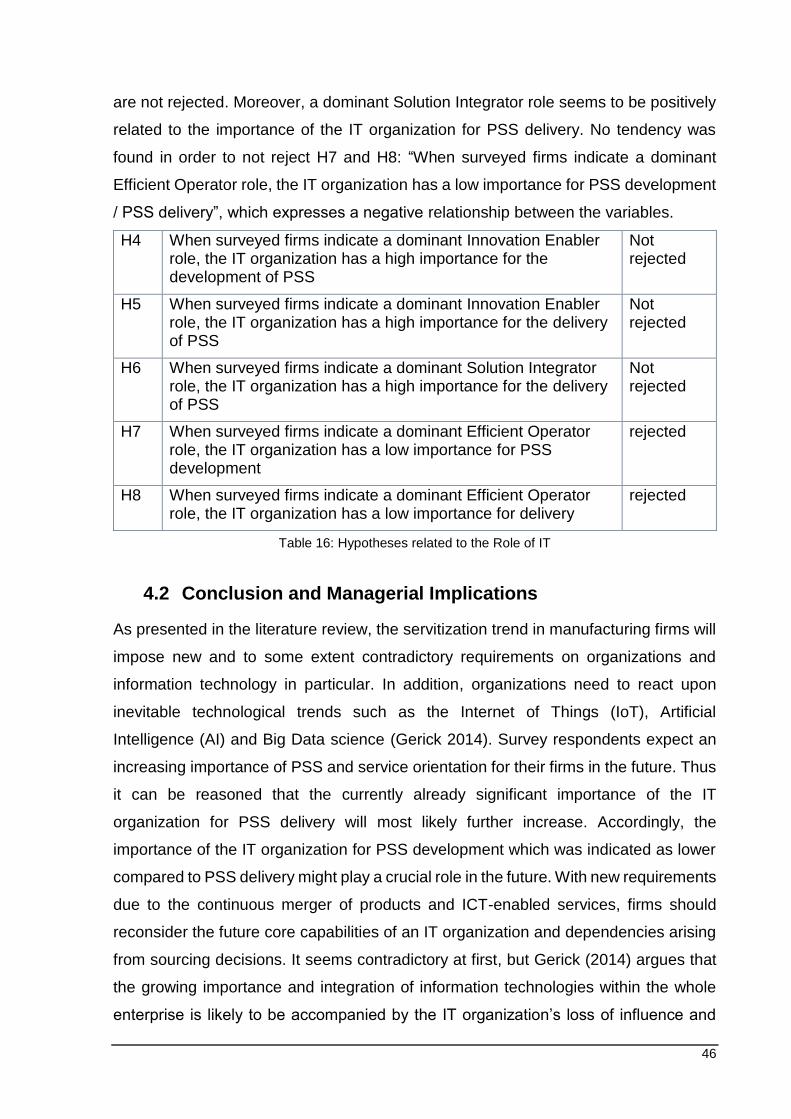
46
are not rejected. Moreover, a dominant Solution Integrator role seems to be positively
related to the importance of the IT organization for PSS delivery. No tendency was
found in order to not reject H7 and H8: “When surveyed firms indicate a dominant
Efficient Operator role, the IT organization has a low importance for PSS development
/ PSS delivery”, which expresses a negative relationship between the variables.
H4 When surveyed firms indicate a dominant Innovation Enabler role, the IT organization has a high importance for the development of PSS
Not rejected
H5 When surveyed firms indicate a dominant Innovation Enabler role, the IT organization has a high importance for the delivery of PSS
Not rejected
H6 When surveyed firms indicate a dominant Solution Integrator role, the IT organization has a high importance for the delivery of PSS
Not rejected
H7 When surveyed firms indicate a dominant Efficient Operator role, the IT organization has a low importance for PSS development
rejected
H8 When surveyed firms indicate a dominant Efficient Operator role, the IT organization has a low importance for delivery
rejected
Table 16: Hypotheses related to the Role of IT
4.2 Conclusion and Managerial Implications
As presented in the literature review, the servitization trend in manufacturing firms will
impose new and to some extent contradictory requirements on organizations and
information technology in particular. In addition, organizations need to react upon
inevitable technological trends such as the Internet of Things (IoT), Artificial
Intelligence (AI) and Big Data science (Gerick 2014). Survey respondents expect an
increasing importance of PSS and service orientation for their firms in the future. Thus
it can be reasoned that the currently already significant importance of the IT
organization for PSS delivery will most likely further increase. Accordingly, the
importance of the IT organization for PSS development which was indicated as lower
compared to PSS delivery might play a crucial role in the future. With new requirements
due to the continuous merger of products and ICT-enabled services, firms should
reconsider the future core capabilities of an IT organization and dependencies arising
from sourcing decisions. It seems contradictory at first, but Gerick (2014) argues that
the growing importance and integration of information technologies within the whole
enterprise is likely to be accompanied by the IT organization’s loss of influence and
47
autonomy. Single business units seem to increasingly aim for an autonomous IT and
not seldom decide upon IT investments without consulting with the IT organization.
Reasons for such autonomy endeavors might be a lack of agility and innovation or an
insufficient compatibility of products and services compared to the market. The
development and provision of complex PSS demand not only new capabilities, but also
an increasingly close integration between what is loosely referred to as business and
IT. This accustomed, distinct divide between business and IT is part of the problem
many manufacturing firms will most probably face when pursuing a servitization
strategy. The divide automatically draws on the traditional view of IT as a support
function where the main contribution of IT is seen in the automation of manual
processes, tying IT closely to established business processes (Zimmermann 2013).
The conducted quantitative study indicates a positive connection between dynamic
sensing capabilities and a strong current service orientation. For dynamic seizing and
reconfiguring capabilities, no trend could be spotted, which does not necessarily mean
that they are less important. Sensing capabilities focus on the detection and shaping
of technological and market opportunities, as well as threats. Seizing and reconfiguring
capabilities in contrast aim to address opportunities and threats, and to achieve the
needed balance between service strategy and organizational design. Regarding the
role of IT, most of the respondents indicated a joint responsibility of business and IT
for technology and service innovation projects and delivery in their firms. Together with
the as predominant observed decentralized and federalized governance models for IT
investments, this evermore necessitates an alignment between business and IT.
The idea of alignment between business and IT is by far not new. Several alignment
models emerged in the early 1990s with the aim to explain the connection and advise
adjustment from a holistic and prescriptive perspective. The probably most widely cited
alignment model was developed by Henderson and Venkatraman (1993) and
influenced by the MIT research (Chan, Reich 2007). In the Strategic Alignment Model
(SAM), as shown in figure 13, the four key domains of business strategy, organizational
infrastructure and processes, IT strategy, and IT infrastructure and processes are
aligned through linkages between any three of these domains. The concept of strategic
alignment is based on strategic fit and functional integration between the four key
domains. Henderson and Venkatraman (1993) discriminate not only between an
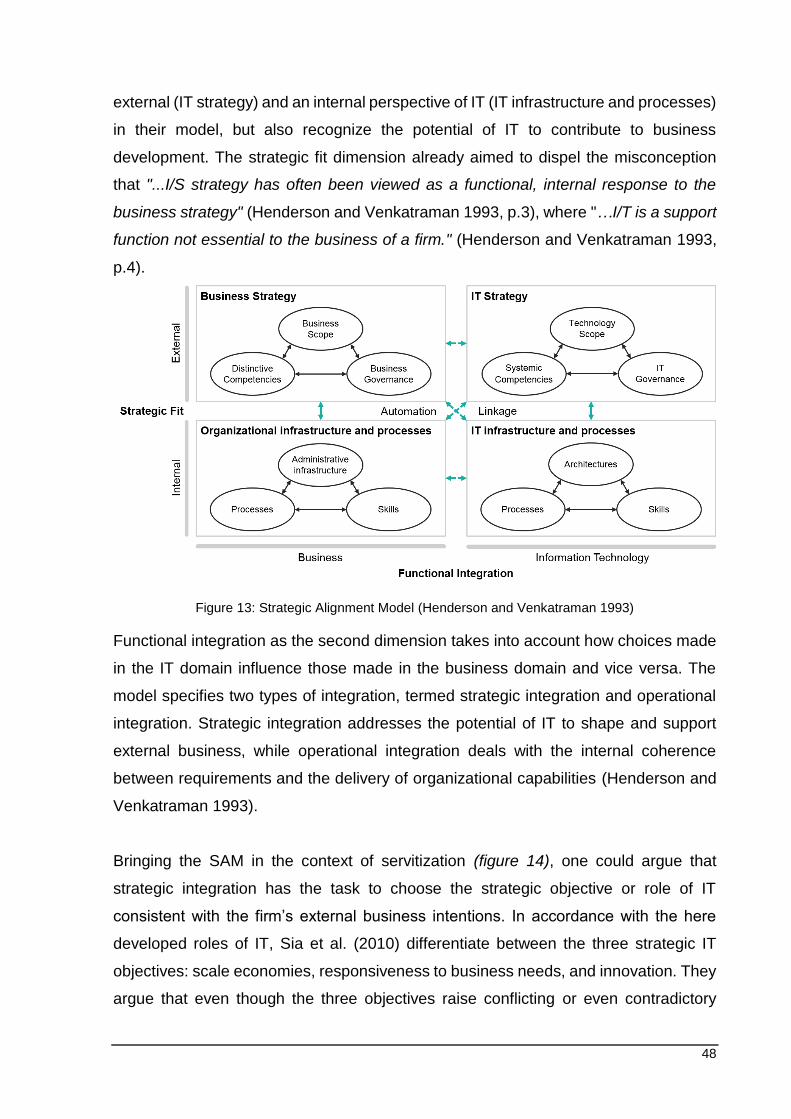
48
external (IT strategy) and an internal perspective of IT (IT infrastructure and processes)
in their model, but also recognize the potential of IT to contribute to business
development. The strategic fit dimension already aimed to dispel the misconception
that "...I/S strategy has often been viewed as a functional, internal response to the
business strategy" (Henderson and Venkatraman 1993, p.3), where "…I/T is a support
function not essential to the business of a firm." (Henderson and Venkatraman 1993,
p.4).
Figure 13: Strategic Alignment Model (Henderson and Venkatraman 1993)
Functional integration as the second dimension takes into account how choices made
in the IT domain influence those made in the business domain and vice versa. The
model specifies two types of integration, termed strategic integration and operational
integration. Strategic integration addresses the potential of IT to shape and support
external business, while operational integration deals with the internal coherence
between requirements and the delivery of organizational capabilities (Henderson and
Venkatraman 1993).
Bringing the SAM in the context of servitization (figure 14), one could argue that
strategic integration has the task to choose the strategic objective or role of IT
consistent with the firm’s external business intentions. In accordance with the here
developed roles of IT, Sia et al. (2010) differentiate between the three strategic IT
objectives: scale economies, responsiveness to business needs, and innovation. They
argue that even though the three objectives raise conflicting or even contradictory
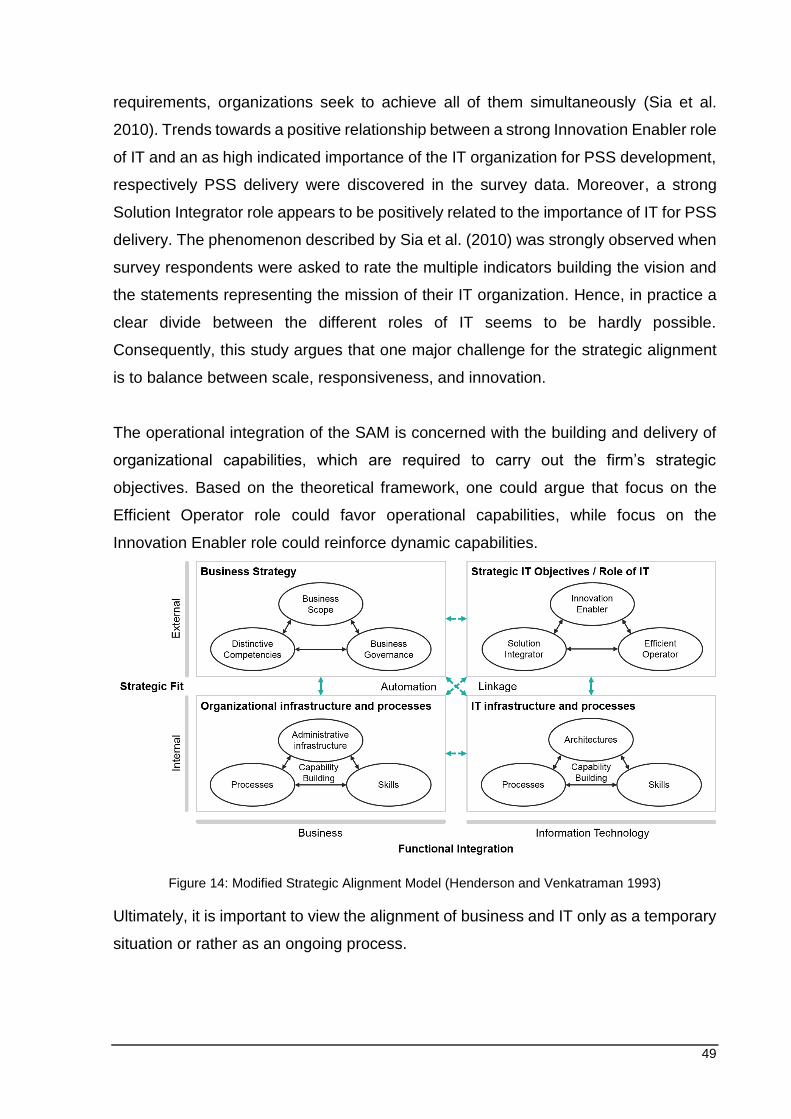
49
requirements, organizations seek to achieve all of them simultaneously (Sia et al.
2010). Trends towards a positive relationship between a strong Innovation Enabler role
of IT and an as high indicated importance of the IT organization for PSS development,
respectively PSS delivery were discovered in the survey data. Moreover, a strong
Solution Integrator role appears to be positively related to the importance of IT for PSS
delivery. The phenomenon described by Sia et al. (2010) was strongly observed when
survey respondents were asked to rate the multiple indicators building the vision and
the statements representing the mission of their IT organization. Hence, in practice a
clear divide between the different roles of IT seems to be hardly possible.
Consequently, this study argues that one major challenge for the strategic alignment
is to balance between scale, responsiveness, and innovation.
The operational integration of the SAM is concerned with the building and delivery of
organizational capabilities, which are required to carry out the firm’s strategic
objectives. Based on the theoretical framework, one could argue that focus on the
Efficient Operator role could favor operational capabilities, while focus on the
Innovation Enabler role could reinforce dynamic capabilities.
Figure 14: Modified Strategic Alignment Model (Henderson and Venkatraman 1993)
Ultimately, it is important to view the alignment of business and IT only as a temporary
situation or rather as an ongoing process.
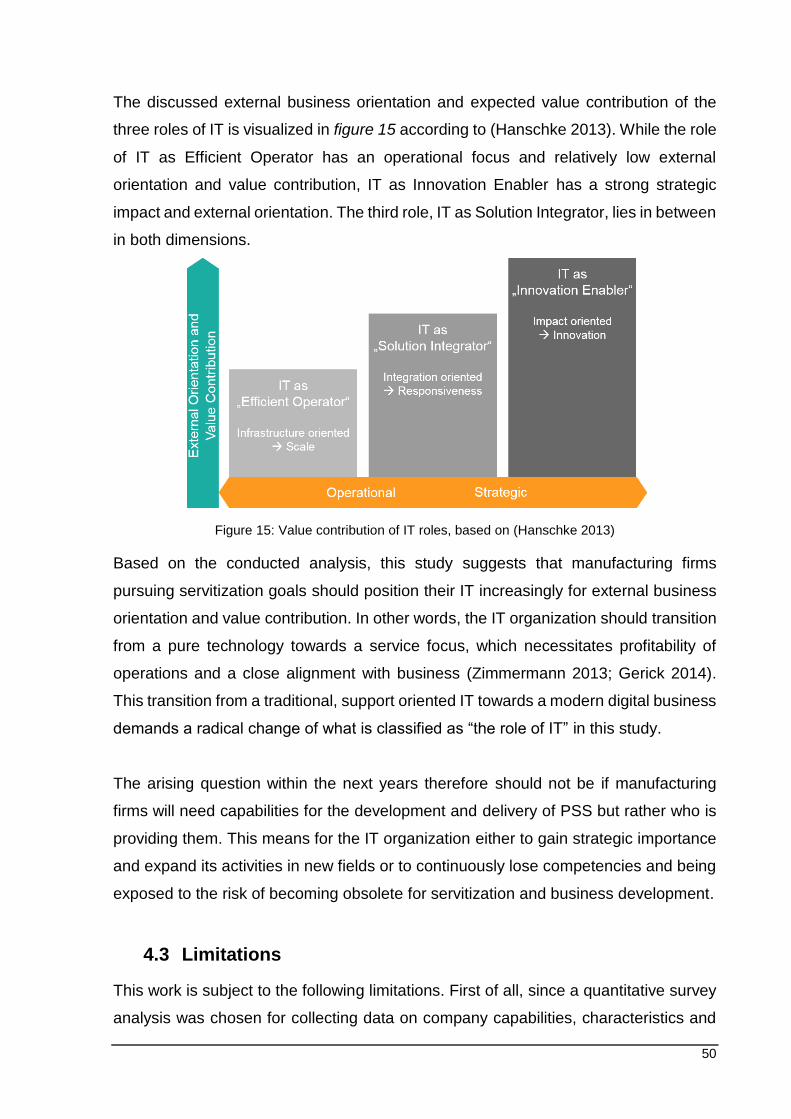
50
The discussed external business orientation and expected value contribution of the
three roles of IT is visualized in figure 15 according to (Hanschke 2013). While the role
of IT as Efficient Operator has an operational focus and relatively low external
orientation and value contribution, IT as Innovation Enabler has a strong strategic
impact and external orientation. The third role, IT as Solution Integrator, lies in between
in both dimensions.
Figure 15: Value contribution of IT roles, based on (Hanschke 2013)
Based on the conducted analysis, this study suggests that manufacturing firms
pursuing servitization goals should position their IT increasingly for external business
orientation and value contribution. In other words, the IT organization should transition
from a pure technology towards a service focus, which necessitates profitability of
operations and a close alignment with business (Zimmermann 2013; Gerick 2014).
This transition from a traditional, support oriented IT towards a modern digital business
demands a radical change of what is classified as “the role of IT” in this study.
The arising question within the next years therefore should not be if manufacturing
firms will need capabilities for the development and delivery of PSS but rather who is
providing them. This means for the IT organization either to gain strategic importance
and expand its activities in new fields or to continuously lose competencies and being
exposed to the risk of becoming obsolete for servitization and business development.
4.3 Limitations
This work is subject to the following limitations. First of all, since a quantitative survey
analysis was chosen for collecting data on company capabilities, characteristics and
51
behavior, all conclusions should be merely interpreted as tendencies, but not as
causalities. The effect is drastically increased in this work, due to the only small sample
that could be drawn from the executed survey. Owing to the small sample size as well
as the inclusion of convenience sampling, the respondent’s answers yield no
representativeness or generalization beyond the study sample (Neuman 2013;
Bryman, Bell 2011). Other potential limitations which might also affect the
generalization of findings are the industry and country specific characteristics
underlying this study. Among German industrial manufacturing firms, the Automotive
and Suppliers Sector is overrepresented in comparison to other countries, which is
reflected by the here conducted survey with 58% of the respondents representing the
Automotive and Suppliers sector. Furthermore, the descriptive analyses were
performed using a sample of N=19, even though the sample included two incomplete
data sets. The missing data can be attributed to respondents not answering single
questions in the survey. Not accounting for incomplete data sets, only 17 would have
been left for further analysis. In order to not further reduce an already small sample,
descriptive analysis were performed with the sample of N=19, as well as the subset of
complete answers (N=17) with the aim to identify significant differences. Since no
potential bias could be found, it was decided to keep the sample with 19 responses
(Streiner 2002). The limitation to employees with knowledge about PSS and strategic
characteristics of information technology in their respective enterprise added
increasing complexity to the research process and therefore contributed to the difficulty
of obtaining a larger sample.
4.4 Suggestions for Further Research
Due to the sample size and the chosen research structure, only separate
considerations of the effect of dynamic capabilities and characteristics of the IT
organization on servitization could be taken into account. Future research might obtain
better results by applying mixed methods (Creswell 2013). Hence, this study suggests
that especially the influence of the role of IT on servitization should be investigated
further by adding qualitative elements (e.g. interviews) to gather in-depth knowledge
on PSS development and PSS delivery in manufacturing firms. Using a combined
approach would allow to gather further information and integrate them with the survey
results.

52
Due to the nature of cross-sectional studies, there is a lack of confidence regarding the
direction of causality between dynamic capabilities, the role of IT and servitization.
Consequently, longitudinal research design would be necessary to examine the
direction of causality and to measure change over time.
VII
REFERENCES
Akershoek, Rob (2016): IT4IT for managing the business of it. A management guide: Van Haren Publishing.
Backhaus, Klaus; Erichson, Bernd; Plinke, Wulff (2016): Multivariate Analysemethoden. Eine anwendungsorientierte Einführung. 14., überarbeitete und aktualisierte Auflage (Lehrbuch).
Baines, T. S.; Lightfoot, H. W.; Benedettini, O.; Kay, J. M.; Roy, Rajkumar (2009): The servitization of manufacturing. A review of literature and reflection on future challenges. In Jnl of Manu Tech Mnagmnt 20 (5), pp. 547–567. DOI: 10.1108/17410380910960984.
Baines, T. S.; Lightfoot, H. W.; Evans, S.; Neely, A.; Greenough, R.; Peppard, J. et al. (2007): State-of-the-art in product-service systems. In Proceedings of the Institution of Mechanical Engineers, Part B: Journal of Engineering Manufacture 221 (10), pp. 1543–1552. DOI: 10.1243/09544054JEM858.
Baines, Tim; Lightfoot, Howard; Smart, Palie; Fletcher, Sarah (2013): Servitization of manufacturing firm. In Jnl of Manu Tech Mnagmnt 24 (4), pp. 637–646. DOI: 10.1108/17410381311327431.
Baines, Tim; W. Lightfoot, Howard (2013): Servitization of the manufacturing firm. In Int Jrnl of Op & Prod Mnagemnt 34 (1), pp. 2–35. DOI: 10.1108/IJOPM-02-2012-0086.
Belvedere, Valeria; Grando, Alberto; Bielli, Paola (2013): A quantitative investigation of the role of information and communication technologies in the implementation of a product-service system. In International Journal of Production Research 51 (2), pp. 410–426. DOI: 10.1080/00207543.2011.648278.
Brashear, Thomas; Gebauer, Heiko; Kowalkowski, Christian (2012): Customer‐focused and service‐focused orientation in organizational structures. In Jnl of Bus & Indus Marketing 27 (7), pp. 527–537. DOI: 10.1108/08858621211257293.
Brashear Alejandro, Thomas; Kowalkowski, Christian; Kindström, Daniel; Gebauer, Heiko (2013): ICT as a catalyst for service business orientation. In Jnl of Bus & Indus Marketing 28 (6), pp. 506–513. DOI: 10.1108/JBIM-04-2013-0096.
Brown, Carol V.; Magill, Sharon L. (1998): Reconceptualizing the Context-Design Issue for the Information Systems Function. In Organization Science 9 (2), pp. 176–194. DOI: 10.1287/orsc.9.2.176.
Bryman, Alan; Bell, Emma (2011): Business research methods. 3. ed. Oxford u.a.: Oxford Univ. Press.
Chan, Yolande E.; Reich, Blaize Horner (2007): IT alignment. What have we learned? In J Inf Technol 22 (4), pp. 297–315. DOI: 10.1057/palgrave.jit.2000109.
Chesbrough, Henry (2010): Business Model Innovation. Opportunities and Barriers. In Long Range Planning 43 (2-3), pp. 354–363. DOI: 10.1016/j.lrp.2009.07.010.
Chesbrough, Henry; Spohrer, Jim (2006): A research manifesto for services science. In Commun. ACM 49 (7), p. 35. DOI: 10.1145/1139922.1139945.
VIII
Controlling Wiki (2015): Center-Konzepte. Edited by R. Dillerup. Institut für Strategie und Controlling, Hochschule Heilbronn. Available online at https://www.controlling-wiki.com/de/index.php/Center-Konzepte, checked on 2nd of August, 2016.
Creswell, J. W. (2013): Research Design: Qualitative, Quantitative, and Mixed Methods Approaches: Sage Publications. Available online at https://books.google.de/books?id=EbogAQAAQBAJ.
Davies, A. (2004): Moving base into high-value integrated solutions. A value stream approach. In Industrial and Corporate Change 13 (5), pp. 727–756. DOI: 10.1093/icc/dth029.
den Hertog, Pim; van der Aa, Wietze; Jong, Mark W. de (2010): Capabilities for managing service innovation. Towards a conceptual framework. In Journal of Service Management 21 (4), pp. 490–514. DOI: 10.1108/09564231011066123.
Dillerup, R.; Stoi, R. (2013): Unternehmensführung: Vahlen.
Eid, Michael; Gollwitzer, Mario; Schmitt, Manfred (2013): Statistik und Forschungsmethoden. Lehrbuch. 3., korrigierte Aufl. Weinheim: Beltz. Available online at http://sub-hh.ciando.com/book/?bok_id=1350214.
Fink, Lior; Neumann, Seev (2007): Gaining Agility through IT Personnel Capabilities: The Mediating Role of IT Infrastructure Capabilities*. In Journal of the Association for Information Systems 8 (8), p. 440.
Frese, E.; Graumann, M.; Theuvsen, L. (2011): Grundlagen der Organisation: Entscheidungsorientiertes Konzept der Organisationsgestaltung: Gabler Verlag. Available online at https://books.google.de/books?id=1FEgBAAAQBAJ.
Gadatsch, Andreas (2009): IT Controlling – Concepts and Transformation into Practice. In Bus. Inf. Syst. Eng. 1 (3), pp. 254–262. DOI: 10.1007/s12599-009-0043-6.
Gadatsch, Andreas; Mayer, Elmar (2010): Masterkurs IT-Controlling. Grundlagen und Praxis für IT-Controller und CIOs – Balanced Scorecard – Portfoliomanagement – Wertbeitrag der IT – Projektcontrolling – Kennzahlen – IT-Sourcing – IT-Kosten- und Leistungsrechnung. 4., erweiterte Auflage. Wiesbaden: Vieweg+Teubner Verlag / GWV Fachverlage GmbH Wiesbaden. Available online at http://dx.doi.org/10.1007/978-3-8348-9740-4.
Gebauer, Heiko; Bravo‐Sanchez, Carlos; Fleisch, Elgar (2007): Service strategies in product manufacturing companies. In Business Strategy Series 9 (1), pp. 12–20. DOI: 10.1108/17515630810850073.
Gebauer, Heiko; Fleisch, Elgar (2007): An investigation of the relationship between behavioral processes, motivation, investments in the service business and service revenue. In Industrial Marketing Management 36 (3), pp. 337–348. DOI: 10.1016/j.indmarman.2005.09.005.
Gebauer, Heiko; Fleisch, Elgar; Friedli, Thomas (2005): Overcoming the Service Paradox in Manufacturing Companies. In European Management Journal 23 (1), pp. 14–26. DOI: 10.1016/j.emj.2004.12.006.
Gebauer, Heiko; Friedli, Thomas (2005): Behavioral implications of the transition process from products to services. In Jnl of Bus & Indus Marketing 20 (2), pp. 70–78. DOI: 10.1108/08858620510583669.
IX
Gerick, Thomas (2014): IT-Controlling muss Rolle des Service Providers einnehmen. In Control Manag Rev 58 (7), pp. 94–101. DOI: 10.1365/s12176-014-0898-3.
Gottschalk, Petter (2004): Managing IT functions. In Wim van Grembergen (Ed.): Strategies for information technology governance. Hershey Pa.: Idea Group Publishing, pp. 246–268.
Grant, Robert M. (2010): Contemporary strategy analysis - text and cases. 7. ed. Chichester u.a.: Wiley.
Grönroos, Christian (2000): Service Management and Marketing: a customer relationship management approach. In Chichester, England: John Wiley&Sons LTD.
Guillemette, Manon G.; Paré, Guy (2012): Transformation of the Information Technology Function in Organizations. A Case Study in the Manufacturing Sector. In Can J Adm Sci 29 (2), pp. 177–190. DOI: 10.1002/cjas.224.
Gustafsson, Anders; Brax, Saara (2005): A manufacturer becoming service provider – challenges and a paradox. In Managing Service Quality 15 (2), pp. 142–155. DOI: 10.1108/09604520510585334.
Gustafsson, Anders; Fischer, Thomas; Gebauer, Heiko; Gregory, Mike; Ren, Guangjie; Fleisch, Elgar (2010): Exploitation or exploration in service business development? In Journal of Service Management 21 (5), pp. 591–624. DOI: 10.1108/09564231011079066.
Hamel, Florian; Herz, Thomas Philipp; Uebernickel, Falk; Brenner, Walter (2010): State of the art: Managing costs and performance of Information Technology.
Hanschke, Inge (2013): Strategisches Management der IT-Landschaft. Ein praktischer Leitfaden für das Enterprise Architecture Management. 3., aktualisierte und erw. Aufl. München: Hanser.
Helfat, Constance E.; Finkelstein, Sydney; Mitchell, Will; Peteraf, Margaret; Singh, Harbir; Teece, David; Winter, Sidney G. (2009): Dynamic capabilities: Understanding strategic change in organizations: John Wiley & Sons.
Helfat, Constance E.; Peteraf, Margaret A. (2003): The dynamic resource-based view. Capability lifecycles. In Strat. Mgmt. J. 24 (10), pp. 997–1010. DOI: 10.1002/smj.332.
Henderson, John C.; Venkatraman, Natarajan (1993): Strategic alignment: Leveraging information technology for transforming organizations. In IBM systems journal 32 (1), pp. 4–16.
Huang, M.-H.; Rust, R. T. (2013): IT-Related Service. A Multidisciplinary Perspective. In Journal of Service Research 16 (3), pp. 251–258. DOI: 10.1177/1094670513481853.
IDC (2010): Worldwide Black Book. Framingham: IDC.
Kindström, Daniel (2010): Towards a service-based business model – Key aspects for future competitive advantage. In European Management Journal 28 (6), pp. 479–490. DOI: 10.1016/j.emj.2010.07.002.
Kindström, Daniel; Kowalkowski, Christian (2014): Service innovation in product-centric firms. A multidimensional business model perspective. In Jnl of Bus & Indus Marketing 29 (2), pp. 96–111. DOI: 10.1108/JBIM-08-2013-0165.
X
Kindström, Daniel; Kowalkowski, Christian; Sandberg, Erik (2013): Enabling service innovation. A dynamic capabilities approach. In Journal of Business Research 66 (8), pp. 1063–1073. DOI: 10.1016/j.jbusres.2012.03.003.
Kowalkowski, Christian; Brehmer, Per‐Olof (2008): Technology as a driver for changing customer‐provider interfaces. In Management Research News 31 (10), pp. 746–757. DOI: 10.1108/01409170810908507.
Leseure, M.; Martinez, Veronica; Bastl, Marko; Kingston, Jennifer; Evans, Stephen
(2010): Challenges in transforming manufacturing organisations into product‐service providers. In Jnl of Manu Tech Mnagmnt 21 (4), pp. 449–469. DOI: 10.1108/17410381011046571.
Lightfoot, Howard; Baines, Tim; Smart, Palie (2013): The servitization of manufacturing. In Int Jrnl of Op & Prod Mnagemnt 33 (11/12), pp. 1408–1434. DOI: 10.1108/IJOPM-07-2010-0196.
Lytle, Richard S.; Hom, Peter W.; Mokwa, Michael P. (1998): SERV∗OR. A managerial measure of organizational service-orientation. In Journal of Retailing 74 (4), pp. 455–489. DOI: 10.1016/S0022-4359(99)80104-3.
Mahnel, Matthias; Friedrich, Wilhelm (2005): So klingt der Erfolg. Preisstrategien für Ersatzteile und Serviceverträge ; [Leitfaden für den Maschinen- und Anlagenbau, die Elektroindustrie und Zulieferindustrie]. Frankfurt am Main: VDMA.
Mathieu, Valérie (2001a): Product services. From a service supporting the product to a service supporting the client. In Jnl of Bus & Indus Marketing 16 (1), pp. 39–61. DOI: 10.1108/08858620110364873.
Mathieu, Valérie (2001b): Service strategies within the manufacturing sector. Benefits, costs and partnership. In Int J of Service Industry Mgmt 12 (5), pp. 451–475. DOI: 10.1108/EUM0000000006093.
Mintzberg, Henry (1979): The structuring of organizations. A synthesis of the research. Upper Saddle River, NJ: Prentice-Hall (The theory of management policy series).
Neely, Andy (2008): Exploring the financial consequences of the servitization of manufacturing. In Oper Manag Res 1 (2), pp. 103–118. DOI: 10.1007/s12063-009-0015-5.
Neu, W. A.; Brown, Stephen W. (2005): Forming Successful Business-to-Business Services in Goods-Dominant Firms. In Journal of Service Research 8 (1), pp. 3–17. DOI: 10.1177/1094670505276619.
Neuman, W. L. (2013): Social Research Methods: Qualitative and Quantitative Approaches: Pearson Education. Available online at https://books.google.de/books?id=Ybn3ngEACAAJ.
Nordin, Fredrik (2008): Linkages between service sourcing decisions and competitive advantage. A review, propositions, and illustrating cases. In International Journal of Production Economics 114 (1), pp. 40–55. DOI: 10.1016/j.ijpe.2007.09.007.
Nylén, Daniel; Holmström, Jonny (2015): Digital innovation strategy. A framework for diagnosing and improving digital product and service innovation. In Business Horizons 58 (1), pp. 57–67. DOI: 10.1016/j.bushor.2014.09.001.
XI
Oliva, Rogelio; Kallenberg, Robert (2003): Managing the transition from products to services. In Int J of Service Industry Mgmt 14 (2), pp. 160–172. DOI: 10.1108/09564230310474138.
Paiola, Marco; Saccani, Nicola; Perona, Marco; Gebauer, Heiko (2013): Moving from products to solutions. Strategic approaches for developing capabilities. In European Management Journal 31 (4), pp. 390–409. DOI: 10.1016/j.emj.2012.10.002.
Parida, Vinit; Sjödin, David Rönnberg; Lenka, Sambit; Wincent, Joakim (2015): Developing Global Service Innovation Capabilities. How Global Manufacturers Address the Challenges of Market Heterogeneity. In Research-Technology Management 58 (5), pp. 35–44. DOI: 10.5437/08956308X5805360.
Pearce II, John A.; David, Fred (1987): Corporate Mission Statements: The Bottom Line. In Academy of Management Executive (08963789) 1 (2), pp. 109–115.
Penttinen, Esko; Palmer, Jonathan (2007): Improving firm positioning through enhanced offerings and buyer–seller relationships. In Industrial Marketing Management 36 (5), pp. 552–564. DOI: 10.1016/j.indmarman.2006.02.005.
Peppard, Joe; Ward, John (2004): Beyond strategic information systems. Towards an IS capability. In The Journal of Strategic Information Systems 13 (2), pp. 167–194. DOI: 10.1016/j.jsis.2004.02.002.
Peterson, Ryan (2004a): Crafting information technology governance. In Information Systems Management 21 (4), pp. 7–22.
Peterson, Ryan R. (2004b): Integration strategies and tactics for information technology governance. In Wim van Grembergen (Ed.): Strategies for information technology governance, vol. 2. Hershey Pa.: Idea Group Publishing, pp. 37–80.
Ramiller, Neil C.; Swanson, E. Burton (2003): Organizing Visions for Information Technology and the Information Systems Executive Response. In Journal of management information systems 20 (1), pp. 13–50.
Rockart, John F.; Earl, Michael J.; Ross, Jeanne W. (1996): Eight imperatives for the new IT organization. In MIT Sloan Management Review 38 (1), p. 43.
Ross, W. Jeanne; Beath, M. Cynthia; Oncul, Batu (2010): The IT unit of the future: new approach to run and build. MIT Sloan Center for Information System Research. Cambridge (Volume 10, 12).
Ross, W. Jeanne; Beath, M. Cynthia; Quaadgras, Anne (2011): The IT Unit of the future: creating strategic value from IT. MIT Sloan Center for Information System Research. Cambridge (Volume 11, 10).
Ross, W. Jeanne; Mocker, Martin; Sebastian, Ina (2014): Architect your business - not just IT! MIT Sloan Center for Information System Research. Cambridge (Volume 14, 12).
Rust, Roland T. (2004): If everything is service, why is this happening now, and what difference does it make? In Journal of Marketing 68 (1), pp. 23–24.
Sambamurthy, V.; Bharadwaj, Anandhi; Grover, Varun (2003): Shaping Agility through Digital Options: Reconceptualizing the Role of Information Technology in Contemporary Firms. In MIS Quarterly 27 (2), pp. 237–263.
Sawhney, Mohanbir; Balasubramanian, Sridhar; Krishnan, Vish V. (2004): Creating growth with services. In MIT Sloan Management Review 45 (2), p. 34.
XII
Schuh, G.; Gudergan, G.; Feige, B. A.; Buschmeyer, A.; Krechting, D. (2015): Business Transformation in the Manufacturing Industry - How Information Acquisition, Analysis, usage and Distribution Affects the Success of Lifecycle-Product-Service-Systems. In Procedia CIRP 30, pp. 335–340. DOI: 10.1016/j.procir.2015.02.133.
Sia, Siew Kien; Soh, Christina; Weill, Peter (2010): Global IT management. Structuring for scale, responsiveness, and innovation. In Commun. ACM 53 (3), p. 59. DOI: 10.1145/1666420.1666449.
Song, Jaeki; Baker, Jeff; Davis, Fred D. (2015): Special section on the role of information technology in service delivery. In Inf Syst Front 17 (3), pp. 471–474. DOI: 10.1007/s10796-015-9552-7.
Story, Vicky M.; Raddats, Chris; Burton, Jamie; Zolkiewski, Judy; Baines, Tim (2016): Capabilities for advanced services. A multi-actor perspective. In Industrial Marketing Management. DOI: 10.1016/j.indmarman.2016.04.015.
Strecker, Stefan; Kargl, Herbert (2009): Integration Deficits of IT Controlling. In Bus. Inf. Syst. Eng. 1 (3), pp. 204–212. DOI: 10.1007/s12599-009-0053-4.
Street, Christopher T. (2007): Evolution in IS alignment and IS alignment capabilities over time. A test of punctuated equilibrium theory. Ottawa: Library and Archives Canada = Bibliothèque et Archives Canada (Canadian theses = Thèses canadiennes).
Streiner, David L. (2002): The case of the missing data: methods of dealing with dropouts and other research vagaries. In Canadian journal of psychiatry. Revue canadienne de psychiatrie 47 (1), pp. 68–75.
Teece, David J. (2007): Explicating dynamic capabilities. The nature and microfoundations of (sustainable) enterprise performance. In Strat. Mgmt. J. 28 (13), pp. 1319–1350. DOI: 10.1002/smj.640.
Teece, David J. (2010): Business Models, Business Strategy and Innovation. In Long Range Planning 43 (2-3), pp. 172–194. DOI: 10.1016/j.lrp.2009.07.003.
Teece, David J.; Pisano, Gary; Shuen, Amy (1997): Dynamic capabilities and strategic management. In Strat. Mgmt. J. 18 (7), pp. 509–533. DOI: 10.1002/(SICI)1097-0266(199708)18:7<509::AID-SMJ882>3.0.CO;2-Z.
Tranfield, David; Denyer, David; Smart, Palminder (2003): Towards a methodology
for developing evidence‐informed management knowledge by means of systematic review. In British journal of management 14 (3), pp. 207–222.
Tukker, Arnold (2004): Eight types of product–service system. Eight ways to sustainability? Experiences from SusProNet. In Bus. Strat. Env. 13 (4), pp. 246–260. DOI: 10.1002/bse.414.
Tukker, Arnold; Tischner, Ursula (2006): Product-services as a research field. Past, present and future. Reflections from a decade of research. In Journal of Cleaner Production 14 (17), pp. 1552–1556. DOI: 10.1016/j.jclepro.2006.01.022.
Vandermerwe, Sandra; Rada, Juan (1988): Servitization of business. Adding value by adding services. In European Management Journal 6 (4), pp. 314–324. DOI: 10.1016/0263-2373(88)90033-3.
Weill, P.; Broadbent, M. (1998): Leveraging the New Infrastructure: How Market Leaders Capitalize on Information Technology: Harvard Business Review Press.
XIII
Weill, Peter (2004): Don’t just lead, govern: How top-performing firms govern IT. In MIS Quarterly Executive 3 (1), pp. 1–17.
Weill, Peter; Vitale, Michael (2002): What IT infrastructure capabilities are needed to implement e-business models? In MIS Quarterly 1 (1), p. 17.
Westermann, George; Weill, Peter; McDonald, Mark (2006): Business Agility and IT Capabilities. MIT Sloan Center for Information System Research. Cambridge (Volume 6, 1E).
Windahl, Charlotta; Andersson, Pierre; Berggren, Christian; Nehler, Camilla (2004): Manufacturing firms and integrated solutions. Characteristics and implications. In Euro Jrnl of Inn Mnagmnt 7 (3), pp. 218–228. DOI: 10.1108/14601060410549900.
Winter, Sidney G. (2003): Understanding dynamic capabilities. In Strat. Mgmt. J. 24 (10), pp. 991–995. DOI: 10.1002/smj.318.
Zimmermann, Karsten (2013): Referenzprozessmodell für das Business-IT-Management. Vorgehen, Erstellung und Einsatz auf Basis qualitativer Forschungsmethoden. Hamburg.
XIV
APPENDIX
Servitization Survey
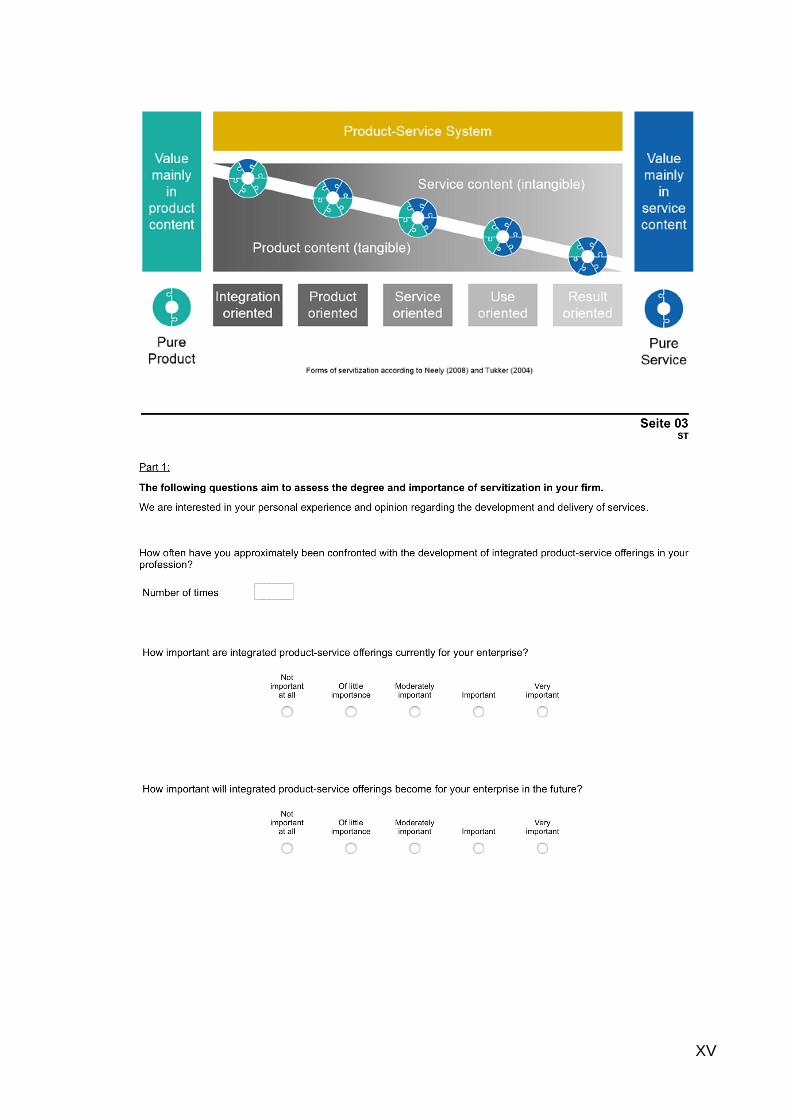
XV
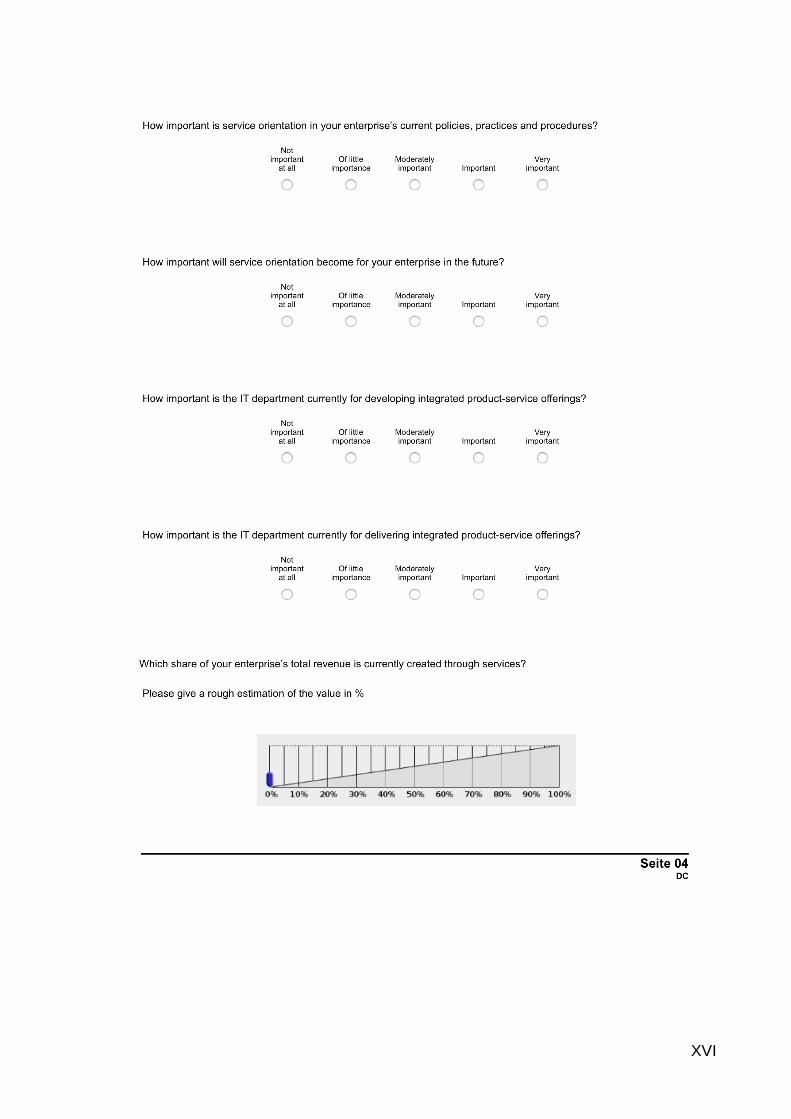
XVI
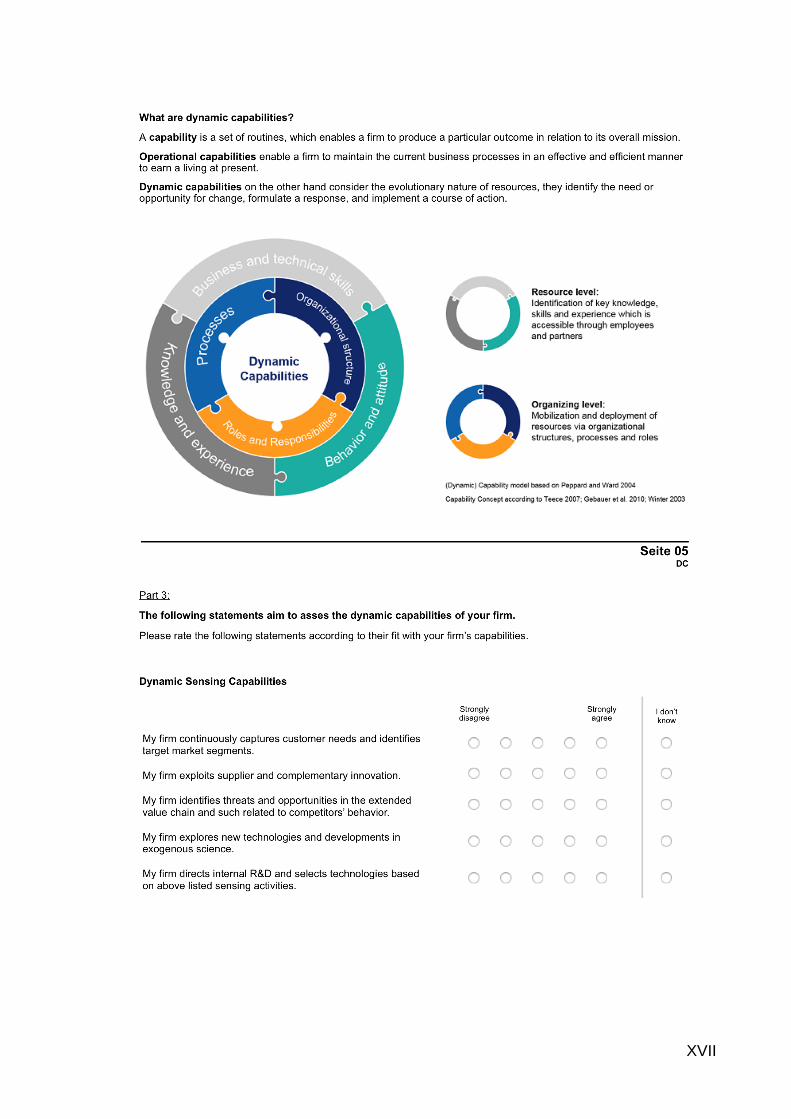
XVII
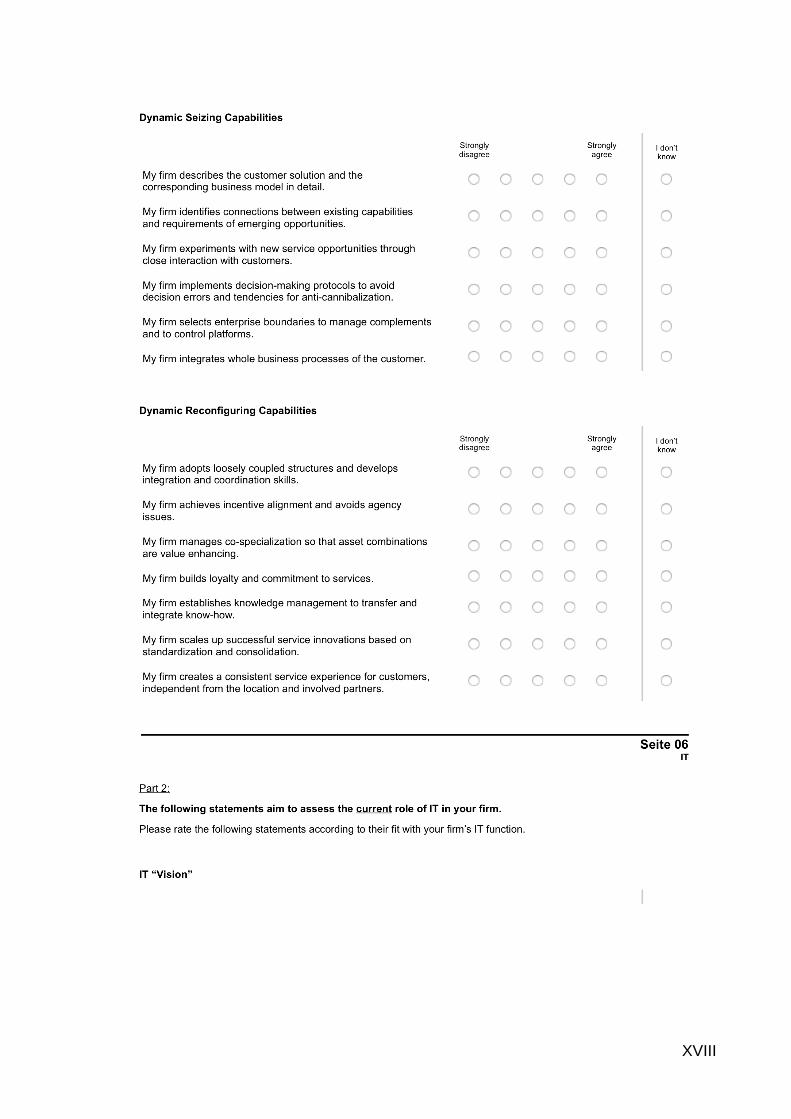
XVIII
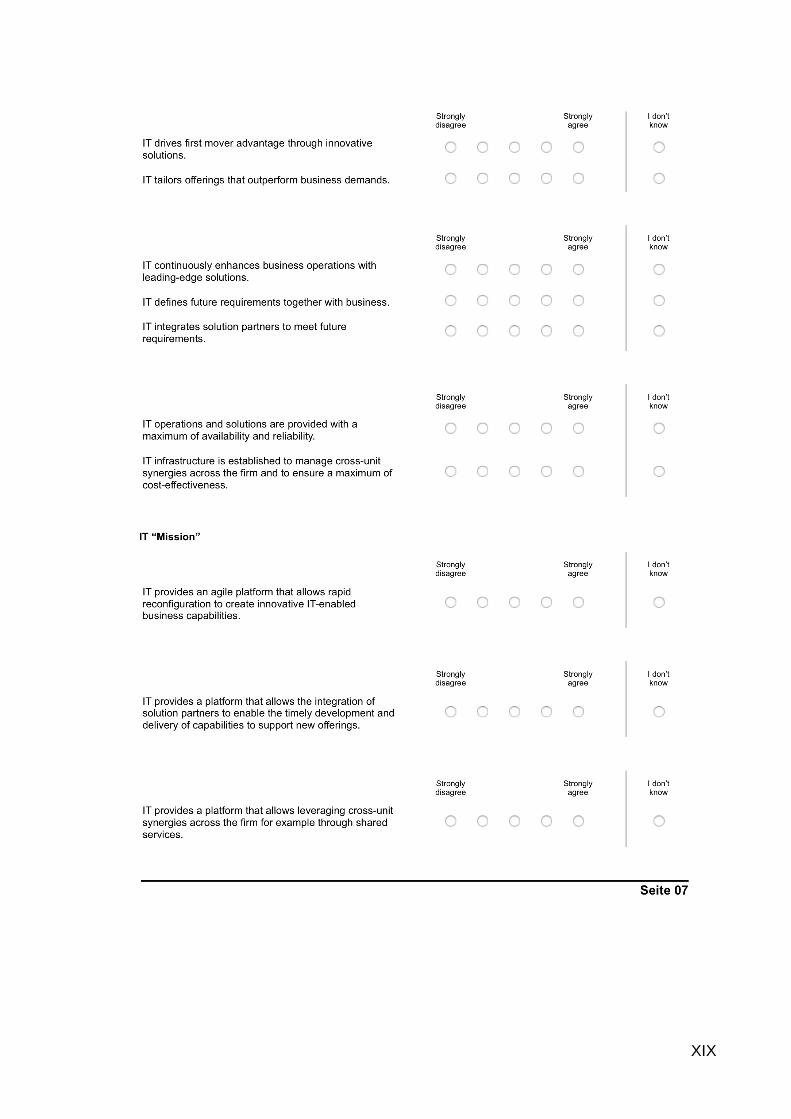
XIX
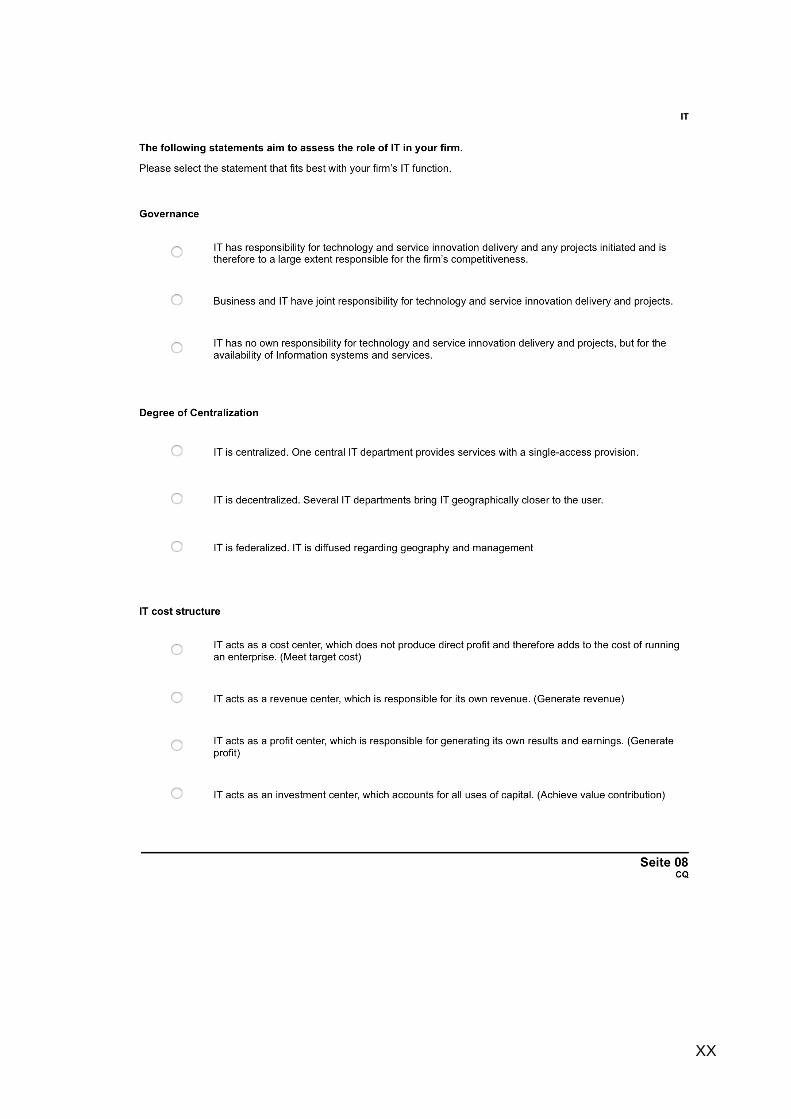
XX
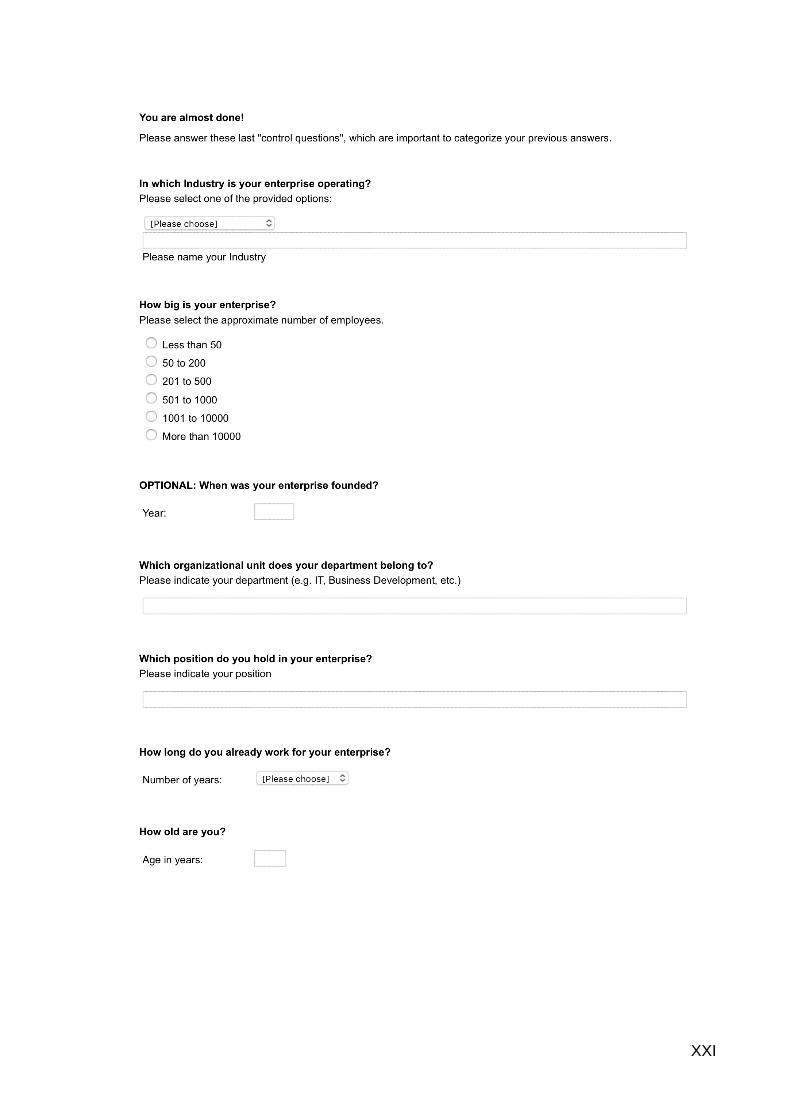
XXI
XXII
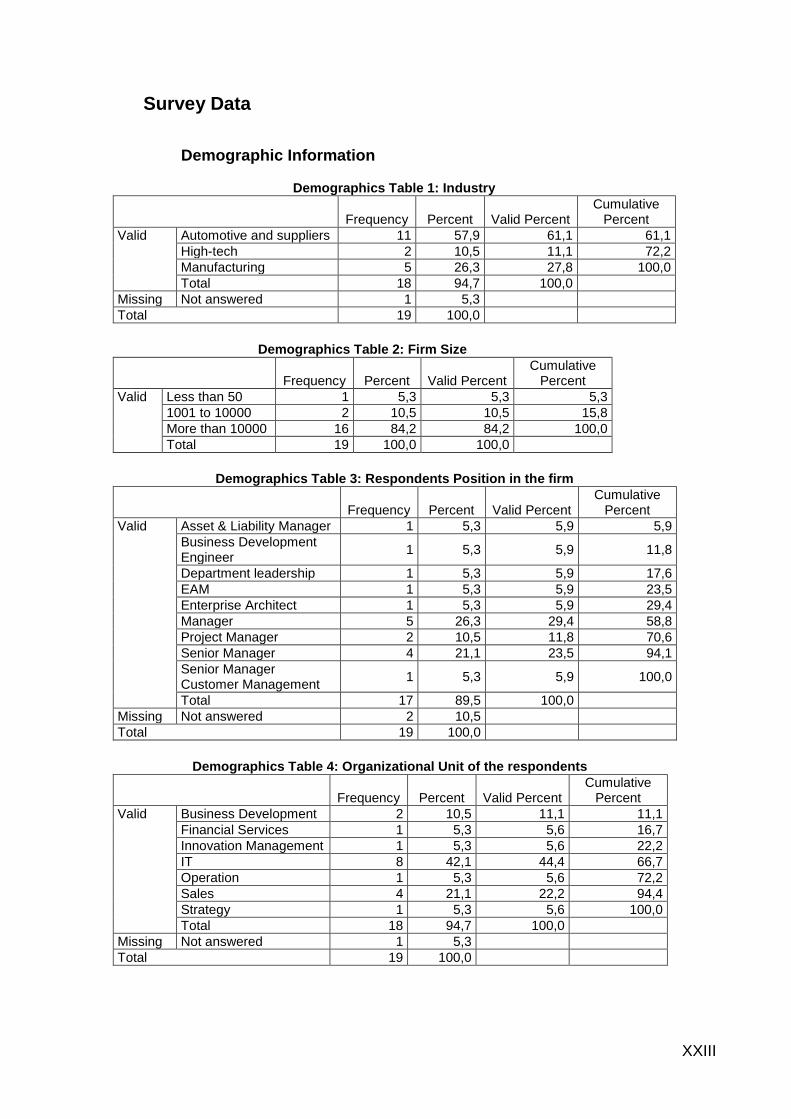
XXIII
Survey Data
Demographic Information
Demographics Table 1: Industry
Frequency Percent Valid Percent Cumulative
Percent
Valid Automotive and suppliers 11 57,9 61,1 61,1
High-tech 2 10,5 11,1 72,2
Manufacturing 5 26,3 27,8 100,0
Total 18 94,7 100,0
Missing Not answered 1 5,3
Total 19 100,0
Demographics Table 2: Firm Size
Frequency Percent Valid Percent Cumulative
Percent
Valid Less than 50 1 5,3 5,3 5,3
1001 to 10000 2 10,5 10,5 15,8
More than 10000 16 84,2 84,2 100,0
Total 19 100,0 100,0
Demographics Table 3: Respondents Position in the firm
Frequency Percent Valid Percent Cumulative
Percent
Valid Asset & Liability Manager 1 5,3 5,9 5,9
Business Development Engineer
1 5,3 5,9 11,8
Department leadership 1 5,3 5,9 17,6
EAM 1 5,3 5,9 23,5
Enterprise Architect 1 5,3 5,9 29,4
Manager 5 26,3 29,4 58,8
Project Manager 2 10,5 11,8 70,6
Senior Manager 4 21,1 23,5 94,1
Senior Manager Customer Management
1 5,3 5,9 100,0
Total 17 89,5 100,0
Missing Not answered 2 10,5
Total 19 100,0
Demographics Table 4: Organizational Unit of the respondents
Frequency Percent Valid Percent Cumulative
Percent
Valid Business Development 2 10,5 11,1 11,1
Financial Services 1 5,3 5,6 16,7
Innovation Management 1 5,3 5,6 22,2
IT 8 42,1 44,4 66,7
Operation 1 5,3 5,6 72,2
Sales 4 21,1 22,2 94,4
Strategy 1 5,3 5,6 100,0
Total 18 94,7 100,0
Missing Not answered 1 5,3
Total 19 100,0
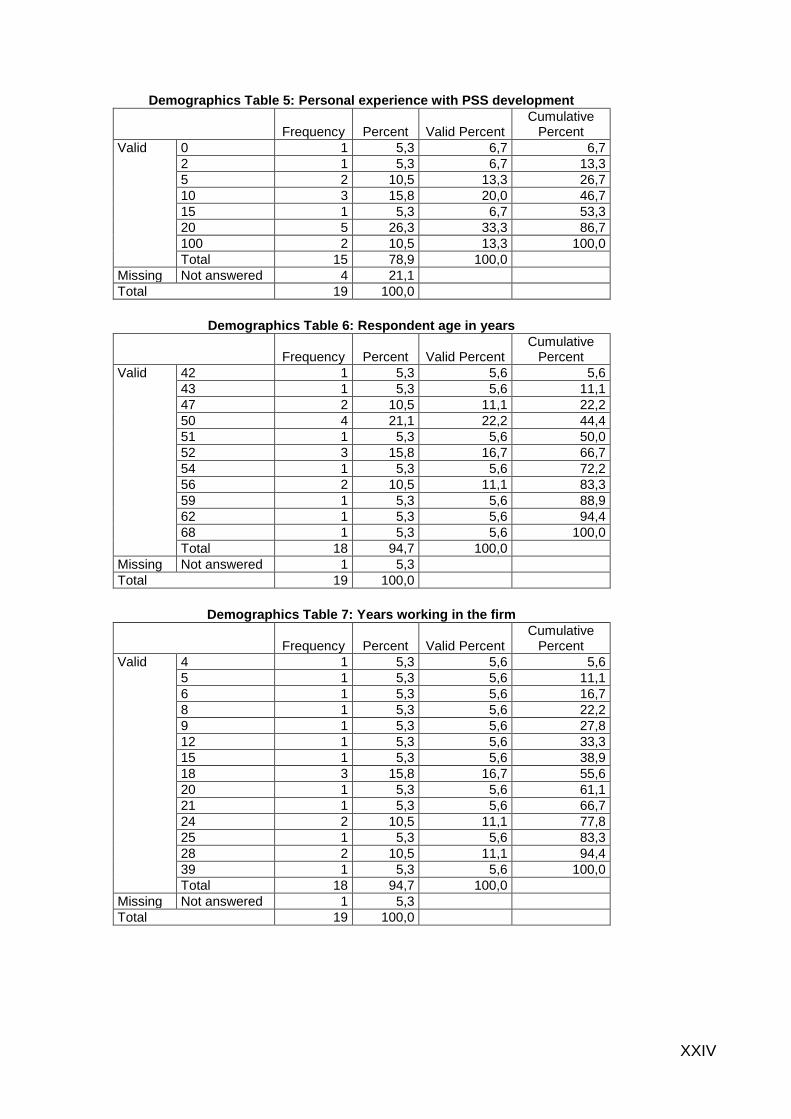
XXIV
Demographics Table 5: Personal experience with PSS development
Frequency Percent Valid Percent Cumulative
Percent
Valid 0 1 5,3 6,7 6,7
2 1 5,3 6,7 13,3
5 2 10,5 13,3 26,7
10 3 15,8 20,0 46,7
15 1 5,3 6,7 53,3
20 5 26,3 33,3 86,7
100 2 10,5 13,3 100,0
Total 15 78,9 100,0
Missing Not answered 4 21,1
Total 19 100,0
Demographics Table 6: Respondent age in years
Frequency Percent Valid Percent Cumulative
Percent
Valid 42 1 5,3 5,6 5,6
43 1 5,3 5,6 11,1
47 2 10,5 11,1 22,2
50 4 21,1 22,2 44,4
51 1 5,3 5,6 50,0
52 3 15,8 16,7 66,7
54 1 5,3 5,6 72,2
56 2 10,5 11,1 83,3
59 1 5,3 5,6 88,9
62 1 5,3 5,6 94,4
68 1 5,3 5,6 100,0
Total 18 94,7 100,0
Missing Not answered 1 5,3
Total 19 100,0
Demographics Table 7: Years working in the firm
Frequency Percent Valid Percent Cumulative
Percent
Valid 4 1 5,3 5,6 5,6
5 1 5,3 5,6 11,1
6 1 5,3 5,6 16,7
8 1 5,3 5,6 22,2
9 1 5,3 5,6 27,8
12 1 5,3 5,6 33,3
15 1 5,3 5,6 38,9
18 3 15,8 16,7 55,6
20 1 5,3 5,6 61,1
21 1 5,3 5,6 66,7
24 2 10,5 11,1 77,8
25 1 5,3 5,6 83,3
28 2 10,5 11,1 94,4
39 1 5,3 5,6 100,0
Total 18 94,7 100,0
Missing Not answered 1 5,3
Total 19 100,0
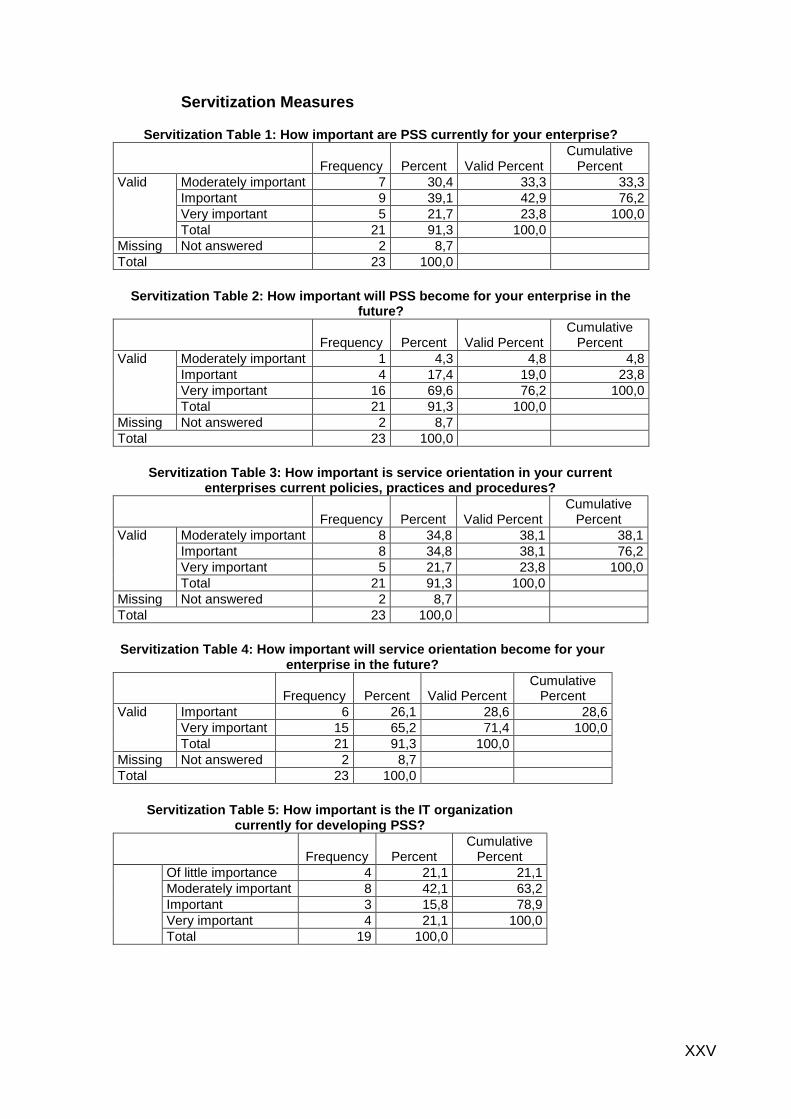
XXV
Servitization Measures
Servitization Table 1: How important are PSS currently for your enterprise?
Frequency Percent Valid Percent Cumulative
Percent
Valid Moderately important 7 30,4 33,3 33,3
Important 9 39,1 42,9 76,2
Very important 5 21,7 23,8 100,0
Total 21 91,3 100,0
Missing Not answered 2 8,7
Total 23 100,0
Servitization Table 2: How important will PSS become for your enterprise in the
future?
Frequency Percent Valid Percent Cumulative
Percent
Valid Moderately important 1 4,3 4,8 4,8
Important 4 17,4 19,0 23,8
Very important 16 69,6 76,2 100,0
Total 21 91,3 100,0
Missing Not answered 2 8,7
Total 23 100,0
Servitization Table 3: How important is service orientation in your current
enterprises current policies, practices and procedures?
Frequency Percent Valid Percent Cumulative
Percent
Valid Moderately important 8 34,8 38,1 38,1
Important 8 34,8 38,1 76,2
Very important 5 21,7 23,8 100,0
Total 21 91,3 100,0
Missing Not answered 2 8,7
Total 23 100,0
Servitization Table 4: How important will service orientation become for your
enterprise in the future?
Frequency Percent Valid Percent Cumulative
Percent
Valid Important 6 26,1 28,6 28,6
Very important 15 65,2 71,4 100,0
Total 21 91,3 100,0
Missing Not answered 2 8,7
Total 23 100,0
Servitization Table 5: How important is the IT organization
currently for developing PSS?
Frequency Percent Cumulative
Percent
Of little importance 4 21,1 21,1
Moderately important 8 42,1 63,2
Important 3 15,8 78,9
Very important 4 21,1 100,0
Total 19 100,0

XXVI
Servitization Table 6: How important is the IT organization
currently for delivering PSS?
Frequency Percent Cumulative
Percent
Moderately important 7 36,8 36,8
Important 5 26,3 63,2
Very important 7 36,8 100,0
Total 19 100,0
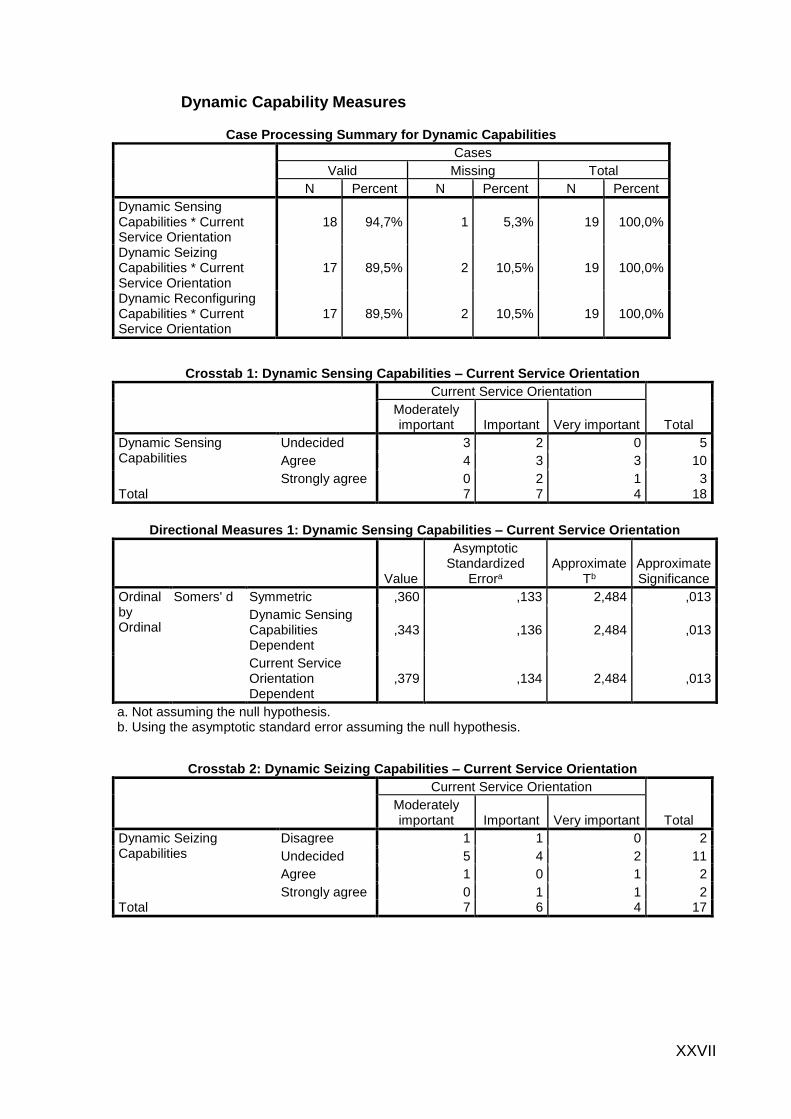
XXVII
Dynamic Capability Measures
Case Processing Summary for Dynamic Capabilities
Cases
Valid Missing Total
N Percent N Percent N Percent
Dynamic Sensing Capabilities * Current Service Orientation
18 94,7% 1 5,3% 19 100,0%
Dynamic Seizing Capabilities * Current Service Orientation
17 89,5% 2 10,5% 19 100,0%
Dynamic Reconfiguring Capabilities * Current Service Orientation
17 89,5% 2 10,5% 19 100,0%
Crosstab 1: Dynamic Sensing Capabilities – Current Service Orientation
Current Service Orientation
Total Moderately important Important Very important
Dynamic Sensing Capabilities
Undecided 3 2 0 5
Agree 4 3 3 10
Strongly agree 0 2 1 3 Total 7 7 4 18
Directional Measures 1: Dynamic Sensing Capabilities – Current Service Orientation
Value
Asymptotic Standardized
Errora Approximate
Tb Approximate Significance
Ordinal by Ordinal
Somers' d Symmetric ,360 ,133 2,484 ,013
Dynamic Sensing Capabilities Dependent
,343 ,136 2,484 ,013
Current Service Orientation Dependent
,379 ,134 2,484 ,013
a. Not assuming the null hypothesis. b. Using the asymptotic standard error assuming the null hypothesis.
Crosstab 2: Dynamic Seizing Capabilities – Current Service Orientation
Current Service Orientation
Total Moderately important Important Very important
Dynamic Seizing Capabilities
Disagree 1 1 0 2
Undecided 5 4 2 11
Agree 1 0 1 2
Strongly agree 0 1 1 2 Total 7 6 4 17
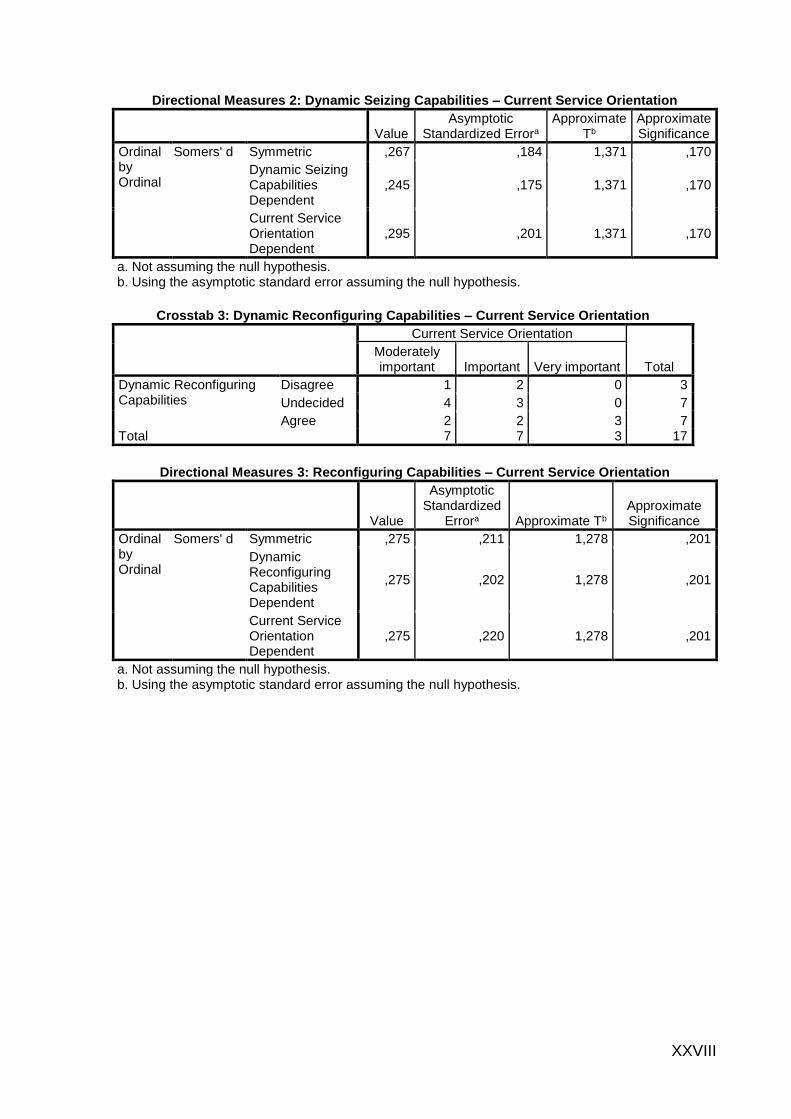
XXVIII
Directional Measures 2: Dynamic Seizing Capabilities – Current Service Orientation
Value Asymptotic
Standardized Errora Approximate
Tb Approximate Significance
Ordinal by Ordinal
Somers' d Symmetric ,267 ,184 1,371 ,170
Dynamic Seizing Capabilities Dependent
,245 ,175 1,371 ,170
Current Service Orientation Dependent
,295 ,201 1,371 ,170
a. Not assuming the null hypothesis. b. Using the asymptotic standard error assuming the null hypothesis.
Crosstab 3: Dynamic Reconfiguring Capabilities – Current Service Orientation
Current Service Orientation
Total Moderately important Important Very important
Dynamic Reconfiguring Capabilities
Disagree 1 2 0 3
Undecided 4 3 0 7
Agree 2 2 3 7 Total 7 7 3 17
Directional Measures 3: Reconfiguring Capabilities – Current Service Orientation
Value
Asymptotic Standardized
Errora Approximate Tb Approximate Significance
Ordinal by Ordinal
Somers' d Symmetric ,275 ,211 1,278 ,201
Dynamic Reconfiguring Capabilities Dependent
,275 ,202 1,278 ,201
Current Service Orientation Dependent
,275 ,220 1,278 ,201
a. Not assuming the null hypothesis. b. Using the asymptotic standard error assuming the null hypothesis.
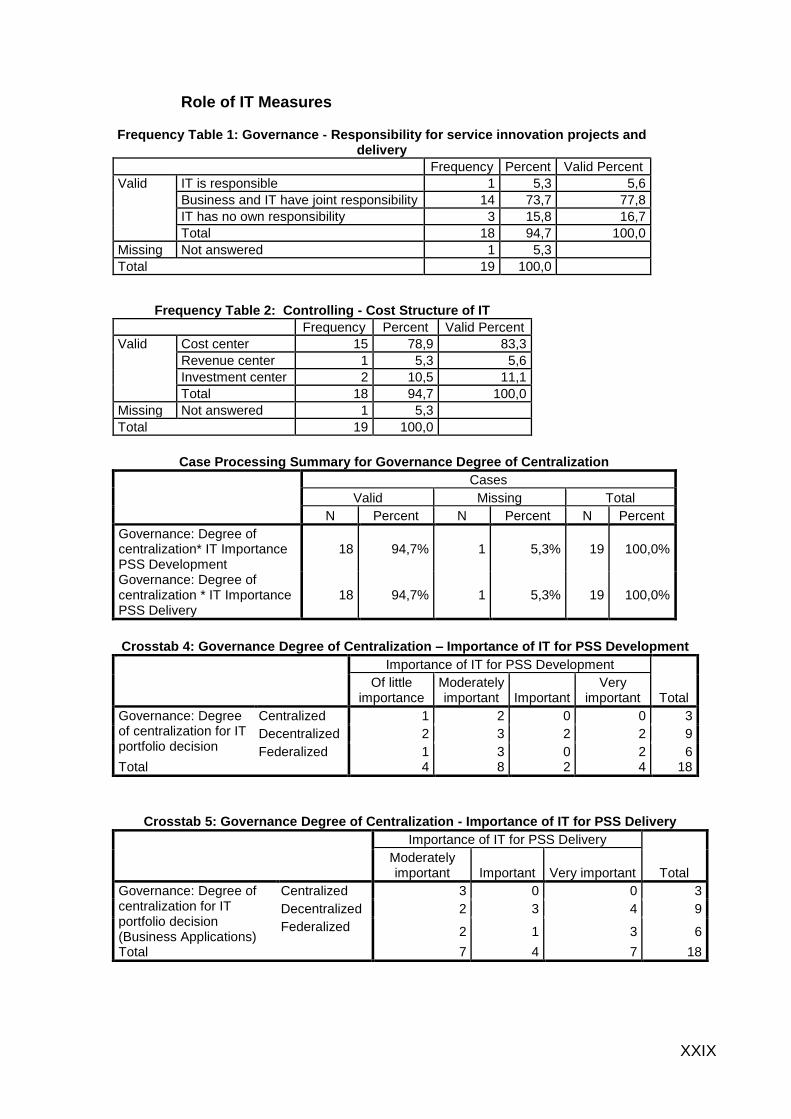
XXIX
Role of IT Measures
Frequency Table 1: Governance - Responsibility for service innovation projects and delivery
Frequency Percent Valid Percent
Valid IT is responsible 1 5,3 5,6
Business and IT have joint responsibility 14 73,7 77,8
IT has no own responsibility 3 15,8 16,7
Total 18 94,7 100,0
Missing Not answered 1 5,3
Total 19 100,0
Frequency Table 2: Controlling - Cost Structure of IT
Frequency Percent Valid Percent
Valid Cost center 15 78,9 83,3
Revenue center 1 5,3 5,6
Investment center 2 10,5 11,1
Total 18 94,7 100,0
Missing Not answered 1 5,3
Total 19 100,0
Case Processing Summary for Governance Degree of Centralization
Cases
Valid Missing Total
N Percent N Percent N Percent
Governance: Degree of centralization* IT Importance PSS Development
18 94,7% 1 5,3% 19 100,0%
Governance: Degree of centralization * IT Importance PSS Delivery
18 94,7% 1 5,3% 19 100,0%
Crosstab 4: Governance Degree of Centralization – Importance of IT for PSS Development
Importance of IT for PSS Development
Total Of little
importance Moderately important Important
Very important
Governance: Degree of centralization for IT portfolio decision
Centralized 1 2 0 0 3
Decentralized 2 3 2 2 9
Federalized 1 3 0 2 6 Total 4 8 2 4 18
Crosstab 5: Governance Degree of Centralization - Importance of IT for PSS Delivery
Importance of IT for PSS Delivery
Total Moderately important Important Very important
Governance: Degree of centralization for IT portfolio decision (Business Applications)
Centralized 3 0 0 3
Decentralized 2 3 4 9
Federalized 2 1 3 6
Total 7 4 7 18
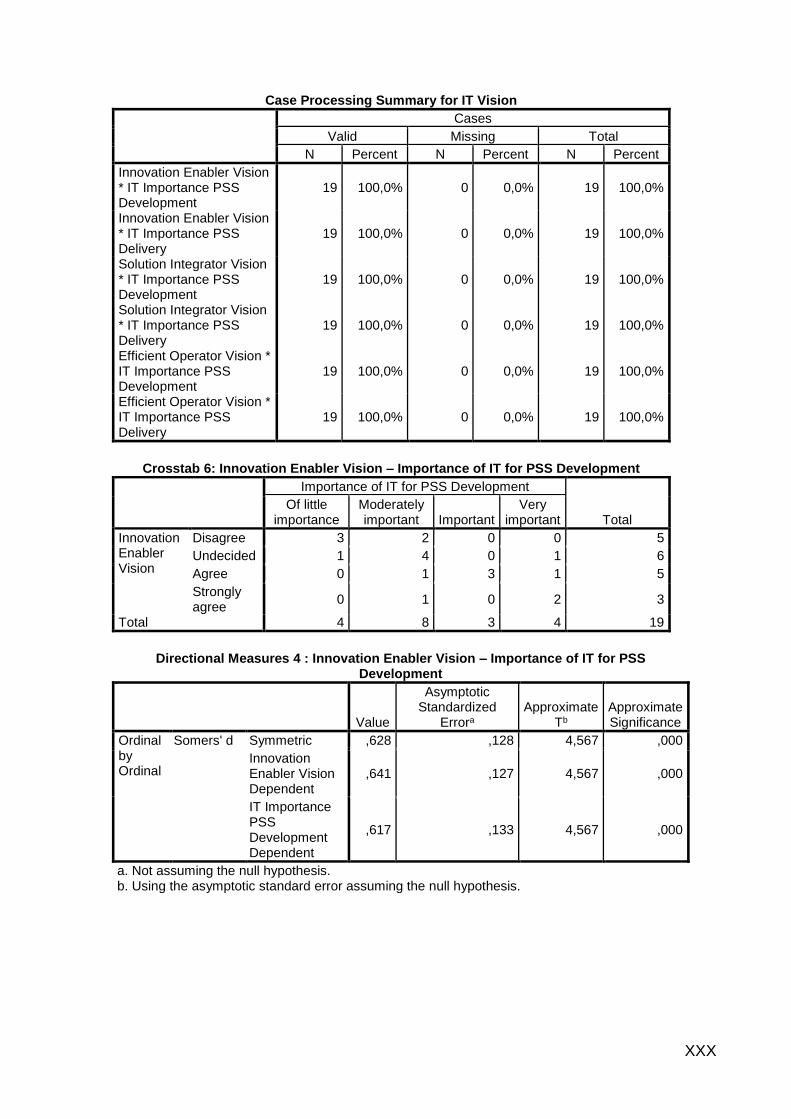
XXX
Case Processing Summary for IT Vision
Cases
Valid Missing Total
N Percent N Percent N Percent
Innovation Enabler Vision * IT Importance PSS Development
19 100,0% 0 0,0% 19 100,0%
Innovation Enabler Vision * IT Importance PSS Delivery
19 100,0% 0 0,0% 19 100,0%
Solution Integrator Vision * IT Importance PSS Development
19 100,0% 0 0,0% 19 100,0%
Solution Integrator Vision * IT Importance PSS Delivery
19 100,0% 0 0,0% 19 100,0%
Efficient Operator Vision * IT Importance PSS Development
19 100,0% 0 0,0% 19 100,0%
Efficient Operator Vision * IT Importance PSS Delivery
19 100,0% 0 0,0% 19 100,0%
Crosstab 6: Innovation Enabler Vision – Importance of IT for PSS Development
Importance of IT for PSS Development
Total Of little
importance Moderately important Important
Very important
Innovation Enabler Vision
Disagree 3 2 0 0 5
Undecided 1 4 0 1 6
Agree 0 1 3 1 5
Strongly agree
0 1 0 2 3
Total 4 8 3 4 19
Directional Measures 4 : Innovation Enabler Vision – Importance of IT for PSS
Development
Value
Asymptotic Standardized
Errora Approximate
Tb Approximate Significance
Ordinal by Ordinal
Somers' d Symmetric ,628 ,128 4,567 ,000
Innovation Enabler Vision Dependent
,641 ,127 4,567 ,000
IT Importance PSS Development Dependent
,617 ,133 4,567 ,000
a. Not assuming the null hypothesis. b. Using the asymptotic standard error assuming the null hypothesis.
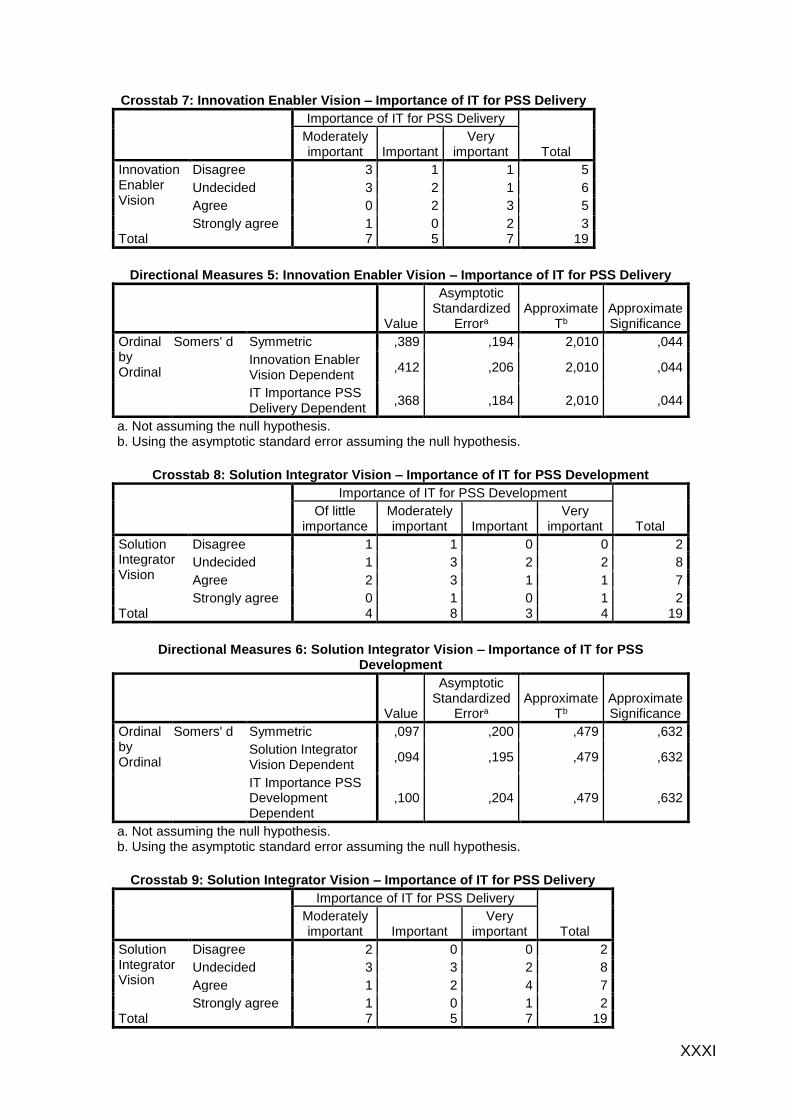
XXXI
Crosstab 7: Innovation Enabler Vision – Importance of IT for PSS Delivery
Importance of IT for PSS Delivery
Total Moderately important Important
Very important
Innovation Enabler Vision
Disagree 3 1 1 5
Undecided 3 2 1 6
Agree 0 2 3 5
Strongly agree 1 0 2 3 Total 7 5 7 19
Directional Measures 5: Innovation Enabler Vision – Importance of IT for PSS Delivery
Value
Asymptotic Standardized
Errora Approximate
Tb Approximate Significance
Ordinal by Ordinal
Somers' d Symmetric ,389 ,194 2,010 ,044
Innovation Enabler Vision Dependent
,412 ,206 2,010 ,044
IT Importance PSS Delivery Dependent
,368 ,184 2,010 ,044
a. Not assuming the null hypothesis. b. Using the asymptotic standard error assuming the null hypothesis.
Crosstab 8: Solution Integrator Vision – Importance of IT for PSS Development
Importance of IT for PSS Development
Total Of little
importance Moderately important Important
Very important
Solution Integrator Vision
Disagree 1 1 0 0 2
Undecided 1 3 2 2 8
Agree 2 3 1 1 7
Strongly agree 0 1 0 1 2 Total 4 8 3 4 19
Directional Measures 6: Solution Integrator Vision – Importance of IT for PSS
Development
Value
Asymptotic Standardized
Errora Approximate
Tb Approximate Significance
Ordinal by Ordinal
Somers' d Symmetric ,097 ,200 ,479 ,632
Solution Integrator Vision Dependent
,094 ,195 ,479 ,632
IT Importance PSS Development Dependent
,100 ,204 ,479 ,632
a. Not assuming the null hypothesis. b. Using the asymptotic standard error assuming the null hypothesis.
Crosstab 9: Solution Integrator Vision – Importance of IT for PSS Delivery
Importance of IT for PSS Delivery
Total Moderately important Important
Very important
Solution Integrator Vision
Disagree 2 0 0 2
Undecided 3 3 2 8
Agree 1 2 4 7
Strongly agree 1 0 1 2 Total 7 5 7 19
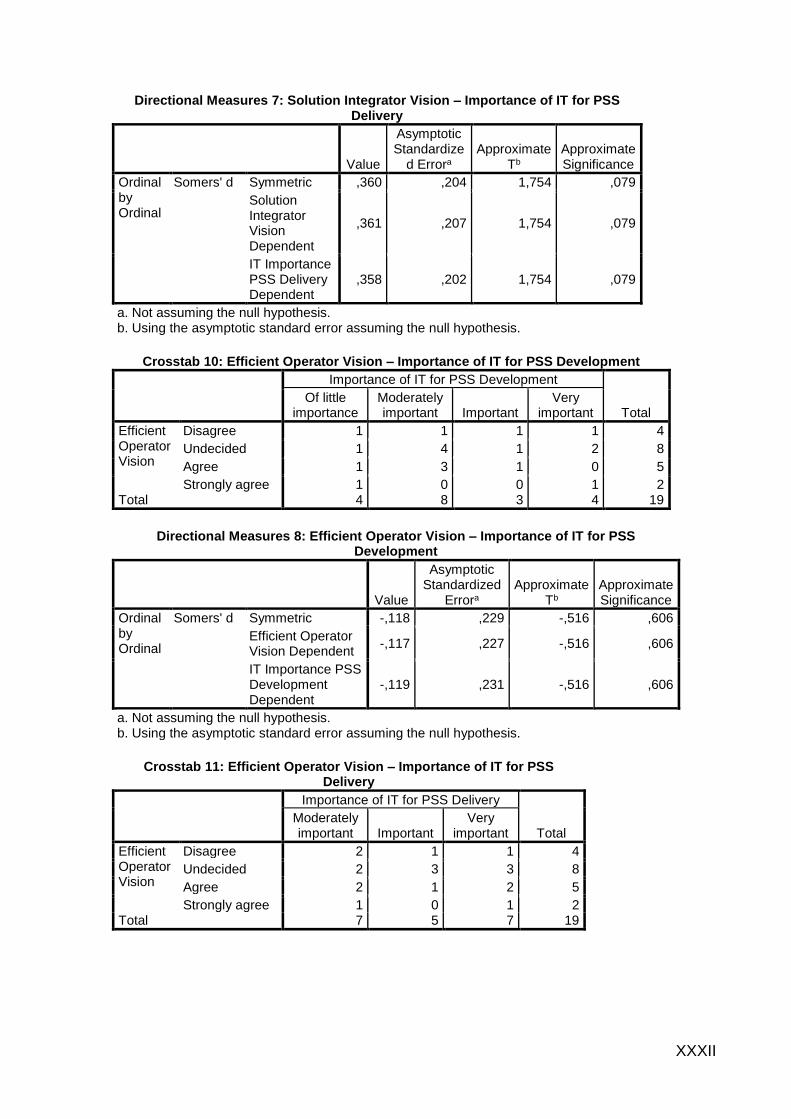
XXXII
Directional Measures 7: Solution Integrator Vision – Importance of IT for PSS Delivery
Value
Asymptotic Standardize
d Errora Approximate
Tb Approximate Significance
Ordinal by Ordinal
Somers' d Symmetric ,360 ,204 1,754 ,079
Solution Integrator Vision Dependent
,361 ,207 1,754 ,079
IT Importance PSS Delivery Dependent
,358 ,202 1,754 ,079
a. Not assuming the null hypothesis. b. Using the asymptotic standard error assuming the null hypothesis.
Crosstab 10: Efficient Operator Vision – Importance of IT for PSS Development
Importance of IT for PSS Development
Total Of little
importance Moderately important Important
Very important
Efficient Operator Vision
Disagree 1 1 1 1 4
Undecided 1 4 1 2 8
Agree 1 3 1 0 5
Strongly agree 1 0 0 1 2 Total 4 8 3 4 19
Directional Measures 8: Efficient Operator Vision – Importance of IT for PSS
Development
Value
Asymptotic Standardized
Errora Approximate
Tb Approximate Significance
Ordinal by Ordinal
Somers' d Symmetric -,118 ,229 -,516 ,606
Efficient Operator Vision Dependent
-,117 ,227 -,516 ,606
IT Importance PSS Development Dependent
-,119 ,231 -,516 ,606
a. Not assuming the null hypothesis. b. Using the asymptotic standard error assuming the null hypothesis.
Crosstab 11: Efficient Operator Vision – Importance of IT for PSS
Delivery
Importance of IT for PSS Delivery
Total Moderately important Important
Very important
Efficient Operator Vision
Disagree 2 1 1 4
Undecided 2 3 3 8
Agree 2 1 2 5
Strongly agree 1 0 1 2 Total 7 5 7 19
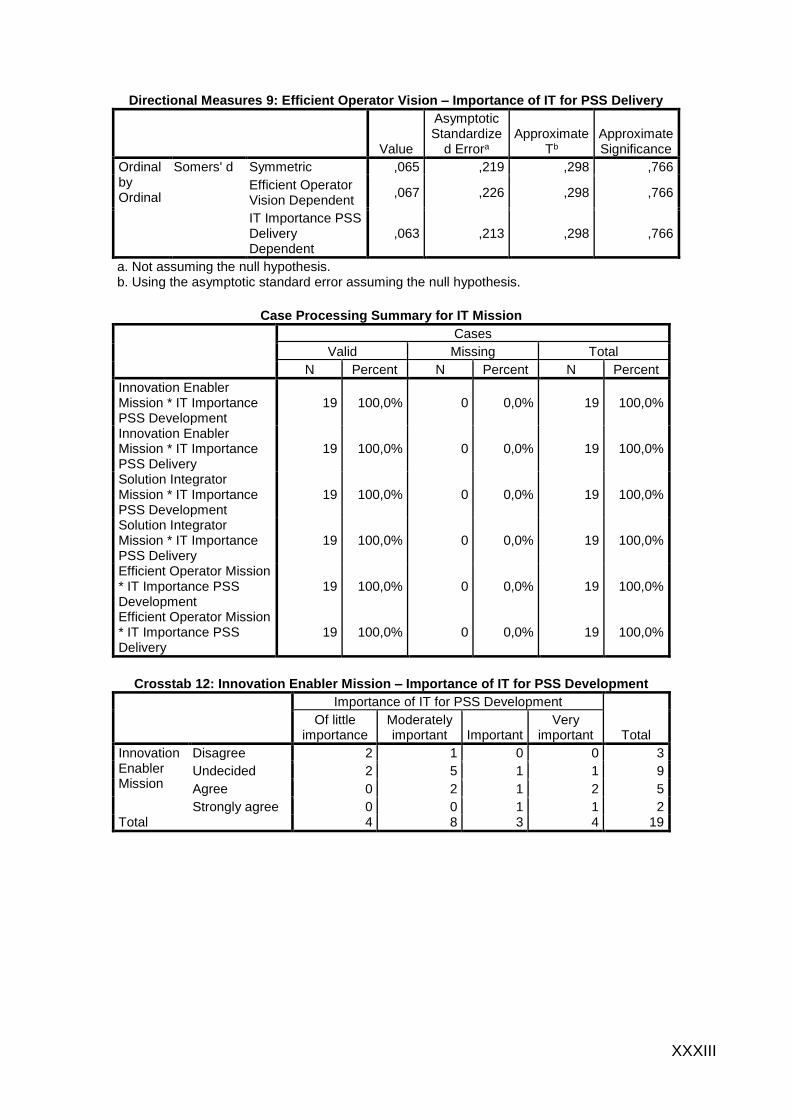
XXXIII
Directional Measures 9: Efficient Operator Vision – Importance of IT for PSS Delivery
Value
Asymptotic Standardize
d Errora Approximate
Tb Approximate Significance
Ordinal by Ordinal
Somers' d Symmetric ,065 ,219 ,298 ,766
Efficient Operator Vision Dependent
,067 ,226 ,298 ,766
IT Importance PSS Delivery Dependent
,063 ,213 ,298 ,766
a. Not assuming the null hypothesis. b. Using the asymptotic standard error assuming the null hypothesis.
Case Processing Summary for IT Mission
Cases
Valid Missing Total
N Percent N Percent N Percent
Innovation Enabler Mission * IT Importance PSS Development
19 100,0% 0 0,0% 19 100,0%
Innovation Enabler Mission * IT Importance PSS Delivery
19 100,0% 0 0,0% 19 100,0%
Solution Integrator Mission * IT Importance PSS Development
19 100,0% 0 0,0% 19 100,0%
Solution Integrator Mission * IT Importance PSS Delivery
19 100,0% 0 0,0% 19 100,0%
Efficient Operator Mission * IT Importance PSS Development
19 100,0% 0 0,0% 19 100,0%
Efficient Operator Mission * IT Importance PSS Delivery
19 100,0% 0 0,0% 19 100,0%
Crosstab 12: Innovation Enabler Mission – Importance of IT for PSS Development
Importance of IT for PSS Development
Total Of little
importance Moderately important Important
Very important
Innovation Enabler Mission
Disagree 2 1 0 0 3
Undecided 2 5 1 1 9
Agree 0 2 1 2 5
Strongly agree 0 0 1 1 2 Total 4 8 3 4 19
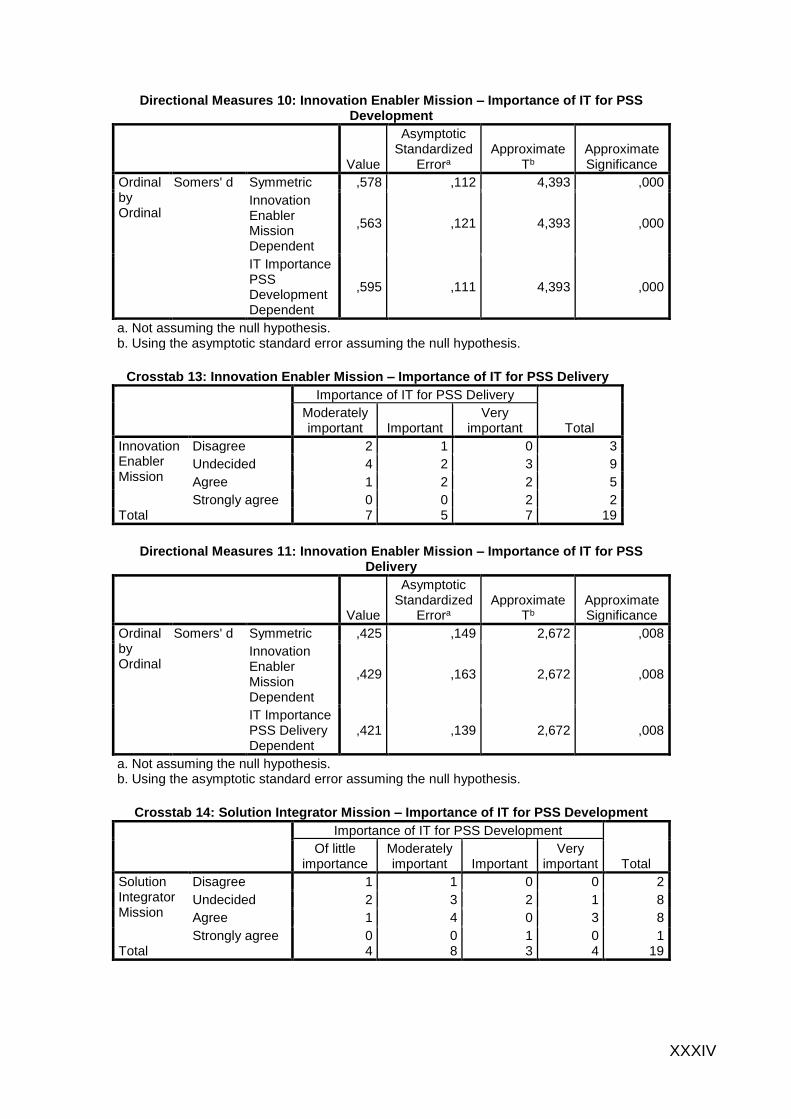
XXXIV
Directional Measures 10: Innovation Enabler Mission – Importance of IT for PSS Development
Value
Asymptotic Standardized
Errora Approximate
Tb Approximate Significance
Ordinal by Ordinal
Somers' d Symmetric ,578 ,112 4,393 ,000
Innovation Enabler Mission Dependent
,563 ,121 4,393 ,000
IT Importance PSS Development Dependent
,595 ,111 4,393 ,000
a. Not assuming the null hypothesis. b. Using the asymptotic standard error assuming the null hypothesis.
Crosstab 13: Innovation Enabler Mission – Importance of IT for PSS Delivery
Importance of IT for PSS Delivery
Total Moderately important Important
Very important
Innovation Enabler Mission
Disagree 2 1 0 3
Undecided 4 2 3 9
Agree 1 2 2 5
Strongly agree 0 0 2 2 Total 7 5 7 19
Directional Measures 11: Innovation Enabler Mission – Importance of IT for PSS
Delivery
Value
Asymptotic Standardized
Errora Approximate
Tb Approximate Significance
Ordinal by Ordinal
Somers' d Symmetric ,425 ,149 2,672 ,008
Innovation Enabler Mission Dependent
,429 ,163 2,672 ,008
IT Importance PSS Delivery Dependent
,421 ,139 2,672 ,008
a. Not assuming the null hypothesis. b. Using the asymptotic standard error assuming the null hypothesis.
Crosstab 14: Solution Integrator Mission – Importance of IT for PSS Development
Importance of IT for PSS Development
Total Of little
importance Moderately important Important
Very important
Solution Integrator Mission
Disagree 1 1 0 0 2
Undecided 2 3 2 1 8
Agree 1 4 0 3 8
Strongly agree 0 0 1 0 1 Total 4 8 3 4 19
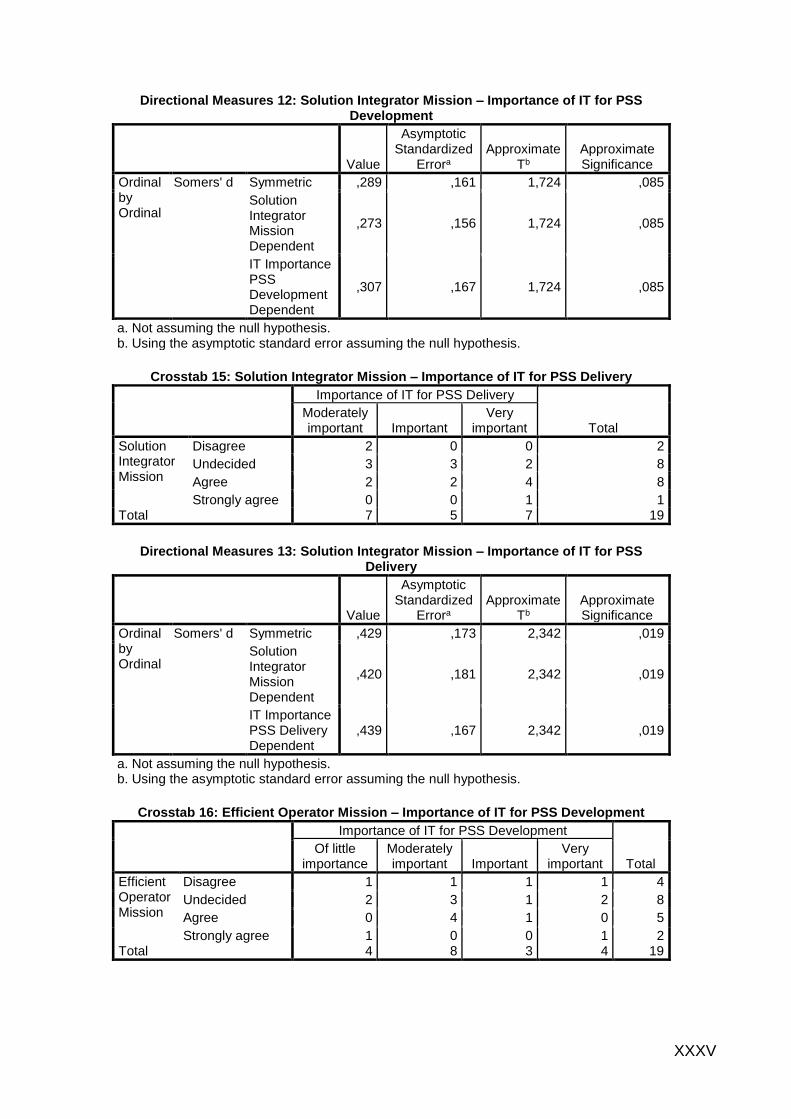
XXXV
Directional Measures 12: Solution Integrator Mission – Importance of IT for PSS Development
Value
Asymptotic Standardized
Errora Approximate
Tb Approximate Significance
Ordinal by Ordinal
Somers' d Symmetric ,289 ,161 1,724 ,085
Solution Integrator Mission Dependent
,273 ,156 1,724 ,085
IT Importance PSS Development Dependent
,307 ,167 1,724 ,085
a. Not assuming the null hypothesis. b. Using the asymptotic standard error assuming the null hypothesis.
Crosstab 15: Solution Integrator Mission – Importance of IT for PSS Delivery
Importance of IT for PSS Delivery
Total Moderately important Important
Very important
Solution Integrator Mission
Disagree 2 0 0 2
Undecided 3 3 2 8
Agree 2 2 4 8
Strongly agree 0 0 1 1 Total 7 5 7 19
Directional Measures 13: Solution Integrator Mission – Importance of IT for PSS
Delivery
Value
Asymptotic Standardized
Errora Approximate
Tb Approximate Significance
Ordinal by Ordinal
Somers' d Symmetric ,429 ,173 2,342 ,019
Solution Integrator Mission Dependent
,420 ,181 2,342 ,019
IT Importance PSS Delivery Dependent
,439 ,167 2,342 ,019
a. Not assuming the null hypothesis. b. Using the asymptotic standard error assuming the null hypothesis.
Crosstab 16: Efficient Operator Mission – Importance of IT for PSS Development
Importance of IT for PSS Development
Total Of little
importance Moderately important Important
Very important
Efficient Operator Mission
Disagree 1 1 1 1 4
Undecided 2 3 1 2 8
Agree 0 4 1 0 5
Strongly agree 1 0 0 1 2 Total 4 8 3 4 19
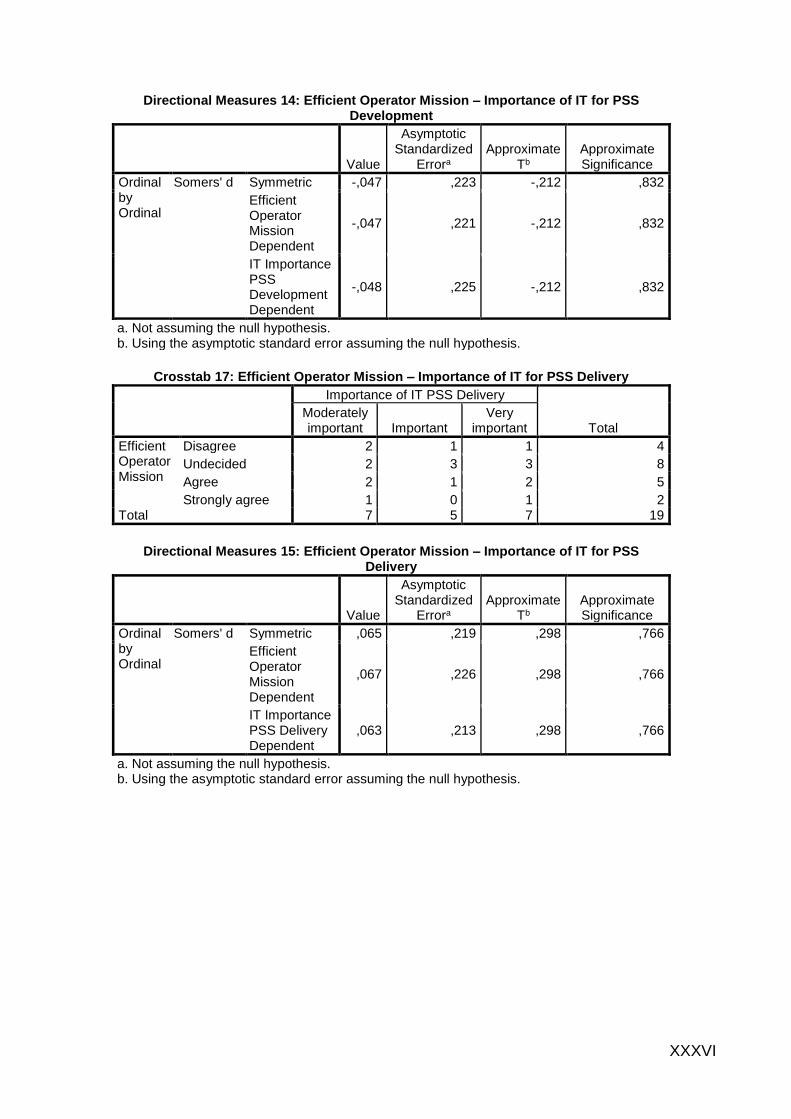
XXXVI
Directional Measures 14: Efficient Operator Mission – Importance of IT for PSS Development
Value
Asymptotic Standardized
Errora Approximate
Tb Approximate Significance
Ordinal by Ordinal
Somers' d Symmetric -,047 ,223 -,212 ,832
Efficient Operator Mission Dependent
-,047 ,221 -,212 ,832
IT Importance PSS Development Dependent
-,048 ,225 -,212 ,832
a. Not assuming the null hypothesis. b. Using the asymptotic standard error assuming the null hypothesis.
Crosstab 17: Efficient Operator Mission – Importance of IT for PSS Delivery
Importance of IT PSS Delivery
Total Moderately important Important
Very important
Efficient Operator Mission
Disagree 2 1 1 4
Undecided 2 3 3 8
Agree 2 1 2 5
Strongly agree 1 0 1 2 Total 7 5 7 19
Directional Measures 15: Efficient Operator Mission – Importance of IT for PSS
Delivery
Value
Asymptotic Standardized
Errora Approximate
Tb Approximate Significance
Ordinal by Ordinal
Somers' d Symmetric ,065 ,219 ,298 ,766
Efficient Operator Mission Dependent
,067 ,226 ,298 ,766
IT Importance PSS Delivery Dependent
,063 ,213 ,298 ,766
a. Not assuming the null hypothesis. b. Using the asymptotic standard error assuming the null hypothesis.


![A worldwide survey on manufacturing servitization · a growing body of literature has described the servitization process from a multitude of points of view [7]. Existing re-search](https://img.pdfslide.us/doc/110x75/5f879333f2af7e12f12d3b8a/a-worldwide-survey-on-manufacturing-a-growing-body-of-literature-has-described-the.jpg)