Embed Size (px)
Citation preview

How can emerging market economies best cope with the current complex global economic environment?XVIII Annual Inflation Targeting Seminar of the Central Bank of BrazilRemarks by Luiz A Pereira da Silva, Deputy General Manager, BISRio de Janeiro, 20 May 2016The views expressed in this presentation are those of the speaker and do not necessarily reflect those of the BIS. These remarks were co-authored by Boris Hofmann, Enisse Kharroubi, Emanuel Kohlscheen, Luiz A. Pereira da Silva and Christian Upper

2
Introduction: EMEs need sober self-assessment Avoid complacency: illusion that current ultra-low policy rates and
investors in search for yield are sufficient to sail through complex, volatile global economy.
Beware of global economy risks: among them, bond yield snapback spreads, capital flows, financial stability in EMEs (but also AEs).
Establishing “confidence” is complex: not just yield differential, current asset prices, good intentions strong macro-financial fundamentals, credibility of policy framework are necessary but not sufficient to revive “animal spirits” and growth; good governance, durable socio-economic stability.
Show capacity to adjust & conduct structural reforms: factor market flexibility vs political economy conditions “fairness” in sharing adjustment costs but also policymaker determination and resolve.

Outline
Among risks for EMEs: bond yield snapback
Comparison with taper tantrum: why inflation outcomes were so different among EMEs, role of fiscal imbalances
Policy implications
3

The risk of bond yield snapback
Global economy with many risks (growth, commodities, China, Brexit, Europe, refugees, terrorism, cybersecurity etc): among those bond yield snapback in AEs (equivalent to taper tantrum) EMEs & USD
Why are bond yields low and stable?
What could trigger a bond yield snapback?
What would be the macro-financial consequences?
What are the lessons from previous episodes (eg taper tantrum)?
4

Why are bond yields low and stable?
5
1 The dashed horizontal lines represent historical averages for the period 1990–2016 for the United States and 1999–2016 for euroarea. 2 Difference between 10-year nominal zero-coupon yield and 10-year estimated term premium. 3 For the euro area, Frenchgovernment bond data are used.
Sources: Bloomberg, BIS calculations.

What could trigger a bond yield snapback?
6

What would be the macro-financial consequences?
7
1 EMEs: Brazil, China, Chinese Taipei, Colombia, the Czech Republic, Hong Kong SAR, Hungary, India, Indonesia, Korea, Malaysia, Mexico, Peru, the Philippines, Poland,Russia, Singapore, Thailand, Turkey and South Africa. Advanced economies: Australia, Canada, Denmark, Germany, Japan, New Zealand, Norway, Sweden, Switzerland andthe United Kingdom. 2 Changes between the listed dates or the closest alternatives depending on data availability. 3 Ten-year government bond yields, in localcurrency. 4 A positive value represents a fall in the index value. 5 Left-hand panel: Bilateral exchange rates against the US dollar; Right-hand panel: Bilateral exchangerates against EUR. A positive value represents a depreciation of the local currencies. Sources: Bloomberg; Datastream, national data; BIS calculations.

What would be the macro-financial consequences?
8
1 For the DSR series and methodology see www.bis.org/statistics/dsr/index.htm. Difference of DSRs from country-specific long-run averages since 1999 or later depending on data availability and when five-year average inflation fell below 10%. The dashed horizontal lines represent thresholds of 4 and 6 percentage points. 2 Assuming that interest rates increase 2.50 percentage points and that all of the othercomponents of the DSR stay fixed. 3 Non-financial corporation headquarters, by residence of issuer. 4 Non-financial corporation headquarters, by nationality of issuer. 5 EMEs countries with oilproduction above 1 million barrels per day. Include Brazil, China, Colombia, Indonesia, Kuwait, Kazakhstan, Malaysia, Mexico, Nigeria, Qatar, Russia, United Arab Emirates and Venezuela.
Sources: IMF, International Financial Statistics; BIS international debt securities statistics; BIS locational banking statistics, BIS; BIS calculations.

What would be the macro-financial consequences?
9
Foreign investors’ share in the local government debt market
In per cent Graph 3
BR = Brazil; CO = Colombia; CZ = Czech Republic; HU = Hungary; ID = Indonesia; IN = India; KR = Korea; MX = Mexico; MY = Malaysia; PE = Peru; PL = Poland; RU = Russia; TH = Thailand; TR = Turkey; ZA = South Africa.
Source: Institute of International Finance.

Comparison with taper tantrum: why inflation outcomes were so different among EMEs? Role of fiscal and risk
Bond yield snapback part of / trigger to other global forces affecting EME inflation (commodity prices and exchange rate).
Two global forces (among others) affecting inflation in EMEs: commodity prices and exchange rate different results, why?
Changing determinants of inflation in EMEs (lower inflation persistence, flatter Phillips curve - output gap, weaker ER pass-through but also significant role of inflation expectations).
MP main determinant of inflation; but other channels also relevant in EMEs recently (market flexibility, contestability, risk premia effect on expectations and then on ER).
10

Two global forces at play for EME inflation
11
1 The IMF’s primary commodity prices; oil = crude oil (petroleum), price index: 2005 = 100, simple average of three spot prices: Dated Brent, West Texas Intermediate and Dubai Fateh; for food, food price index: 2005 = 100, includes price indices of cereal, vegetable oils, meat, seafood, sugar, bananas and oranges; for metals, metals price index: 2005 = 100, includes price indices of copper, aluminium, iron ore, tin, nickel, zinc, lead and uranium. 2 An increase signifies appreciation of the local currency. 3 Aggregate for emerging economies; weighted average based on the GDP and PPP exchange rates of Argentina, Brazil, Chile, China, Colombia, the Czech Republic, Hong Kong SAR, Hungary, India, Indonesia, Israel, Korea, Malaysia, Mexico, Peru, the Philippines, Poland, Russia, Saudi Arabia, Singapore, South Africa, Thailand and Turkey. 4 Bilateral exchange rates; beginning of 2013 = 100.
Sources: IMF, Primary Commodity Prices Database; national data; BIS calculations.

Different outcomes by X-orientation of EMEs
12
AE = United Arab Emirates; CL = Chile; CN = China; CO = Colombia; HK = Hong Kong SAR; ID = Indonesia; IN = India; KR = Korea; MX = Mexico; MY = Malaysia; PE = Peru; PH = Philippines; PL = Poland; RU = Russia; SA = Saudi Arabia; SG = Singapore; TH = Thailand; TR = Turkey; ZA = South Africa.
1 Commodity exporters are countries for which more than 40% of the exports are commodities. 2 For countries following an inflation targeting strategy.
Sources: Datastream; national data; BIS calculations.

Different outcomes by intensity of depreciation
13
AR = Argentina; BR = Brazil; CL = Chile; CN = China; CO = Colombia; HK = Hong Kong SAR; ID = Indonesia; IN = India; KR = Korea; MX = Mexico; MY = Malaysia; PE = Peru; PH = Philippines; PL = Poland; RU = Russia; SA = Saudi Arabia; SG = Singapore; TH = Thailand; TR = Turkey; ZA = South Africa.
Sources: National data; BIS; BIS calculations.

Changing determinants for EME inflation
14
1 Persistence is defined as the autoregressive coefficient in the inflation process, ie from the equation: = + + − ∑ ∆ + + , where it is the log change in CPI incountry i in quarter t;i are country fixed effects andt time fixed effects; ygapit is the domestic output gap; and NEERit is the log change in the nominal effective exchange rate in country i in quarter t.
1 Persistence is defined as the autoregressive coefficient in the inflation process, ie from the equation: = + + − ∑ ∆ + + , where it is the log change in CPI incountry i in quarter t;i are country fixed effects andt time fixed effects; ygapit is the domestic output gap; and NEERit is the log change in the nominal effective exchange rate in country i in quarter t.
Sources: Jašová et al (2015); IMF, International Financial Statistics and World Economic Outlook; CEIC; Datastream; national data; BIS calculations.

Changing determinants for EME inflation
15
1 Pass-through results are derived from the equation: = + + − ∑ ∆ + + , where �it is the log change in CPI in country i in quarter t; �i are country fixed effects and �t time fixed effects; ygapit is the domestic output gap; and �NEERit is the log change in the nominal effective exchange rate in country i in quarter t. The estimates are obtained in a dynamic panel-data setup using the generalised method of moments following Arellano and Bover (1995) and Blundell and Bond (1998) for Argentina, Brazil, Chile, China, Colombia, the Czech Republic, Hong Kong SAR, Hungary, India, Indonesia, Israel, Korea, Malaysia, Mexico, Peru, the Philippines, Poland, Russia, Saudi Arabia, Singapore, South Africa, Thailand and Turkey. 2 Results are derived based on the equation from footnote 1 extended with non-linear exchange rate terms, ie = + + − ∑ ∆ − ∑ ∆ − ∑ ∆ + + . 3 Contemporaneous pass-through is defined as the quarterly coefficient in the inflation process, ie . 4 Yearly pass-through is defined as the sum of yearly coefficients in the inflation process, ie + + + . 5 Long-run pass-through is defined as the sum of yearly coefficients in the inflation process, ie ( + + + )/(1 − ).
Sources: Jašová et al (2015); IMF, International Financial Statistics and World Economic Outlook; CEIC; Datastream; national data; BIS calculations.

EMEs exchange rates movements and market flexibility
16

EMEs exchange rate movements and risk
17

EMEs changes in inflation rate versus risk premia
18
EMEs changes in risk premia versus fiscal balance
19
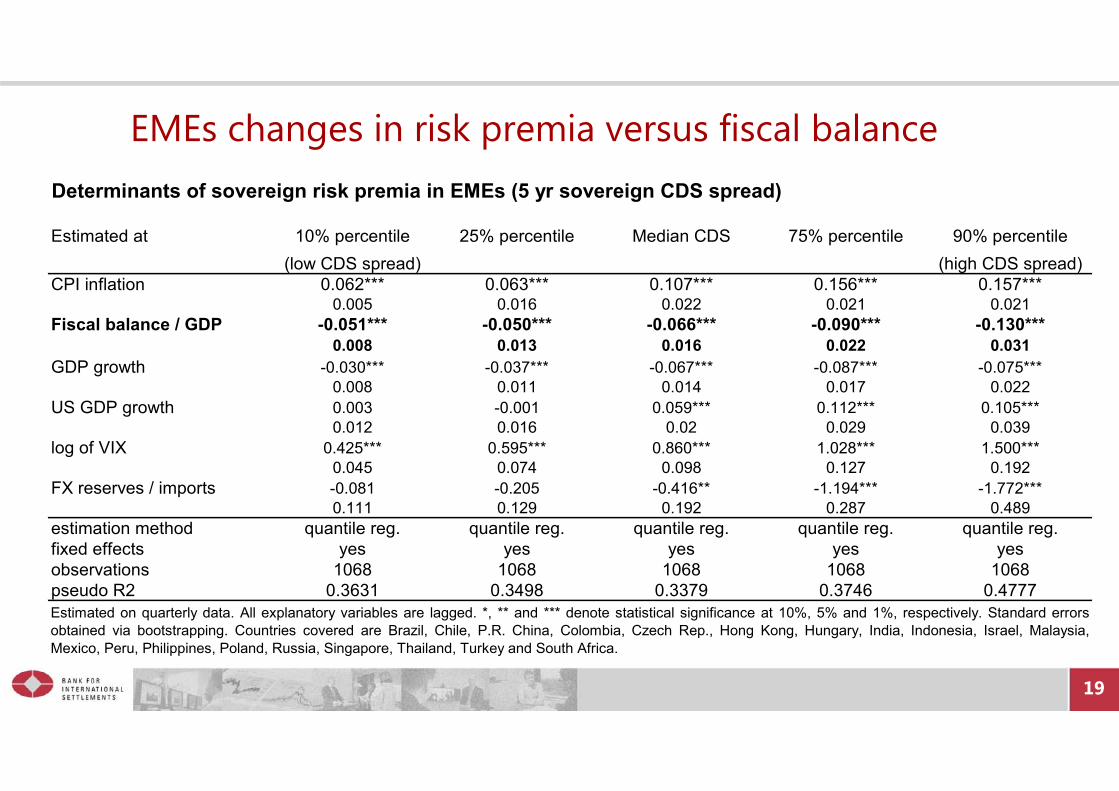
Determinants of sovereign risk premia in EMEs (5 yr sovereign CDS spread)
Estimated at 10% percentile 25% percentile Median CDS 75% percentile 90% percentile(low CDS spread) (high CDS spread)
CPI inflation 0.062*** 0.063*** 0.107*** 0.156*** 0.157***0.005 0.016 0.022 0.021 0.021
Fiscal balance / GDP -0.051*** -0.050*** -0.066*** -0.090*** -0.130***0.008 0.013 0.016 0.022 0.031
GDP growth -0.030*** -0.037*** -0.067*** -0.087*** -0.075***0.008 0.011 0.014 0.017 0.022
US GDP growth 0.003 -0.001 0.059*** 0.112*** 0.105***0.012 0.016 0.02 0.029 0.039
log of VIX 0.425*** 0.595*** 0.860*** 1.028*** 1.500***0.045 0.074 0.098 0.127 0.192
FX reserves / imports -0.081 -0.205 -0.416** -1.194*** -1.772***0.111 0.129 0.192 0.287 0.489
estimation method quantile reg. quantile reg. quantile reg. quantile reg. quantile reg.fixed effects yes yes yes yes yesobservations 1068 1068 1068 1068 1068pseudo R2 0.3631 0.3498 0.3379 0.3746 0.4777Estimated on quarterly data. All explanatory variables are lagged. *, ** and *** denote statistical significance at 10%, 5% and 1%, respectively. Standard errorsobtained via bootstrapping. Countries covered are Brazil, Chile, P.R. China, Colombia, Czech Rep., Hong Kong, Hungary, India, Indonesia, Israel, Malaysia,Mexico, Peru, Philippines, Poland, Russia, Singapore, Thailand, Turkey and South Africa.

Openness, product market flexibility and risk, inflation
20
The pass-through of global forces driving inflation through the exchange rate into EME inflation can be affected by risk premia and compounded by local market rigidities (eg, factor market contestability, specificities in labour markets). These additional factors help to explain the variance of inflation across EMEs.

EMEs inflation, risk premia versus fiscal balance
Openness to trade and competition are important factors to contain inflation (eg, product market flexibility); greater integration and a more competitive market structure market (contestability) could reduce the burden of monetary policy(Auer and Fischer (2010), Auer (2015)).
A reasonable degree of fiscal discipline and a sustainable debt dynamics are key for control of inflation (Blanchard (2004) and Favero and Giavazzi (2004)).
A better fiscal position diminishes risk premia; in EMEs lower risk premia are associated with lower inflation.
21

Conclusions: EMEs strengthen fundamentals
Macroeconomic stability. Floating ERR, sustainable fiscal/public debt stance, independent MP to achieve low and stable inflation (eg, under IFT framework or other) (Obstfeld (2015)).
Financial stability. Prevention of excessive exuberance in credit-financial cycles; regulation & macroprudential (MaP) tools; FX interventions if/when FS threaten, ie. spillovers from global economy (Agénor and Pereira da Silva (2013)).
Capacity to “look through” external shocks (eg snapback etc). Good news but also bad news (expectations) risk premia fiscal/public debt stance negative feedback loop for inflation.
22

EME structural reforms
Strengthen overall institutional framework. Better governance, predictability through explicit rules for investors, established and well communicated policy reactions countered (Acemoglu and Robinson (2012)).
Factor markets. Greater openness, flexibility, competitive and contestable markets; more incentives for innovation and growth not to rent-seeking and protection (Akerlof and Shiller (2009, 2016)).
Public (private) sector balance sheet. Sustainable (perceived, actuarial, simulated) debt dynamics; smooth social welfare inter-temporal inconsistencies through transparent arrangements.
23
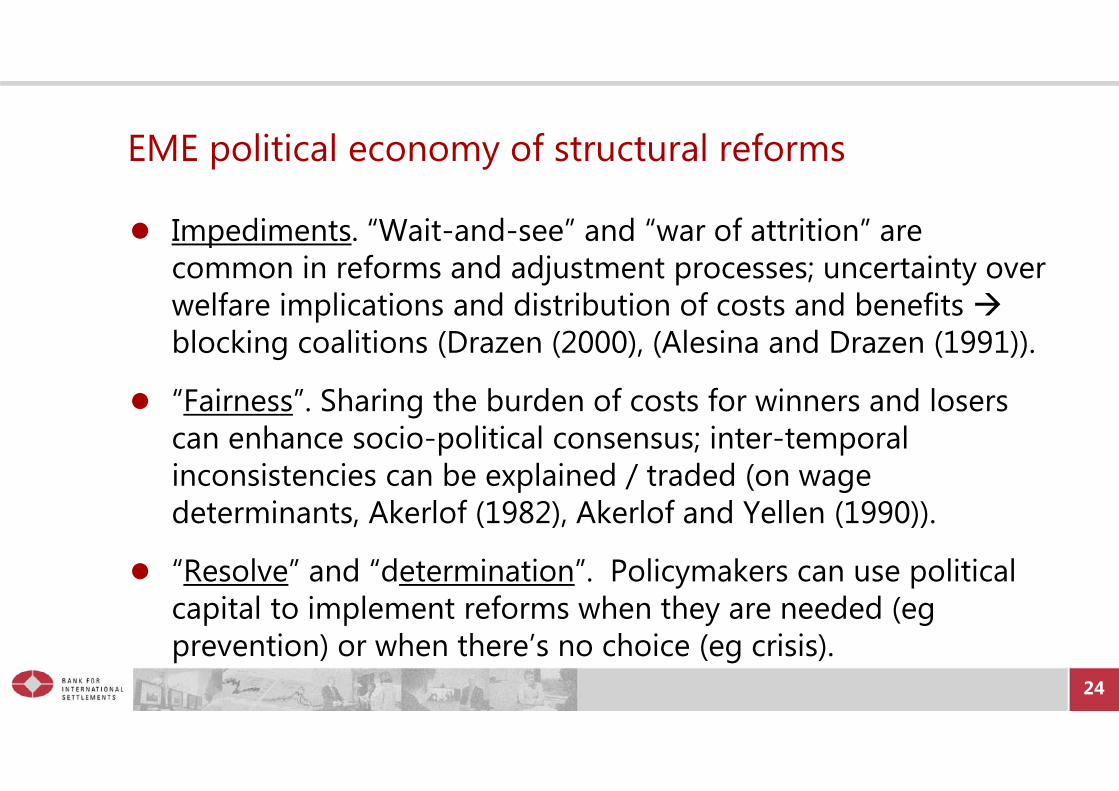
EME political economy of structural reforms
Impediments. “Wait-and-see” and “war of attrition” are common in reforms and adjustment processes; uncertainty over welfare implications and distribution of costs and benefits blocking coalitions (Drazen (2000), (Alesina and Drazen (1991)).
“Fairness”. Sharing the burden of costs for winners and losers can enhance socio-political consensus; inter-temporal inconsistencies can be explained / traded (on wage determinants, Akerlof (1982), Akerlof and Yellen (1990)).
“Resolve” and “determination”. Policymakers can use political capital to implement reforms when they are needed (eg prevention) or when there’s no choice (eg crisis).
24

References
25
Acemoglu, D and J Robinson (2012): Why nations fail: the origins of power, prosperity, and poverty, Crown Publishers, New York.Agénor, P-R, K Alper and L Pereira da Silva (2014): “Sudden floods, macroprudential regulation and financial stability in an open economy”, Journal of International Money and Finance, vol 48, pp 68–100.Agénor, P-R and L Pereira da Silva (2013): Inflation targeting and financial stability: a perspective from the developing world, Inter-American Development Bank and Centro de Estudios Monetarios Latinoamericanos, http://idbdocs.iadb.org/wsdocs/getdocument.aspx?docnum=38367231. Alesina, A and A Drazen (1991): “Why are stabilizations delayed?”, American Economic Review, vol 81, no 5, pp 1170–88.Akerlof, G (1982): “Labor contracts as partial gift exchange”, Quarterly Journal of Economics, vol 97, pp 543–69.Akerlof, G and R Shiller (2009): Animal spirits: how human psychology drives the economy and why it matters for global capitalism, Princeton University Press.——— (2016): Phishing for Phools: The Economics of Manipulation and Deception, Princeton University Press. Akerlof, G and J Yellen (1986): Efficiency wage models of the labor market, Cambridge University Press.——— (1990): “The fair wage-effort hypothesis and unemployment”, Quarterly Journal of Economics, vol 105, no 2, pp 255–83. Auer, R A and A Fischer (2010). "The effect of low-wage import competition on U.S. inflationary pressure," Journal of Monetary Economics, vol. 57(4), pp 491-503.Auer, R (2015): “Exchange rate pass-through, domestic competition, and inflation: evidence from the 2005–08 revaluation of the renminbi”, Journal of Money, Credit and Banking, vol 47, no 8, pp 1617–50.Blanchard (2004)Borio, C and A Filardo (2007): “Globalisation and inflation: New cross-country evidence on the global determinants of domestic inflation”, BIS Working Paper, no 227.Bruno, V and H S Shin (2015): “Capital flows and the risk-taking channel of monetary policy”, Journal of Monetary Economics, vol 71, pp 119–32.Favero, C and F Giavazzi (2004): “Inflation targeting and debt: lessons from Brazil”, NBER Working Paper, no 10390.Gilchrist, S, R Schoenle, J Sim and E Zabkrajsek (2016): Inflation dynamics during the financial crisis, http://people.bu.edu/sgilchri/research/GSSZ_inflation.pdf.Jašová, M, R Moessner and E Takáts (2016): “Exchange rate pass-through: what has changed since the crisis?”, mimeo.Matsen, E, G Natvik and R Torvik (2016): “Petro populism”, Journal of Development Economics.Obstfeld, M (2015): “Trilemmas and trade-offs: living with financial globalisation”, BIS Working Papers, no 480.