Embed Size (px)
Citation preview

AD-A279 333some lUSACERI Technical Report FF-94/17
Human-FadlityInteor interaction
US Ar• Co"of EnginerConbucwon EnglnrertnRleseaw aortrs
How Building Systems AffectWorker Wellness
by ;Douglas C. Heinen ELECTRichard E. Rundus MAY 181Michael R. Kemme IRobert J. NemethGary R. KinzerKaren A. QuinlanBlessing F. AdeoyeBruce L. Rives
The Army has a significant financial investment in its facilities,especially in the construction, modification, and maintenance ofbuildings used as workplaces. Just as the physical environmentof the workplace affects work productivity, there is a fundamentalrelationship between the quality of its facilities and how well theArmy can perform its mission. Despite high building costs andlimited financial resources, the Army must cost-effectively improveits facilities for better productivity.
Many factors combine to determine how well a facility can functionas a workplace. This study examined how the facility perfor-mance attributes of thermal comfort, indoor air quality, lighting 941- 4868performance, and spatial configuration affect the individual worker.This study will help establish a body of knowledge that can exploitthe links between definable physical environments and optimalhuman health, job performance, and satisfaction.
DTiC;
Approved for public release; distribution is unlimited.
A

The contents of this report are not to be used for advertising, publication,or promotional purposes. Citation of trade names does not constitute anofficial endorsement or approval of the use of such commercial products.The findings of this report are not to be construed as an officialDepartment of the Army position, unless so designated by other authorizeddocuments.
DESTROY THIS REPORT WHEN IT IS NO LONGER NEEDED
DO NOT RETURN IT TO THE ORIGINATOR

USER EVALUATION OF REPORT
REFERENCE: USACERL Technical Report FF-94/17, How Building Systems Affect Worker Wellness
Please take a few minutes to answer the questions below, tear out this sheet, and return it to USACERL.As user of this report, your customer comments will provide USACERL with information essential forimproving future reports.
1. Does this report satisfy a need? (Comment on purpose, related project, or other area of interest forwhich report will be used.)
2. How, specifically, is the report being used? (Information source, design data or procedure,management procedure, source of ideas, etc.)
3. Has the information in this report led to any quantitative savings as far as manhours/contract dollarssaved, operating costs avoided, efficiencies achieved, etc.? If so, please elaborate.
4. What is your evaluation of this report in the following areas?
a. Presentation:
b. Completeness:
c. Easy to Understand:
d. Easy to Implement:
e. Adequate Reference Material:
f. Relates to Area of Interest:
g. Did the report meet your expectations?
h. Does the report raise unanswered questions?

i. General Comments. (Indicate what you think should be changed to make this report and futurereports of this type more responsive to your needs, more usable, improve readability, etc.)
5. If you would like to be contacted by the personnel who prepared this report to raise specific questions
or discuss the topic, please fill in the following information.
Name:
Telephone Number:.
Organization Address:
6. Please mail the completed form to:
Department of the ArmyCONSTRUCTION ENGINEERING RESEARCH LABORATORIESATTN: CECER-INITP.O. Box 9005Champaign, IL 61826-9005

REPORT DOCUMENTATION PAGE 1 *IOW IN. 07O4-01
PIN" 0,u~ 1 a 4 baft ulmf s of ftnw. Is oofd ft map I Mwin wu wpome *wnad Un vW Wfiuwg fteuinrn. .w6 9 "& swimm.Ig In@ OW e~ WAW rnt *a nmli.end amyluII OW fw" ow =. n at'~n~n Send un I;i Ingng Ofm haldm esfh~ or win Ow upW d 96tm
cuab" of -n - li- ey smaelftm #W blr o"maln ba iMi. ~i0m lhd.amn I S ndas Oum for, bd.m Operoimown p n Ru 1215- Ju..Wli PNO o. I I 4 m. VA UIS1dUS. an ao ft Oclk @6 d '4 &04 IqnmP lI-dui P~dV O1U0. VftW*VW DO
1. AGENCY UK ONLY (L"m Slt) 2. RT DATE 3. REPORT TYPE AND DATES COVERED
I March 194 Final4. TITLE AND SUBTITLE 5. FUNIONG NUMIERS
How Building Systems Affect Worker Wellness 4A161102AT23SA-X02
6. AUTHORM)Douglas C. Heinen, Richard E. Rundus, Michael R. Kemme, Robert i. Nemeth,Gay RL Kinzer, Karmn A. Quinlan, Blessing F. Adeoye, and Bruce L Rives
7. PERFORMING ORGANM TI NAMES Am ADODEss(E s. PERFORMING ORGANIZATIONU.S. Army Construction Engineering Research Laboratories (USACERL) REPORT NUMER
P.O. Box 9005 TR FF-94/17Champaign, IL 61826-9005
9. teRIr. AGENCY NAME(S) AND ADDRESS(ES) 10. SPONSORKWGAONITORINGAGENCY REPORT NUMBER
11. SUPPLEMENTARY NOTES
Copies are available from the National Technical Information Service, 5285 Port Royal Road, Springfield, VA22161.
l DISTRI •n•lo•AVAwLAILITY STATEMENT T2b. DTmIBUON CODEApproved for public release; distribution is unlimited.
15. A•STRACT Pkmnmm 20 woas)
The Army has a significant financial investment in its facilities, especially in the construction, modification, andmaintenance of buildings used as workplaces. Just as the physical environment of the workplace affects workproductivity, them is a fundamental relationship between the quality of its facilities and how well the Army canperform its mission. Despite high building costs and limited financial resources, the Army must cost-effectivelyimprove its facilities for better productivity.
Many factors combine to determine how well a facility can function as a workplace. This study examined howthe facility performanc attributes of thermal comfort, indoor air quality, lighting performance, and spatialconfiguration affect the individual worker. This study will help establish a body of knowledge that can exploitthe links between definable physical environments and optimal human health, job performance, and satisfaction.
14. SUBJECT TERMS I. NUMBER OF PAGES
cost effectiveness 82health buildings - environmental engineeringwork environment U.S. Army - military construction 16. PE
17. SECURIIlY CLASSIFICATION IS6. SECURITY CLASSIFICATION 119. SECURITY CLASSIFICATION 20. LIMITATION OF ABSTRACTOF REPORT OF THIS PAGE OF ABSTRACTUnclassified Unclassified Unclassified SAR
NSN 7540-01 -20456M SWndd Form 296 (Rev. 2-8S)PfuabW by AM SlW Mil1M12Us

EXECUTIVE SUMMARY
Good facility design and planning must produce facilities that satisfy several fundamental objectivesat once; they must maintain appropriate air quality, thermal comfort, and lighting for building inhabitants,while minimizing energy consumption and maintaining system flexibility.
Designing an effective spatial configuration for an office involves matching the office space to theneeds of the organization that houses the structure, and the individuals who occupy it; an office must besuited to both the work and the workers. Traditional offices were divided between closed offices forsupervisors, and open ('bullpen") offices for workers. Larger modem organizations have incorporated"curicles," or free-standing partitions that allow a desirable amount of privacy to individuals or smallgroups of workers. Partitioned workplaces are seen as flexible alternatives to the traditionally structuredoffices that allow work areas to accommodate economic and ergonomic factors, and "cognitivepersonalities." As in all aspects of building design, designing for spatial configuration must strike abalance between the objective needs of the organization and the more subjective human ingredient. Goodbuilding design is a holistic integration of all these factors, regardless of whether it involves new buildingdesign or a redesign of existing facilities. (Chapter 2)
The use of lighting in the office workplace involves issues of both function and aesthetics.Functional issues involve objective and measurable attributes of physical comfort, quantity, and efficiency.User-aesthetic issues involve less measurable attributes of psychological comfort, and lighting quality andeffectiveness. In fact, occupants' assessments of lighting are based on a mixture of objective andsubjective characteristics. The same objectively measured "glare" produced by a standard office luminaire,for instance, may not be seen as "glare" when it is produced by chandelier or window light. Thosefunctional evaluations of lighting based solely on mathematical approaches to lighting and mechanicaldesign that promote uniformity are based on many weak assumptions and do not produce accurate orconsistent results. Generally, uniform overhead lighting provides poor illumination that wastes energy andimposes an oppressive and mundane atmosphere. A combination of ambient and task lighting of the officeprovide the basic ingredient to a good office environment. (Chapter 3)
Thermal comfort is influenced by a range of environmental and personal parameters. Environmentalparameters that influence thermal comfort are (1) air temperature, (2) mean radiant temperature.(3) humidity, and (4) air motion. Two quantifiable personal parameters used in calculating thermalcomfort are activity level and clothing insulation. Several mathematical algorithms combine theseparameters to predict the comfort range within a given space. However, objective measurement of thermalcomfort is hard to achieve. Like any calculations, these algorithms depend on the accuracy of theirmeasured input, even though thermal characteristics can fluctuate from point to point in a given area.Moreover, thermal comfort is a highly subjective quantity that may better lend itself to survey orquestionnaire measurement on a broad "comfort scale." (Chapter 4)
The effects of indoor air pollution are broad and far-reaching. Economic costs involve: (1) materialsand equipment damage, (2) direct medical costs, and (3) lost worker productivity. Other costs less readilyquantifiable are: (1) welfare loss associated with pain and suffering associated with health effects not fullyalleviated by medical treatment, (2) the value of unpaid time spent, in the home, caring for those whosehealth has been affected, and (3) losses due to the reduced enjoyment of recreational or nonproductiveactivities affected by indoor air pollution. (pp 49-65)
A good facility design will bring several factors to bear to maintain good air quality in the officeworkplace. Tobacco smoke is a common source of indoor air pollution that can be minimized by creating
3
or establishing designated nonsmoking areas. Workplaces unavoidably close to smoking areas andsmoking areas themselves should be designed with adequate extra ventilation, or should be equipped withair-cleaning mechanisms. (pp 49-5 1)
Often building materials themselves are the sources of indoor air pollutants. Materials containingvolatile organic compounds or formaldehyde should be avoided where possible. If such materials cannotbe avoided, several strategies can help guarantee good quality indoor air. The risks of using suchmaterials can often be minimized by aging the materials in a warehouse before using them forconstruction. Once installed, some VOCs can be "baked out" of construction materials before the buildingis occupied. Increased ventilation and use of air cleaners can also improve air quality. Formaldehyde-containing materials may be sealed to prevent or reduce the escape of vapors. (pp 51-54)
Radon is an important external source of indoor air pollution. New facilities may best be locatedto avoid radon-containing soil, or, in some cases, radon-containing soil may be removed beforeconstruction begins. In existing facilities, the danger of radon can be minimized by sealing off possibleradon entryways or by providing good subfloor ventilation. (pp 54-55)
In all climates, the ability to provide adequate thermal comfort levels, and thus to enhanceproductivity, is an important consideration for the designer. Thermal comfort demands require thebuilding to meet users' functional needs, and to respond to stresses of the changing climate. In itsbroadest sense, building design for thermal comfort involves a balance between the building's orientation,its windowing scheme, the use of thermal mass, and the use of mechanical systems to maintain interiortemperature and ventilation.
4

FOREWORD
This study was conducted ftr the U.S. Army Constructio Engineering Research Laboratories(USACERL) under Project 4A161 102AT23, "Basic Research in Military Construction"; Work Unit SA-X02, "Human-Facility Interior Interaction."
This research was an interdivisional effort of the Energy and Utility Systems Division (FE) and theFacility Systems Division (FF) of the Infrastructum Laboratory (FL), and the Environmental Laboratory(EL), USACERL. David Joncich is Chief, CECER-FE, and Alan Moore is Acting Chief, CECER-FF.Dr. Michael J. O'Connor is Chief, CECER-FL, and William Goran is Chief, CECER-EL. The USACERLtechnical editor was William J. Wolfe, Information Management Office.
LTC David J. Rebbein is Commander, USACERL, and Dr. L.R. Shaffer is Director.
Asoesaton lor3l*IS G~A&I
DTIC TAB 1113Ubannowced 3justItloat ion• ..
ByDlstributi,Avallablilty godge
vall and/orD t peolaJL5f
S_ _

CONTENTSPap
SF 298 1EXECUTIVE SUMMARY 3FOREWORD 5LIST OF FIGURES AND TABLES 7
INTRODUCTION ................................................... 9Background 9Objective 9Approach 9Mode of Technology Transfer 10
2 SPATIAL CONFIGURATION ......................................... 11Introduction 11The Changing Office 12Factors in Spatial Configuration 13Concepts in Spatial Configuration 18
3 LIGHTING PERFORMANCE AND QUALITY ............................ 24Initroduction 24User Issues 24Daylight in the Office Environment 28Ambient and Task Lighting Systems 31
4 THERMAL COMFORT .............................................. 35Introduction 35Background 35Design For Thermal Comfort 36Environmental Parameters 38Combined Environmental Parameters 42Personal Parameters 43ASHRAE Criteria 44Evaluation of Thermal Parameters 47Nonuniformity of Thermal Parameters 47
5 INDOOR AIR QUALITY ............................................. 49Introduction 49Indoor Air Pollutants 49Economic Impacts of Indoor Air Pollution 55Diagnosing Indoor Air Quality Problems 58Source Control 62Ventilation Control 69Air Cleaning 70IAQ Modeling 75
REFERENCES 76
DISTRIBUTION
6

FIGURES
Number Pare
I Spatial Layout for a "Visionary's" Office 16
2 Spatial Layout for a "Catalyst's" Office 17
3 Spatial Layout for a "Stabilizer's" Office 17
4 Spatial Layout for a "Cooperator's" Office 18
5 Use of Panel Systems To Stucture Open Plan Offices 19
6 Light and Air Blockage Caused by Panel Placement 20
7 Stone and Luchetti's Office Concept 21
8 Prank Becker's Office Concept 21
9 Herman Miller Headquarters, Grand Rapids, MI 22
10 La Rinascente Headquarters, Milan, Italy 22
I I CIE (International Commission on Illumination) Classification System 32
12 How Thermal Comfort Parameters Operate 39
13 Mean Radiant Temperature and Air Temperature for and Equivalent ThermalSensation of 70 OF 41
14 Approximate Heat Generated and Lost by a Person at Rest 41
15 Extension of Summer Comfort Zone 42
16 Typical clo Values for Various Activity Levels 44
17 Typical clo Values for Various Clothing 44
18 Thermal Comfort Boundaries Determined by Humidity and Temperature 45
19 Tune-Activity Patterns by Micnoenvironment 50
20 Radon Decay Chain 55
21 Temperature Profiles for Three Buildings During Bake-Out 67
22 Changes in VOC Levels Before and After Bake-Out 68
23 Two-Stage EectnMic Air Cleaner Operation 73
7
TABLES Page
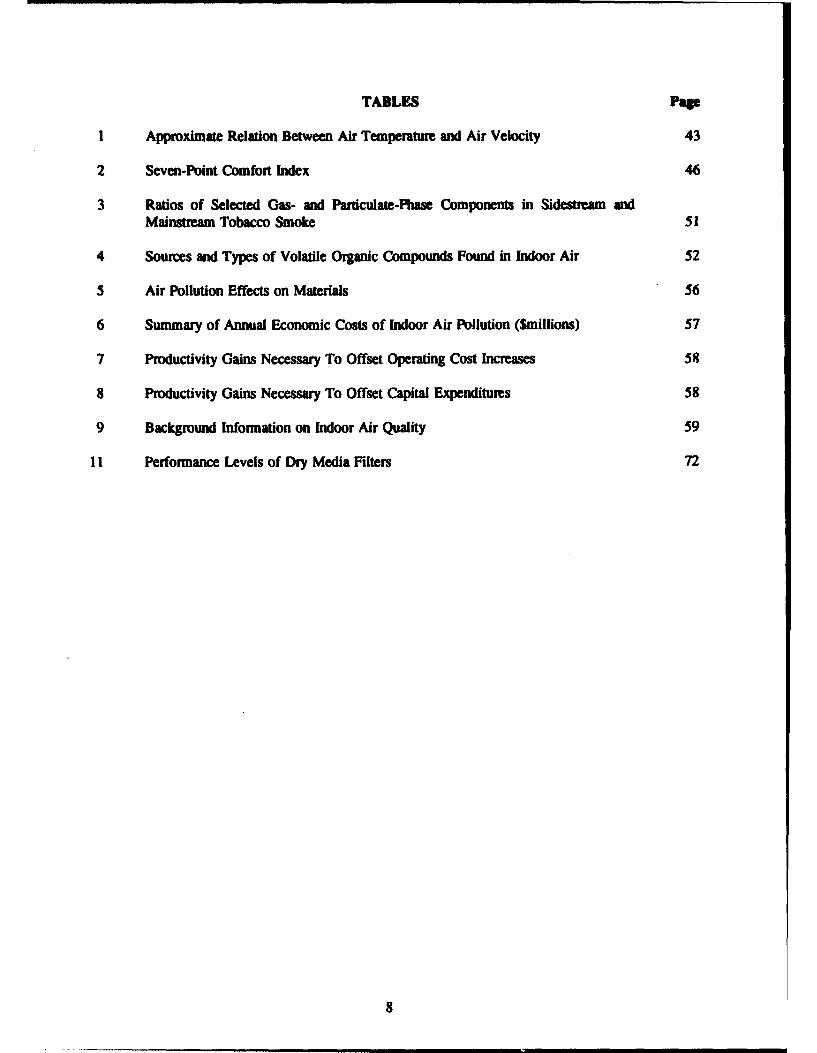
I Approximate Relation Between Air Temperature and Air Velocity 43
2 Seven-Point Comfort Index 46
3 Ratios of Selected Gas- and Particulate-Phase Components in Sidestream andMainstream Tobacco Smoke 51
4 Sources and Types of Volatile Organic Compounds Found in Indoor Air 52
5 Air Pollution Effects on Materials 56
6 Summary of Annual Economic Costs of Indoor Air Pollution ($millions) 57
7 Productivity Gains Necessary To Offset Operating Cost Increases 58
8 Productivity Gains Necessary To Offset Capital Expenditures 58
9 Background Information on Indoor Air Quality 59
11 Performance Levels of Dry Media Filters 72
8

HOW BUILDING SYSTEMS AFFECTWORKER WlLLNESS
1 INTRODUCTION
Background
The Army has a significant financial investment in its facilities, especially in the construction,modification, and maintenance of buildings used as workplaces. Many factors work together to determinehow well a building can function as a workplace. It must be flexible enough to respond to organizationalchanges, must be able to meet changing technological requirements, and most importantly, must createan interior environment that serves the needs of its inhabitants.
Several trends have combined to emphasize the importance of the fundamental relationship betweenthe Army's ability to fulfill its mission, and its facilities. Costs of owning and operating buildingscontinue to increase; financial resources have diminished; and user productivity has remained unchangedor declined. This study investigated the physical and psychological relationship between the individualand the facility, emphasizing how an individual worker's "wellness" can be affected by the physicalattributes of the environment. In this context, wellness is defined as the health, performance, andsatisfaction of the individual worker. Some physical attributes of a facility that affect wellness are thermalcomfort, indoor air quality, lighting, and spatial configuration. A comparison of how a worker's wellnessresponds to a differing facility physical attributes can provide the basis for a system to measure, evaluate,and recommend changes to improve facility quality.
Objective
The overall objective of this study is to outline how to design and implement facility supportsystems to optimize worker wellness. Information gained from this preliminary study wiln contribute tofurther research to develop a comprehensive methodology for relating interior building performance attri-butes to human wellness.
Approach
A tearn of experts in the area of building performance attributes was formed. The group metregularly to discuss and to develop strategies to relate interior building performance attributes tooccupants' wellness. A literature search was performed to examine the characteristics of each interiorattribute in detail, and to identify areas that a designer should consider in developing or evaluatingphysical space. Researchers identified and investigated four areas that should be considered to effectivelyevaluate physical spaces. To facilitate this research, it was imperative to narrow the discussion to issuesrelated to an office or administrative type of function. It is presumed, however, that the proposed generalprinciples and methods can be used in a broad variety of work environments.
9

Mode of Technology Transfer
The results of this research will be forwarded to Corps of Engineers offices and installation Directo-rate of Public Works (DPW) personnel for use as a reference guide to designers and facility managers.This research will also be incorporated into the Corps of Engineers PROSPECT courses "Interior DesignI and IU." This work will also contribute to further research in issues concerning quality of life, facilitydelivery process, interior design, and facility management, which will be used to produce advancedproducts, systems, and methodologies to further support the designers or facility managers' function.
10

2 SPATIAL CONFIGURATION
Introduction
One of the most difficult problems associated with office workers productivity, is being able toidentify and quantify what it is they are expected to do. In effect, white collar employees are paid fortheir ability to apply their knowledge to work. In most cases they are not asked to produce "10 widgetsper hour," but rather to solve a given problem using their knowledge and other resources. Office workersare in control of their own "rate of productivity." The question is, does the function and needs of theworker drive the space (office) or does the space (office) define worker needs based on other issues? Forexample, what is the effect on the worker if the organization reduces individual office space due to thehigh cost of rent? What impact do organizational standards have on workers? If standards do exist, whydo they exist, how are they used, and how are they implemented?
Steelcase Inc. (Lathrop, 1991) has adopted the philosophy that if the physical space drives the users,the net result is a negative impact to the workers effectiveness. If, however, the organizational needs, allthe way down to the individual performing a given task, shape their space needs, the net resullt is apositive impact on the workers effectiveness. They go on further to imply that this thinking uses"Effectiveness" versus "Efficiency" as its driver and often means providing more space for their workers.Again the net result is a gain for the organization and the workers because even a small increase in overallproductivity of the workers far outweighs extra expense on furniture, construction, or rent.
The following is a simplified illustration of how much productivity costs.
In a 100,000 sq ft administrative building (1 sq ft = 0.093 m2), assume an occupancy of 400 persons.
* Assume an average salary of $20,000 per person. Annual payroll = $8 million.* At full capacity, $8 million worth of productivity results.• If something has an impact on employee productivity, say 1 percent, the cost or gain in
productivity is $80,000. ($8 million x I percent = $80,000).
Organizations must identify what it is they are to impact-basically, answer the question why theyare in business. For example, a company that produces widgets wants to be able to produce a qualitywidget in the most time efficient method. In an office, the product is generally a misnomer, what theorganization must do is support the workers to allow them to be most effective. Once the organizationidentifies their "product," then they can better evaluate their ability to influence that "product." The goalof this research is to recognize costs associated with providing the "product" involved (the workplace),look at it over time by some life cycle analysis/neasure, and determine the impacting variables.
History of the Office
Offices in the past were quite different than those we are familiar with today. Different needs,office procedures and technology meant a simpler office with little or no privacy-a bullpen office. Thistype of office consists of a large space with desks arranged closely together without vertical separationbetween them. Bullpen offices often facilitated work flow between workers and encouraged informalcommunication between employees. The bullpen office was typically combined with enclosed offices forsupervisors. The enclosed offices were an expression of rank, reward, and leadership.
The bullpen office is still used today but has become less popular as people tend to view someamount of enclosure as important. Also, new technologies have affected the office, requiring one to use
II

the vertical space around workstations as well as to reduce the footprint of each workstation. This needhelped the development of systems furniture that uses panels to support the workstation components.
Technology tools like the telephone, typewriter, computer, and photocopier have had a majorinfluence on the interior office environment as well. External communication (correspondence) led to thegeneration of paper, which was stored in pigeon-holes on desks, flat, in boxes or in drawers. The intro-duction of vertical filing helped revolutionize the office by making filing easier and in fact led to genera-tion of even more paper. More internal correspondence, standardized formats and varying theories ofindexing or methods of filing pushed for the development of increased ease in storage of paper. Thisincrease and change in paper generating activities impacted the office in several ways. One way, personalfiling at each desk became, and still remains, critical to the effective performance of one's job.
The need for some enclosure and requirements to use the vertical space introduced landscapedpartitioning by the Herman Miller Company. This initiated some form of privacy to the user as well asdifferent worksurfaces, storage units, and miscellaneous accessories like task fights, paper handlingdevices, etc. Landscaped partitioning was the start of "cubicle, semi-private workstations," much of whichstill exists today. These first cubicles incorporated free-standing furniture (conventional desks, bookcases,file cabinets, etc.) with free-standing partitions. Enclosed offices still existed for supervisors or con-ference areas in most conditions.
The first generation of systems furniture developed and contributed to the workplace environmentby removing storage units from the floor and having the panel support them, forming a system. Simply,the first generation of systems fumiture have panels of varying heights that offer an enclosure that isstrong enough to support storage units thereby saving space (workstation square footage). The secondgeneration of systems furniture incorporates these same features but introduces cable managementcapability. It also incorporates ergonomically sensitive design features such as workstation height/angleand keyboard adjustability. Finally, a third generation of systems furniture employs horizontal and verticalpanel modularity and allows users to stack the panel enclosures. This system also integrates the capabilityof environmental responsiveness through their functional modularity. The systems resemble buildingblocks where each panel block can be dictated by function: fans for circulating air and exhausting heat,filters for cleaning air, acoustical panels for sound privacy, glazed panels for visual access with acousticalprivacy, etc.
The use of systems furniture has helped to reduce the square footage requirements of eachworkstation (use of vertical space), generally giving the users some level of privacy (visual and acoustical),and functionally and aesthetically improving the interior work environment. Research, industry analysis,and surveys have begun to show a change in using exclusively systems furniture. Workers are requestingmore open, "team areas" versus smaller, more private workstations. As stated earlier in this section,Steelcase strives to provide Effective vs Efficient workstations in reference to the square footage of spaces.Consequently, while systems furniture saves valuable real estate, the cost of not providing an Effectiveworkstation as it impacts a user's productivity must still be considered.
The Changing Office
Change in office configuration came about for a variety of reasons, including: the size and make-upof the workforce (demographics), the attitudes, satisfaction, and knowledge level of the workers, and anincrease in office automation and technology.
12

The Work/orce
The number of white-collar workers in the workforce has increased from less than 29 million in1960 to over 67 million in 1990, requiring organizations to look for an economical means to provideoffice space for the larger workforce. The aging workforce, handicapped accessibility requirements, andthe increase in women in the workforce are a large proportion of the workforce, requiring moreconsiderations in all aspects of the office space.
Worker Attitude and Satisfaction
Office workers are increasingly dissatisfied with their work. According to a 1991 Steelcase report,only 43 percent of office workers are "very satisfied" with their work. Most of the job satisfaction hasbeen reported by clerical, secretarial, and union workers. The reasons for the dissatisfaction vary byperson, place, and organization. Office workers are more knowledgeable today, have more formaleducation, and are much more aware of office-related issues. As a result, office workers demand morefrom their work and their work environment. Research studies have shown that job satisfaction dependson worker satisfaction with both the individual workspaces and the whole office environment. Thisillustrates the integration required of building attributes and human characteristics to produce a truly goodquality, synergistic design.
Health and safety in the workplace are concerns of office workers. Problems like eyestrain,backaches, carpal tunnel syndrome, and hazards like radiation from computer terminals, poor air qualityand exposure to hazardous materials have become major issues to office workers. Stress, which isvirtually impossible to quantify, impacts office workers also.
Office Automation and Technology
Technology requires a supporting infrastruct.re of power, cabling, i.,,Ating, and thermal control.In most cases, the current infrastructure cannot meet all of the requirements for the various technologytools. Office technology is noted as a major cause of problems in today's office. Computers arebecoming more widely used and while technology is changing quickly, the office environment is slow tochange to meet the new needs. In the 1991 Steelcase report, 85 percent of office workers reported usinga computer, 33 percent more than 5 hours per day.
Computers require space and different types of furniture to avoid health problems in workers.Predictions of the "paperless office" never came to fruition and most offices generate more paper thanbefore. Along with the visual and postural health problems are the psychological effects of officetechnology. Automation in the office can lead to rigid work procedures, repetitive and routine jobs, andless mobility, all of which may lead to potential health disorders. In addition, electronic mail has led toa feeling of isolation in many office workers and a distinct lessening in informal communication, whichis important to worker satisfaction.
Factors in Spatial Configuration
The most common office spatial configurations used today (open, enclosed, and bullpen offices) arefaced with all the problems stated above. An improved quality of worklife and a humanized workenvironment are psychological incentives that can increase productivity. Worker specific incentives canbe categorized as either psychosocial or psychophysical. These factors, along with three more(organizational factors, economic factors, and ergonomic factors) must be addressed to produce the mosteffective and productive workplace.
13

Psychosocial Factors
Psychosocial factors are those that affect the worker's psychological state through the socialenvironment or interaction with others, encompassing such aspects as job design, motivation, training,supervision, expectations, group work flow, status, and social interaction.
Psychophysical Factors
Psychophysical factors are those that affect the worker psychologically through the physicalenvironment. Often, the way management views the importance of the workforce is evident in thedecisions made regarding the physical interior environment. These factors include: privacy, communi-cation with other employees, and the public, personalization and display, aesthetics, and traffic flow, bothhorizontally (doors and hallways) and vertically (stairways and elevators).
Organizational Factors
Organizational factors are those that influence workstation design and workers thror ' tandardsof the organization. These factors usually include company structure, long range goals, )rporateculture. Many organizations have been moving from a departmental-based structure tow•aL project-or group-based structure. In a departmental structure, employees are placed in close proximity to thosethat perform similar functions even though they are often working on separate projects.
In a project structure, employees who perform different functions are working together on a projectand are in adjacent office spaces. Unlike a departmental structure, as one project is finished and new onesbegun, project teams will shift according to the needs of the new work; this requires a physical moverientto allow new teams to be in the same area. This creates a need for flexible work environments.
Growth is an organizational factor which involves flexibility. When first deciding on the spatialconfiguration of an office, it is important for the organization to somehow predict the future growth andneeds of the office and to prepare for it accordingly. If an organization expects to grow in the near future,the office design chosen must allow for office space for the increasing employee population and avoidmajor office changes in the future that may lead to high costs. Use of modular design and workstationcomponents in space-saving layouts is a cost-saving way to plan office changes.
The organizational culture will control such things as the size of a person's office based on rank,the amount of privacy afforded in that space, the office's location, whether or not there is a window, andeven the quality of the furnishings. Again, like psychophysical factors, the interior physical environmentcan tell the observer how important management feels their workforce is to the organization based on itsattention given to the work environment.
Economic Factors
Economic factors will directly affect an organization's organizational policy. These factors includesuch things as increasing office rents, and the need to maximize the use of office space and minimizecosts-get the greatest number of people in the least amount of space without negatively affectingproductivity. Economic factors also cover the increasing need for flexibility. In most organizations, the"chum rate." or the percentage of occupants relocated within the same facilities during a year, has beensteadily increasing; flexibility has become a major consideration. As the annual chum rate nears 50percent there is a need to compare the costs of relocating offices with the costs of reconfiguring the space(Lindo 1991).
14

Worker absenteeism is a large economic cost to organizations. Absenteeism occurs when workersbecome ill or injured in the workplace due to postural problems, illness due to indoor air contaminants,eyestrain and headaches because of improper lighting, and injuries because of an inadequate officeconfiguration. For example, exposed cables cause people to trip; and back strain may result whenemployees try to reach needed items placed out of reach because there is no room to store things properly.It has been reported that a 1984 estimate by the American Academy of Orthopedic Surgeons cited lostearnings and medical-related expenses of more than $27 billion annually, and that some businesses spend$9000 per day treating such disorders in their employees. Absenteeism will also occur when workers areunhappy in their work due to a variety of psychosocial and psychophysical factors; people will just stayhome.
Ergonomic Factors
The term "Ergonomics" is derived from the Greek term "ergo," meaning work, and "'nomos."meaning natural laws, and refers to the study of the relationship between the worker and the workenvironment. The increased use of computers in the office has made ergonomics a major issue in pro-moting health and safety, and in increasing productivity in the office. The important aspects of ergo-nomics include chair adjustability, work surface height. electronic equipment and office layout especiallyin terms of accessibility.
Office chairs should be adjustable for height and angle of the backrest, should have lumbar support,and (depending on the individual task) ann rests, and should swivel, preferably on a five-point base forstability.
Worksurfaces should be vertically adjustable to accommodate a wide range of user sizes. Theyshould also allow sufficient room for the user's knees, and worksurface legs should not interfere with themovements of the user. Worksurfaces should have rounded edges and comers to prevent injuries.Computer users should have keyboard trays with adequate wrist support to allow for the proper posturewhile typing to prevent back fatigue.
The office layout or spatial configuration should provide accessibility to all equipment and flexibilityto perform various tasks. It should also provide sufficient space to allow for maximum productivity,proper job execution, and safety in the workplace.
Cognitive Personalities
One study suggested that an office environment should contribute to a person's ease of communicat-ing, choosing, or evaluating information (Williams, Armstrong, and Malcolm 1985). An office can furtherthe work of an individual and an organization only if its members understand the structure of thatorganization, and if that structure is reflected in the office design. Note that the office is the tool for thewhite collar worker, office design must reflect the psychological aspects and work style of the individualand the task to be done.
Individual work styles are developed from intellectual processes known as cognitive styles. Swisspsychologist Carl Jung has postulated that there are four innate personal characteristics that can offerobservable differences in the way individuals perceive the workplace:
1. Sensing: Becoming aware of things directly through the five senses and concentrating on theactual facts and details to be verified by seeing, hearing, touching, weighing, and measuring.
15

2. Intuition: Becoming aware of things indirectly by incorporating ideas and associations hrom the
unconscious with data provided through the senses.
3. Thinking: Coming to a conclusion by a logical process aimed at an impersonal finding.
4. Feeling: Coming to a conclusion by appreciating the personal, subjective values assigned tothings, people, and events.
Combinations of these characteristics in an individual result in a particular pattern of reeds.behavior, values, and interests resulting in four cognitive styles. These four styles suggest differentrequirements for how office space is used, and how workstations are designed. Generally, a personalitytype will associate with similar types, creating a corporate culture both in personalities and in spatiallayout.
Visionaries: These individuals have the personal characteristics of thinking and intuition. Theycollect theoretical possibilities, tend to base decisions on impersonal information and take a broad viewof things. They want to appear competent and use a few general rules to gather data and gear it towardsmaking decisions quickly. They need an office that was aesigned for large quantities of referencematerials, plenty of shelving and storage, preferably little intemnption, and room to expand workstationlayouts (Figure 1).
Catysts: These individuals have the personal characteristics of feeling and intuition. They alsocollect data, but act on it differently, tend to base decisions on the personal values of all those involvedrather than some abstract future. They generate possibilities, hunches, and alternatives and look at eventsas a part of a dynamic process towards decisionmaking. An office with room for personal items to reflecttheir more personal approach to decisionmaking, a mixture of memorabilia and work objects best reflectstheir needs. (Figure 2).
Stabilizers: These individuals have the personal characteristics of thinking and sensing. Theycollect hard data and make decisions based on logic aimed at creating stability and order. They strive forprocedures, rules, and regulations to maintain the organization logically and systematically. Their needsrequire an environment geared toward action and space to display relevant data (Figure 3).
FIgure 1. Spatial Layout for a "Visionary's" Offi•,
16

CoOFAM: These individuals have the personal characteristics of feeling and sensing. Theycollect facts and experiences and make decisions in light of their own personal values or others affectedby these facts. They have a live-and-let-live approach and ame recepve to change. They often try toharmonize any differences that emerge. They need contact with others to work efficiently, and requirean office that allows accessibility to co-workers. Privacy is a nonissue. (Figure 4).
Figure 2. Spatial Layout for a "Catalyst's" OffIce.
Figure 3. Spatial Layout for a "Stabilizer's" Office.
17

Ulgur 4. Spatial Layout for a "Cooperatr's Office.
Concepts in Spatial Configuration
Because of the many changes happening in offices today, organizations are always looking for moreeffective office environments to promote worker satisfacton and productivity. The best office environ-ments would address the concerns of the user through effective spatial configuration techniques asdescribed in the following section.
Offlce Types
Bullpen Offices. Bullen offices (described earlier) became inefficient and dysfunctional to tasksto be performed as organizations grew larger. The need for privacy became of primary importance andworkers have become more conscious of and discriminating in what they thought was a satisfyingworkplace. Bullpen offices do offer some benefits. They encourage informal communication, make workflow easy to follow, and maximize flexibility and economy. Many organizations decided the problemsof lack of privacy and noise outweighed the benefits and attempted to find another office type that betterfit their needs. Bullpen offices have been appropriately used for pooling people who need visual andphysical proximity.
Enclose Offices On the opposite end of the spectrum from bullpen offices, are enclosed offices(Figure 5). Enclosed offices offer privacy, personalization, status, and an inexpensive original cost, butare nonflexible and expensive in materials and downtime to reconfigure. Enclosed offices do notencourage communication and often foster isolatio. They also require more floor area than open officeplans, and workers may complain of feeling claustrophobic. Supervisors or executives generally needenclosed offices due to the level of privacy needed to perform their job. Enclosed offices often are onexterior walls and can therefore capitalize on windows.
Onen Plan Offices. The general concept of open plan offices is to gain visual privacy using a pre-manufactured panel system (Figure 5). Panel systems are flexible; it is easier and cheaper to reconfigurepanel-system offices than enclosed offices. (This depends on whether the workstations were designed ona module, and how easily the panels can he moved.) Included in moving panels is the cost of movingHVAC and electrical outlets along with telecommunications wiring. However, panel systems can intermpt
18

S~OPEN PLAN
S~OFFICES
ENCLOSED OFFICEFigure 5. Use of Panel Systems To Structure Open Plan Offices.
office air flow and block ambient room lighting (Figure 6). A panel system requires coordinated HVACsystem placement to avoid drafts and stagnant air in the office. Open offices require less floor area peroffice to achieve the same amount of worksurface and storage area of an enclosed office due to active useof vertical storage.
Office Design Issues
Multiple Task Environments. Individuals are often required to perform tasks that require differentoffice settings. Some tasks such as reading, thinking, or meeting generally require privacy. Other taskssuch as group projects require communication and participation among workers. Conflicts betweenprivacy versus participation can arise. Independence versus inclusion are also areas of potential conflict.
In the past, landscaped partitioning (panel systems) have attempted to create flexibility and eliminateconflicts by allowing the user to modify the configuration relatively easy. However, many designers feelthat landscaped partitioning represents an inadequate solution as the design may actually imposenonaccommodating standards. A facility manager will find it virtually impossible to appropriately managea space if no standards are in place. A standard manufacturer, common module footprint for both openand enclosed environments, and similar colors are just a few of the opportunities that designers have theability to influence.
Stone and Luchetti (1985) developed a concept based on the idea that one workstation is usuallynot sufficient for all of a worker's needs and tasks (Figure 7). The concept shows a variety of specialized
19

(1)4
FIgure 6. Light and Air Blockage Caused by Panel Placement.
workstations that workers can move between depending on the task to be completed. Each person stillretains a small, permanent "home-base" unit. This concept allows the workplace to change to meetdifferent work related tasks daily. It can also accommodate a project team (or several project teams)concurrently.
A concept similar to Stone and Luchetti's (Figure 8) allows worksettings to be linked electronicallyso that an individual is no longer tied te one workstation. Frank Becker's "loosely-coupled settings"divide the office into two major zones (that can be easily modified if desired):
"* the edge, which consists of small, permanent workstations near natural light and views
"* the core, which contains flexible group areas that could be deliberately located away from teammembers to increase contact between workers as they move from one space to another.
Grow Identity. Corporations are often organized into a matrix structure where the major emphasisis placed on groups of individuals working together towards a common goal. Matrix structures arecontinually reorganizing teams as projects are completed and new ones are begun. Physical enclosure cancontribute to a teams sense of cohesion because:
"* Physical boundaries provide a symbolic edge indicating a unit.
"* Barriers around a group encourage conversation within it, assuming that people will choose themost convenient partner in conversation.
"* The physical enclosure of a group may allow privacy for the group. Privacy may permit anautonomy or identity more supportive of group objectives.
An example of group identity is the Herman Miller Headquarters: Building B. This building isbased on a concept involving city planning guides in Kevin Lynch's, Image of a City (Figure 9). Majorcorridors became "streets," individual departments became "neighborhoods" and public areas (conferencerooms, copy area, break areas) became "parks." Architectural elements were used to define fixedcharacteristics such as permanent walls to define the edges between areas. Systems furniture was usedto define individual workstations.
20

. ReceptUo 5. Ubrary2. Meeting Room 6. Open House3. Conference Room 7. Home Base4. Special Equipment Room 8. Management
Figure 7. Stone and Luchetti's Offce Concept.
The Edge
6 t 06
W N 1.bho Homva e Offices
Fi-lure'8. Frank Decker's Office Concept.
Lda Rinascente Headquarters in Milan, Italy is also a group identity building, based on a concept thatlinks together a series of cowrts, each rep•etn a different department (Figu~re 10). Each court containsapproximately 40 workstations organze around a central zone. Each zone contains flies, samples, anddisplays of that team's work, and contains the main circulation for the floor. By forcing the maincirculation to go through the zones, worker, ai exposed to the work other groups are involved in andlines of communication between groups are maitie.
21

L. .L ,L , tp-H .L.LJL LI _L
IU J TTL-U -f I if.f rT r 1 R -r
TIT
1
'EHI 1L. I rl 1- 33
1. Streets: Corridors2. Parks: Conference Rooms, Copy Rooms, Break Areas3. Neighborhoods: Departments
Figure 9. Herman Miller Headquarters, Grand Rapids, MI.
Court
Figure 10. La Rinascente Headquarters, Milan, Italy.
Task-Related Design A task-related concept of office design has three major areas of concentration,to: (1) facilitate the performance of specific activities, (2) minimize the building-related problemsassociated with office work, and (3) provide sufficient space for the person and the materials needed toperform the work effectively.
To achieve these goals, a task-related design would redirect the traditional approach of orga-nizational and architects/interior designers imposing decisions and viewpoints on employees. Instead, thisconcept recommends a bottom-up approach in which those who would be using the workstations areinvolved in the design process.
22

The procedure used in this concept first assesses the general or macro goals of the organization thatinvolve function, flexibility, required tools, and planned future growth. Next, is to obtain user informationabout their tasks, needs, and preferences. At this point, generic job categories are established e.g.,executive, managerial, professional, technical, secretarial, and clerical. Each category is assigned normaltask activities, and each activity is ranked by time spent and level of importance. From this it is possibleto identify space allocation and furniture needs, and to establish functional, standard workstations.
Determininq a standard workstation for each job category requires a certain flexibility. The designershould relate the workstation footprint to a building module to optimize the entire design. A modulardesign can allow users to adjust and personalize their space based on their individual cognitivepersonalities. Often this module will be a subset of some larger building element like the structural grid,which influence the smaller building and furniture-related elements like the individual workstations. Acomplete facility design must meet the individual functional goals along with the goals of common areas,mechanical areas, support areas, and corridors.
For planning purposes, the Army has established guidelines to estimate gross office facility spatialrequirements based on personnel only (AR 405-70 1991, AEI). Note that these guidelines do not accountadequately for nonpersonnel specific spaces like toilets, corridors, storage areas, conference rooms, etc.Regulations and organization-specific policies often use a net-to-gross square footage conversion toprovide space for these nonpersonnel areas. Designers should augment these recommended squarefootages, to plan the facility holistically in determining their overall square footage requirements. Mosttimes, the structure of a building and its various systems limit the actual footprint of an office.Consequently, the designer is often tasked to meet the users needs with programmed spaces that are basedon quantities lower than user's actual requirements.
23
3 LIGHTING PERFORMANCE AND QUALITY
Introduction
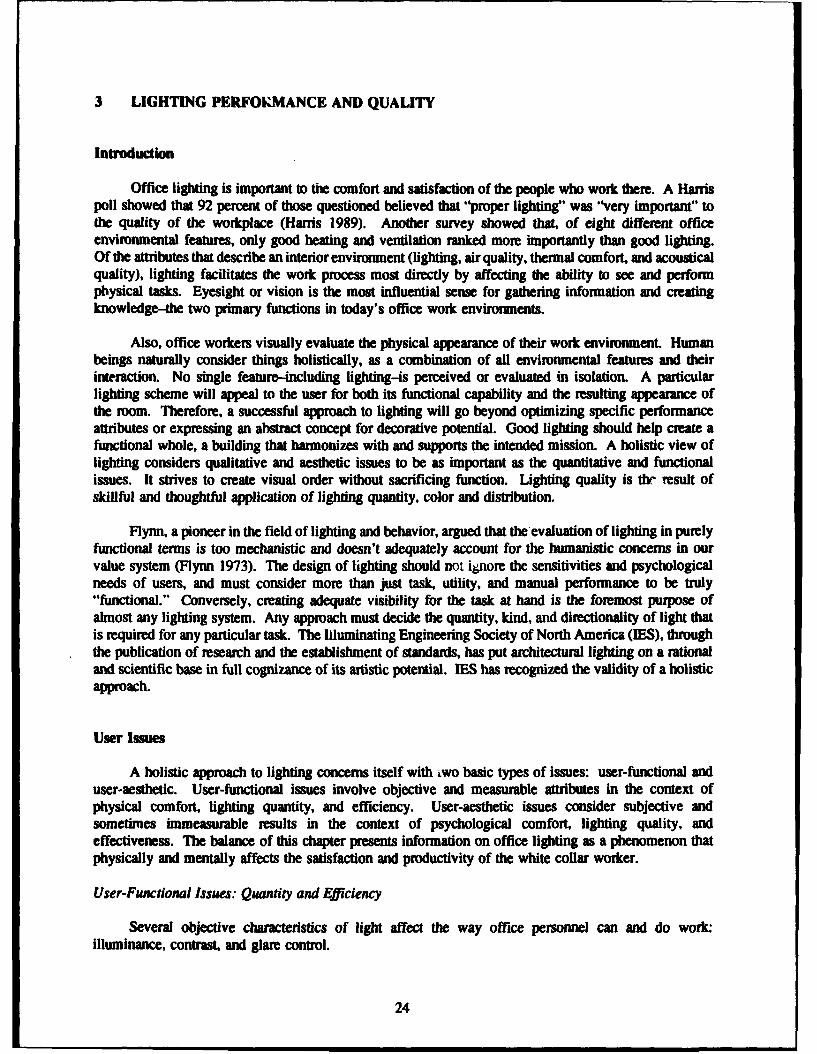
Office lighting is important to the comfort and satisfaction of the people who work them. A Harrispoll showed that 92 percent of those questioned believed that "proper lighting" was "very important" tothe quality of the workplace (Harris 1989). Another survey showed that, of eight different officeenvironmental features, only good heating and ventilation ranked more importantly than good lighting.Of the attributes that describe an interior environment (lighting, air quality, thermal comfort, and acousticalquality), lighting facilitates the work process most directly by affecting the ability to see and performphysical tasks. Eyesight or vision is the most influential sense for gathering information and creatingknowledge-the two primary functions in today's office work environments.
Also, office workers visually evaluate the physical appearance of their work environment. Humanbeings naturally consider things holistically, as a combination of all environmental features and theirinteraction. No single feature-including lighting-is perceived or evaluated in isolation. A particularlighting scheme will appeal to the user for both its functional capability and the resulting appearance ofthe room. Therefore, a successful approach to lighting will go beyond optimizing specific performanceattributes or expressing an abstract concept for decorative potential. Good lighting should help create afunctional whole, a building that harmonizes with and supports the intended mission. A holistic view oflighting considers qualitative and aesthetic issues to be as important as the quantitative and functionalissues. It strives to create visual order without sacrificing function. Lighting quality is tlh result ofskillful and thoughtful application of lighting quantity, color and distribution.
Flynn, a pioneer in the field of lighting and behavior, argued that the evaluation of lighting in purelyfunctional terms is too mechanistic and doesn't adequately account for the humanistic concerns in ourvalue system (Flynn 1973). The design of lighting should not ignore the sensitivities and psychologicalneeds of users, and must consider more than just task, utility, and manual performance to be truly"functional." Conversely, creating adequate visibility for the task at hand is the foremost purpose ofalmost any lighting system. Any approach must decide the quantity, kind, and directionality of light thatis required for any particular task. The Illuminating Engineering Society of North America (TES), throughthe publication of research and the establishment of standards, has put architectural lighting on a rationaland scientific base in full cognizance of its artistic potential. IES has recognized the validity of a holisticapproach.
User Issues
A holistic approach to lighting concerns itself with iwo basic types of issues: user-functional anduser-aesthetic. User-functional issues involve objective and measurable attributes in the context ofphysical comfort, lighting quantity, and efficiency. User-aesthetic issues consider subjective andsometimes immeasurable results in the context of psychological comfort, lighting quality, andeffectiveness. The balance of this chapter presents information on office lighting as a phenomenon thatphysically and mentally affects the satisfaction and productivity of the white collar worker.
User-Functional Issues: Quantity and Efficiency
Several objective characteristics of light affect the way office personnel can and do work:illuminance, contrast, and glare control.
24

liuminan, Illuminance refers to the quantity of transmitted light that reaches a surface, definedspecifically as the density of luminous power expressed in lumens per square foot; it is measured infootcandles (I foot-candle = 1.08 lux). The lumen is a measure of photometric power or the power oflight as perceived by the human eye. It accounts for the sensitivity of the eye to the energy levels ofdifferent frequencies of visible light. liluminance is affected by color of light and its distance from thelight source.
Illuminance is the key measure of the general visibility of a task. In an office environment, the levelof illuminance can affect reading rates, error rates, and quality control. In terms of user satisfaction,however, increasing illuminance levels follows a pattern of diminishing returns. Satisfaction of the userwith the lighting increases with illuminance to a point and then decreases. While most workers generallyfavor high levels, excessive lighting levels create discomfort from glare.
The IES has introduced standardized illuminance levels and categories based on the type of activity,age of the observer, speed or accuracy demanded by the activity, and presence of a particularly low orhigh background reflectance. In an office setting, useful places for measuring lighting are at the floor forambient illumination, and at the work surface for task illumination.
The preliminary findings of a post-occupancy evaluation of 1000 occupied workstations in 13buildings in the United States indicate that perceived lighting acceptability is strongly associated with thedegree of perceived brightness. Of the workers who described their workstations as bright, 80 percentwere satisfied with the lighting conditions available to them. Conversely, of the workers who describedtheir workstations as dim, only 15 percent were satisfied with the lighting conditions available to them(Marans 1987).
Color. The color scheme of a uniformly illuminated office greatly affects its appearance. Theperception of color is influenced by the spectral content of the light source, the spectral reflectance of thesurface, and the level of adaption of the observer. In an office environment, the most important of theseis the spectral reflectance of the surfaces, unless fine color discrimination is needed. It is more the colorof the surface than the color of the light that influences our judgement of acceptability.
The color of a light source is evaluated by a measure called the "Color Rendering Index," whichis defined as the degree to which the perceived colors of objects illuminated by a test source conform tothe colors of the same objects illuminated by daylight at the same color temperature as the test source.*An index of 100 indicates equivalence to daylight at that color temperature. A light source with goodcolor rendering generally produces greater saturation in surface colors than those with poor color-renderingproperties. Color saturation describes the way the color of a surface corresponds to the color of incidentlight. Warmer surface colors, such as reds and browns, will better saturate warmer light sources such asan incandescent. Cooler surface colors, such as blues and grays will achieve better saturation with coolerlight sources such a fluorescent. Better color saturation will produce colors that are more true and vivid.Generally, higher illuminance increases color saturation.
Uniformity. Most lighting designs assume that illuminance is uniform throughout the desired area.However, an undesirable range of illuminances does occur occasionally because of improper spacing offixtures or underestimated light loss factors. Some zones may appear "gloomy" or "depressing," and mayaffect user satisfaction. A design may use the "uniformity ratio," or the ratio of minimum illuminancein a zone to average illuminance of the larger area, to help prevent those situations. A quotient of 0.8 isthe guiding standard in current practice.
"Color temperature" describes the chronaticity of the light source. Two light sources cannot be compared for color unless theyhave matching or close to matching color temperatures. A higher color temperature means the light is more white.
25

Extremely nonuniform illuminance levels can cause eye strain, especially in older personnel. Theeyes normally go through a period of visual adjustment in moving from light to dark or vice versa, butto do this on a regular basis in an office routine will result in irritation of the eyes for some workers.
Luminance Ratios. Just as illuminance is a measure of light from a given source, luminance is ameasure of light reflected from a surface. As such, luminance is the product of source illuminance andsurface reflectance. It is the aspect of lighting often referred to as "brightness."
The ratio of two luminances is termed "contrast," which has no units of measurement, but is gaugedon a scale between zero and one, zero being no contrast and 1 being maximum contrast. Contrast isessential to visual performance. Since the most basic visual tasks are detail discrimination and detectionof low contrast, the luminance of the task in relation to the luminance of the background becomes critical.For example, reading type on a page is helped by the low luminance black print that contrasts to the highluminance white paper. Above a certain minimum value, contrast does not depend on illuminance. Forexample, one can read by moonlight as well as sunlight.
Luminance ratios are not precisely held measures for all situations, but can be a range of valuesapplied to a specific condition. For example, one can read at the same speed a black type printed onvarious shades of gray paper. It is only when the contrast approaches zero that the performance of a giventask is affected. Luminance ratios can become a problem in the contemporary office where personalcomputers exist in conjunction with paper-based activities. The illuminance required for paper functionsis considerably higher than the optimal level for video display terminal (VDT) operation. Such situationsrequire adjustable task lighting that will not interfere with use of the computer.
Control of Glare. Glare is a result of a very high luminance in an otherwise low luminance field;it is a condition of very excessive contrast. Glare is generally categorized into disability glare anddiscomfort glare. Disability glare impairs vision through direct dazzle of the eye from a light source andmay immobilize the viewer. It rarely occurs in r: ,ffice environment because light sources are usuallymounted away from the line of sight and luminance differences are relatively small across the space.Discomfort glare arises from a continual exce&s -- contrast between bright and dim surfaces. It maydistract the viewer and cause eye strain. Strictly, disability glare refers to a severe reduction in thevisibility of objects, and "discomfort glare" refers only to the sense of discomfort produced (Boyce 1981,p 305). In the office environment, discomfort glare is the more common of the two.
Discomfort glare (as well as disability glare) may be perceived directly from the luminance sourceor indirectly from a high reflectance or spectral surface. The sensation and discomfort of direct glare arebased on four principle factors (Boyce 1981, p 306):
I. Luminance of the glare source2. Luminance of the background3. Angular subtense of the glare source at the eye4. Deviation of the glare source from the line of sight.
The four are related in that it is rare to vary one factor independently. For example, a morepowerful light source will increase the luminance of the glare source, but will also increase backgroundluminance, so that the effects may cancel each other. The luminance of the glare source is affected bythe size and number of the source(s). The effect of glare is cumulative; an increase in size, number orluminance of the source(s) will increase the level of glare. As above, background luminance will usuallyvary with the luminance of the source, and can serve to moderate perceived glare with the use of higherreflectance, diffuse finishes.
26

The American measure of direct glare in an interior space is called Visual Comfort Probability(VCP), which is based on a statistical manipulation of the four factors above with units defined as thepercentage of users who would feel comfortable in the measured environment. A VCP index of 70 ormore with a source luminance ratio (maximum to average) not exceeding 5:1 at various angles from thesource constitutes an acceptable environment.
Indirect glare is the presence of a high luminance source reflected from a surface and into the visualfield of the observer. Veiling reflections on the screens of computer monitors are a significant example.They are caused by a mirroring of the light source in the task surface. The visual definition of the object,or the ability to see the task itself, is due to the degree of task surface diffusion. A perfectly diffusesurface reflects only a small portion of incident light into the eye, whereas an undiffused or specularsurface will reflect incident light much the same as a mirror. The principle effect is a shar reduction ofcontrast between the task and its background, thus severely decreasing its visibility.
Veiling reflections are often a function of the geometry between observer, task, and light source.The physical arrangement of a light source, task, and observer should position the task forward of the lightsource so incident light comes from behind the observer. To minimize objectionable brightness, make thetask illuminance larger to overcome the detrimental veiling and use adjustable supplementary task lighting.In designing the light source, reduce the overall luminance of the luminaire or reduce the luminance atthe critical offending angles of 25 to 40 degrees. The task quality can be changed by reducing thespecularity of the task and using matt or low gloss paper and felt tip pens. The use of tiltableworksurfaces can also be considered.
Glare can only be accurately evaluated in context. The particular circumstance in which glare occurscan have an important effect on an occupant's assessment of comfort or discomfort. For example, astandard office luminaire is generally uninteresting to look at and the attention they attract because of theirhigh luminance is regarded as unfavorable. A crystal chandelier however, because of its beauty will beregarded more favorably even though the luminance is higher than the office luminaire. Likewise, anoffice window may produce luminance values comparable to a luminaire regarded as high in glare, butthe occupant will be less sensitive toward it. Since the window is valued for its association with the viewas well as the incoming light, occupants judge it by a different standard (Boyce 1981, p 314).
The assessment of glare also depends on the presence of a task. One study showed that usersevaluated two identical lighting conditions differently depending solely on the presence or absence of atask to perform. The presence of a task produced a different boundary between comfort and discomfort(Guth 1951, p 65).
User-Aesthetic Issues: Quality and Effectiveness
User-aesthetic issues are those that do not affect the physical comfort of the user or visibility of thetask but nevertheless appear significant to the user's evaluation of lighting; they are issues of "lightingquality." Subjective issues as appearance and aesthetics, psychological comfort and impression, andpersonal control are important because they appeal to our inner values as human beings and play a rolein the sy•buili communication between organization and worker. Unfortunately, it is ,lifficult to measureand even harder to form guidelines about user-aesthetic concerns. The correlation method of relatingsubjective judgements of lighting to physical descriptors of lighting, which many researchers use, produceslimited information on a single variable. However, some lighting criteria based on results from themethod have proved sound in practice.
27

Anear.nce, A lighting plan principally affects the appearance of a space by distributing light tocreate contrasts between lighter and darker areas. Users usually find small or moderate contrasts to bepleasing and interesting, whereas those that are large and excessive can create interiors that are gloomyand forbidding (Hawkes, Loe, and Rowlands 1977).
The general appearance of the space also influences the user's evaluation of the lighting design(Hawkes, Loe, and Rowlands 1977). Poor aesthetic quality of the space will inevitably influence theuser's assessment of the lighting's objective capability (Ellis 1986, p 243). The subjective consequencesof a lighting scheme have as much to do with its success in the eyes of the user as its objectivecharacteristics.
It is difficult, however, to specify aesthetic preferences since they are always subject to particularsocial and cultural situations. Human reaction to the environment is variable and inconsistent; few nrlesor patterns am identifiable. It is apparent that the interaction of people to environmental stimuli isinfluenced by their perception of the associated social situation in which they find themselves (Ellis 1986,p 227). Often user's attitudes toward work and the organization manifest themselves in the assessmentof physical conditions. Novelty in the lighting design may meet with user approval more readily in a lessregimented, more spontaneous workplace. Conventional schemes are more likely to find acceptance inoffices where definition and security are valued. It is the unconscious link between unpredictable socialinteraction to an associated environment that makes regimentation of one aesthetic treatment for allenvironments so unacceptable. No universal aesthetic preference exists.
Daylight in the Office Environment
Many office buildings use daylight to some extent to meet their lighting needs. Where there arewindows, there is potential daylight to illuminate the interior. In general, people strongly prefer daylightas a primary source of illumination (Heerwagen and Heerwagen 1986, p 47), and overwhelmingly preferworking in windowed buildings over nonwindowed ones (Heerwagen and Oriands 1986, p 624). Workersin windowless offices are less positive about their jobs and their working conditions than those who workin windowed spaces (Finnegan and Solomon 1981). These studies all underscore the fact that peoplehighly value the opportunities for view and daylight in their work environment.
Yet it is obvious that an office relying solely on daylight to meet all of its illumination needs attimes would be severely dysfunctional and inadequate. Concepts to combine daylight and electrically-generated light have existed for more than 40 years. The British concept of Permanent SupplementaryArtificial Lighting of Interiors (PSALI) has been the most prevalent model. In contrast to manycontemporary lighting schemes, it views electrical light as supplementary to daylight, not vice versa. Itsfocus is not primarily on how to provide daylight, but how to do so in a manner that minimizes theattendant effects of glare, shadow, and heat gain. It is contingent on a thorough daylight analysisincluding maximum, minimum, and average sky luminance values, typical cloud conditions, andfenestration. 'The recent concern for energy efficiency and the immediate topic of office productivitysuggests that dJ'c integration of daylight and electric light is quite important.
User-Functional Issues
Lighting plans that disregard the effect of daylight have an impact on how the illuminance isconsidered. It is still considered as the most prominent attribute, but with less rigidity. Nondaylightingschemes regard the continuous attainment of recommended illuminance levels as mandatory. Schemesthat integrate daylight assume that a variation of the interior daylight illuminance levels during the course
28

of the day will not affect visual performance, even when actual levels fall below accepted recommenda-mion nluminace levels that are recommended by the I.S are still the target, but since daylight changes
slowly, the eye can adapt to the altered level and see basically the same scene. The eye appreciateslightness or brightness not only by actual luminance of the object being viewed but also by contrast withthe surrounding area. The concept regards visual perfornanc as more closely related to contrastdlscnmlnatlon than to the actual daylight illuminance range.
As daylight enters a building, its illuminance values fade quickly as the distance from the windowincreases. A goal of integration is to keep an acceptable uniformity ratio across the space while erasingthe distinction between the electrically and naturally illuminated. A simple way to achieve this is to placemore light fixturs in the vicinity of the building core and fewer at the perimeter. Uniform placement offixtures is redundant and unnecessary in a daylit building.
Essential to the cost effectiveness and uniformity of daylighting is the automatic dimming of theelectric lighting. Dimming compensates to some degree for the inherent variation in daylight, and can beaccomplished by two different approaches. A system that uses full-range dimming with electronic ballastsis preferable to one that makes use of partial dimming with conventional ballasts and a stepped switchingscheme. The stepped switching action can disturb occupants.
The proper establishment of zones is critical for a daylight compensation system. The size of a zoneis established by determining the maximum room depth that receives at least half of its illuminance fromdaylight for several hours each day. Exact delineation depends upon latitude, climate, orientation.fenestration and cost of electric energy. The most likely scenario is perimeter and interior zones.
The proper use of lighting controls can reduce energy use by 60 percent, depending on the type ofspace as well as occupancy usage and patterns. Controls can extend lamp and ballast life, reduce coolingcosts, and lower maintenance costs. Investment payback for lighting controls can be very short if theapplication is properly selected and electrical energy rates are favorable.
The color of daylight coming into the interior workspace is composed of all wavelengths across thevisible spectrum. It varies in its primary makeup across the day and across the seasons. It has beenshown that people prefer the color of daylight and use it as a reference to judge the quality of artificiallight. Most fluorescent light sources achieve color compatibility with daylight. Since most offices areilluminated with fluorescent sources, occupants rarely complain of lighting color. Care must be taken,however, with the use of high- and low-pressure sodium sources in daylit offices since they generate agolden color light from a narrow band of the visible spectrum that will contrast excessively with daylight
Daylight glare is caused by direct sunlight and/or excessively bright sky as seen through a windowor glazed surface. Generally, glare is usually not a problem on the north face of a building unless thecircumstances of the site reflect direct sunlight through the glazed areas.
The control of direct glare from windows on all other elevations is essential. Several architecturalsolutions to the problem are common. The use of low emissivity glass reduces glare and heat gain.Certain chemical coatings on the glass will reflect some incoming light and reduce the daylighttransmission to the interior, also producing a somewhat muted view of the exterior. Architectural sunshading and control devices can also reduce glare and help project light deeper into the interior. A lightshelf will shade the window below and act as a reflector to direct light inward. Another exterior measureused in lowrise office buildings is placement of exterior plantings near the building perimeter. Large treescan directly shade glazed areas, and low shmubbey can diffuse incident light. Both measures can enhancethe view from the building.
29

The use of lighter color finishes on a building's interior will help reduce contrast and the visualeffect of direct glare. If the glare factor is too high, occupants will close blinds and curtains, eliminatingthe benefits of daylighting. To occupants, the minimization of eyestrain and discomfort is more importantthan the perceived benefits of daylight.
User-Aesthetic Issues
It is not clear why people prefer to work in daylight. One theory suggests that daylight may beperceived as inherently psychologically soothing because its changing illuminance suggests the passageof time and the peacefulness of shelter. Electric lighting is more diffuse than daylight, which lends a moremeaningful aesthetic quality to the space by its inherent flow and directional quality. Also, the body'sbiological process of producing vitamin D3 by absorbing ultraviolet light may produce a feeling of well-being (Greer 1984, p 66). Occupants behind glass windows cannot achieve this benefit since glass absorbsmost of the UV spectrum.
The window itself may be part of the reason for the preference of daylight. Research suggests thatoccupants desire daylight independent of its contributions to task visibility (Ne'eman and Vine 1984, p160). Daylight entering through a window gives a psychological benefit; it allows a view to the outdoors,ohich gives a periodic, temporary relief from the day's work by allowing outside visual contact andescape from the sense of enclosure. That contact also enhances break times by giving a sense of removalfrom the work environment. However, windows alone are not enough; there must be "something to lookat" (with psychologically significant content or information) for the windows to be perceived as more thanjust sources of daylight. Research has shown that distant and mid-distant views are more desirable thanclose views to office workers, and views of nature are preferred over those lacking natural elements(Markus 1967). Several studies have shown that occupants prefer views of the natural environment overurban scenes (Heerwagen and Orians 1986, p 625). It appears that the opportunity for natural views isassociated with social well-being and health. A study of housing project residents found that the morelarge trees and woods people were able to see from their windows, the more friendly, supportive, andattractive they rated their neighborhood (Kaplin 1983, pp 127-162). Medical research has shown thatpatients in intensive care units recover faster and have fewer setbacks in facilities with windows than inthose without The windows contributed to the shorter recovery period by providing a sense of stimulationand arousal in addition to such basic information as the weather, time of day, and seasonal changes(Wilson 1972, pp 225-226).
It reasonably follows that, if a windowless building is required, the office areas should be designedas larger spaces to promote greater activity and social interaction. Outside views and natural light shouldespecially be considered if workers are isolated or restricted in their activities. Deprivation of contact withother human beings and the outdoors will result in passivity, listlessness, and depression.
The optimal daylighting of a building is an issue that has been thoroughly researched and discussedbut rarely implemented. The problems involved in utilizing "free" light in the context of an actualbuilding project are many and complex. Requirements for user well-being and performance, functionalplanning, energy savings, and lowest long-term cost often cannot be optimized simultaneously. Aclimatically sensitive and ideally daylit building dictates a particular massing, site orientation, and physicaldimensioning that may not always be congruent with the other components of a complete buildingprogram.
The principal concept in the daylighting of interiors is that of penetration. Since most workers arelocated away from the building's perimeter, daylighting design attempts to distribute a greater amount oflight to a greater number of people. The success of daylight penetration depends on a combination of abuilding based on a narrow plan form, high floor-to-ceiling heights, and/or skylights. A narrow building
30

oriented east and west with large glazed areas to the south optimizes the use of daylight. The narrow planhowever may not always accommodate an organization's special needs or fit the conditions of the site.Greater floor to ceiling height will increase the daylight penetration and create a sense of spaciousnesswithin the interior. An area of glass 10 ft above the floor will let in twice as much light as the same areaof glass 5 ft above the floor (Daryanani 1984, p I 11). However, greater ceiling height will increase theinitial cost of the building by increasing the materials and labor required for construction. The inherentlylarger glazed areas may also put a larger load on the mechanical system, which would increase its sizeand cost. Skylights can provide great quantities of natural light, but are limited in most cases to one-storyapplications.
In hard functional terms, integrated daylighting schemes are disfavored for their complexity and cost.Some decisions made in a specific project concerning the role of daylight may adversely impact otherbuilding systems. Research has shown that drawbacks of the concept are not economically compensatedby increased satisfaction and productivity of the user. Although a sample of 33 people indicated theystrongly preferred daylight to electric light for a range of psychological and physical needs, "havingdaylight in ones work area" ranked 19th out of 20 office variables in terms of importance for acomfortable work environment (Heerwagen and Heerwagen 1986, p 48). The same study also showedthat those with windowed offices consistently valued daylight less than those stationed in core spaces.Daylight as a psychological asset apparently becomes more pronounced for those who are deprived of it.
Ambient and Task Lighting Systems
Ambient lighting systems are those that provide the general space illumination. Task lightingprovides illumination for specific activities within a space. Until the energy crisis of the 1970s, thefunctions of both were always performed by one general overhead system. Stark uniformity in theplacement of fixtures and in illuminance levels was the result. This came about from a scientific approachto design based more on rigorous mathematical modeling than intuitive acknowledgement of humanvalues. The level of ambient light in a space was determined by the most visually demanding task.Uniform illuminance levels on the order of 100 foot-candles at the worksurface were not uncommon. Inaddition to wasting energy, the excessive brightness caused glare problems and eyestrain for many officeworkers, and it was also criticized as oppressive and uninteresting (Ellis 1986, p 225). The generaloverhead system, however, is still very common today.
The premise of task/ambient lighting is that the amount of light delivered is based solely on thefunction to be performed. The concept separates the lighting of the task from the lighting of thesurroundings. A whole space need not be illuminated to the degree required for a visually demanding butlocally performed task. In the office environment, work is performed in predetermined areas such as adesk, a workstation, or a conference table. These areas are locally illuminated to a level in accordancewith the visual difficulty of the tasL At the task level, the primary consideration is given to performancethrough mathematical modeling. Beyond work areas, the need is only for general orientation within theoverall space. This requires much lower illuminance levels. Ambient light controls contrast with the tasklighting within the room.
Ambient lighting systems can be categorized based on way the light is delivered into the space bydirect and indirect systems; other systems may display characteristics of each (Figure 11). A directlighting system is usually mounted in or close to the ceiling and focuses concentrated or spread lightdownward. The spread type is the most common for offices and most aptly represented by the recessed2 x 4 ft fluorescent fixture called a trouffer. Direct lighting gives very little vertical surface illumination,and so requires perimeter lighting for blackboards or other presentation surfaces. Often the perimeterlighting consists of recessed incandescent downlights.
31

0-10% 10-40% 40-W%90-100 1;00 40-60% Q
DIREO SE1&-D1ECT GEEA DFRUSE
40-60 60-90% 90-100%400 -M0T40% 0-10%
D1ECT-ICFIECT SEWWFECT tNcLumk*ue for ganeral ION1 we -cIma'On 'by the CE in accordnce wni fte percentege
of tota hmi*l~e otf~xfi emite above and below horzormuL. The "0 dairbilon curves may takemanly oW. wllDM the OriNW of upward end downward de~rIbudon, depenxig on tMe typ of W~source end Me dearg of fte kairrinef.
Figure 11. CIE (International Commission on Illumination) Classification System. (Source:Illuminating Engineering Society of North America. Used with permission.)
Indirect lighting reflects off the ceiling plane and upper wall surfaces to the woilcsurfaces so thatthe ceiling plane and upper wall surfaces become the light source. It follows that these surfaces shouldhave a high reflectance value. Positive qualities of an indirect system include a resultant illumination tais quite diffuse or shadowless, generally uniform, and low in direct and reflected glare. This type is ofparticular advantage in spaces with specular visual tasks, such as computer work.
Task lighting is nearly always localized direct light. Fixtures may be mounted under overheadcabinets in an office arrangement that uses systems furniture. Adjustable arm models may also be usedand are recommended to control veiling reflections and to focus light into specific areas around the work-station. A fluorescent source has the advantage over an incandescent because of lower local heat gain.A diffusing lens over the source will prevent shadows over the work surface and promote uniformity.
User-Functional Issues
Illuminance from ambient lighting systems is measured as an average maintained across the space.The lumen (flux) method is used most often for determining illuminance. It is based on a coefficient ofutilization and various factors of light loss that occur through time.
The coefficient of utilization gauges the overall luminous efficiency of a particular unit in aparticular space. It is the ratio of the lumens reaching the horizontal working plane, to the lumensgenerated by the source. Zonal cavities are determined by the proportions of the room, mounting height,and surface reflectance; these combined with the specific fixture efficiency and distribution, yield thecoefficient. Light loss factors account for anything that contributes to the decrease in initial sourcelumens, including decreased voltage, colder temperatures, lamp and ballast age, and dirt depreciation ofroom and lamp surfaces. The coefficient and the loss factors are combined to predict the averageilluminance across the space.
32

Orfield rases iome questiom cncerning the usefalness of the lumen method mad the validity of tem acapp.wch to UHling. The calculation of coefficient of utilizatin requires a number ofasumptions that impede its effectiveness, including:
1. The layout of luminaires must be symmetric.2. Reflectance is assumed to be constant on relevant surfaces.3. The space Is free of barriers such as partial height partitions.
Failwe of the lumen method to accurately detennine the illuminance is predictable when applied to theopen office environment. The method overstates the lighting level by about four times what actuallyreaches the wokuairface (Orfield 1987, p 19). A predicted 50 foot-candles is actually 12.5 foot-candles.
The problem with mathematical models are twofold. First, they implicitly promote the propositionthat office space must be very simple, uniform, and symmetric for the calculations to be reasonablysolvable. The calculation of valid averages requires a good degree of uniformity. Second, even withsimple, uniform spaces, the assumptions required to use the formulae do not consider the activity in the.area, air flow, or acoustical values.
Luminance ratios at the workstation should be moderate. Lighter color finishes and fabrics improvethe ratio. The task light should not be extralcinarily bright, but should provide about the same luminanceas the ambient system. However, the greater portion of light must be on the task. The ambient lightperforms a secondary role of controlling contrast. It is safe to say that, in office environments, moderatelevels of illumination in task and ambient light will almost always meet the comfort needs of the userwithout sacrificing the function to be performed. The current recommendation is that the local backgroundilluminance produced by the ambient system should not be less than one-third of the task illuminance(Boyce 1980, p 301).
Direct glare in an ambient direct system is most often controlled through the design of the fixtureitself. Prismatic lenses, baffles, and reflectors within the luminaire manage the diffusion of light Fixtureswith parabolic reflectors have been successfully introduced to control direct glare. The parabolic shapedirects light downwards while allowing only very little to scatter at high incident angles. From typicalviewing positions, the fixture appears to be a part of the ceiling and tends not to be a glare source.
Indirect systems generally reduce or remove glare from the ambient source. The creation of aluminous ceiling plane will reduce the potential for gloominess. The general color of the ceiling planeis of great importance as it affects the color of the reflected light
Whatever the benefits of indirect lighting, a large survey showed that 75 percent of buildingoccupants working under direct recessed fluorescent lighting fixtures with louvers were satisfied with theirworkstation fighting, and only 14 percent were dissatisfied. Occupants having indirect, furniture-mountedsystems had lower levels of satisfaction (56 percent expressed satisfaction and 36 percent expresseddissatisfactiork,. Also workstations with supplemental task lighting were consistently rated less favorablythan those which received their light from the ambient system only (Marans 1987, p 36).
Direct glam and veiling reflections can be controlled easily with adjustable or movable task lighting.This is essential with the use of computers, where the spectral surface of the screen is prone to veilingreflections. By positioning the screen and controlling surounding contrast, screen glare can be minimized.Direct glare from the fixture itself must be handled through design and manufacture.
33

User-Aesthetic Issues
The aesthetic purpose of ambient lighting is to create moderate visual contrast. In the officeenvironment, there are many creative opportunities •o use different light types and delivery systems.Fluorescent and incandescent systems can be enhanced with metal halide or high pressure sodium accents.A direct diffuse system can be supported with spotlights to enliven the space. The profusion of newhardware in the last few years provides greater opportunities to create visual contrast inexpensively. Alllighting problems can become creative opportunities.
Combining perimeter incandescent downlighting with an indirect or direct fluorescent system forgeneral space illumination can successfully integrate function and aesthetic. General ambient lightdownplays wall surface, whereas perimeter downlighting illuminates the content or texture of the surfacewith a wash of warm light. The warm, concentrated incandescent light differs from the cool, dispersedfluorescent to create a simple, pleasurable contrast.
Moderate lighting contrast can work to create hierarchy and differentiation in the visual elementsof the office. Lighting contrast may promote a sense of order and accomplishment, whereas uniformitysuggests regimentation. Lighting that supports visual hierarchy and differentiation may contributepsychologically to improved employee morale toward the task and pride in the work place. Perceptually,it breaks down the greater physical reality into elements more of human scale. As large organizations arecomposed of groups, subgroups and individuals, the luminous environment can be delineated through aphysical hierarchy of area, zone, and workstation.
Different areas within the larger facility can be illuminated to accommodate its function. The degreeto which the area is exposed to the public will have an impact on its lighting scheme. The zones withinan area can be differentiated by tieir specific function within the overall operation. For example the needsfor an executive area are different than those of a clerical area. At the workstation, the individual isprominent. A task light c'ntributes to an individual's sense of importance by allowing personal controlin its placement and usage. The organization hierarchy can be highlighted through proper lighting design.
34

4 THERMAL COMFORT
Introduction
Since a correlation exists between occupant comfort and productivity, there is much current interestin building occupant comfort. In addition, legal and economic liabilities associated with occupantdiscomfort may be at issue.
The ability to provide adequate thermal comfort levels, and thus facilitate productivity. is animportant consideration for a building designer. A well designed building allows for the integration ofthe facility's envelope, mechanical systems, and interior layout to provide the best thermal environment.This may be done by isolating the interior space from the outside, or by incorporating desirable outsideconditions. Interior conditions conducive to human occupancy and worker productivity rely on manyenvironmental parameters. This chapter discusses thermal comfort-related issues addressed by theAmerican Society of Heating, Refrigerating and Air-Conditioning Engineers (ASHRAE).
Background
ASHRAE Standard 55-8IR, "Thermal Environmental Conditions for Human Occupancy," specifiesthe combinations of space and personal factors that will produce comfort conditions acceptable to 80percent or more of the occupants in a given space. The environmental parameters that Standard 55-81Raddresses are temperature, thermal radiation, humidity, and air speed; the personal parameters are thoseof activity and clothing.
It should be explicitly stated that one's perception of the physical environment is a response toseveral interrelated factors. The environmental factors that ASHRAE examines to determine occupantcomfort are measurable, quantifiable, and rationally derived environmental parameters. Other personal(subjective) parameters also affect how individuals perceive an environment. It is these personal factorsthat keep thermal comfort evaluation of an environment bound to statistical predictions rather thanempirical techniques.
The definitions for thermal comfort and thermal sensation indicate that subjective parameters canalso influence thermal comfort. Personal likes and dislikes along with the potential influence ofnonthermal parameters such as air quality, lighting, and acoustics complicate the use of the measurable,physical parameters. Furthermore, a person's metabolic heat production (primarily a function of activitylevel), its transfer to the environment, and the resulting physiological adjustments and body temperature,influence individual perception of the thermal environment Environmental parameters affect this heattransfer process as do clothing insulation properties.
A few of the important terms (ASHRAE, 1981) presented in Standard 55-81R include:
1. Acceptable Thermal Environment: An environment that at least 80 percent of the occupantswould find thermally acceptable.
2. Occupied Zone: The region within a space, between planes 3 and 72 in. (75 and 1800 mm)above the floor, and more than 2 ft (600 mm) from the walls or fixed air-conditioning equipment(ASHRAE Terminology of Heating, Ventilating, Air Conditioning and Refrigeration).
35

3. Thermal Contfort: That condition of mind that expresses satisfaction with the thermalenvironment.
4. Thermal Environment: Those characteristics of the environment that affect a person's heat lossor gain.
5. Thermal Sensation: A conscious feeling commonly graded into the categories of cold, cool,slightly cool, neutral, slightly warm, warm, and hot.
Design For Thermal Comfort
Providing comfortable thermal conditions for building occupants should be a fundamental goal ofbuilding designers. Many environmental and personal factors influence a person's perception of theenvironment, and design can strongly influence environmental parameters. Studies in this field haveestablished environmental boundaries to predict a certain percentage of people who will perceive givenconditions as comfortable. Designers should plan buildings to stay within these boundaries.
Optimizing thermal comfort through building design is a difficult and complex process that requiresthe designer to assimilate many interrelated design aspects into an optimal configuration. Issues andelements of building design impact the thermal comfort component of facility design. Global parameterssuch as a buildings' function and its environment combine with building specifics to affect thermalcomfort.
Building Funcdon/Occupancy
A building's function will usually influence occupancy loads and schedules, and sometimes theselection of building materials, all of which can affect a building's thermal properties. Optimal thermalconditions are not unilateral; they depend on the tasks individuals perform in the building, and thus varyconsiderably. Optimum thermal conditions in an office building will differ from those in a building whereheavy manual labor is the primary task. A building's use will therefore dictate the acceptable comfortrange for the tasks to be performed there. The higher the rate of physical work (i.e., the metabolic rate),the lower the thermal requirements, and vice versa. Both occupancy loads and schedules need to beexamined and evaluated for their effects on thermal loads, and their relationship with climatic loads.
Climate
Military building energy usage is principally determined by the building "envelope," the point ofdemarcation between interior and exterior that moderates between exterior climatic conditions andcontrolled interior conditions. Before designing the envelope, a designer should investigate the climaticconditions that will affect the building. Many environments involve a diversity of possible weatherconditions. Building designs typically compensate for temperature extremes only, ignoring climaticparameters that can have a significant influence on a building's energy consumption such as solar andwind effects.
The Corps of Engineers Architect Engineer lnstructon (AEI) (1991) dictate ranges for interior andexterior design temperatures for assorted building types and also prescribe whether or not a particularlocation qualifies for mechanical air-conditioning or humidity control. Design criteria do not address howother environmental elements can or will affect building design. Although the addressed parameters mayhave a significant effect on interior thermal comfort, future building designers will have to respond to allthe variables that affect interior climate design rather than just a select few.
36

Except in rare btnces, climate and thermal comfort are inseparable design companions. Envelopeand mechanical design solutions are simply responses to interior design prerequisites, and exteriorconditions.
Bulding Design
A building's design should respond to programmatic (functional) needs and the climate. However.buildings are often not integrated with their environment. Mechanical systems often compensate fordesign deficiencies. For example, a chiller may counterbalance large expanses of glass exposed to the sunwhere solar shading or a redesign of the facade would have been more efficient Rising fuel prices andconcerns about chlorofluorocarbons (CFCs) have increased interest in efficient mechanical systems andintelligent building design.
Intelligent building design involves many inter-related building design parameters. The followingsections briefly explore the larger issues involved with building design that affect thermal comfort, andthe nature and degree of their interrelationships.
Build•in Site. Building placement can profoundly influence how the local microclimate and climatein general will impact the building. Factors that can affect building orientation are existing infrastructure(road and utility networks) and the surrounding context (buildings and terrain). Often the original layoutof roads, utilities, and buildings is conducted without thought of their future impact on optimized buildingorientation. This forces the building designer to work within parameters that limit an optimized solution.
Issues involved with siting a building that can affect thermal comfort include solar exposure,exposure to winds, and relation to the surrounding landscape elements (both natural and manmade).Properly accounting for these environmental parameters can help create a thermally comfortable buildingwhile also affecting its energy consumption characteristics.
Fenestration. Fenestration, the design ard placement of windows in a building, can significantlyinfluence thermal comfort and energy consumption. Orientation, size, type of glazing, shading, exteriorsurroundings, interior finishes, and type of task being performed on the interior can all affect thequantitative and qualitative aspects of a particular fenestration scheme. It is possible to quantitativelydetermine the heat gain or loss through windows, and (although somewhat more difficult), the quantityand distribution of daylight. Qualitative analysis of a fenestration scheme can be difficult since the quali-tative aspects of the light being admitted change throughout the day and different types of tasks requiredifferent types and quantities of light. A change in building function can render an existing fenestrationscheme ineffective.
Fenestration can also affect other directly and indirectly related building systems such as the lightingand the heating, ventilation, and air-conditioning (HVAC) system. Good daylighting design can reducethe lighting load, which in turn can reduce the cooling or increase the heating load, depending on theseason. Changing any one asp!ect of a fenestration scheme can result in a chain reaction that affects manyother elements of a buildings' design.
Thermal Mass. The use of thermal mass to modulate interior conditions is a concept that has beenused for a long time. Mass can be used to absorb, retain, and release thermal energy. Although buildingmass can be linked to thermal comfort, optimal levels of thermal mass are rarely calculated. Thermalmass is usually a simple function of the structural system and interior furnishings. The potential forthermal mass to become an integral component of the thermal environmental control system isconsiderable and its thermal comfort implications and energy conservation potential should not beunderestimated. Building mass, similar to fenestration, also affects many other aspects of building design,
37

directly and indirectly. Startup loads, peak loads, exposure to solar radiation, etc. are all related tobuilding mass and other associated building systems.
Mechanical Systems. One of the fundamental purposes of a mechanical system is to maintaininterior temperatures and ventilation rates within an acceptable range. Design of the mechanical systemprimarily depends on the size of the building's envelope, exterior conditions, interior needs, functions,and equipment. Due to all of the variables that can impact HVAC system design, optimizing a design isnot a simple task.
HVAC system design is of great importance due to the impact it has on the occupants and theamount of energy that it typically consumes. A properly designed system wi•i maintain comfortableinterior conditions while minimizing energy consumption. This can be a relatively straightforward processin the design of a new facility. However, determining the effects of changing building functions,demands, and the adequacy of the existing systems to meet these changes can be difficult.
The mechanical system also plays a key role in providing proper and adequate indoor air quality.Thermal comfort involves both occupant comfort and safety. It is important to achieve energy savingswhile providing proper temperature humidity. On the other hand, poor indoor air quality can have long-term physical effects that impact the user far beyond matters of comfort. Also note that energy savingson the mechanical system are more than mechanical design; savings must continue through the life andoperation of the system, including its maintenance and upkeep. The following section deals specificallywith indoor air quality issues and their impact on users.
Environmental Parameters
An individual reacts thermally with the environment in several ways. Evaporative heat losses occurthrough the evaporat ..n of body fluids, and dry heat exchange can occur through convection or radiation.The physical parameters of the environment work together to affect these processes. The fourenvironmental parameters that influence the thermal comfort of a space are: (1) Air Temperature,(2) Mean Radiant Temperature, (3) Humidity, and (4) Air Speed.
Air Temperature
Air Temperature (t,) is the most elementary environmental parameter to be measured. It is ameasure of the sensible heat of air and is significant in judging comfort, particularly in cold environments.Figure 12 shows the environmental parameters that affect heat exchange between a person's body and thesurroundings. In warmer environments, humidity can have a significant effect on the body's temperatureregulation through sweating, thus limiting the importance of air temperature in the determination ofthermal comfort. Convective heat exchange with the environment is thus influenced by air temperature,humidity, and velocity. As the difference in temperature between the body and the surrounding airincreases, so does the rate of convection.
Air temperature can be measured using a standard liquid in glass thermometer, resistancethermometer, thermocouple, or bimetallic thermometer. For an accurate air temperature reading, themeasurement device should be shielded from direct radiation while not restricting air motion around thedevice.
3-

Figure 12. How Thermal Comfort Parameters Operate.
Mean Radiant Temperature
Mean Radiant Temperature (P[IRT or t~,) is defined as the uniform surface temperature of a radiantly
black enclosure in which an occupant would exchange the same amount of radiant he~at as in the actual
nonuniform space. Radiative heat transfer is governed by the surface temperatures of the individual and
the surrounding environment. Physical properties such as emissivity and absorptivity of each surface, as
well as its angle factor to the individual, affect the amount of radiation exchange.
MART can be calculated with reasonable accuracy by summing the products of the various surface
temperatures and their respective angle factors to the person. In many cases, the air temperature and lPlRT
are equal; however, in certain instances the convective and radiant heat exchange in a given environment
A simple example can show the importance of radiant heat. Imagine standing outside on a calm,
clear, sunny day, in the middle of the winter. Although the air temperature may be below freezing, it is
possible to feel comfortable, even warm, by staying in the radiant heat of the sun. Conversely, one may
feel cold in a room that has reasonable air temperatures but also contains a large cold surface such as an
exterior glass wall. In both instances, the air temperature alone does not finafly determine comfort. This
should be an important consideration of the designer whenever a potential radiant heat source or sink may
Usually the mean radiant temperature tends to stabilize at room air temperature. However, exterior
wails with large glass surfaces or without .insulation may introduce considerably lower surface
temperatures during the heating season than other interior surfaces, thereby lowering the mean radiant
temperature of a space. The effect of this reduced mean radiant temperature can be significant• a 1 -degree
39

change in the mean radiant temperature is assumed to have about a 40 percent greater effect (on comfort)than a 1-degree change in air temperature. Therefore, it is usual to reduce the air temperature 1.4 F forevery I OF that the mean radiant temperature exceeds the air temperature, and to increase the air tempera-ture 1.4 OF for a decrease of I 0F in mean radiant temperature (1 *F = [*C x 1.8] + 32). Figure 13 showsthe necessary mean radiant temperature and corresponding air temperature to maintain a thermal sensationof 70 F.
Thermal radiation is measured using either a globe thermometer or a two-sphere radiometer. Therationalization for describing the thermal radiation inside a space by specifying its mean radianttemperature is to reduce numerous values (i.e., the radiation from various directions) into a single figurefor calculation.
Hwmidity
Comfort is directly affected by humidity since moisture in the air affects evaporative heat losses.Evaporative heat loss is influenced by humidity and air temperature. When temperatures and humiditylevels are high, it becomes difficult for the body to cool by perspiration because the air is unable to acceptadditional moisture, thus restricting latent heat loss from the individual. Evaporative losses are particularlyimportant at higher air temperatures as convective and radiant heat loss decreases as the environmentaltemperatures approach, or surpass, the body temperature.
At lower temperatures, i.e., approximately 60 F and below, the convective and radiant heat lossfrom a human body are approximately seven times greater than evaporative losses (from perspiration andrespiration). At temperatures above normal body temperatures (98.6 *F), convective and radiative heatloss from a human body will be zero; thus the only means for cooling is through evaporation from eitherperspiration, or respiration. Figure 14 shows the relationship between the various modes of body heat lossand ambient room temperatures.
Humidity can be determined by measuring either dew point, relative humidity, wet bulb, or vaporpressure, and converting from one measure to another. Instruments used to determine these quantities arepsychrometers, dew point hygrometers, or electrical conductivity or capacity hygrometers.
Air Speed
Induction of air motion within a space is important for many reasons, all of which affect humancomfort. Supply of fresh air, removal of accumulated heat and moisture next to the body, and mixing ofair to avoid thermal stratification, all contribute to perceived comfort. Air velocities of approximately 10to 50 ft per minute (fpm) are considered adequate to produce favorable conditions, with an upper limitof 160 fpm. The summer comfort zone (on the psychrometric chart) can be extended with higher airvelocities up to a maximum of 200 fpm (Figure 15).
Figure 14 also illustrates why air motion can be such an important component of thermal comfortat higher temperatures. Notice that, as the room temperatures approach or surpass 80 0F, the primarymeans of heat removal from the body is through evaporation. Air motion can profoundly influence therate of evaporation. Still air can cause discomfort, while mov.ing air can help create tolerable conditionsby promoting evaporation. Convective heat exchange can be enhanced by increased air velocity acrossthe body, e.g., by using a fan. The use of the wind chill factor as a measure of cold also shows the strongeffect air speed has on convective heat transfer.
40

j75
E-- him bd
FiNVre 13. Men Radiant Temperature and Air Temperature for and Equivalent Thermal Senn-tion of 70 OF.
Air speed can be measured with a variety of instruments, including hot-wire, heated sphere, orheated resistance anemometers. The most important aspect of a measurement device is that it beomnidirectional and capable of detecting air movement fluctuations.
Hod Gmnwst BMuh 400 400 400 400 400Hodbt by:RIladin & ComnVlon 360 300 200 100 0Evapdnio &I.00M 0TOWi Blsh 400 400 400 400 400
Soo
500 b
3400
200
50 s0 70 40 90 100
Ro Tem patum
Figure 14. Approximate Heat Generated and Lost by a Pernon at Rest.
41

OC
n U 24 U 27 U 20
£ JO GA mui or 100 pm 200
0.0 " 0"72 74 76 711 so a 6
OF
TEMPERATURE
Figure 15. Extension of Summer Comfort Zone.
Combined Environmental Parameters
Operative Temperature
Operative temperature (Q,) relates the combined effects of convective and radiant heat exchange intoa single parameter. Operative temperature is defined as the uniform temperature of a radiantly blackenclosure in which an occupant would exchange the same amount of heat by radiation plus convectionas in the actual nonunifom envinminen. Operative temperature is the numerical average of the airtemperature (Q) and mean radiant temperature (t), weighted by their respective heat transfer coefficients(h. and h).
t. = ht. + ht, [Eq I]h. +h,
If the body's radiation and convective heat transfer coefficients are not known, another method candetermine operative temperature by using the air temperature, mean radiant temperature, and air velocityof a space in the relation:
t. - axt + (1 -a)tK [Eq 2]
Where Table I shows (approximately) how factor a depends on air velocity v.
For air speeds of 80 fpm or less, and an MRT less than 120 PF, the operative temperature isapproximately the simple average of the air temperature and MRT. Operative temperature is a very usefulparameter as it offers a reasonable, single point measurement of thermal comfort under certain conditionsoften found in an office environment. It is approximately equal to the temperature of a 6-in. globethermometer. A gray or pink globe is recommended since a black globe would overestimate the effectof direct solar radiation.
42

T",b I
ApprwhaeI sRhda bet 1 Air T=mPsrur mi Air VeoLuy
v("M) a
0-0.2 0.50.2 - 0.6 0.60.6 - 10.0 0.7
The operative temperature is a rationally derived temperature scale. It is, in a sense, an adjustedtemperature scale to account for both convective and radiative dry-heat exchange between the body andthe environmet The operative temperature scale addresses an important component of assessing thermalcomfort. The human body exchanges energy with the environment through radiation, conduction, andevaporation. Simply measuring air temperature or the mean radiant temperature of a space will notprovide a comprehensive perspective of how the human body will respond to interpret the ambientenviroment.
Persmal Prammetws
The two quantifiable personal parameters used in calculatng thermal comfort are activity level andclothing insulation,
Activity Level
There is a predictable correlation between most people's activity and their metabolic rate (the rateof energy production of the body). This rate of energy production changes with the level of activity. Themore strenuous the activity, the more heat the body produces. Metabolism's standard unit is expressedin "met units," where I met is defined as 58.2 W/m2 (18.4 Btuih sq ft), which is equal to the energyproduced per unit surface area of a seated person at rest. The surface area of an average person is about1.8 m2 (19 sq ft). A seated person at rest produces approximately 350 Btu/ (18.4 Btuh sq ft x 19 sqft).
Typical met units vary from 0.8 for an inactive reclining person to 3.0 for sustained, high activitywork (Figure 16). (These values will vary from person to person depending on their physical health.)
Clothing Insulation
A person's clothing can have a strong influence on body heat transfer to the surrounding
environment, and thus to the perception of comfort Clothing or garment insulation is quantified in "clounits." The insulation provided by a suit of clothing is specified as "Icl," and the contribution of anindividual garment to overall insulation is expressed in terms of its effective insulation Iclu. One clo unitequals 0.155 m2 C/W (0.88 sq ft PF/Btu). Typical d!o values for clothing ensembles range from 0.5 forlight summer attire to 1.2 and above for heavy winter clothing (Figure 17). To get an exact value for aparticular clothing ensemble, individual garment clo values are simply added together and multiplied by0.82 to arrive at a total insulation value.
43

C Ffs% .... Iwo
* U[
1.0) 1.5 , UU 0
ACIWITY LEVEL. km MET U~lSmFigu'e 16. Typical do Vaiues hr Various Activity Levels.
ASHRE Criteria
Figure 18 shows thermai comnfoit boundaries with resect to humidity and operative temperature.As thermal counfoi bouxliares aure not absolute; clothing, activity level, and increased air movement maycamse the boundaries to deviate fiom "standard" conditions. Experimental studies of the relationship of
•miUim po.5 inul
64U0 72O 76 U 34
-IMa W1mqTUlF•ur 1. Typdcl do Values hrt Variou Clohig
44

OF
70
10
455
U ,
40 o
35 S
30
I:5 -2
250
so 70 so gO0 FOPERATIVE TEMPERATUFRE
Fip"e 1& Tuum Comfort Boindarie Duletnined by Humidity and Temperature.
thermal comfort to the environment have been conducted since the 1920s. Sensation scales, such as theseven-point scale shown in Table 2, are common.
Empirlcal analysis of subject responses from these studies have related them to the environmentaland personal factors mentioned above. The responses have also been related to physiological factors suchas skin temperature, inernl tempemmre, sweat rate, skin wettedness, and thermal conductunce betweenthe core and skin, and mathmatical models have been formulated from these results.
A thermal comfort model will typically take the form of an energy balance equation. The heattransfer between the individual and the environment, as well as the =eultant body temperatures and therate of internal heat storage are determined. If the rate of internal heat storage is zero, and the bodytemperates are at acceptable levels. then a thermally neutral, or comfortable, state is assumed.
45

Tubkk 2
SsMD-Po CoAlo" Isad
NOw Coih TlbaIn SOMM
+3 Hot+2 WMi+1 SliByt wreo N§aWl-1 Slig"y coo-2 Cool-3 Cold
Cowforr Eqasasouu
Thue complex algorithms are used to predict comfort within a space, including the Pierce, Frager,and KSU tmemal comfort models. These equations can be used to predict a person's response tomeasured or hypothetical envinTInental puuwmetem. The algorithms result in a Predicted Mean Vote(PMV) value, which is a mathematical function of activity, clothing, and the four enviroinentalparuaeters. This value is an index that predicts the responses of individuals on the seven-point scale (-3cold to +3 hot) for a given thermal -envimuent. From the PMV index it is possible to determine thePredicted Percentap Dissatisfied (PPD) within a given thermal environment. PMV values between -0.832and +0.841 ae estimated to satisfy 80 percent of the occupants or to dissatisfy 20 percent (PPD).Equation 3 is an example of the Finger algorithm used to calculate PMV.
PMV - 0.352e 4o " +. 0.032) (W/AD. (I--n) -0.35 [43--0.061W/AD. (I-n) - pJ - 0.42 [WAD. (1 -n) - 501 - 0.0023 WAD. [Eq 3](44 - p) - 0.0014 M/A. (34 - t) - 3.4 * 10-8 fdINt + 273t" - %t + 273t)'- f, .h (d -tQ)}
Where tý (mean temperature of outer surfsce of clothed body) is found iteratively from:
td - 35.7 - 0.032 WA/ (I-n) -0.18 Id (3.4 * 104 fd [(t.d +273)' [Eq 4]
-(t, + 273)'] +fdh. (td - t) (C)}
and hk (convective heat transfer coefficient) is determined by:
h- - 2.05 (td - tQO"' for 2.05 (td - taf)> 10.4 (v)"3 (for high air movement env.)
or [Eq 51
10.4 (v)03 for 2.05 (td - tQ)°2s < 10.4 (v)"- (for low air movement env.)
46

Some vdum am smuwal mid need to be imated, such as loth iniulation values mid dicodiS aft faor. Naturally, mom colot ingcreases the respective exterior surface a . Generatingthe PPD values depends on certain asfumptins:
&• - Clothing area factor = 1.1 (summer); 1.15 (winter)- Thermal resistnce of the clothing - 0.5 do (summer); 0.9 do (winter)
M/ADu = Metabolic rate per unit body surface area (Ar. = DuBois area) (kcalu m2) =50 kcalihrm2 for sedentary work
n = External mechanical efficiency of the body =0 for sedentary work.
Evaluation of Thernmil Pranmeta's
Determining these environmental parameters requires that measurements be taken at explicitlocations to property assess the effects on individuals. ASHRAE Standard 55-81R outlines properinstrument type, required measuring range, accuracy, response time, as well as the proper measurementlocation for various types of building structures.
The subjective nature of thermal comfort also lends itself to the use of questionnaire or surveymeasurements as illustrated in the 7-point PMV scale. Much effort has gone into determining properscaling techniques.
Measurement Locations
Obviously, measurements should be made in locations where occupants reside. If the locations havenot been determined, measurements should be taken in locations where the most extreme values of thethermal parameters are predicted to occur. Once locations have been determined, the height or positionabove the floor for measurement are stipulated. These heights vary depending on whether the person isseated or standing, and whether or not there is furniture in the way. ASHRAE Standard 55-8 R. sections7.1.1 and 7.1.2 expand on these subjects. Humidity is considered to be constant throughout the zone sothat the location for measurement of this parameter is not critical.
Measurement Periods
Thermal property measurements must be taken over a period of time. Air speed, temperature cycles,drifts, clothing, and activity, also need to be observed over a certain time period. ASHRAE Standard55-81R, section 7.2 details this subject.
Nonuniformity of Thermal Parameters
Within any room, various thermal characteristics can fluctuate from point to point. Air stratification,windows, uninsulated slabs, air leaks to the exterior, and other factors, can all affect localized thermalconditions. Fluctuating thermal characteristics are tolerable within limits.
Vertical Temperature Differences
Temperature differences within the occupied zone (assumed to be from 4 to 67 in. above the floor)should not exceed 3 0C (5 OF).
47

Radiant Temperature Asymmetry
Radiative temperature asymmetry should nt be more than a 5 °C (9 OF) in the vertical direction.and 10 °C (IS OF) in the horizontal direction. Vertical positions where radiant temperatures are measuredare 0.6 m (2 ft) above the floor for a seated person. and 1.1 m (3.6 ft) for a statming person.
Floor Temperatures
Floor surface temperatures for persons wearing typical footwear should be between 18 OC (65 OF)to 29 OC (84 OF).
Drafts
Drafts affect the body by providing unwanted cooling. The risk of draft depends on the mean airspeed. the air turbulence intensity, and the air temperature. These values are then used to determine thepercentage of people feeling a dratl, which should be less than 15 percent at any point in the occupiedzone. ASHRAE Standard 55-81R, sections 5.1.6.4, Appendix 1, and Figure 5.4, give more informationon this subject.
48

s ImnooR AIR QUALITY
Introduction
Over the put 15 years, a number of circumstances have contributed to a heightened awarenes of
indoor air quality:
1. In the late 1970s, the presence of friable asbestos in public schools became a health concent.
2. Owners of urea-formaldehyde foam-insulated houses often complained of odor and acuteirritating symptoms
3. Hundreds of outbreaks of illness among occupants of new or recently remodeled offices, schools,and other public access buildings were reported.
4. The potential for energy conservation measures to increase levels of indoor air contaminants wasrecognized by governmental authorities who advocated them.
5. Homeowners began seeking alternatives (e.g., kerosene heaters and wood-burning stoves) to theperceived high cost of central heating systems.
6. The environmental nature of allergies and asthma became better understood.
7. It became apparent that radon contamination of residences was not just a problem of uraniummill waste tailings and abandoned phosphate strip mines but a problem affecting millions of homes in theUnited States, Canada, and Northern Europe (Godish 1989, p 1).
Americans spend 68 to 70 of their time at home and 16 to 20 percent at work, or up to 90 percentof the time indoors (Figure 19). Obviously, most of the air we breathe is from indoor sources; exposuretimes for indoor air pollutants is much greater than for outdoor air pollutants. The greater exposure timeis significant since adverse health effects from air pollutants are related to both the concentration of thepollutants and the exposure time.
Indoor air quality is an important consideration in the design, operation, and maintenance ofbuildings. In the workplace, indoor air pollution can increase absenteeism, decrease worker productivity,and invite lawsuits. Building designers and facility managers must therefore have access to timely anduseful information about the relationship between indoor air quality and a building's attributes andoperational parameters. The rest of this chapter reviews the current knowledge of indoor air quality. Thefirst section helps define the area of indoor air quality.
Indoor Air Pollutants
Environmental Tobacco Smoke (ETS)
The chemical constituents found in an atmosphere filled with tobacco smoke are derived from twosources, mainstream and sidestream smoke. Mainstream smoke is what the smoker inhales and sidestreamnsmoke rises directly from the burning tobacco. Sidestream smoke is more important to indoor air qualitysince this smoke contains a much greater concentrton of toxic compounds than is found in mainstreamsmoke. More toxic compounds are produced in sidestream smoke because conditions are favorable for
49

Im-
Horno Work In T"ansi Other kioo Toad Outdoor
Microenvironment
Figure 1•. Time-Activity Patterns by Microenvironment.
the creation of incomplete combustion pro~ducts. Table 3 shows a comparison of vapor-phase andparticulate-phase compounds in sidestream and mainstream smoke.
Health Effects. Particulates released from smoking contribute greatly to the respirable particulateconcentration in indoor air. In smoking areas, the indoor concentration of respirable particulates willalmost always exceed outdoor concentrations and will often exceed outdoor standards. Respirable particlesare those that can be inhaled into the lungs and deposited there. Compounds attached to these particulatesare more likely to cause disease because of the extended contact time with respiratory tissues.
Carbon monoxide in smoking areas only rarely exceeds the U.S. Environmental Protection Agency's(USEPA's) I -hour outdoor standard of 35 pain, but can exceed the S-hour standard of 9 ppm (TFurie 1985,p 74). Studies have shown that carboxyhemoglobin levels can rise from around 1 to 2 percent innonsmoking individuals exposed to smoke-filled envirornments. This reduction in oxygent-carrying capacityis a potential health threat to people with angina pectoris (Turiel 1985, p 75).
The Surgeon General has extensively reviewed the health risks associated with involuntary smoking.Involuntary smoking has been causally linked with lung cancer in healthy nonsmokers and with increasedfrequencies of repiatory infections and respiratory symptoms in children of smoking parents.
Control Mechanisms. Control mechanisms for ETS include:
1. Creaion of separate nonsmokig and smokingars2. Increased ventilation in smoking areas3. Use of air-cleaning devices.
50
000ni nn uun m~• . .

Tad 3
Rlaas. of Suects Gas. mW d i CompommbtIN Sieurm mid Makbirea Tobacco Smoke
Vapor Phme 81MBS Rad Paitkaliste Pbme S/MS Rads
Carbon Monoxide 2.5.4.7 Pariculate Mattr 13-1.9
Carbon dioxide 8-11 Nicotine 2.6-3.3
Denzene" 10 Phenol 1.6-3.0
Acrolein 8-15 2-Naphthylamine" 30
Hydrogen cyanide 0.1-0.25 Benzo---amtrone" 2.0-4.0
Nitrogen oxides 4-10 BnZm--pyrYe" 25-3.5
Hydrazine! 3 N-Nirosdiethanolamine 1.2
N-Nitrosodimethylanne" 20-100 Cadmium 7.2
N-Nitrosopynrolidine 6-30 Nickel* 13-30
"Suspected animal or human carcinogegn.Information source: U.S. Surgeon General, The Hea/th Conequences of InvohudaySmoking, DHHS (CDC) 874-39 (1986).
Volatile Organic Compounds (VOCs)
Because of the recent proliferation in the types and quantities of synthetic organic compounds usedin construction materials, furishings, and consumer products, most indoor air environments contain traceamounts of hundreds of organic compounds. The problem is especially severe in newly constructed,aemodeled, or refumnished buildings where indoor concentrations of some compounds can be hundreds oftimes greater than outdoor concentrations. However, the concentrations of many of the compounds droprapidly as the building ages.
Sources. Table 4 shows examples of organic compound types and potential indoor sources.
Health Effects. Some organic compounds found in indoor air are known or suspected carcinogens,including: benzene, tetrachloroethylene, trichloroethylene, and formaldehyde. In most indoor environ-ments, the concentrations of any particular compound are so low that the risk of cancer is minimal.
Mixtures of organic gases and vapors have also been associated with "sick-building" syndromecomplaints such as headaches, initation of the eyes and mucous membranes, irritation of the respiratorysystem, drowsiness, fatigue, and general malaise. These symptoms occur despite concentrations wellbelow occupational standards. It is believed that these standards may not be appropriate for predictingthese types indoor air quility complaints for three reasons: (1) daily exposure may be greater than thetypical 8-hour work day; (2) susceptible people can become sensitized to certain compounds; and (3)qynergistic interactions among the compounds may occur.
51

Table 4
Sources amd Types of Voklti Ormuodc Compouds Found In I"d= Air
Polutant Type Example Indoor Sources
Aliphatic hydrocarbons Propane. butane, hexane, Cooking and heating fuels, aemrol propellants, des-limonne ning compounds. refrigerats, lubricants, flavoring
agents, perfume ban
Halogenated hydrocarbons Methyl chloroform, meth- Aerosol propellants, fumigants, pesticides, refriger-ylene chloride, PCBs ants, and degreasing, dewaxing. and dry cleaning
solvents
Aromatic hydrocarbons Benzene, toluene, xylenes Paints, varnishes, glues, enmnels. lacquers, cleamn
Alcohols Ethanol, methanol Window cleaners, paints, thinmers, cometica, ad-hesives, human breath
Ketones Acetone Lacquers, varnishes, polish removers, adhesives
Aldehydes Formaldehyde, nonanal Fungicides, germicides, disinfectants, artficial andpermanent-press textiles, paper, particle boards,cosmetics, flavoring agents, etc.
Control Mechanisms. Control mechanisms for organics include:
1. Aging of materials capable of emitting organic compounds before their use2. Increased ventilation of new buildings3. Baking out compounds by raising the structure's temperature and ventilation4. Use of local ventilation near known sources5. Proper use of products that emit organic compounds6. Use of air-cleaning devices.
Formaldehyde
Formaldehyde (HCHO) is a pungent colorless gas. Its odor can be detected as low as 0.05 ppm butmost individuals notice it at a concentration of I ppm. Formaldehyde is often considered separately fromother organic pollutants because of the large number of well publicized cases of adverse health effectsattributable to formaldehyde contamination and because products capable of emitting formaldehyde arefound in many locations in buildings.
Sources. Urea-formaldehyde foam insulation (UFFI) was installed in many locations in the mid tolate 1970s. The Consumer Product Safety Commission received many complaints of adverse health effectsdue to formaldehyde emissions from UFFI and banned its use in 1982. Although the ban was lifted a yearlater, the adverse publicity and fears of liability have virtually eliminated UFFI use.
Urea-formaldehyde (UF) resins are the most common adhesives used in plywood, chipboard, andparticle board. These materials are used widely in building construction. UP resins are also found widelyin carpeting and furnishings.
Health Formaldehyde toxicity is caused by contact with the skin and mucous membranesof the eyes, nose, and throat. Connecting specific health effects to specific concentrations is difficultbecause people vary widely in their responses and complaints. Exposure can cause burning eyes and
52

irritation to upper respiratory passages at concentrations as low as 0.05 ppm in sensitized individuals(Turiel 1985, p 17).
Formaldehyde is also a proven animal carcinogen (Environmental Health Perspectives 1982, pp 139-168). The USEPA has projected an upper bound risk of developing cancer among residents of mobilehomes, exposed for more than 10 years to an average level of 0.10 ppm, to be 2 in 10,000Q for residentsexposed to an average level of 0.07 ppm in some conventional homes the risk is 1 in 10,000 (Hefter etal. 1987).
Control Mechanisms. Control mechanisms for formaldehyde include:
1. Exclusion of UF resin-containing materials2. Alternate resin use in products3. Modification of UP resin to limit formaldehyde release4. Coating UF resin-containing products5. Aging UF resin-containing products6. Dehumidification7. Increased ventilation, especially in new buildings or newly renovated areas.
Biogenic Particles
Biogenic particles are particulate irritants of biological origin. Biogenic particles are contactedthrough the inhalation of the biogenic particle itself or through the inhalation of a particle that containsa biogenic agent. These particles may include bacteria; fungi; viruses; amoebae; algae; pollen grains; plantparts; insect parts and wastes; animal saliva, urine, and dander, human dander, and a variety of organicdusts (Godish 1988, p 53).
Sources. Many pathogenic viruses and bacteria are generated by building occupants themselves.They are most often exhaled from the respiratory system by breathing, coughing, or sneezing. Theseinfectious particles may remain airborne for a long time and in some cases be dispersed through buildingsby the ventilation system. Air recirculation through faulty humidification systems and contaminated airducts have, on occasion, placed individuals at risk to infectious airborne agents. Examples of theseillnesses are Legionnaires disease, humidity fever (allergic alveolitis), and aspergillosis.
A number of allergens can be found in indoor air. Pollen found indoors is primarily produced fromoutdoor plants. Indoor pollen counts are normally lower than outdoor counts. Indoor fungal spore con-centrations are also lower in most buildings than outdoors. However, in buildings where the relativehumidity exceeds 75 percent, molds can flourish, elevating the concentration of fungal spores. Dust mites,which feed on human skin scales, feathers, and fungi, produce an allergenic excreta that can become incor-porated into dust particles. These mites can flourish in climates where the winters are humid and mild.
Health Effects. Airborne microorganisms and allergens can cause allergic respiratory reactions aswell as respiratory infections. Influenza, pneumonia, and other diseases may be spread through infectionby airborne pathogenic bacteria and viruses. Dust, fungus spores, and plant pollen are important factorsin provoking hay fever, asthma. or other allergy-related symptoms.
53

CoMl A4 m.~ Control mechanisms for biogenic particles include:
1. Better maintenance of cooling towers, filters, humidifiers, and air-conditioning systems2. Lowering humidity levels3. Use of air-cleaning systems.
Combunton Products
Nitrogen oxides, carbon monoxide, carbon dioxides, sulfur dioxide, volatile organic caraoncompounds, and particulates are all products of combustion that can adversely effect indoor air quality.Products of combustion are more of a problem for residences because of unvented combustion sources.
oue Unvented gas appliances such as stoves can be a source of nitrogen oxides and carbonmonoxide. Short-tenm indoor concentrations of carbon monoxide due to unvented gas stove use canexceed the I-hour outdoor quality standard of 35 ppm (Sterling and Sterling 1979). Short-term indoorconcentrations of nitrogen oxides can exceed the California outdoor air quality standard of 0.25 ppm(Traynor et al. 1981). Space heaters and fireplaces are other potential sources of the pollutants.
Health Effects. Carbon monoxide's toxicity is related to its ability to interfere with the uptake ofoxygen by blood hemoglobin. Health effects associated with carbon monoxide include: decreased attentionspan, decreased reaction time, headaches, nausea, extreme drowsiness, and ultimately death byasphyxiation. However, indoor concentrations of carbon monoxide are normally well below the thresholdassociated with the onset of these health effects.
Long-term exposure to nitrogen dioxide has been associated with decreased lung function anddisease. Some studies have indicated decreased lung function in children living in households using gasstoves when compared with children living in households with electric stoves (Melia et al. 1982, pp 164-168; Speizer et al. 1980, pp 3-10). Other studies dispute this relationship (Ware et al. 1984, pp 236-374).
Control Mechanisms. Control mechanisms for combustion products include:
1. Local ventilation of gas appliances and space heaters2. Proper maintenance of gas appliances, space heaters, and fireplaces.
Radon
Radon (mRn) is a chemically inert radioactive gas formed during the radioactive decay series ofmU. The radon decay chain is shown in Figure 20. The major health risks associated with radon result
from the alpha decays of the two short-lived progeny, 21%Po and 214Po.
Sources. There are three important ways that radon can enter buildings:
1. Transport from soil through cracks and openings in the structures or around the foundation2. Emanation from earth-derived building materials such as concrete3. Transport in water and natural gas.
Soil is considered to be the major contributor to indoor radon concentrations in most U.S. houses,but some building materials may contain large amounts of radioactive substances.
Health Effects. Indoor radon has been judged to be the most serious environmental carcinogen thatthe USEPA must address for the general public. Based on current EPA exposure and risk estimates, radon
54

I, a (5.5q MeOV)
3.05 min
SI a" MDV26.8 min 19.7 mý 160 WC
I a (7.7 MeV)
19A4 y "
FIgure 20. Radon Decay Chain.
exposure in single-family houses may be a causal factor in roughly 20,000 lung cancer fatalities per year(Puskin and Nelson, 1989, pp 915-919. Most of these projected fatalities are attributable to exposure inhouses with average or moderately elevated radon levels (below 10 pCi/L).
Control Mechanisms. Control mechanisms for radon include:
1. Subfloor ventilation2. Additional ventilation of high concentration areas3. Proper construction to prevent radon entry pathways4. Sealing of radon entry pathways5. Proper building site selection6. Removal of radon containing soil7. Removal of radon from air.
Economic Impacts of Indoor Air Pollution
There is very little data available for estimating the economic impact of indoor air pollution.However, the EPA in its Report to Congress on indoor Air Quality (1989) estimates some of the costsof poor air quality. The EPA report addresses three major types of economic costs:
1. Materials and equipment damage2. Direct medical costs3. Lost productivity.
Other costs not considered are:
1. Other welfare loss associated with pain and suffering due to health effects that are not fullyalleviated by medical treatment
2. The value of unpaid time spent by persons taking care of those whose health is affected in thehome
3. Losses due to reduced ernoyment of recreational and other activities affected by indoor airpollution.
55
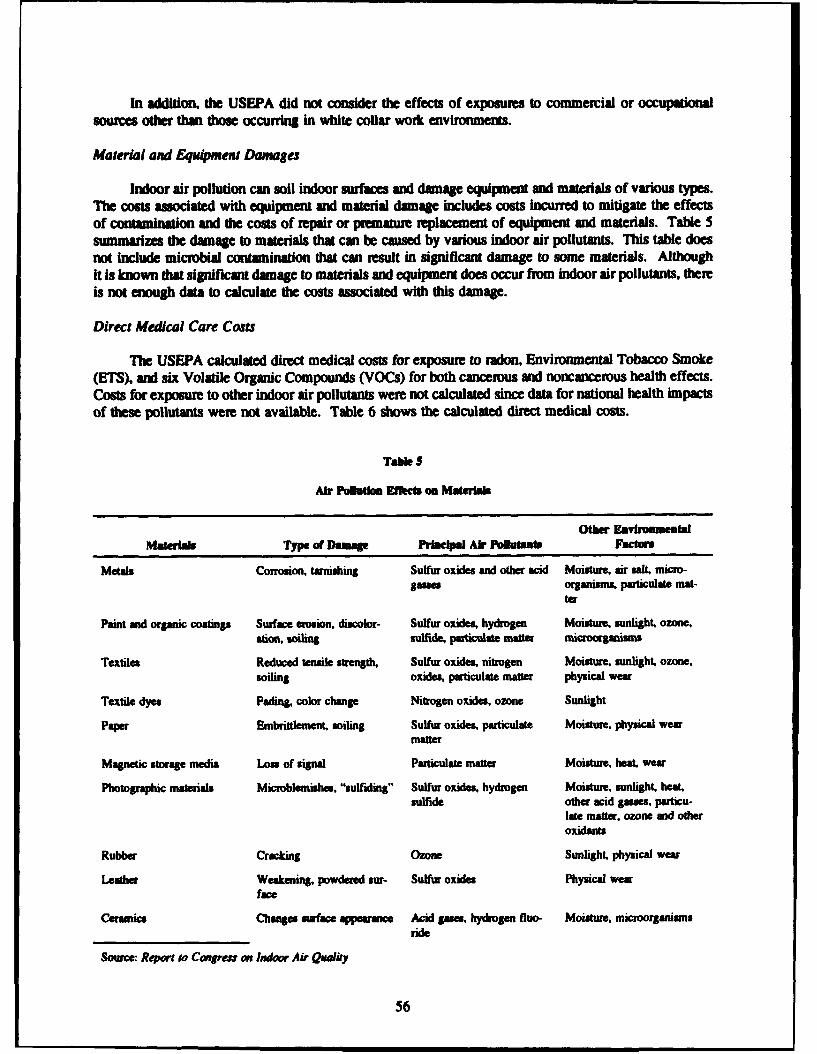
In addition, the USEPA did not consider the effects of exposures to commercial or occupational
sources other than those occurring in white collar work environments.
Material and Equipment Damages
Indoor air pollution can soil Indoor surfaces and damage equipment and materials of various types.The costs associated with equipment and material damage includes costs incurred to mitigate the effectsof contamination and the costs of repair or premature replacement of equipment and materials. Table 5summarizes the damage to materials that can be caused by various indoor air pollutants. This table doesnot include microbial contamination that can result in significant damage to some materials. AlthoughIt is known that significant damage to materials and equipment does occur from indoor air pollutants, thenmis not enough data to calculate the costs associated with this damage.
Direct Medical Care Costs
The USEPA calculated direct medical costs for exposure to radon, Environmental Tobacco Smoke(ETS), and six Volatile Organic Compounds (VOCs) for both cancerous and noncancerous health effects.Costs for exposure to other indoor air pollutants were not calculated since data for national health impactsof these pollutants were not available. Table 6 shows the calculated direct medical costs.
Table s
Air Pohstio Efwects on Materlbs
Other EnvrooamentalMateriffls Typ of DaOmag Prladpal Air Polftuat Factnr
Metals Corrosion, tarnishing Sulfur oxides and other acid Moisture, air salt" micro-games organisms, particulate mat-
ter
Paint mid organic coatings Surface erosion, discolor- Sulfur oxides, hydrogen Moisture, sunlight, ozone.ation. soiling sulfide, particulate matter microrsgmuisms
Textiles Reduced tensile strength, Sulfur oxides, nitrogen Moisture, sunlight, ozone.soiling oxides, particulate matter physical wear
Textile dyes Fading, color change Nitrogen oxides, ozone Sunlight
Paper Embrittlement, soiling Sulfur oxides, particulate Moisture, physical wearmatter
Magnetic storage media Lou of signal Particulate matter Moisture, heat, wear
Photographic materials Micrblemishes, "sulfiding" Sulfur oxides, hydrogen Moisture, sunlight. heat.sulfide other acid gumes, particu-
late matter, ozone and other
oxidants
Rubber Cracking Ozone Sunlight, physical wear
Leather Weakening, powdered sur- Sulfur oxides Physical wearface
Ceramics Changes surface appeaue Acid gum, hydrogen fluo- Moisture, microorganismsride
Source: Report to Congress on Indoor Air Qualky
56

Tabe6
Stmma of AmamE v icotm Comb of Iamdw Air Poftdm (Smniam)
Merial TOmi Cal-Direct Modiral Expeniltu LAWt Pro- and E~qi. cob"e
PaisteSm Canmer Niscaneer duct,,ly Damage Coub .
Rado and radon daughtme $426 NC" $1,991 $2,417
STS $274-385 $447-516 $2,457-2.974 NC $3,178-3,875
Biological contminants NC NC NC NC NC
VOCS
6 VOCa $25-125 NC $93-463 $113-588
Other VOC& NC NC NC NC NC
Asbestos NC NC NC NC
Combustion gases NC NC NC NC NC
Particulate matter NC NC NC NC NC
Unspecified (sick building NC (see text) (see text) (see text)
sydoe)
" Includes only costs associated with those types of cancer and other health effects for which estimates ofnumbers of annual health impairment were calculated in Chapters 3 and 4 of the source document. Theestimated costs shown here are therefore undestated. (Source: USEPA. Report to Congres on Indoor AirQ-).
"NC - Costa not calculated
Prodsctivity Losses
Adverse health effects or general discomfort resulting from indoor air pollution may result in losteconomic productivity, including:
1. Lost productive years due to major illness2. Lost time due to increased number of sick days taken from the job3. Lost productive efficiency on the job.
The USEPA calculated the costs associated with loss of earnings due to major illness for exposureto radon, ETS, and six VOCs (the same categories calculated for direct medical costs). Due to lack ofdata, costs for exposure to other indoor pollutants were not calculated. Table 6 shows the calculated lostproductivity costs for these specific categories.
Lost productivity while on the job and from increased sick days was estimated from a recent surveyof 94 state government nffice buildings in the New England states of Maine and New Hampshire. TheNew England survey sought information on the extent and effect of poor indoor air quality, including thelosses in productivity, the increased number of sick days, and the frequency of doctor visits, attributed byrespondents to poor indoor air quality. The New England survey was not scientifically administered andmay have a significant bias. However, since it was the only survey which provides the necessary
57

information to estimate productivity losses, a number of adjustments and very conservative assumptionsconceming those not receiving or not responding to the survey were incorporated into this analysis.
Data from the New England survey would attribute an average productivity loss of 3 percent to poorindoor air quality. Respondents would also attribute an average of 0.6 added sick days per year to poorindoor air quality. When these results ame applied to the nations white collar labor force, the economiccost to the nation would be on the order of $60 billion annually. While the USEPA does not regard thisas a reliable estimate, it suggests quite strongly that productivity losses may be on the order of tens ofbillions of dollars per year. Tables 7 and 8 show the balance required in expenses to gain a personnelproductivity increase.
Diagnosing Indoor Air Quality Problems
Investigations of indoor air quality are generally initiated in response to a perceived problem withthe indoor air quality, to isolate and mitigate one or more sources of deteriorated air quality believed tobe the cause of health or comfort complaints by the building's occupants. Traditional industrial hygiene
Tabb 7
P.rodctilytt Galins NecsmaryTo Offst Operang com na"m
cod ICSMSm
Knew (%) Total Eavfro.met (%) Oflbettf Prmfedtvy Gab
5% 1.67% 0.0515% 5.00% 0.1525% 833% 0.2550% 16.67% 0.50
Base cost assumption:Energy costs = $2 per sq ft per yrTotal environment c•sts = $6 per aq ft per yr
Table 8
Prodocvity Gains NecemryTo Offat Capital EMpeaditre
Ofrettliag Productiity Ga-insCapil Codt Auadned Cot
(Weq Rt) (S/eq ft) No Chmpe I. Operating Code (%) Operating Cants (%) nmcreae by 15%
1 0.13 0.07 0.225 0.66 033 0.48
10 1.31 0.66 0.8115 1.97 0.99 1.1425 3.29 1.64 1.80s0 6.57 3.29 3.44
Bas cost aOs4apton:Emneg tos - $2 per sq ft per yrAnnualizd costs we capital costs arnitized at 10% over a 15-yr life
58

3mk~a3 IUtwmdom em Enea Ak Qmalty
1. Facilty identification 5. HYAC systemA. Building amansemunber * Enery mum (oiL w.s electric)3. Address o Primar fluids (stwmn. hot irwater)C. Location * Supply (pipe duct, plenum)D. Owner * Distribution (radiaosm ceiling filiers)B. Tenant * Return (pipe duct, plenum)
- Location of heat source2. Contact perwn - Loca~l beating units
A. Facility manager B. CoolingB. HYAC operator * Number and location of chillersC. Maintenance supervisor * Number and description of distribution systemsD. primary client contact * window units
C. Air intake3. Facility description * Location of air intakes)
A. Nature of hnusnessý or activities conducted by. - Means of controlling outside air"* Tenant * Design quantity/paecent outside air"* Other occupants * Open windows
B. Number of occupants vi each space e Open doorC. Activities conducted in or near the fascility. * Local exhauist systems (restrooms, kitchen. labors-
"* Laboratory tory)"* Manufacturing D. Conditioning"* Industrial operations - Humidifiers"* Cafeteria - Dehumidifiers"* Parking garage e Rimgr"* OdWe Chemical use - Air cleanes
D. Time of day/days of week E. Operation of HVAC"* Any employee on duty *Location of thermnostatinftones"* Office employees on duty *Access to thermostats/zones"* Maintenance employees on duty *Dafte thermostats last calibrated"* Facility open for business *Day/night controller (cycle)
E. Consbnaction F. Maintenance of HVAC"* Number of floor - Date system last balanced"* Floor Kea per floor - Schedule for filter change/clean"* Year constructed - Schedule for other cleaning"* Inended use - Schedule for other maintenance"* Major renovations (include date)
F. Furnishings"* Floor coverings"* Wall coverings"* Partiions"* Ceilings
4. NeighborhoodA. Principal use (rural, urban. commercial)B. Proximity to trafficC. Density of traffiD. Neighboring facilities in which traffic, construction, or
chemical wse might be suspected of adversely impactingneighborhood air quality.
Source: Rafferty. PJ.. "A Protocol for Initial Investigations of Indoor Air Quality," Proceed is ofA th 2nd ArW*M~eeting wardExiaikiar, of t'w Air anid Waear Memq~imn Associakm, paper 89-85A (Anaheim, CA. 25-30 June 193).
59

Tab 9 (Called)
6. FaClty saniftenancs B. Dab of symiptomn coatTypicalnd atypical activitiaalpmducis regarding: C. Number of persons qorin the following com
Oo* Claorend indoor use of pesticides Ai"* Painting. staining, wurnishifg - Too hot"* Asbestosato other insulation removal 0 Dredty"* Insulation Too cold"* Now furniture owr q ohyStuffy"* wax stripping *Mold or mildew"* Lesking watr w Tobacco amoke
E lectrical. pkmftn or HYAC repuir or renov- *Dusty
thorn *LIy*New partitions wall covermrgs, floor coverings *Noisy
*Cleaed floor coveing wall covernag or uphol- *odors
amry DarkD. Daeb complaints began
7. Health and comfort Complaints E. Daiy. weekly. or yearly patterns of reportingA. Number and location of p-rsom reporting the syvkmpteniemd complaints
following yMpems: F. Complainant characterization"* Eye irritation a Work location"* Contact lnas irritation 9 Work function"* Noew irritation * Percelntge of towa occpsafts in mar"* Shortness of breath 0 Sea distribution"* flana irritation a Age distribution
" Ne Skin gesittion S. Any other circumnstwices; suspected of adversely"Sking irrpacting indoor air quality of the facility"* Hemlock."* Wheezing"* Nausea"* Chea tightecing"* Diarrhea"* Fatigue,"* Dizines
"* Sick more often then usual
methods that try to compare measure individual air contaminant with thew respective occupationtal healthStandard, often fai. Alternate diagniostic protocols have been developed to deal specifically with thenonspecific symptoms of Sick Building Syndrome (SBS). These protocols typically involve thre Stages:
1. Consultation with building occupants and maintenance personnel2. Qualitative chaacterization of sources and air movements3. Quantitative evaluation of fth HVAC system, potential air contaminants, and environmental
pamees
A propesly conducted investigation of indoor air quality can identify indoo air problems And recommendremedial actions to address building design and operaton difficulties.
60

The reolution of more difficult indoor air quality puoblem often requies the expertise of an indoorair quality specialist. However, the initial investigation of indoor air quality problems should be a lowcost, sem.quaaive analysis that professionals in the fields of HVAC engineering, air pollutione n, or Industrial hygiene can conduct. The initial investigation can solve many indoor air qualityproblems and can provide a more focused direction for more detailed investigations.
Consultation Stage
Table 9 outlines the types of information that should be gathered during the consultative stage ofa preliminary investigation, including a description of the facility, its surrounding neighborhood, theHVAC system, maintenance activities, and health and comfort complaints of the occupants. Aninvestigator acquires most of the information through extensive interviews with one or more individualswho are intimately familiar with the construction, operation, and maintenance of the physical plant.Information on the health and comfort complaints of the occupants can be obtained by interviews or awritten survey.
During interviews, construction documents should be reviewed to identify materials of particularconcern used in the construction of the facility. Floor plans should be marked to identify locations ofreported complaints, suspected emission points, air-handling zones, and HVAC intake and relief points.The distance and direction of potential emission points outside of the building should be indicated.Material safety data sheets should be obtained for all chemical products suspected of being the source ofthe problem. Hypotheses on the cause of the indoor air quality problem are then developed based on theinformation collected during this stage of the investigation.
Qualitative Stage
The next stage of the preliminary investigation should be a qualitative survey of the facility. In thissurvey, all the senses are used to develop a body of data that is used to evaluate the various hypothesesdeveloped during the consultative stage. Evidence of microbial damage and other contaminant sourcescan be seen. Odors are also importn indicators of air pollution problems. The only device that shouldbe used during this survey is a smoke-tube with an aspirator bulb. An investigator uses this device tocharacterize the air movement between the various rooms of the facility. Arrows sketched on a floor plancan indicate air movement patterns from each rom to the next.
Quantitative Stage
The final stage of the preliminary investigation is a quantitative assessment of the HVAC system,some of the more likely air contaminants, and temperature and humidity. The results of this stage incombination with the other stages are used to develop mitigative measures, if possible, for the control ofthe indoor air pollution problem.
HVAC Investization. An investigator should begin the evaluation of the HVAC system byanalyzing the overall ventilation rate. Overall ventilation can be determined directly by measuring theflow through the outside air intake duct. However, the configuration of the intake sometimes makes anaccurate measumement impossible. In these cases, the design ventilation rate can, in theory, be calculatedby reviewing blueprint plans and analyzing fan curves for the system. The design of the HV NC systemshould be considered while making these determinations since the percentage of outside air maj -ry withthe outside temperature or some other control parameter.
An investigator should then determine the effectiveness of local ventilation. This includes both localexhaust ventilation from potential significant sources of indoor air pollution and local ventilation provided
61

by the HVAC system to occupied rooms. Potential significant sources include the laboratory,photographic dauroom, printing shop, and certain graphic arts operations. Local ventilation can bemeasured directly with an anemometer or velocity-measuring hood. However, an investigator should alsonote any potential for short circuiting of ventilation air. This potential exists if the supply and return airgrills are located too close to one another.
Another useful method for determining adequate ventilation is a CO2 concentration survey. IndoorCO2 levels above the background concentration of 325 ppm are primarily the result of human exhalationand are therefore a good indicator of human bioeffiluents and the effectiveness of ventilation to dilutethem. Indoor CO2 levels can be measured with portable CO2 monitors or detector tubes. An investigatorshould collect a large number of samples with respect to occupancy, thermostat controls, HVAC supplyzones, and suspected trouble spots.
Measurement of Indoor Air Pollutants. After the HVAC system has been evaluated, a number oflikely indoor air pollutants can be measured. An investigator should identify which, if any, pollutants tomeasure based on the types of occupant complains and other information developed during thepreliminary investigation. VOCs, CO. and micro-organism levels are all likely air contaminants that canbe semi-quantitatively measured during a preliminary investigation.
Rather than conducting compound-specific measurements of a variety of suspected VOCs, a usefulscreening approach to characterize VOCs emissions is the measurement of total VOC levels. Portablehand-held instruments to measure total VOCs are readily available and relatively inexpensive. Theseinstruments can generally measure concentrations of total VOCs down to I ppm. Mixtures of VOCs atconcentrations as low as I ppm have been associated with decreased concentration levels and mucousmembrane irritation. Therefore a level of I ppm total VOCs is an acceptable indicator for deciding topursue further investigation or mitigation.
Screening for contamination of nonspecific airborne micro-organisms is a controversial subject.Opponents to this practice fear that the method can provide a false sense of security since it can notidentify many agents of airborne microbial contamination (such as Legionella). However, the method canbe used to identify gross bacterial or fungal contamination in certain circumstances, provided thelimitations of the technique are clearly understood. Air samples should be collected at several locationsinside and outside of the facility. For certain media, the concentration of micro-organisms is consideredsignificantly different if values exceed approximately twice the observed background levels.
Interpretation of Results
Interpreting findings of an initial investigation requires considerable professional judgment and somecreativity. The process is frequently an iterative one in that portions of the facility may need to beretested using screening or more sophisticated techniques. Often, several mitigation measures are availableto control a single identified problem. The options generally considered are to remove the source, toisolate and/or ventilate the source, to separnAe receptors from the sources, to enhance the control system,and to clean contaminated surfaces. Enhancing the control system may require a redesign of the HVACsystem, or specific changes in its operation, control, or maintenance.
Source Control
The USEPA has classified source control strategies into four general categories: (1) sourcesubstitution and/or removal; (2) source encapsulation and/or confinement; (3) proper source operation andmaintenance; and (4) source modification (USEPA 1989). Since source control strategies vary depending
62

oni the pdhlu invoved aid the sourc of emisson, thy asn mat esily dicued in die co.ext Ofspecific ccMvamnil problems. Emissions of ETS, organic compounds, bkogni particles, and asbeikare ali potentially import" indoor air pollutants in nf' uidmai buildings that can be reduced by varioussource cxonto techniques.
Environmental Tobacco Smoke (ETS)
ETS source control is limited to removing or confining the somce. ETS can be controlled eitherby banning smoking from the effected building or by providing designated smoking ares apart from thegeneral habitable areas. Designated smoking areas must be depreusurized and vented directly to theoutside to avoid transportation of ETS into other Indoor areas. A recent study has demonstrated thepotential effectiveness of restricting smoking to designated areas (Vaughan and Hamnond 1989). In thisstudy, nicotine vapor (a surrogate for all ElS) was measured at a large number of representative sitesbefore and after implementing a new smoking policy in a modem office building. The new policyrestricted smoking to a snack bar on the 32nd floor and the eastern part of the cafetemia only. Theresearchers concluded from their mesuements that:
1. After the smoking policy was implemented, general employee exposure to nicotine vapor wasreduced by over 95 percent on most floors.
2. Even the highest concentrations in the general office areas (those adjacent to the designatedsmoking areas) were much lower after implementing the policy.
3. Improvement in air quality on the 31st and 32nd floors was not as great as on floors that did notshare an air handling system with a floor containing a designated smoking area. The average level on the31st floor was four times that on the 19th floor.
4. There was evidence that tobacco smoke vapors spilled over into office areas of the 32nd floor,probably through open doors and shared overhead plenums.
5. Under the new policy, the air quality of both the cafeteria and the 32nd floor snack bar wasgenerally poorer. The snack bar was especially contaminated with worst case nicotine levels at least 1800times higher than the typical office area.
Organic Compounds
Formaldehvde. Formaldehyde can be emitted from a wide range of building materials. Productscapable of releasing formaldehyde include wood products bonded with urea-formaldehyde (U-F) resins,urea formaldehyde foam insulation (UFFI), and U-F wood finishes. Formaldehyde is emitted eitherthrough the direct release of loosely bound formaldehyde or through the reaction of U-F resins with watervapor.
Source Substitution/Removal. A seemingly simple way to minimize formaldehyde exposure is byavoiding the use of or removing formaldehyde-releasing products from the indoor environment. However,formaldehyde-releasing products are often less expensive, more durable, and/or more aestheticallyappealing than available substitute products.
Wood products include hardwood plywood, particleboard, and medium density fiberboard. Productsmanufactured from solid wood, gypsum board products, metal, and plastic can be substituted forformaldehyde-releasing wood products. Substitution of particle board used as subflooring is particularlyadvisable because of the high formaldehyde concentration associated with its use.
63

UFFI has become relatively unavailable because of attempts by the Consumer Product SafetyCommission to ban it and the associated bad publicity. Urn is still used as an insulating medium forcertain industrial and commercial applications. However fiberglass, cellulose, and styrofoam-substituteproducts are available for most insulation uses.
U-F-based finishes are widely used in North America on wood cabinetry and furniture. Manyproduct substitutes are available; however, they do not have the scratch and chip resistance of U-F resin-based finishes.
Source Encagsulation/Confinement. Both manufacturers and end users of formaldehyde-emittingproducts can use a number of source encapsulation/confinement techniques to reduce emissions. Manufac-turers apply a number of different coatings to hardwood plywood and particleboard products. The coatingsprevent formaldehyde emissions both by impeding the transport of formaldehyde across the barrier andby impeding the transport of water vapor into the wood product (which hydrolyses the U-F resin). Thesecoatings include varnishes and paints, some of which contain formaldehyde scavenging compounds tofurther reduce emissions. End users of formaldehyde emitting products can apply similar coatings. Arecent study evaluated the effectiveness of some of these coatings applied to particleboard subflooringunder whole house conditions (Godish 1987, pp 221-225). Formaldehyde reductions varied from 17 to87 percent. All surface coatings appeared to provide long-term reductions in formaldehyde levels.
Source Modification. Manufacturers of U-F-based wood products and finishes use a number ofsource modification techniques to reduce formaldehyde emissions. These include:
1. Reducing the formaldehyde-to-urea ratio in resin formulations2. Providing for ideal curing/production conditions3. Adding formaldehyde-scavenging compounds to resins or finishes4. Treating wood products with formaldehyde reactive gases such as ammonia5. Using alternate resin systems when available.
When it is necessary to use U-F-based wood products and finishes, it may be advisable to useproducts manufactured with one or mom of the formaldehyde emission reduction techniques mentionedabove.
Source modification techniques for reducing formaldehyde emissions are also available to buildingoccupants affected by excess formaldehyde emissions, including:
1. Ammonia fumigation2. Climate control3. Product aging.
Ammonia fumigation has been shown to be an effective long-term formaldehyde reduction techniquefor areas with large concentrations of formaldehyde releasing materials such as mobile homes (Jewell1984). A recent study documented surprisingly effective formaldehyde control achieved through theregulation of indoor temperature and relative humidity (RH) (Godish and Rouch 1986, pp 792-797). Forexample, the authors reported that a decrease in temperature and humidity levels from 30 0C and 70percent RH to 20 *C and 30 percent RH reduced formaldehyde concentrations in a mobile home by 80percent. Aging of new formaldehyde-releasing products for several months can dramatically reduceexposures from these materials. Exponential decay in formaldehyde emissions is a widely reportedphenomenon. Formaldehyde emissions tend to decrease rapidly at first and then almost level off incomparison after a few years. However, product aging can never completely halt formaldehyde emissions.
64

Formaldehyde will continue to be released as long as U-F based products are preset. Hydrolysis of U-Fresins and the subsequent release of formaldehyde will continue through the lifetime of the product.
Volatile Ornanic Comoounds (VOCs). Source control techniques can be difficult to employ forVOCs since little information is available on the health effects of specific VOCs or VOC mixtures. VOCsvary widely in number, sources, and concentration. Individual VOCs are difficult to identify and quantify.Control becomes difficult when it is not clear which compound or group of compounds should becontrolled. Even when it is clear which VOC must be controlled, it may be hard to locate a specificsource of VOC contamination. This is especially true when building materials and funishings are thesource of emissions. These items are manufactured using a wide variety of organic solvents, which oftenremain in the product in small amounts where they can become a source of VOC emissions. Because ofthe limited knowledge of the health effects and sources of VOCs, most VOC source control techniquesattempt to reduce the total VOC concentration in indoor air.
Source Substitution/Removal. Avoiding or removing products capable of high VOC emissions isdifficult because of dhe lack of useful emissions data. A number of chamber studies, including a largeeffort sponsored by the USEPA, have reported VOC emissions from potential indoor sources (Molhave1982, p 117; Girman et al. 1984, p 312; Tichenor and Mason 1988, p 264). The results of these studiessometimes conflict and are not directly comparable since the test conditions are not standardized. Thesestudies also tend to report emission characteristics by broad product categories. Emissions for genericproduct names are generally unknown. These characteristics may also vary considerably for a specificproduct type from one manufacturer to another. Simply removing the source can be an effective techniquewhen the offending VOC source can be identified. However finding an acceptable substitute product maybe difficult
Source Modification. Source modification techniques for high VOC emission products takeadvantage of the beneficial aging process observed in these products. A number of studies have shownthat indoor concentrations of many VOCs decline rapidly during the first few months after the building'scompletion (Berglund 1982, pp 11-15; Sheldon et al. 1988 [Vol I HI]).
Table 10 summarizes the VOC results from a USEPA study of public buildings. In this study, thenew hospital, nursing home, and office were completed 34, 4, and 1 week(s), respectively, before the firstVOC-monitoring efforts. Table 10 shows significant declines in the total measured VOCs between trips1 and 2 for the new nursing home and office. However, the hospital did not experience this type of VOCreduction. The authors concluded that the outgassing of VOCs was greatly reduced in the hospital by thetime VOC monitoring began since the monitoring did not begin until 8 months after the buildingscompletion. Table 10 also shows that chlorinated VOCs did not follow the pattern of reducedconcentrations and that the hospital and office building samples showed the highest concentrations. Theseresults indicate that a renewable source for this type of VOC exists in these buildings such asphotocopying or cleaning solvents. However, the aromatic and aliphatic VOCs, which had the highestinitial concentrations in the new nursing home and office, were greatly reduced between trips I and 2.
The observed rapid decrease in VOC emissions suggests some practical source control methods.For a new or newly refurbished work space, it is a good idea to install all building materials and furnish-ings as soon as possible and to forgo occupancy as long as possible. For certain furnishings, such asoffice furniture and carpeting, aging of the materials in a waemhouse before installation can reduce occu-panl exposures. After occupancy, increasing the ventilation rate during the first 6 months may also helpto reduce the likelihood of VOC-related health and comfort complaints during this active VOC outgassingperiod.
65

0~I4A r44
an%
II
W$ Nc -d r-.
~T $i!
12 j 'a 66

Another method for reducing VOC levels in new buildings that takes advantage of VOC productaging is a "bake-out." A bake-out procedure entails increasing the indoor temperature beyond comfortlevels for a period of a few days in an unoccupied, fully furnished building. The elevated temperatureincreases the evaporation rate of residual organic solvents found in building furnishings and materials.Some ventilation is maintained during the period to flush out the VOCs. In effect, a bake-out acceleratesthe aging process on the furnishings and materials.
The California Air Resources Board (CARB) has sponsored studies of the bake-out procedure in anattempt to determine whether bake-outs are practical, and to develop the information needed to conductsuccessful bake-outs (Girman 1987, p 22; Girman 1990). In the most successful of the CARB sponsoredbake-outs, supplemental electric heaters were used since the building was baked-out during a period whenthe outside temperatures were near the minimum design for the heating system. The thermostats weredisconnected and the building temperature was allowed to float tFigure 21 shows the temperature profilesin three locations in the building during the bake-out. To conserve heat, the ventilation was kept to aminimum except during measurement periods when the ventilation was increased to pre-bake-out levels.Figure 22 illustrates the changes in total VOC levels before and after the bake-out One day after thebake-out, the VOC concentration was not significantly lower. This occurred because the building materialsand furnishings were still cooling off from the bake-out. One month later, the total VOCs were reducedto around 5 to 7 percent of the concentrations before the bake-out, apparently larger changes than can beaccounted for simply on the basis of aging. However, it is impossible to estimate the benefits of the bake-out since a control house was not used in this or other bake-out research.
Pesticides. The most important aspect of source -introl for pesticides is proper application.Because most pesticides have a relatively low vapor pressure, indoor air concentrations are generally lowif prescribed application procedures are followed. The semivolatile nature of many pesticides allows skinabsorption to be a potentially significant exposure pathway. Good application practices include: use ofno more than the manufacturer's suggested dosage; application away from HVAC ducts and air intakes;application during nonbusiness hours; and application away from surfaces that may come into contact with
40- 1041 st floor 99
-- 2nd floor- return air 9SY' •' -.• • .... , ". .•plenum
~3O 84
S79
174 C
20 69 0
64
15 - • 590.0 1.0 2.0 3.0 4.0 5.0 6.0 7.0
DAYFigure 21. Temperature Profiles for Three Buildings During Bake-Out.
67

20
5
.. d 10. I I I l.
et FlooW 2d FlooW PlWem Roof
= Pro M POMD =Poet-t
Figure 22. Changes in VOC Levds Before and After Bake-Out.
human skin. The pesticides found in foggers or bug bombs have somewhat higher volatilities than otherpesticides. It is important to keep occupants away from areas where this type of product is used duringthe period of time recommended by the manufacturer. Injection of suspected carcinogenic pesticides, suchas chlordane. underneath concrete slabs-at one time fairly common but now illegal practice-containingventilation supply ducts is especially dangerous.
Diogenic Particles
Control of biogenic particles involves elements of source removal, proper source operation andmaintenance, and source modification. Control measures for biogenic particles are designed to preventor stop bacterial and fungal growths within an indoor environment or its HVAC system. In a recent paperthe following recommendations were made for the prevention of biological contamination (Rask andMorey 1987):
1. Prevent excessive moisture entry into occupied spaces and HVAC system components2. Remove stagnant water and slimes from building mechanical ventilation systems3. Us,, stam as a moisture source in humidifiers4. Eliminate water sprays as components of office building HVAC systems5. Maintain relative humidity below 70 percent6. Use filters with a 50 to 70 percent rated efficiency7. Remove water-damaged material and furnishings8. Provide a fastidious maintenance program for HVAC air-handling and fan coil units.
These eight control methods can be effective in preventing symptoms associated with exposures ofmycotoxins and allergens. However, the prevention of outbreaks of Legionnaires' disease and Pontiac
68

fever requires special considerations. Cooling towers should be well maintained and equipped with effec-tive mist eliminators to prevent the drift of aerosols containing L. pneumophila into HVAC systemcomponents. Biocides have been shown to be largely ineffective in reducing populations of L. pneumo-phfla in cooling towers (Godish 1989, p 161).
Asbestos
As described in an earlier section, friable asbestos-containing material (ACM) has been widely usedas a fire and heat retardant material in a variety of nonesidential buildings. Asbestos-containing buildingmaterials of all types have been banned for use in new construction by the USEPA, so asbestoscontamination should not be a problem in new buildings.
The only permanent asbestos control method is to remove ACM. However, other options that canhelp reduce asbestos fiber exposure include: special building operation and maintenance practices, repair,enclosure, and encapsulation. Asbestos contamination is a very well studied and understood problem.A large body of information on asbestos control has been published by the USEPA (1981, 1985a, 1985b)for general distribution, and by the U.S. Army Construction Engineering Research Laboratories for U.S.Army distribution. Detailed information about asbestos control is available from these sources.
Ventilation Control
A common way to control the quality of indoor air is to use outside air to dilute indoor concen-trations of air pollutants. This approach to indoor air quality relies on a relatively clean outsideatmosphere and mechanisms to exchange air between the inside and outside of a building system and todistribute outdoor air throughout the building. Th following sections discuss indoor air quality controlby general and specific ventilation strategies.
General Ventilation
General ventilation refers to the overall rate of supplying a percentage of outdoor air to a building'sHVAC system. Since ventilation replaces indoor air with outdoor air, this control strategy effectivelydilutes indoor airborne contaminants at a rate dependent on the effective rate of ventilation and outdoorpollutant concentrations.
Ventilation requirements, such as those incorporated in ASHRAE Standard 62-1989 are intendedto control the products of human metabolism and other contaminants under most circumnstances (ASHRAE1989). However, source control, ajr cleaning, and increased ventilation may also be required in thepresence of strong sources. The ASHRAE requirements provide minimum outdoor air ventilation ratesfor specific building types and usage.
Local or Exhaust Ventilation
Local ventilation, also called exhaust ventilation, controls indoor air quality by providing ventilationnear a pollutant source. Local ventilation provides a separate exhaust system for a plume of contaminantsfrom a pollutant source. Local ventilation is widely used to exhaust combustion products and odors fromcooking in cafeterias, and odor from lavatories. In office envirounments, local ventilation may also beapplied to exhaust ammonia from blueprint machines, ozone from office copiers, methanol from spiritduplicators, and acetic acid, formaldehyde, and other vapors from photographic film processing.Considering the noxious gas produced by such equipment and processes, it is ironic that they commonly
69

occupy the most poorly ventilated spaces in the building. Local ventilatior can also be effective for the
control of ETS in designated smoking areas (Bearg and Turner 1987, pp 334-337).
Demand-Induced Ventilation
A sensor may be used to trigger increased outdoor ventilation rates when levels of some specifiedcontaminant reach or exceed a specified level. This technique attempts to balance the need for adequateindoor air quality, thermal comfort, and energy conservation by integrating indoor contaminant andtemperature levels in one control mechanism.
A CO2 sensor has been suggested for use in general office environments (Vaculik 1987, pp 244-25 1). However sensors for other pollutants may also be used, singly or in combination, depending on thecircumstances. In a demonstration of air quality control using this strategy, for example, an office buildingair quality problem caused by a parking structure was corrected, in part, by a CO sensor used to increaseventilation rates when CO levels from the garage reached a preset threshold (Boelter and Monaco 1987,pp 41-46).
Ventilation Efficiency
The extent to which ventilation air reaches the breathing zone of building occupants is termedventilation efficiency. The condition where a portion of the supply air bypasses an occupied zone istermed "short circuiting." Short circuiting prevents a portion of the supply air from diluting and carryingaway indoor air contaminants. Short circuiting is less prevalent when supply outlets are located on thefloor and return outlets are located on the ceiling. However, for economic reasons, supply and return airoutlets are often both located in ceilings. Partitions erected in open office plans can also interrupt the flowof ventilation air.
Air Cleaning
Air cleaning involves the physical or chemical removal of pollutants from the indoor air. Threebasic technologies have been developed: filtration, electrostatic precipitation, and gas or vapor sorption.Air-cleaning devices that use filtration or electrostatic precipitation remove particulate matter from the airwhile devices containing sorbents remove gas or vapor contaminants.
Particulate Matter Control Devices
Particulate matter (dust) is the most common type of indoor air contaminant removed by aircleaning. Dust may contain materials from outdoor sources (flyash, pollen, oil, soot, etc.) or indoorsources (tobacco smoke, fabric lint, fungal spores, bacteria, etc.). Many dust particles can adversely affectoccupant health and comfort directly because of their pathogenic, allergenic, or toxic properties. Dustparticles also can indirectly affect occupant health and comfort. Inhalation of dust particles can providethe means of exposure for microbial agents, condensed organic compounds, and radon progeny tV'Wbecome attached to the dust. The two primary air cleaning methods for indoor dust control are filtrationand electrostatic precipitation.
Filtration. Filters are the most frequently used air-cleaning device for removing dust from indoorair. Filters consist of a mat of fibers oriented perpendicular to the direction of air flow. Filters collectparticles through a combination of complex processes including interception, impaction, diffusion, andelectrostatic deposition. Small dust particles tend to follow streamlines jis air flows around filter fiberelements. Impaction occurs when relatively lhge particles, because of their inertia, cannot follow the
70

streamlines and collide with filter fibers. Interception occurs when particles follow the steamlines aroundfibers but still come in contact with the fibers because of the converging streamlines. Collection bydiffusion occurs when the random Brownian motion of very small particles, usually less than I pm, causethe particles to impinge upon the filter fibers. During the process of electrostatic deposition, particles,which naturally carry a small electrical charge, are attracted to fibers that are oppositely charged. Therelative importance of this collection process in filtration is not well defined.
Filters create an initial resistance to air flow that gradually increases as the filter becomes cloggedwith collected dust. This resistance to air flow can be measured as a static pressure drop across the filter.As the filter becomes clogged and the pressure drop across the filter increases, more energy must besupplied to keep the air flowing at the required rate. Since dirty filters can result in decreased air flowsand increased operating costs, it is important that operators of filtration systems regularly maintain andreplace filters.
Three types of filters are generally available for indoor use: dry, viscous impingement, and chargedmedia filters (Godish 1989, p 253). Any of these may be disposable or renewable panel filters.Renewable filters present a fresh filter surface as needed to maintain an acceptable pressure drop orcleaning efficiency. Filters are primarily used to filter the air in ducts of centralized HVAC systems. Thefilters may be designed to protect the air-handling unit's fan or may be designed to reduce indoorparticulate concentrations. Filters are also used in modular free-standing devices used for local aircleaning of small spaces.
Drv-Tyve Panel Filters. These filters have low collection efficiencies. They are typically used toprotect mechanical equipment in air-handling units and home furnaces, and as prefilters for higherefficiency filters. Dry-type panel filters collect larger particles by impaction and interception. Typicalair velocities range from 200 to 700 ft/min'. Initial pressure drops are low (0.05 to 0.25 in. H20) andfilters are kept in place until pressure drops reach 0.5 to 0.75 in. H 20 (Godish 1989, p 253). Dry panelfilter media may consist of open-cell foams, textile cloth nonwove -, paperlike mats of glass or cellulosefibers, wood fill, etc. (ASHRAE 1988).
Viscous Media Panel Filters, These filters contain coarse fibers coated with an oily substance. Theoil improves the filter's ability to collect large particles such as fabric dust or lint. However, these filtershave a low efficiency for collecting the small particles found in dust. Typical operating velocities rangefrom 300 to 600 ft/min and filter change is required when the pressure drop reaches 0.5 in. H20 (Godish1989, p 2"'ý
Extended Surface Dry-Type Filters. The previously discussed filter types can all be described aslow efficiency for the large fraction of small-size particles found in dust. More efficient filters must havea greater thickness and/or density. However, increasing filter thickness or density significantly increasesthe pressure drop wross a filter for the same flow rate of air through the fiter. The pressure drop problemcan be overcome by increasing the surface area of the filter. In this way, the velocity of the air movingthrough the filter is reduced and pressure drops are lowered to acceptable levels. Pleating the filter mediais a common way of extending the filter's surface area.
Extended media filters are available in a variety of designs and performance levels. The media isusually supported in a panel frame or box. The filter depth may vary from 2 to 36 in. in depth, or evenmore in special applications (ASHRAE 1988). Table I I shows performance and efficiency ratings forvarious types of dry media filters.
"1 ft = 0.305 m; 1 in. = 25.4 mm.
71

Table 11
Puuomase Levek of Dry Medal Fit
Dat Ha WkS
Arrub Dust Spot DOP C&FdtjFiber MediaType (S) EadmCY (%) Md~mqy(s) (WllUO CIRM Con)
Fine open foam and ftxtiledenie noowovem 70-80 15-30 0 130-425
Thin papWelik mats ofglas fiber celluloe 80-90 20-35 0 90-180
Mat of glass fiber,multiy cellulose, wool felt 85-90 25-40 5-10 90-180
Mats of 5- to 10-prm fibers,0.25 to 0.5 in. (6-12 mm) thickness 90-95 40-60 15-25 270-540
Mats of 3- to 5-pm fibers,0.25 to 0.5 in. (6-12 mm) thickneas >95 60-80 34-40 180-450
Mats of I- to 4-jun fibers,mixture of varous fibers >95 80-90 50-55 180-360
Mat of 0.5- to 2.0-pnfibers (glas) NA 90-98 75-90 500-1000
Wet laid ppers of mostly glass fibers.<l-prn diameter (HEPA) NA NA 95-99.999 500-1000
Mnbraw FRlt (Cellulose, acetate,nylon) having holes nlpm in diaeter NA NA -100 NA
Source: ASHRAE 1988, pp 10.1-10.12.
Electronic Air CleaMer. Elecmnic air cleaners use the Same principle of operation as industrialelectrostatic precipitators. Most electronic air cleaners work in two stages- In the first stage, particles inthe air are charged by thin high voltage wires oriented perpendicular to the flow. The high voltage appliedacross the wires produces a corona Bischarge that applies the positive charge to the passing particles. Inthe second stage, negatively chan• .'lates attract the charged particles and collect them (Figure 23).
Electronicair cleaners typically operate at efficiencies well below their theoretical capability. Amajor factor in this less than theoretical operation is "mneakage" of particles through the electronic aircleaner. Sneakage can occur when a portion of the airflow does not pass through an effective chargingor collection area Researchers recently demonstrated dramatic improvements in collection efficiencywhen sneakage through an electronic air cleaner was prevented (Hanley et al. 1960).
Electronic air cleaners have a low resistance to air flow when compared to filters. The smallpressure drops across these devices produce lower fan power requirements and operating costs.Maintenance is limited to cleaning the collection plates. Frequency of cleaning will depend on dustloading. Buildup of material on the collection plate will result in declining collection efficiencies.
72

* . ,,1.• II!*m .,e
* •o a. a 0 I__ __ -.- 1-- - - -- --- --- ,---u---- a
* 0 * g a O I
° O ° ° • j O i - w -- --
• Io o-*i.,*•1
O''S.sd AE! II
a-- ., . .. .Va i ~ 1
OOU
I I- ---------_ I
O O O O2. * n1 A
0 . * * a * *1 * a A V U, A a
* .... *a ..
Performance Testint• for Dust Control Devices. ASHRAE Standard 52-76 describes methods of
testing the performance of particle collection devices (ASHRAE 1976). The ASHRAE testing protocol
describes two measures of performnance: afetac and dust spot efficiency. Arretance is the percentageof a standardized synthetic dust that is removed from an air stream by the collection device. Aastanwe
is a measure of a device's ability to remove relatively large paticles. Dust spot efficiency measure the
ability of a collection device to remove paricles capable of soiling surfaces. This soiling property is
associated with small particles found in dust.
The ASHRAE dust spot method is not intended to rate the performnc of collection devices with
efficiencies grete than 98 percemt For these devices, the di-octyl phthalate (DOP) smoke penetration
method is most often used. This method measures the concentrton of a smoke of essentially uniformDOP prtces before and after the prtle collection device. The paricle diameter is 0.3 pm, with a
cloud density of 80 mg/m' (Godishi 1983, p 265).
Gaseous Conauinant Control Deviac
The principles of abeoximk themud oxidation, cataytic oxidation or reduction, and adsorption ame
all u sed to co n tro l g aseo u s c on ta ini m l em l i m o n fro m in d u str ial p r c s e. O f fth se o n ly th e p rin cip le
73

of adsorption has been widely applied to indoor air cleaning devices. The following discussion focuseson these devices.
Adsomtio Adsorption is the adherence of gases, vapors, or liquids to a solid surface. Theadherence is due to the same physical forces that hold atoms, molecules, and ions together in a solid state.The surfaces of solids exist in a state of unbalanced forces. Residual forces at the surface of a solid havethe potential of holding molecules to the surface of the solid in an attempt to satisfy the unbalancedsurface condition. The solid surface is called the adsorbent, and the substance attracted to the solid surfaceis called the adsorbate. Adsorbents used for gas cleaning typically have very porous structures andtherefore large exposed areas capable of gas sorption.
Two basic types of adsorption are generally recognized: physical adsorption and chemisorption.Physical adsorption occurs as the result of the attractive forces between the molecules of the solid surfaceof the adsorbent and adsorbate. No chemical bond exists between the substances, and the adsorbate canbe removed from the adsorbent in unchanged fonm. Chemisorption, however, is the result of a chemicalinteraction between the adsorbate and adsorbent. The adhesive force is generally much greater than inphysical adsorption, and on desorption, the original substance will often have undergone a chemicalchange. Many cases of adsorption can be classified as purely physical adsorption or chemisorption. Acontinuum exists between the two types of adsorption, and in many cases, both processes occur at thesame time.
Physical Adsorption. Activated carbons are the most commonly used adsorbents for indoor aircleaning. They remove contaminant gases primarily through physical adsorption. Activated carbons differin their structural properties and their performance as adsorbents. In general, the ability of activatedcarbons to adsorb gases and vapors increases with the adsorbate's molecular size and weighL Gases suchas oxygen, nitrogen, carbon monoxide, and methane are not adsorbed at moom temperatures. Somewhatheavier gases such as ethylene, formaldehyde, ammonia, hydrogen chloride, and hydrogen sulfide are onlymoderately adsorbable at room temperature. Higher molecular weight, higher-boiling point vapors (above0 *C) are well adsorbed (Godish 1983, p 284).
Adsorption in a fixed bed of activated carbon does not take place uniformly throughout the bed.A bed of activated carbon will contain a number of adsorption zones. The saturation zone is an areacompletely saturated with adsorbed material. At the edge of the saturation zone begins the adsorptionzone. In the adsorption zone, adsorbate concentrations rapidly decrease as the material is adsorbed. Allthe adsorbate is essentially collected in this zone. At the end of the bed is a zone where little adsorptiontakes place since there is little adsorbate left to collect. The adsorption zone progressively moves alongthe bed with time. When the adsorption zone reaches the end of the bed, breakthrough occurs and thecarbon bed reaches the end of its useful life.
Chemisorption. Physical adsorption is sometimes supplemented by chemisorption. The largeinternal surface area of sorbents can be impregnated with specialized chemicals. These chemicals canselectively react with and retain indoor air pollutants within the sorbent.
Activated carbons and activated alumina are often used to produce chemisorptive media.Impregnating activated carbons with certain chemicals can increase their ability to adsorb specific lightergases such as formaldehyde, hydrogen sulfide, and ethylene. Carbon impregnants include bromine, metaloxides, elemental sulfur, iodine, potassium iodide, and sodium sulfide (Godish 1983, p 292). Activatedalumina impregnated with potassium permanganate (KMnO4) is widely used in air-cleaning systems. Thismaterial is able to effectively remove a number of indoor air contaminant gases and vapors. Thecoaminant are sorbed on the surface of the activated alumina where the KMnO 4 oxidizes them on athin film of water (Turk 1977, pp 329-363).
74

IAQ Modeling
The ultimate goal of IAQ modeling is to predict the exposure of building occupants to indoor aircontaminants. Many modeling techniques must be used to arrive at this prediction. The concentrationof indoor air contaminants is a function of the location of emission sources, the emission rates from thesesources, the dispersion of the contaminant, the removal rate of the contaminant, and the complex flowfields between the sources and human receptors. Personal exposure depends on the concentrations ofcontaminants and the probabilities of individuals being at a particular location and time. Modelingtechniques include Source and Sink Modeling, Flow Field Modeling, and Concentration and ExposureModeling.
75

Crr9D REFERENCES
Archifteille and &Wqmrnsg Insoariomr (AR!) (Hsadqunums, U.S. Army Corp. of Engins;r [HQUSACHJ, Wadsinkion DC.9 December 1991)
AMy Regulaton (AR) 405-70 Utiliuation or Read Fwae (Hemdquares. U.S. Army Corps Of Engineers, Wndaingimn DC. 23Februay 1977, rev. 1991)
ASHRAB. "Air Cleaniers," EqupwN~ HamdboovA (American Society of Heating. Refrgeraton. sad Air Conditioning Enginees[ASHRAEJ. 1988), pp 10.1-10.12.
ASFIRAB. Standardl 52-76. "Method of Teoting Air Cleaning Devices Used in Gener-a Ventilation for Remioving Particulate
Matter (ASHRAB, 1976).
ASHRAE. Standard 62-19319, "Ventilation for Acceptable Indoor Air Quality" (ASHRAE, Atlanta, GA. 1989).
B=rg D.W.. and W.A. Turner, "Achieving Tobacco Smoke-Free Envirounments: T1e Problem and Some Solutions," Procwdingsof she ASHL4E Cooterence, IAQ 87: Practical Control of indoor Air Problems (ASHRAE, Arlington. VA, 1987), pp 334-337.
Berglund, B. at al. "A Longitudinal Study of Air Contaminants in a Newly Built Preschool." Environeunt Invurnatvawl (1988),Vol 8, pp 11-15.
Bookter, F.W.. and B.A. Monaco, "Ventilation Modification in a Parking Structue," Procedinugs of the ASHNAR Coeference IAQ87: Practical Control of Indoor Air Problems (ASHRAE. Arlington, VA. 1987) pp 41-46.
Boyce. P.R.. "Human Factors in Lighting." Applied Scie,,ci (London. 1981), p 305.
Canter, D.A. "priorities in Building Evaluation: Scene Methodological Considerations," Journal of Architectural Research (June1977), p 38.
Daryanmji, S., "Design Comiderations for the Daylighting of Now Commercial Office Buildings." Enaergy and Buildings, Vol 6,No. 2 (1984), p I111.
Ellis, P., -Functional, Aesthetic and Symbolic Aspects of Office Lighting," Behavioral issues in Offic Design (Van NostrandReinhold, New York, 19866) p 243.
Finnegan, M.C., and L. Zene Solomon, "Work Attitudes in Windowed vs Windowless Envirounments," Journal of SocialPsychology, Vol 115 (19811) pp 291-292.
Flynn. John B., "Concepts Beyond the IES Framnework," Lighting Design and Application (January 1973). p 4.
Giran. J., L. Alevantis, G. Kulasingani, M. Petreas, and L. Webber, "Bake-Out of an Office Building." Proceedings of ther 4thIrternationwal Caqftaice on Indoor Aur Quality and Climate, Vol 1 (W. Berlin. Germany, 1987), pp 22.
Girman, J., L. Alevantis. M. Peftrew and L. Weber, "Bake-Out of a Now Office Building To Reduce Volatile OrganicConcentrations," Proceedings of the 82nd Annua Air and Waste Managemen Association Meeting, Paper 89-80.8(Anaheim. CA. 25-30 June 1990).
Girms. J.R.. A.T. Hodgson. A.S. Newton, A.W. Wink.s, "Emissions of Volatile Organic Comnpounds From Adhesives WithIndoor Applications," Environment International. Vol 12 (1934), pp 312.
Godish, T., Indoor Air Pollution Control (Lewis Publishers, Inc., Chelsea, MK 1969), p 1.
Godish, T. at al -Contro of Residential Formaldehyde Levels by Sotuv 1Teatmet,- Proceedings of the Fourth InternationialCworerenc on Indoor Air and Climnate, Vol 3 (Institute for Water, Soil, anid Air Hygiene West Berlin, Germany, 1917,pp 221-225.
Godisim. T., anid J. Roach, "Mitigation of Residential Forma~ldeyde Contamination by indoor Climate Control"- Amnericanindastrial Hygiene Associatin Journal, Vol 47 (1936), pp 792797.
76

CrruD mIFRUNCU (Cnt'i)
Griew, Ni.. "Lighting Dusign: Stab of ibm Art," Archi~ewmae (Ockkoer. 1964), p 66.
Guft. S.K.. "Comfortable Brightness Relationships for Critical and Casual Seeing," Ifwaindarion EnginwariSg Vol 46 (1951).p 65.
Hanley. J.T.. D.D. Smith. PA. Lawless. D.S. Humor, and L.E. Sparks. -A Funadmental Evaluation of an Electronic Air Cleaimer."Proceedings o'f the F#M~ Iivnteranal Cce,.'nce an Indoor Air Quality aid Chinse, Vol 3 (Toronto. Canada. July 1990).
Harms Lotuis, and Associates. Tie QOice Envirownmmu Index (Steelcame Inc., 1989)
Hawkes. D.J.. D.L. Loc. and L. Rowlandes. A Note Towards this Understanding of Lighting Quality, Report to the Illumuinating
Engineerung Research Institule. Now York. Project Number 96-71 (1977).
Heurwagen. J.H.. G.H. Orions. "Adaptions to Windowlessness," Enviromevn, and Behavior, Vol 13. No. 5(19966) p 624.
Heorwagen. J.H.. and D.R. Heewagen. -Lighting and Psychological Comnfort, Lighting and Application (April 1986), p 47.
Hafter. R. at al., Assaesmen ofiHealth Risks to Gormm Warkers an Certain Howni Residents From Erpomire to Frn~aldesyde(USEPA. 1987).
Jewell, RA, Reducing Forinaldehyde Levels =m Mobile Hormos Using 29% Aqueous Aiwuania Treawmen or Heal Exchangers(Weyerhaesuer Corp,. Tacema. WA. 1964).
Kaplin, R.. '7be Role of Nature in an Urban Context," Behavior and the Natural Enrominmmw (Pleiumn Press. New York. 19313).
pp 127-162.
Moans, R.W.. -Evaluating Office Lighting Environments," Lighftin Design and Application (August 1987. P 35.
Me"a R.J.W. et aI, "Childhood Respiratory Illness and dhe Home Environment~ Association Between Respiratory Illes andNitrogen Dioxide. Temperatmre. and Relative Hurmidity." Iternational Journal of Epidemiology. Vol 11 (1932), pp 164-163.
Moiliave. L., "Indoor Air pollution Due to Organic Vapours of Solvents in Building Materials." EJWWroo.w~unternwational. Vol 3(1982). pp 117.
Ne'ewnan, B.. G. Sweitzer, and E. Vine, "Office Worker Respns to Lighting and Daylighting Issues in WorkspaceEnviroments: A Pilot Survey." Energy and Buildings, Vol 6. No. 2(1984). p 160.
Orfield, SJ., "Open Plan Office Lighting: Interactions With Other Performance Variables," Lightin Design and Appli cation (July1987). p 19.
Puskin, J.S.. and C.B. Nelson. "EPA's Perspective on Risks Prom Residential Radon Exposume" he Journal ofshe Air and WagteManagement Associ~ationm. Vol 39, No. 7 (July 1939), pp 915-9 19.
Rask. D.R.. and P.R. Morey. "Strategies for Indoor Air Control of Bimoaesols in Office Buildings," Presented at the 80h AnnuealMeeting cp APCA (New York. 2 1-26 June 1987).
"Report of the Federal Panel on Formaldehyde," Environmenutal Health Perspecives. Vol 43 (1932). pp 139-169.
Report to Congress on Indoor Air Quality (August 1939).
Sheldon. L., H. Zoelon, J. Sickles. C. Eaton and T. Hartwell, Indoor Air Quality in Public Buildings, Volume Al EPA/60/6-B&W%09 (Research Triangle Institute. NC, 1988).
Sheldon. L.S.. R.W. Handy. T.D. Hartwell, R.W. Whitmnore, H.S. Zelon, and E.D. Pellizzari, Indoor Air Quality in PublicBuildings, Volune I, EPA/600M88M00a (Research Triangle Institute Raleigh, NC. 1933).
77

CrrlTD RuRENCiES (CIm'd)
Spsim, F.. at &L, "Respirutory Disease Ran sad Pulmonary Functions in Children Asaociaad With NOi Exposure," AnwricaReview of Respiratory Disease. Vol 121 (1910), pp 3-10.
Sterling, T.D., and E. Steling. "Carbon Monoxide Levels in Kitchens and Homes With Ona Cookem," Air Po//aiom ConrolAssociatiom Jour•n• Vol 29, No. 3 (March 1979).
Tichenor. B.A., M.A. Mason, "Organic Emissions From Consumer Products and Building Materials to the Indoor Enviroment,"Journal of she Air Pollution Control Awociatia, Vol 38 (1988), p 264.
Traynor. G.W. et al, "The Effects of Ventilation of Residential Air Pollution Due to Emissions From a Gus-Pired Range." LBL-12563 (Lawrence Berkeley Laboratory, 1981).
Turiel. L. Indoor Air Quality and Haman Health (Stanford University Press, Stanford, CA, 1935), p 14.
Turk. A. "Adsorption," Air Pollution. Vol IV: Engineering Control ofAir Pollution, 3rd ed. (Academic Press. New York, 1977).pp 329-363.
U.S. Surgeon General, "The Health Consequences of Involuntary Smoking," DHHS (CDC) 87-9398 (1986).
U.S. Environmental Protection Agency (USEPA), Guidance for ControUlig Asbestos-Containing Materials in Buildings. EPA-560/5-85-024 (USEPA. Office of Pesticides & Toxic Substances, Washington. DC, 1985a).
USEPA. Asbestos in Buildings-Guidwsce for Service and Maintenance Personel, EPA-560/15-85-018 (USEPA, Office ofPesticides and Toxic Substances, Washington, DC, 1985b).
USEPA. Report to Congress on Indoor Air Quality, Volume I1: Asaessmien and Control of Indoor Air Pollutior, EPA140011-89/001C (USEPA. August 1989).
USEPA, Guidelines for the Le of Encapsulants on Asbesto-Contabing Materias (USEPA, Office of Pesticides and ToxicSubstances, Washington, DC, 1981).
Vaculik F., "Air Quality Control in Office Buildings by a CO, Method," Proceedings of the ASHRAE Conference 1AQ 87:Practical Control of Indoor Air Problems (Arlington, VA. 1987), pp 244-251.
Vaughan. W.M.,, and S.K. Hammond. "Impact of 'Designated Smoking Area' Policy on Nicotine Vapor and ParticleConcentrations in a Modern Office Building," Proceedings of the 82nd Annual Meeting of the Air and Waste ManagwnentAssociation, paper 89-159.6 (Anaheim California, 25-30 June 1989).
Ware, J.H. et. aL, "Passive Smoking, Gas Cooking, and Respiratory Health of Children Living in Six Cities," American Reviewof Respiratory Disease, Vol 129 (1984), pp 236-374.
Wilson, L.M., "The Effects of Outside Deprivation on a Windowless Intensive Care Unit," Archives of Inernal Medicine. Vol130 (1972), pp 225-226.
UNCITED REFERENCES
American Society of Heating. Refrigeration and Air Conditioning Esigineers [ASHRAEJ, Thermal Environmental Conditions ForHuman Occupancy, Standard 55-1981 (ASHRAE, 1981).
ASHRAE, 1981 ASIHRAE Handbook of Fundaientals (ASHRAE, 1981).
Brill, Michael, Using Of•ce Dejign to Increase Producivity, Vol I (Workplace Design and Productivity, Inc., 1935).
CRSS and Matsushita Electric Works, Officing: Bringing Amenity and neeligence to Knowledge Work (LibroPort Co. Ltd.,1988).
78

,UNCrFF Rx V 3N (Ca W 'an )
Dainoff, Marvi J., umd Marilyn Hecht Dainoff. Peqel aind Productivity, A Mmaner's Guide to Ergenmics irn the Ekictramicffice (Hot, Rinehart & Wimkm, Toronto. 1986).
Ercamon Information Systems AB, Ergonomic Principl, in Office Automation (Ericsso Information Systems AB, Swede..
1983).
Flad Co.. Choesing Beween Open-Ofte and Closed-Office Plans (The Flad Companies, 1989).
Galitz, Wilbert 0., Husman Factors in Oftice AuWmation (Lit. Office Management Association. Inc., 1980).
Galiz. Wilbat 0.. Humaniing Office Auomiation, The Impact of Ergmnomics on Productivity (QED Information Science. Inc.,1984).
Kvileth, Tarald 0., ed-, Egonamics of Workstation Design (Butterworths, London. 1983).
Latirop, David, Senior Consultant, Steelcase Inc., presentation at CDC (12 July 1991).
Lawler, E.E., Mll, and L.W. Porter, "re Effect of Performance on Job Satisfaction," Industrial Relations, No. 7 (1967), pp 20-28.
Lindo, David, "Hidden Costs of Reorganization," Of Systns (November 1991), pp. 14 & 16.
McGuinness William J., and Stein Benjamin, Mechanical and Electrical Equiment for Buildings (John Wiley and Sons Inc.,1971).
Rubin. Arthur, and Gary Gillette, L aideline for Work Station Design (National Institute for Standards and Technology, 1989).
Ryburg, Jon. mad Michael Wodka. "Got Set Now for New Tech's Impact on FM Planning," Facilities Design & Management(April 1990). pp 64-67.
Taubert. Wil, "Balancing Design in Today's Office," Business Interiors (Nov-Dec 1989), pp 1-14.
Tweedy, Donald B.. Office Space Planning and Management (Quorum Books, New York. 1986).
Williams, Cecil. David Armstrong, and Clark Malcolm, The Negotiable Environment, People, White-Collar Work and the OQfce(Facility Management Institute. Ann Arbor. 1985).
Winenan, Jean, ed., Behavioral Issues in Ofice Design (Van Nostrand Reinhold Company, New York. 1986),
Workstation Design for Current Office Envirorunents (American Society of Safety Engineers, 1985).
79

DISTRI"UTION
Chief of Engineers USA Intelligence and Fort Belvoir, VA 22060ATTN: CEHBC-IM-LH (2) Security Command ATMN: CECC-R
ATTN: CEHEC-IM-LP (2) ATTN: EngineerATTN: CERD-L U.S. Army Engineer Distncts
USA Material Command, A'M1N: CENPA-ENU.S. Army Engineer Divisions !nstallation and Srvcs Activity ATTN: CESWA-ED
ATrN: CEHND-ED ATMN: AMXEN-C ATTN: CENAB-ENATMN: CELMV-ED ATTN: CENCB-EDATTN: CESWD-ED USA Material Command ATIN: CENCC-EDATTN: CEMRD-ED ATTh: AMCEN-F ATTN: CESAC-ENATTN: CENAD-EN ATTN: CENCE-EDATTN: CENPD-EN USA Training and Doctrine Cmd AM-: CEEUD-EDATTN: CENED-ED ATMN: ATBO-GFE ATTN: CEPOF-EDAM : CENCD-ED AMTN: CESWF-EDATFN: CEORD-ED USA Japan ATTN: CESWG-EDATIN: CEPOD-ED HQ, U.S. Army, Japan/IX ATTN: CEPOH-EDATT'N: CESAD-EN ATTN: AJEN AKIN: CEORH-EDAKTN: CESPD-ED ATMN: CESAJ-EDAMfN: CETAD-EN USA Pacific Command ATTN: CEPOJ-ED
AMTN: APEN ATTN: CEMRK-EDHeadquarters, DA AMiN: CESWL-EDDeputy Assistant Secrta•ry for USA Community & Family AMFN: CESPL-EDInstalations and Housing Support Center AMTN: CEORL-ED
ATTN: DACF-ZSF ATfN: CELMM-EDHeadquarters, DA ATTN: CESAM-EN
AMiN: DACS-DMA U.S. Forces Korea/Sth U.S. Army AMIN: CEORN-EDSeouL Korea ATTM.- CELMN-ED
Office of the Chief, Army Reserve ATTN: CENAN-ENATTN: DAAR-CM Eighth U.S. Army ATTN: CENAO-EN
AKTN: EAFE-P-MC ATTN: CEMRO-EDHeadquarters. DA ATTN: CENAP-EN
ATTN: NGB-ARI USA Health Services Command AMTN: CEORP-EDATTN: Engineer ATTN: CENPP-EN
Headquarters, AF ATTN: CESPK-EDAMFN: LEED-F USA Troop Support Agency ATTN: CENCR-ED
ATTN: LOTA-EM-F AITN: CESPN-ED.Commander In Chief ATIN: CESAS-ENU.S. Army Europel7th Army US Army Military District ATTN: CENPS-EN
ATTN: AEAEN of Washington ATTN: CELMS-EDAITN: Engineer ATTN: CENCS-ED
Military Traffic Mgmt Command ATTN: CESWT-EDATTN: Engineer USA Topographic Engineering Ctr ATKN: CELMK-ED
AMIN: CEETL ATIN: CENPW-ENUSA Criminai Investigation Cmd ATTN: CESAW-EN
ATTN: Engineer USA Cold Regions Research AMI'N: CENAC-ENand Engineering Laboratory
USA Forces Command ATTN: CECRL Defense Technical Info. Ctr 22304A1TN: AFEN ATTN: DTIC-FAB (2)
USA HL hreys Engineer CenterUSA Information Systems Cmd Support Activity 90
ATTN: AS-ENGR ATTN: CEHEC 10893
7th Signal Command USA Environmental CenterAMTN: ANS-ENGR ATTN: USAEC
USA Center for Public WorksATTN: CECPW-PP
This lbl•iaon was fepnced on eycled [upea. * U.S. GOVERNMENT PRINTING OFFICE: 1994-3510-S/O018