Embed Size (px)
Citation preview
How Anonymous is the Tor Network?A Long-Term Black-Box Investigation
R. Koch, M. Golling and G.D. Rodosek
• This is a post-print of the paper ”How Anonymous is the Tor Network?A Long-Term Black-Box Investigation,“ c© IEEE.
• The paper was published in Computer, Issue 3, March 2016, c© IEEE, as a CoverFeature. Please have a look at the original publication.
• Please use the citation of the original publication:R. Koch , M. Go l l ing and G. D. Rodosek , "How Anonymous I s the Tor Network? A
Long−Term Black−Box Inve s t i g a t i on , " in Computer , vo l . 49 , no . 3 , pp .42−49 , Mar . 2016 .
do i : 10 .1109/MC.2016 . 73keywords : {Communication networks ; Computer hacking ; Computer s e c u r i t y ; IP
networks ; I n t e rn e t ; Privacy ; Relays ; Routing p r o t o c o l s ; Su r v e i l l a n c e ; Tor ;anonymous communication ; de−anonymization ; hackers ; network s e c u r i t y ; networks u r v e i l l a n c e ; networking ; networks ; onion rout ing ; r ou t e r s ; s e c u r i t y } ,
URL: http :// i e e e xp l o r e . i e e e . org /stamp/stamp . j sp ? tp=&arnumber=7433346&isnumber=7433333
• BibTeX:@ARTICLE{7433346 ,author={R. Koch and M. Go l l ing and G. D. Rodosek } ,j ou rna l={Computer } ,t i t l e ={How Anonymous I s the Tor Network? A Long−Term Black−Box Inv e s t i g a t i o n } ,year ={2016} ,volume={49} ,number={3} ,pages={42−49},keywords={Communication networks ; Computer hacking ; Computer s e c u r i t y ; IP
networks ; I n t e rn e t ; Privacy ; Relays ; Routing p r o t o c o l s ; Su r v e i l l a n c e ; Tor ;anonymous communication ; de−anonymization ; hackers ; network s e c u r i t y ; networks u r v e i l l a n c e ; networking ; networks ; onion rout ing ; r ou t e r s ; s e c u r i t y } ,
do i ={10.1109/MC.2016 . 73} ,ISSN={0018−9162} ,month={Mar} ,}
• Please find the article abstract in IEEE Xplore:http://ieeexplore.ieee.org/xpl/articleDetails.jsp?arnumber=7433346&filter%3DAND%28p_IS_Number%3A7433333%29
COMPUTER, MARCH 2016 1
How Anonymous is the Tor Network?A Long-Term Black-Box Investigation
Robert Koch, Mario Golling and Gabi Dreo Rodosek
Abstract—A popular choice for anonymous Internet commu-nication, the Tor network uses entry, relay, and exit nodes tohide the traffic’s origin. However, an investigation that involvedrunning real applications and website requests through Torrevealed numerous agglomerations of exiting traffic that anattacker could exploit.
Index Terms—Communication networks, Computer hacking,Computer security, IP networks, Internet, Privacy, Relays, Rout-ing protocols, Surveillance, Tor, anonymous communication, de-anonymization, hackers, network security, network surveillance,networking, networks, onion routing, routers, security
I. INTRODUCTION
With many countries limiting both freedom of speech andthe press [1], and with privacy concerns being paramount inless restrictive nations, assurances that anonymous Internetcommunication can indeed provide anonymity have becomemore important. At the same time, shadowy activities - such asdrug trafficking through the Silk Road, publicizing classifiedinformation, and planning and coordinating terrorist activitylike the November 2015 Paris attacks—have increased interestin breaking anonymized network communication.
In light of anonymity’s two sides, both individuals andsurveillance organizations are questioning the strength ofpopular communication services such as Tor. Both the USNational Security Agency (NSA) and the UK surveillanceagency Government Communications Headquarters (GCHQ)have initiated efforts to break the Tor network [2]. Multiplehidden Tor services like Silk Road 2.0 were shut downduring Operation Onymous in November 2014, and documentshave recently been disclosed that imply an NSA partnershipwith AT&T and Verizon to conduct Internet communicationsurveillance [3]. These developments have serious implicationsfor the anonymity of Internet communication.
Anonymous communication depends on not identifying theoriginator’s IP address and thus his or her location. In the Tornetwork, traffic is rerouted through several nodes: an entrynode, which sends it to (typically one) relay node, which sendsit to an exit node. The communication’s origin is anonymousbecause the destination sees only the exit node’s IP address.
Tor randomly selects exit nodes to hinder traffic-analysis at-tacks, but because it must minimize communication latency toavoid degrading performance, selection is not equally random,and thus does not produce uniformly distributed exit nodes.
All authors are members of the Research Center CODE (Cyber Defence),Faculty of Computer Science, Universitat der Bundeswehr Munchen, D-85577Neubiberg, GermanyE-mail: [email protected]
Instead, Tor weights the process of selecting exit nodes ac-cording to parameters such as the maximum number of exitingtraffic streams pending. Consequently, the exit nodes actuallyused might be more heavily concentrated in a particular areaor to a particular ISP.
To explore the consequences of this weighted randomselection, we conducted an investigation based on 1.5 yearsof Tor data. Unlike previous Tor research efforts, we treatedthe Tor network as a black box and focused on identifying theinformation types that a large ISP or an intelligence servicecould gather. Our investigative results show a significantimbalance between the number of available exit nodes andthose actually used. Moreover, many of the exit nodes usedeither belong to a small set of ISPs or are concentrated ina small area - characteristics that facilitate the collection ofdata on network traffic as part of a traffic-analysis or profilingattack. Consequently, the effects of exit-node distributionand selection could eventually erode network security andanonymity.
II. HOW TOR WORKS
Tor aims to eliminate the mapping between user and ser-vices or servers by hiding the user’s IP address and therebyblocking user identification and communication tracking. Toaccomplish this, Tor generates an overlay network in whicheach node maintains a Transport Layer Security (TLS) con-nection to every other node [4]. Tor establishes a circuit—arandom pathway through the network—by selecting entry,relay, and exit nodes.
Tor can extend the circuit by adding relay nodes, but acircuit typically has only one relay node so that communi-cation latency remains at an acceptable level. To choose theexit node, Tor uses weighted random selection: it traversesthe connection array and chooses a node to maximize thenumber of pending exit streams, optionally applying the exitnode’s required capacity and uptime as selection parameters.Section 5.3 of the Tor specification has more details (https://gitweb.torproject.org/torspec.git/tree/tor-spec.txt).
To avoid delays, Tor builds circuits preemptively and reg-ularly as defined by the NewCircuitPeriod parameter,which defaults to every 30 seconds. Multiple TCP connectionscan share a Tor circuit. When an application sends a request tothe Tor network, Tor attaches a new stream to an appropriateopen circuit; if no existing circuit can handle the request, Torlaunches a new one.
To avoid profiling attacks, Tor rotates used circuits regularlyaccording to the MaxCircuitDirtiness parameter, which

COMPUTER, MARCH 2016 2
TABLE I: Distribution of exit nodes in select countries from November 2013 to May 2015.
AVAILABLE EXIT NO. OF TIMES SHARE OF ALL TRAFFICCOUNTRY NO. OF AVAILABLE EXIT NODES NODES (%) EXIT NODES WERE USED EXITING THE TOR NETWORK (%)Romania (RO) 42 1.67 893,728 7.15Suisse (CH) 70 2.78 1,078,683 8.63Russia (RU) 289 11.50 146,565 1.17Netherlands (NL) 237 9.43 1,651,242 13.20France (FR) 199 7.92 890,229 7.12Germany (DE) 302 12.01 1,806,412 14.44United States (US) 510 20.29 2,582,072 20.65
Fig. 1: Heat map of Tor exit-node use by country during three weeks of the investigation. Along the x-axis are countriesordered by number of Tor nodes in that country. Along the y-axis, country order is based on the nodes’ cumulative data rate.Exit-node use is the number of times that Tor chose one of the country’s nodes as an exit node. Dominant countries areoverrepresented—their exit-node use is intense (yellow) and above average (orange). Weak countries (dark purple crosses) areunderrepresented—their exit-node use is below average. The inset shows the ideal heat distribution, in which exit-node use ismore intense overall.
defaults to every 10 minutes. Persistent single TCP streams,such as Internet Relay Chat (IRC) protocol connections, arenot rotated and will remain on the same circuit indefinitelyto counter profiling attacks (www.torproject.org/docs/faq.html.en#ChangePaths).
When sending data through Tor, the client encrypts it multi-ple times with the nodes’ keys, including the predecessor’s andsuccessor’s addresses for their respective nodes. Each node hasthe key only for one layer, uses the key to remove that layer,and then forwards the data. In this way, it sees only the IPaddress of where the packet came from and where it has to go.The exit node sends the packet to its final destination, whichsees only the exit node’s IP address. When the answer returns,each node adds its encryption layer and only the sender canfinally remove them all and thus read the answer. This processis similar to peeling an onion (hence Tor’s original name, The
Onion Router).
III. ANALYZING EXIT-NODE SELECTION AND USE
To identify possible traffic-analysis and profiling attacks thatexploit the selection and use of Tor exit nodes, we generatedautomated website requests and collected data about the exitnodes used and their characteristics from November 2013to May 2015 (1.5 years). Our main goal was to determinethe decrease in anonymity directly attributable to exit-nodedistribution and use.
We used the anonymizing relay monitor (arm; www.atagar.com/arm) to extract the IP addresses of used exit nodes andIPInfoDB - a combination of database and webservice thatallows users to access IP geolocation information -to geolocatethem by city. We used nslookup and dig to collect additionalavailable information, such as DNS data, and whois to identifythe ISPs that provided the IP addresses.
COMPUTER, MARCH 2016 3
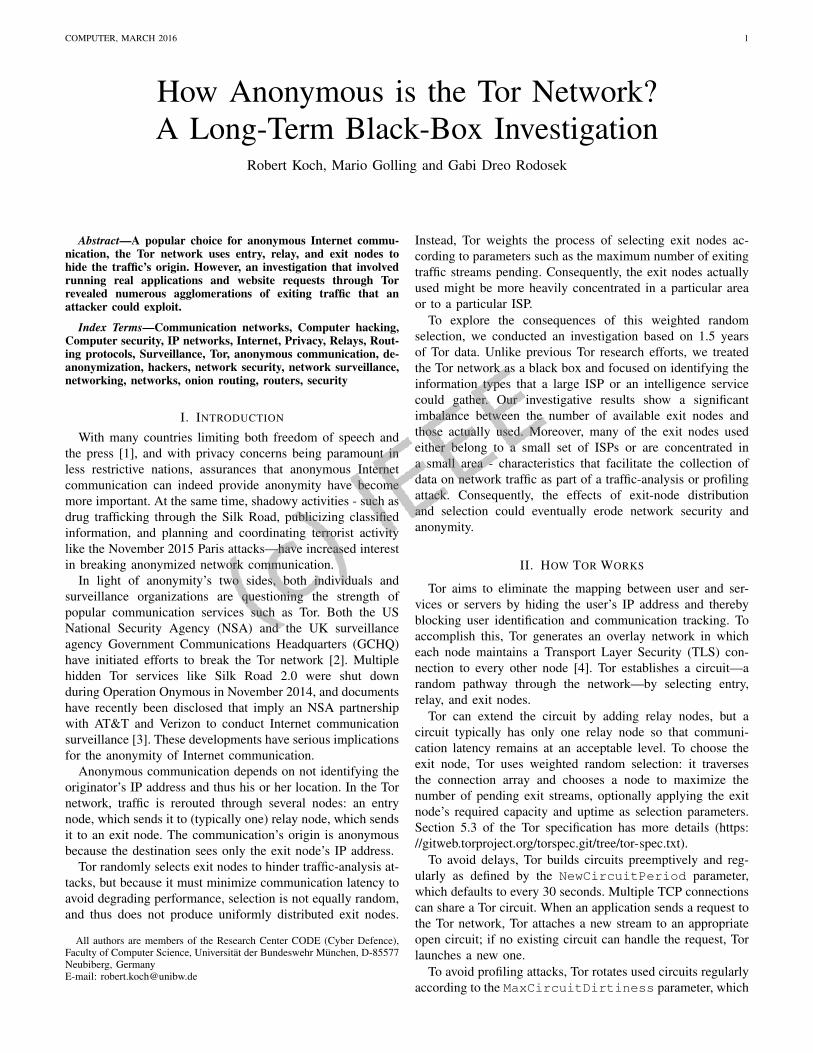
TABLE II: Exit-node distribution corresponding to Figure 1, actual exit-node use, and optimal exit-node use.
OPTIMAL USECOUNTRY’S SHARE OF ALL COUNTRY’S EXIT NODE USE OF CIRCUITS EXITING OF CIRCUITS EXITING AGGREGATED
COUNTRY available exit nodes (%) share that was used (%) within the country (%) within the country (%) % exits (%)Liberia (LR) 0.27 100 2.79 0.02 3.34Luxembourg (LU) 2.13 38.10 3.13 0.31 3.71Singapore (SG) 0.27 1.64 0.04 0.90 0.04Romania (RO) 3.47 19.70 6.69 0.97 8.15Switzerland (CH) 3.73 10.45 8.67 1.97 10.54Russia (RU) 3.73 4.46 0.74 4.62 0.83Netherlands (NL) 12.53 9.69 15.63 7.13 18.29France (FR) 15.2 8.93 17.64 9.38 6.77Germany (DE) 8.53 2.22 14.16 21.21 16.34United States (US) 24.0 5.53 12.07 23.92 13.60
To collect the data, we used Python and Bash scripts to setup parallel threads, each of which used a local configurationfile and port to initialize its own Tor instance. A wrapperfunction in the script used wget to retrieve websites fromestablished Tor network circuits. We then analyzed the exitnodes’ IP addresses.
Because each circuit is used for 10 minutes and not rotatedafter each access, an exit node’s IP address could be recordedmultiple times, and the same exit node might be repeatedlyselected. We deliberately allowed this to mimic real systemand user behavior when the Tor browser is used to surf theWeb. However, in our results, we count a used exit node’s IPaddress only once; if numerous connections run over the samecircuit and the exit IP address is counted multiple times, welabel those ”aggregated exits.“
A. Global patterns
We began our investigation by identifying each country’srole as a provider of Tor exit nodes during the 1.5 years,finding that 2,514 Tor exit nodes were used with more than12.5 million aggregated exits. The recorded number of nodesis higher than the actual average number of Tor exit nodesbecause new nodes joined the Tor network during our obser-vations, and others that we had counted were subsequentlydisabled.
As Table I shows, our investigation revealed some surpris-ing imbalances in the degree to which countries used exitnodes. The US dominates the Tor network, hosting morethan 20 percent of all Tor nodes; the percentage of usedexit nodes is also 20 percent. Germany (DE) and France(FR) had similar percentages in the two categories. However,the percentages differ significantly for other countries. Russia(RU), for example, had nearly 12 percent of the available exitnodes (the seventh highest cumulative exit-node data rate),but only 1.17 percent of the connections ran over Russian Torexit nodes. Consequently, Russia ended up being considerablyunderrepresented in the number of country-specific exit nodesused.
Because exit-node selection is weighted to favor nodes withhigher capacity and data rate, it is natural to assume that acountry’s Internet data rate would heavily influence its exit-node use. However, our investigation showed many exceptionsto that assumption. Sweden (SE), for example, provided veryfast connections with an average speed of 16.1 Mbps, whichwas not reflected in that country’s actual exit-node use. On the
other hand, Liberia’s (LR’s) broadband connections are stillbelow global average, yet we found an intense use of its singleexit node. Countries like Luxembourg (LU) also had higherthan expected exit-node use relative to their average Internetdata rate, number of exit nodes, and exit-node cumulative datarate.
Although it might be tempting to attribute differences inexit-node use among countries to variations in the exit nodes’bandwidth, we found evidence of major deviations. To bettervisualize and understand deviations from logical assumptionsand the findings of previous work, we generated a series ofheat maps, such as that in Figure 1. Each map shows thedistribution of exit nodes according to their number and use byapplications exiting the Tor network during three weeks of ourinvestigation period. We opted for a reduced dataset becausedisplaying data for the entire 1.5 years would hide importantdetails, such as nodes that were in the network for only a shorttime. Exit nodes regularly leave and join the network, and evena single node can severely affect the entire network. Liberia,for example, supported only one exit node during the threeweeks, but that node was important enough to earn Liberia adominant country ranking.
Moving from right to left along Figure 1’s x-axis, duringthe three weeks portrayed, the US had the most Tor nodes(1,627), followed by Germany, France, the Netherlands (NL),Great Britain (GB), and Russia. However, the number of Tornodes did not always determine a country’s dominance inexit-node use. Liberia, the penultimate country in number ofTor nodes, had far fewer nodes than Norway (NO) at 56or Denmark (DK) at 61, yet its capacity was higher thanthe cumulative node capacity in either of those countries.Thus, in terms of node capacity and the weighting in Tor’salgorithm for selecting exit nodes, Liberia was one of thedominant countries—routing 3.34 percent of all applicationexits, according to these parameters.
The map also shows that countries like Luxembourg andRomania (RO) had intense use, while countries like Russia,which had the sixth highest number of exit nodes, are under-represented.
B. Use by country versus optimal use
Table II shows the statistics we used to determine a coun-try’s expected average exit-node use. Circuit use clearly showswhy particular countries were overrepresented or underrepre-sented. Exit nodes are always just that - exit nodes - but circuits
COMPUTER, MARCH 2016 4
0
20
40
60
80
100
LR LU CH RU NL FR DE US
Per
cen
tag
e
Country
Exit Node Application per Country
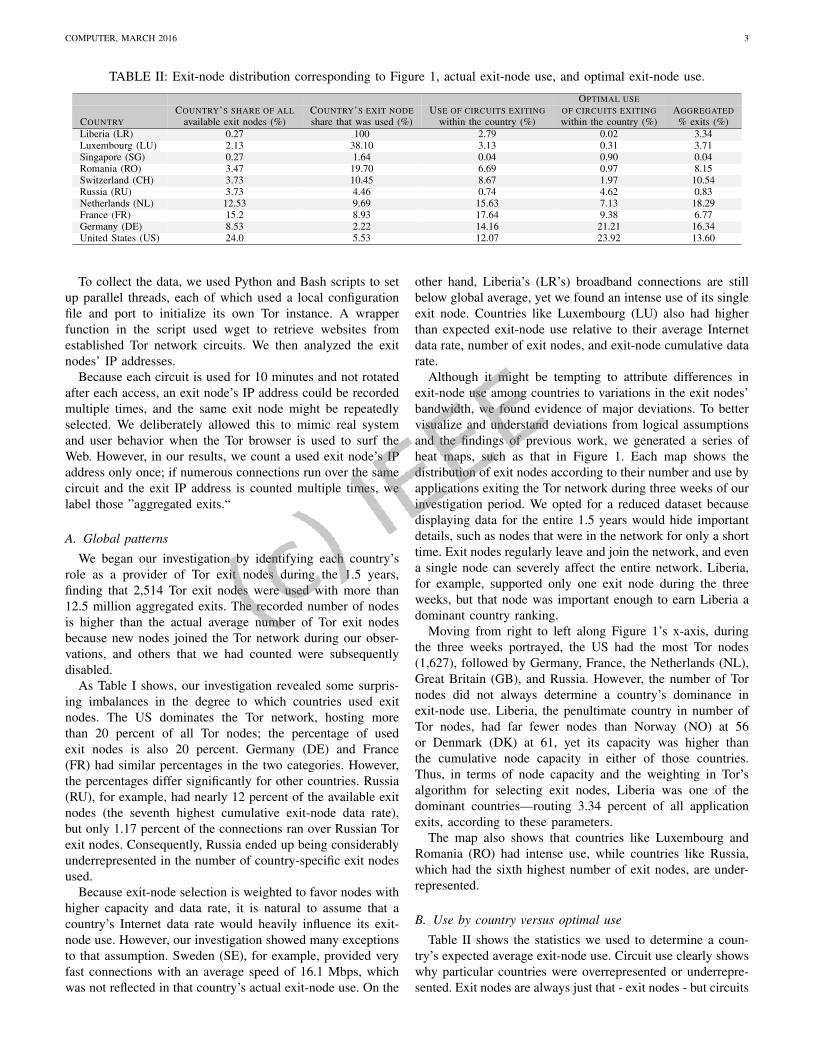
Fig. 2: Exit-node use per country relative to available exitnodes based on three weeks of data. Each bar shows the ratioof available Tor nodes (red) to nodes that Tor configured asexit nodes in that country (green) to used exit nodes, or onesthat Tor selected (blue). Nearly a quarter of all nodes werelocated in the US, but Tor selected only 5.53 percent of these(blue section of US bar). Likewise, 8.53 percent of all exitnodes were located in Germany (green section of DE bar),but Tor selected only 2.22 percent of these (blue section ofDE bar).
represent the path through the Tor network, which Tor buildsby applying weighted random selection. Consequently, someexit nodes are practically never used, while others are usedrepeatedly.
In column 5 of Table II, the calculated optimal share isnot necessarily optimal in Tor’s weighted selection becausethe calculated share does not take the exit nodes’ data ratesinto account. On the other hand, some organizations havesophisticated surveillance capabilities, so the broadest possibleexit distribution would minimize observable traffic and hampertraffic-analysis attacks. Relative to a uniform distribution,actual circuit use (column 4 of Table II) in certain countrieswas considerably higher: 186 times in Liberia, 10.13 timesin Luxembourg, 6.9 times in Romania, and 4.4 times inSwitzerland (CH).
In contrast, the US - even with its considerable broadbandcapability - used only 0.5 times its optimal share - andGermany, with the second highest optimal share, used only0.67 times. France was an interesting isolated case. Of allcircuits constructed, 17.64 percent had exit nodes in France,which was 1.88 times its optimal share (9.38 percent), but itsnumber of aggregated exits was quite low: only 6.77 percentof all application exits ran through French exit nodes. No othercountry demonstrated this behavior; typically, the number ofaggregated exits was higher than the number of used circuits.
These unusual results led us to investigate how circuit sta-bility relates to exit location. We subsequently determined thatcircuits ending in countries like Germany and the Netherlandswere quite stable, typically running until they reached theMaxCircuitDirtiness value (10 min). However, circuitsending in France often showed an increased number of timed-
out connections as well as early drops. On average, the circuit-use time in France was only about 7.5 min.
We found other imbalances in exit-node use per country.Countries like the US, France, and Germany provide numerousexit nodes, so theoretically exit-node use should be high.However, as Figure 2 shows, these countries actually used onlya fraction of their available exit nodes.
A balanced distribution would reduce the risk of a traffic-analysis attack, in which every node is configured and used asan exit node, spreading the distribution and hampering networkmonitoring. The tradeoff is performance, because numerousnodes with low data rates must be used regularly, which slowsTor network traffic.
Moreover, configuring every available Tor node as an exitnode is ideal for a country with many available Tor nodes,but some countries, such as Liberia, have only one or several,which greatly increases the risk of traffic monitoring. However,countries with a high number of Tor nodes could do more toeven out their exit-node distribution. Germany, for example,has numerous Tor nodes (red in Figure 2) but only a smallpercentage is configured as exit nodes (green). Even moredisconcerting is the fraction of exit nodes actually used (blue).
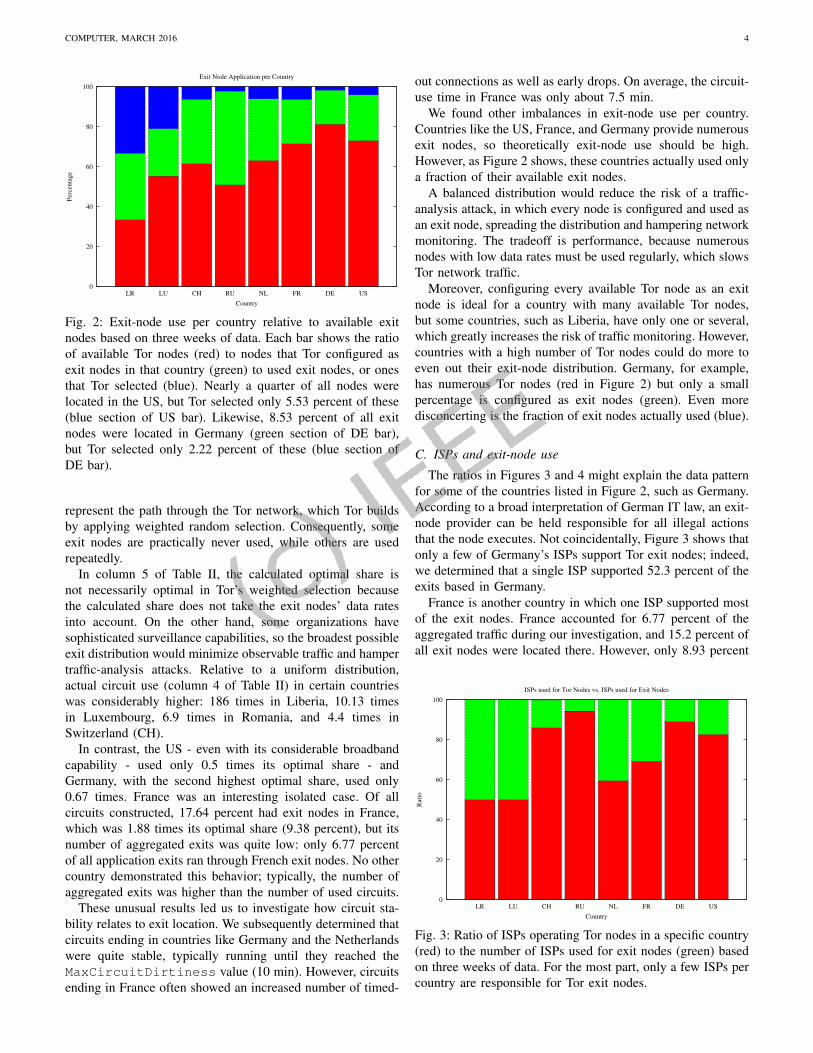
C. ISPs and exit-node use
The ratios in Figures 3 and 4 might explain the data patternfor some of the countries listed in Figure 2, such as Germany.According to a broad interpretation of German IT law, an exit-node provider can be held responsible for all illegal actionsthat the node executes. Not coincidentally, Figure 3 shows thatonly a few of Germany’s ISPs support Tor exit nodes; indeed,we determined that a single ISP supported 52.3 percent of theexits based in Germany.
France is another country in which one ISP supported mostof the exit nodes. France accounted for 6.77 percent of theaggregated traffic during our investigation, and 15.2 percent ofall exit nodes were located there. However, only 8.93 percent
0
20
40
60
80
100
LR LU CH RU NL FR DE US
Rat
io
Country
ISPs used for Tor Nodes vs. ISPs used for Exit Nodes
Fig. 3: Ratio of ISPs operating Tor nodes in a specific country(red) to the number of ISPs used for exit nodes (green) basedon three weeks of data. For the most part, only a few ISPs percountry are responsible for Tor exit nodes.
COMPUTER, MARCH 2016 5
0
20
40
60
80
100
LR LU CH RU NL FR DE US
Rat
io
Country
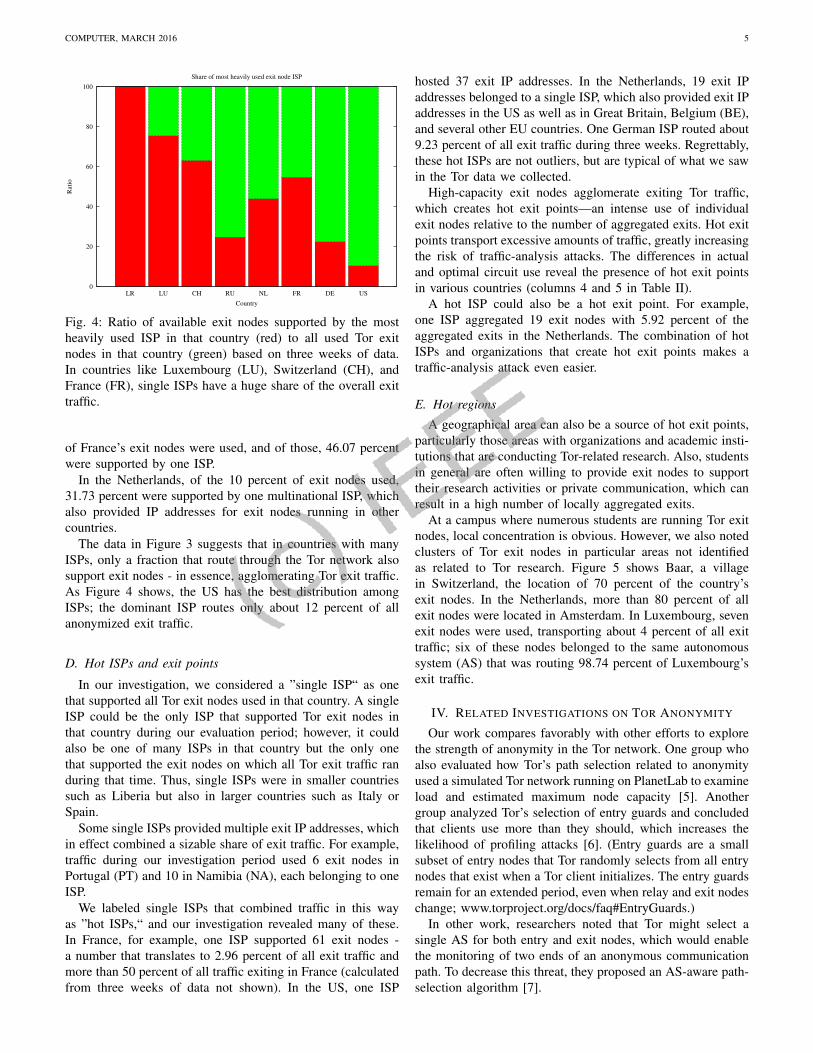
Share of most heavily used exit node ISP
Fig. 4: Ratio of available exit nodes supported by the mostheavily used ISP in that country (red) to all used Tor exitnodes in that country (green) based on three weeks of data.In countries like Luxembourg (LU), Switzerland (CH), andFrance (FR), single ISPs have a huge share of the overall exittraffic.
of France’s exit nodes were used, and of those, 46.07 percentwere supported by one ISP.
In the Netherlands, of the 10 percent of exit nodes used,31.73 percent were supported by one multinational ISP, whichalso provided IP addresses for exit nodes running in othercountries.
The data in Figure 3 suggests that in countries with manyISPs, only a fraction that route through the Tor network alsosupport exit nodes - in essence, agglomerating Tor exit traffic.As Figure 4 shows, the US has the best distribution amongISPs; the dominant ISP routes only about 12 percent of allanonymized exit traffic.
D. Hot ISPs and exit points
In our investigation, we considered a ”single ISP“ as onethat supported all Tor exit nodes used in that country. A singleISP could be the only ISP that supported Tor exit nodes inthat country during our evaluation period; however, it couldalso be one of many ISPs in that country but the only onethat supported the exit nodes on which all Tor exit traffic randuring that time. Thus, single ISPs were in smaller countriessuch as Liberia but also in larger countries such as Italy orSpain.
Some single ISPs provided multiple exit IP addresses, whichin effect combined a sizable share of exit traffic. For example,traffic during our investigation period used 6 exit nodes inPortugal (PT) and 10 in Namibia (NA), each belonging to oneISP.
We labeled single ISPs that combined traffic in this wayas ”hot ISPs,“ and our investigation revealed many of these.In France, for example, one ISP supported 61 exit nodes -a number that translates to 2.96 percent of all exit traffic andmore than 50 percent of all traffic exiting in France (calculatedfrom three weeks of data not shown). In the US, one ISP
hosted 37 exit IP addresses. In the Netherlands, 19 exit IPaddresses belonged to a single ISP, which also provided exit IPaddresses in the US as well as in Great Britain, Belgium (BE),and several other EU countries. One German ISP routed about9.23 percent of all exit traffic during three weeks. Regrettably,these hot ISPs are not outliers, but are typical of what we sawin the Tor data we collected.
High-capacity exit nodes agglomerate exiting Tor traffic,which creates hot exit points—an intense use of individualexit nodes relative to the number of aggregated exits. Hot exitpoints transport excessive amounts of traffic, greatly increasingthe risk of traffic-analysis attacks. The differences in actualand optimal circuit use reveal the presence of hot exit pointsin various countries (columns 4 and 5 in Table II).
A hot ISP could also be a hot exit point. For example,one ISP aggregated 19 exit nodes with 5.92 percent of theaggregated exits in the Netherlands. The combination of hotISPs and organizations that create hot exit points makes atraffic-analysis attack even easier.
E. Hot regions
A geographical area can also be a source of hot exit points,particularly those areas with organizations and academic insti-tutions that are conducting Tor-related research. Also, studentsin general are often willing to provide exit nodes to supporttheir research activities or private communication, which canresult in a high number of locally aggregated exits.
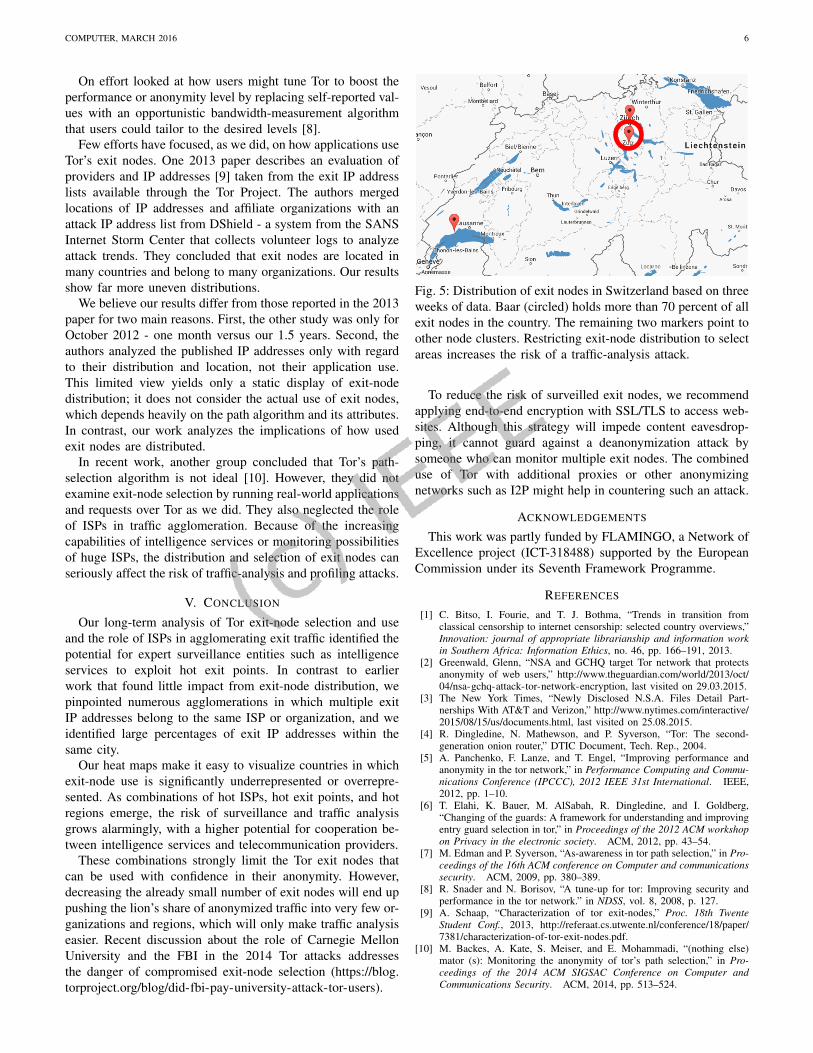
At a campus where numerous students are running Tor exitnodes, local concentration is obvious. However, we also notedclusters of Tor exit nodes in particular areas not identifiedas related to Tor research. Figure 5 shows Baar, a villagein Switzerland, the location of 70 percent of the country’sexit nodes. In the Netherlands, more than 80 percent of allexit nodes were located in Amsterdam. In Luxembourg, sevenexit nodes were used, transporting about 4 percent of all exittraffic; six of these nodes belonged to the same autonomoussystem (AS) that was routing 98.74 percent of Luxembourg’sexit traffic.
IV. RELATED INVESTIGATIONS ON TOR ANONYMITY
Our work compares favorably with other efforts to explorethe strength of anonymity in the Tor network. One group whoalso evaluated how Tor’s path selection related to anonymityused a simulated Tor network running on PlanetLab to examineload and estimated maximum node capacity [5]. Anothergroup analyzed Tor’s selection of entry guards and concludedthat clients use more than they should, which increases thelikelihood of profiling attacks [6]. (Entry guards are a smallsubset of entry nodes that Tor randomly selects from all entrynodes that exist when a Tor client initializes. The entry guardsremain for an extended period, even when relay and exit nodeschange; www.torproject.org/docs/faq#EntryGuards.)
In other work, researchers noted that Tor might select asingle AS for both entry and exit nodes, which would enablethe monitoring of two ends of an anonymous communicationpath. To decrease this threat, they proposed an AS-aware path-selection algorithm [7].
COMPUTER, MARCH 2016 6
On effort looked at how users might tune Tor to boost theperformance or anonymity level by replacing self-reported val-ues with an opportunistic bandwidth-measurement algorithmthat users could tailor to the desired levels [8].
Few efforts have focused, as we did, on how applications useTor’s exit nodes. One 2013 paper describes an evaluation ofproviders and IP addresses [9] taken from the exit IP addresslists available through the Tor Project. The authors mergedlocations of IP addresses and affiliate organizations with anattack IP address list from DShield - a system from the SANSInternet Storm Center that collects volunteer logs to analyzeattack trends. They concluded that exit nodes are located inmany countries and belong to many organizations. Our resultsshow far more uneven distributions.
We believe our results differ from those reported in the 2013paper for two main reasons. First, the other study was only forOctober 2012 - one month versus our 1.5 years. Second, theauthors analyzed the published IP addresses only with regardto their distribution and location, not their application use.This limited view yields only a static display of exit-nodedistribution; it does not consider the actual use of exit nodes,which depends heavily on the path algorithm and its attributes.In contrast, our work analyzes the implications of how usedexit nodes are distributed.
In recent work, another group concluded that Tor’s path-selection algorithm is not ideal [10]. However, they did notexamine exit-node selection by running real-world applicationsand requests over Tor as we did. They also neglected the roleof ISPs in traffic agglomeration. Because of the increasingcapabilities of intelligence services or monitoring possibilitiesof huge ISPs, the distribution and selection of exit nodes canseriously affect the risk of traffic-analysis and profiling attacks.
V. CONCLUSION
Our long-term analysis of Tor exit-node selection and useand the role of ISPs in agglomerating exit traffic identified thepotential for expert surveillance entities such as intelligenceservices to exploit hot exit points. In contrast to earlierwork that found little impact from exit-node distribution, wepinpointed numerous agglomerations in which multiple exitIP addresses belong to the same ISP or organization, and weidentified large percentages of exit IP addresses within thesame city.
Our heat maps make it easy to visualize countries in whichexit-node use is significantly underrepresented or overrepre-sented. As combinations of hot ISPs, hot exit points, and hotregions emerge, the risk of surveillance and traffic analysisgrows alarmingly, with a higher potential for cooperation be-tween intelligence services and telecommunication providers.
These combinations strongly limit the Tor exit nodes thatcan be used with confidence in their anonymity. However,decreasing the already small number of exit nodes will end uppushing the lion’s share of anonymized traffic into very few or-ganizations and regions, which will only make traffic analysiseasier. Recent discussion about the role of Carnegie MellonUniversity and the FBI in the 2014 Tor attacks addressesthe danger of compromised exit-node selection (https://blog.torproject.org/blog/did-fbi-pay-university-attack-tor-users).
Fig. 5: Distribution of exit nodes in Switzerland based on threeweeks of data. Baar (circled) holds more than 70 percent of allexit nodes in the country. The remaining two markers point toother node clusters. Restricting exit-node distribution to selectareas increases the risk of a traffic-analysis attack.
To reduce the risk of surveilled exit nodes, we recommendapplying end-to-end encryption with SSL/TLS to access web-sites. Although this strategy will impede content eavesdrop-ping, it cannot guard against a deanonymization attack bysomeone who can monitor multiple exit nodes. The combineduse of Tor with additional proxies or other anonymizingnetworks such as I2P might help in countering such an attack.
ACKNOWLEDGEMENTS
This work was partly funded by FLAMINGO, a Network ofExcellence project (ICT-318488) supported by the EuropeanCommission under its Seventh Framework Programme.
REFERENCES
[1] C. Bitso, I. Fourie, and T. J. Bothma, “Trends in transition fromclassical censorship to internet censorship: selected country overviews,”Innovation: journal of appropriate librarianship and information workin Southern Africa: Information Ethics, no. 46, pp. 166–191, 2013.
[2] Greenwald, Glenn, “NSA and GCHQ target Tor network that protectsanonymity of web users,” http://www.theguardian.com/world/2013/oct/04/nsa-gchq-attack-tor-network-encryption, last visited on 29.03.2015.
[3] The New York Times, “Newly Disclosed N.S.A. Files Detail Part-nerships With AT&T and Verizon,” http://www.nytimes.com/interactive/2015/08/15/us/documents.html, last visited on 25.08.2015.
[4] R. Dingledine, N. Mathewson, and P. Syverson, “Tor: The second-generation onion router,” DTIC Document, Tech. Rep., 2004.
[5] A. Panchenko, F. Lanze, and T. Engel, “Improving performance andanonymity in the tor network,” in Performance Computing and Commu-nications Conference (IPCCC), 2012 IEEE 31st International. IEEE,2012, pp. 1–10.
[6] T. Elahi, K. Bauer, M. AlSabah, R. Dingledine, and I. Goldberg,“Changing of the guards: A framework for understanding and improvingentry guard selection in tor,” in Proceedings of the 2012 ACM workshopon Privacy in the electronic society. ACM, 2012, pp. 43–54.
[7] M. Edman and P. Syverson, “As-awareness in tor path selection,” in Pro-ceedings of the 16th ACM conference on Computer and communicationssecurity. ACM, 2009, pp. 380–389.
[8] R. Snader and N. Borisov, “A tune-up for tor: Improving security andperformance in the tor network.” in NDSS, vol. 8, 2008, p. 127.
[9] A. Schaap, “Characterization of tor exit-nodes,” Proc. 18th TwenteStudent Conf., 2013, http://referaat.cs.utwente.nl/conference/18/paper/7381/characterization-of-tor-exit-nodes.pdf.
[10] M. Backes, A. Kate, S. Meiser, and E. Mohammadi, “(nothing else)mator (s): Monitoring the anonymity of tor’s path selection,” in Pro-ceedings of the 2014 ACM SIGSAC Conference on Computer andCommunications Security. ACM, 2014, pp. 513–524.