Embed Size (px)
Citation preview

A NATION ONLINE:
How Americans Are Expanding Their Use of the Internet
February 2002
U.S. DEPARTMENT OF COMMERCE Economics and Statistics Administration
National Telecommunications and Information Administration

I am pleased to release A Nation Online: How Americans Are Expanding Their Use of the Internet. This report provides comprehensive information on Americans’ connectivity to the Internet, broadband services, and computers. Increasing numbers of Americans have integrated these technologies into their daily lives and are using them in a variety of places and for a wide range of activities.
The expanding use of new technologies continues to strengthen our economy. More Americans can now engage in online commerce, obtain e-government services, and access valuable information. Broadband connections are also on the rise. These high-speed connections will make it easier for people to engage in distance learning programs or telemedicine and to access a whole new array of entertainment and services that are on the horizon.
As these connections open new economic opportunities for more Americans, it is important that all segments of our Nation are included in this ongoing information revolution. I am heartened by this report’s findings that all groups of individuals are using these technologies in increasingly greater numbers.
Our young people are real leaders in the use of new information technologies. The vast majority of our youth are now Internet users. This development holds special promise for our economic future: today’s children who gain comfort and aptitude with new information technologies will be tomorrow’s skilled workers and innovators for our country.
These developments promise to bring economic growth and vitality to our Nation, and I am pleased that we are able to report on these exciting milestones.
Donald L. Evans

FOREWORD
Kathleen B. Cooper
Under Secretary for Economic Affairs Administrator, Economics and Statistics Administration
Nancy J. Victory
Assistant Secretary for Communications and Information Administrator, National Telecommunications and Information Administration
A Nation Online: How Americans Are Expanding Their Use of the Internet provides an insightful look at how Americans are increasing their connectivity to information technologies. We are fortunate to be able to base our findings on the September 2001 U.S. Census Bureau’s Current Population Survey – a survey of approximately 57,000 households and more than 137,000 individuals across the United States. As such, the data in this study are among the most broad-based and reliable datasets that have been gathered on Internet, broadband, and computer connectivity.
The ongoing collection and reporting of such data are critical for those of us in public policy. As more and more commercial activity, government services, and health and educational material are offered online, access to the Internet has become increasingly important. These data can help us track which Americans use the Internet and can access such information and services. The Census data, for example, shed light on which households subscribe to the Internet and broadband services, which household members actually go online, which schoolchildren are using the Internet and computers at schools and at home, which Americans are using these technologies at work and at home, and how usage outside the home is affecting whether Americans go online at home.
We hope that this information will be useful to a wide variety of policymakers and
service providers, such as educators, government officials, and content providers. These data will help all of us determine how we can reach Americans more effectively and take maximum advantage of the opportunities available through new information technologies.

A NATION ONLINE: HOW AMERICANS ARE EXPANDING THEIR USE OF THE INTERNET
National Telecommunications Economics and Statistics and Information Administration Administration Nancy J. Victory, Assistant Secretary Kathleen B. Cooper, Under Secretary for Communications and Information for Economic Affairs
Joint Project Team NTIA ESA Kelly K. Levy, Associate Administrator, Lee Price, Deputy Under Secretary for Office of Policy Analysis and Development Economic Affairs
James McConnaughey, Senior Economist Patricia Buckley, Senior Policy Advisor Wendy Lader, Senior Policy Analyst Sabrina Montes, Economist
Sallianne Schagrin, Telecommunications George McKittrick, Economist Policy Analyst Jeffrey Mayer, Director, Office of Sandra Castelli, Telecommunications Policy Development Policy Analyst Jeffrey Joyner, Senior Counsel Keri Nusbaum
U.S. Bureau of the Census Demographic Surveys Division Demographic Statistical Methods Division Ronald R. Tucker Alfred Meier Greg Weyland Tim J. Marshall Technologies Management Office Adelle Berlinger Andrew Stevenson L. Dinah Flores Kerry Akiyama Population Division Eric Newburger
Acknowledgments
NTIA and ESA would like to thank Milton Brown, Clyde F. Ensslin, Maureen Lewis, Steve Saleh, Josephine Scarlett, Kathy Smith, and Mary Smith of NTIA, and Elizabeth (E.R.) Gregory of ESA for their contribution to this report.

TABLE OF CONTENTS
EXECUTIVE SUMMARY .............................................................................................................1 Chapter 1: Overview........................................................................................................................3 Chapter 2: Computer and Internet Use ..........................................................................................10
Key Demographic Factors in Computer and Internet Use.........................................................11 Income .......................................................................................................................................11 Employment Status....................................................................................................................13 Age.............................................................................................................................................14 Gender........................................................................................................................................15 Educational Attainment .............................................................................................................17 Urban or Rural Location of the Household ...............................................................................20 Race / Hispanic Origin...............................................................................................................21
Chapter 3. Online Activities .........................................................................................................30 Primary Uses by the U.S. Population ........................................................................................30 Activities Among Those Individuals Online .............................................................................31 Gender........................................................................................................................................32 Age.............................................................................................................................................32 Race ...........................................................................................................................................33 Income .......................................................................................................................................34
Chapter 4: How and Where America Goes Online .......................................................................35 Connection Types: The Expansion of Broadband .....................................................................35 Spread of New Devices .............................................................................................................37 Location of Use..........................................................................................................................38
Chapter 5: The Digital Generation: How Young People Have Embraced Computers and the Internet ...........................................................................................................................................42
Computer and Internet Use........................................................................................................42 The Impact of Schools on Internet and Computer Use..............................................................44 How Young People Are Using the Internet ...............................................................................52 Concerns About Children’s Online Use ....................................................................................53
Chapter 6: The Digital Workplace.................................................................................................57 Introduction................................................................................................................................57 Computer Use at Work by Occupation......................................................................................58 Computer Use at Work by Gender and Age..............................................................................59 Types of Computer Uses at Work .............................................................................................59 Internet Use at Work..................................................................................................................61 The Work – Home Connection..................................................................................................62
Chapter 7: Computer and Internet Use Among People with Disabilities.....................................65 People with Disabilities .............................................................................................................65 Under 25 ....................................................................................................................................66 25 to 60 year olds.......................................................................................................................67 Over 60 Year-Olds.....................................................................................................................70 The Interaction of Disability with Computer and Internet Use .................................................71
Chapter 8: The Unconnected .........................................................................................................73 The Offline Population ..............................................................................................................73

The Importance of Cost to Households Never Connected to the Internet .................................75 Why Households have Discontinued Internet Access ...............................................................76 The Effect of Confidentiality Concerns.....................................................................................77 Content Concerns.......................................................................................................................77 The Role of Network Effects .....................................................................................................78
Chapter 9: Reductions in Inequality for Computer and Internet Use ...........................................85 How a Gini Coefficient for Computer and Internet Use is Computed ......................................85
CONCLUSION..............................................................................................................................91 METHODOLOGY ........................................................................................................................92

A NATION ONLINE: How Americans Are Expanding Their Use of the Internet
National Telecommunications and Information Administration 1
EXECUTIVE SUMMARY
Few technologies have spread as quickly, or become so widely used, as computers and the Internet. These information technologies are rapidly becoming common fixtures of modern social and economic life, opening opportunities and new avenues for many Americans. A Nation Online: How Americans Are Expanding Their Use of the Internet shows the rapidly growing use of new information technologies across all demographic groups and geographic regions. Not only are many more Americans using the Internet and computers at home, they are also using them at work, school, and other locations for an expanding variety of purposes.
In the last few years, Americans’ use of the Internet and computers has grown substantially.
• The rate of growth of Internet use in the United States is currently two million new Internet users per month.
• More than half of the nation is now online. In September 2001, 143 million Americans (about 54 percent of the population) were using the Internet — an increase of 26 million in 13 months. In September 2001, 174 million people (or 66 percent of the population) in the United States used computers.
Children and teenagers use computers and the Internet more than any other age group.
• Ninety percent of children between the ages of 5 and 17 (or 48 million) now use computers. • Seventy-five percent of 14-17 year olds and 65 percent of 10-13 year olds use the Internet.
• Family households with children under the age of 18 are more likely to access the Internet
(62 percent) than family households with no children (53 percent), and non-family households (35 percent).
• Computers at schools substantially narrow the gap in computer usage rates for children from high and low income families.
Internet use is increasing for people regardless of income, education, age, races, ethnicity, or gender.
• Between December 1998 and September 2001, Internet use by individuals in the lowest-income households (those earning less than $15,000 per year) increased at a 25 percent annual growth rate. Internet use among individuals in the highest-income households (those earning $75,000 per year or more) increased from a higher base but at a much slower 11 percent annual growth rate.

A NATION ONLINE: How Americans Are Expanding Their Use of the Internet
2 Economics and Statistics Administration
• Between August 2000 and September 2001, Internet use among Blacks and Hispanics increased at annual rates of 33 and 30 percent, respectively. Whites and Asian American and Pacific Islanders experienced annual growth rates of approximately 20 percent during these same periods.
• Over the 1998 to 2001 period, growth in Internet use among people living in rural households has been at an average annual rate of 24 percent, and the percentage of Internet users in rural areas (53 percent) is now almost even with the national average (54 percent).
• The highest growth rate among different types of households is for single mothers with children (29 percent).
• People with mental or physical disabilities (such as blindness, deafness, or difficulty walking, typing, or leaving home) are less likely than those without such disabilities to use computers or the Internet.
While 80 percent of Americans access the Internet through dial-up service, residential use of broadband service is rapidly expanding.
• Between August 2000 and September 2001, residential use of high-speed, broadband service doubled—from about 5 to 11 percent of all individuals, and from 11 to 20 percent of Internet users.
Americans are going online to conduct an expanding range of activities.
• Forty-five percent of the population now uses e-mail, up from 35 percent in 2000. Approximately one-third of Americans use the Internet to search for product and service information (36 percent, up from 26 percent in 2000).
• Among Internet users, 39 percent of individuals are making online purchases and 35 percent of individuals are searching for health information.
Use of the Internet and computers at work has contributed to higher use levels at home.
• The presence of someone who uses a computer or the Internet at work in a household is associated with substantially higher computer ownership or Internet use for that household, by a margin of about 77 percent to 35 percent.
With more than half of all Americans using computers and the Internet, we are truly a nation online. At work, schools, and libraries, as well as at home, the Internet is being used by a greater number of Americans.

A NATION ONLINE: How Americans Are Expanding Their Use of the Internet
National Telecommunications and Information Administration 3
CHAPTER 1: OVERVIEW
Americans’ use of information technologies grew at phenomenal rates in 2001. This past year saw a rapid increase in computer and Internet use, not only in homes, but also at the workplace, schools, and other locations. Broadband connections, available principally through cable modems and digital subscriber lines (DSL), are making higher-speed connections available to an increasing number of Americans and expanding options for online usage.
The Department of Commerce’s Census Bureau surveyed approximately 57,000 households containing more than 137,000 individuals in all 50 states and the District of Columbia and found a rapid diffusion of these technologies.1 At the time of the survey, September 2001, 60.2 million U.S. homes (or 56.5 percent) had a personal computer. Seven of every eight households with computers (88.1 percent) also subscribed to the Internet. As a result, more than half of U.S. households (53.9 million homes, or 50.5 percent) had Internet connections. As shown in Figure 1-1, this remarkable rise to over 50 percent household penetration of both computers and the Internet occurred very quickly. 2
Figure 1-1: Percent of U.S. Households with a Computer and Internet Connections, Selected Years
8.2
15.0
22.8 24.1
56.5
51.0
42.136.6 50.5
41.5
26.2
18.6
0
10
20
30
40
50
60
70
80
90
100
1984 1988 1992 1996 2000
Perc
ent o
f U.S
. Hou
seho
lds
Computer
Internet
Source: NTIA and ESA, U.S. Department of Commerce, using U.S. Census Bureau Current Population Survey Supplements
1 For a more extensive discussion on the U.S. Census Bureau’s survey methods in the Current Population Survey Supplement, see the Methodology section at the end of this report. 2 Households with at least one computer plus Internet connectivity total 53.0 million. A number of households also have more than one Internet access device. See Chapter 4 for a more detailed discussion.

A NATION ONLINE: How Americans Are Expanding Their Use of the Internet
4 Economics and Statistics Administration
On an individual (rather than household) basis, as of September 2001 two-thirds (66.8 percent) of the people in the United States used a computer at home, school and/or work. The vast majority of those who used computers (80.6 percent) were also connecting to the Internet. These two factors taken together contributed to a substantial rise in Internet use. By September 2001, 143 million people in the United States (or 53.9 percent) were using the Internet, up from 116.5 million people (or 44.5 percent) in August 2000. The widespread increase in information technologies in the United States has occurred across all 50 states. As Figure 1-2 shows, in August 2000, few states had more than 50 percent of their population using the Internet. By September 2001, most states had at least half of their population online. Table 1-1 provides a state-by-state breakdown of individual Internet use.
Figure 1-2: The Rapid Increase in Internet Use in the United States Across States
August 2000 September 2001
Greater than 50% of People Use The Internet (35)Approx. 50% of People Use the Internet (9)Less Than 50% of People Use the Internet (6)
Source: NTIA and ESA, U.S. Department of Commerce, using U.S. Census Bureau Current Population Survey Supplements

A NATION ONLINE: How Americans Are Expanding Their Use of the Internet
National Telecommunications and Information Administration 5
The rapid diffusion of the Internet is not a unique U.S. phenomenon. According to data compiled by the Organization for Economic Cooperation and Development (OECD) from various nations, the rise in Internet use is truly a global phenomenon (Figure 1-3).3
Figure 1-3: Individuals Using the Internet from any Location, Selected Countries, 1999 and 2000
58.1%53.6% 53.3% 51.1% 47.9% 47.1%
39.8% 39.7% 36.2%31.1% 29.2% 29.2% 26.6% 24.5% 22.5% 21.3%
10.3%
0%10%20%30%40%50%60%70%80%90%
100%
Sweden
Denmark
Netherl
ands
Finlan
d
Austria
United
States
United
Kingdo
mIre
land
Luxe
mbourg
EU Averag
e
Belgium
German
y
Icelan
d
France
Spain
Portug
al
Greece
Note: EU country estimates are for February 2001 and US estimates are for August 2000.Source: European Union, http://europa.eu.int/information_society/eeurope/index_en.htm and U.S. Department of Commerce, Economic and Statistics Administration.
Note: EU country estimates are for February 2001 and US estimates are for August 2000. Source: European Union,
http://europa.eu.int/information_society/eeurope/index_en.htm and U.S. Department of Commerce, Economic and Statistics Administration.
The spread of new technologies, such as the Internet, can be described by a variety of metrics – such as the percent of households connected (Figure 1-1) and the percent of the population connected (Figure 1-2). Figure 1-4 shows how selecting a different basis of measurement can affect the results: in September 2001, 50.5 percent of households had Internet connections; 56.7 percent of the total U.S. population lived in households with these connections; a lower 43.6 percent of Americans were using the Internet in their homes; while 53.9 percent of the total population used the Internet at some location.
This report features data on individuals more than data on households, for several reasons.4 First, focusing on individuals permits us to study such factors as age, gender, education, and employment status in determining computer and Internet use. Second, Internet access is more frequently occurring outside the home, at such locations as work, schools, and libraries. And finally, a small
3 Other studies or reports that have identified this general trend among various countries include, but are not limited to, the Asian Pacific Economic Cooperation (APEC) Working Group on Telecommunications and Information (TEL), Interim Response of the TEL to Leaders’ Declaration Concerning Internet Issues, 24th Meeting, Jejii Island, Korea, Doc. No. DCSG/2, September 29, 2001 (www.apectelwg.otg/apec/atwg); Conference Board of Canada, Canada in 2nd Place on Connectedness Index, February 13, 2001 (www.conferenceboard.ca/press/2001/connectedness); International Telecommunication Union (ITU), World Telecommunication Development Report 2001, Geneva, ITU, 2001; OECD, The Digital Divide: Diffusion and Use of ICTS, DSTI/ICCP/IE (2000)/Final, January 2002. 4 For additional information on household connectivity, see www.esa.doc.gov or www.ntia.doc.gov. These charts may be useful for international comparisons when households are the unit of measurement.

A NATION ONLINE: How Americans Are Expanding Their Use of the Internet
6 Economics and Statistics Administration
but growing number of Internet connections are increasingly occurring over personal devices, such as wireless phones and personal digital assistants, in addition to the computer. For some variables, such as the type of home Internet connection and reasons for non-subscribership, the household remains the unit of measurement because that is the level at which the question was most appropriately asked. For purposes of historical comparisons with earlier data available only on a household basis, we also use current household data.
Figure 1-4: Different Perspectives on Internet Access and Use
26.230
22.3
32.741.5
46.7
35.744.4
50.556.7
43.6
53.9
0102030405060708090
100
HouseholdInternet
Subscribership
Persons withInternet Access
at Home
Persons UsingHome Access
Persons UsingInternet
Anywhere
Perc
ent
Dec. 1998 Aug. 2000 Sept. 2001
Source: NTIA and ESA, U.S. Department of Commerce, using U.S. Census Bureau Current Population Survey Supplements
This report examines computer and Internet use from a number of perspectives.
Chapter 2 provides an overview of the expanding use of computers and the Internet and how different demographics, such as income or age, are associated with rates of use.
Chapter 3 looks at online activities. It also examines the relationship of a variety of demographic factors to online activities.
Chapter 4 reports on how and where people are going online; the expanding use of broadband connections; and the small but growing number of people using secondary devices, such as mobile cell phones to access the Internet. Chapter 4 also examines a particularly significant development in the past year: the increasing use of the Internet outside the home.
Chapters 5 and 6 focus on particular “outside the home” locations: work and school. Chapter 5 examines how schools provide access to computers and the Internet for students, enabling children of all socio-economic backgrounds to use these technologies. As a result, children and young adults are among the highest users of new technologies, integrating the Internet in their schoolwork and other activities. Chapter 6 focuses on how use at the workplace has affected the presence and use of computers and the Internet at home.

A NATION ONLINE: How Americans Are Expanding Their Use of the Internet
National Telecommunications and Information Administration 7
Of course, not all Americans are using computers or the Internet at high rates. Chapter 7 examines how one such group—those with disabilities—still trails behind the national average in terms of use. Chapter 8 discusses more generally the population that is not online and considers some possible reasons for their lack of connectivity.
Finally, Chapter 9 examines changes in Internet and computer use for subgroups of the population over time. Using a standard methodology to gauge inequality, our research shows that inequality among various groups is decreasing. As these trends continue, we expect that new information technologies will become more widely shared by an ever-expanding number of Americans.

A NATION ONLINE: How Americans Are Expanding Their Use of the Internet
8 Economics and Statistics Administration
Table 1-1. Internet Use by Percent of State Population
State Total Population, Age 3+ (Thousands) Percent Who Are Internet Users
(90 Percent Confidence Interval)*
United States 265,180 53.6 — 54.1
Alabama 4,271 43.3 — 49.0
Alaska 593 66.0 — 71.6
Arizona 4,641 50.4 — 55.8
Arkansas 2,544 41.4 — 47.1
California 33,108 50.9 — 53.3
Colorado 4,004 57.3 — 62.9
Connecticut 3,170 55.3 — 61.9
District of Columbia 509 42.0 — 48.6
Delaware 732 55.1 — 61.6
Florida 15,075 50.5 — 53.5
Georgia 7,550 47.7 — 52.8
Hawaii 1,150 47.6 — 54.1
Idaho 1,244 53.0 — 58.5
Illinois 11,486 49.5 — 53.0
Indiana 5,733 52.6 — 58.4
Iowa 2,769 55.3 — 61.2
Kansas 2,509 55.0 — 61.0
Kentucky 3,785 50.3 — 56.1
Louisiana 4,141 40.6 — 46.2
Maine 1,233 57.2 — 63.6
Maryland 5,115 58.4 — 64.3
Massachusetts 5,993 54.5 — 58.8
Michigan 9,553 54.6 — 58.2
Minnesota 4,742 60.7 — 66.2
Mississippi 2,642 38.9 — 44.7
Missouri 5,192 54.3 —60.3
Montana 866 54.7 — 60.4
Nebraska 1,632 52.4 — 58.4
Nevada 1,902 49.2 —54.9
New Hampshire 1,194 60.2 — 66.7
New Jersey 7,944 58.1 — 61.8
New Mexico 1,754 46.9 — 52.6
New York 17,510 51.6 — 54.3
North Carolina 7,200 45.0 — 49.3
North Dakota 591 53.4 — 59.5
Ohio 10,877 53.2 — 56.8
Oklahoma 3,161 46.8 — 52.5
Oregon 3,358 58.2 — 64.1
Pennsylvania 11,356 53.3 — 56.7
Rhode Island 943 53.3 — 60.0
South Carolina 3,728 44.6 — 50.7
South Dakota 690 55.9 — 61.6
Tennessee 5,209 49.5 — 55.5

A NATION ONLINE: How Americans Are Expanding Their Use of the Internet
National Telecommunications and Information Administration 9
Texas 19,576 49.7 — 52.6
Utah 2,061 58.7 — 64.0
Vermont 590 57.3 — 63.6
Virginia 6,653 55.7 — 61.2
Washington 5,661 58.3 — 64.2
West Virginia 1,712 43.9 — 49.5
Wisconsin 5,070 54.1 — 59.9
Wyoming 460 59.3 —65.2
* Specific point estimates are subject to sampling error (see Methodology Section). This Table reports the 90 percent confidence interval to avoid inaccurate and misleading rankings of states by Internet use point estimates. With a probability of 90 percent the “true” percent of Internet use falls within this range.

A NATION ONLINE: How Americans Are Expanding Their Use of the Internet
10 Economics and Statistics Administration
CHAPTER 2: COMPUTER AND INTERNET USE
Increasingly, we are a nation online. Individuals continue to expand their use of computers and the Internet. As of September 2001, 174 million people or 65.6 percent of the U.S. population were computer users. One hundred forty three million people or 53.9 percent of the population used the Internet (Tables 2-1 and 2-2 and Figure 2-1).
Figure 2-1: Internet Use From Any Location, Percent of Persons Age 3 +
Computer Use 1997, 2001 Internet Use 1997, 1998, 2000, 2001
53.5
65.6
0102030405060708090
100
Oct. 1997 Sept. 2001
Perc
ent
22.2
32.7
44.4
53.9
0102030405060708090
100
Oct. 1997 Dec. 1998 Aug. 2000 Sept. 2001
Perc
ent
Source: NTIA and ESA, U.S. Department of Commerce, using U.S. Census Bureau Current Population Survey Supplements
Both computer and Internet use have increased substantially in the past few years. Since 1997 computer use has grown at a rate of 5.3 percent on an annualized basis.5 Internet use has grown at a rate of 20 percent a year since 1998. In the 13 months before September 2001, over 26 million more people went online.
The demographic profile of computer and Internet users provided in this chapter reveals that growth in computer and Internet use is broadly based. In every income bracket, at every level of education, in every age group, for people of every race and among people of Hispanic origin, among both men and women, many more people use computers and the Internet now than did so in the recent past. Some people are still more likely to be Internet users than others. Individuals living in low-income households or having little education, still trail the national average. However, broad measures of 5 Although the Current Population Survey Supplements (on which this report and reports in the Falling Through the Net series are based) have tracked computer penetration rates in the United States, they have done so on a household basis; i.e., respondents have been asked to report whether there was a computer in the household. The 2001 survey, however, included questions on whether a person uses a computer. Because questions on individual computer use have not been asked since the October 1997 Current Population Survey Supplement, data on computer use by individuals are not available for 1998 and 2000.
The 1997 survey also used somewhat different phrasing for both the computer and Internet use questions. In 1997, respondents were asked about their use of “Internet and other online services” and their use of “personal or home computers, laptops, mini computers or mainframe computers.” In 2001, respondents were asked about their use of the “Internet” and about their use of “personal computers and laptops.” The computer use questions are roughly similar, although the 2001 data would likely be somewhat higher if respondents had been specifically instructed to include the use of “mini computers or mainframe computers” in their response. The Internet use question likely provides a correct order of magnitude for Internet use. The difference in the question’s phrasing, however, makes the comparison of growth rates between 1997 and other years somewhat problematic. All growth rates are calculated beginning with the 1998 survey results.

A NATION ONLINE: How Americans Are Expanding Their Use of the Internet
National Telecommunications and Information Administration 11
Internet use in the United States suggest that over time Internet use has become more equitable (See Chapter 9).
Demographic Factors in Computer and Internet Use Income Family income remains an indicator of whether a person uses a computer or the Internet. Individuals who live in high-income households are more likely to be computer and Internet users than those who live in low-income households. This relationship has held true in each successive survey of computer and Internet use.6
Nonetheless, both computer and Internet use have increased steadily across all income categories over time (Figure 2-2). While notable differences remain in Internet use across income categories, Internet use has grown considerably among people who live in lower income households. Among people living in the lowest income households (less than $15,000 annually), Internet use had increased from 9.2 percent in October 1997 to 25.0 percent in September 2001.
Figure 2-2: Computer and Internet Use From Any Location by Family Income, Persons Age 3 +
Computer Use 1997, 2001 Internet Use 1997, 1998, 2000, 2001
0
10
20
30
40
50
60
70
80
90
100
Under $15,000 $15,000-$24,999
$25,000-$34,999
$35,000-$49,999
$50,000-$74,999
Over $75,000
Perc
ent
Sept. 2001
Oct. 1997
0
10
20
30
40
50
60
70
80
90
100
Under$15,000
$15,000-$24,999
$25,000-$34,999
$35,000-$49,999
$50,000-$74,999
Over $75,000
Perc
ent
Sept. 2001
Aug. 2000
Dec. 1998
Oct. 1997
Source: NTIA and ESA, U.S. Department of Commerce, using U.S. Census Bureau Current Population Survey Supplements
6 The individuals who were in a given income bracket in October 1997 are not necessarily the same people in that bracket in September 2001. The family income level of any household changes over time as the income earners make more or less money according to personal and economic circumstances. Thus, the composition of income brackets changes over time.

A NATION ONLINE: How Americans Are Expanding Their Use of the Internet
12 Economics and Statistics Administration
Internet use is growing faster among people in lower family income brackets (Figure 2-3, Table 2-3). Internet use among people who live in households where family income is less than $15,000 grew at an annual rate of 25 percent between December 1998 and September 2001. Over the same period Internet use grew at an annual rate of 11 percent among people living in households where family income was $75,000 or more.
Figure 2-3: Growth in Internet Use by Family Income, Percent of Persons Age 3 + (Annual Rate) December 1998 to September 2001
25 2422
20
15
11
0
5
10
15
20
25
30
35
40
45
50
Under $15,000 $15,000-$24,999
$25,000-$34,999
$35,000-$49,999
$50,000-$74,999
Over $75,000
Gro
wth
in In
tern
et U
se R
ate
12/9
8-9/
01 a
ar
Source: NTIA and ESA, U.S. Department of Commerce, using U.S. Census Bureau Current Population Survey Supplements
Not only did the Internet use rate grow faster for those living in lower income households, but growth also accelerated between August 2000 and September 2001 relative to December 1998 to August 2000. For people living in households in the two lowest income brackets, the Internet use rate grew faster between August 2000 and September 2001 than between December 1998 and August 2000. This acceleration in the growth of Internet use did not occur among people living in higher income households (Table 2-3).

A NATION ONLINE: How Americans Are Expanding Their Use of the Internet
National Telecommunications and Information Administration 13
Employment Status Both the employed and the not employed (either unemployed or not in the labor force) saw growth in computer and Internet use rates since 1997 (Figure 2-4).
People who are employed are more likely to be both computer and Internet users. In 2001, 73.2 percent of employed people (age 16 and older) were computer users and 65.4 percent were Internet users. In contrast, only 40.8 percent of people who were not employed were computer users and 36.9 were Internet users.
Figure 2-4: Computer and Internet Use From Any Location by Employment Status, Percent of Persons Age 16 + Computer Use 1997, 2001 Internet Use 1997, 1998, 2000, 2001
0
10
20
30
40
50
60
70
80
90
100
Oct. 1997 Sept. 2001
Perc
ent
Note: Not employed includes people who are unemployed and people who are not in the labor force.
Employed
Not-Employed
0
10
20
30
40
50
60
70
80
90
100
Oct. 1997 Dec. 1998 Aug. 2000 Sept. 2001
Perc
ent
Note: Not employed includes people who are unemployed and people who are not in the labor force.
Employed
Not Employed
Source: NTIA and ESA, U.S. Department of Commerce, using U.S. Census Bureau Current Population Survey Supplements
A NATION ONLINE: How Americans Are Expanding Their Use of the Internet
14 Economics and Statistics Administration
Age Increases in computer and Internet use have occurred across the entire age distribution. Since December 1997, the entire age distribution has shifted upward with each new survey.
Computer and Internet use are strongly associated with the age of the individual. As Figure 2-5 shows, children and teenagers were the most likely to be computer users. Computer use is also relatively high—about 70 percent in 2001—among people in their prime workforce years (generally people in their 20s to their 50s). Those above this age range are less likely to be computer users. This pattern is consistent in both 1997 and 2001.
Rates of Internet use show a similar pattern that holds true for each year of data. Internet use rates climb steadily as age increases for children through young adults, level off at relatively high rates for people between ages 26 and 55, and then fall among people at higher ages.
Figure 2-5: Computer and Internet Use at Any Location Age Distribution (3 year moving average), Percent of Persons Age 3 to 80
Computer Use 1997, 2001 Internet Use 1997, 1998, 2000, 2001
0
10
20
30
40
50
60
70
80
90
100
0 5 10 15 20 25 30 35 40 45 50 55 60 65 70 75 80
Age (Centered 3-year moving avg.)
Perc
ent
Sept. 2001
Oct. 1997
0
10
20
30
40
50
60
70
80
90
100
0 5 10 15 20 25 30 35 40 45 50 55 60 65 70 75 80Age (Centered 3-year moving avg.)
Per
cent
Dec. 1998
Sept. 2001
Aug. 2000
Oct. 1997
Source: NTIA and ESA, U.S. Department of Commerce, using U.S. Census Bureau Current Population Survey Supplements
One would expect to see the current plateau for Internet use among those age 25 to 55 extend to older ages over time because the overall upward shift in the age distribution shown in Figure 2-5 is composed of two components. The first is an absolute increase in Internet use by people and the second is a cohort effect. The cohort effect describes the fact that the people who are in the 55-year-old age cohort in September 2001 are not the same people who were in this age group in earlier surveys. The 55 year olds of September 2001 were mostly 51 year olds when Census first asked about Internet use in October 1997. People who used the Internet when they were younger will likely continue to do so as they age.

A NATION ONLINE: How Americans Are Expanding Their Use of the Internet
National Telecommunications and Information Administration 15
Gender Males and females have had approximately equal rates of computer use since 1997. In 1997, males were more likely than females to be Internet users. Between October 1997 and August 2000, this difference disappeared. Since August 2000, males and females have had virtually identical rates of Internet use (Figure 2-6). In September 2001, the Internet use rate was 53.9 percent for males and 53.8 percent for females.
The annual growth rates from August 2000 to September 2001 were similar: 19 percent growth at an annual rate for males and 20 percent for females (Table 2-3).
Figure 2-6: Computer and Internet Use Anywhere by Gender, Percent of Persons Age 3+
Computer Use 1997, 2001 Internet Use 1997, 1998, 2000, 2001
0
10
20
30
40
50
60
70
80
90
100
Male Female
Perc
ent
Oct. 1997 Sept. 2001
65.865.5
0
10
20
30
40
50
60
70
80
90
100
Male Female
Perc
ent
Oct. 1997 Dec. 1998 Aug. 2000 Sept. 2001
53.9 53.8
Source: NTIA and ESA, U.S. Department of Commerce, using U.S. Census Bureau Current Population Survey Supplements
A NATION ONLINE: How Americans Are Expanding Their Use of the Internet
16 Economics and Statistics Administration
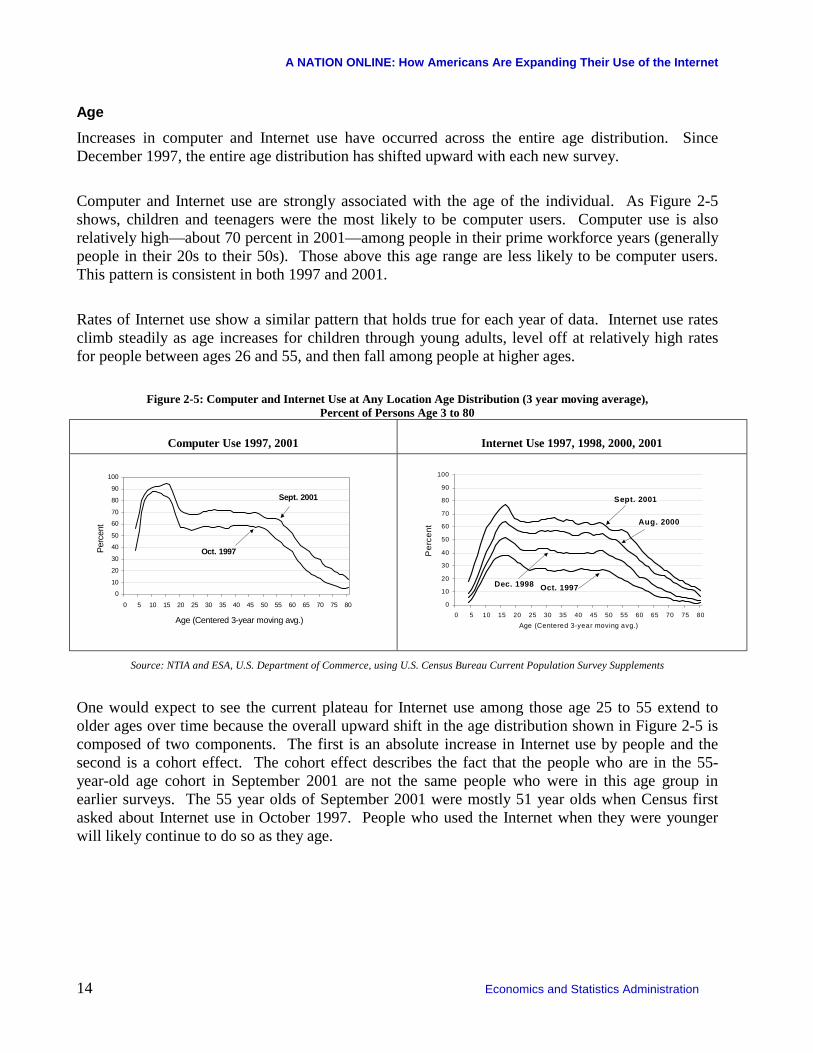
Although the aggregate rates of use and growth by gender have equalized, there are still gender-related differences in Internet use within various age groups (Figure 2-7). Women, from approximately age 20 to age 50, are more likely to be Internet users than men. From about age 60 and older, men have higher rates of Internet use than women.
Figure 2-7: Computer and Internet Use Distribution by Age & Gender, Sept. 2001, Percent of Persons Age 3 to 80
Computer Use Internet Use
0
10
20
30
40
50
60
70
80
90
100
0 5 10 15 20 25 30 35 40 45 50 55 60 65 70 75
Age (center 3-year moving average)
Per
cent Male
Female
0
10
20
30
40
50
60
70
80
90
100
0 5 10 15 20 25 30 35 40 45 50 55 60 65 70 75
Age (centered 3-year moving average)
Per
cent
Male
Female
Source: NTIA and ESA, U.S. Department of Commerce, using U.S. Census Bureau Current Population Survey Supplements
Gender can also be considered in the context of household type.7 In previous years people who lived in single parent households (where children under the age of 18 are present) headed by women were less likely to be Internet users. The Internet use rate among people living in female-headed single parent households grew dramatically between August 2000 and September 2001, and the differential between Internet use rates between people living in male and female single parent households has largely disappeared.
7 “Household. A household consists of all persons--related family members and all unrelated persons--who occupy a housing unit and have no other usual address. A house, an apartment, a group of rooms, or a single room is regarded as a housing unit when occupied or intended for occupancy as separate living quarters. A householder is the person (or one of the persons) in whose name the housing unit is owned or rented.
Family. A family is defined as a group of two or more persons residing together who are related by birth, marriage, or adoption; all such persons are considered as members of one family. Families are classified either as married-couple families or as families maintained by women or men without spouses. A family maintained by a woman or a man is one in which the householder is either single, widowed, divorced, or married, spouse absent.” Current Population Survey Concepts, (http://www.bls.census.gov/cps/bconcept.htm).

A NATION ONLINE: How Americans Are Expanding Their Use of the Internet
National Telecommunications and Information Administration 17
However, as Figure 2-8 shows, people who live in households headed by married couples (where children under the age of 18 are present) are more likely than people who live in other household types to be both computer and Internet users.
Figure 2-8: Computer and Internet Use Anywhere by Type of Household, Persons Age 3 +
Computer Use, 1997, 2001 Internet Use, 1997, 1998, 2000, 2001
0
10
20
30
40
50
60
70
80
90
100
Married Couple withChildren
Male with Children Female with Children Households withoutChildren
Per
cent
Oct. 1997 Sept. 2001
78.8
62.666.0
0
10
20
30
40
50
60
70
80
90
100
Married Couple withChildren
Male with Children Female with Children Households withoutChildren
Per
cent
Oct. 1997 Dec. 1998 Aug. 2000 Sept. 2001
62.0
45.8 45.3
Source: NTIA and ESA, U.S. Department of Commerce, using U.S. Census Bureau Current Population Survey Supplements
Educational Attainment Educational attainment also factors into computer and Internet use. The higher a person’s level of education, the more likely he or she will be a computer or Internet user.
As shown in Figure 2-9, adults (age 25 and above) with education beyond college were the most likely to be both computer and Internet users each year of the survey.8 Those with Bachelor’s degrees trailed close behind. At the opposite end of the spectrum are those adults whose highest level of education is less than high school. In September 2001, the computer use rate for the latter was 17.0 percent and the Internet use rate was 12.8.
Internet use has grown rapidly among those with lower levels of educational attainment. Internet use for adults with a Bachelor’s degree and adults with and education level beyond a Bachelor’s degree grew at annual rates of 13 and 9 percent, respectively from December 1998 to September 2001. Internet use among those with only a high school diploma grew at an annual rate of 30 percent over the same period (Table 2-3).
8 Educational attainment is shown for people age 25 and older to reduce the likelihood that the individual is still in school.

A NATION ONLINE: How Americans Are Expanding Their Use of the Internet
18 Economics and Statistics Administration
Figure 2-9: Internet Use Anywhere by Educational Attainment, Percent of Persons Age 25 +
Computer Use, 1997, 2001 Internet Use, 1997, 1998, 2000, 2001
0
10
20
30
40
50
60
70
80
90
100
Less ThanHigh School
High SchoolDiploma / GED
Some College BachelorsDegree
BeyondBachelors
Degree
Perc
ent
Oct. 1997
Sept. 2001
0
10
20
30
40
50
60
70
80
90
100
Less ThanHigh School
High SchoolDiploma / GED
Some College BachelorsDegree
BeyondBachelors
Degree
Perc
ent
Sept. 2001
Aug. 2000
Dec. 1998
Oct. 1997
Source: NTIA and ESA, U.S. Department of Commerce, using U.S. Census Bureau Current Population Survey Supplements

A NATION ONLINE: How Americans Are Expanding Their Use of the Internet
National Telecommunications and Information Administration 19
Box 2-1: Interrelated Demographic Factors Descriptive statistics, such as those in this chapter, are not sufficient to determine why a certain group of individuals has higher or lower rates of computer and Internet use. One of the reasons is that demographic characteristics are often interrelated.
An individual’s occupation (which is discussed in Chapter 6) is often associated with a certain level of education. People with higher incomes often have higher levels of education. Thus, the statistics describing how people living in low income households, or who have low levels of education, or a given occupation are less likely to be Internet users may be capturing a more complicated interaction between the demographic characteristics. For example, income and education are strongly correlated. Thus, the relationship between Internet use and educational attainment could simply reflect the fact that people with higher levels of education tend to have higher incomes.
On closer examination, however, we find that income and education have independent effects on Internet use. Figure 2-10 shows the Internet use rates for each of six income categories broken into four levels of educational attainment. Thus, the entire population 25 years of age or more is assigned to one of 24 income/education categories. As Figure 2-10 shows, people who have lower levels of education but live in households with a high family incomes are less likely to be Internet users than those who have high levels of education and live in households with low family income.
Figure 2-10: Income and Education Have In dependent Effects on Internet Use, Age 25+
$75,000& above
$50,000 -$74,999
$35,000 -$49,999
$25,000 -$34,999
$15,000 -$24,999
Less than$15,000
Less Than High School
High School
Some College
Bachelors Degree & More
0
10
20
30
40
50
60
70
80
90
100
Perc
ent
Source: NTIA and ESA, U.S. Department of Commerce, using U.S. Census Bureau Current Population Survey Supplements
Both higher income and more education are themselves correlated with occupations that tend to have greater Internet use at work. As Chapter 6 demonstrates, a person’s use at work has an important relationship to whether the Internet is at home, independent of income.

A NATION ONLINE: How Americans Are Expanding Their Use of the Internet
20 Economics and Statistics Administration
Urban or Rural Location of the Household In September 2001, people living in each urban/rural category—non-central city urban, central city urban, and rural—had higher rates of Internet use than in previous years9 (Figure 2-11).
Figure 2-11: Internet Use Anywhere by Geographic Location of Household, Percent of Persons Age 3+
0102030405060708090
100
All Persons Rural Central City Urban (NotCentral City)
Per
cent
Dec. 1998 Aug. 2000 Sept. 2001
53.9 57.452.949.1
Source: NTIA and ESA, U.S. Department of Commerce, using U.S. Census Bureau Current Population Survey Supplements
Over the 1998 to 2001 period, growth in Internet use among people living in rural households has been particularly strong (24 percent at an average annual rate). Use of the Internet by people in rural households now approaches the national average (Table 2-3). Internet use among people living in central city urban households has also grown, although not as rapidly (19 percent at an average annual rate). Internet use among people who live in non-central city urban households has grown at a slightly slower rate (18 percent at an average annual rate). Even with the slowest growth rate, however, people living in non-central city urban households used the Internet at a rate greater than the other two geographic categories in September 2001.
9 The "urban" category includes those areas classified as being urbanized (having a population density of at least 1,000 persons per square mile and a total population of at least 50,000) as well as cities, villages, boroughs (except in Alaska and New York), towns (except in the six New England states, New York, and Wisconsin), and other designated census areas having 2,500 or more persons. A "central city" is the largest city within a "metropolitan" area, as defined by the Census Bureau. Additional cities within the metropolitan area can also be classified as central cities if they meet certain employment, population, and employment/residence ratio requirements. “Urban, not central city” equals the “urban” category less the “central city” category. All areas not classified by the Census Bureau as urban are defined as rural and generally include communities of less than 2,500 persons.

A NATION ONLINE: How Americans Are Expanding Their Use of the Internet
National Telecommunications and Information Administration 21
Race / Hispanic Origin Since 1997, rates of computer and Internet use by individuals have increased for each broad race/Hispanic origin category.10
Differences in computer and Internet use across these broad race and Hispanic origin categories persist. In each survey, Whites and Asian American and Pacific Islanders have had higher rates of both computer and Internet use than Blacks and Hispanics11 (Figure 2-12, Table 2-2). In September 2001, the computer use rates were highest for Asian American and Pacific Islanders (71.2 percent) and Whites (70.0 percent). Among Blacks, 55.7 percent were computer users. Almost half of Hispanics (48.8 percent) were computer users. During the same year, Internet use among Whites and Asian American and Pacific Islanders hovered around 60 percent, while Internet use rates for Blacks (39.8 percent) and Hispanics (31.6 percent) trailed behind.
On the other hand, Internet use has increased across all race and groups and growth in Internet use rates was faster for Blacks and Hispanics than for Whites and Asian American and Pacific Islanders (Table 2-3). From December 1998 to September 2001, Internet use among Blacks grew at an annual rate of 31 percent. Internet use among Hispanics grew at an annual rate of 26 percent. Internet use continued to grow among Asian American and Pacific Islanders (21 percent), and Whites (19 percent), although not so rapidly as for Blacks and Hispanics. Although not so dramatic, Blacks and Hispanics also have had somewhat faster growth in computer use than Whites and Asian American and Pacific Islanders (Table 2-1).
Growth in Internet use rates for Blacks and Hispanics also accelerated in the 2000 to 2001 period. Between August 2000 and September 2001, growth in Hispanic Internet use increased to 30 percent from the 24 percent annual rate of growth from December 1998 to August 2000. Growth in Internet use among Blacks increased to a 33 percent annual rate between August 2000 and September 2001, from the 30 percent annual rate of growth between December 1998 and August 2000. Growth rates among Whites and Asian American and Pacific Islanders were comparable during both periods.
10 The Current Population Survey is designed primarily to measure accurately national employment on a monthly basis. The survey design is such that measures for certain sub-populations are also accurate. However, this is not the case for all sub-populations. Although the survey includes questions to identify the race/Hispanic category “American Indian Alaska Native,” the survey design is such that data for this sub-population is unreliable. This category is therefore not reported in this analysis. 11 Persons categorized as Hispanic are those who indicated that their origin was Mexican-American, Chicano, Mexican, Puerto Rican, Cuban, Central or South American, or other Hispanic. People of Hispanic origins can be of any race. People who have indicated that they are of Hispanic origin are grouped as Hispanic and excluded from the race categories. Thus, "Whites" should be read as "Whites, non-Hispanic" and "Blacks" should be read as "Blacks, non-Hispanic."

A NATION ONLINE: How Americans Are Expanding Their Use of the Internet
22 Economics and Statistics Administration
Figure 2-12: Internet Use Anywhere by Race/Hispanic Origin, Percent of Persons Age 3 +
Computer Use 1997, 2001 Internet Use 1997, 1998, 2000, 2001
0
1 0
2 0
3 0
4 0
5 0
6 0
7 0
8 0
A s ian A m e ric an /P a c if icIs lan d e r
W hite B la c k H is p a nic
Pe
rce
nt
O c t. 1 9 9 7 S e p t. 2 0 0 1
71. 2 70. 7
55. 7
0
10
20
30
40
50
60
70
80
Asian Amer. &Pacific Isl.
White Black Hispanic
Perc
ent
Oct. 1997 Dec. 1998 Aug. 2000 Sept. 2001
60.4 59.9
39.8
31.6
Source: NTIA and ESA, U.S. Department of Commerce, using U.S. Census Bureau Current Population Survey Supplements
The race and ethnic origin categories used in this analysis are broad aggregations of what can be very disparate sub-groups. Individual sub-groups may have higher or lower levels of Internet use than the aggregate. Box 2-2 provides an example of a sub-group of the Hispanic population (those not speaking English in the home) that has much lower levels of Internet use than the aggregate Hispanic population. It is likely that each broad category has sub-groups with rates of computer and Internet use that differ dramatically from the aggregate.

A NATION ONLINE: How Americans Are Expanding Their Use of the Internet
National Telecommunications and Information Administration 23
Box 2-2: Example of Differential Internet Use in a Race/Hispanic Origin Sub-Group Internet use among Hispanics differs considerably depending on whether Spanish is the only language spoken in the household, which is the case for about one in nine of Hispanic households.12 In September 2001, 14.1 percent of Hispanics who lived in households where Spanish was the only language spoken used the Internet. In contrast, 37.6 percent of Hispanics who lived in households where Spanish was not the only language spoken used the Internet.
The forces influencing Internet use for these two sub-groups of the Hispanic category are not necessarily clear-cut. One could point to metrics that suggest a predominance of English language sites on the Internet. The Organization for Economic Cooperation and Development, for example, reports that more than 94 percent of links to pages on secure servers were in English in July 2000.13 Yet, this metric reflects only one use of the Internet—commerce—and provides no information on how much of other Internet traffic (e-mail and other online communications) is English only.
Furthermore, there can be considerable demographic differences among sub-groups. For example, individuals living in Spanish language-only households are more likely to have lower family incomes than those who live in non-Spanish language-only households. The income distribution of individuals living in Spanish language-only households is in fact strikingly different from that for other Hispanics and from the overall income distribution (Figure 2-14). Levels of educational attainment for individuals living in the Spanish-only households also differ from non-Spanish only Hispanic households and other households.
Figure 2-13: The Spanish Language Only Sub-Groups of the Hispanic Category Have a Strikingly Different Income Distribution Than Other Hispanics and the Population at Large, 2001
0
5
10
15
20
25
30
35
40
U.S. Population Hispanics Hispanics NotSpanish Only
Hispanics Spanish-Only
Perc
ent
Under $15,000 $15,000-$24,999 $25,000-$34,999$35,000-$49,999 $50,000-$74,999 Over $75,000
Source: NTIA and ESA, U.S. Department of Commerce, using U.S. Census Bureau Current Population Survey Supplements.
12 The Current Population Survey asks the question “Is Spanish the only language spoken by all members of the household who are 15 years of age or older?” Although this phrasing is restrictive, because it excludes households where Spanish may be the predominant rather than the exclusive language spoken in a household, the results suggest ways in which the aggregate results for people claiming membership in the “Hispanic” ethnic category mask a variety of experiences in using the Internet. 13 Organization for Economic Cooperation and Development, Understanding the Digital Divide, 2001. p.23. (www.oecd.org/dsti/sti/prod/digital_divide.pdf)

A NATION ONLINE: How Americans Are Expanding Their Use of the Internet
24 Economics and Statistics Administration
Table 2-1: Computer Use From Any Location by Individuals Age 3 and Older, October 1997 and September 2001
Oct. 1997 Sept. 2001
Percent of People Who
Are Computer Users
Growth in Use Rate
(annual rate)
Computer
Users (thousands)
Total (thousands)
Computer Users
(thousands) Total
(thousands) Oct. 1997
Sept. 2001
Oct. 1997 to Sept. 2001
Total Population 136,900 255,689 174,051 265,180 53.5 65.6 5.3 Gender
Male 66,978 124,590 84,539 129,152 53.8 65.5 5.2 Female 69,921 131,099 89,512 136,028 53.3 65.8 5.5
Race/ Origin
White 105,957 184,295 130,848 186,793 57.5 70.0 5.2 Black 13,854 31,786 18,544 33,305 43.6 55.7 6.5 Asian Amer. & Pac. Isl. 5,306 9,225 7,600 10,674 57.5 71.2 5.6
Hispanic 10,729 28,233 15,690 32,146 38.0 48.8 6.6 Employment Status
Employed a 80,687 130,857 98,819 135,089 61.7 73.2 4.5 Not Employed a, b 18,074 72,911 31,487 77,268 24.8 40.8 13.5
Family Income
Less than $15,000 13,182 44,284 11,681 31,354 29.8 37.3 5.9
$15,000 - $24,999 12,115 32,423 12,464 26,649 37.4 46.8 5.9 $25,000 - $34,999 16,360 33,178 16,495 28,571 49.3 57.7 4.1 $35,000 - $49,999 23,440 38,776 25,233 36,044 60.4 70.0 3.8 $50,000 - $74,999 30,043 41,910 35,465 44,692 71.7 79.4 2.6 $75,000 & above 29,542 36,572 49,672 56,446 80.8 88.0 2.2
Educational Attainment Less Than High School c 2,331 29,114 4,672 27,484 7.9 17.0 21.5
High School Diploma / GED c 19,256 57,487 27,118 57,386 33.5 47.3 9.2 Some College c 24,595 42,544 31,551 45,420 57.8 69.5 4.8 Bachelors Degree c 20,640 27,795 25,965 30,588 74.3 84.9 3.5 Beyond Bachelors Degree c 10,970 13,863 14,151 16,283 79.1 86.9 2.4
Age Group Age 3 – 8 14,412 24,445 16,877 23,763 59.0 71.0 4.9
Age 9 – 17 30,188 35,469 34,356 37,118 85.1 92.6 2.2 Age 18 – 24 14,528 24,973 19,361 27,137 58.2 71.3 5.3 Age 25 – 49 58,745 101,853 71,491 101,890 57.7 70.2 5.1
Male 27,577 50,177 33,647 50,020 55.0 67.3 5.3 Female 31,168 51,676 37,844 51,871 60.3 73.0 5.0
Age 50 + 19,026 68,949 31,965 75,272 27.6 42.5 11.6
Male 9,654 31,252 15,547 34,438 30.9 45.1 10.2 Female 9,372 37,697 16,418 40,834 24.9 40.2 13.1
Household Type In Which the Individual Lives d
Married Couple w/Children <18 Years Old 68,855 103,791 81,897 104,337 66.3 78.5 4.4

A NATION ONLINE: How Americans Are Expanding Their Use of the Internet
National Telecommunications and Information Administration 25
Oct. 1997 Sept. 2001
Percent of People Who
Are Computer Users
Growth in Use Rate
(annual rate)
Computer
Users (thousands)
Total (thousands)
Computer Users
(thousands) Total
(thousands) Oct. 1997
Sept. 2001
Oct. 1997 to Sept. 2001
Male Householder w/Children <18 Years Old 3,163 6,284 4,632 7,400 50.3 62.6 5.7 Female Householder w/Children <18 Years Old 14,288 27,327 19,160 29,032 52.3 66.0 6.1
Family Household without Children <18 Years Old 33,001 77,612 46,400 81,996 42.5 56.6 7.6 Non-Family Household 16,589 39,381 21,913 42,333 42.1 51.8 5.4
Source: U.S. Bureau of the Census, Current Population Survey supplements, October, September 2001. Notes: a Age 16 and older. b Unemployed and not in the labor force. c Age 25 and older. d Excludes group quarters, such as dorms and military barracks.

A NATION ONLINE: How Americans Are Expanding Their Use of the Internet
26 Economics and Statistics Administration
Table 2-2: Internet Use From Any Location by Individuals Age 3 and Older, October 1997, December 1998, August 2000, and September 2001
Oct. 1997 (thousands)
Dec. 1998 (thousands)
Aug. 2000 (thousands)
Sept. 2001 (thousands)
Internet Use (percent)
Internet Users Total Internet
Users Total Internet Users Total Internet
Users Total Oct. 1997
Dec. 1998
Aug. 2000
Sept. 2001
Total Population 56,774 255,689 84,587 258,453 116,480 262,620 142,823 265,180 22.2 32.7 44.4 53.9 Gender
Male 30,311 124,590 43,033 125,932 56,962 127,844 69,580 129,152 24.3 34.2 44.6 53.9
Female 26,464 131,099 41,555 132,521 59,518 134,776 73,243 136,028 20.2 31.4 44.2 53.8 Race/ Origin
White 46,678 184,295 69,470 184,980 93,714 186,439 111,942 186,793 25.3 37.6 50.3 59.9 Black 4,197 31,786 6,111 32,123 9,624 32,850 13,237 33,305 13.2 19.0 29.3 39.8 Asian Amer. & Pac. Isl. 2,432 9,225 3,467 9,688 5,095 10,324 6,452 10,674 26.4 35.8 49.4 60.4 Hispanic 3,101 28,233 4,897 29,452 7,325 30,918 10,141 32,146 11.0 16.6 23.7 31.6
Employment Status
Employed b 37,254 130,857 56,539 133,119 76,971 136,044 88,396 135,089 28.5 42.5 56.6 65.4 Not Employed b, d 9,012 72,911 14,261 73,891 21,321 73,891 28,531 77,268 12.4 19.5 28.9 36.9
Family Income
Less than $15,000 4,069 44,284 5,170 37,864 6,057 32,096 7,848 31,354 9.2 13.7 18.9 25.0 $15,000 - $24,999 3,760 32,423 5,623 30,581 7,063 27,727 8,893 26,650 11.6 18.4 25.5 33.4 $25,000 - $34,999 5,666 33,178 8,050 31,836 11,054 31,001 12,591 28,571 17.1 25.3 35.7 44.1
$35,000 - $49,999 8,824 38,776 13,528 39,026 16,690 35,867 20,587 36,044 22.8 34.7 46.5 57.1 $50,000 - $74,999 13,552 41,910 19,902 43,776 25,059 43,451 30,071 44,692 32.3 45.5 57.7 67.3 $75,000 & above 16,276 36,572 24,861 42,221 36,564 52,189 44,547 56,446 44.5 58.9 70.1 78.9
Educational Attainment Less Than High School a 516 29,114 1,228 29,039 2,482 28,254 3,506 27,484 1.8 4.2 8.8 12.8
High School Diploma/GED a 5,589 57,487 10,961 57,103 17,425 56,889 22,847 57,386 9.7 19.2 30.6 39.8
Some College a 10,548 42,544 16,603 43,038 24,201 44,628 28,321 45,420 24.8 38.6 54.2 62.4 Bachelors Degree a 11,503 27,795 16,937 28,990 21,978 30,329 24,726 30,588 41.4 58.4 72.5 80.8
Beyond Bachelors Degree a 7,195 13,863 9,635 14,518 12,104 15,426 13,633 16,283 51.9 66.4 78.5 83.7
Age Group (and Labor Force) Age 3 – 8 1,748 24,445 2,680 24,282 3,671 23,962 6,637 23,763 7.2 11.0 15.3 27.9 Age 9 – 17 11,791 35,469 15,396 35,821 19,579 36,673 25,480 37,118 33.2 43.0 53.4 68.6 Age 18 – 24 7,884 24,973 11,356 25,662 15,039 26,458 17,673 27,137 31.6 44.3 56.8 65.0 Age 25 – 49 27,639 101,853 41,694 101,836 56,433 101,946 65,138 101,890 27.1 40.9 55.4 63.9
Male 14,679 50,177 20,889 50,054 27,078 50,034 30,891 50,020 29.3 41.7 54.1 61.8 Female 12,960 51,676 20,806 51,781 29,356 51,913 34,247 51,871 25.1 40.2 56.5 66.0
Age 50 + 7,712 68,949 13,669 70,852 21,758 73,580 27,895 75,272 11.2 19.3 29.6 37.1
Male 4,560 31,252 7,356 32,248 10,989 33,561 13,757 34,438 14.6 22.8 32.7 39.9 Female 3,152 37,697 6,313 38,604 10,769 40,019 14,138 40,834 8.4 16.4 26.9 34.6
Geographic Location of Household In Which the Individual Lives
Rural n/a n/a 19,274 65,828 28,889 67,980 35,751 67,642 n/a 29.3 42.5 52.9 Urban n/a n/a 65,313 192,625 87,591 194,640 107,072 197,537 n/a 33.9 45.0 54.2
Urban Not Central City n/a n/a 41,881 116,091 56,773 118,641 69,342 120,724 n/a 36.1 47.9 57.4
Urban Central City n/a n/a 23,432 76,534 30,818 75,999 37,730 76,813 n/a 30.6 40.6 49.1 Household Type In Which the Individual Lives

A NATION ONLINE: How Americans Are Expanding Their Use of the Internet
National Telecommunications and Information Administration 27
Oct. 1997 (thousands)
Dec. 1998 (thousands)
Aug. 2000 (thousands)
Sept. 2001 (thousands)
Internet Use (percent)
Internet Users Total Internet
Users Total Internet Users Total Internet
Users Total Oct. 1997
Dec. 1998
Aug. 2000
Sept. 2001
Married Couple w/Children <18 Years Old
27,664 103,791 41,462 110,295 57,122 112,920 64,714 104,337 26.7 37.6 50.6 62.0
Male Householder w/Children <18 Years Old
1,143 6,284 1,995 7,866 2,825 8,186 3,389 7,400 18.2 25.4 34.5 45.8
Female Householder w/Children <18 Years Old
4,041 27,327 6,219 27,877 9,866 30,034 13,140 29,032 14.8 22.3 32.9 45.3
Family Household without Children <18 Years Old
15,240 77,612 21,660 72,155 29,199 70,521 41,397 81,996 19.6 30.0 41.4 50.5
Non-Family Household 8,293 39,381 13,220 40,199 17,442 40,884 20,136 42,333 21.1 32.9 42.7 47.6
Source: U.S. Bureau of the Census, Current Population Survey supplements, October 1997,December 1998, August 2000, September 2001. Notes: a Age 25 and older. b Age 16 and Older. c Both people who are unemployed and people not in the labor force.

A NATION ONLINE: How Americans Are Expanding Their Use of the Internet
28 Economics and Statistics Administration
Table 2-3: Percent Difference and Growth Rates, Internet Use From Any Location by Individuals Age 3 and Older, October 1997, December 1998, August 2000, and September 2001
Internet Use (percent) Percentage Point Difference Growth in Use Rate
(annual rate)
Oct. 1997*
Dec. 1998
Aug. 2000
Sept. 2001
1997 to 1998*
1998 to 2000
2000 to 2001
1998 to
2001
1997 to
1998*
1998 to
2000
2000 to
2001
1998 to
2001 Total Population 22.2 32.7 44.4 53.9 n/a 11.7 9.5 21.2 n/a 20 20 20 Gender
Male 24.3 34.2 44.6 53.9 n/a 10.4 9.3 19.7 n/a 17 19 18 Female 20.2 31.4 44.2 53.8 n/a 12.8 9.7 22.5 n/a 23 20 22
Race/ Origin
White 25.3 37.6 50.3 59.9 n/a 12.7 9.7 22.4 n/a 19 18 19 Black 13.2 19.0 29.3 39.8 n/a 10.3 10.5 20.7 n/a 30 33 31 Asian Amer. & Pac. Isl. 26.4 35.8 49.4 60.4 n/a 13.6 11.1 24.7 n/a 21 21 21 Hispanic 11.0 16.6 23.7 31.6 n/a 7.1 7.9 15.0 n/a 24 30 26
Employment Status
Employed b 28.5 42.5 56.6 65.4 n/a 14.1 8.9 23.0 n/a 19 14 17
Not Employed b, d 12.4 19.5 28.9 36.9 n/a 9.4 8.1 17.4 n/a 27 26 26 Family Income
Less than $15,000 9.2 13.7 18.9 25.0 n/a 5.2 6.2 11.4 n/a 21 30 25 $15,000 - $24,999 11.6 18.4 25.5 33.4 n/a 7.1 7.9 15.0 n/a 22 28 24 $25,000 - $34,999 17.1 25.3 35.7 44.1 n/a 10.4 8.4 18.8 n/a 23 22 22 $35,000 - $49,999 22.8 34.7 46.5 57.1 n/a 11.9 10.6 22.5 n/a 19 21 20 $50,000 - $74,999 32.3 45.5 57.7 67.3 n/a 12.2 9.6 21.8 n/a 15 15 15
$75,000 & above 44.5 58.9 70.1 78.9 n/a 11.2 8.9 20.0 n/a 11 12 11 Educational Attainment
Less Than High School a 1.8 4.2 8.8 12.8 n/a 4.6 4.0 8.5 n/a 55 41 49
High School Diploma / GED a 9.7 19.2 30.6 39.8 n/a 11.4 9.2 20.6 n/a 32 27 30
Some College a 24.8 38.6 54.2 62.4 n/a 15.7 8.1 23.8 n/a 23 14 19 Bachelors Degree a 41.4 58.4 72.5 80.8 n/a 14.0 8.4 22.4 n/a 14 11 13
Beyond Bachelors Degree a 51.9 66.4 78.5 83.7 n/a 12.1 5.3 17.4 n/a 11 6 9
Age Group (and Labor Force) Age 3 – 8 7.2 11.0 15.3 27.9 n/a 4.3 12.6 16.9 n/a 22 74 40 Age 9 – 17 33.2 43.0 53.4 68.6 n/a 10.4 15.3 25.7 n/a 14 26 19
Age 18 – 24 31.6 44.3 56.8 65.0 n/a 12.6 8.5 21.0 n/a 16 13 15 Age 25 – 49 27.1 40.9 55.4 63.9 n/a 14.4 8.6 23.0 n/a 20 14 18
Male 29.3 41.7 54.1 61.8 n/a 12.4 7.6 20.0 n/a 17 13 15 Female 25.1 40.2 56.5 66.0 n/a 16.4 9.5 25.8 n/a 23 15 20
Age 50 + 11.2 19.3 29.6 37.1 n/a 10.3 7.5 17.8 n/a 29 23 27 Male 14.6 22.8 32.7 39.9 n/a 9.9 7.2 17.1 n/a 24 20 23 Female 8.4 16.4 26.9 34.6 n/a 10.6 7.7 18.3 n/a 35 26 31
Geographic Location of Household In Which the Individual Lives
Rural n/a 29.3 42.5 52.9 n/a 13.2 10.4 23.6 n/a 25 22 24 Urban n/a 33.9 45.0 54.2 n/a 11.1 9.2 20.3 n/a 19 19 19
Urban Not Central City n/a 36.1 47.9 57.4 n/a 11.8 9.6 21.4 n/a 18 18 18 Urban Central City n/a 30.6 40.6 49.1 n/a 9.9 8.6 18.5 n/a 18 19 19

A NATION ONLINE: How Americans Are Expanding Their Use of the Internet
National Telecommunications and Information Administration 29
Internet Use (percent) Percentage Point Difference Growth in Use Rate
(annual rate)
Oct. 1997*
Dec. 1998
Aug. 2000
Sept. 2001
1997 to 1998*
1998 to 2000
2000 to 2001
1998 to
2001
1997 to
1998*
1998 to
2000
2000 to
2001
1998 to
2001 Household Type In Which the Individual Lives
Married Couple w/Children <18 Years Old
26.7 37.6 50.6 62.0 n/a 13.0 11.4 24.4 n/a 20 21 20
Male Householder w/Children <18 Years Old
18.2 25.4 34.5 45.8 n/a 9.1 11.3 20.4 n/a 20 30 24
Female Householder w/Children <18 Years Old
14.8 22.3 32.9 45.3 n/a 10.5 12.4 23.0 n/a 26 34 29
Family Household without Children <18 Years Old
19.6 30.0 41.4 50.5 n/a 11.4 9.1 20.5 n/a 21 20 21
Non-Family Household 21.1 32.9 42.7 47.6 n/a 9.8 4.9 14.7 n/a 17 11 14
Source: U.S. Bureau of the Census, Current Population Survey supplements, October 1997, December 1998, August 2000, September 2001. Notes:*The October 1997 question on Internet use was worded considerably differently than the questions used in the following years. The use rates calculated from the October 1997 data are likely correct in terms of their order of magnitude. Growth rates have, however, not been calculated because the implied precision of the year-to-year comparisons would be inaccurate. a Age 25 and older. b Age 16 and Older. c Both people who are unemployed and people not in the labor force.

A NATION ONLINE: How Americans Are Expanding Their Use of the Internet
30 Economics and Statistics Administration
CHAPTER 3: ONLINE ACTIVITIES
As increasing numbers of Americans are going online, they are engaging in a wide variety of online activities. Nearly half (45.0 percent) of the population now uses e-mail. The September 2001 survey asked respondents to report on activities in 16 areas, compared to the nine activities measured in the August 2000 survey. This year’s survey revealed that activity levels for the original nine categories continued to grow, while also reporting strong activity levels for the newly added categories.
Primary Uses by the U.S. Population The chief uses of the Internet remained the same in September 2001 as in August 2000, but occurred at much higher levels (Figure 3-1). The predominant use continued to be e-mail or instant messaging. In September 2001, nearly half of the population used e-mail (45.2 percent, up from 35.4 percent in 2000). Searching for information also ranked high: approximately one-third of Americans used the Internet to search for product and service information (36.2 percent, up from 26.1 percent in 2000), and to search for news, weather, and sports information (33.3 percent, up from 19.2 percent in 2000).
In addition, many more Internet users reported making online purchases or conducting online banking. The August 2000 survey combined these two categories and found that 13.3 percent of online users were engaged in both activities. The September 2001 survey, however, asked about these activities separately and found that 21.0 percent made online purchases and 8.1 percent conducted banking online.
Figure 3-1: Online Activities, 2000 and 2001 as a Percentage of Total U.S. Population, Persons Age 3 +
45.2
36.2
33.3
21.0
7.5
2.8
35.4
26.1
19.2
13.3
7.1
2.5
0 20 40 60 80 100
Product/Service Information Search
News, Weather, Sports
Product/Service Purchases
Employment Search
Make Phone Calls
20002001
Source: NTIA and ESA, U.S. Department of Commerce, using U.S. Census Bureau Current Population Survey Supplements

A NATION ONLINE: How Americans Are Expanding Their Use of the Internet
National Telecommunications and Information Administration 31
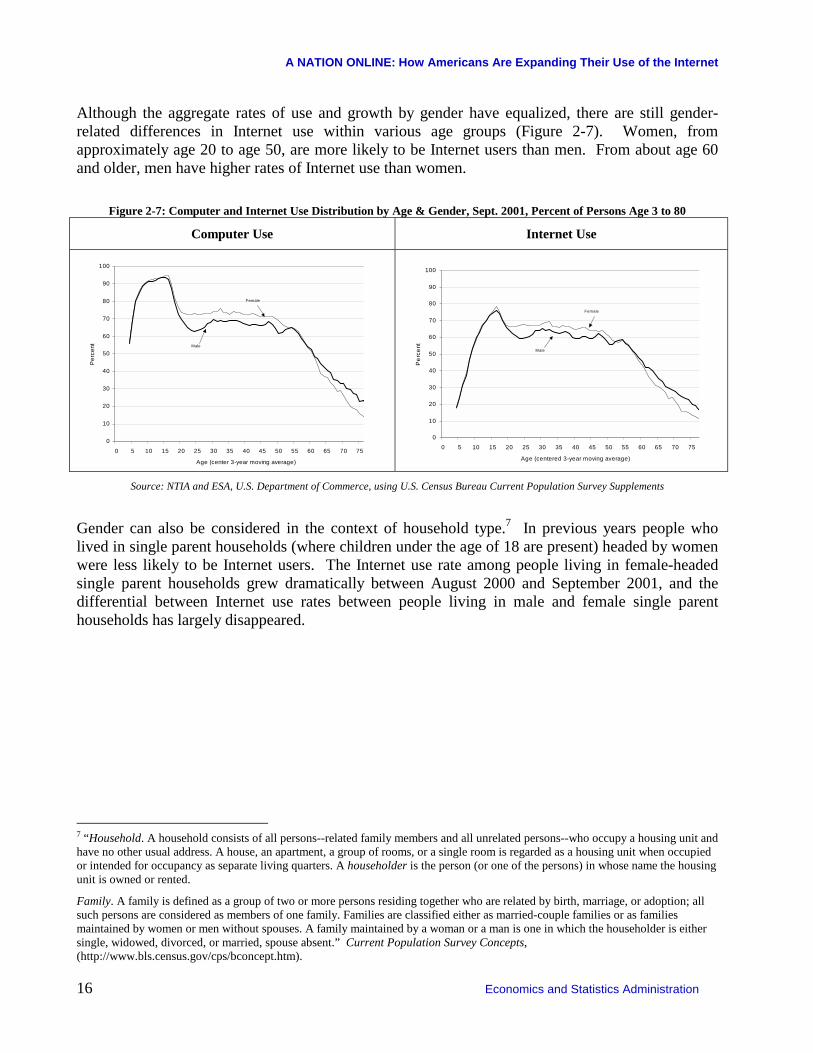
Activities Among Those Individuals Online Looking more specifically at Internet users, e-mail easily outdistances all other online activity (Figure 3-2). Online users are also connecting to the Internet in large numbers to search for information, whether it is product/services, health, or government services. The Internet is also a source for news and sports for many online users. To the extent that product/service purchases, online trading, and online banking represent consumers engaged in e-commerce, that activity is fairly strong and growing.
Figure 3-2: Activities of Individuals Online, 2001 As a Percentage of Internet Users, Persons Age 3 +
84.0
67.3
61.8
42.1
39.1
34.9
30.9
24.8
18.8
17.3
17.9
16.4
8.8
5.2
3.5
0 20 40 60 80 100
Product/Service Information Search
News, Weather, Sports
Playing Games
Product/Service Purchases
Health Services or Practices Info. Search*
Government Services Search*
Complete School Assignment**
View TV/Movies, Listen to Radio
Chat Rooms or Listservs
On-Line Banking*
Job Search*
Trade Stocks, Bonds, Mutual Funds*
Make Phone Calls
On-Line Education Course
*These online activities surveyed individuals age 15 and over only. **This activity was asked of all respondents. If the response was restricted to individuals enrolled in school, the percentage of Internet users completing school assignments would increase to 77.5 percent.
Source: NTIA and ESA, U.S. Department of Commerce, using U.S. Census Bureau Current Population Survey Supplements
Whether an Internet user engages in a certain activity varies by some, but not all, demographic factors. For example, geography has little impact on the selection of activity. The proportions of Internet users engaged in specific online activities varies little across regions, and was similar regardless of whether the Internet user lived in a rural, urban, or central city area. Household type also showed little, if any, differences. Gender, age, race, and income, however, do have some relationship with Internet users’ selection of online activities, as discussed below.

A NATION ONLINE: How Americans Are Expanding Their Use of the Internet
32 Economics and Statistics Administration
Gender Male and female Internet users engage in some online activities at different rates. More men than women used the Internet to check news, weather, and sports (67.1 percent versus 56.7 percent respectively), but more women went online to find information on health services or practices (39.8 percent contrasted with 29.6 percent for men). A higher proportion of male Internet users use the Internet for financial purposes as compared with females: they were more than twice as likely as females to trade online (12.6 percent of males compared to 5.3 percent of females), and males were slightly more likely to bank online than female users (19.3 percent versus 16.5 percent).
A larger percentage of male Internet users reported using the Internet for entertainment-oriented activities. A higher proportion of males versus females played games online (45.3 percent versus 39.1 percent, respectively) and viewed television or movies or listened to the radio (21.9 percent versus 15.9 percent, respectively).
Men and women responded similarly for the remaining categories surveyed. For example, 82.8 percent of male Internet users e-mailed, compared to 85.1 percent of female Internet users; 16.9 percent of male Internet users searched online for jobs, compared to 16.0 percent of female Internet users; and 18.4 percent of male Internet users participated in online chat rooms or list servs, compared to 16.3 percent of female Internet users.
Age An Internet user’s age also affects online use and activities. Those 55 and older were least likely to use the Internet in many of the surveyed categories, such as playing games, job searching, participating in chat rooms or list servs, viewing television or movies, listening to the radio, or trading online. On the other hand, this age group was more likely (42.7 percent) than any other age group to check health information online. And those 55 and older showed equally strong e-mail use as any other adult age group.
Internet users in the 25-34 age group were the most likely to bank online (26.1 percent), followed by the Internet users in the 35-44 age group (21.3 percent), the 45-54 age group (17.7 percent) and the 55 and above age group (13.0 percent).
Online shopping is particularly common among 25-34 years old Internet users. About half of the people in this age group (53.0 percent) used the Internet for online shopping, as did 51.2 percent of the 35-44 year olds.
An in depth look at Internet users under the age of 25 is presented in Chapter 5.
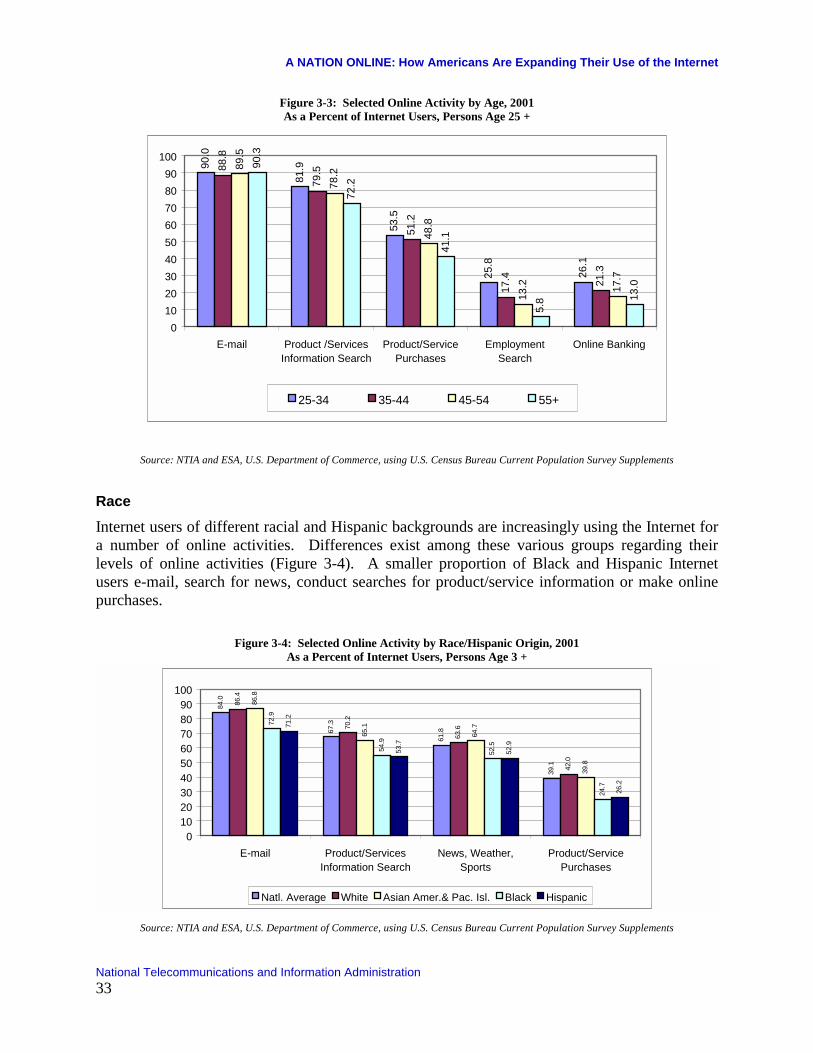
A NATION ONLINE: How Americans Are Expanding Their Use of the Internet
National Telecommunications and Information Administration 33
Figure 3-3: Selected Online Activity by Age, 2001 As a Percent of Internet Users, Persons Age 25 +
90.0
81.9
53.5
25.8
26.1
88.8
79.5
51.2
17.4 21
.3
89.5
78.2
48.8
13.2 17
.7
90.3
72.2
41.1
5.8 13
.0
0102030405060708090
100
E-mail Product /ServicesInformation Search
Product/ServicePurchases
EmploymentSearch
Online Banking
25-34 35-44 45-54 55+
Source: NTIA and ESA, U.S. Department of Commerce, using U.S. Census Bureau Current Population Survey Supplements
Race Internet users of different racial and Hispanic backgrounds are increasingly using the Internet for a number of online activities. Differences exist among these various groups regarding their levels of online activities (Figure 3-4). A smaller proportion of Black and Hispanic Internet users e-mail, search for news, conduct searches for product/service information or make online purchases.
Figure 3-4: Selected Online Activity by Race/Hispanic Origin, 2001 As a Percent of Internet Users, Persons Age 3 +
84.0
67.3
61.8
39.1
86.4
70.2
63.6
42.0
86.8
65.1
64.7
39.8
72.9
54.9
52.5
24.7
71.2
53.7
52.9
26.2
0102030405060708090
100
E-mail Product/ServicesInformation Search
News, Weather,Sports
Product/ServicePurchases
Natl. Average White Asian Amer.& Pac. Isl. Black Hispanic
Source: NTIA and ESA, U.S. Department of Commerce, using U.S. Census Bureau Current Population Survey Supplements

A NATION ONLINE: How Americans Are Expanding Their Use of the Internet
34 Economics and Statistics Administration
Income Comparing income levels and online activities reveals a general pattern that shows broader use as income increases. The proportion of Internet users in the highest income level (households earning more than $75,000 a year) exceeds all other income groups in eight of the 16 online categories surveyed. As demonstrated in Table 3-1, these individuals were more likely to use the Internet to: search for health services or product information; search for government services or agency information; purchase products or services; search for products and services; bank, trade, or e-mail; or search for news, sports, or weather.
Table 3-1: Online Activities of Internet Users by Household Family Income, 2001 Percent of Internet Users Age 3 +
Under 15,000
15,000-24,999
25,000-34,999
35,000-49,999
50,000-74,999 Over 75,000
E-Mail/Instant Messaging 72.0 75.5 78.7 81.3 85.0 89.1 Playing Games 47.0 48.6 45.7 44.5 42.9 37.5 News, Weather, Sports 53.5 55.5 57.2 58.3 63.2 67.0 Product/Service Information Search 54.9 58.0 63.3 64.2 68.5 73.5 Complete School Assignments 37.1 27.3 25.1 22.9 23.3 24.6 Job Search 23.0 20.6 20.5 17.4 16.0 14.6 Chat Rooms or Listservs 23.0 20.0 18.8 16.9 16.5 16.5 Health Services or Practices Info. Search 29.5 29.9 32.7 32.9 35.1 38.9 Government Services Search 28.1 27.2 28.0 29.6 29.6 35.1 Product/Service Purchases 26.1 26.8 31.4 35.0 39.4 49.1 View TV/Movies, Listen to Radio 20.0 19.1 19.1 18.6 18.5 19.8 Online Banking 12.8 12.1 14.4 15.6 18.0 23.0 Online Education Course 4.0 3.2 3.1 3.6 3.5 4.0 Trade Stocks, Bonds, Mutual Funds 3.2 2.9 4.9 6.3 8.1 13.8 Make Phone Calls 6.7 6.3 5.2 5.9 4.8 5.1
Source: NTIA and ESA, U.S. Department of Commerce, using U.S. Census Bureau Current Population Survey Supplements

A NATION ONLINE: How Americans Are Expanding Their Use of the Internet
National Telecommunications and Information Administration 35
CHAPTER 4: HOW AND WHERE AMERICA GOES ONLINE
Internet users are expanding how and where they go online. Faster connection speeds through digital subscriber lines (DSL) and cable are now available to more users as these technologies continue to expand their geographical reach. New devices offer the opportunity for access without a computer and increased mobility of use. Most striking, however, is the growth in the number of people who use the Internet from more than one location.
Connection Types: The Expansion of Broadband Most individuals who use the Internet at home make that connection via a regular “dial up” telephone line (80.0 percent), with cable modems being the second most common way to connect (12.9 percent), followed by DSL (6.6 percent).
Figure 4-1: Home Internet Connection Type, 2001 as a Percent of Individuals Using the Internet at Home
Source: NTIA and ESA, U.S. Department of Commerce, using U.S. Census Bureau Current Population Survey Supplements
Generally referred to as “broadband,” cable modems and DSL allow for higher speed access than is available through dial-up.14 The use of these services in residential settings has rapidly increased over the past year. In August 2000, only 5.0 percent of all individuals or 11.2 percent of home Internet users claimed to have something faster than a dial-up service in their homes.
14 This study asked respondents about the two most common broadband technologies available in the United States, digital subscriber line (DSL) and cable modems plus any “other” higher-speed Internet access used at home. These technologies usually feature broadband capabilities, although some applications or connections may possess speeds lower than the 200 kilobits per second—either in both directions or only upstream— that the Federal Communications Commission defines as “full broadband.” See In the Matter of Local Competition and Broadband Reporting, Report and Order, CC Docket No.99-301 (rel. March 30, 2000) at ¶ 22.
Dial-up80.0%
Cable Modem12.9%
Digital Subscriber Line
(DSL)6.6%
Other0.5%

A NATION ONLINE: How Americans Are Expanding Their Use of the Internet
36 Economics and Statistics Administration
As of September 2001, those figures had risen to 10.8 percent of the population or 20.0 percent of individuals who use the Internet at home.15
This strong growth of approximately 116 percent over a 13-month period coincides with the growing availability of these services. Until very recently, broadband was only available in selected areas of the country. For example, the Federal Communications Commission (FCC) reported that high-speed subscribers were present in 75 percent of the nation's zip codes at the end of December 2000 as compared to 56 percent at the end of 1999. The deployment of broadband occurred first in higher density areas. According to the FCC, high-speed subscribers were present in 97 percent of the most densely populated zip codes at the end of December 2000 as compared to 45 percent of zip codes with the lowest population densities.16 As shown in Figure 4-2, differences by population density continued to carry over into 2001 with rural areas trailing urban areas and central cities.
Figure 4-2: Higher-Speed Internet Connection by Geographic Area as a Percent of Total U.S. Internet Households
10.712.2 11.8
7.3
19.1
22.0 21.2
12.2
0
5
10
15
20
25
U.S. Central Cities Urban Rural
20002001
Source: NTIA and ESA, U.S. Department of Commerce, using U.S. Census Bureau Current Population Survey Supplements
15 Homes with broadband have, on average, a higher number of individual Internet users. For example, on a household basis, Internet connection through something other than dial-up increased from 10.7 percent to 19.1 percent between August 2000 and September 2001 among those households with home Internet connection—lower percentages than recorded on an individual basis. 16 Http://www.fcc.gov/Bureaus/Common_Carrier/News_Releases/2001/nrcc0133.html

A NATION ONLINE: How Americans Are Expanding Their Use of the Internet
National Telecommunications and Information Administration 37
The growth in broadband subscribership compares favorably to the deployment rates of other communications technologies and services. Broadband deployment reached 8 percent of U.S. households in early 2001—an adoption speed that outstrips other technologies such as color television, cell phones, pagers, and VCRs.17
Figure 4-3: Rate of Deployment of Selected Technologies
0
2
4
6
8
10
12
1 2 3 4 5 6
Perc
ent o
f Hou
seho
lds
Broadband Color TV PagersCell Phones VCRs
Source: eBrain Market Research and the National Cable and Telecommunications Association
Because cable and DSL Internet are more costly than dial-up services, the proportion of Internet users subscribing to these broadband services varies in expected ways, with individuals in high-income households, for example, having higher subscribership rates than individuals in lower income households.
Individuals with broadband access at home had a modestly greater likelihood of engaging in the activities shown in Figure 3-2. For example, although 84 percent of Internet users send e-mail, that figure rises to 87 percent for broadband users specifically. The only activity reflecting a large difference between broadband users and the Internet-using population, in general, is in the viewing of television or movies or listening to the radio. In September 2001, 28.2 percent of broadband users engaged in these activities, compared to 18.8 percent of Internet users generally.
Spread of New Devices The vast majority of Internet users in the United States still access the Internet through a desktop or laptop computer.18 Although the number of people using alternative Internet access devices is increasing, the survey revealed that people who use them typically also have a computer. In
17 Although it uses a different definition of “broadband” than is used in this report, Figure 4-3 provides a useful illustration of the relative deployment speeds of some familiar communications technologies. See supra note 14 for discussion of broadband definition. 18 This is not universally the case in other countries. In Japan, for example, 30 million people access the Internet through NTT DoCoMo’s i-Mode using a handheld device. Although iMode does not have full Internet capability, it is widely used in Japan to access the subset of Internet information available to subscribers. See http://www.NTTdocomo.com.

A NATION ONLINE: How Americans Are Expanding Their Use of the Internet
38 Economics and Statistics Administration
September 2001, only 1.5 percent of the households that had home Internet access did not also have a computer.
The only category of alternative Internet access device owned by more than 2 percent of households is Internet-enabled cell phones or pagers (4.8 percent) and virtually all of these households also have computers.19 Only 1.8 percent of households include a household member who has an Internet accessible personal digital assistant (PDA) or other handheld device, and 0.6 percent of households have Internet access through a television-based system. The television-based systems are the only category of alternative access devices where a substantial proportion of subscribing households do not also have a computer (44.4 percent), but this category accounts for 0.6 percent of total households.
Location of Use Increased use of mobile Internet devices may eventually make the question of location less important. For now, however, when most access still occurs through less than portable personal computers, where people use the Internet may have implications for the quality of access they enjoy (i.e., the degree of availability or access they actually have) or the type of activities they undertake online.20 For example, home Internet access may be thought of as a higher quality type of access because it is available (theoretically) 24 hours a day, seven days a week, while school or library access periods are limited to specific hours and often with time limits per session.
As shown in Figure 4-4, the most significant change between December 1998 and September 2001 is the substantial increase in the proportion of people who use the Internet both at home and from some other location.21 At the end of 1998, only 6.5 percent of the population used the Internet both at home and from some other location. In just under three years, that figure had almost quadrupled to 24.5 percent. That a growing number of people connect from multiple locations could indicate that the Internet is increasingly viewed as a basic communication and information tool, closer in nature to the telephone than the desktop computer.
Figure 4-4 also gives information as to the change in the proportion of the population using the Internet in each category: at home and from some other location. In December 1998, 22.3 percent of the population used the Internet at home (15.8 percent plus 6.5 percent). Home use had grown to 43.6 percent by September 2001. Similarly, Internet use from a location outside the home grew from 17.0 percent to 34.8 percent over the same period.
19 The questions on Internet access devices were asked only of the household. No information is available on actual use of these devices on a per person basis. 20 The sample size of households that have Internet-enabled cell phones or pagers, but no computer, is too small for a reliable estimate to be reported. 21 December 1998 is used as a basis of comparison rather than August 2000. The data from the August 2000 survey reflected the fact that students were generally not in school when the survey took place, and there appeared to be a downward bias on Internet use outside of the home.

A NATION ONLINE: How Americans Are Expanding Their Use of the Internet
National Telecommunications and Information Administration 39
Figure 4-4: Internet Use by Location as a Percent of U.S. Population, 1998 and 2001
15.8
19.1
6.5
24.5
10.5
10.3 46.1
67.2
0% 20% 40% 60% 80% 100%
Dec 1998
Sept 2001
Home Only Home & Outside the HomeOutside of Home Only Does Not Use the Internet
Source: NTIA and ESA, U.S. Department of Commerce, using U.S. Census Bureau Current Population Survey Supplements
“Outside the home” covers a variety of locations. The September 2001 survey asks specifically about Internet use at six locations: work, school, public libraries, community centers, someone else’s house, and “somewhere else.” Figure 4-5 shows that no single category of “outside the home” comes close to Internet use at home in terms of utilization by a proportion of the U.S. population. However, percent of the total population may not be the most useful basis on which to consider location of use. For example, the 51.9 million people who use the Internet at work represent 19.6 percent of the population, but 38.4 percent of those who work. Similarly, the 31.5 million who use the Internet at school account for only 11.9 percent of the total population, but 44.8 percent who attend school. Chapters 5 and 6 focus specifically on these school and work subgroups.
Figure 4-5: Internet Use by Specific Location as a Percent of U.S. Population
43.6
19.6
11.9
5.4
0.6
5.8
05
101520253035404550
Home Work School Library CommunityCenter
Someoneelse's House
Perc
ent
Source: NTIA and ESA, U.S. Department of Commerce, using U.S. Census Bureau Current Population Survey Supplements

A NATION ONLINE: How Americans Are Expanding Their Use of the Internet
40 Economics and Statistics Administration
Of the universe of Internet users, 10.0 percent of Internet users access the Internet at a public library. This proportion remained virtually constant between August 2000 and September 2001. Over one-half of the population that uses the Internet at a public library is under age 25. Additionally, 14.0 percent of Internet users do not use the Internet at home, school, or work.
Internet use at public libraries varies by race and income: only 8.6 percent of Whites that use the Internet use the public library as an access point, while the comparable figures for Blacks and Hispanics are 18.7 percent and 13.8 percent, respectively. Among Asian Americans and Pacific Islanders, 11.6 percent of Internet users accessed the Internet at public libraries.
As shown in Figure 4-6, most of the people who use the Internet at public libraries also use the Internet at other locations. Among racial and ethnic groups, 12.7 percent of Whites, 19.4 percent of Blacks, and 16.0 percent of Hispanics using the Internet at libraries do not also access the Internet from home, work or school. Only 6.6 percent of Asian American and Pacific Islanders who use the Internet at a public library do not also use the Internet from some other location.
Figure 4-6: Public Library Internet Users, by Race and Sources of Other Access
as a Percent of Internet Users that Use Internet Facilities at Public Libraries
Whites
24.5
17.745.0
12.7
Home, not Work or School Work or School, not HomeHome, Work, and School Not Home, Work or School
Blacks
17.5
33.329.8
19.418.7% of Internet Users Use Public Libraries
Hispanics
20.1
31.732.3
16.013.8% of Internet Users Use Public Libraries
8.6% of Internet Users Use Pubic Libraries
15.155.2
6.623.2
Asians11.6% of Internet Users Use Public Libraries
Source: NTIA and ESA, U.S. Department of Commerce, using U.S. Census Bureau Current Population Survey Supplements

A NATION ONLINE: How Americans Are Expanding Their Use of the Internet
National Telecommunications and Information Administration 41
Internet access at public libraries is more often used by those with lower incomes than those with higher incomes. Just over 20 percent of Internet users with household family incomes of less than $15,000 a year use public libraries, and 6.1 percent of Internet users in this income category do not use the Internet at home, work, or school. As household income rises, not only does the proportion of public library Internet users decline, but also the percentage of Internet users without alternative access points also declines.
Figure 4-7: Public Library Internet Users by Income and Location of Other Access as a Percent of Internet Users
6.14.1 5.2
1.5 0.8 0.2
10.9 7.9
9.18.6
7.0
14.2
0
5
10
15
20
25
Under $15,000 $15,000-$24,999 $25,000-$34,999 $35,000-$49,999 $50,000-$74,999 Over $75,000
Perc
ent
Public Library Users Using Library Only Public Library Users with Other Use Locations
Source: NTIA and ESA, U.S. Department of Commerce, using U.S. Census Bureau Current Population Survey Supplements

A NATION ONLINE: How Americans Are Expanding Their Use of the Internet
42 Economics and Statistics Administration
CHAPTER 5: THE DIGITAL GENERATION: HOW YOUNG PEOPLE HAVE EMBRACED COMPUTERS AND THE INTERNET
Children and young adults have embraced new information technologies in large numbers. More than any other age group, these younger age groups use computers and the Internet widely for many of their daily activities.
This chapter explores the increasingly large number of children and young adults who have computers and online access, where they get access outside the home, and how they use the Internet. We focus on children in lower elementary school (ages 5-9), later elementary and junior high school (ages 10-13), and high school (ages 14-17), as well as young adults (ages 18-24). This year’s survey also asked parents about concerns about exposing children to online content, and whether that has affected their decisions to go online or to maintain Internet access.
Computer and Internet Use As noted in Chapter 2, children and young adults under 25 are significant users of new information technologies. By the age of 10, young people are more likely to use the Internet than adults at any age beyond 25. The high rate of use among children and young adults is reflected in higher rates of Internet connectivity within family households with children, as well as in high use rates among these age groups both at home and outside the home.
Family households with children under age 18 are far more likely to have computers than families without children: 70.1 percent, compared to 58.8 percent. They are also more likely to have Internet subscriptions: 62.2 percent versus 53.2 percent. The presence of children is also associated with modestly higher rates of broadband connectivity through DSL or cable modem: 18.4 percent for families with children, compared to 16.9 percent for those without children (Figure 5-1).
Figure 5-1: Access Among Families With and Without Children, 2001 as a Percentage of U.S. Households
70.162.2
18.4
58.853.2
16.9
0102030405060708090
100
Computers Internet Broadband
Perc
ent
Households with Children Households without Children
Source: NTIA and ESA, U.S. Department of Commerce, using U.S. Census Bureau Current Population Survey Supplements

A NATION ONLINE: How Americans Are Expanding Their Use of the Internet
National Telecommunications and Information Administration 43
Individual computer and Internet use among all groups of children and young adults has also soared in the last few years. With regard to computer use, 89.5 percent of all school-aged children (between the ages of 5-17) use computers. Within the same age range, 58.5 percent use the Internet. Internet use is particularly high for teens and pre-teens.22 More than three-quarters (75.6 percent) of 14-17 year olds and 65.4 percent of 10-13 year olds use the Internet at some location, up from 51.2 and 39.2 percent in 1998 (Figure 5-2).
Among 18-24 year olds, Internet use is heavily affected by whether or not they attend school or college. Among those in school or college, 85.0 percent use the Internet, compared to 51.5 percent of those who are not in school.
Figure 5-2: Internet Use at Any Location, 1998 and 2001 as a Percent of U.S. Population
4.1
16.8
39.2
51.2
63.2
29.9
14.3
38.9
65.4
75.6
85
51.5
0
10
20
30
40
50
60
70
80
90
100
3-4 years old 5-9 years old 10-13 yearsold
14-17 yearsold
18-24 yearsold in school
18-24 yearsold not inschool
19982001
Source: NTIA and ESA, U.S. Department of Commerce, using U.S. Census Bureau Current Population Survey Supplements
In addition to much higher overall use, children and young adults are also far more likely to use the Internet outside the home than they were in previous years. In fact, “outside home” use is nearly equivalent to “at home” use for almost every age group (and exceeds “at home” use for 18-24 year olds in school or college). For example, as Figure 5-3 demonstrates, nearly equal percentages of teenagers used the Internet outside the home (60.7 percent) as at home (61.4 percent). This contrasts with 1998 levels for teenagers of 26.9 percent “outside home” use, compared to 32.9 percent at home. Similarly, in 1998, 19.2 percent of 10-13 year olds used the Internet outside the home, compared to 25.4 percent at home.
22 Figure 5-2 compares the September 2001 survey results to December 1998 Census survey data, which provided a more complete data set on student use than the August 2000 survey taken during the summer vacation.

A NATION ONLINE: How Americans Are Expanding Their Use of the Internet
44 Economics and Statistics Administration
Figure 5-3: Internet Use Among Children At Home/Outside Home/Any Location, 2001 as a Percent of U.S. Population
43.6
28.3
51.1
68
38.2
34.8
25.3
49.8
60.7
71.9
24.5
53.9
38.9
65.4 75
.6 85
51.561
.4
01020
3040506070
8090
100
Natl. Average 5-9 years old 10-13 yearsold
14-17 yearsold
18-24 yearsold in school
18-24 yearsold not inschool
Perc
ent
At Home Outside Home Any Location
Source: NTIA and ESA, U.S. Department of Commerce, using U.S. Census Bureau Current Population Survey Supplements
The high rate of Internet use outside the home among young people 10 years old and up is considerably different from the overall national figures for all ages, and is largely accounted for by use at schools, as discussed in the following section.
The Impact of Schools on Internet and Computer Use Most “outside home” use is at schools, where children and young adults use computers and the Internet at high levels. As shown in Figure 5-4, young people are using computers at high levels, even in elementary school. For example, almost every young adult (95.9 percent) between ages 18 and 24, who attends school or college, uses a computer: 86.1 percent in school (20.8 percent only at school and 65.3 percent both at home and school), and 74.5 percent at home (9.2 percent only at home and 66.3 percent both at home and school). Even among 5 to 9 year olds, a large portion (84.3 percent) are using computers at home, at school, or both.

A NATION ONLINE: How Americans Are Expanding Their Use of the Internet
National Telecommunications and Information Administration 45
Figure 5-4: Computer Use by Age and Location, 200123
20.75
22.05
24.66
25.76
65.3
63.1
59.9
48.2
10 45.4
4.14
6.63
7.93
15.65
7.5
8.1
9.2
44.6
10.4 10.0
4.1
6.6
0.6
0% 20% 40% 60% 80% 100%
18-24 years old not inschool
18-24 years old inschool
14 to 17 years old
10 to 13 years old
5 to 9 years old
School, Not Home School and Home Home, Not SchoolOther, Not Home Does Not Use a Computer
Source: NTIA and ESA, U.S. Department of Commerce, using U.S. Census Bureau Current Population Survey Supplements
Figure 5-5 also indicates the widespread use of the Internet by young people both at home and at school, although Internet use is not yet at the same high levels as computer use. For example, more than three-quarters of 14-17 year olds use the Internet at home, at school, or both: 55.4 percent use the Internet at school (42.8 percent both at home and school, and 12.6 percent only at school), while 61.4 percent use it at home (42.8 percent both at home and school, and 18.6 percent only at home). Even three out of eight 5-9 year olds (or 37.6 percent) use the Internet at home and/or school.
23 The percentages in the two oldest categories do not add to 100% because 0.6% of the individuals in school between the ages of 18 and 24 use a computer at work, but not at home or school and 0.1% of those between 14 and 17 use a computer at work, but not at home or school.

A NATION ONLINE: How Americans Are Expanding Their Use of the Internet
46 Economics and Statistics Administration
Figure 5-5: Internet Use by Age and Location, 2001
15.3
12.6
12.8
9.4
42.8
32.4
12.8
48.5
15.0
24.4
34.6
61.1
49.6
15.4
38.2
18.3
18.6
18.7
1.22
1.56
1.54
1.7
13.3
0% 20% 40% 60% 80% 100%
18-24 years old not inschool
18-24 years old inschool
14 to 17 years old
10 to 13 years old
5 to 9 years old
School, Not Home School and Home Home, Not SchoolOther, Not Home Does Not Use the Internet
Source: NTIA and ESA, U.S. Department of Commerce, using U.S. Census Bureau Current Population Survey Supplements
Figures 5-6, 5-7, and 5-8 show the significance of having computers at school in bringing technology to children of various backgrounds.24 Figure 5-6 shows that 80.7 percent of children (ages 10-17) in the lowest income category use computers at school, little different from the 88.7 percent of children at the highest income level. School helps to equalize the disparity that would otherwise exist in computer and Internet use among the various household income categories. In the lowest income category, 33.1 percent of children use computers at home, in contrast to 91.7 percent of children in the highest income category. The gap in computer use narrows, however, from almost 60 points between the highest and lowest income children’s use at home to a 12 point gap in computer use when home and school are combined.
24 Figures 5-6 through 5-11 refer specifically to 10 to 17 year-olds. Similar patterns hold within the two component groups, 10 to 13 and 14 to 17, and for the two age groups not shown here, 5 to 9 and 18 to 24 in school. See Tables 5-1 and 5-2 for details.

A NATION ONLINE: How Americans Are Expanding Their Use of the Internet
National Telecommunications and Information Administration 47
Figure 5-6: Computer Use Among 10 to 17 Year-Olds By Income and Location, 2001
52.2
42.6
31.8
20.3
12.0
5.9
4.6
5.7
7.4
6.7
8.8
8.9
12.5
9.0
5.2
82.8
75.0
67.7
51.8
39.1
28.5
4.3
2.4
14.8
0% 20% 40% 60% 80% 100%
Under $15,000
$15,000-$24,999
$25,000-$34,999
$35,000-$49,999
$50,000-$74,999
Over $75,000
School, Not Home School and Home Home, Not School Does Not Use a Computer
Source: NTIA and ESA, U.S. Department of Commerce, using U.S. Census Bureau Current Population Survey Supplements
Similarly, as shown in Figure 5-7, Hispanic and Black children – who have lower computer use rates at home – approach computer use rates of Whites and Asian American and Pacific Islanders largely due to their computer use in school. A far higher percentage of Hispanic (38.9 percent) and Black (44.7 percent) children rely solely on schools to use computers than do Asian and Pacific Islanders (11.1 percent) and White children (15.1 percent). Because of the availability of school computers, overall computer use rates among children of different racial and ethnic backgrounds is comparable: 84.2 percent for Hispanic children, 88.8 percent for Black children, 94 percent for Asian and Pacific Islander children, and 95.4 percent for White children.

A NATION ONLINE: How Americans Are Expanding Their Use of the Internet
48 Economics and Statistics Administration
Figure 5-7: Computer Use Among 10 to 17 Year-Olds
By Race/Hispanic Origin and Location, 2001
15.1
11.1
44.7
38.9
71.8
70.7
39.4
38.6
8.5
12.2
4.7
6.7
6.0
11.2
15.6
4.5
0% 20% 40% 60% 80% 100%
White
Asian Amer. & Pacific Isl.
Black
Hispanic
School, Not Home School and Home Home, Not School Does Not Use a Computer
Source: NTIA and ESA, U.S. Department of Commerce, using U.S. Census Bureau Current Population Survey Supplements
Finally, Figure 5-8 shows that overall computer use rates for children of single parents – who have lower use rates at home – approach those of children from two-parent families due to computer use at school. More than twice as many children from single-parent families use computers only at schools as do children in two-parent families: 40.7 percent of children in female-headed households, 32.0 percent in male-headed households, and 16.6 percent in households with two parents.25 Because of school use, children from different family types have comparable overall computer use rates: 88.8 percent for children in female-headed households, 90.7 percent for children in male-headed households, and 94.4 percent of children in dual-parent households.
25 Rather than specify “mother” and “father,” non-two parent households headed by a female or male could also include an aunt, uncle, grandparent, or non-relative such as a foster parent.

A NATION ONLINE: How Americans Are Expanding Their Use of the Internet
National Telecommunications and Information Administration 49
Figure 5-8: Computer Use Among 10 to 17 Year-Olds By Household Type and Location, 2001
16.6
32.0
40.7
69.3
50.8
42.4
9.1
11.25.6
7.9
8.5 5.6
0% 20% 40% 60% 80% 100%
Two-Parent Household
Male-Headed Household
Female-HeadedHousehold
School, Not Home School and Home Home, Not School Does Not Use a Computer
Source: NTIA and ESA, U.S. Department of Commerce, using U.S. Census Bureau Current Population Survey Supplements
Schools also provide an important resource for Internet use for all children, regardless of their background. The levels of school-only Internet use, however, are not as high as the levels of school-only computer use. As a result, the availability of the Internet at schools does not compensate for disparities in home use to the same degree as computer use in schools.
As shown in Figures 5-9, 5-10, and 5-11, substantial differences in overall Internet use remain between children of different backgrounds. Figure 5-9 demonstrates that nearly four times as many children (ages 10-17) go online only at school when they live in a household in the lowest income category (20.8 percent) than at the highest income level (5.0 percent). However, overall school use still varies widely: 34.3 percent for children in the lowest income category, compared to 62.7 percent for children who live in the highest income households. Additionally, home Internet use is much higher for those who live in high income households: 82.5 percent for children in families earning $75,000 and higher, compared to 21.4 percent for children in families earning $15,000 and below. For these reasons, overall Internet use among children has a wider differential by income than computer use. Children in families at the lowest income level have an overall Internet use rate about half that of children at the highest income level: 45.7 percent, compared to 87.5 percent.
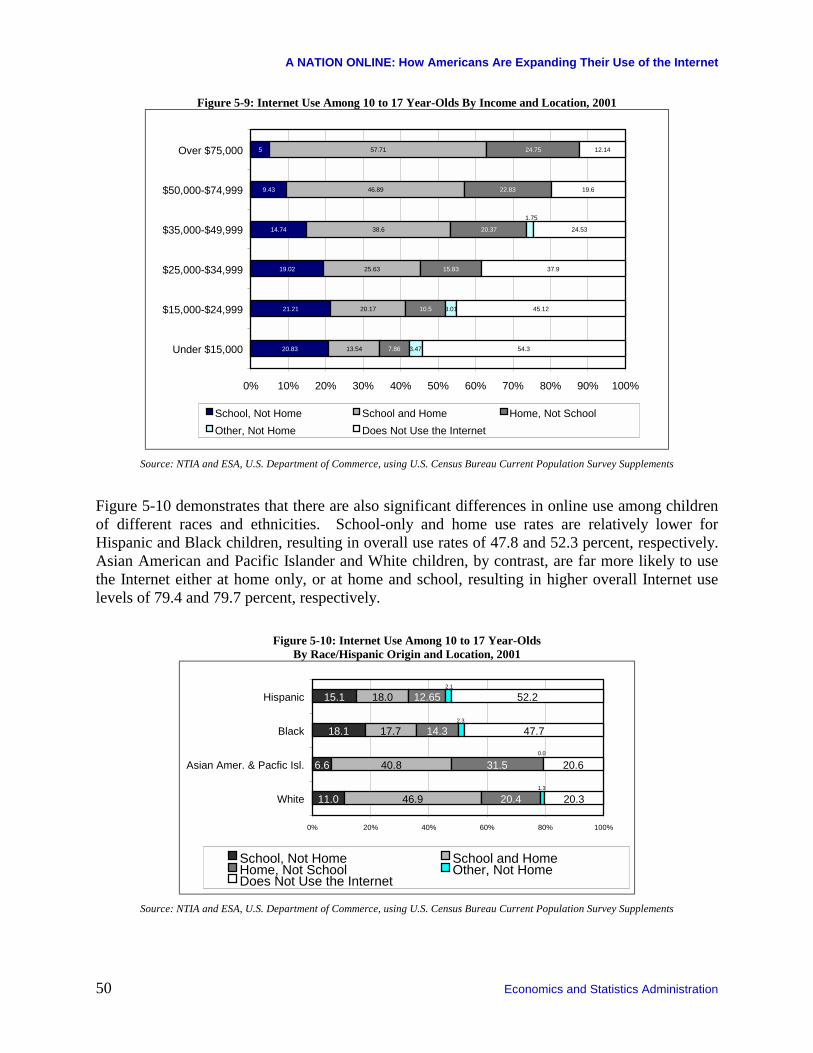
A NATION ONLINE: How Americans Are Expanding Their Use of the Internet
50 Economics and Statistics Administration
Figure 5-9: Internet Use Among 10 to 17 Year-Olds By Income and Location, 2001
21.21
19.02
14.74
9.43
5
13.54
20.17
25.63
38.6
46.89
57.71
7.86
10.5
15.83
20.37
22.83
3.47
3.01
54.3
45.12
37.9
24.53
19.6
12.14
20.83
24.75
1.75
0% 10% 20% 30% 40% 50% 60% 70% 80% 90% 100%
Under $15,000
$15,000-$24,999
$25,000-$34,999
$35,000-$49,999
$50,000-$74,999
Over $75,000
School, Not Home School and Home Home, Not SchoolOther, Not Home Does Not Use the Internet
Source: NTIA and ESA, U.S. Department of Commerce, using U.S. Census Bureau Current Population Survey Supplements
Figure 5-10 demonstrates that there are also significant differences in online use among children of different races and ethnicities. School-only and home use rates are relatively lower for Hispanic and Black children, resulting in overall use rates of 47.8 and 52.3 percent, respectively. Asian American and Pacific Islander and White children, by contrast, are far more likely to use the Internet either at home only, or at home and school, resulting in higher overall Internet use levels of 79.4 and 79.7 percent, respectively.
Figure 5-10: Internet Use Among 10 to 17 Year-Olds By Race/Hispanic Origin and Location, 2001
11.0
6.6
18.1
15.1
46.9
40.8
17.7
18.0
31.5
20.3
20.6
47.7
52.2
14.3
12.65
20.41.3
0.0
2.3
2.1
0% 20% 40% 60% 80% 100%
White
Asian Amer. & Pacfic Isl.
Black
Hispanic
School, Not Home School and HomeHome, Not School Other, Not HomeDoes Not Use the Internet
Source: NTIA and ESA, U.S. Department of Commerce, using U.S. Census Bureau Current Population Survey Supplements

A NATION ONLINE: How Americans Are Expanding Their Use of the Internet
National Telecommunications and Information Administration 51
Finally, Figure 5-11 shows similar patterns for children from households of different family types. Children in single-parent families are less likely to use the Internet at home (36.5 percent in female-headed households and 45.1 percent in male-headed households) than are children in two-parent families (64.2 percent). Because Internet use at school does not compensate for this difference, overall Internet use rates remain higher for children in two-parent families.
Figure 5-11: Internet Use Among 10 to 17 Year-Olds By Household Type, 2001
10.0
17.1
19.5
43.3
28.4
23.6
20.9
16.7
12.9
24.9
35.0
41.1
2.9
0.0
1.0
0% 20% 40% 60% 80% 100%
Two-Parent Household
Male-HeadedHousehold
Female-HeadedHousehold
School, Not Home School and HomeHome, Not School Only Other, Not HomeDoes Not Use the Internet
Source: NTIA and ESA, U.S. Department of Commerce, using U.S. Census Bureau Current Population Survey Supplements
While the vast majority of children and young adults uses the Internet either at home or school, there are some who use the Internet at other locations outside the home. This is captured in the “other only” category in Figures 5-9, 5-10, and 5-11. Approximately 12 percent of 10 to 17 year olds use the Internet at the library and a similar percentage use the Internet at a friend's house. (one-third of this group overlaps—i.e., they use the Internet at both the library and a friend's house). However, as shown in the figures above, only a very small percentage of Internet users in this age group rely solely on Internet access outside of home and school—2.1 percent—although this does vary by family income, race/Hispanic origin, and household type, as discussed in Chapter 2.
Using the Internet from a location other than home or school also varies by whether the student has Internet access at home. For example, 16.6 percent of Internet users in the 10-17 age bracket use the Internet at a public library. This percentage, however, rises to 29.3 percent among kids who use the Internet at school, but not at home. And although there are large differences in public library use among the various segments of this group (see Figure 5-12), overall public library use remains high for students who use the Internet at school, but not at home.

A NATION ONLINE: How Americans Are Expanding Their Use of the Internet
52 Economics and Statistics Administration
Figure 5-12: Internet Use at Public Libraries by Students Who Use the Internet at School, But Not at Home, Ages 10 to 17, 2001
29.3
39.447.2
32.024.1
0
10
20
30
40
50
60
70
80
90
100
Total White Black Asian Amer.& Pacific Isl.
Hispanic
Perc
ent
Source: NTIA and ESA, U.S. Department of Commerce, using U.S. Census Bureau Current Population Survey Supplements
How Young People Are Using the Internet Children and young adults have embraced the Internet in conducting their daily activities, and therefore, use the Internet in ways that differ from older adults. While older adults tend to use the Internet to check for news, sports, weather, or research products and services, children and young adults are more likely to use the Internet to complete school assignments or play games. And while very high percentages of all age groups – adults and children alike – use e-mail, older children and young adults are doing so at much higher levels.
As shown in Figure 5-13, children and young adults are most likely to use the Internet for schoolwork. More than half of all children over age 10, and three-quarters of all young adults (18 to 24 year olds) in school, use the Internet for this purpose. Nearly one-fifth of all elementary school students are also using the Internet for schoolwork.
Children and young adults also use the Internet for communication and entertainment. E-mail is a close second to schoolwork among teenagers and young adults. A very high percentage of all teenagers (62.1 percent) and young adults in school (75.0 percent) use e-mail, compared to 45.2 percent of the overall U.S. population. These two age groups also go online in higher percentages than other age groups to engage in chat rooms and to listen to the radio or watch TV or movies.
Generally, as children grow older, they use the Internet for more types of activities. The one exception is playing games, which peaks among 14-17 year olds. While Internet use is generally lower among 5-9 year olds, 25 percent of this age group uses the Internet to play games.

A NATION ONLINE: How Americans Are Expanding Their Use of the Internet
National Telecommunications and Information Administration 53
These patterns show that the Internet has become integrated into children’s daily routines, which involve school, entertainment, communication, and play. As children get older, they become far more likely to use the Internet to engage in such activities. As a result, teenagers and young adults in school are now among the highest Internet users.
Figure 5-13: Major Activities Among Children and Young Adults, 2001 As a Percentage of U.S. Population under 25 years old
46.9
76.6
86.190.1
43.2
63.8
82.189.3
66.4 64.761.0
50.6
11.017.9
26.9 27.8
5.6
16.0
34.2 33.7
0
10
20
30
40
50
60
70
80
90
100
5-9 years old 10-13 years old 14-17 years old 18-24 years old in school
Perc
ent
Schoolwork E-mail Playing Games Listening to Radio/Watch Movies Chatrooms
Source: NTIA and ESA, U.S. Department of Commerce, using U.S. Census Bureau Current Population Survey Supplements
Concerns About Children’s Online Use With the Internet becoming an increasingly common daily activity for children, there has been a heightened interest regarding the possible exposure of children to unsafe or inappropriate content online. Despite such concerns, it is clear that children are still using the Internet in increasingly high numbers. As discussed below, it is also apparent that these concerns are not a significant reason underlying a household’s decision to forego or to discontinue Internet access. Nevertheless, because these concerns have been raised, the September 2001 survey asked for the first time whether parents were more concerned about exposure of children to material on the Internet or to material on television.26
On a nationwide basis, a majority of respondents (68.3 percent) said that they were more concerned about their children’s exposure to material over the Internet. A lower percentage said they felt equally concerned about the propriety of Internet and television content (26.1 percent), and a small fraction (5.6 percent) said they felt less concerned about the Internet than television.
26 While the survey captured which medium caused parents greater concern, it did not capture the level of concern. The respondent might state that he or she felt “more concerned” about the Internet, but the survey does not measure whether the concern is slight or extreme.
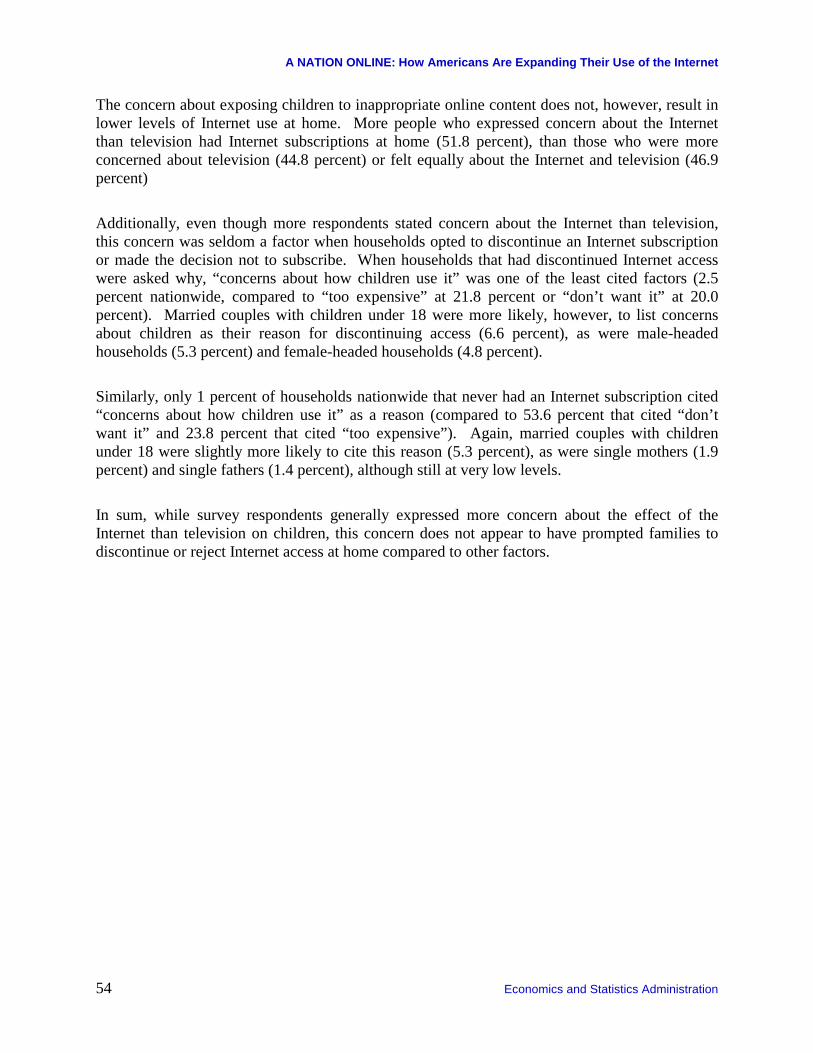
A NATION ONLINE: How Americans Are Expanding Their Use of the Internet
54 Economics and Statistics Administration
The concern about exposing children to inappropriate online content does not, however, result in lower levels of Internet use at home. More people who expressed concern about the Internet than television had Internet subscriptions at home (51.8 percent), than those who were more concerned about television (44.8 percent) or felt equally about the Internet and television (46.9 percent)
Additionally, even though more respondents stated concern about the Internet than television, this concern was seldom a factor when households opted to discontinue an Internet subscription or made the decision not to subscribe. When households that had discontinued Internet access were asked why, “concerns about how children use it” was one of the least cited factors (2.5 percent nationwide, compared to “too expensive” at 21.8 percent or “don’t want it” at 20.0 percent). Married couples with children under 18 were more likely, however, to list concerns about children as their reason for discontinuing access (6.6 percent), as were male-headed households (5.3 percent) and female-headed households (4.8 percent).
Similarly, only 1 percent of households nationwide that never had an Internet subscription cited “concerns about how children use it” as a reason (compared to 53.6 percent that cited “don’t want it” and 23.8 percent that cited “too expensive”). Again, married couples with children under 18 were slightly more likely to cite this reason (5.3 percent), as were single mothers (1.9 percent) and single fathers (1.4 percent), although still at very low levels.
In sum, while survey respondents generally expressed more concern about the effect of the Internet than television on children, this concern does not appear to have prompted families to discontinue or reject Internet access at home compared to other factors.

A NATION ONLINE: How Americans Are Expanding Their Use of the Internet
National Telecommunications and Information Administration 55
Table 5-1: Has Computer at Home and Uses Internet at Home, by Children 3-17 Years Old, 2001
Total 3-17 Years Old Home computer
Home Internet Use
Outside Home Internet Use
Number Percent Percent Percent Total 60,881 70.7 41.2 38.9 AGE 3-4 years 7,868 61.7 11.5 5.4 5-9 years 20,096 68.0 28.3 25.3 10-13 years 16,895 88.5 51.1 49.8 14-17 years 16,022 75.7 61.4 60.7 GENDER Male 31,183 70.3 41.1 38.7 Female 29,699 71.1 41.2 39.0 RACE/HISPANIC ORIGIN White non-Hispanic 38,170 82.7 50.2 44.5 Black 9,477 45.8 24.7 31.8 Asian Pacific Islander 2,591 81.3 51.6 37.3 Hispanic (of any race) 9,923 46.6 20.1 24.5 HOUSEHOLD TYPE Married-couple household 42,835 79.1 46.6 40.0 Male householder 3,093 57.2 33.0 37.8 Female householder 14,166 49.0 26.8 35.9 Nonfamily household 669 55.0 31.7 32.7 FAMILY INCOME Under $15,000 7,323 33.3 14.3 25.9 15,000-24,999 6,108 48.0 21.4 31.5 25,000-34,999 6,765 59.7 28.9 33.6 35,000-49,999 8,632 75.7 42.4 41.7 50,000-74,999 10,840 86.9 52.1 44.0 75,000+ 13,604 94.9 63.4 48.3 Not reported 7,596 62.6 37.1 34.4
Source: NTIA and ESA, U.S. Department of Commerce, using U.S. Census Bureau Current Population Survey Supplements

A NATION ONLINE: How Americans Are Expanding Their Use of the Internet
56 Economics and Statistics Administration
Table 5-2: Has Computer at Home and Uses Internet at Home by Young Adults 18-24 Years Old, Attending School or College, 2001
Total 18-24 Years Old
Home computer
Home Internet Use
Outside Home
Internet Use Number Percent Percent Percent In School or College 11,034 80.7 68.0 71.9 Not in School or College 16,103 52.4 24.0 13.3 GENDER Male 5,195 81.9 69.4 73.7 Female 5,833 89.1 66.8 70.3 RACE/HISPANIC ORIGIN White non-Hispanic 7,499 86.5 74.3 76.2 Black 1,450 58.9 47.0 59.7 Asian Pacific Islander 730 89.6 77.5 72.5 Hispanic (of any race) 1,288 66.8 49.7 61.1 HOUSEHOLD TYPE Married-couple household 3,346 88.3 73.8 69.3 Male householder 264 66.7 53.8 69.3 Female householder 1,059 60.0 46.5 58.7 Non-family household 1,854 78.6 68.6 81.4 FAMILY INCOME Under $15,000 1,550 69.2 56.1 73.9 15,000-24,999 902 68.7 53.8 65.2 25,000-34,999 1,004 68.4 56.1 73.0 35,000-49,999 1,173 81.8 37.5 67.8 50,000-74,999 1,766 87.7 34.5 74.0 75,000+ 3,147 93.8 83.0 75.6 Not reported 1,493 71.2 62.8 64.7
Source: NTIA and ESA, U.S. Department of Commerce, using U.S. Census Bureau Current Population Survey Supplements
While school is the primary location where children use computers and the Internet outside the home, for adults that location is the workplace, which is discussed in the next chapter.
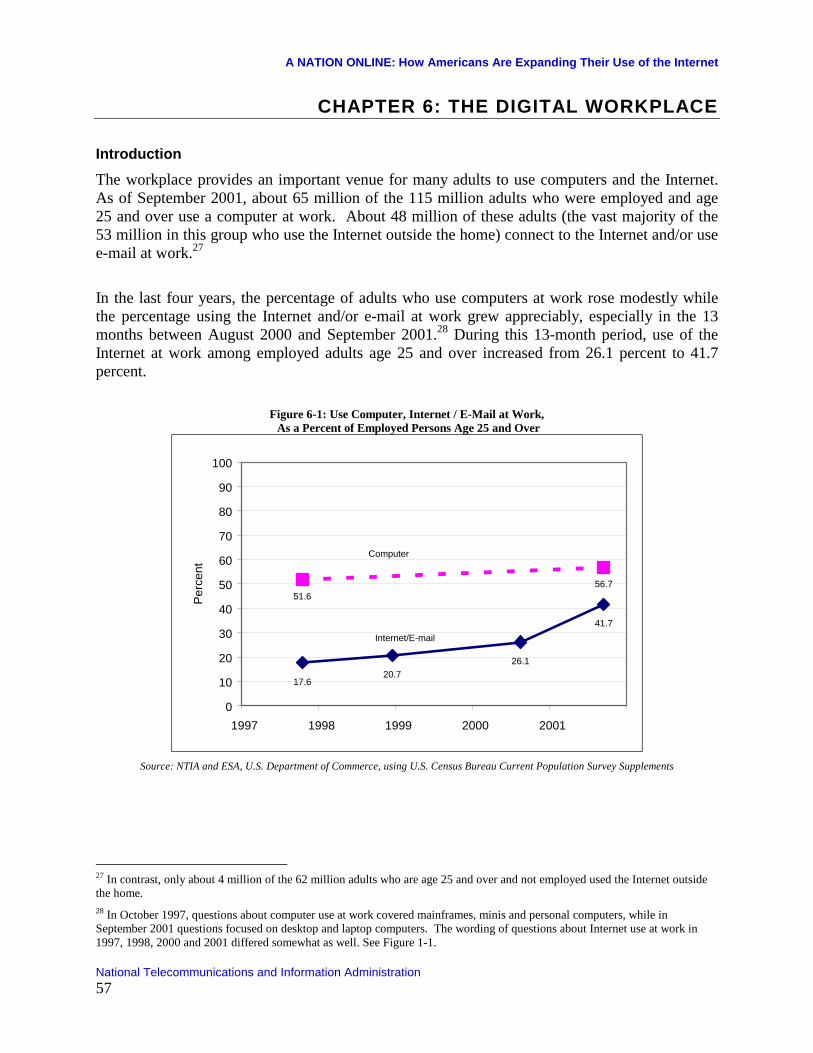
A NATION ONLINE: How Americans Are Expanding Their Use of the Internet
National Telecommunications and Information Administration 57
CHAPTER 6: THE DIGITAL WORKPLACE
Introduction The workplace provides an important venue for many adults to use computers and the Internet. As of September 2001, about 65 million of the 115 million adults who were employed and age 25 and over use a computer at work. About 48 million of these adults (the vast majority of the 53 million in this group who use the Internet outside the home) connect to the Internet and/or use e-mail at work.27
In the last four years, the percentage of adults who use computers at work rose modestly while the percentage using the Internet and/or e-mail at work grew appreciably, especially in the 13 months between August 2000 and September 2001.28 During this 13-month period, use of the Internet at work among employed adults age 25 and over increased from 26.1 percent to 41.7 percent.
Figure 6-1: Use Computer, Internet / E-Mail at Work, As a Percent of Employed Persons Age 25 and Over
56.7
41.7
26.120.7
17.6
51.6
0
10
20
30
40
50
60
70
80
90
100
1997 1998 1999 2000 2001
Perc
ent
Computer
Internet/E-mail
Source: NTIA and ESA, U.S. Department of Commerce, using U.S. Census Bureau Current Population Survey Supplements
27 In contrast, only about 4 million of the 62 million adults who are age 25 and over and not employed used the Internet outside the home. 28 In October 1997, questions about computer use at work covered mainframes, minis and personal computers, while in September 2001 questions focused on desktop and laptop computers. The wording of questions about Internet use at work in 1997, 1998, 2000 and 2001 differed somewhat as well. See Figure 1-1.

A NATION ONLINE: How Americans Are Expanding Their Use of the Internet
58 Economics and Statistics Administration
Computer Use at Work by Occupation In general, use of a computer at work correlates with occupations in which workers have higher educational attainment and, to a lesser extent, with gender.
Table 6-1: Employed Persons Age 25 and Over, by Occupation Use a computer at main job
Employed (000s)
Median Education
Percent women 000s Percent
Total 115,065 SC 46.3 65,190 56.7
Managerial and professional specialty 39,412 CD 50.2 31,723 80.5 Technical, sales, and administrative support 31,482 SC 62.9 22,205 70.5 Precision production, craft, and repair 13,083 HS 8.4 4,152 31.7 Service 13,678 HS 61.6 3,478 25.4 Operators, fabricators, and laborers 14,504 HS 24.3 3,006 20.7 Farming, forestry, and fishing 2,905 HS 20.3 625 21.5 CD – college degree, SC – some college but no degree, HS – high school diploma or GED
Source: NTIA and ESA, U.S. Department of Commerce, using U.S. Census Bureau Current Population Survey Supplements
The proportion of people using a computer at work was 80.5 percent for people in managerial and professional specialty occupations and was 70.5 percent for people in technical, sales, and administrative support occupations. The median educational attainment in these fields is a college degree or some college. About three-quarters of employed women work in these two occupations in contrast with just over one-half of men.
At the other end of the spectrum, only about one in five persons used a computer at work in the occupation categories for operators, fabricators, and laborers as well as for farming, forestry, and fishing. The median educational attainment in these fields is a high school diploma. Women account for less than ten percent of those employed in these occupations.

A NATION ONLINE: How Americans Are Expanding Their Use of the Internet
National Telecommunications and Information Administration 59
Computer Use at Work by Gender and Age Because of the occupational differences, the share of women who use a computer at work exceeds the share of men who do by a margin of 62.9 percent to 51.3 percent. This difference persists across all ages. For both men and women, the percentage that use a computer at work fluctuates within a narrow range until the mid- to late 50s, at which point computer use at work for both genders declines steadily.
Figure 6-2: Use of a Computer at Work by Gender and Age Percent of Employed Persons, 2001
0
10
20
30
40
50
60
70
80
90
100
25 35 45 55 65 75
Perc
ent
Men
Women
Three-year centered average of
Source: NTIA and ESA, U.S. Department of Commerce, using U.S. Census Bureau Current Population Survey Supplements
Types of Computer Uses at Work Workplace use of computers involves a number of tasks, led by connecting to the Internet, word processing, and spreadsheets and databases. Calendar and scheduling, graphics and design, and programming are less commonly used applications.

A NATION ONLINE: How Americans Are Expanding Their Use of the Internet
60 Economics and Statistics Administration
Figure 6-3: Computer Activities at Work, as a Percent of Employed Persons Age 25 and Over, 2001
56.7
41.738.8
35.9
30.4
16.8
8.8 7.3
0
10
20
30
40
50
60
70
80
90
100
All uses Internet, e-mail Word processing,desktop publishing
Spreadsheets,databases
Calendar,scheduling
Graphics anddesign
Programming Other
Perc
ent
Source: NTIA and ESA, U.S. Department of Commerce, using U.S. Census Bureau Current Population Survey Supplements
Not surprisingly, the ranking of computer activities at work by occupation tends to follow the order for general use of a computer at work. Workers in managerial and professional specialties, as well as technical, sales, and administrative support, are the most active users of the Internet and e-mail, word processing, spreadsheets and databases, and calendar and scheduling.
Table 6-2: Top Four Computer Uses by Occupation, Percent of Employed Persons 25 and Over
Internet, e-mail
Word processing,
desktop publishing
Spreadsheets, databases
Calendar, scheduling
Total 41.7 38.8 35.9 30.4 Managerial and professional specialty 66.8 63.2 56.6 48.8 Technical, sales, and administrative support 49.2 45.5 43.1 34.7 Service 13.9 14.3 11.8 12.3 Precision production, craft, and repair 19.0 14.8 16.6 14.6 Operators, fabricators, and laborers 9.2 7.6 8.7 7.0 Farming, forestry, and fishing 14.6 13.0 13.2 9.2
Source: NTIA and ESA, U.S. Department of Commerce, using U.S. Census Bureau Current Population Survey Supplements

A NATION ONLINE: How Americans Are Expanding Their Use of the Internet
National Telecommunications and Information Administration 61
Internet Use at Work The proportion of employed persons age 25 and over who use the Internet and/or e-mail at work increased from 26.1 percent in August 2000 to 41.7 percent in September 2001, a vigorous 54 percent annual rate of growth.
As with computer use, the distribution by age and gender of employed persons age 25 and over who use the Internet at work varies. Women are more likely than men to use the Internet/e-mail at work: 44.4 percent compared with 39.3 percent. This margin in favor of women is about half of the margin for computer use.
Also similar to computer use, the proportion of men and women who use the Internet at work remains reasonably steady between the ages of 25 and 55, when Internet use at work drops. The margin in favor of women persists until the mid-50s, at which point it essentially disappears.
Figure 6-4: Use Internet / E-mail at Work by Gender and Age, as a Percent of Employed Persons, 2001
0
10
20
30
40
50
60
70
80
90
100
25 35 45 55 65 75
Men
Women
Three-year centered average of ages
Source: NTIA and ESA, U.S. Department of Commerce, using U.S. Census Bureau Current Population Survey Supplements

A NATION ONLINE: How Americans Are Expanding Their Use of the Internet
62 Economics and Statistics Administration
Occupations already more likely to be using the Internet at work tended to experience the largest gains in Internet/e-mail use between 2000 and 2001 on a percentage point basis. In terms of growth rates, however, farming, forestry, and fishing and service occupations posted the largest advances.
Figure 6-5: Internet / E-mail Use at Work by Occupation, as a Percent of Employed Persons Age 25 and Over, 2001
38.4
21.0
8.6
5.5
3.3
8.0
6.7
3.0
20.4
21.5
8.2
10.0
6.2
3.6
1.5
2.3
2.2
2.3
0 10 20 30 40 50 60 70 80 90 100
Managerial andprofessional specialty
Technical, sales, andadministrative support
Precision production, craft,and repair
Farming, forestry, andfishing
Service
Operators, fabricators, andlaborers
1998 2000 2001
Source: NTIA and ESA, U.S. Department of Commerce, using U.S. Census Bureau Current Population Survey Supplements
Even with recent gains, striking differences in Internet use at work by occupation remain, particularly in male-dominated fields. While information technology undoubtedly can play a role in many fields of work, there are some occupations where it may be of little or no value or take a different form than a desktop computer connected to the Internet. In addition, further advances in the state of the art in computers in terms of reliability, portability, and ease of use may be necessary before they are practical in occupations characterized by lower levels of educational attainment.
The Work – Home Connection Approximately 24 million of the 65 million employed adults who use a computer at work also do work on a computer at home. This underscores a critical connection between the workplace and home: exposure to a computer and the Internet in the workplace makes it substantially more likely for a computer and the Internet to be used at home.
Undoubtedly, there are cases where enthusiastic home users introduce computers and the Internet to a workplace more likely, however, use at work lends to use at home. Use at work not only acquaints someone with the utility of the technology, it also provides an opportunity to climb a
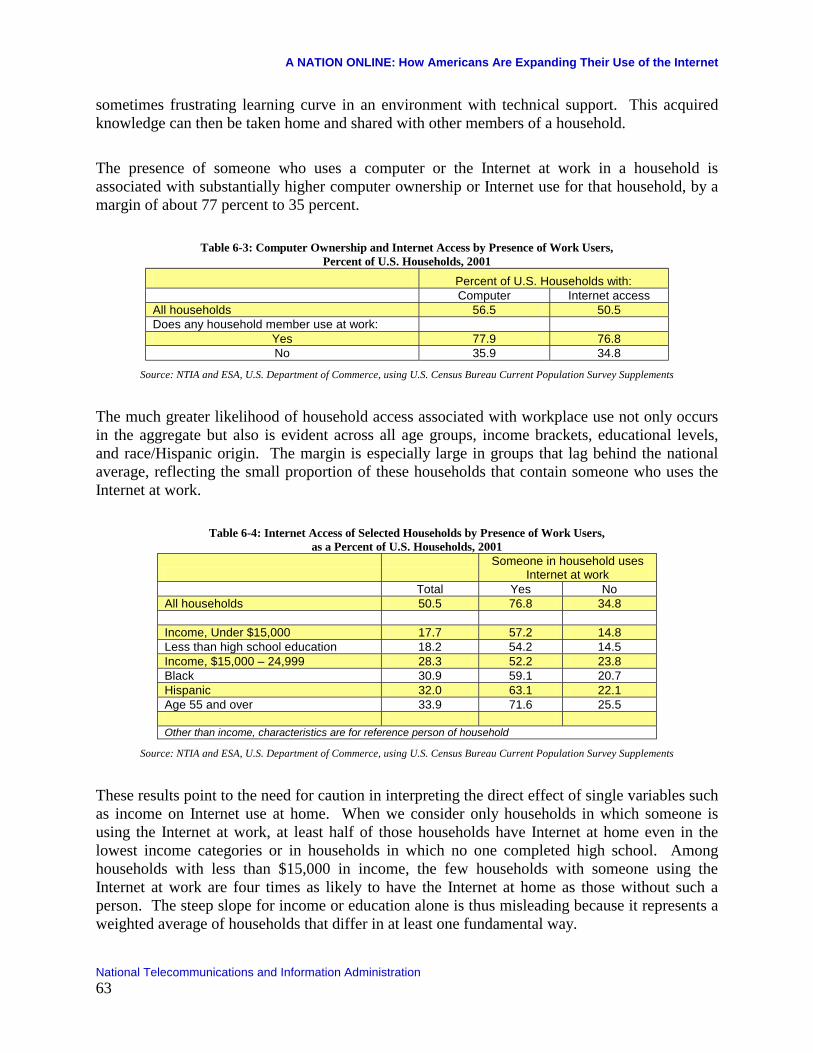
A NATION ONLINE: How Americans Are Expanding Their Use of the Internet
National Telecommunications and Information Administration 63
sometimes frustrating learning curve in an environment with technical support. This acquired knowledge can then be taken home and shared with other members of a household.
The presence of someone who uses a computer or the Internet at work in a household is associated with substantially higher computer ownership or Internet use for that household, by a margin of about 77 percent to 35 percent.
Table 6-3: Computer Ownership and Internet Access by Presence of Work Users, Percent of U.S. Households, 2001
Percent of U.S. Households with: Computer Internet access All households 56.5 50.5 Does any household member use at work:
Yes 77.9 76.8 No 35.9 34.8
Source: NTIA and ESA, U.S. Department of Commerce, using U.S. Census Bureau Current Population Survey Supplements
The much greater likelihood of household access associated with workplace use not only occurs in the aggregate but also is evident across all age groups, income brackets, educational levels, and race/Hispanic origin. The margin is especially large in groups that lag behind the national average, reflecting the small proportion of these households that contain someone who uses the Internet at work.
Table 6-4: Internet Access of Selected Households by Presence of Work Users, as a Percent of U.S. Households, 2001
Someone in household uses
Internet at work Total Yes No All households 50.5 76.8 34.8 Income, Under $15,000 17.7 57.2 14.8 Less than high school education 18.2 54.2 14.5 Income, $15,000 – 24,999 28.3 52.2 23.8 Black 30.9 59.1 20.7 Hispanic 32.0 63.1 22.1 Age 55 and over 33.9 71.6 25.5 Other than income, characteristics are for reference person of household
Source: NTIA and ESA, U.S. Department of Commerce, using U.S. Census Bureau Current Population Survey Supplements
These results point to the need for caution in interpreting the direct effect of single variables such as income on Internet use at home. When we consider only households in which someone is using the Internet at work, at least half of those households have Internet at home even in the lowest income categories or in households in which no one completed high school. Among households with less than $15,000 in income, the few households with someone using the Internet at work are four times as likely to have the Internet at home as those without such a person. The steep slope for income or education alone is thus misleading because it represents a weighted average of households that differ in at least one fundamental way.

A NATION ONLINE: How Americans Are Expanding Their Use of the Internet
64 Economics and Statistics Administration
Figure 6-6: Household Internet Access by Family Income, as a Percent of U.S. Households, 2001
0
10
20
30
40
50
60
70
80
90
100
Under $15,000 $15,000 -24,999
$25,000 -34,999
$35,000 -49,999
$50,000 -74,999
Over $75,000
All households
No one in household uses the Internet at work
Someone in household uses the Internet at work
Source: NTIA and ESA, U.S. Department of Commerce, using U.S. Census Bureau Current Population Survey Supplements
Figure 6-7: Household Internet Access by Education, as a Percent of U.S. Households, 2001
0
10
20
30
40
50
60
70
80
90
100
Less than high school High school Some college Bachelor's degree Beyond college
All households
No one in household uses the Internet at work
Someone in household uses the Internet at work
Source: NTIA and ESA, U.S. Department of Commerce, using U.S. Census Bureau Current Population Survey Supplements

A NATION ONLINE: How Americans Are Expanding Their Use of the Internet
National Telecommunications and Information Administration 65
CHAPTER 7: COMPUTER AND INTERNET USE AMONG PEOPLE WITH DISABILITIES
As demonstrated in earlier sections, computer and Internet use is becoming increasingly commonplace in homes, schools, and on the job. People of all ages, races, and ethnicities are moving more and more of their activities online. Having access and the ability to use these tools is especially important to members of our community who have difficulties due to physical or mental constraints. The tremendous communications capabilities of the Internet could provide an important tool to help people with disabilities to overcome certain of the challenges they face. However, the data show that people with disabilities are less likely than the population as a whole to use computers or the Internet.
People with Disabilities The September 2001 supplement marks the first time that questions about specific types of disability have been included in the set of computer and Internet use questions on the Current Population Survey (CPS).29 These questions do not attempt to quantify the number or the proportion of people in the population who have a disability. Rather, these questions were posed in order to examine how specific types of disabilities impact computer and Internet use. The questions, as asked, are shown in Box 7-1. They cover long-lasting severe vision, hearing, mobility, and manual dexterity problems, as well as a question concerning any physical or mental condition that makes it difficult to leave the house.
Box 7-1: CPS Supplement Questions Concerning Specific Types of Disabilities Do you have any of the following long-lasting physical conditions: (Asked of everyone in the household age 3 and above) A) Blindness or a severe vision impairment even with glasses or contact lenses? B) Deafness or a severe hearing impairment even with a hearing aid? C) A physical condition that substantially limits your ability to walk or climb stairs? D) A condition that makes it difficult to type on an ordinary typewriter or traditional computer keyboard? Do you have difficulty going outside the home alone, for example, to shop or visit a doctor’s office, because of a physical or mental health condition lasting six months or longer? (Asked of everyone in the household age 15 and above)
29 The previous report, Falling Through the Net: Toward Digital Inclusion, published in October 2000, did include a section on “Internet Access and Computer Use Among People with Disabilities.” The data for that section, however, came from another survey, the Survey of Income and Program Participation, which, in the fall of 1999 asked different questions to identify persons with disabilities from those used in the September 2001 CPS supplement. The CPS does allow respondents to choose “disability” as a reason for not being in the work force. However, as this section shows, most people with a disability do not fall into this category. The September supplement to the CPS through 2005 is scheduled to include questions on both computer/Internet use and on disability. Thus, future reports should be able to document changes in computer and Internet use among people with disabilities.

A NATION ONLINE: How Americans Are Expanding Their Use of the Internet
66 Economics and Statistics Administration
Approximately 8.5 percent of the population has at least one of the five disabilities covered in the survey. As shown in Table 7-1, the incidence of each of the various types of disabilities rises sharply with age. For example, while only 1.3 percent of children under 15 have at least one of the disabilities examined here, almost 30 percent of the population aged 65 and older has at least one of these limitations. Because this pattern is the reverse of that followed by Internet use (which rises sharply at the younger end of the spectrum and then declines at older age levels, see Figure 2-5 in Chapter 2), it is important to consider the question of computer and Internet use by people with disabilities within relevant age categories.30 However, the relatively few respondents who have these disabilities at the lower end of the age range and the relatively few respondents who use computers and the Internet at the upper end of the age range severely limit the degree of disaggregation that can be undertaken. Therefore, this analysis is limited to three broad groups: individuals under 25, 25 to 60 year-olds, and those over 60.
Table 7-1: Age Distribution of Specific Disabilities as a Percent of Population, 2001
3-14 15-24 25-34 35-44 45-54 55-64 65 and
Over Multiple Disabilities 0.4 0.6 1.0 2.0 3.8 6.3 15.0 Blind or Severe Vision Impairment 0.3 0.4 0.4 0.5 0.6 0.7 1.4 Deaf or Severe Hearing Impairment 0.3 0.3 0.3 0.5 0.6 0.9 2.4 Difficulty Walking 0.2 0.4 1.0 1.9 2.7 5.7 7.1 Difficulty Typing 0.1 0.3 0.4 0.6 0.6 0.8 0.9
Difficulty Leaving Home Not
Asked 0.5 0.5 0.7 0.9 1.1 2.2 None of These Disabilities 98.7 97.6 96.4 93.8 90.7 84.6 71.1
Source: NTIA and ESA, U.S. Department of Commerce, using U.S. Census Bureau Current Population Survey Supplements
Under 25 Year-Olds31 Less than 2 percent of the population between ages 3 and 24 reported having at least one of the disabilities considered in this report. Table 7-2 contains the only relevant data on computer and Internet use that can reliably be presented for this age group. Although “Internet Use at Home” is lower among those with disabilities, Internet use from other locations brings those with either severe vision or hearing impairments up to the level of the population in general and substantially improves the connectivity situation of individuals in the other disability categories. While a reasonable assumption would be that many of these young people have Internet access through their school, this cannot be demonstrated with this survey data because of the small number of observations in this category.
30 For example, on average only 25.4 percent of the population aged 3 and above with at least one of the first four types of disabilities (difficulty leaving home not included because it was only asked of age 15 and above) use the Internet at any location. Part of the reason this percentage is so much lower than the 53.9 percent average for the population as a whole, is that the population of people with disabilities is heavily weighted toward an older population that is less likely to use the Internet. 31 The population totals for the age groups in this section are less than for the CPS supplement in general because this section is necessarily limited to those respondents who answered the questions concerning disability.

A NATION ONLINE: How Americans Are Expanding Their Use of the Internet
National Telecommunications and Information Administration 67
Table 7-2: Computer and Internet Use Among 3 to 24 Year-Olds By Disability Status, 2001
Size of Population in
Category (in Thousands)
Percent of Population
(percent)
Has a PC at Home
(percent)
Uses the Internet at
Home (percent)
Uses the Internet from Any Location
(percent)
Multiple Disabilities 436 0.6 65.0 26.8 43.6 Blind or Severe Vision
Impairment 267 0.4
61.2 30.6 56.3 Deaf or Severe Hearing
Impairment 198 0.3
76.4 26.6 56.5 Difficulty Walking 275 0.4 64.0 32.4 45.8 Difficulty Typing 185 0.2 63.9 35.4 48.6 None of These
Disabilities 75,299 98.2
68.5 43.8 56.9
Total Answering 76,659 68.4 43.5 56.7 % not answering 12.9
Source: NTIA and ESA, U.S. Department of Commerce, using U.S. Census Bureau Current Population Survey Supplements 25 to 60 Year-Olds Among individuals between the ages of 25 and 60, the likelihood of having at least one of the five disabilities considered here increases to 7.3 percent. As shown in Table 7-3 below, with the exception of those individuals with severe hearing impairment, those who have at least one of these disabilities are less likely than those without a disability to live in a home with a personal computer. And even in homes with a computer, people who have at least one of these disabilities are less likely to use the computer or the Internet.
Table 7-3: Computer and Internet Use at Home Among 25 to 60 Year-Olds By Disability Status, 2001
Size of Population in
Category (in Thousands)
Percent of Population
(percent)
Has a Computer at
Home (percent)
Of Those Who Have a
PC at Home
Uses a the PC at Home (percent)
Uses the Internet at Home (percent)
Multiple Disabilities 3,111.2 2.6 45.4 67.8 56.4 Blind or Severe Vision
Impairment 660.1 0.6
63.7 74.9 61.7 Deaf or Severe Hearing
Impairment 591.4 0.5
70.1 74.5 68.0 Difficulty Walking 2,643.7 2.3 51.6 74.3 63.7 Difficulty Typing 661.8 0.6 58.6 78.7 65.8
Difficulty Leaving Home 891.4 0.8 49.8 77.1 66.7 None of These
Disabilities 109,174.8 92.7
69.4 83.4 75.1 Total 117,734.3 100 68.2 82.8 74.4
% not answering 13.4 Source: NTIA and ESA, U.S. Department of Commerce, using U.S. Census Bureau Current Population Survey Supplements

A NATION ONLINE: How Americans Are Expanding Their Use of the Internet
68 Economics and Statistics Administration
People who have at least one of the listed disabilities are much less likely to be Internet users than those without any of these disabilities. Further, even among Internet users, the Internet activities of people with disabilities are somewhat different. As shown in Table 7-4, people with disabilities are more likely than the population in general to use the Internet to play games and search for health information.
Table 7-4: Internet Activities of 25 to 60 Year-Olds By Disability Status, 2001
Internet Use from Any Location (percent)
Among Internet Users
E-Mail or Instant
Messaging
Play Games
Search for Product or
Service Info.
Purchase Online
News, Weather
Sports info Health Info Gov.
Info
Multiple Disabilities 30.3 84.9 39.8 76.8 41.6 68.0 56.1 39.1 Blind or Severe
Vision Impairment 51.5 86.8 46.6 81.9 53.1 73.2 38.7 30.9 Deaf or Severe
Hearing Impairment 54.8 84.3 36.5 72.6 48.1 69.4 33.6 32.9 Difficulty Walking 39.8 85.0 41.6 75.5 44.4 66.9 48.2 34.9 Difficulty Typing 49.2 87.6 36.2 79.8 54.8 63.5 51.9 41.8 Difficulty Leaving
Home 40.4 84.9 31.5 73.2 45.2 64.5 50.6 38.1 None of These
Disabilities 63.1 88.3 32.0 78.5 50.4 70.2 39.1 34.4
Total 61.4 88.2 32.3 78.4 50.2 70.1 39.6 34.5 Source: NTIA and ESA, U.S. Department of Commerce, using U.S. Census Bureau Current Population Survey Supplements
In an earlier section of this report (see Chapter 6), rates of computer and Internet use were shown to vary substantially by employment status. As shown in Figure 7-1, while people with severely limited sight and hearing have employment rates approaching that of the population that does not have one of these disabilities, people in the other disability categories are much less likely to be employed.

A NATION ONLINE: How Americans Are Expanding Their Use of the Internet
National Telecommunications and Information Administration 69
Figure 7-1: Employment Rates Among 25 to 60 Year-Olds by Disability Status, as a Percent of U.S. Population, 2001
17.1
76.281.2
37.5
56.2
33.3
82.1
0102030405060708090
100
MultipleDisabilities
VisionDisability
only
HearingDisability
only
Difficultywalking only
DifficultyTyping only
DifficultyLeaving
Home only
None ofThese
Disabilities
Perc
ent
Source: NTIA and ESA, U.S. Department of Commerce, using U.S. Census Bureau Current Population Survey Supplements
People who are not employed fall into one of two major categories: unemployed (which means that one is in the labor force, but is not employed) and out of the labor force (not looking for a job). The CPS records those not in the labor force as retired, disabled, or other. Overall, 78.6 percent of the population between ages 25 and 60 is employed, 3.1 percent is unemployed, 2.6 percent is retired, 4.9 percent is “disabled,” and 10.8 percent fall into the “other” category.32
The data are sufficient to provide a comparison of persons who gave “disability” as the reason they were not in the labor force for some of the disability categories.33 Of the disabilities considered here, it is not surprising that those with more than one of the disabilities were the most likely to be out of the labor force for reasons of disability. People with mobility issues (both the “difficulty walking or climbing stairs” and the “inability to leave the house to go to an appointment”) also had high rates of being out of the labor force due to disability. As shown in Figure 7-2, 1.8 percent of individuals who replied negatively to the five specific disability questions contained in Box 1 are not in the labor force due to a disability. People with vision or hearing issues are much less likely to be out of the labor force because of their disability.
32 These are the percentages for the subset of the population that answered the disability question—13.4 percent of the respondents in this age category did not answer these questions. However, the distribution of this subset does not differ in any meaningful way from the population as a whole. For example, the comparable figure for percent employed in the 25 to 60 age group is 78.6 percent when calculated for the population as a whole. 33 It is not possible to consider the employed/unemployed rates among those with at least one of the disabilities considered here because of limited sample size.

A NATION ONLINE: How Americans Are Expanding Their Use of the Internet
70 Economics and Statistics Administration
Figure 7-2: “Not in the Labor Force Because of Disability” Among 25 to 60 Year-Olds by Disability Status, 2001
66.9
9.5 7.2
42.5
22.5
48.8
1.80
102030405060708090
100
MultipleDisabilities
VisionDisability only
HearingDisability only
Difficultywalking only
DifficultyTyping only
DifficultyLeaving
Home only
None ofThese
Disabilities
Perc
ent
Source: NTIA and ESA, U.S. Department of Commerce, using U.S. Census Bureau Current Population Survey Supplements
On the job, people with either a vision or hearing disability or with multiple disabilities are less likely to use a computer at work than others (Table 7-5). Even among those that do use a computer, substantial differences remain in the extent to which they connect to the Internet or use e-mail. One interesting finding is that the disability category showing the highest rate of on-the-job computer use are those persons who report “having a condition that makes it difficult to type on an ordinary typewriter or traditional computer keyboard.” This group has work computer use rates similar to that of the population without one of these disabilities. However, given the fact that 22.5 percent of people in this category are employed in administrative positions where the incidence of repetitive motion disorders such as carpal tunnel syndrome may be high, makes this finding less surprising.
Table 7-5: Computer and Internet Use at Work Among Employed 25 to 60 Year-Olds By Disability Status, 2001
Uses a Computer at Work (percent)
Of Those Who Use a Computer at Work: Uses the Internet at Work
(percent) Multiple Disabilities 48.1 68.2 Blind or Severe Vision Impairment 52.1 69.6 Deaf or Severe Hearing Impairment 50.3 57.5 Difficulty Walking 55.4 69.0 Difficulty Typing 58.6 67.9 Difficulty Leaving Home 57.6 71.9 None of These Disabilities 58.4 74.0 Total 58.2 73.8
Over 60 Year-Olds In general, those over age 60 are less likely than other age groups to have a computer in their home or to use the PC or the Internet in the home and for those with a disability the use rates are

A NATION ONLINE: How Americans Are Expanding Their Use of the Internet
National Telecommunications and Information Administration 71
even lower (Table 7-5). In addition, people in this age group are much less likely to use the Internet outside of the home. For example, the difference between Internet use from home and Internet use from any location was 13.4 percent among those between 3 and 24 who have difficulty walking or climbing stairs (a rise from 32.6 percent to 46.0 percent). The comparable change was only 2.0 percent for the population over 60 with a similar disability (14.1 percent who use the Internet from home to 16.1 percent who use the Internet from any location).
The Interaction of Disability with Computer and Internet Use The charts and tables above are suggestive that people with disabilities tend to use computers and the Internet at rates below the average for the population. From these tables, however, it is not possible to discern whether other factors, such as education or income, are actually the variables driving the disparity, rather than the fact of the disability. However, statistical analysis indicates that even when income, education, and age are accounted for, people with disabilities considered here are less likely than those without disabilities to be Internet users.34
34 In order to explore this question, a logit regression was run with Internet use from any location as the dependent variable and disability status (dummy variables for each of the disability questions, excluding difficulty leaving home), race dummies, and ordered variables for age, income, and education. A variety of income and education variables were considered and results were robust. The disability variables were uniformly negative and significant, except for one case where dummy variable for multiple disabilities was insignificant.

A NATION ONLINE: How Americans Are Expanding Their Use of the Internet
72 Economics and Statistics Administration
Table 7-5: Computer and Internet Use at Home Among Those Over 60 By Disability Status, 2001
Size of Population in
Category (in
Thousands)
Percent of Population (percent)
Has a Computer at
Home (percent)
Of Those Who Have a
Computer at Home
Uses the Internet from Any Location
Uses a the Computer at
Home (percent)
Uses the Internet at
Home (percent)
Multiple Disabilities 4,927.2 13.5 22.2 31.4 23.8 6.2 Blind or Severe Vision Impairment 446.7 1.2 30.2 42.6 27.5 9.6 Deaf or Severe Hearing Impairment 771.6 2.1 35.4 56.5 45.7 17.8 Difficulty Walking 2,592.9 7.1 28.7 62.9 49.3 16.1 Difficulty Typing 327.9 0.9 24.9 62.3 52.3 13.5 Difficulty Leaving Home 712.2 2.0 25.7 33.2 25.2 7.2 None of These Disabilities 26,767.1 73.2 39.4 67.0 56.7 25.4 Total 36,545.6 35.8 62.8 52.5 21.3 % not answering 11.4
Source: NTIA and ESA, U.S. Department of Commerce, using U.S. Census Bureau Current Population Survey Supplements

A NATION ONLINE: How Americans Are Expanding Their Use of the Internet
National Telecommunications and Information Administration 73
CHAPTER 8: THE UNCONNECTED
The earlier chapters of this report have chronicled changes in the connected population: who they are, where they are, what they are doing online, what devices and connection types they are using, and where they are using the Internet. There is a sizable segment of the U.S. population (as of September 2001, 46.1 percent of persons and 49.5 percent of households), however, that does not use the Internet. This chapter profiles this “unconnected” population and explores some of the reasons why it may not be online.
The Offline Population Table 8-1 at the end of this chapter presents the complement to Table 2-2—descriptive statistics for those individuals who do not use the Internet. As the analysis in Chapter 2 shows, Internet use has expanded dramatically in the United States, but a number of groups are more likely not to be Internet users. These non-users include:
• People in households with low family incomes — 75.0 percent of people who live in households where income is less than $15,000 and 66.6 percent of those in households with incomes between $15,000 and $35,000.
• Adults with low levels of overall education—60.2 percent of adults (age 25 +) with only a high school degree and 87.2 percent of adults with less than a high school education.35
• Hispanics—68.4 percent of all Hispanics and 85.9 percent of Hispanic households where Spanish is the only language spoken.
• Blacks—60.2 percent of Blacks.
Earlier chapters have examined the change in the online population focusing on the growth in the number of users or home connections. We gain a different perspective by looking at the rate of decrease in the population that is not online. In other words, we compare the change in the online population with the group initially not online instead of the group initially online. Consider the non-Internet-using population by educational attainment, for example. Among people at least 25 years old with a high school education, the share not using the Internet declined from 69.4 percent in August 2000 to 60.2 in September 2001. Over the same period and age level, the share of those with a college education who were not using the Internet shrank from 27.5 percent to 19.2 percent (Figure 8-1). Thus, high school graduates had a slightly larger point change (9.2 percentage points) than college graduates (8.3 percentage points). Because so many more high school graduates were not Internet users in August 2000, the 9.2 percentage 35 A person’s level of education is correlated to his/her income. People with low overall levels of education are more likely to live in households with lower family incomes. Levels of educational attainment have also increased over time; thus, age and education may be negatively correlated at the higher age levels.

A NATION ONLINE: How Americans Are Expanding Their Use of the Internet
74 Economics and Statistics Administration
point change over the next 13 months represented a 12 percent annual rate of decline in non-Internet-users (Table 8-2). On the other hand, so few college graduates were non-Internet-users in 2000 that their 8.2 percentage point change reflected a 28 percent annual rate of decline in non-Internet-users. When Chapter 2 examined those same point changes from the perspective of the growth in Internet users, high school graduates had a larger growth rate of Internet users than college graduates (27 percent vs. 11 percent) (See Table 2-3).
Figure 8-1: Individuals Not Using the Internet, By Selected Educational Attainment Level, August 2000 and September 2001
69.4
27.5
60.2
19.2
0102030405060708090
100
High School Diploma/GED Bachelor's Degree
20002001
Source: NTIA and ESA, U.S. Department of Commerce, using U.S. Census Bureau Current Population Survey Supplements

A NATION ONLINE: How Americans Are Expanding Their Use of the Internet
National Telecommunications and Information Administration 75
The Importance of Cost to Households Never Connected to the Internet The cost of Internet access matters much more to households with lower incomes than to those with higher incomes. The September 2001 survey asked households without Internet subscriptions the question, “What is the main reason that you don’t have the Internet at home?”36 Survey results indicated that the largest specific response was that the cost was “too expensive.”37 This response was volunteered by one-fourth of these households, but much more often by lower income households than by higher income households. Figure 8-2 shows the relationship between costs, income, and adoption of home Internet connections. With successively higher income categories, fewer households report that cost is a barrier and more households are making their first connections to the Internet at home. Households with incomes below $15,000 volunteered cost as the barrier to home Internet subscriptions 34.7 percent of the time. Among households in that income category, the share of the population without home Internet subscriptions declined by only 6 percent between August 2000 and September 2001. At the other end of the spectrum, only 9.6 percent of households with incomes of at least $75,000 said that they were deterred by cost. That income level saw a 34 percent reduction in the share of households without home Internet between August 2000 and September 2001.
Figure 8-2- Adoption Rate and Internet “Too Expensive” by Income Percent of U.S. Households without Internet
0
5
10
15
20
25
30
35
40
45
50
Under$15,000
$15,000-24,999
$25,000-34,999
$35,000-49,999
$50,000-74,999
Over$75,000
Perc
ent
Share of Households without Internet because it is "too expensive"
Decline in households without Internet from 2000 to 2001 (as percent of households without Internet in 2000)
Source: NTIA and ESA, U.S. Department of Commerce, using U.S. Census Bureau Current Population Survey Supplements
36 Tables 8-2a and 8-2b provide summary data by demographic category for those responding households that have never been connected to the Internet and those that have disconnected, respectively. 37 Approximately one-half of the households who had never subscribed to the Internet at home responded with the ambiguous catchall “don’t want it.” That response could come from people who have not connected for a combination of specific reasons in addition to those persons who can see no use for it under any conditions, including zero cost.

A NATION ONLINE: How Americans Are Expanding Their Use of the Internet
76 Economics and Statistics Administration
Among specific responses, cost rated highly across a number of demographic groups of non-Internet households. In particular, respondents for married couples or single-parent families with children, and heads of households that were younger than 45 years of age, less educated, or unemployed all identified “too expensive” as the most important reason for non-connectivity at a much higher level than the national figure of 25.3 percent. Why Households have Discontinued Internet Access Those households that have discontinued Internet access numbered 3.6 million, or 3.3 percent, of all U.S. households as of September 2001. Among this group of unconnected persons, cost was the most frequently cited reason for disconnecting (Figure 8-3). Households with incomes less than $50,000 identified “too expensive” as the primary reason for discontinuing their Internet connection (26.9 percent of such households). Cost was more important in households with only high school degrees (24.6 percent) than in households with college degrees (13.7 percent). Those household heads younger than 45 rated cost (24.2 percent) more highly than household heads 45 years or older (19.0 percent). Geographic differentials existed: households in rural areas cited cost less often (19.9 percent) than households in central cities (25.5 percent).
The lack of a computer or problems with the home computer also accounted for many persons discontinuing their use (Figure 8-3). Although people have concerns about their children’s exposure to inappropriate material on the Internet (see discussion at the end of this chapter), this was seldom the reason cited by people who no longer subscribed to the Internet.
Figure 8-3 Reasons for U.S. Households Discontinuing Internet Access
Percent Distribution, 2001
Can use elsewhere11%
Don't want it20%
Computer capability
11%
Too expensive22%
Concern w/ children
3% Problems w/ ISP1%
Other9%
No computer14%
No connection4%
No time2%
Moved3%
Source: NTIA and ESA, U.S. Department of Commerce, using U.S. Census Bureau Current Population Survey Supplements

A NATION ONLINE: How Americans Are Expanding Their Use of the Internet
National Telecommunications and Information Administration 77
The Effect of Confidentiality Concerns Some households may choose not to have a home Internet connection because of confidentiality concerns. The September 2001 survey asked respondents if they were more or less concerned about their confidentiality over the Internet as compared to the telephone. It is important to note that although respondents reported being more concerned about their confidentially over the Internet, the question was phrased in such a way that respondents did not rate the degree of concern but rather whether they were more or less concerned.38
About half (50.9 percent) of respondents were more concerned about their confidentiality over the Internet compared with the telephone. About one-third (41.4 percent) of respondents reported their concerns were the same for both media, and 7.7 percent of respondents reported feeling less concern about confidentiality over the Internet compared to on a telephone.
In terms of age, persons under 25 years old were the least concerned about their confidentiality over the Internet (36.0 percent), compared with those 55 years of age or older who were the most concerned (54.8 percent). A majority of respondents in the two age groups under 35 reported that they were either neutral or more concerned about the telephone. In contrast, a majority of respondents over 35 were more concerned about the Internet than were either neutral or more concerned about the telephone. Examining gender revealed that females and males shared a similar level of concern about confidentiality over the Internet: 51.8 percent compared to 50.1 percent, respectively. Looking at household types, male-led households were least likely to be concerned about confidentiality over the Internet (41.4 percent), while female-led households were most concerned (54.9 percent). Male-led households were also most likely to respond that there was no difference in confidentiality between the two media (52.5 percent), compared to 38.0 percent of female-led household who reported that there was no difference.
Content Concerns Some households, particularly those with children under the age of 18, may choose not to have a home Internet connection because of the concern that the children may access inappropriate material. As discussed in Chapter 5, the September 2001 survey found that among households with children, 68.3 percent responded that compared with material on television, they were more concerned about the kind of material children may be exposed to on the Internet. This concern, however, did not translate into lower rates of Internet access among this group. Among those that thought the Internet was a source of more concern than television, 51.8 percent had Internet in the home as compared to 48.2 percent who did not subscribe to the Internet. Those who were less concerned (5.6 percent) or had similar concerns (26.1 percent) actually constituted a lower proportion of Internet households.
38 The specific question reads: “Compared to providing information over the telephone, how concerned are you about providing personal information over the Internet? Are you: (1) more concerned (2) less concerned (3) about the same.”

A NATION ONLINE: How Americans Are Expanding Their Use of the Internet
78 Economics and Statistics Administration
The Role of Network Effects “Network effects” may be another factor determining whether people connect to the Internet.39 Typically, the adoption of a technology that has “network effects” begins slowly. At some point a successful technology will reach a tipping point and adoption will accelerate rapidly. As the technology saturates the market, the adoption rate slows, since most people who want the technology already have it.40
Generally, the adoption of a technology does not take place uniformly across the entire economy or the entire population. The penetration rate for fax machines, for example, is much higher among businesses than among households. The fax never rivaled the telephone or mail for household communications, whereas businesses found considerable value in the near instant transmission of documents. Under this concept, if a person’s family, friends, and broader community are Internet users, there would be increased incentive for them to go online. On the other hand, if few of a person’s family, friends, or community were online, there would be less of an incentive to go online. In looking at the relationship of home Internet to variables such as income, education, race or Hispanic origin, we may be picking up in part the probability of family, friends, and community to be online.
In sum, there are a number of reasons as to why a substantial proportion of U.S. households do not currently use the Internet. Some reasons, such as those related to “network effects,” can be surmised from adoption patterns of new technologies. Other reasons were provided as rationale in the September 2001 survey. Cost (“too expensive”) rates highest among lower-income households, particularly for those that have decided to discontinue Internet access at home, and highly among many demographic groups of non-Internet households. In contrast, confidentiality issues (even where households express greater concerns about the Internet than television) and concerns about how children use the Internet do not appear to be significant reasons why households stay or go offline.
39 “Network effects” (also called “network externality”) centers on the notion that the addition of another subscriber in a network increases the value of access to existing or potential subscribers, 40 This pattern is characterized by an “S” curve. For a more detailed discussion, see U.S. Department of Commerce, Falling Through The Net: Toward Digital Inclusion, pp. 2-4.

A NATION ONLINE: How Americans Are Expanding Their Use of the Internet
National Telecommunications and Information Administration 79
Table 8-1: Non-Internet Use From Any Location by Individuals Age 3 and Older, October 1997, December 1998, August 2000, and September 2001
Oct. 1997 (thousands)
Dec. 1998 (thousands)
Aug. 2000 (thousands)
Sept. 2001 (thousands)
Non-Internet Use (percent of population)
Non-Internet Users
Total Non-
Internet Users
Total Non-
Internet Users
Total Non-
Internet Users
Total Oct. 1997
Dec. 1998
Aug. 2000
Sept. 2001
Total Population 198,914 255,689 173,866 258,453 146,140 262,620 122,357 265,180 77.8 67.3 55.6 46.1 Gender
Male 94,279 124,590 82,899 125,932 70,882 127,844 59,572 129,152 75.7 65.8 55.4 46.1 Female 104,635 131,099 90,966 132,521 75,258 134,776 62,785 136,028 79.8 68.6 55.8 46.2
Race/ Origin
White 137,617 184,295 115,510 184,980 92,725 186,439 74,851 186,793 74.7 62.4 49.7 40.1 Black 27,589 31,786 26,012 32,123 23,226 32,850 20,068 33,305 86.8 81.0 70.7 60.2 Asian Amer. & Pac. Isl. 6,794 9,225 6,221 9,688 5,229 10,324 4,223 10,674 73.6 64.2 50.6 39.6 Hispanic 25,133 28,233 24,556 29,452 23,593 30,918 22,005 32,146 89.0 83.4 76.3 68.4
Employment Status
Employed b 93,603 130,857 76,580 133,119 59,073 136,044 46,693 135,089 71.5 57.5 43.4 34.6 Not Employed b, d 63,899 72,911 58,890 73,151 52,570 73,891 48,736 77,268 87.6 80.5 71.1 63.1
Family Income
Less than $15,000 40,215 44,284 32,694 37,864 26,039 32,096 23,506 31,354 90.8 86.3 81.1 75.0 $15,000 - $24,999 28,662 32,423 24,958 30,581 20,664 27,727 17,756 26,649 88.4 81.6 74.5 66.6 $25,000 - $34,999 27,512 33,178 23,786 31,836 19,947 31,001 15,980 28,571 82.9 74.7 64.3 55.9
$35,000 - $49,999 29,953 38,776 25,498 39,026 19,177 35,867 15,457 36,044 77.2 65.3 53.5 42.9 $50,000 - $74,999 28,358 41,910 23,874 43,776 18,392 43,451 14,621 44,692 67.7 54.5 42.3 32.7 $75,000 & above 20,296 36,572 17,360 42,221 15,625 52,189 11,900 56,446 55.5 41.1 29.9 21.1
Educational Attainment Less Than High School a 28,598 29,114 27,811 29,039 25,773 28,254 23,977 27,484 98.2 95.8 91.2 87.2
High School Diploma/GED a 51,898 57,487 46,142 57,103 39,463 56,889 34,539 57,386 90.3 80.8 69.4 60.2 Some College a 31,995 42,544 26,435 43,038 20,427 44,628 17,099 45,420 75.2 61.4 45.8 37.6 Bachelors Degree a 16,291 27,795 12,054 28,990 8,351 30,329 5,863 30,588 58.6 41.6 27.5 19.2
Beyond Bachelors Degree a 6,668 13,863 4,884 14,518 3,322 15,426 2,650 16,283 48.1 33.6 21.5 16.3
Age Group (and Labor Force) Age 3 – 8 22,697 24,445 21,602 24,282 20,291 23,962 17,126 23,763 92.8 89.0 84.7 72.1
Age 9 – 17 23,678 35,469 20,425 35,821 17,094 36,673 11,638 37,118 66.8 57.0 46.6 31.4 Age 18 – 24 17,088 24,973 14,306 25,662 11,419 26,458 9,464 27,137 68.4 55.7 43.2 34.9 Age 25 – 49 74,214 101,853 60,142 101,836 45,513 101,946 36,752 101,890 72.9 59.1 44.6 36.1
Male 35,498 50,177 29,165 50,054 22,956 50,034 19,128 50,020 70.7 58.3 45.9 38.2 Female 38,716 51,676 30,975 51,781 22,557 51,913 17,624 51,871 74.9 59.8 43.5 34.0
Age 50 + 61,237 68,949 57,183 70,852 51,822 73,580 47,377 75,272 88.8 80.7 70.4 62.9
Male 26,692 31,252 24,892 32,248 22,572 33,561 20,681 34,438 85.4 77.2 67.3 60.1 Female 34,545 37,697 32,291 38,604 29,250 40,019 26,696 40,834 91.6 83.6 73.1 65.4
Geographic Location of Household In Which the Individual Lives
Rural n/a n/a 46,554 65,828 39,091 67,980 31,891 67,642 n/a 70.7 57.5 47.1 Urban n/a n/a 127,312 192,625 107,049 194,640 90,465 197,537 n/a 66.1 55.0 45.8
Urban Not Central City n/a n/a 74,210 116,091 61,868 118,641 51,382 120,724 n/a 63.9 52.1 42.6
Urban Central City n/a n/a 53,102 76,534 45,181 75,999 39,083 76,813 n/a 69.4 59.4 50.9 Household Type In Which the Individual Lives

A NATION ONLINE: How Americans Are Expanding Their Use of the Internet
80 Economics and Statistics Administration
Oct. 1997 (thousands)
Dec. 1998 (thousands)
Aug. 2000 (thousands)
Sept. 2001 (thousands)
Non-Internet Use (percent of population)
Non-Internet Users
Total Non-
Internet Users
Total Non-
Internet Users
Total Non-
Internet Users
Total Oct. 1997
Dec. 1998
Aug. 2000
Sept. 2001
Married Couple w/Children <18 Years Old
76,127 103,791 68,833 110,295 55,798 112,920 39,623 104,337 73.3 62.4 49.4 38.0
Male Householder w/Children <18 Years Old
5,141 6,284 5,871 7,866 5,361 8,186 4,011 7,400 81.8 74.6 65.5 54.2
Female Householder w/Children <18 Years Old
23,286 27,327 21,658 27,877 20,168 30,034 15,892 29,032 85.2 77.7 67.2 54.7
Family Household without Children <18 Years Old
62,373 77,612 50,495 72,155 41,322 70,521 40,599 81,996 80.4 70.0 58.6 49.5
Non-Family Household 31,088 39,381 26,979 40,199 23,442 40,884 22,196 42,333 78.9 67.1 57.3 52.4
Source: U.S. Bureau of the Census, Current Population Survey supplements, October 1997, December 1998, August 2000, September 2001. Notes: a Age 25 and older. b Age 16 and Older. c Individuals who live in households in which the answer to the question “Is Spanish the only language spoken by all members of the household who are 15 years of age or older?” was yes. d Both people who are unemployed and people not in the labor force.

A NATION ONLINE: How Americans Are Expanding Their Use of the Internet
National Telecommunications and Information Administration 81
Table 8-2: Percent Difference and Growth Rates Non-Internet Use From Any Location by Individuals Age 3 and Older, October 1997, December 1998, August 2000, and September 2001
Non-Internet Use (percent of population) Percentage Point Difference Decline in Non-Use Rate
(annual rate)
Oct. 1997*
Dec. 1998
Aug. 2000
Sept. 2001
1997 to 1998*
1998 to 2000
2000 to 2001
1998 to
2001
1997 to
1998*
1998 to
2000
2000 to
2001
1998 to
2001 Total Population 77.8 67.3 55.6 46.1 n/a -11.6 -9.5 -21.1 n/a 11 16 13 Gender
Male 75.7 65.8 55.4 46.1 n/a -10.4 -9.3 -19.7 n/a 10 16 12 Female 79.8 68.6 55.8 46.2 n/a -12.8 -9.7 -22.5 n/a 12 16 13
Race/ Origin
White 74.7 62.4 49.7 40.1 n/a -12.7 -9.7 -22.4 n/a 13 18 15 Black 86.8 81.0 70.7 60.2 n/a -10.3 -10.4 -20.7 n/a 8 14 10 Asian Amer. & Pac. Isl. 73.6 64.2 50.6 39.6 n/a -13.6 -11.1 -24.7 n/a 13 20 16 Hispanic 89.0 83.4 76.3 68.4 n/a -7.1 -7.9 -14.9 n/a 5 10 7
Employment Status
Employed b 71.5 57.5 43.4 34.6 n/a -14.1 -8.9 -23.0 n/a 16 19 17 Not Employed b, c 87.6 80.5 71.1 63.1 n/a -9.4 -8.1 -17.4 n/a 7 11 8
Family Income
Less than $15,000 90.8 86.3 81.1 75.0 n/a -5.2 -6.2 -11.4 n/a 4 7 5 $15,000 - $24,999 88.4 81.6 74.5 66.6 n/a -7.1 -7.9 -15.0 n/a 5 10 7 $25,000 - $34,999 82.9 74.7 64.3 55.9 n/a -10.4 -8.4 -18.8 n/a 9 12 10
$35,000 - $49,999 77.2 65.3 53.5 42.9 n/a -11.9 -10.6 -22.5 n/a 11 18 14 $50,000 - $74,999 67.7 54.5 42.3 32.7 n/a -12.2 -9.6 -21.8 n/a 14 21 17 $75,000 & above 55.5 41.1 29.9 21.1 n/a -11.2 -8.9 -20.0 n/a 17 28 22
Educational Attainment Less Than High School a 98.2 95.8 91.2 87.2 n/a -4.6 -4.0 -8.5 n/a 3 4 3
High School Diploma / GED a 90.3 80.8 69.4 60.2 n/a -11.4 -9.2 -20.6 n/a 9 12 10 Some College a 75.2 61.4 45.8 37.6 n/a -15.7 -8.1 -23.8 n/a 16 17 16 Bachelors Degree a 58.6 41.6 27.5 19.2 n/a -14.0 -8.4 -22.4 n/a 22 28 25
Beyond Bachelors Degree a 48.1 33.6 21.5 16.3 n/a -12.1 -5.3 -17.4 n/a 23 23 23
Age Group (and Labor Force) Age 3 – 8 92.8 89.0 84.7 72.1 n/a -4.3 -12.6 -16.9 n/a 3 14 7
Age 9 – 17 66.8 57.0 46.6 31.4 n/a -10.4 -15.3 -25.7 n/a 11 31 20 Age 18 – 24 68.4 55.7 43.2 34.9 n/a -12.6 -8.3 -20.9 n/a 14 18 16 Age 25 – 49 72.9 59.1 44.6 36.1 n/a -14.4 -8.6 -23.0 n/a 15 18 16
Male 70.7 58.3 45.9 38.2 n/a -12.4 -7.6 -20.0 n/a 13 15 14 Female 74.9 59.8 43.5 34.0 n/a -16.4 -9.5 -25.8 n/a 17 20 19
Age 50 + 88.8 80.7 70.4 62.9 n/a -10.3 -7.5 -17.8 n/a 8 10 9
Male 85.4 77.2 67.3 60.1 n/a -9.9 -7.2 -17.1 n/a 8 10 9 Female 91.6 83.6 73.1 65.4 n/a -10.6 -7.7 -18.3 n/a 8 10 9
Geographic Location of Household In Which the Individual Lives
Rural n/a 70.7 57.5 47.1 n/a -13.2 -10.4 -23.6 n/a 12 17 14 Urban n/a 66.1 55.0 45.8 n/a -11.1 -9.2 -20.3 n/a 10 16 12
Urban Not Central City n/a 63.9 52.1 42.6 n/a -11.8 -9.6 -21.4 n/a 12 17 14
Urban Central City n/a 69.4 59.4 50.9 n/a -9.9 -8.6 -18.5 n/a 9 13 11 Household Type In Which the Individual Lives

A NATION ONLINE: How Americans Are Expanding Their Use of the Internet
82 Economics and Statistics Administration
Non-Internet Use (percent of population) Percentage Point Difference Decline in Non-Use Rate
(annual rate)
Oct. 1997*
Dec. 1998
Aug. 2000
Sept. 2001
1997 to 1998*
1998 to 2000
2000 to 2001
1998 to
2001
1997 to
1998*
1998 to
2000
2000 to
2001
1998 to
2001 Married Couple w/Children <18 Years Old
73.3 62.4 49.4 38.0 n/a -13.0 -11.4 -24.4 n/a 13 22 17
Male Householder w/Children <18 Years Old
81.8 74.6 65.5 54.2 n/a -9.1 -11.3 -20.4 n/a 8 16 11
Female Householder w/Children <18 Years Old
85.2 77.7 67.2 54.7 n/a -10.5 -12.4 -23.0 n/a 8 17 12
Family Household without Children <18 Years Old
80.4 70.0 58.6 49.5 n/a -11.4 -9.1 -20.5 n/a 10 14 12
Non-Family Household 78.9 67.1 57.3 52.4 n/a -9.8 -4.9 -14.7 n/a 9 8 9
Source: U.S. Bureau of the Census, Current Population Survey supplements, October 1997, December 1998, August 2000, September 2001. Notes:*The October 1997 question on Internet usage was worded considerably differently than the questions used in the following years. The use rates calculated from the October 1997 data are likely correct in terms of their order of magnitude. Growth rates have, however, not been calculated because the implied precision of the year-to-year comparisons would be inaccurate. a Age 25 and older. b Age 16 and Older. c Both people who are unemployed and people not in the labor force.
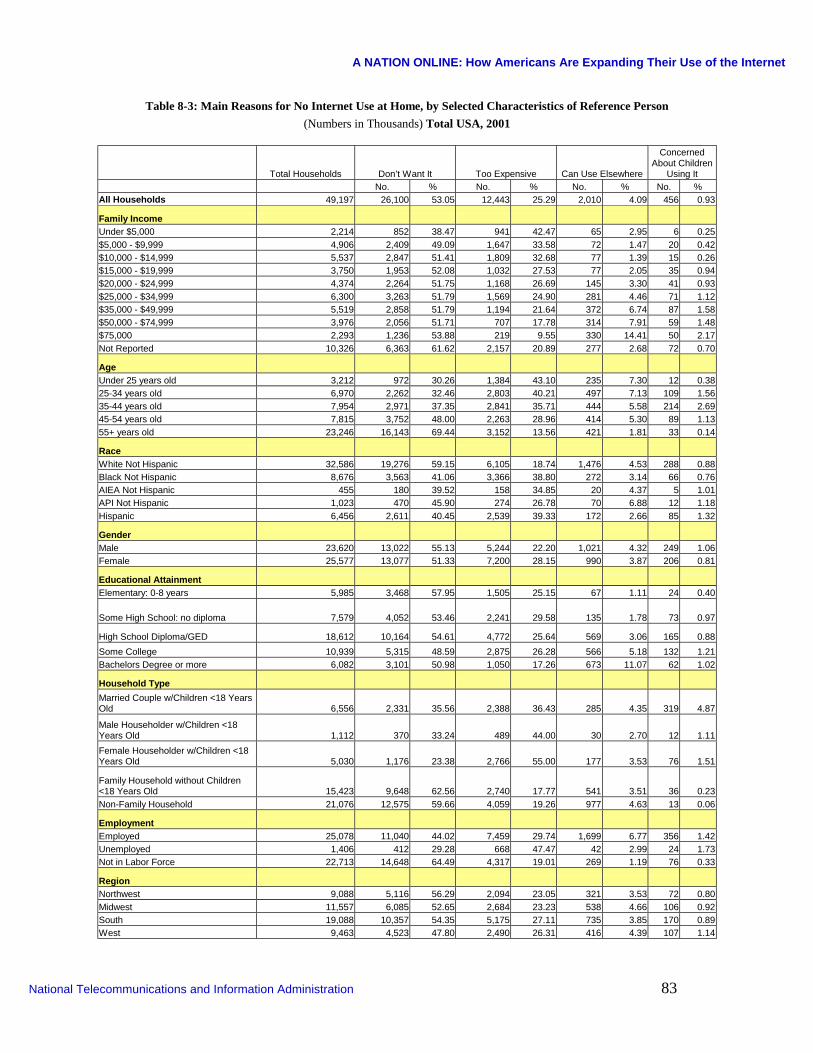
A NATION ONLINE: How Americans Are Expanding Their Use of the Internet
National Telecommunications and Information Administration 83
Table 8-3: Main Reasons for No Internet Use at Home, by Selected Characteristics of Reference Person
(Numbers in Thousands) Total USA, 2001
Total Households Don’t Want It Too Expensive Can Use Elsewhere
Concerned About Children
Using It No. % No. % No. % No. % All Households 49,197 26,100 53.05 12,443 25.29 2,010 4.09 456 0.93
Family Income Under $5,000 2,214 852 38.47 941 42.47 65 2.95 6 0.25 $5,000 - $9,999 4,906 2,409 49.09 1,647 33.58 72 1.47 20 0.42 $10,000 - $14,999 5,537 2,847 51.41 1,809 32.68 77 1.39 15 0.26 $15,000 - $19,999 3,750 1,953 52.08 1,032 27.53 77 2.05 35 0.94 $20,000 - $24,999 4,374 2,264 51.75 1,168 26.69 145 3.30 41 0.93 $25,000 - $34,999 6,300 3,263 51.79 1,569 24.90 281 4.46 71 1.12 $35,000 - $49,999 5,519 2,858 51.79 1,194 21.64 372 6.74 87 1.58 $50,000 - $74,999 3,976 2,056 51.71 707 17.78 314 7.91 59 1.48 $75,000 2,293 1,236 53.88 219 9.55 330 14.41 50 2.17 Not Reported 10,326 6,363 61.62 2,157 20.89 277 2.68 72 0.70
Age Under 25 years old 3,212 972 30.26 1,384 43.10 235 7.30 12 0.38 25-34 years old 6,970 2,262 32.46 2,803 40.21 497 7.13 109 1.56 35-44 years old 7,954 2,971 37.35 2,841 35.71 444 5.58 214 2.69 45-54 years old 7,815 3,752 48.00 2,263 28.96 414 5.30 89 1.13 55+ years old 23,246 16,143 69.44 3,152 13.56 421 1.81 33 0.14
Race White Not Hispanic 32,586 19,276 59.15 6,105 18.74 1,476 4.53 288 0.88 Black Not Hispanic 8,676 3,563 41.06 3,366 38.80 272 3.14 66 0.76 AIEA Not Hispanic 455 180 39.52 158 34.85 20 4.37 5 1.01 API Not Hispanic 1,023 470 45.90 274 26.78 70 6.88 12 1.18 Hispanic 6,456 2,611 40.45 2,539 39.33 172 2.66 85 1.32
Gender Male 23,620 13,022 55.13 5,244 22.20 1,021 4.32 249 1.06 Female 25,577 13,077 51.33 7,200 28.15 990 3.87 206 0.81
Educational Attainment Elementary: 0-8 years 5,985 3,468 57.95 1,505 25.15 67 1.11 24 0.40
Some High School: no diploma 7,579 4,052 53.46 2,241 29.58 135 1.78 73 0.97
High School Diploma/GED 18,612 10,164 54.61 4,772 25.64 569 3.06 165 0.88 Some College 10,939 5,315 48.59 2,875 26.28 566 5.18 132 1.21 Bachelors Degree or more 6,082 3,101 50.98 1,050 17.26 673 11.07 62 1.02
Household Type Married Couple w/Children <18 Years Old 6,556 2,331 35.56 2,388 36.43 285 4.35 319 4.87
Male Householder w/Children <18 Years Old 1,112 370 33.24 489 44.00 30 2.70 12 1.11 Female Householder w/Children <18 Years Old 5,030 1,176 23.38 2,766 55.00 177 3.53 76 1.51
Family Household without Children <18 Years Old 15,423 9,648 62.56 2,740 17.77 541 3.51 36 0.23 Non-Family Household 21,076 12,575 59.66 4,059 19.26 977 4.63 13 0.06
Employment Employed 25,078 11,040 44.02 7,459 29.74 1,699 6.77 356 1.42 Unemployed 1,406 412 29.28 668 47.47 42 2.99 24 1.73 Not in Labor Force 22,713 14,648 64.49 4,317 19.01 269 1.19 76 0.33
Region Northwest 9,088 5,116 56.29 2,094 23.05 321 3.53 72 0.80 Midwest 11,557 6,085 52.65 2,684 23.23 538 4.66 106 0.92 South 19,088 10,357 54.35 5,175 27.11 735 3.85 170 0.89 West 9,463 4,523 47.80 2,490 26.31 416 4.39 107 1.14

A NATION ONLINE: How Americans Are Expanding Their Use of the Internet
84 Economics and Statistics Administration
Computer Capability
No Computer in Household Lack of Knowledge Other
No. % No. % No. % No. %
All Households 520 1.06 2,917 5.93 1,032 2.1 3,718 7.56
Family Income Under $5,000 12 0.53 156 7.03 42 1.89 142 6.42 $5,000 - 9,999 12 0.26 250 5.09 204 4.16 291 5.94 $10,000 - $14,999 51 0.93 346 6.26 127 2.29 265 4.79 $15,000 - $19,999 36 0.96 265 7.07 122 3.26 230 6.12 $20,000 - $24,999 62 1.41 312 7.13 100 2.29 284 6.48 $25,000 - $34,999 67 1.07 474 7.52 124 1.97 451 7.16 $35,000 - $49,999 88 1.59 379 6.88 92 1.67 448 8.12 $50,000 - $74,999 85 2.15 298 7.5 51 1.27 405 10.2 $75,000 & above 45 1.97 104 4.53 27 1.19 282 12.31 No Reported 62 0.6 333 3.23 143 1.38 920 8.9
Age Under 25 years old 39 1.23 317 9.85 21 0.67 232 7.21 25-34 years old 99 1.43 588 8.44 80 1.14 532 7.64 35-44 years old 146 1.84 570 7.16 104 1.31 664 8.35 45-54 years old 91 1.16 463 5.93 133 1.71 610 7.8 55+ years old 144 0.62 979 4.21 693 2.98 1,680 7.23
Race . White 360 1.11 1,833 5.62 599 1.84 2,649 8.13 Black 57 0.66 585 6.74 173 2 594 6.84 AIEA Not Hispanic 9 2.08 31 6.82 12 2.55 40 8.81 API Not Hispanic 16 1.59 44 4.3 43 4.18 94 9.19 Hispanic 77 1.2 424 6.57 206 3.19 342 5.29
Gender . Male 268 1.14 1,334 5.65 516 2.18 1,966 8.32 Female 252 0.98 1,583 6.19 516 2.02 1,752 6.85
Education Elementary: 0-8 years 32 0.54 234 3.91 284 4.75 370 6.19 Some High School: no diploma 61 0.81 412 5.43 186 2.46 417 5.51 High School Diploma/GED 156 0.84 1,160 6.23 347 1.87 1,280 6.88 Some College 151 1.38 806 7.37 130 1.19 964 8.82 Bachelors Degree or more 120 1.98 306 5.03 84 1.38 686 11.29
Household Type Married Couple w/Children <18 Years Old 149 2.28 448 6.83 88 1.35 547 8.34 Male Householder w/Children <18 Years Old 30 2.66 101 9.08 22 2.01 58 5.2 Female Householder w/Children <18 Years Old 72 1.43 458 9.12 30 0.59 274 5.45 Family Household without Children <18 Years Old 127 0.82 734 4.76 355 2.3 1,242 8.05 Non-Family Household 143 0.68 1,176 5.58 537 2.55 1,598 7.58
Employment Employed 382 1.52 1,775 7.08 327 1.31 2,039 8.13 Unemployed 5 0.33 137 9.71 34 2.45 85 6.04 Not in Labor Force 133 0.59 1,006 4.43 670 2.95 1,594 7.02
Region Northwest 71 0.78 461 5.07 161 1.77 792 8.72 Midwest 133 1.15 768 6.65 259 2.24 983 8.51 South 160 0.84 951 4.98 395 2.07 1,127 5.9 West 156 1.64 738 7.8 218 2.3 816 8.62

A NATION ONLINE: How Americans Are Expanding Their Use of the Internet
National Telecommunications and Information Administration 85
CHAPTER 9: REDUCTIONS IN INEQUALITY FOR COMPUTER AND INTERNET USE
In discussions of changing computer and Internet use, a common question is whether inequality has been rising or declining. While previous chapters in this report show that inequality remains, this chapter shows that inequality has been declining by the standard measure of inequality used by economists. Just as income inequality declines when incomes grow faster among those with lower incomes, inequality in computer and Internet use declines when use rises faster among those with lower rates of use. Earlier chapters have noted that higher rates of growth in both computer and Internet use have been occurring among those groups with lower rates of use, such as those with lower income, with less education, from racial groups with low rates, or over 60 years of age.
Different rates of computer and Internet use result from such factors as income, education, use at school, and use at work in different occupations. Income still matters because computers and Internet subscriptions still cost a significant amount of money. On the other hand, income becomes less a factor as prices of computers and Internet subscriptions decline. For school-age children, we found substantial differences in home access to computers and the Internet according to household income. When school and library use are taken into account, however, differences in computer and Internet use among children were much smaller. Among adults, higher levels of education are associated both with greater income and with occupations that tend to use computers and the Internet at work. Once again, we found that computers and the Internet were becoming more common in occupations with lower rates of use.
How a Gini Coefficient for Computer and Internet Use is Computed To analyze the distribution of computer and Internet use, we have adapted the standard methodology for assessing the distribution of income. In the case of income inequality, households are ranked according to their income and a Lorenz curve is drawn (starting with the lowest incomes) to indicate the cumulative income received by the cumulative population up to that point. For example, Figure 9-1 depicts the distribution of U.S. money income in 2000. Since the bottom 40 percent of the population received 12.5 percent of income, the Lorenz curve goes through (0.4, 0.125).
Figure 9-1: Lorenz Curve of Household Money Income, 2000
0.0
0.2
0.4
0.6
0.8
1.0
0.0 0.1 0.2 0.3 0.4 0.5 0.6 0.7 0.8 0.9 1.0Household quintiles, cumulative share
Mon
ey In
com
e, c
umul
ativ
e sh
are

A NATION ONLINE: How Americans Are Expanding Their Use of the Internet
86 Economics and Statistics Administration
The most widely used measure of inequality, the Gini coefficient, derives from the Lorenz curve. A Gini coefficient of 0 means that income is equally distributed among the population, while a value of 1 means essentially one person has all the income while everyone else has none. The Gini coefficient measures the area between the straight line connecting (0,0) and (1,1) and the Lorenz curve connecting those two points, as a proportion of the triangle formed by (0,0), (1,0), and (1,1). The Gini coefficient equals zero in the case of absolute equality because the Lorenz curve would lie along the straight line from (0,0) to (1,1). In a situation of absolute inequality (in which only one person had all income), the Lorenz curve would run from (0,0) along the X axis until virtually (1,0) and then abruptly rise to (1,1).
The standard approach to measuring income inequality differs from our approach to measuring inequality of computer and Internet use in one key aspect. In the case of income distribution, virtually every household has income that is reported at a very specific level. In our case, we divide the population into distinct groups (such as by income, education, or occupation) and compute the number of users within each group. Note also that we cannot measure intensity of use. In most of the calculations in this chapter, a person who occasionally uses the Internet at the library is counted the same as someone using a broadband connection for hours a day.
Figure 9-2 shows the distribution of household computer ownership by family income in 1984 and 2001. In 1984, the lowest 42 percent of households by income accounted for only 12 percent of computer users. By 2001, the lowest income 45 percent of households included about 27 percent of computer users. With lower income people accounting for a much higher share of computer users in 2001, the curve for 2001 “bows out” much less than the curve for 1984. The Lorenz curve for 1984 divides the lower right triangle almost in half, for a Gini efficient that year of .438. By 2001, the area between the curve and diagonal was less than a quarter of the triangle, for a Gini coefficient of .229 in 2001. (By comparison, the Gini coefficient for the distribution of money income among households indicated greater inequality, rising from .415 in 1984 to .460 for the most recent year, 2000.)
Figure 9-2: Lorenz Curve for Households with Computers vs. Income
0.0
0.2
0.4
0.6
0.8
1.0
0.0 0.2 0.4 0.6 0.8 1.0Households ranked by income, cumulative share
Hou
seho
lds
with
com
pute
rs, c
umul
ativ
e sh
are
1984
200
(.449,.26
(.425,.12

A NATION ONLINE: How Americans Are Expanding Their Use of the Internet
National Telecommunications and Information Administration 87
Figure 9-3: Gini Coefficients for Households with Computers, Selected years
0.00
0.05
0.10
0.15
0.20
0.25
0.30
0.35
0.40
0.45
0.50
1984 1986 1988 1990 1992 1994 1996 1998 2000
Figure 9-3 traces the descent of the Gini coefficient for household computer ownership beginning in 1984 and continuing through available data points to 2001. The figure shows that, even though significant disparities remain, the distribution of computers among households has moved continuously in the direction of less inequality. Most of the decline occurred in the second half of the period. (By contrast, the Gini coefficient for household money income dispersion went in the other direction, rising from .415 in 1984 to .460 in 2000)
Internet use figures have a shorter history. Even so, whether measured against income, education, family type, or race/Hispanic origin, the distribution of Internet use at home has moved in the direction of lower inequality. Figures 9-4 and 9-5 depict the reduction of inequality between 1998 and 2001 in Internet use at home based on income and education categories. In the case of income groups, the Gini coefficient declined from .361 in 1998 to .254 in 2001. For educational attainment groups, the measures of inequality for the two years were almost identical, falling from .364 to .262.
Figure 9-4: Lorenz Curve - Internet Use at home vs. Family income Figure 9-5: Lorenz Curve - Internet Use at home vs. Education
0.0
0.2
0.4
0.6
0.8
1.0
0.0 0.2 0.4 0.6 0.8 1.0Population over age 3 ranked by Household income, cumulative s hare
1998
2001
0.0
0.2
0.4
0.6
0.8
1.0
0.0 0.2 0.4 0.6 0.8 1.0Population over age 25 ranked by Householder's Education, cumulative share
Inte
rnet
Use
at H
ome,
cum
ulat
ive s
hare
1998
2001

A NATION ONLINE: How Americans Are Expanding Their Use of the Internet
88 Economics and Statistics Administration
The Gini coefficient may also be used to calibrate the effects of work and school on inequality. Chapter 6 found that when someone in the household used the Internet at work, there were much smaller disparities in home Internet rates between high and low income households. That lower inequality is reflected by a Gini coefficient of only .083 among households with Internet users at work versus .298 among households in which no one uses the Internet at work.
Chapter 6 also noted that the rates of Internet use varied substantially by occupation, but were rising in some occupations that had been lower in 1998. The Gini measure confirms that, with a reduction of inequality by occupation falling from .374 in 1998 to .303 in 2001.
Similarly, Chapter 5 showed a substantial equalizing effect of school on both computer and Internet use compared to use at home. Among 10 to 17 year olds in 2001, the Gini coefficient for home computer use was .164 among income groups, but was only .026 for home and school computer use combined. In the case of Internet use, the disparity in home use was larger (.217) and the effect of schools was smaller (down to .126).
The measure of inequality for broadband fell from 2000 to 2001, but remains notably higher than the measure for household Internet subscriptions generally. The Gini coefficient for household broadband declined from .395 in August 2000 to .374 in September 2001. The Gini coefficient for household Internet subscriptions overall decreased from .309 to .270 over the same period. Because home broadband service costs substantially more than regular dial-up Internet service, it should come as no surprise that broadband is distributed more towards higher income groups than dial-up service.
These analyses show that substantial changes have occurred since the introduction of both home computers and the Internet when the initial user community tended to be dominated by those who had higher incomes or had them at work or both. The jobs involving computers and the Internet tended to require more education. As a result, inequality based on income and education was substantial. Over time, however, declining prices, increased availability in schools and libraries, and wider applications in many occupations have combined to reduce inequality in both computer and Internet use.

A NATION ONLINE: How Americans Are Expanding Their Use of the Internet
National Telecommunications and Information Administration 89
Table 9-1: Selected Gini Coefficients Population, Age 3 and Above: 1998 2001
Use Internet At Home by Income .361 .254
Use Internet At Home by Householder Education .364 .262
Population, Age 10-17: 1998 2001
Use Internet at Home by Family Income .367 .217
Use Internet Anywhere by Family Income .202 .115
At Home, 2001
At Home or School, 2001
Use Computer by Family Income .164 .026
Use Internet by Family Income .217 .126
Employed Persons, Age 25 and Over: 1998 2001
Use Internet at Work by Occupation .374 .303
All Households: 2000 2001

A NATION ONLINE: How Americans Are Expanding Their Use of the Internet
90 Economics and Statistics Administration
Internet Connection of Any Type by Family Income .309 .270
Broadband Connection by Family Income .395 .374
Someone in Household
Uses Internet at Work, 2001
No one in Household Uses
Internet at Work, 2001
Internet Connection by Family Income .083 .298

A NATION ONLINE: How Americans Are Expanding Their Use of the Internet
National Telecommunications and Information Administration 91
CONCLUSION
The Internet has become a tool that is accessible to and adopted by Americans in communities across the nation. Approximately two million more people become Internet users every month, and over half of the population is now online. Those who have been the least traditional users –people of lower income levels, lower education levels, or the elderly – are among the fastest adopters of this new technology. As a result, we are more and more becoming a nation online: a nation that can take advantage of the information resources provided by the Internet, as well as a nation developing the technical skills to compete in our global economy.
The expanding use of the Internet at schools, work, and libraries has played a significant role in this development. Young people are now active users of this technology. This report has demonstrated that the presence of computers and Internet access at schools is making these resources available to children who lack them at home. This means that our children will gain the skills and familiarity with new technologies that will allow them to find jobs in our new economy.
In addition, many more Americans than in years past are using computers and the Internet at work. Certain jobs that previously involved only manual labor, for example, now involve some use of information technologies. Proficiency with these technologies has become increasingly important, and adults are gaining such proficiency as more use information technologies at work and find new opportunities for using them at home.
Our nation has passed a significant milestone now that the majority of Americans use computers and the Internet for their daily activities. This trend is enriching our world, facilitating our work lives, and providing a skill set needed for a growing economy.

A NATION ONLINE: How Americans Are Expanding Their Use of the Internet
92 Economics and Statistics Administration
METHODOLOGY
This report utilizes data from the Department of Commerce’s U.S. Census Bureau, taken from the Census Bureau’s September 2001 Current Population Survey (CPS) of approximately 57,000 sample households. The survey took place during the week of September 16-22, 2001, and generated response rates of 93.5 percent for the basic CPS and 92.1 percent for the Internet and Computer Use Supplement.
The households surveyed were selected from the 1990 Decennial Census files with coverage in all 50 states and the District of Columbia. The sample is continually updated to account for new residential construction. The Census divided the United States into 2,007 geographic areas, each typically comprised of a county or several contiguous counties. A total of 754 geographic areas were selected for the 2001 CPS survey.
For each household, Census Bureau interviewers spoke to a person (called the “respondent”) who was at least 15 years old and was considered knowledgeable about everyone in the household. For purposes of collecting data at the household level (such as type of connection to the Internet), the respondent provided information pertaining to the “householder” or “reference person,” who is an adult in the household who either owns or has signed for the rent on the residence. For purposes of collecting data at an individual level, the respondent provided responses for him or herself and proxy responses for all other members of that household. The survey, therefore, provided information on 137,259 individuals (age 3 and older).
The Census Bureau cross-tabulated the information gathered from the CPS according to specific variables, such as income, race, education level, household type, and age as well as by geographic categories, such as rural, urban, and central city, plus state and region. The Census Bureau determined that some of the data were statistically insignificant for meaningful analysis because the sample from which they were derived was too small.
All statistics are subject to sampling error, as well as non-sampling error such as survey design flaws, respondent classification and reporting errors, data processing mistakes and undercoverage. The Census Bureau has taken steps to minimize errors in the form of quality control and edit procedures to reduce errors made by respondents, coders, and interviewers. Ratio estimation to independent age-race-sex-Hispanic population controls partially corrects for bias attributable to survey undercoverage. However, biases exist in the estimates when missed people have characteristics different from those of interviewed people in the same age-race-sex-Hispanic group.
The data used in this report are freely available in a Public Use File maintained by the Census Bureau. See www.census.gov.