Embed Size (px)
Citation preview
HOW AIR TRANSPORT CONNECTS THE WORLD
A NEW METRIC OF AIR CONNECTIVITY AND ITS EVOLUTION BETWEEN 1990 AND 2012
Florian AllroggenA, Michael WittmanB and Robert Malina*A
A Laboratory for Aviation and the Environment
Massachusetts Institute of Technology 77 Massachusetts Avenue, 33-115 Cambridge, MA 02139 USA
B International Center for Air Transportation Massachusetts Institute of Technology 77 Massachusetts Avenue, 35-217 Cambridge, MA 02139 USA
* Corresponding author: [email protected]
Report No. ICAT-2015-01 March 2015
MIT International Center for Air Transportation (ICAT)
Department of Aeronautics & Astronautics Massachusetts Institute of Technology
Cambridge, MA 02139 USA

[Page Intentionally Left Blank]

How Air Transport Connects the World 3
How Air Transport Connects the World - A New Metric of Air Connectivity and Its Evolution between
1990 and 2012
by
Florian Allroggen, Michael Wittman and Robert Malina
SUMMARY
Objective
Scheduled air transport services connect airports throughout the world and thereby enable
interaction on a global scale. By doing so, they spur globalization (Hummels, 2007) as well as
social and economic development (Lakshmanan, 2011). In order to facilitate integration of
regions into global value chains, planners, scholars and policymakers therefore need to
understand as to how scheduled air transport services link a region to other markets. For this
purpose, connectivity metrics have been developed, which measure the degree of connections
between airports (Burghouwt, Redondi, 2013). In particular, the ‘connection quality-weighting’
approach (Veldhuis, 1997; Burghouwt, de Wit, 2005) has been used to compute the aggregate
quality of all available connections at an airport with regard to their properties in quickly
bridging distances. However, such a metric has neither been calibrated on the basis of observed
passenger behavior nor been computed for the world’s airports across a multi-decade time series.
This paper sets out to develop the first such metric and to discuss global airline network
development between 1990 and 2012 from a connectivity perspective.
How Air Transport Connects the World 4
Methodology
The Global Connectivity Index (GCI) for each airport is computed by summing the connection-
quality of each available flight connection weighted by the interaction potential, to which the
connection provides access. This requires three levels of analysis. First, on the link-identification
level, we identify from OAG flight schedules all scheduled nonstop and onestop connections,
which are available to passengers at each airport. Second, on the link-quality level, we compute
each connection’s frequency and relative connectivity value as compared to (hypothetical)
nonstop flights. The relative connectivity value is derived from flight duration and layover time
and calibrated through observed routing data for US passengers. Third, on the destination-quality
level, we model the interaction potential, to which each worldwide airport provides access. For
this purpose, we use gridded wealth-adjusted population data and a distance-decay function.
Results By computing yearly GCI scores for 1990 to 2012, we analyze the geography of and trends in
worldwide connectivity. While we observe significant growth of aggregate connectivity at the
world’s airports, the growth patterns are heterogeneous with regard to the type of connectivity as
well as time and location: First, nonstop connectivity increases significantly and steadily at Asian
airports from 1990 to 2012, yet remains relatively unchanged at North American airports and
European airports between 2000 and 2012. Economic crises as well as consolidation among
legacy carriers, which has been offset by the emergence of newly established Low Cost Carriers,
can be considered key contributors to the limited growth in nonstop connectivity in North
America and Europe. Second, growth in global onestop connectivity outperforms growth in
nonstop connectivity by a factor of ~3.5. Onestop connectivity growth coincides with the
extension of global hub-and-spoke networks through increasing cooperation among airlines.

How Air Transport Connects the World 5
1 Introduction
Air transport connections enable interaction on a global scale, thereby catalyzing globalization
(Hummels, 2007) and spurring social and economic development (Lakshmanan, 2011).
Consequently, there is a significant societal interest to analyze air transport networks in terms of
the connections, which airports offer to potential users in its surrounding regions. In order to
appraise air transport-related policy measures such as, for example, airport infrastructure
investments or route subsidies, there is a need for planners and policymakers to consider the
impact of these measures on air transport connections.
Researchers have evaluated air transport networks and their connections with different
approaches as summarized in recent reviews by Zanin and Lillo (2013) and Burghouwt and
Redondi (2013). While Zanin and Lillo (2013) focus on analyses of network structure and
overall network performance, Burghouwt and Redondi (2013) specifically address the concepts
of ‘connectivity’ and ‘centrality’. They define connectivity as the degree of connection between
nodes (airports) in a network and centrality as the significance of transfer points in forming
indirect connections. In their review, Burghouwt and Redondi (2013) distinguish several metrics,
including metrics based on shortest and quickest connection paths (e.g. Shaw, Ivy, 1994;
Malighetti et al., 2008; Paleari et al., 2010; Zhang et al., 2010) as well as metrics computed by
summing connection quality over all available connections (e.g. Veldhuis, 1997; Burghouwt, de
Wit, 2005). However, they do not discuss the relative merits of these metrics. While shortest and
quickest paths analyses study overall network quality through optimal connections, ‘connection
quality-weighting’ approaches focus on the ‘value’ of each connection as perceived by
passengers. The latter approach consider all feasible connections for reaching each available
destination and use a set of assumptions to compute the (relative) ‘connectivity value’ of each
link. Connectivity values are derived from the relative quality of each connection in terms of
passengers’ efforts in traveling on that connection (i.e. flight duration and layover time)
Transaction-specific idiosyncrasies such as tastes or fares, which vary among potential
passengers and impact on each passenger’s itinerary choice, are not considered since they cannot
be aggregated to the route level, yet.
To date, no analysis exists which evaluates ‘quality-weighted’ connectivity and/or centrality at
the world’s airports with the help of an empirically calibrated model. Such a model is developed
in this paper. We compute these metrics to analyze worldwide connectivity and centrality trends

How Air Transport Connects the World 6
between 1990 and 2012. This period is of particular interest since it includes major changes in
the airline industry by means of deregulation and liberalization in different world regions, and
the emergence of global airline alliances and new airline business models.
The remainder of this paper proceeds as follows: In Section 2, the building blocks of ‘connection
quality-weighted’ connectivity and centrality are outlined. Section 3 develops the connectivity
and the centrality metrics. Global and world-region trends in connectivity and centrality between
1990 and 2012 are analyzed in Section 4. Section 5 concludes.
2 Building Blocks of the Model
Following ‘connection quality-weighting’ approaches (Veldhuis, 1997; Burghouwt, de Wit,
2005), we compute connectivity and centrality by assessing the quality of each air travel
opportunity. For this purpose, we structure the analysis into three levels (Fig. 1).
Fig. 1. Building blocks of the connection quality-weighting approach.
First, on the ‘link-identification-level’, we identify each airport’s travel connections to all linked
destinations as well as each connection’s transfer point (if applicable). Since air transport is
mostly scheduled transport, links are formed through (a series of) scheduled flights. We do not
follow analyses of shortest and quickest paths (e.g. Shaw, Ivy, 1994; Malighetti et al., 2008;
Paleari et al., 2010; Zhang et al., 2010), but instead identify all connections, which a passenger
might consider a feasible travel option. In so doing, we follow our objective to evaluate
connectivity and centrality of the entire network as perceived by passengers.
Second, the ‘link-quality-level’ assesses the ‘connectivity value’ of each connection through the
efforts to overcome distances with the help of the respective connection. As shown in the
itinerary choice literature (Coldren, Koppelmann, 2005; Hsiao, Hansen, 2011), a connection’s
quality is systematically driven by its frequency and its directness. The additional value of higher

How Air Transport Connects the World 7
frequencies results from a reduction in waiting time between a passenger’s desired departure
time and the scheduled departure time. The directness of a flight connection is a function of
detours and layovers which both cause disutility to the passenger. As discussed in the
introduction, fares are not considered, as fares are not a systematic property of a scheduled
connection due to widespread yield management practices leading to transaction-specific fare
levels.
Third, the ‘destination-level’ is used to account for the economic value of a connection in terms
of the interaction potential, to which the respective connection provides access. Most analyses of
air transport networks (e.g. Shaw, Ivy, 1994, Paleari et al., 2010) do not consider this quality
dimension since they intend to evaluate traffic patterns and overall network performance without
accounting for destination properties. In order to meet our objective of assessing the quality of
each connection from a potential passenger’s perspective and in line with the Economic
Geography literature (Redding, Venables, 2004; Breinlich, 2006; Redding, 2010), we add a
destination quality dimension to the connectivity model. Consequently, our connectivity metric
bears some resemblance to a transport-related accessibility metric, which maps the level of
potential interaction accessible through transport from a specific location (Geurs, van Wee,
2004).

How Air Transport Connects the World 8
3 The Model
3.1 The Connectivity Model
The connectivity metric is derived from the building blocks as outlined in Section 2. It extends a
connectivity metric developed by Wittman and Swelbar (2014) through adding a global
perspective, an itinerary model, an assessment of onestop flights’ relative connectivity value and
continuous modeling of global destination quality.
To compute the Global Connectivity Index score !"!!,! for an airport ! in year !, let ! be the
set of world airports, !!,! be the set of all destination airports that can be reached from airport !
in year ! and ℛ!,! be the set of all routings which link airport ! to its set of destinations !!,! in
year ! . Assuming the connectivity metric to be the sum of potential destinations’ quality
weighted by properties of each routing, we yield eq. (1).
!"#!,! = !!,!!!,!!!!,!!∈ℛ!,!
! (1)
where !!,! maps the directness of routing ! ∈ ℛ!,!, !!,! measures routing !’s frequency in year ! and !!!,! is the destination quality of route !’s final destination airport !! ∈ !!,! ⊆ ! in year !. The model is parameterized with the help of four sub-models, which are discussed in the
subsequent paragraphs.
3.1.1 Itinerary Model
The Itinerary Model parameterizes the ‘link-identification-level’ by identifying each departure
airport a ∈ !’s set of valid routings ℛ!,! in year !. For the identification of ℛ!,!, two routing
types are distinguished:
1. Nonstop Routings
A nonstop routing ! consists of a single scheduled flight which links departure airport
!! ∈ !! to destination airport !! ∈ !!,! without a stop. It is identified through the tuple
!!!"!#$"% = !!;!!;!"#$"%!!; !!!,!! !where !"#$"%!! is the operating airline of routing !’s
flight and !!!,!!! is routing !’s arrival time at destination airport !!. The set of airport !’s
nonstop routings ℛ!,!!"!#$"% is derived from flight schedules as published in the Official
Airline Guide (OAG). It is obtained by listing all scheduled passenger flights, which depart

How Air Transport Connects the World 9
airport ! during year !.1 For multi-segment flights (e.g. NZ1 on LHR-LAX-AKL), we treat
the first destination airport as being connected through a nonstop routing (e.g. LHR-LAX for
LHR or LAX-AKL for LAX) only.
2. Onestop Routings
A onestop routing ! links its departure airport !! ∈ ! to its destination airport !! ∈!!through two scheduled flights and a transfer at layover airport !! ∈ !. It is identified
through tuple !!!"#$%!& = !!; !!;!!;!"#. !1!;!"#. !2!; !!!,!!; !!!,!! ! where !"#. !1! and
!"#. !2! are the operating airlines of routing !’s first and second flight respectively, !!!,!! is
the arrival time of routing !’s first flight at layover airport !! and !!!,!! is the departure time
of routing !’s second flight from layover airport !! .!Identification of an airport !’s set of
valid onestop routings ℛ!,!!"#$%!&builds on the set of its nonstop routings ℛ!,!
!"!#$"%. For each
nonstop flight, we list all connecting flights in airport !!’s flight schedule to build all
potential onestop routings, each mapped by !!!"#$%!& . A potential onestop routing is
considered a feasible onestop routing ! ∈ ℛ!,!!"#$%!&if the following conditions are met:
i. Since passengers need sufficient time for a transfer at layover airport !!, a valid
routing must meet !!!,!! − !!!,!! ≥ 30!!"#.2
ii. If flights of routing ! are operated by different airlines or if the operating airline does
not sell connecting itineraries on a single ticket, passengers will have to buy separate
tickets, will have to bear the risk of missing their connection (without monetary
compensation) and will have to re-check their baggage. Given this disutility, only
onestop routings with two flights operated by a single airline, which sells connecting
tickets, 3 are considered feasible routings. 4 Exceptions are routings, which are
operated under code-share agreements. Such routings are evaluated as if the itinerary
was operated by a single airline (Oum, Park, 1997; Park, 1997). This yields the
conditions in eqs. (2).
!!!!!!!!!!!!!!!!!!!!!!!!!!!!!!!!!!!!!!!!!!!!!!!!!!!!!!!!1 For this analysis, the OAG data is filtered to include (i.) scheduled passenger flights only and (ii.) to remove multiple
listings of a single flight (i.e. codeshare entries). 2 We note that minimum layover time can exceed 30 min at numerous airports and longer minimum connection times (MCT)
have been assumed in the literature (e.g.Veldhuis, 1997, Paleari et al., 2010). As most passengers transfer at hubs where airlines coordinate incoming and outgoing traffic to offer indirect connectivity (Burghouwt, de Wit, 2005), bias of using a short MCT is smaller than using long MCT.
3 Many European Low Cost Carriers, for example, do not offer connecting tickets. A year-specific list of all airlines, which do not offer connecting flights, is compiled through desktop research. In a first step, we use an heuristic approach so that all airlines, which offer code shares, are assumed to sell transfer connections.
4!! We note that this approach implicitly assumes a prohibitively high disutility of ‘self-help hubbing’ (Malighetti et al., 2008). !

How Air Transport Connects the World 10
!!". !1! = !"#. !2! !!∧ !!!"#$%&'" !!". !1! = 1 (2a)
∨ !"#. !1! ∈ Γ!!! !∨ !"#. !2! ∈ Γ!!! ! (2b)
where Γ!!! [Γ!!!] is the set of airline codes on flight 1 [flight 2] of routing !5! and
!"#$%&'" ! = 1!!!!if#airline#a#offers#connecting#tickets0!!!!else$$$$$$$$$$$$$$$$$$$$$$$$$$$$$$$$$$$$$$$$$$$$$$$$$$$$$$$$$$$$ (3)
We assume the set of all routings to consist of the set of nonstop routings and the set of onestop
routings ℛ!,! = ℛ!,!!"!#$"% ∪ ℛ!,!
!"#$%!& . Burghouwt and Redondi (2013) suggest that limiting
the analysis to nonstop and onestop connections induces negligible bias for short- and medium-
haul connections, while some bias might exist for ultra-long-haul journeys (≥ 8,000 km). For our
model, we regard such potential bias to be negligible for two reasons. First, transfers result in
significant additional travel time for taxi, take-off and landings as well as for potential detours.
Second, empirical analyses show that waiting time and transfer time cause high disutility to
passengers (Veldhuis, 1997; Wardman, 2004). Since our model considers these dimensions of
connection quality, it would assign very low connectivity values to itineraries with more than
one transfer so that such itineraries would contribute only negligibly to overall connectivity.
3.1.2 Frequency Model
Frequency is considered as a driver of connectivity on the ‘link-quality-level’. Since a routing !
is defined through the combination of origin airport !! ∈ ! , layover airport !! ∈ ! (if
applicable), destination airport !! ∈ !, operating airline(s) and arrival and departure times, we
map multiple daily frequencies as different routings.6 In an effort to avoid potential seasonality
bias caused by computing connectivity scores for a small number of days (e.g. Malighetti et al.,
2008; Paleari et al., 2010; Redondi et al., 2011), we run a yearly connectivity analysis.7
Therefore, frequency !!,! maps the number of days on which routing ! is operated during year !. For onestop routings, both flights have to be operated to consider the routing operational.
!!!!!!!!!!!!!!!!!!!!!!!!!!!!!!!!!!!!!!!!!!!!!!!!!!!!!!!!5 Codeshare information is drawn from OAG schedule data. Each entry’s codeshare set, which is posted in the original OAG
schedules, is completed through adding codes from duplicate entries. 6 Given the additive nature of the GCI score, this approach is equivalent to an approach which does not use a time-sensitive
routing definition and therefore, explicitly considers frequency during the day. 7 The data, which is used for this purpose, represent schedules as loaded in the OAG database in December (1990-1998) or
January (1999-2012).

How Air Transport Connects the World 11
3.1.3 Directness Valuation Model
The directness valuation model evaluates the quality of a routing in terms of its directness. In
previous connectivity analyses that consider routings’ connection quality authors have suggested
to uniformly value onestop routings at one eighth of the value of a nonstop routing (Emrich, de
Harris, 2008; Wittman, Swelbar, 2014). Since onestop routings are heterogeneous with respect to
their detour and layover though, we follow Veldhuis (1997) and Burghouwt and de Wit (2005)
and derive a relative connectivity value !! for each routing !. This value is introduced so as to
map the relative disutility of onestop routings as compared to (hypothetical) nonstop routings.
We do not derive the relative connectivity value from disutility as compared to the quickest path
(Redondi et al., 2011) because quickest paths’ directness is heterogeneous (Paleari et al., 2010)
so that it cannot be used to normalize disutility. As shown in eq. (4), we therefore model !! as a
function ! ∙ of its detour factor Δ!.
!! = ! Δ! (4)
where the detour factor Δ! is computed as the ratio of total perceived travel time on routing ! as
compared to the travel time on a (hypothetical) direct flight between airports !! and !!. This
yields eq. (5).8
Δ! =1!!!!!!!!!!!!!!!!!!!!!!!!!!!!!!!!!!!!!!!!!!!!!!!!!!!!!!!!!!!!!!!!!!!!!∀!!! ∈ !!!"!#$"%!"#$!!!,!! + !"#$!!!,!! + ! ∙ !"#$!!
!"#$!!!,!!!!!!∀!!! ∈ !!!"#$%!&
(5)
where !"#$!!,! is the duration of a flight between airports ! and !, !"#$!! is the layover time at
airport !! on route ! and ! is the relative value of layover time as compared to flight time. The
latter is considered because empirical evidence suggests the disutility of in-vehicle time (flight
time) to be lower than the disutility of waiting (layover) time (Veldhuis, 1997; Wardman, 2004).
Given recent empirical analyses on the value of waiting time for public transport, we assume
! = 2 (Abrantes, Wardman, 2011).9
For the calculation of Δ!, routing !’s scheduled layover time is computed as !"#$!! = !!!,!! −!!!,!! . In order to use a consistent set of operational assumptions for all flights and to
!!!!!!!!!!!!!!!!!!!!!!!!!!!!!!!!!!!!!!!!!!!!!!!!!!!!!!!!8 Note that Δ! = 1!!!∀!!r ∈ ℛ!
!"!#$"%!since there is no layover and no detour for direct flights. 9 Veldhuis (1997) assumes ! = 3 and Burghouwt and de Wit (2005) use ! = 2.4, but none of the analyses derive their values
from published empirical literature.

How Air Transport Connects the World 12
homogenize scheduling behavior of airlines, the duration of nonstop flights is estimated with the
help of the linear block-time model in eq. (6).
!"#$!!,! = !! + !! ∙ !"#!!,! (6)
This model assumes a flight’s block-time (scheduled gate-to-gate duration of a flight) to be a
linear function of its great circle distance !"#!!,! and a fixed block-time component !! for
taxiing, take-off and landing. The parameters !! and !! are estimated by using OLS procedures10
and OAG’s block-time data! on 27.66m worldwide scheduled nonstop flights in 2008. Great
circle distance for each flight is computed by using geographical airport positions from the Open
Flights Airport Database. The estimates are reported in Tab. 1. In Fig. 2, a scatterplot of the data
and of the block time predictions is presented. The results show a high fit of the model so that the
empirically calibrated model can be used to obtain scheduled block-time predictions.
Fig. 2. Block time, estimated block time and great circle distance.
Tab. 1. Estimation results for the block-time# model.
Parameter Variable Estimate β0 cons. 39.12***
(0.032) β1 dista,b 0.072***
(0.000) R2 0.9667 N 27,661,130
Standard errors in parenthesis. # Block-times are reported in minutes. *** Significant at the 1 % level.
!!!!!!!!!!!!!!!!!!!!!!!!!!!!!!!!!!!!!!!!!!!!!!!!!!!!!!!!10 By following this approach, we implicitly assume an ’average flight scenario’ for all flights. This scenario does neither
account for route-specific impacts of aircraft choice nor for route-specific impacts of congestion or prevailing weather conditions. Thus, flight time differences result from ceteris paribus variations of distance, only.

How Air Transport Connects the World 13
To compute relative connectivity values !!, we parameterize function !(∙) as follows:
1. We normalize the relative connectivity value of a nonstop connection ! ∈ !!!"!#$"% to
!! = 1. This yields !! = ! Δ! = 1 = 1.
2. We assume that a critical detour factor Δ exists so that ! Δ! = 0!!!∀!!Δ! ≥ Δ. Thus, a
onestop routing ! is assigned a relative connectivity value of 0, if passengers are not
willing to accept its detour (∆!> ∆). By using linear interpolation for"1 ≤ Δ! ≤ Δ,"we yield eq. (7).
!! = max 0, ΔΔ− 1−
1Δ− 1 ∙ Δ! (7)
Although previous analyses have assumed a maximum detour factor (Veldhuis, 1997;
Burghouwt, de Wit, 2005; Redondi et al., 2011), Δ has not yet been calibrated empirically. For
the calibration, this analysis studies Q2-2011 US-domestic ticket data from the DB1B sample on
the degree of detour that passengers are willing to bear. For each onestop ticket in the sample, we
compute Δ! by using ticket information and complementary OAG flight schedule data. Δ is
estimated through the 95th percentile11 of the observed Δ! (Tab. 2). We do not use the observed
maximum of Δ!, since the distribution of observed Δ! is positively skewed and leptokurtic12 due
to potential outliers and/or unlabeled multi-segment itineraries.
In line with Veldhuis (1997), one might argue that Δ is a function of (hypothetical) direct flight
distance !"#!!!,!! since the maximum acceptable detour in absolute terms might increase with
!"#!!!,!!, but declines in relative terms. By calculating the 95th percentiles of observed Δ! for
350-km-intervals of !"#!!!,!! (Tab. 2), we indeed identify a reduction of Δ with !"#!!!,!!. To
avoid arbitrary breaks, Δ conditional on !"#!!!,!! is modeled through linear interpolation of the
estimates (Fig. 3). The DB1B sample contains US-domestic tickets only so that 96.3 % of the
covered nonstop flights are shorter than 4,200 km. Given visual indications of Δ’s convergence
towards a constant value for high !"#!!!,!! (Fig. 3), we assume Δ to be constant for !"#!!!,!! ≥4200!!".
To validate the directness valuation model, we compute critical layover time and relative
connectivity values for connections with a 45 min layover. The results are shown in Tab. 3. We
!!!!!!!!!!!!!!!!!!!!!!!!!!!!!!!!!!!!!!!!!!!!!!!!!!!!!!!!11 The 92nd and the 97th percentile are considered to assess the sensitivities. 12 Skewness ! = 6.68 and curtosis ! = 130.91.

How Air Transport Connects the World 14
find that the weights (for a 45 min layover) and critical layover times appear to be within
reasonable bounds, which provides evidence for the validity of the directness valuation model.
Tab. 2. Percentiles of Δ! in Q2-2011 DB1B tickets.
Distance range 92nd Percentile
95th Percentile
97th Percentile from [km] to [km]
0 350 3.757253 4.070018 4.3370387 350 700 3.4519708 3.6936926 4.0369704 700 1050 2.9950553 3.1914789 3.4916569 1050 1400 2.6292191 2.8322571 3.1274016 1400 1750 2.368249 2.544571 2.8105519 1750 2100 2.177788 2.329377 2.560708 2100 2450 2.0806659 2.2152831 2.4047286 2450 2800 1.9633982 2.0890465 2.2553335 2800 3150 1.9133304 2.0356163 2.2538368 3150 3500 1.8464689 1.9590001 2.1074851 3500 3850 1.819149 1.9255417 2.0841169 3850 4200 1.7557251 1.8695927 2.0426838 All distances 3.1266324 3.4331318 3.8511574
Fig. 3. Maximum relative detour factor.
0 2000 4000 6000 8000
12
34
5
Great Circle Distance [km]
Δ̂
92nd Percentile95th Percentile97th Percentile

How Air Transport Connects the World 15
Tab. 3. Validation of the directness valuation model
Origin airport
Layover airport
Destination airport
Estimated block time 92nd Percentile ! 95th Percentile ! 97th Percentile ! Nonstop [min]
Onestop[min] Critical Layover [min]*
Weight with 45 min layover
Critical layover [min]*
Weight with 45 min layover
Critical layover [min]*
Weight with 45 min layover
CDG MUC LHR 64 195 18 0.000 27 0.000 37 0.00 CDG AMS LHR 64 134 49 0.047 58 0.138 68 0.22 CDG ARN LHR 64 294 - ** 0.000 - ** 0.000 - ** 0.00 CDG FRA JFK 459 556 125 0.462 151 0.532 191 0.61 CDG VIE JFK 459 643 82 0.212 108 0.315 148 0.43 CDG LHR JFK 459 502 152 0.617 178 0.667 218 0.72 CDG ARN JFK 459 642 82 0.213 108 0.316 148 0.43 CDG MUC HKG 730 777 252 0.751 294 0.784 357 0.82 CDG AUH HKG 730 889 196 0.548 238 0.607 301 0.67 CDG JNB HKG 730 1476 - ** 0.000 - ** 0.000 7 0.00 CDG LHR HKG 730 797 242 0.715 284 0.752 347 0.79 CDG AMS IST 200 266 76 0.286 90 0.365 109 0.45 CDG ARN IST 200 348 35 0.000 49 0.031 68 0.16 CDG MUC IST 200 241 89 0.403 103 0.469 122 0.54 CDG FCO IST 200 257 81 0.327 94 0.402 114 0.48 CDG MAD IST 200 350 34 0.000 48 0.023 67 0.16 CDG SIN SYD 1259 1304 454 0.859 525 0.877 634 0.90 CDG ICN SYD 1259 1322 445 0.840 516 0.861 625 0.88 CDG PEK SYD 1259 1314 449 0.849 520 0.868 629 0.89 CDG DXB SYD 1259 1323 444 0.839 516 0.860 625 0.88 CDG HKG SYD 1259 1301 455 0.861 527 0.879 636 0.90 BOS ATL MIA 185 257 70 0.240 84 0.326 104 0.42 BOS ORD MIA 185 317 40 0.000 54 0.073 74 0.21 BOS IAH MIA 185 375 12 0.000 25 0.000 45 0.00 BOS JFK MIA 185 226 86 0.383 99 0.453 120 0.53 BOS ATL LAX 341 413 93 0.372 112 0.454 142 0.54 BOS ORD LAX 341 380 109 0.499 129 0.565 158 0.64 BOS CLT LAX 341 408 95 0.390 115 0.470 144 0.56 BOS JFK LAX 341 386 106 0.476 126 0.545 155 0.62 BOS MIA LAX 341 495 52 0.053 71 0.177 101 0.31 BOS YYZ IAH 224 278 83 0.345 97 0.420 116 0.50 BOS ATL IAH 224 268 88 0.393 102 0.462 121 0.53 BOS JFK IAH 224 264 90 0.409 104 0.477 123 0.55 BOS SFO IAH 224 580 - ** 0.000 - ** 0.000 - ** 0.00 BOS FRA DUS 451 516 138 0.545 164 0.605 203 0.67 BOS CDG DUS 451 505 143 0.577 169 0.632 208 0.69 BOS LHR DUS 451 492 150 0.616 176 0.666 215 0.72 BOS ARN DUS 451 594 99 0.316 124 0.405 163 0.50 BOS KEF DUS 451 517 137 0.543 163 0.603 202 0.67 BOS FCO DUS 451 633 79 0.201 105 0.306 144 0.42 BOS MAD DUS 451 576 108 0.368 133 0.451 172 0.54 * Layover time which yields ∆= ∆ and ! = 0. Minimum connecting time and actual schedules are not considered. ** A critical layover time does not exist, since the flights use the maximum allowed additional perceived travel time.

How Air Transport Connects the World 16
3.1.4 Destination Quality
The destination quality model addresses the ‘destination-level’ by evaluating the level of
potential economic interaction to which an airport provides access. Since interaction partners are
only partially located at the airport, the model needs to (i.) define the geographical area to which
airports provide access and (ii.) identify a metric for interaction potential. As shown in eq. (8),
both dimensions are reflected in destination airport !!’s quality metric !!!! , which is defined in
line with Accessibility metrics (Paez et al., 2012) and market access metrics in (New) Economic
Geography (Redding, 2010).
!!!! = ℎ !"#$!!,! !!!∈!!!
.! (8)
where the set of markets!!!!, to which a destination airport !! provides access, and the decay
function ℎ(∙), which is driven by linear distance !"#!!!,! between airport !! and market !, map
the geography of the destination market while!!! measures market ! ’s level of potential
interaction.
Contrary to the geographical scope of airport catchment areas for departing passengers, no
literature exists, to date, on the geographical scope of regions to which arrival airports provide
access. However, it is reasonable to assume that access to regions from an arrival airport is
symmetric to airport access for departing passengers. The latter has been analyzed in airport
choice studies, which have identified a negative impact of airport access impedance on airport
choice (Pels et al. 2001; Başar, Bhat, 2004; Hess, Polak, 2005; Ishii et al., 2009; Marcucci, Gatta,
2011).13 While such evidence underlines the significance of a decay pattern, the functional form
of that pattern remains unexplored, since most analyses apply choice models derived from linear
or linear-log utility functions. Notable exceptions are Harvey (1987), Hess et al. (2007) and de
Luca (2012). Given their results, one might expect the decay function to be inversely s-shaped.
Thus, we model the decay pattern through the logistic decay function in eq. (9).
ℎ !"#$!!,! = !1+ !!!∙!"#!!!,!!! ! (9)
which is decreasing for ! < 0 and inversely s-shaped for ! < 0. For ! < 0, this pattern implies
that markets far-away from an airport !! do not significantly add to airport !!’s destination
!!!!!!!!!!!!!!!!!!!!!!!!!!!!!!!!!!!!!!!!!!!!!!!!!!!!!!!!13 We note that according to airport choice studies, air service-related attributes impact on airport choice. We do not model
such attributes, as our analysis investigates the quality of the market, to which destination airports potentially provide access.

How Air Transport Connects the World 17
market quality, since ℎ(∙) → 0 for !"#!!!,! → ∞ . To avoid large computational burden,
especially in case of using high-resolution market data, without inducing considerable error, we
modify ℎ(∙) to include a distance threshold !"#$ so that ℎ !"#$!!,! = 0 for !"#$!!,! > !"#$. This yields eq. (10).
ℎ !"#$!,! = max 0, !1+ !!!∙!"#!!!,!!! − ! ! (10)
Parameters !, !, ! and ! are fitted as follows:
1. The decay function is standardized by assuming ℎ !"#$!!,! = 0 = 1. Based on this
assumption, the scaling parameter ! is calculated as shown in eq. (11).
! = (1+ !!)(! + 1)! (11)
2. Matisziw and Grubesic (2010) consider airports within 257 km as part of a person’s
airport choice set. By assuming symmetry of airport access and market access, we yield
!"#$ = 257 km and eq. (12).
! = (1+ !!)(! + 1)1+ !!!∙!"#!! ! (12)
3. We consider the decay function a representation of (scaled) passenger density, so that the
share of passengers !"#!$%(!!), who travel less than !! km to airport !!, at airport !! is
shown in eq. (13).
!"#!$% !! =ℎ !"#!!!,! !!"#!!!,!
!!!
ℎ !"#!!!,! !!"#!!!,!!"#$!
! (13)
While considering eqs. (10), (11) and (12), we use eq. (13) to compute !"#!$% for a
distance threshold !! at given ! and !. With the help of airport choice data, parameters !
and ! can now be chosen so as to minimize the sum of squared deviations between
observed and estimated passenger shares. For that purpose, we use data from the 2001
Airline Passenger Survey for the San Francisco Bay Area (CRA, 2004) and from the
2003 German Air Traveler Survey (Wilken et al., 2007).14 This yields ! = 1.0500,
! = −3.0020 , ! = 0.0003 and ! = −0.0435 with an average absolute deviation of
estimated and observed passenger shares at 3 percentage points. The resulting decay
pattern is plotted in Fig. 4. !!!!!!!!!!!!!!!!!!!!!!!!!!!!!!!!!!!!!!!!!!!!!!!!!!!!!!!!!14 From the Airline Passenger Survey for the San Francisco Bay Area, we include data on the share of (weighted) passengers
for distance thresholds between 75km and 250 km at a 25 km resolution. In addition, the average share at a 75 km threshold at German airports is considered.

How Air Transport Connects the World 18
Fig. 4. Airport access decay pattern.
!We note that this analysis sets out to approximate markets, to which airports potentially provide
access. Thus, it does not model observed passenger behavior, which varies between airports or
between destination markets at a specific airport (Wilken et al., 2007; Lieshout 2012).
Nevertheless, we regard this approach as advancing previous work since it does neither rely on a
subjective definition of a maximum access distance threshold without any decay (Malighetti et
al., 2008; Maertens, 2010) nor on subjective definitions of decay not backed by observed
passenger behavior (e.g. Bel, Fageda, 2010).
To model the level of potential interaction in market !, gridded global population data adjusted
by differences in wealth levels is used. 15 In particular, the analysis is based on the LandScan
data16, which contains global estimates of ambient population at a 30 arc-second resolution for
yearly model iterations between 2000 and 2012 (Oak Ridge National Laboratory, 2014). For
missing years, population data is obtained by applying yearly country-level population growth
rates from the World Bank’s World Development Indicators database (World Bank, 2014a) to
each grid cell. Wealth differences are considered by normalizing the population in each grid cell
with GDP per capita data from the World Development Indicators database for the respective
country and year.
For our calculations, we use the standardized destination quality metric !!!,! in eq. (14).
!!!!!!!!!!!!!!!!!!!!!!!!!!!!!!!!!!!!!!!!!!!!!!!!!!!!!!!!15 We do not follow Wittman and Swelbar (2014) or Reynolds-Feighan and McLay (2006) in using traffic data to approximate
destination quality since traffic does not reflect the level of potential interaction to which a destination airport provides access.
16 LandScan (2000 through 2012)™ High Resolution global Population Data Set is copyrighted by UT-Battelle, LLC, operator of Oak Ridge National Laboratory under Contract No. DE-AC05-00OR22725 with the United States Department of Energy.

How Air Transport Connects the World 19
!!!,! =!!!,!!
max !!,!!! !|!! ∈ !!! ∧ !!!′ = ! !!.! (14)
This metric can be interpreted as the relative quality of the market, to which airport !! provides
access, in year ! as compared to the highest observed destination quality of any airport in year !. Year-2007 results for the LandScan-based destination quality metric are presented in Tab. 4.
Tab. 4. Results from the destination quality model for the year 2007.
Airport City Country IATA Code
!!!,! Percentile in Dataset
Tokyo Intl. Tokyo Japan HND 0.949 0.0% Newark Liberty Intl. Newark United States EWR 0.730 0.2% John F. Kennedy Intl. New York United States JFK 0.705 0.2% Heathrow London United Kingdom LHR 0.594 0.5% Los Angeles Intl. Los Angeles United States LAX 0.512 0.7% Düsseldorf Düsseldorf Germany DUS 0.501 0.8% Manchester Manchester United Kingdom MAN 0.445 1.2% Orly Paris France ORY 0.418 1.6% Charles De Gaulle Paris France CDG 0.409 1.6% Schiphol Amsterdam Netherlands AMS 0.360 2.1% Chicago O'Hare Intl. Chicago United States ORD 0.360 2.1% Brussels Brussels Belgium BRU 0.359 2.2% Incheon Intl. Seoul South Korea ICN 0.340 2.5% Ronald Reagan Washington Natl. Washington United States DCA 0.276 3.2% Washington Dulles Intl. Washington United States IAD 0.246 4.1% Hong Kong Intl. Hong Kong Hong Kong HKG 0.221 4.6% ...
Bahrain Intl. Bahrain Bahrain BAH 0.036 24.9% Lourdes Tarbes France LDE 0.035 25.1% ...
Lanzarote Las Palmas Spain ACE 0.006 50.0% Luxor Intl. Luxor Egypt LXR 0.005 50.2% ...
Strahan Airport Strahan Australia SRN 0.001 74.9% Teniente Vidal Coyhaique Chile GXQ 0.001 75.2% ...

How Air Transport Connects the World 20
3.2 The Centrality Model
For each airport ! ∈ ! , we define the set of onestop routings ℛ!,!!"#$%!& which pass
through airport !, so that !! = !!!∀!!! ∈ ℛ!,!!"#$%!&. Following eq. (1), airport !’s Global
Hub Centrality Index score !"#!!,! can be calculated as the sum of destination quality at
each destination !! !!∀!!! ∈ ℛ!,!!"#$%!& weighted by properties of the respective routing.
This yields eq. (15).
!"#$!,! = !!,!!!,!!!!,!!∈ℛ!,!
!"#$%!&! (15)
Applying the methodology from Section 3.1 parameterizes this metric.
3.3 Growth Decomposition of the Metrics
As analytically shown in Appendix A, changes of the GCI metric over time can be
decomposed into three partial effects:
1. Network effects
Network effects capture GCI-variation, which results from ceteris paribus changes of
air services, i.e. in frequency, layover time or layover airport. We note, that in order
to compute these network effects, the GCI decomposition (Appendix A) requires the
network-induced changes in connection quality to be weighted by the year-1990
destination quality score. If one wants to map network changes without accounting
for destination weights, a related metric, the change in destination-invariant GCI,
should be used. This is because the destination-invariant GCI assumes the destination
weight to be 1 for all airports.
2. Destination-quality effects
Destination-quality effects are changes in GCI, which result from ceteris paribus
variation in destination quality. In a full decomposition of GCI growth, these effects
must be calculated by assuming connection quality as derived from the year-1990
network (Appendix A).

How Air Transport Connects the World 21
3. Simultaneity effects
The network effects and the destination-quality effects are ceteris-paribus GCI
variations, which are computed by using the base-year destination-weights and the
base-year network respectively (Appendix A). In turn, simultaneous variation of the
network and of destination quality causes impacts beyond the sum of the network
effects and the destination quality effects (Appendix A). In the subsequent analysis,
we call these additional effects “simultaneity effects”. They are positive, if
destinations with growing destination weights receive improved air services, and
negative if air services to destinations with growing destination weights are reduced.
4 Results
4.1 Nonstop Connectivity
We assess the distribution of global nonstop connectivity among airports first by
visualizing the scores.17 Fig. 5 (a) shows that global year-1990 nonstop connectivity was
concentrated in North America, Europe and Japan. In particular, North American airports
[European airports; Japanese airports] accounted for 63 % [23 %; 6 %] of global nonstop
GCI in 1990. High destination weights in developed countries and well-established
nonstop links between airports in these countries partly explain this dominance.
However, while the year-1990 distribution of destination-invariant GCI scores (Fig. 6
(b)) is more balanced than the distribution of GCI scores (Fig. 6 (a)), airports in North
America, Europe and Japan still accounted for 76.2 % of global destination-invariant
nonstop GCI in 1990.18
!!!!!!!!!!!!!!!!!!!!!!!!!!!!!!!!!!!!!!!!!!!!!!!!!!!!!!!!17 The distance decay function outlined in Section 3.1. is applied for assigning each airport’s score to its surrounding
region. 18 Japan is part of the “East Asia & Central Asia” world region. In 1990, Japanese airports explained 76.2 % [41.8
%] of nonstop GCI [destination-invariant nonstop GCI] in this region.
How Air Transport Connects the World 22
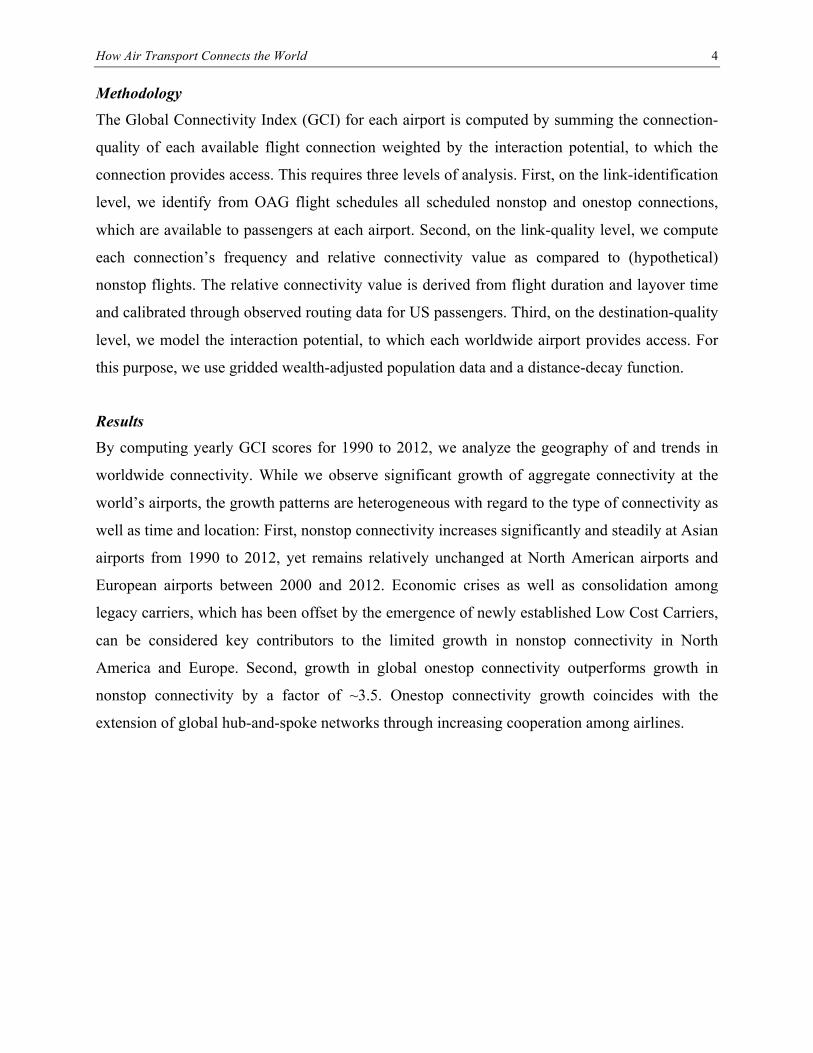
Fig. 5. World map of nonstop GCI.
(a) Year 1990
!(b) Year 2012
! From 1990 to 2012, global aggregate nonstop GCI grew by 86.3 % (Fig. 7). During the
1990s, growth was almost exclusively driven by network effects (96.7 % of growth),
whereas between 2000 and 2012, network effects [destination-invariant GCI] declined
[increased] by 1.0 % [9.6 %]. At first glance, the results for the destination-invariant GCI
for 2000-2012 might seem contradictory to observed increases in air traffic volumes over
the same time-period. 19 However, the reported 62 % rise in revenue passenger kilometers
for 2000-2012 (Airbus, 2013) can be explained by increases in flight distances (+12.7%
(Airbus, 2013)), aircraft capacity (+18.6 % (Airbus, 2013)) and load factors (~71% to
~79% (Airbus, 2014)). The difference between the development of the network effects
and destination-invariant GCI is caused by above-average growth in traffic in less-
developed world regions which points to the existence of spatial heterogeneity in the
connectivity development. !!!!!!!!!!!!!!!!!!!!!!!!!!!!!!!!!!!!!!!!!!!!!!!!!!!!!!!!19 Note that the destination-invariant GCI should be used for the comparison to traffic growth since it is independent
of destination weights (Section 3.3).

How Air Transport Connects the World 23
Fig. 6. Nonstop connectivity distribution by world region.
a) Nonstop GCI.
b) Destination-invariant nonstop GCI.
To further assess this spatial heterogeneity, we analyze changes in the nonstop
connectivity distribution between 1990 and 2012. Although the year-2012 nonstop
connectivity distribution was still concentrated to North America, Europe and Japan (43.2
%, 23.6 % and 8.7 % of global nonstop connectivity), the connectivity share of airports in
those areas declined from 92.0 % to 75.4 % (Fig 5 (b); Fig. 6 (a)). This was particularly
caused by high connectivity growth at (non-Japanese) Asian airports, whereas during the
2000s, the North American network deteriorated and network-related connectivity growth
in Europe slowed down (Fig. 6 (b)). Given the heterogeneity in development in North
America, Europe and Asia, we discuss nonstop connectivity trends in these regions in
more detail.

How Air Transport Connects the World 24
Fig. 7. Global nonstop connectivity development.
!
4.1.1 North America
Between 1990 and 2012, the increase in nonstop GCI at North American airports (28.1
%) was lower than global aggregate GCI growth (86.3 %) (Fig. 8). Network effects drove
54.7 % of the North American increase in GCI during the 1990s. In the 2000s, network
effects at North American airports decreased by 17.7 %. Since US airports accounted for
95 % of aggregate North American nonstop GCI, we can explain the development in
North America with US developments.
Fig. 8. Nonstop connectivity development in North America.
!!

How Air Transport Connects the World 25
In the beginning of the 1990s, the US airline industry incurred significant losses (Chan,
2000; Dempsey, 2008). Carriers such as Continental, Pan Am, Midway, Eastern Airlines
and TWA filed for bankruptcy (Chan, 2000). However, these bankruptcies did not
significantly impact on aggregate connectivity since many services were taken over by
competitors (e.g. PanAm) or bankrupt airlines were allowed to continue their operations
(Chan, 2000). From the mid 1990s, the industry recovered (Dempsey, 2002; Goetz,
Vowles, 2009), which is reflected in positive network effects until the end of the 1990s.
From 2000 to 2002, declining travel demand after the collapse of the dot-com bubble,
catalyzed by the attacks on September 11, 2001, rising security concerns and the SARS
outbreak (Goetz, Vowles, 2009), led to an 11 % service reduction at North American
airports. In spite of schedule reductions, US carriers incurred losses of $ 35b between
2001 and 2006 (Dempsey, 2008). Furthermore, several legacy carriers (e.g. Delta
Airlines, United Airlines, US Airways and Northwest Airlines) filed for bankruptcy
(Goetz, Vowles, 2009) and/or underwent reorganization resulting in a reduction of legacy
operations by 4.0 % between 2002 and 2007.20 At the same time, US low cost carriers
were still profitable (Francis et al., 2006; Goetz, Vowles, 2009), grew their business by
41.7 %21 and thereby stabilized the aggregate US network effect.
During the US subprime crisis starting in summer 2007 and the subsequent world
financial crisis, a decrease in air travel demand caused airlines to enter another phase of
substantial financial losses (Dobruszkes, van Hamme, 2011; Wittman, 2014). As a
reaction to decreased demand, US carriers employed “capacity rationalization” (Wittman,
2014) and adjusted schedules by cutting flight services, which lead to a decrease in the
North American destination-invariant GCI [the network effect] by 12.1 % [10.7%] from
2008 to 2010. Between 2010 and 2012, the reductions in North American destination-
invariant nonstop connectivity [the North American network effect] slowed to 4.4 % [2.9
%], which Wittman (2014) calls a phase of “capacity discipline”.
Turning to the connectivity distribution among North American airports, researchers have
found the build-up of US hub-and-spoke networks to enhance core-periphery patterns !!!!!!!!!!!!!!!!!!!!!!!!!!!!!!!!!!!!!!!!!!!!!!!!!!!!!!!!20 We consider American Airlines, Northwest Airlines, United Airlines, Delta Air Lines, US Airways, Continental,
America West Airlines, Midwest Airlines and Alaska Airlines. 21 We consider Southwest Airlines, JetBlue, AirTran, Frontier Airlines, Spirit Airlines, Sun Country Airlines,
Allegiant Air and Virgin America.

How Air Transport Connects the World 26
(Goetz, Sutton, 1997). Indeed, the year-1990 distribution of nonstop connectivity among
North American airports was highly concentrated on the largest 25 [10] North American
airports, which accounted for 48.0 % [25.9 %] of aggregate year-1990 nonstop GCI (Fig.
9). Furthermore, the concentration ratio of the 25 [10] largest airports increased by
∆CR!" = 7.8!!pp [∆CR!" = 3.3!!pp] between 1990 and 2012 (Fig. 9). 30.8 % [54.1 %] of
the CR!" [CR!"] increase was observed between 2010 and 2012. This is consistent with
observed network development strategies of US carriers, which have centered traffic at
their hubs in these years (Wittman, 2014) and thereby increased the “peripheralization”
(Goetz, Sutton, 1997) of secondary and tertiary US airports.
Fig. 9. Connectivity concentration among US airports.
!
4.1.2 Europe
European nonstop GCI grew by 89.7 % from 1990 to 2012, which is similar to global
average nonstop GCI growth (86.3 %) (Fig. 10 (a)). The growth between 1990 and 2000
was predominantly fueled by a 69.0 % increase in network effects (Fig. 10 (a)), whereas
in the 2000s, destination quality effects largely drove nonstop GCI developments
(correlation coefficient: 0.99).
How Air Transport Connects the World 27
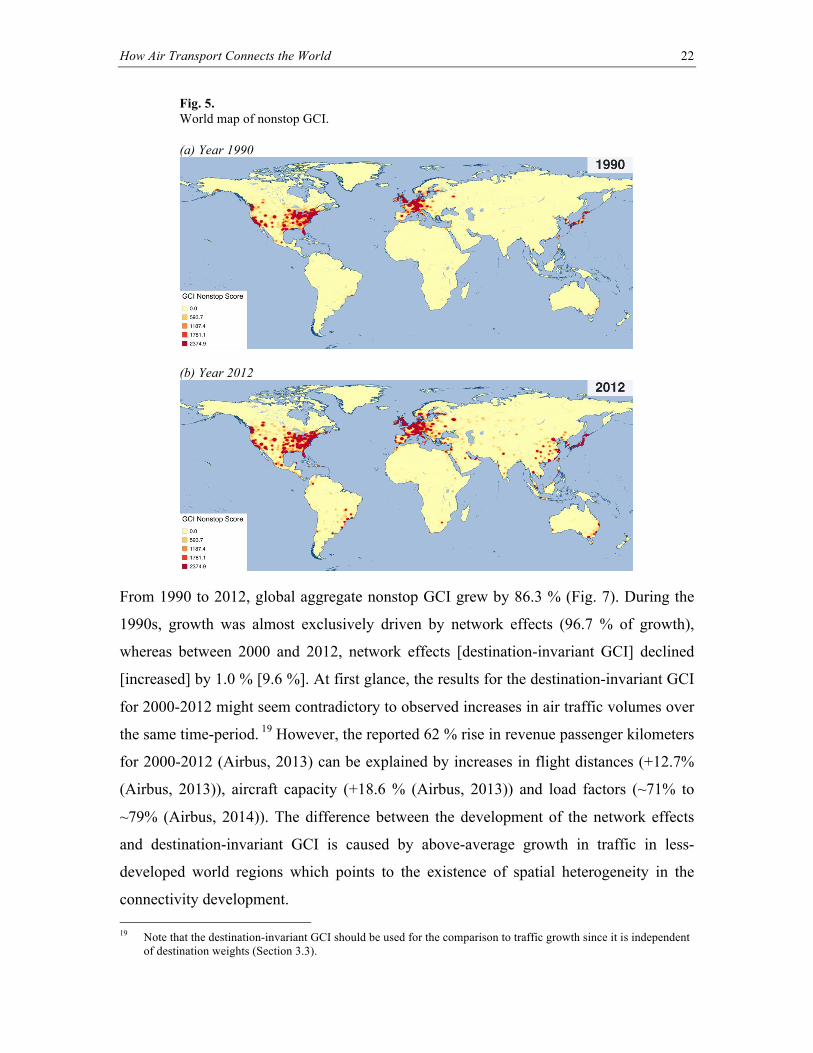
Fig. 10. Nonstop connectivity development in Europe.
(a) World region “Europe”
!(b) EU-15 and Norway
!(c) New EU entrants
!!

How Air Transport Connects the World 28
Between 1987 and 1997, the European air transport market was liberalized. In 1993,
capacity control and market access control were abolished with the exception of cabotage
rights, which were granted in 1997 (Berechman, de Wit, 1996). Deregulation first
affected the EU-15 member states and Norway.22 In these countries, network effects
increased by 59.7 % between 1993 and 2000 (Fig. 10 (b)), thereby outperforming the
global aggregate nonstop network effects over the same period (30.5 %). Although this
growth might partly be explained by economic recovery after the Gulf crisis, market
deregulation should be considered a catalyst since new (albeit small) airlines entered the
market (Berechman, de Wit, 1996) and above-average growth in intra-European traffic
was observed (Burghouwt, Hakfoort, 2001).
In 2004, 10 countries joined the European Union followed by Romania and Bulgaria in
2007. This has resulted in significant aviation growth (Dobruszkes, 2009; Dobruszkes,
2013). While the compound annual growth rate (CAGR) of the nonstop network effect in
the new member states averaged 8 % between 1990 and 2003, it increased to 19.2 %
between 2003 and 2006 (Fig. 10 (c)). We note that multiple causal relationships, which
are catalyzed through EU entry, may cause this, including the deregulation of air
transportation in the new member states (Dobruszkes, 2009), additional trade as part of
the common European market and increases in income in the new member states
(Rapacki, Próchniak, 2009).
Deregulation has also been a catalyst for the emergence of European Low Cost Carriers
(LCCs). During the early 1990s, European LCCs first entered the deregulated domestic
UK and Irish markets, successively followed by market entries throughout Europe after
full market deregulation (Francis et al., 2006; Budd et al., 2014; Fig. 11). Despite a 77 %
failure rate among the new carriers (Budd et al., 2014) and two major economic crises,
annual LCC traffic growth in the EU-27, Switzerland, Norway and Iceland averaged 18.8
% between 2000 and 2012. 23 This growth explains roughly 57.2 % [72.2 %] of European
aggregate destination-invariant GCI growth between 1990 [1995] and 2012 24 and
!!!!!!!!!!!!!!!!!!!!!!!!!!!!!!!!!!!!!!!!!!!!!!!!!!!!!!!!22 We note that Austria, Sweden and Finland became EU members in 1995. 23 Airlines have been classified as LCCs using information from Budd et al. (2014) and Dobruszkes (2006). 24 In line with our results, Dobruszkes (2013) reports that additional LCC flights explain approximately 70 % of the
increase in total number of flights in the EU from 1995 to 2012.

How Air Transport Connects the World 29
compensates the 18.8 % service reductions of the 20 largest European legacy carriers25
between 2000 and 2012 by a factor of 2. Consequently, LCCs gradually became
established market participants and accounted for 25.2 % of destination-invariant GCI at
airports in the EU-27, Switzerland, Norway and Iceland by 2012. The highest year-2012
destination-invariant LCC-connectivity was observed in the UK and Ireland (40.8 %
market share), the Mediterranean EU countries (29.3 % market share) and the German-
speaking countries (23.3 % market share) (Fig. 11). This spatial distribution supports
Dobruszkes (2006) and Dobruszkes (2013) who observe a concentration of European
LCC traffic in (North-)Western Europe and at (Mediterranean) tourist destinations. With
the EU enlargement in 2004 and 2007, the LCCs also built up a significant market
presence in Eastern Europe (Dobruszkes, 2009; Budd et al, 2014; Gabor, 2010). Due to
their significant size at the time of EU enlargement26, they could quickly enter new
markets, thereby increasing their destination-invariant GCI share in the new member
states from 2.0 % in 2003 to 14.2 % in 2006 (Fig. 11).
Fig. 11. Destination-invariant GCI generated by European Low Cost Carriers by origin airport location.
! !
!!!!!!!!!!!!!!!!!!!!!!!!!!!!!!!!!!!!!!!!!!!!!!!!!!!!!!!!25 Operations at airports in the EU-27, Norway, Iceland and Switzerland are considered only. 26 LCCs claimed roughly 10.1 % of the year-2003 destination-invariant GCI in the EU-15.

How Air Transport Connects the World 30
The observed growth of European LCCs during the early 2000s and the traffic decline of
European legacy carriers are responsible for the divergence of the destination-invariant
GCI from the network effects as depicted in Fig. 10 (a). This is because as compared to
legacy carriers, LCCs serve more remote (secondary) airports (Francis et al., 2006),
which have 13.2 % lower average destination weights than European airports served by
the 15 largest European legacy carriers.27 In turn, the LCC growth resulted in additional
connectivity at airports, which received little or no service by the legacy carriers
(Burghouwt, Hakfoort, 2001; Fan, 2006; Suau-Sanchez, Burghouwt, 2011).
4.1.3 Asia
The largest relative growth in nonstop connectivity scores among the world-regions was
observed at Asian airports where, driven to a large extent by network effects (56.1 % of
the Asian 1990-2012 nonstop GCI growth), nonstop GCI increased by 376.1 % from
1990 to 2012 (Fig. 12). In turn, 41.2 % of the global aggregate nonstop GCI increases
were recorded at Asian airports. The Asian development differs from the European and
North American as network effects are steadier. Network deteriorations are only observed
in two years, as compared to 11 years in North America and 6 years in Europe. In
particular, Asian air transportation was not significantly hit by the Gulf crisis in the
beginning of the 1990s (Rimmer, 2000; Fig. 12) and network deterioration first appeared
during the Asian crisis towards the end of the 1990s (Chin et al., 1999; Bowen, 2000,
Rimmer, 2000). Due to Asian carriers being relatively financially healthy (Lawton,
Solomko, 2005), carriers were able to quickly recover from the crisis, before the 9/11
attacks led to service reductions (2001-2002) and the SARS outbreak slowed network
growth (2003-2004) (Fig. 12; Lawton, Solomko, 2005). Fueled by increasing
liberalization of air transportation in Asian countries (Forsyth et al., 2006) and the
emergence of Asian Low Cost Carriers (Hooper, 2005; Lawton, Solomko, 2005),
network effects recovered, and, with the exception of a one-year slowdown in growth
during the world financial crises in 2009, high growth rates prevailed until 2012 (Fig. 12;
Dobruszkes, van Hamme, 2011). !!!!!!!!!!!!!!!!!!!!!!!!!!!!!!!!!!!!!!!!!!!!!!!!!!!!!!!!27 Average destination weights are calculated for destination airports located in the EU-27 states, Norway, Iceland
and Switzerland. The average is weighted by flight frequency.

How Air Transport Connects the World 31
Fig. 12. Nonstop connectivity development in Asia.
!!A geographical decomposition of the Asian 1990-2012 nonstop GCI growth reveals that
Chinese and Japanese airports accounted for more than half of the absolute Asian
increase in nonstop GCI.
• In 1990, Japanese airports explained 63.0 % [6.0 %] of Asian [global] nonstop GCI,
and could therefore be considered the dominant air transport market in Asia. From
1990 to 2012, the nonstop GCI in Japan increased by 170.9 % - almost twice as
much as the global average growth (89.7 %). Network effects caused 96.3 % of the
GCI increase at Japanese airports. This increase occurred in conjunction with
gradual deregulation of the Japanese air transport market during the 1990s, with full
deregulation of airfares happening in the early 2000s (Yamauchi, Ito, 1996;
Yamaguchi, 2007; Murakami, 2011).
• Connectivity generated at Chinese airports increased unprecedentedly in the years
1990-2012. While in 1990, only 1.6 % [0.2 %] of Asian [global] aggregate nonstop
GCI was accessible to passengers at Chinese airports28, the GCI score increased by
5856.9 % between 1990 and 2012 (Fig. 13). As a consequence, Chinese airports
accounted for 20.0 % [4.8 %] of the year-2012 Asian [global] aggregate nonstop
GCI. Network effects (1688.0 %), potentially driven by growing passenger demand !!!!!!!!!!!!!!!!!!!!!!!!!!!!!!!!!!!!!!!!!!!!!!!!!!!!!!!!28 Hongkong and Macau are not considered.

How Air Transport Connects the World 32
and by the transformation of the Chinese airline industry from an entity under
military control into a business (Zhang, 1998; Zhang, Round, 2008; Shaw et al.,
2009; Wang et al., 2011), were a significant source of this increase. Furthermore,
network improvements in China coincided with significant destination quality
growth, so that rising simultaneity effects were observed (Fig. 13). These effects
indicate that services to locations, which have substantially grown in destination
quality since 1990, have significantly increased. Given the high growth rates of the
Chinese economy, the simultaneity effects can, in turn, be interpreted as an
indication of considerable service growth in the Chinese domestic market.
Fig. 13. Nonstop connectivity development in China.
!
Fig. 14. GCI concentration rates in Asia.
!

How Air Transport Connects the World 33
Compared to 1990, when Asian nonstop GCI was concentrated at Japanese airports,
nonstop GCI scores dispersed over time and the concentration rates of nonstop GCI
among Asian airports declined (Fig. 14). While connectivity growth has occurred at
existing airports, we also observe a 63.1 % increase in the number of airports, which
receive regular scheduled air services29 between 1990 and 2012 (Tab. 5). This increase in
the number of airports with regular service can be assumed to have been facilitated
through demand growth for air travel in Asia. Furthermore, the growth coincides with
supply-side developments such as the emergence of Asian LCCs (Francis et al., 2006),
more liberal international air service agreements, that open up access to additional
airports for international routes and/or multiple carriers, (Hooper, 1997; Bowen, 2000;
Hooper, 2005; Lawton, Solomko, 2005; Forsyth et al., 2006) and the development of new
airport infrastructure (Yamaguchi, 2007).
Tab. 5. Airport count by airport size class in Asia.
Airport size [daily flights]
Number of airports
from to 1990 2000 2012 2 20 388 451 550 21 50 33 64 90 51 100 22 17 42 101 200 6 20 31 201 400 1 5 15 401 0 0 6 450 557 734
4.2 Onestop Connectivity and Onestop Centrality
4.2.1 The Connectivity Perspective
The results from Fig. 15 (a) suggest that the year-1990 onestop GCI was concentrated at
North American airports, which, indeed, accounted for 85.9 % of global onestop GCI,
whereas airports in Europe accounted for 8.7 % only (Fig. 17 (a)). The North American
dominance in the year-1990 onestop GCI is still observed if destination-weights are
factored out (North American share in global aggregate destination-invariant onestop
GCI 87.4 %) (Fig. 17 (b)). Thus, one may conclude that North American airports were
served through extensive hub and spoke networks already in 1990 (Berechman, de Wit, !!!!!!!!!!!!!!!!!!!!!!!!!!!!!!!!!!!!!!!!!!!!!!!!!!!!!!!!29 “Regular” is defined here as two or more departures per day on average

How Air Transport Connects the World 34
1996; Borenstein, 1992). In such networks, frequent flights to hub airports facilitate high-
frequent services to many onward destinations (Kanafani, Ghobrial, 1985; Alderighi et
al., 2007), thereby creating high onestop connectivity at each spoke airport. This effect is
especially high if (1) hub locations are chosen so as to attract passengers to the indirect
routings (Dempsey, 1991; O’Kelly, 1998) and (2) flight schedules at the hubs are
designed to avoid excessive waiting time during layovers (Kanafani, Ghobrial, 1985;
Burghouwt, de Wit, 2005). While US carriers designed their year-1990 networks in that
regard, European carriers operated centralized, but temporally rather uncoordinated
networks (Burghouwt, de Wit, 2005) so that European aggregate year-1990 onestop GCI
was relatively low.
Fig. 15. World map of global onestop connectivity scores.
(a) Year 1990
!(b) Year 2012
!! !

How Air Transport Connects the World 35
Fig. 16. Onestop connectivity development 1990-2012.
!!
Between 1990 and 2012, global onestop GCI grew by 175.8 % and thereby outperformed
growth in nonstop connectivity by a factor of roughly 3.5. The development can be
subdivided into two phases.
Phase 1: 1990-2000
From 1990 to 2000, network effects explained 94.4 % of the 115.2 % global onestop GCI
growth (Fig. 16). The increase in network effects coincided with expanding cooperation
among carriers. In particular, carriers started offering their customers “seamless” global
network coverage by selling tickets of onward flights, which are operated by partnering
airlines, but carry the ticketing carrier’s code (“codeshares”) (Chan, 2000; Gudmundsson,
Rhoades, 2001; Fan et al., 2001). Such collaborations first emerged during the late 1980s
and their number grew significantly during the 1990s (Oum, Park, 1997; Chan, 2000;
Gudmundsson, Rhoades, 2001). The foundation of global airline alliances such as Star
Alliance (1997), Qualiflyer (1998),30 oneworld (1999) and SkyTeam (2000) marked the
peak of that trend. An estimate of the significance of cooperation in creating onestop
connectivity can be obtained by computing the codeshare-induced onestop GCI31. The
results underline the significance of inter-airline cooperation for the growth of global
onestop GCI during the 1990s (Tab. 6).
!!!!!!!!!!!!!!!!!!!!!!!!!!!!!!!!!!!!!!!!!!!!!!!!!!!!!!!!30 Qualiflyer was disintegrated in 2001. 31 The codeshare-induced onestop GCI is the difference between the onestop GCI and a onestop GCI metric, which
allows for intra-airline transfers only (if applicable for the airline).

How Air Transport Connects the World 36
Fig. 17. Onestop connectivity distribution by world region.
(a) Onestop GCI
!(b) Destination-invariant onestop GCI
! The largest absolute 1990-2000 increases in onestop GCI were observed at North
American airports (57.3 % of the absolute 1990-2000 onestop growth) and European
airports (25.6 % of the absolute 1990-2000 onestop growth) (Fig. 17 (a)). In particular,
the onestop GCI CAGR at European airports (15.9 %) outperformed the CAGR at North
American airports (5.9 %), so that European airports significantly caught up on their
North American counterparts in terms of onestop connectivity. Overall, the share of
European airports in global onestop GCI increased from 8.7 % in 1990 to 17.7 % in 2000
(Fig. 17 (a)). This growth coincides with the reorganization of European airline networks.
While North American airlines had already operated established hub-and-spoke networks
back in 1990, European legacy carriers significantly optimized their networks during the
1990s by further consolidating their (long-haul) operations at their hubs (Burghouwt,
Hakfoort, 2001; Burghouwt et al., 2003) and improving temporal coordination of their
schedules (Burghouwt, de Wit, 2005).

How Air Transport Connects the World 37
In total, airports in wealthy regions in Europe and North America received 82.9 % of the
1990-2000 onestop GCI growth. Thus, one may conclude that during the first phase of
hub-and-spoke network development, those networks predominantly enhanced links
among wealthy regions. In turn, the (destination-weighted) network effects outperformed
destination-invariant GCI growth between 1990 and 2000 (Fig. 16). Furthermore, this
result supports Bowen (2002) who finds higher air traffic connectivity improvements in
wealthy countries than at poor and peripheral locations during the late 1980s and early
1990s.
Tab. 6. Share and growth rate of codeshare-induced onestop GCI.
! Share of codeshare-induced onestop GCI CAGR of aggregate codeshare-induced onestop GCI 1993 1997 2000 2004 2008 2012 1993-1997 1997-2000 2000-2004 2004-2008 2008-2012 Africa 2.9% 18.7% 31.1% 32.8% 34.4% 34.8% 98.0% 41.8% 14.8% 15.3% 0.3% Australia & Oceania 10.6% 17.5% 46.6% 35.7% 38.7% 51.1% 58.8% 65.5% -4.4% 12.1% 10.6% Europe 1.3% 23.4% 34.2% 41.0% 48.3% 52.2% 156.3% 31.3% 11.1% 14.0% -1.5% North America 0.9% 9.6% 22.2% 38.6% 39.9% 45.8% 99.7% 42.3% 18.8% 3.2% -3.0% Central America, South America & Caribbean 1.1% 11.1% 28.9% 32.6% 32.4% 33.3% 112.8% 61.0% 11.7% 11.2% -0.9%
East Asia & Central Asia 0.8% 8.2% 25.4% 33.1% 41.1% 45.3% 117.3% 68.8% 17.1% 24.1% 6.0% South Asia & South-East Asia 0.3% 18.0% 32.3% 34.6% 36.7% 36.5% 249.5% 33.6% 17.3% 18.7% 3.1% West Asia 1.2% 13.9% 24.2% 30.1% 38.5% 37.6% 124.6% 42.7% 13.9% 26.6% 5.8% Global 1.0% 12.0% 25.3% 38.3% 41.2% 45.7% 110.9% 40.8% 16.1% 7.7% -1.3%
Phase 2: 2000-2012
Between 2000 and 2012, the network effects declined twice (13.8 % (2001-2002); 11.0 %
(2007-2010)), but subsequent recoveries led to an almost constant level in 2012 as
compared to 2000. While economic crises following the 9/11 attacks and the collapse of
the US subprime market explain short-term variations (Section 4.1), significant spatial
heterogeneities in the development patterns exist (Fig. 17).
• At North American airports, a 21.1 % [15.0 %] decline in the onestop network effects
[destination-invariant GCI] was observed between 2000 and 2012 (Fig. 17 (b)). This
is because the legacy carriers, which operate hub-and-spoke networks (Franke, 2004;
Dempsey, 2002), reduced their services, whereas the LCCs, which offer fewer
indirect connections (Franke, 2004; Gillen, Lall, 2004), grew (Section 4.1.1). We also
find that the absolute growth in codeshare-induced GCI offset 88.6 % of the decline

How Air Transport Connects the World 38
in onestop intra-airline-transfer GCI, and that the codeshare-induced GCI share
increased from 22.2 % in 2000 to 45.8 % in 2012 (Tab. 6). Thus, one may conclude
that North American carriers were able to stabilize aggregate onestop connectivity in
times of “capacity rationalization” and “capacity discipline” by partially substituting
intra-airline-transfer offerings with inter-airline-transfer offerings through codeshares.
• At European airports, growth of onestop connectivity slowed as compared to 1990-
2000. In particular, the network effect CAGR fell from 16.7 % (1990-2000) to 1.1 %
(2000-2012). At EU-15 airports, EU legacy carriers significantly reduced their
services (Section 4.1.2). The resulting ceteris-paribus decrease in onestop
connectivity, however, was offset by growth of codeshare-induced GCI so that the
share of codeshare-induced GCI rose from 2000 to 2012 (Tab. 6). We note that at
airports in the new EU member states, onestop GCI grew by 89.3 % from 2000 to
2012 and almost all of this growth (96.3 %) was observed in the aftermath of the EU
enlargement.
• The largest 2000-2012 GCI growth was observed in Asia and Africa, which
accounted for 53.3 % of the 2000-2012 global onestop GCI increase (Fig. 17).
Network effects (CAGR between 5.5 % (Africa) and 8.2 % (South & Southeast
Asia)) were significant contributors to this trend, explaining between 57.7 % (Africa)
and 65.6 % (East & Central Asia) of the 2000-2012 onestop GCI increase in the
respective region.
Overall, the onestop connectivity trends resulted in a spatial deconcentration of global
onestop connectivity (Fig. 15 (b)). In particular, the share of onestop GCI at North
American airports dropped from 85.9 % in 1990 to 53.5 % in 2012, whereas the onestop
GCI share of European airports increased from 8.7 % in 1990 to 17.7 % [21.9 %] in 2000
[2012] and the Asian onestop connectivity share rose from 5.7 % [2.8 %] to 14.9 %
between 2000 [1990] and 2012. Thus, a shift of onestop connectivity growth from
prosperous western countries (1990-2000) into emerging markets (2000-2012) was

How Air Transport Connects the World 39
observed and caused the destination-invariant GCI to catch-up on the (destination-
weighted) network effects during the 2000s (Fig. 17).
In terms of the world’s poorest countries32, we find that while they had a less than
proportionate share in onestop GCI growth between 1990-2000 (onestop GCI CAGR of
these countries 6.1%, global average: 8.0%), onestop GCI growth from 2000-2012
outperforms the global average (CAGR 15.0% vs. 2.1%). This might indicate that the
“marginalization” of poor countries within airline networks described by Bowen (2002),
has ended – at least in terms of onestop connectivity.
4.2.2 The Centrality Perspective
We now turn to the centrality perspective, i.e. the contribution of transfer airports to the
generation of connectivity. In 1990, 87.4 % of global onestop connectivity was facilitated
through hub operations at North American airports (Fig. 18 (a)), which can be explained
by coordinated hub-and-spoke networks already being available to passengers in North!America, whereas hub-and-spoke networks were less extensive in other parts of the world
(Section 4.2). Furthermore, the GHCI was concentrated at the Top-5 [10] hub airports,
which accounted for 38.7 % [56.5 %] of the global GHCI score (Fig. 18). The most
important hubs outside North America were Frankfurt and London Heathrow, which
together explained roughly one third of the aggregate non-North American GHCI, but
only achieved 33.1 % and 22.4 % of the average GHCI score at Top-5 North American
hubs, respectively.
!!!!!!!!!!!!!!!!!!!!!!!!!!!!!!!!!!!!!!!!!!!!!!!!!!!!!!!!32 We consider the 34 countries with the lowest per-capita income as defined by the World Bank (2014b).

How Air Transport Connects the World 40
Fig. 18. World map of Top-150 Hubs.
(a) Year 1990.
!
(b) Year 2012.
!
Between 1990 and 2000, 93.6 % of the GHCI growth occurred at airports in North
America and Europe. In particular, the strong centrality growth of European airports
caused the centrality share of European airports [North American airports] to increase
[decrease] from 10.0 % [87.4 %] in 1990 to 20.1 % [75.3 %] in 2000. Since European
legacy carriers drove this trend by improving temporal schedule coordination in their
centralized networks (Burghouwt, Hakfoort, 2001; Burghouwt, de Wit, 2005), the five
most central European hubs in 1990 received the largest absolute growth in centrality
(68.4 % of the 1990-2000 GHCI growth at European airports). In turn, European hubs
significantly caught up to their American counterparts in terms of centrality so that the
global centrality concentration rate of the 5 [10] largest global hubs fell from 38.7 %
[56.5 %] in 1990 to 28.9 % [45.9 %] in 2000 (Fig. 19).

How Air Transport Connects the World 41
Fig. 19. Concentration rates of global hub centrality.
!!After 2000, the growth of hub centrality scores remained strong at European airports
(50.5 % of global 2000-2012 growth) and accelerated at Asian airports (43.1 % of global
2000-2012 growth), whereas the centrality score remained almost constant in North
America.
• In Europe, the three largest hubs, Frankfurt, London Heathrow and Paris CDG,
accounted for 64.9 % of the 2000-2012 GHCI growth and in 2012, explained 51.4 %
of the European year-2012 GHCI (Fig. 18 (b)). In addition, the extension of
Lufthansa’s second hub at Munich airport (Albers et al., 2005) caused an 11.6 %
increase in European GHCI and led to Munich Airport becoming the fifth most
central European airport.
• In Asia, hub centrality more than quintupled between 2000 and 2012. The largest
growth was observed at Chinese airports (34.5 % of Asian GHCI growth), Japanese
and South Korean airports (18.7 % of Asian GHCI growth), airports in the United
Arab Emirates and Qatar (14.7 % of Asian GHCI growth) and Turkish airports (8.6 %
of Asian GHCI growth). The growth contribution of airports in the United Arab
Emirates and Qatar is particularly noteworthy, since it is driven by the market entry
and expansion of Middle East Carriers (Qatar, Etihad, Emirates), which use the
geographical position of their home airports to connect world-regions with one-
transfer hub-and-spoke networks (Vespermann et al., 2008; O’Connell, 2011). As a
consequence, we find their home airports (Doha, Abu Dhabi, Dubai) to develop from
regional hubs for Africa, Western Asia and South Asia & Southeast Asia to hubs for

How Air Transport Connects the World 42
journeys into all world regions (Tab. 7). In particular, we observe significant year-
2012 centrality of the three hubs under consideration in South Asia & Southeast Asia,
West Asia, Africa and Australia & Oceania. This results from the Middle East
carriers’ network structures, which were particularly focused on these regions
(Vespermann et al., 2008; Hooper et al., 2011; Grimme, 2011). We note that the
relative centrality of the three hubs with regard to North America and Europe remains
low in 2012 (Tab. 7) due to limited frequencies to these regions from Middle Eastern
hubs, relatively long layovers and low destination weights for routes with reasonable
detour factors (e.g. South and Southeast Asia) (Grimme et al., 2011).
Tab. 7. Onestop connectivity ranking and onestop connectivity share facilitated through Dubai Airport, Doha Airport and Abu Dhabi Airport by world region of origin airport.
2000 2000 2012 2012
GHCI Destination-invariant GHCI Destination-
invariant Africa DXB 39 (0.1%) 35 (0.2%) 6 (5.6%) 7 (5.1%)
DOH 71 (0.0%) 57 (0.1%) 10 (2.3%) 10 (2.6%) AUH 78 (0.0%) 47 (0.1%) 26 (0.7%) 23 (0.8%)
Australia & Oceania DXB - - 8 (3.1%) 7 (3.4%) DOH - - 18 (0.7%) 24 (0.7%) AUH - - 16 (0.9%) 18 (0.9%)
Europe DXB 119 (0.0%) 89 (0.0%) 32 (0.4%) 24 (0.7%) DOH 206 (0.0%) 164 (0.0%) 44 (0.3%) 31 (0.6%) AUH 193 (0.0%) 154 (0.0%) 64 (0.1%) 48 (0.2%)
North America
DXB 372 (0.0%) 393 (0.0%) 89 (0.0%) 55 (0.1%) DOH - - 105 (0.0%) 71 (0.1%) AUH - - 141 (0.0%) 91 (0.0%)
Central America, South America & Caribbean
DXB - - 45 (0.2%) 45 (0.2%) DOH - - 51 (0.1%) 58 (0.1%) AUH - - - -
East Asia & Central Asia
DXB 116 (0.0%) 127 (0.0%) 53 (0.2%) 44 (0.5%) DOH - - 51 (0.2%) 47 (0.4%) AUH 134 (0.0%) 181 (0.0%) 81 (0.1%) 75 (0.1%)
South Asia & South-East Asia
DXB 18 (1.2%) 21 (0.9 %) 2 (7.6%) 3 (6.1%) DOH 36 (0.2%) 47 (0.3%) 8 (4.5%) 8 (4.3%) AUH 41 (0.1%) 48 (0.3%) 15 (1.9%) 22(1.4%)
Western Asia DXB 26 (0.5%) 18 (1.0%) 5 (4.3%) 5 (4.5%) DOH 28 (0.4%) 20 (0.9%) 4 (4.6%) 4 (5.5%) AUH 31 (0.3%) 24 (0.8%) 13 (2.2%) 15 (2.0%)
Onestop connectivity share through a transfer at the respective hub in the respective origin region given in parentheses. - No scheduled service.
How Air Transport Connects the World 43
• In North America, the concentration rate of the 10 largest hubs increased from 61.3 %
in 2000 to 67.7 % in 2012. This process was driven by restructuring of US legacy
carriers during the 2000s (Wittman, 2014), which, inter alia, led the carriers to
strengthen their main hubs, i.e. Atlanta (Delta), Charlotte (US Airways), Newark
(United) and Philadelphia (US Airways), and to de-hub secondary hubs such as
Dallas Fort Worth (Delta), St. Louis (TWA / American Airlines), Pittsburgh (US
Airways) and Cincinnati (Delta).
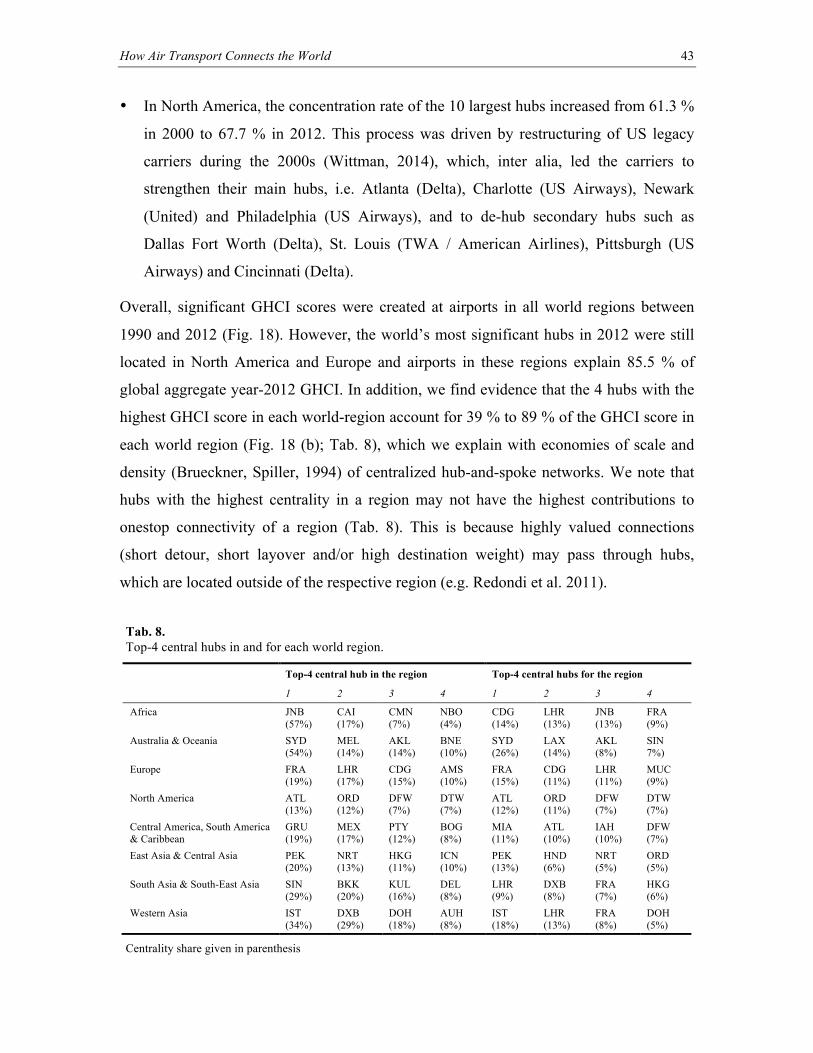
Overall, significant GHCI scores were created at airports in all world regions between
1990 and 2012 (Fig. 18). However, the world’s most significant hubs in 2012 were still
located in North America and Europe and airports in these regions explain 85.5 % of
global aggregate year-2012 GHCI. In addition, we find evidence that the 4 hubs with the
highest GHCI score in each world-region account for 39 % to 89 % of the GHCI score in
each world region (Fig. 18 (b); Tab. 8), which we explain with economies of scale and
density (Brueckner, Spiller, 1994) of centralized hub-and-spoke networks. We note that
hubs with the highest centrality in a region may not have the highest contributions to
onestop connectivity of a region (Tab. 8). This is because highly valued connections
(short detour, short layover and/or high destination weight) may pass through hubs,
which are located outside of the respective region (e.g. Redondi et al. 2011).
!Tab. 8. Top-4 central hubs in and for each world region.
Top-4 central hub in the region Top-4 central hubs for the region 1 2 3 4 1 2 3 4
Africa
JNB (57%)
CAI (17%)
CMN (7%)
NBO (4%)
CDG (14%)
LHR (13%)
JNB (13%)
FRA (9%)
Australia & Oceania
SYD (54%)
MEL (14%)
AKL (14%)
BNE (10%)
SYD (26%)
LAX (14%)
AKL (8%)
SIN 7%)
Europe
FRA (19%)
LHR (17%)
CDG (15%)
AMS (10%)
FRA (15%)
CDG (11%)
LHR (11%)
MUC (9%)
North America
ATL (13%)
ORD (12%)
DFW (7%)
DTW (7%)
ATL (12%)
ORD (11%)
DFW (7%)
DTW (7%)
Central America, South America & Caribbean
GRU (19%)
MEX (17%)
PTY (12%)
BOG (8%)
MIA (11%)
ATL (10%)
IAH (10%)
DFW (7%)
East Asia & Central Asia
PEK (20%)
NRT (13%)
HKG (11%)
ICN (10%)
PEK (13%)
HND (6%)
NRT (5%)
ORD (5%)
South Asia & South-East Asia
SIN (29%)
BKK (20%)
KUL (16%)
DEL (8%)
LHR (9%)
DXB (8%)
FRA (7%)
HKG (6%)
Western Asia
IST (34%)
DXB (29%)
DOH (18%)
AUH (8%)
IST (18%)
LHR (13%)
FRA (8%)
DOH (5%)
Centrality share given in parenthesis

How Air Transport Connects the World 44
5 Conclusion
In this paper, we have proposed a new connectivity and centrality model that sets out to
assess the quantity and quality of nonstop and onestop air transport services from the
perspective of (potential) passengers. By computing the metric for 1990 to 2012, we have
analyzed both the geography of, and trends in global air services. In turn, this paper is the
first to describe the effects of airline deregulation, airline network structures, cooperation
among airlines, market entry of Low Cost Carriers and Middle East carriers and
economic crises on connectivity in a consistent framework. Since the societal value of air
transportation depends on its quality in bridging distances quickly, we regard the
connectivity perspective as particularly insightful.
The contribution of this paper is threefold. First, it extends existing connectivity models
as summarized by Burghouwt and Redondi (2013). In particular, our approach builds on
the “connection quality-weighting” model (Veldhuis, 1997; Burghouwt, de Wit, 2005;
Burghouwt, Veldhuis, 2006) rather than shortest- or quickest-path models (e.g. Malighetti
et al., 2008; Paleari et al., 2010; Zhang et al., 2010), which allows us to compute
connection quality as perceived by passengers at each airport. While the assessment of
connection quality previously relied on assumptions about maximum detour, our
approach estimates these patterns empirically. In line with the accessibility approach
(Geurs, van Wee, 2004; Paez et al., 2012), we further extend the connection quality
assessment by considering the economic interaction potential to which each destination
airport provides access.
Second, this paper is the first to use a connectivity model for describing the impacts of
global 1990-2012 aviation market developments on connectivity. While analyses of
network structures and performance (Burghouwt, Hakfoort, 2001; Bowen, 2002;
Reynolds-Feighan, 2007; Paleari et al., 2010; Wang et al., 2011; Lin, 2012) as well as
market developments following airline deregulation (Borenstein, 1992; Dempsey, 2002;
Goetz, Sutton, 1997; Chan, 2000), the emergence of new airline business models
(Dobruszkes, 2006, 2009, 2013; Fan, 2006; Francis et al., 2006; Hooper et al., 2011;
Budd et al., 2014;) and economic crises (Rimmer, 2000; Alderighi, Cento, 2004;
Wittman, 2014) have been conducted, a consistent framework for global supply-side

How Air Transport Connects the World 45
market analyses from the connectivity perspective has not been applied, to date. As
shown by Suau-Sanchez and Burghouwt (2012), the development of such an approach is
particularly important given the increasing significance of indirect connections, which
require network analyses to simultaneously model network geography and temporal
schedule coordination.
Third, the application of our connectivity metric can advance air transport-related
research. The methodology proposed for connection quality weighting might be used to
study, for example, competition among hub airports or among different routings (Hansen,
1990; Redondi et al., 2011). In line with Grubesic and Matisziw (2011), Grubesic and
Wei (2012) and Matisziw et al. (2012), one might also apply the connectivity model to
evaluate the effectiveness and efficiency of the US Essential Air Service Program or the
European Public Service Obligations. It could also be used to assess the impact of airport
incentive schemes (Malina et al., 2012; Allroggen et al., 2013) from a societal
perspective. Furthermore, analyses of the economic growth and employment effects of
aviation (e.g. Brueckner, 2003; Percoco, 2010; Allroggen, Malina, 2014) would benefit
from incorporating a connectivity metric, since the metric reflects the degree of access to
other regions facilitated through air transport services.
We close by noting that future extensions of the connectivity model could deal with
transaction-specific heterogeneities such as airfares, airline service levels and passenger
preferences, as they impact on individually perceived connectivity. In order to do so, one
would need to empirically analyze the trade-off between these heterogeneities and the
degree of connectedness, as well as to develop an approach for the aggregation of
individual preferences. In addition, future work could be directed towards identifying
causal drivers of connectivity to complement our descriptive analysis. This would entail
the development of suitable empirical identification strategies for these drivers.

How Air Transport Connects the World 46
Acknowledgement
Florian Allroggen gratefully acknowledges funding from the German Research
Foundation under grant no.: AL 1814/1-1. Michael Wittman thanks the members of the
MIT Airline Industry Consortium for financial support and helpful comments throughout
the development of this paper.
APPENDIX
Appendix A: Decomposition of GCI Growth
The growth rate !!,!,!!! of the GCI score for an airport ! between base-year ! − ! and
year ! is calculated as outlined in eq. (A-1):
!!,!,!!! =!"!!,! − !"!!,!!!
!"!!,!!!=
!!,!!!,!!!!,! − !!,!!!!!,!!!!!!,!!!!∈ ℛ!,!∪ℛ!,!!!!"!!,!!!
(A-1)
For routings !, which are operated in year ! or year ! − ! only, we assume eqs. (A-2).
!!,! = 0!!∀!! ∈ ℛ!,!!! !\ℛ!,!! (A-2a)
!!,!!! = 0!!∀!! ∈ ℛ!,!!\ℛ!,!!! ! (A-2b)
For each route !, we now derive the absolute change of its GCI-contribution Δ!"!!,!,!,!!!
as shown in eq. (A-3).
Δ!"!!,!,!,!!! = !!,!!!,!!!!,! − !!,!!!!!,!!!!!!,!!! (A-3)
Furthermore, we rewrite !!,! , !!,! and !!!,! as outlined in eqs. (A-4).
!!,! = !!,!!! + Δ!!,!,!!! ! (A-4a)
!!,! = !!,!!! + Δ!!,!,!!! (A-4b)
!!!,! = !!!,!!! + Δ!!!,!,!!! (A-4c)
where Δ!!,!,!!! , Δ!!,!,!!! and Δ!!!,!,!!! are the absolute changes of ! , ! and !
respectively between base-year ! − ! and year !. Substitution of eqs. (A-4) into eq. (A-3)
yields eq. (A-5).
Δ!"!!,!,!,!!! = !!!,!!! !!,!!!Δ!!,!,!!! + !!,!!!Δ!!,!,!!! + Δ!!,!!!Δ!!,!,!!! "+!!!,!!!!!,!!!Δ!!!,!,!!! "
(A-5)

How Air Transport Connects the World 47
+Δ!!!,!!! !!,!!!Δ!!,!,!!! + !!,!!!Δ!!,!,!!! + Δ!!,!!!Δ!!,!,!!!
In eq. (A-5), we identify the destination-quality-neutral absolute growth !!,!,!!! of route
!’s GCI contribution which is caused by a ceteris paribus variation of the network
between base-year ! − ! and year !. It is shown in eq. (A-6).
!!,!,!!! = !!,!!!Δ!!,!,!!! + !!,!!!Δ!!,!,!!! + Δ!!,!!!Δ!!,!,!!! (A-6)
Eq. (A-5) is now rewritten as presented in eq. (A-7).
Δ!"!!,!,!,!!! = !!!,!!!!!,!,!!!+!!!,!!!!!,!!!Δ!!!,!,!!! + Δ!!!,!!!!!,!,!!! (A-7)
From eqs. (A-7) and (A-1), we derive eq. (A-8).
!!,!,!!! =!!!,!−!!!,!,!−!!∈ ℛ!,!∪ℛ!,!−!
!"!!,!−!!!+ !
!!,!!!!!,!!!!!!!,!,!!!!∈ ℛ!,!∪ℛ!,!!!!"!!,!!!
+!!!!,!!!!!,!,!!!!∈ ℛ!,!∪ℛ!,!!!
!"!!,!!!
(A-8)
GCI-growth rates are subsequently decomposed as follows:
1. Network effects
Network-related GCI effects result from ceteris paribus changes of the network.
!!,!,!!! =!!!,!!!!!,!,!!!!∈ ℛ!,!∪ℛ!,!!!
!"!!,!!! maps the network-related GCI growth rate
!!,!,!!! at airport ! between base-year ! − ! and year !. For our analysis, we
compute !!,!,!""# from the difference of year !’s GCI scores with constant year-
1990-destination quality weights33 and the year-1990 scores divided by the year-
1990 scores.
2. Destination-quality effects
Destination quality-related GCI effects result from ceteris paribus changes of
destination quality. !!,!,!!! =!!,!!!!!,!!!!!!!,!,!!!!∈ ℛ!,!∪ℛ!,!!!!"!!,!!!
represents the
destination quality-related GCI growth rate !!,!,!!! at airport ! between year
! − ! and year !. In our analysis, we calculate !!,!,!""# from the difference of the
!!!!!!!!!!!!!!!!!!!!!!!!!!!!!!!!!!!!!!!!!!!!!!!!!!!!!!!!33 For each year !, this score is computed by assuming the network of year ! and the destination quality weights for
year 1990. Computation is conducted by airport.

How Air Transport Connects the World 48
constant year-1990-network GCI scores for year !34 and the year-1990 GCI scores
divided by the year-1990 GCI scores.
3. Simultaneity effects
Simultaneity effects are the additional GCI effects of simultaneous variation of
the network and destination quality. The interaction-related GCI growth rate for
airport ! , base-year ! − ! and year ! is defined by
!!,!,!!! =!!!!,!!!!!,!,!!!!∈ ℛ!,!∪ℛ!,!!!
!"!!,!!!. According to eq. (A-8), we calculate
!!,!,!""# = !!,!,1990 − !!,!,!""# − !!,!,!""#.
!!!!
Appendix B: Definition of World Regions
The world regions are defined in Fig. B-1. Fig. B-1. Map of world regions.
!!!!
!!!!!!!!!!!!!!!!!!!!!!!!!!!!!!!!!!!!!!!!!!!!!!!!!!!!!!!!34 For each year !, this score is computed by assuming the year-1990 network and the destination quality weights for
year !. Computation is conducted by airport.

How Air Transport Connects the World 49
References
Abrantes, P.A.L., Wardman, M.R., 2011. Meta-analysis of UK values of travel time: an update. Transportation Research Part A 45, 1-17.
Airbus, 2013. Global market forecast. Future journeys, 2013-2032.
Airbus, 2014. Global market forecast. Flying on demand, 2014-2033. Albers, S., Koch, B., Ruff, C., 2005. Strategic alliances between airlines and airports:
theoretical assessment and practical evidence. Journal of Air Transport Management 11, 49-58.
Alderighi, M., Cento, A., 2004. European airlines conduct after September 11. Journal of Air Transport Management 10, 97-107.
Alderighi, M., Cento, A., Nijkamp, P., Rietveld, R., 2007. Assessment of new hub-and-spoke and point-to-point airline network configurations. Transport Reviews 27, 529-549.
Allroggen, F., Malina, R., Lenz, A.K., 2013. Which factors impact on the presence of incentives for route and traffic development? Econometric evidence from European airports. Transportation Research Part E 60, 49-61.
Allroggen, F., Malina, R., 2014. Do the regional growth effects of air transport differ among airports? Journal of Air Transport Management 37, 1-4.
Başar, G., Bhat, C., 2004. A parameterized consideration set model for airport choice: an application to the San Francisco Bay Area. Transportation Research Part B 38, 889-904.
Bel, G., Fageda, X., 2010. Privatization, regulation and airport pricing: an empirical analysis for Europe. Journal of Regulatory Economics 37, 142-161.
Berechman, J., de Wit, J., 1996. An analysis of the effects of European aviation deregulation on an airline’s network structure and choice of primary West European hub airport. Journal of Transport Economics & Policy 30, 251-274.
Borenstein, S., 1992. The evolution of U.S. airline competition. Journal of Economic Perspectives 6, 45-73.
Bowen, J., 2000. Airline hubs in Southeast Asia: national economic development and nodal accessibility. Journal of Transport Geography 8, 25-41.
Bowen, J., 2002. Network change, deregulation and access in the global airline industry. Economic Geography 78, 425-439.
Breinlich, H. (2006): The spatial income structure in the European Union: what role for Economic Geography? Journal of Economic Geography 6, 593-617.
Brueckner, J.K., Spiller, P.T., 1994. Economies of traffic density in the deregulated airline industry. Journal of Law and Economics 37, 379-415.
Brueckner, J.K., 2003. Airline traffic and urban economic development. Urban Studies 40, 1455-1469.

How Air Transport Connects the World 50
Budd , L., Francis, G., Humphreys, I., Ison, S., 2014. Grounded: characterizing the market exit of European low cost airlines. Journal of Air Transport Management 34, 75-85.
Burghouwt, G., Hakfoort, J., 2001. The evolution of the European aviation network, 1990-1998. Journal of Air Transport Management 7, 311-318.
Burghouwt, G., Hakfoort, J., van Eck, J.R., 2003. The spatial configuration of airline networks in Europe. Journal of Air Transport Management 9, 309-323.
Burghouwt, G., de Wit, J., 2005. Temporal configurations of European airline networks. Journal of Air Transport Management 11, 185-198.
Burghouwt, G., Veldhuis, J., 2006. The competitive position of hub airports in the transatlantic market. Journal of Air Transportation 11, 106-130.
Burghouwt, G., Redondi, R., 2013. Connectivity in air transport networks. An assessment of models and applications. Journal of Transport Economics & Policy 47, 35-53.
Chan, D., 2000. The development of the airline industry from 1978 to 1998. A strategic global overview. The Journal of Management Development 19, 489-514.
Chin, A., Hooper, P., Oum, T.H., 1999. The impacts of the Asian economic crisis on Asian airlines: short-run responses and long-run effects. Journal of Air Transport Management 5, 87-96.
Coldren, G.M., Koppelmann, F.S., 2005. Modeling the competition among air-travel itinerary shares: GEV model development. Transportation Research Part A 39, 345-365.
CRA, 2004. Air Passengers from the bay area’s airports, 2001 and 2002. Volume 1: Overview and Methods. Final Report prepared for the Metropolitan Transportation Commission.
De Luca, S., 2012. Modelling airport choice behaviour for direct flights, connecting flights and different travel plans. Journal of Transport Geography 22, 148-163.
Dempsey, P.S., 1991. The disintegration of the U.S. airline industry. Transportation Law Journal 20, 9-46.
Dempsey, P.S., 2002. Predation, competition & antitrust law: turbulence in the airline industry. Journal of Air Law and Commerce 67, 685-840.
Dempsey, P.S., 2008. The financial performance of the airline industry post-deregulation. Houston Law Review 45, 421-485.
Dobruszkes, F., 2006. An analysis of European low-cost airlines and their networks. Journal of Transport Geography 14, 249-264.
Dobruszkes, F., 2009. New Europe, new low-cost air services. Journal of Transport Geography 17, 423-432.
Dobruszkes, F., 2013. The geography of European low-cost airline networks: a contemporary analysis. Journal of Transport Geography 28, 75-88.

How Air Transport Connects the World 51
Dobruszkes, F., van Hamme, G., 2011. The impact of the current economic crisis on the geography of air traffic volumes: an empirical analysis. Journal of Transport Geography 19, 1387-1398.
Emrich, R.M., de Harris, F.H., 2008. Share shift and airport substitution in origin-destination markets with low-cost entrants. International Journal of Revenue Management 2, 109-122.
Fan, T., Vigeant-Langlois, L., Geissler, C., Bosler, B., Wilmking, J., 2001. Evolution of global airline strategic alliance and consolidation in the twenty-first century. Journal of Air Transport Management 7, 349-360.
Fan, T., 2006. Improvements in intra-European inter-city flight connectivity: 1996-2004. Journal of Transport Geography 14, 273-286.
Forsyth, P., King, J., Rodolfo, C.L., 2006. Open Skies in ASEAN. Journal of Air Transport Management 12, 143-152.
Francis, G., Humphreys, I., Ison, S. Aicken, M., 2006. Where next for low cost airlines? A spatial and temporal comparative study. Journal of Transport Geography 14, 83-94.
Franke, M., 2004. Competition between network carriers and low-cost carriers. Retreat battle or breakthrough to a new level of efficiency? Journal of Air Transport Management 10, 15-21.
Gabor, D., 2010. Low-cost airlines in Europe: Network Structures After the Enlargement of the European Union. Geographica Pannonica 14, 49-58
Geurs, K.T., van Wee, B., 2004. Accessibility evaluation of land-use and transport strategies: review and research options. Journal of Transport Geography 12, 127-140.
Gillen, D., Lall, A., 2004. Competitive advantage of low-cost carriers: some implications for airports. Journal of Air Transport Management 10, 41-50.
Goetz, A.R., Sutton, C.J., 1997. The geography of deregulation in the US airline industry. Annals of the Association of American Geographers 87, 238-263.
Goetz, A.R., Vowles, T.M., 2009. The good, the bad and the ugly: 30 years of US airline deregulation. Journal Transport Geography 17, 251-263.
Gudmundsson, S.V., Rhoades, D.L., 2001. Airline alliance survival analysis: topology, strategy and duration. Transport Policy 8, 209-218.
Grimme, W., 2011. The growth of Arabian airlines from a German perspective. A study on the impact of new air services to Asia. Journal of Air Transport Management 17, 333-338.
Grubesic, T.H., Matisziw, T.C., 2011. A spatial analysis of air transport access and the essential air service program in the United States. Journal of Transport Geography 19, 93-105.
Grubesic, T.H., Wei, F., 2012. Evaluating the efficiency of the Essential Air Service program in the United States. Transportation Research Part A 46, 1562-1573.
Hansen, M., 1990. Airline competition in a hub-dominated environment: an application of noncooperative game theory. Transportation Research Part B 24, 27-43.

How Air Transport Connects the World 52
Harvey, G., 1987. Airport Choice in a multiple airport region. Transportation Research Part A 21, 439-449.
Hess, S., Polak, J.W., 2005. Mixed logit modelling of airport choice in multi-airport regions. Journal of Air Transport Management 11, 59-68.
Hess, S., Adler, T., Polak, J.W., 2007. Modelling airport and airline choice behaviour with the use of stated preference survey data. Transportation Research Part E 43, 221-233.
Hooper, P., 1997. Liberalizing competition in domestic airline markets in Asia. The problematic interface between domestic and international regulatory policies. Transportation Research Part E 33, 197-209.
Hooper, P., 2005. The environment for Southeast Asia’s new and evolving airlines. Journal of Air Transport Management 11, 335-347.
Hooper, P., Walker, S., Moore, C., Al Zubaidi, Z., 2011. The development of the Gulf region’s air transport networks. The first century. Journal of Air Transport Management 17, 325-332.
Hsiao, C.Y., Hansen, M., 2011. A passenger demand model for air transportation in a hub-and-spoke network. Transportation Research Part E 47, 1112-1125.
Hummels, D., 2007. Transportation costs and international trade in the second era of globalization. Journal of Economic Perspectives 21, 131-154.
Ishii, J., Sunyoung, S., van Dender, K., 2009. Air travel choices in multi-airport markets. Journal of Urban Economics 65, 216-227.
Kanafani, A., Ghobrial, A.A., 1985. Airline hubbing. Some implications for airport economics. Transportation Research Part A 1, 15-27.
Lakshmanan, T.R. (2011): The broader economic consequences of transport infrastructure investments. Journal of Transport Geography 19, 1-12.
Lawton, T.C., Solomko, S., 2005. When being the lowest cost is not enough: building a successful low-fare airline business model in Asia. Journal of Air Transport Management 11, 355-362.
Lieshout, R., 2012. Measuring the size of an airport’s catchment area. Journal of Transport Geography 25, 27-34.
Lin, J., 2012. Network analysis of China’s aviation system, statistical and spatial structure. Journal of Transport Geography 22, 109-117.
Maertens, S., 2010. Drivers of long-haul flight supply at secondary airports in Europe. Journal of Air Transport Management 16, 239-243.
Malina, R., Albers, S., Kroll, N. (2012):!Airport incentive programs, A European perspective. Transport Reviews 32, 435-453.
Malighetti, P., Paleari, S., Redondi, R., 2008. Connectivity of the European airport network: ‘Self-help hubbing’ and business implications. Journal of Air Transport Management 14, 53-65.
How Air Transport Connects the World 53
Marcucci, E., Gatta, V., 2011. Regional airport choice: consumer behaviour and policy implications. Journal of Transport Geography 19, 70-84.
Matisziw, T.C., Grubesic, T.H., 2010. Evaluating locational accessibility to the US air transportation system. Transportation Research Part A 44, 710-722.
Matisziw, T.C., Lee, C.L., Grubesic, T.H., 2012. An analysis of essential air service structure and performance. Journal of Air Transport Management 18, 5-11.
Murakami, H., 2011. Empirical analysis of inter-firm rivalry between Japanese full-service and low-cost carriers. Pacific Economic Review 16, 103-119.
Oak Ridge National Laboratory, 2014. LandScan Documentation. Available Online: http://web.ornl.gov/sci/landscan/landscan_documentation.shtml.
O’Connell, J.F., 2011. The rise of the Arabian Gulf carriers. An insight into the business model of Emirates Airlines. Journal of Air Transport Management 17, 339-346.
O’Kelly, M.E., 1998. A geographer’s analysis of hub-and-spoke networks. Journal of Transport Geography 6, 171-186.
Oum, T.H., Park, J.H., 1997. Airline alliances: current status, policy issues and future directions. Journal of Air Transport Management 3, 133-144.
Páez, A., Scott, D.M., Morency, C., 2012. Measuring accessibility: positive and normative implementations of various accessibility indicators. Journal of Transport Geography 25, 141-153.
Paleari, S., Redondi, R., Malighetti, P., 2010. A comparative study of airport connectivity in China, Europe and US: which network provides the best service to passengers? Transportation Research Part E 46, 198-210.
Park, J.H., 1997. The effects of airline alliances on markets and economic welfare. Transportation Research Part E 33, 181-195.
Pels, E., Nijkamp, P., Rietveld, P., 2001. Airport and airline choice in a multiple airport region: an empirical analysis for the San Francisco Bay Area. Regional Studies 35, 1-9.
Percoco, M., 2010. Airport activity and local development. Evidence from Italy. Urban Studies 47, 2427-2443.
Rapacki, R., Próchniak, M., 2009. The EU enlargement and economic growth in the CEE new member countries. Economic Papers 367. The European Commission, Brussels.
Redding, S., Venables, A.J., 2004. Economic geography and international inequality. Journal of International Economics 62, 53-82.
Redding, S.J., 2010. The empirics of New Economic Geography. Journal of Regional Science 50, 297-311.
Redondi, R., Malighetti, P., Paleari, S., 2011. Hub competition and travel times in the world-wide airport network. Journal of Transport Geography 19, 1260-1271.

How Air Transport Connects the World 54
Reynolds-Feighan, A., McLay, P., 2006. Accessibility and attractiveness of European airports: a simple small community perspective. Journal of Air Transport Management 12, 313-323.
Reynolds-Feighan, A.J., 2007. Competing networks, spatial and industrial concentration in the US airline industry. Spatial Economic Analysis 2, 237-257.
Rimmer, P.J., 2000. Effects of the Asian crisis on the geography of Southeast Asia’s air traffic. Journal of Transport Geography 8, 83-97.
Shaw, S.L., Ivy, R.J., 1994. Airline mergers and their effects on network structure. Journal of Transport Geography 2, 234-246.
Shaw, S.L., Lu, F., Chen, J., Zhou, C., 2009. China’s airline consolidation and its effects on domestic airline networks and competition. Journal of Transport Geography 17, 293-305.
Suau-Sanchez, P., Burghouwt, G., 2011. The geography of the Spanish airport system: spatial concentration and deconcentration patterns in seat capacity distribution, 2001-2008. Journal of Transport Geography 19, 244-254.
Suau-Sanchez, P., Burghouwt, G., 2012. Connectivity levels and the competitive position of Spanish airports and Iberia’s network rationalization strategy, 2001-2007. Journal of Air Transport Management 18, 47-53.
Veldhuis, J.,1997. The competitive position of airline networks. Journal of Air Transport Management 3, 181-188.
Vespermann, J., Wald, A., Gleich, R., 2008. Aviation growth in the Middle East. Impacts on incumbent players and potential strategic reactions. Journal of Transport Geography 16, 388-394.
Wang, J., Mo, H., Wang, F., Jin, F., 2011. Exploring the network structure and nodal centrality of China’s air transport network: a complex network approach. Journal of Transport Geography 19, 712-721.
Wardman, M., 2004. Public transport values of time. Transport Policy 11, 363-377. Wilken, D., Berster, P., Gelhausen, M., 2007. Airport choice in Germany: new empirical
evidence of the 2003 German air traveller survey. Journal of Airport Management 1, 165-179.
Wittman, M.D., 2014. The effects of capacity discipline on smaller U.S. airports: trends in service, connectivity and fares. MIT MS Thesis, Cambridge.
Wittman, M.D., Swelbar, W.S., 2014. Capacity discipline and the consolidation of airport connectivity in the United States. Transportation Research Record: Journal of the Transportation Research Board 2449, 72-78.
World Bank, 2014a. World Development Indicators 2014. Washington, DC. doi: 10.1596/978- 1-4648-0163-1.
World Bank, 2014b. World Bank Analytical Classifications. Available online: http://siteresources.worldbank.org/DATASTATISTICS/Resources/OGHIST.xls

How Air Transport Connects the World 55
Yamauchi, H., Ito, T. 1996. Air transport policy in Japan. Working Paper No. 124, Center on Japanese Economy and Business, Columbia Business School.
Yamaguchi, K., 2007. Inter-regional air transport accessibility and macro-economic performance in Japan. Transportation Research Part E 43, 247-258.
Zanin, M., Lillo, F., 2013. Modelling the air transport with complex networks. A short review. The European Physics Journal - Special Topics 215, 5-21.
Zhang, A., 1998. Industrial reform and air transport development in China. Journal of Air Transport Management 4, 155-164.
Zhang, Y., Round, D.K., 2008. China’s airline deregulation since 1997 and the driving forces behind the 2002 airline consolidations. Journal of Air Transport Management 14, 130-142.
Zhang, J., Cao, X.B., Du, W.B., Cai, K.Q., 2010. Evolution of Chinese airport network. Physica A 389, 3922-3931.