Embed Size (px)
Citation preview
HOW ACQUISITIONS AFFECT FIRM BEHAVIOR ANDPERFORMANCE: EVIDENCE FROM THE DIALYSIS
INDUSTRY∗
PAUL J. ELIASON
BENJAMIN HEEBSH
RYAN C. MCDEVITT
JAMES W. ROBERTS
Many industries have become increasingly concentrated through mergers andacquisitions, which in health care may have important consequences for spendingand outcomes. Using a rich panel of Medicare claims data for nearly one milliondialysis patients, we advance the literature on the effects of mergers and acquisi-tions by studying the precise ways providers change their behavior following anacquisition. We base our empirical analysis on more than 1,200 acquisitions ofindependent dialysis facilities by large chains over a 12-year period and find thatchains transfer several prominent strategies to the facilities they acquire. Mostnotably, acquired facilities converge to the behavior of their new parent compa-nies by increasing patients’ doses of highly reimbursed drugs, replacing high-skillnurses with less-skilled technicians, and waitlisting fewer patients for kidneytransplants. We then show that patients fare worse as a result of these changes:outcomes such as hospitalizations and mortality deteriorate, with our long panelallowing us to identify these effects from within-facility or within-patient variationaround the acquisitions. Because overall Medicare spending increases at acquiredfacilities, mostly as a result of higher drug reimbursements, this decline in qualitycorresponds to a decline in value for payers. We conclude the article by consideringthe channels through which acquisitions produce such large changes in providerbehavior and outcomes, finding that increased market power cannot explain thedecline in quality. Rather, the adoption of the acquiring firm’s strategies and prac-tices drives our main results, with greater economies of scale for drug purchasingresponsible for more than half of the change in profits following an acquisition.JEL Codes: D43, I11, L10.
∗We thank Virginia Wang for valuable guidance on obtaining and workingwith the USRDS data. We thank Ben Handel, Jonathan Kolstad, Gabriel Na-tividad, David Ridley, and numerous seminar participants for useful feedback. Wegratefully acknowledge research support provided by the Social Sciences ResearchInstitute and the National Science Foundation (SES 1850736 and 1851615). Wethank Alexander Marsh, Gabor Palinko, Lily Liu, Zilan Yang, Sungwoo Cho, andHanmeng Wang for research assistance. The data reported here have been sup-plied by the United States Renal Data System (USRDS). The interpretation andreporting of these data are the responsibility of the authors and in no way shouldbe seen as an official policy or interpretation of the U.S. government.
C© The Author(s) 2019. Published by Oxford University Press on behalf of Presidentand Fellows of Harvard College. All rights reserved. For Permissions, please email:[email protected] Quarterly Journal of Economics (2020), 221–267. doi:10.1093/qje/qjz034.Advance Access publication on November 19, 2019.
221
Dow
nloaded from https://academ
ic.oup.com/qje/article-abstract/135/1/221/5607794 by Brigham
Young University user on 03 August 2020
222 THE QUARTERLY JOURNAL OF ECONOMICS
I. INTRODUCTION
Health care markets have become increasingly concentratedthrough mergers and acquisitions (Gaynor, Ho, and Town 2015).Proponents of this industry trend cite several potential bene-fits of consolidation, including lower costs through economies ofscale and better patient outcomes through coordinated care. Butgreater concentration may also result in higher prices or lowerquality (Cuellar and Gertler 2006; Dafny, Duggan, and Rama-narayanan 2012; Gaynor and Town 2012). Previous studies of thistopic typically consider only broad notions of market structureand outcomes—by showing, for instance, that more-concentratedhospital markets have higher mortality rates. Comparatively lesswork has examined the precise channels through which merg-ers and acquisitions ultimately lead to changes in outcomes. Inthis article, we use detailed claims and facility data from the U.S.dialysis industry to show directly how large chains transfer theircorporate strategies to the independent facilities they acquire andleverage their greater economies of scale, seen most prominentlyin larger drug doses, which substantially affect the cost and qual-ity of care they provide.
We focus our study on the U.S. market for outpatientdialysis—a medical procedure that cleans the blood of patientssuffering from end-stage renal disease (ESRD)—because itoffers several distinct advantages as an empirical setting forthis topic. First, dialysis is a fairly standardized treatmentthat allows for a direct comparison of providers. Second, thedialysis industry has become increasingly concentrated followinga series of mergers and acquisitions: today, dialysis is providedprimarily by multiestablishment for-profit firms, with the shareof independently owned and operated dialysis facilities fallingfrom 86% to 21% over the past three decades and the two largestpublicly traded corporations, DaVita and Fresenius, now owningmore than 60% of facilities and earning more than 90% of theindustry’s revenue (United States Renal Data System 2014;Baker 2019). Third, detailed Medicare claims and clinical dataallow us to identify important changes in providers’ behavior andpatients’ outcomes following an acquisition. Finally, the dialysisindustry is an important market to study, with total Medicare re-imbursements for treating the nation’s 430,000 dialysis patientsamounting to about $33 billion a year, or 6% of total Medicareexpenditures.
Dow
nloaded from https://academ
ic.oup.com/qje/article-abstract/135/1/221/5607794 by Brigham
Young University user on 03 August 2020
ACQUISITIONS, FIRM PERFORMANCE, AND BEHAVIOR 223
We find that acquired facilities alter their treatments in waysthat increase reimbursements and decrease costs. For instance,facilities capture higher payments from Medicare by increasingthe amount of drugs they administer to patients, for which Medi-care paid providers a fixed per-unit rate during our study period.The most noteworthy of these is EPOGENC© (EPO; epoetin alfa),a drug used to treat anemia, which represented the single largestprescription drug expenditure for Medicare in 2010, totaling $2billion (U.S. Government Accountability Office 2012). Perhapsreflecting the profits at stake, patients’ EPO doses increase 129%at independent facilities acquired by large chains. Similarly,acquired facilities increase their use of the iron deficiencydrug Venofer R© (iron sucrose injection) relative to Ferrlecit R©
(sodium ferric gluconate), a perfect substitute that offers lowerreimbursements. On the cost side, large chains replace high-skillnurses with lower-skill technicians at the facilities they acquire,reducing labor expenses. Facilities also increase the patient loadof each employee by 11.7% and increase the number of patientstreated at each dialysis station by 4.5%, stretching resources andpotentially reducing the quality of care received by patients.
Adopting the acquiring firm’s operational strategies directlyaffects patient outcomes and Medicare expenditures. Patientsat acquired facilities are 4.2% more likely to be hospitalized ina given month, while the survival rate for new patients falls by1.3–2.9% depending on the time horizon. In addition, new ESRDpatients who start treatment at an acquired facility are 8.5%less likely to receive a kidney transplant or to be added to thetransplant waitlist during their first year on dialysis, a reflectionof worse care because transplants provide a better quality oflife and a longer life expectancy than dialysis. Other measuresof clinical quality are mixed at best. We find, for example, thatpatients are 5.1% less likely to have hemoglobin values withinthe recommended range and 10.0% more likely to have valuesthat are too high, an indication of poor anemia treatment.The only outcome for which we find unequivocal evidence ofimproved quality at acquired facilities is the urea reduction ratio,a measure of the waste cleared during dialysis, with patients atacquired facilities becoming 1.8% more likely to have adequateclearance levels. Although patients receive worse care on thesemeasures following an acquisition, acquired facilities increaseper-treatment Medicare reimbursements by 6.9%, resulting in
Dow
nloaded from https://academ
ic.oup.com/qje/article-abstract/135/1/221/5607794 by Brigham
Young University user on 03 August 2020
224 THE QUARTERLY JOURNAL OF ECONOMICS
$301.7 million in additional Medicare spending throughout oursample on a base of $4.5 billion.
As in much of the merger effects literature, our findings mayface multiple threats to identification, because acquisitions do notoccur randomly and acquired facilities likely differ from those notacquired in important, potentially unobservable ways. We over-come these challenges by using detailed claims data that allow usto observe patients with the same characteristics being treatedat the same facility before and after acquisition, which allows usto identify the effects of an acquisition solely from within-facilitychanges in ownership. In many cases, we can also estimate speci-fications that include patient fixed effects and identify the acqui-sition effects from within-patient changes in outcomes, a particu-larly conservative approach.
We then examine the mechanisms through which acquisitionsaffect firm behavior. We first consider whether an acquisition’seffect on market power can explain the changes we observe forpatient outcomes, as would be predicted by standard models ofregulated markets with endogenous product quality (e.g., Gaynor2004 and the models discussed therein). With prices set adminis-tratively for Medicare patients, these models predict that a facilityfacing more competition in its market would offer higher-qualitycare to attract patients, given the assumption that demand is elas-tic with respect to quality. In dialysis, however, this assumptionfails to hold: patients are not very responsive to changes in qualityand rarely switch facilities, mainly due to high travel costs. Wetherefore find similar qualitative and quantitative results acrossall outcomes when comparing acquisitions that increased marketconcentration to those that did not. As such, changes in marketpower cannot explain the decline in dialysis quality that occursafter a takeover, which implies that the strategy of the acquiringchain, rather than the subsequent concentration of the market,largely determines how patients fare following an acquisition.
Because an increase in local market power does not explainthe changes we observe following an acquisition, we conclude theanalysis by considering other explanations for why independentfacilities do not typically imitate the more profitable strategiesof the large chains before being acquired. Although we assess ahost of possible reasons, only two withstand scrutiny. First, andmost important, the largest for-profit chains benefit from greatereconomies of scale, such as the volume discounts for purchasing
Dow
nloaded from https://academ
ic.oup.com/qje/article-abstract/135/1/221/5607794 by Brigham
Young University user on 03 August 2020
ACQUISITIONS, FIRM PERFORMANCE, AND BEHAVIOR 225
injectable drugs, which influences their behavior. Second, wefind some limited evidence that nonprofit facilities change morefollowing an acquisition than for-profit facilities do, suggestingthat for-profit acquirers’ explicit mandate to maximize profitsmay lead them to sacrifice patient outcomes in favor of higherreimbursements.
This article contributes to several bodies of literature. Thefirst studies the effects of mergers and acquisitions, in healthcare and more generally.1 Much of this literature has focused onhow mergers affect prices through changes in market power.2 Theliterature examining the effects of mergers and acquisitions onquality is more limited.3 Even in regulated markets, the net ef-fect is theoretically ambiguous. On the one hand, standard modelswithout merger efficiencies (e.g., Gaynor 2004) show that acqui-sitions leading to increased market power reduce the incentive todeliver high-quality care.4 On the other hand, mergers that resultin efficiency gains, such as through economies of scale, may leadto better outcomes.
This article also contributes to the somewhat limited liter-ature on how “roll-up” strategies, where large firms graduallyincrease their market share by acquiring many of their muchsmaller competitors, affect industry performance and outcomes.This “whale eats krill” pattern of consolidation has occurred inindustries as varied as physician practices (Capps, Dranove, andOdy 2017) and funeral homes (Wollmann 2019), as well as pack-aged ice companies, breweries, hair stylists, vending machines,medical devices (Dunn 2016), automotive suppliers (Kocourek,
1. This is an extensive literature that cannot be fully reviewed here. For athorough review in the context of health care, see Gaynor, Ho, and Town (2015).
2. In health care, these studies have primarily considered hospital mergers,broadly finding that they result in higher prices paid by insurers (e.g., Dafny 2009;Gowrisankaran, Nevo, and Town 2015; Dafny, Ho, and Lee 2019).
3. A number of papers study the effect of market concentration on hospitalquality but do so without focusing explicitly on mergers and acquisitions (e.g.,Kessler and McClellan 2000; Gaynor, Moreno-Serra, and Propper 2013).
4. Bloom et al. (2015) find empirical support for this by showing that U.K.public hospitals improve their quality when patients can more easily switch fromlow-quality to high-quality providers. More directly, Ho and Hamilton (2000) com-pare quality measures at hospitals before and after being acquired or mergingwith another hospital, finding that quality deteriorates along some dimensionsfollowing acquisition, especially in more-concentrated markets. Hayford (2012)and Capps (2005) also investigate the direct impact of mergers on hospital quality.
Dow
nloaded from https://academ
ic.oup.com/qje/article-abstract/135/1/221/5607794 by Brigham
Young University user on 03 August 2020
226 THE QUARTERLY JOURNAL OF ECONOMICS
Chung, and McKenna 2000), solar power (Seeking Alpha 2015),and many others (The Economist 2015).
Finally, our article contributes to a recent literature specifi-cally focused on the economics of the dialysis industry (e.g., Dai2014; Dai and Tang 2015; Wilson 2016a, 2016b; Cutler, Dafny,and Ody 2017; Grieco and McDevitt 2017; Gaynor, Mehta, andRichards-Shubik 2018; Eliason 2019). Within this literature, ourarticle is most closely related to Cutler, Dafny, and Ody (2017),who study how market concentration in the dialysis industryaffects quality and the price charged to privately insured patients.Using data from the Health Care Cost Institute and DialysisFacility Compare (DFC), they exploit mergers of national dialysischains as shifters in local market concentration and find no effectof concentration on quality and a weakly positive effect on prices.This differs substantially from our work in a number of ways.First, they perform their analysis at an aggregate level becausethey do not observe patient-level data and are unable to matchdata from private insurers to facilities from DFC. By contrast,much of our analysis is performed at the patient level, allowingus to control for a large set of patient covariates and to observehow quality and treatment change within a facility—and evenwithin a patient—over time. Moreover, our article focuses on therole of a chain’s strategy in treatment decisions, which is lesslikely to be influenced by local market competition. Also, someprior work has studied the effect of facility ownership on patients’treatments, but to our knowledge ours is the first to directlyconsider how acquisitions change firm strategies and the causalmechanisms through which they affect patient outcomes.5
The rest of the article proceeds as follows. Section II sum-marizes important institutional details of the dialysis industry.Section III describes our data. Section IV presents our mainresults on the effects of dialysis facility acquisitions. Section Vshows that these effects do not vary based on market concentra-tion. Section VI considers other explanations for why independent
5. Garg et al. (1999), Zhang et al. (2014), and Thamer et al. (2007) study theeffect of facility ownership on patients’ treatments. The first two papers providedescriptive evidence that for-profit facilities and chain-owned facilities, respec-tively, are less likely to refer patients to the transplant waitlist, with Garg et al.also finding lower mortality rates at for-profit facilities. Zhang, Cotter, and Thamer(2011) further show that chain-owned facilities have higher mortality rates thanindependent facilities, whereas Thamer et al. (2007) find that patients at nonprofitdialysis facilities receive lower EPO doses than those at for-profit chain facilities.
Dow
nloaded from https://academ
ic.oup.com/qje/article-abstract/135/1/221/5607794 by Brigham
Young University user on 03 August 2020
ACQUISITIONS, FIRM PERFORMANCE, AND BEHAVIOR 227
facilities behave differently than do chains. Section VII concludes.The Online Appendix contains further details on the data, thesample construction, and analyses that illustrate the robustnessof our findings.
II. BACKGROUND ON THE DIALYSIS INDUSTRY
II.A. Medical Background
The kidneys perform two primary functions in the humanbody: filtering wastes and toxins out of the blood and produc-ing erythropoietin, a hormone that stimulates red blood cell pro-duction. The diagnosis for patients experiencing chronic kidneyfailure, where their kidneys no longer adequately perform thesefunctions, is called end-stage renal disease (ESRD). To survive,ESRD patients must either receive a kidney transplant or reg-ularly undergo dialysis, a medical treatment that mechanicallyfilters wastes and toxins from a patient’s blood. Although a trans-plant is considered the best course of treatment, it is often notpossible, either due to a lack of available kidneys or the patient’spoor physical condition. Fewer than 20% of dialysis patients arecurrently on a kidney waitlist, and for those who are, the medianwait time for a transplant is 3.6 years (United States Renal DataSystem 2014). As a result, most patients with kidney failure relyon dialysis, either permanently or for an extended time.
Those with ESRD may receive one of two types of dialysis:hemodialysis or peritoneal dialysis. Hemodialysis uses a machine(also referred to as a station and designed to treat one patientat a time) to circulate blood through a filter outside the body,which can be performed at the patient’s home or at a dialysiscenter, whereas peritoneal dialysis uses the lining of the patient’sabdomen to filter blood inside the body.6 Because over 90% ofdialysis patients choose in-center hemodialysis, we focus on thismodality for our analysis.
In addition to dialysis, most ESRD patients receive treatmentfor anemia because they do not naturally produce enough erythro-poietin, which leads to a deficiency of red blood cells (Besarab et al.1998). Anemia is treated with a cocktail of injectable drugs, mostcommonly the erythropoietin-stimulating agent EPO, along withan intravenous iron analog, such as Venofer or Ferrlecit. Patients
6. For more information, see https://www.niddk.nih.gov.
Dow
nloaded from https://academ
ic.oup.com/qje/article-abstract/135/1/221/5607794 by Brigham
Young University user on 03 August 2020
228 THE QUARTERLY JOURNAL OF ECONOMICS
most commonly receive these drugs while being treated at a dial-ysis facility.
A dialysis facility’s quality of care may be assessed throughclinical indicators and patient outcomes. Among the clinical mea-sures, the two most prominent are the urea reduction ratio (URR)and hemoglobin (Hgb) levels. URR measures the percent of pri-mary waste (urea) filtered out of a patient’s blood during dialysis,which increases as a patient spends more time on a machine. Al-though patients vary in how long it takes them to achieve a givenURR, the standard of care is that a dialysis session should con-tinue until a patient achieves a URR of at least 0.65 (Owen et al.1993; NIH 2009).
The second, a patient’s Hgb level, measures the onset or sever-ity of anemia. During the period of our study, the FDA recom-mended EPO doses be such that Hgb levels fall between 10 and12 grams per deciliter (g/dL) (Manns and Tonelli 2012). On thelower end, patients with Hgb below 10 g/dL are anemic and sufferfrom symptoms such as fatigue, dizziness, headaches, and, in somesevere cases, death. On the other side of this range, high levelsof Hgb can result in serious complications, such as cardiovascularevents (Besarab et al. 1998; Singh et al. 2006).
Along with these clinical measures, patient outcomes such asmortality and hospitalization represent additional indicators ofa facility’s quality. Of particular concern are hospitalizations forsepticemia and cardiovascular events (Schrier and Wang 2004).Septicemia, an infection of the blood for which dialysis patientsare especially susceptible because of their weakened immune sys-tems and frequent connection between the dialysis machine andtheir bloodstream, poses a severe risk for patients. Providers canreduce infections by properly cleaning machines between patients(Patel et al. 2013), but this is costly because it takes up to an hourto adequately sanitize a dialysis station (Grieco and McDevitt2017). ESRD patients also face an elevated risk for cardiovascu-lar events such as myocardial infarction and stroke, a risk madeworse through excessive use of EPO (Besarab et al. 1998; Singhet al. 2006).
II.B. The Role of Medicare in Dialysis
A defining feature of the dialysis industry is that 90 daysafter being diagnosed with ESRD, all patients become eligiblefor Medicare coverage, regardless of age, which makes Medicare
Dow
nloaded from https://academ
ic.oup.com/qje/article-abstract/135/1/221/5607794 by Brigham
Young University user on 03 August 2020
ACQUISITIONS, FIRM PERFORMANCE, AND BEHAVIOR 229
the primary payer for most ESRD patients. In 2014, over 80%of the 460,000 ESRD patients receiving dialysis treatmentsin the United States were enrolled in Medicare. As a result,Medicare spends more than $33 billion a year for costs associatedwith ESRD, approximately 1% of the entire federal budget(Ramanarayanan and Snyder 2014).
Throughout the time period of our study, Medicare useda blended payment policy to reimburse dialysis providers.7
Specifically, Medicare paid a composite rate of around $128 perdialysis treatment, up to three times a week for each patient. Forinjectable drugs, providers were reimbursed separately on a fee-for-service basis depending on the quantity of drug administered,a crucial feature of the industry that we study below.8
Prior to 2011, fee-for-service injectable drugs generated con-siderable revenue for dialysis providers. In our analysis, we fo-cus on the three most prevalent injectable anemia drugs: EPO,Venofer, and Ferrlecit. More than 90% of dialysis patients receivedEPO in the mid-2000s, and annual expenditures reached $2 billionin 2010, making it the largest prescription drug expense for Cen-ters for Medicare and Medicaid Services (CMS) (U.S. GovernmentAccountability Office 2012). Administering EPO proved lucrativefor providers, accounting for as much as 25% of DaVita’s revenueand up to 40% of its accounting profits (DaVita 2005). Many pa-tient advocates questioned such pervasive use of EPO, however,as several studies linked excessive doses to an increased risk ofmortality and cardiovascular events (Besarab et al. 1998; Singhet al. 2006; Brookhart et al. 2010).
7. Beginning in 2011, Medicare made a number of changes to how it reim-burses dialysis providers. In particular, it substantially changed its reimburse-ment policy by bundling dialysis and anemia treatment (including injectabledrugs) into a single prospective payment, changing the case-mix adjustments tothose payments, and introducing the Quality Incentive Program. Because thesereforms probably had many confounding effects on the dialysis industry, in thisarticle we restrict our analysis of facility acquisitions to the years spanning 1998to 2010 and study the effects of the 2011 reform in a separate paper (Eliason et al.2019a).
8. For these drugs, providers were reimbursed at a rate equal to 95% of theiraverage wholesale price prior to 2005. This was reduced to 85% in 2004. Afterinvestigations by the CMS found that providers were being reimbursed muchmore than they were spending, Congress altered the payment scheme to be 106%of the average sales price, a more accurate reflection of the drugs’ true costs forproviders.
Dow
nloaded from https://academ
ic.oup.com/qje/article-abstract/135/1/221/5607794 by Brigham
Young University user on 03 August 2020
230 THE QUARTERLY JOURNAL OF ECONOMICS
The other two anemia drugs, Ferrlecit and Venofer, areintravenous iron supplements used to treat iron-deficient anemiapatients; they are essentially substitutable (Kosch et al. 2001)and both offered generous reimbursements. In 2007, total Medi-care expenditures for these two drugs were $68 million and $166million, respectively, making them the sixth and fourth mosthighly reimbursed drugs under Medicare Part B. Both are soldby their manufacturers in single-use vials, and any amount ofthe drug left over in a vial must be discarded to reduce the riskof infection, with CMS reimbursing facilities for the amount inthe vial rather than the amount actually administered to thepatient. Although Ferrlecit and Venofer had nearly identical per-milligram reimbursement rates during our study period, Venoferwas produced exclusively in 100 mg vials, and Ferrlecit wasproduced in 62.5 mg vials. As a result, facilities could effectivelyreceive higher reimbursements per vial for Venofer because theycould, for example, use 25 mg from four vials rather than one100 mg vial but still bill CMS for four 100 mg vials, discarding75 mg from each of the four (i.e., under this scheme they couldbill for 400 mg of Venofer as opposed to 250 mg of Ferrlecit). Onecompany accused of engaging in this practice paid $450 millionto settle a whistleblower lawsuit (Pollack 2011; Stempel 2015).
Although Medicare covers the vast majority of dialysis pa-tients in the United States, those who have private insuranceand become eligible for Medicare solely due to ESRD retain thatcoverage for the first 30 months of treatment before Medicarebecomes the primary payer.9 Reimbursements from private in-surers tend to be much higher than those from Medicare, withestimates suggesting that the average private insurance ratesare anywhere from 2.1 times (United States Renal Data System2013) to 4.5 times (Boyd 2017) as generous as Medicare.10
II.C. The Market for Dialysis
Dialysis patients choose their provider much like they do inother segments of the U.S. health care system, with those cov-ered under Medicare able to receive treatment at any facility thathas an opening. Patients primarily receive dialysis at one of the
9. Including the 90-day waiting period for Medicare eligibility, private insur-ance coverage may last up to 33 months.
10. According to DaVita’s 2007 10-K, the average patient with private insur-ance generated 3.8 times more revenue than the average Medicare patient.
Dow
nloaded from https://academ
ic.oup.com/qje/article-abstract/135/1/221/5607794 by Brigham
Young University user on 03 August 2020
ACQUISITIONS, FIRM PERFORMANCE, AND BEHAVIOR 231
more than 6,000 dedicated dialysis facilities across the country,where they typically go three times a week for treatment thatlasts three to four hours each visit.11 These facilities are run bya mix of for-profit and nonprofit firms, and over the past threedecades the two largest for-profit chains, DaVita and Fresenius,have grown to the point where they now control over 60% of fa-cilities and earn 90% of the industry’s revenue (United StatesRenal Data System 2014; Baker 2019). The remainder of the mar-ket comprises smaller chains and independent facilities that areoften run by nephrologists.
Dialysis chains potentially have a number of advantages overindependent facilities. Large chains, for example, may have loweraverage costs due to volume discounts for pharmaceuticals as wellas centralized clinical laboratories; they may have a stronger bar-gaining position with commercial insurance companies (Pozniaket al. 2010); and their national brand and network may makethem more attractive to patients.
Chains also stand apart from independent facilities by havingfirm-wide standards that they implement across their facilities.Notably, large chains have operation manuals that dictate proce-dures during treatment. We see evidence of this standardizationin the predictability of a patient’s EPO dose: an acquired facility’suse of EPO becomes nearly twice as predictable—and twice ashigh—compared with its preacquisition doses.12 The use of thesemanuals represents a clear channel through which an acquisitioncould alter patients’ treatments and outcomes, which we study atlength below.
Chains’ system-wide standards may not universally lead tohigher-quality care, however, as anecdotal evidence presented bythe media, as well as some governmental reports, have raised con-cerns about practices and outcomes at both independent and chainfacilities. For example, an investigative journalist from ProPub-lica examined the inspection records of more than 1,000 facilitiesand found that surveyors came across filthy or unsafe conditions
11. Unless otherwise specified, for the rest of the article when we use the term“dialysis” we are referring to in-center hemodialysis.
12. These statements about predictability are based on comparing R2 fromregressions of EPO dose per patient on patient characteristics interacted withyear fixed effects estimated separately using observations from facilities that areacquired either pre- or postacquisition. See results in Online Appendix M.
Dow
nloaded from https://academ
ic.oup.com/qje/article-abstract/135/1/221/5607794 by Brigham
Young University user on 03 August 2020
232 THE QUARTERLY JOURNAL OF ECONOMICS
in almost half the units they checked (Fields 2010).13 Similarly,The New York Times and Washington Post have reported on theexcessive use of injectable drugs at dialysis facilities, noting thatdespite the billions spent on anemia drugs, there is little evidencethat they improve patients’ quality of life (Berenson and Pollack2007; Whoriskey 2012). Multiple reports by the Office of the In-spector General have also scrutinized dialysis facilities’ drug useand acquisitions.14 In addition to bad press, extreme cases of poorconditions and treatment quality have led to a number of lawsuitsagainst providers.15 Moreover, the media has reported claims thatchains potentially provide worse care by discouraging their pa-tients from seeking kidney transplants (Matthews 2017; Oliver2017).16 In the analysis that follows, we move beyond such anec-dotes by using our comprehensive claims data to consider directlyhow a firm’s strategy affects patient outcomes.
III. DATA AND DESCRIPTIVE STATISTICS
A primary contribution of our article is to show how acqui-sitions affect the quality of care provided by dialysis facilities,which we accomplish in part by tracking patients’ treatments andtests before and after their facilities are acquired. The micro-leveldata we use are essential for observing any changes in a facility’sstrategic choices and how these choices subsequently affect pa-tients’ outcomes and overall Medicare spending. In this section,
13. At some facilities, blood was found encrusted on patients’ treatment chairsor even splattered around the room. At a unit in Durham, NC, ants were reportedlyso common that staffers would simply hand a can of bug spray to patients whocomplained.
14. See OEI-03-06-00200 or OEI-03-06-00590 for two examples.15. As an example, in 2008 Fresenius Medical Care North America agreed to
settle a wrongful death lawsuit brought by a deceased patient’s survivors. Accord-ing to a federal inspection report, during treatment the patient’s bloodline becamedisconnected and, contrary to emergency standing orders, the dialysis technicianreconnected the line to the patient’s catheter, “infusing him with ‘potentially con-taminated blood.”’ He was later taken to a hospital where tests showed that hiscatheter had become infected with antibiotic-resistant Staphylococcus. The infec-tion moved to his heart and brain, and he died a few days later.
16. Although patients can self-refer for a transplant, they often lack adequateinformation about the procedure and fail to understand its risks and benefits.Facilities thus play an important role in a patient’s decision to pursue a transplant,and some have allegedly discouraged patients from seeking one to avoid losingtheir reimbursements (OPTN Minority Affairs Committee 2015).
Dow
nloaded from https://academ
ic.oup.com/qje/article-abstract/135/1/221/5607794 by Brigham
Young University user on 03 August 2020
ACQUISITIONS, FIRM PERFORMANCE, AND BEHAVIOR 233
we describe our data and provide descriptive results for the mostprominent changes in firm strategy.
III.A. Data Sets
For our analysis, we use patient- and facility-level data fromthe United States Renal Data System (USRDS). The USRDS isa data clearing house funded by the National Institutes of Dia-betes and Digestive and Kidney Diseases and the National Insti-tutes of Health that collects and stores data related to chronickidney disease. They combine data from a variety of sources,including Medicare administrative files, Medicare claims, an-nual facility surveys, and clinical surveillance data, to create themost-comprehensive data set for studying the U.S. dialysisindustry.17 Online Appendices A and L provide more details onthe data sets and how we constructed our sample.
The USRDS uses a number of data sources to create an ex-haustive treatment history for almost all dialysis patients in theUnited States since at least 1991, allowing us to observe each pa-tient’s sex, race, BMI, cause of ESRD, payer, measures of kidneyfailure, comorbidities (e.g., diabetes and hypertension), residen-tial ZIP Code, facility of treatment, and mortality data. We com-bine these data with institutional claims from Medicare, whichprovide a more granular view of the dialysis treatments receivedby Medicare patients. Providers submit line-item claims for ser-vices other than dialysis. These include all injectable drugs admin-istered during treatment and clinical measures related to dialy-sis care (URR) and anemia treatment (Hgb levels) at a monthlyfrequency, making them among the more detailed claims dataavailable to researchers. These data also identify if and when apatient is hospitalized. Finally, we observe a patient’s transplantand waitlist status, including their listing date and the transplantcenter.
Detailed data on dialysis facilities come from the Annual Fa-cility Survey, which is required by CMS to maintain certificationand receive Medicare reimbursements for ESRD treatment. Fromthese surveys, we observe a facility ID, address, chain affiliation,labor inputs, number of dialysis stations, for-profit status, andtypes of treatment offered (hemodialysis, peritoneal dialysis, ortransplant). These data allow us to construct a yearly panel of
17. For a more thorough description of USRDS, see the Researcher’s Guide tothe USRDS System at USRDS.org.
Dow
nloaded from https://academ
ic.oup.com/qje/article-abstract/135/1/221/5607794 by Brigham
Young University user on 03 August 2020
234 THE QUARTERLY JOURNAL OF ECONOMICS
chain ownership for each facility. We enrich this panel and con-struct a monthly panel of chain ownership using precise acquisi-tion dates for each facility from the Provider of Service files andannual cost reports submitted to CMS. This process enables us tofind precise acquisition dates for 1,055 of the 1,236 acquisitionswe observe.18
In addition to the Annual Facility Survey, providers mustsubmit certified financial statements to CMS each year that de-tail their costs of providing care as part of the Healthcare CostReporting Information System (HCRIS), which CMS reservesthe right to audit. We use these reports to construct measuresof per treatment variable costs and per unit EPO acquisitioncosts.19
We combine these data sets and drop any patient who is miss-ing demographic or comorbidity data. We also drop observations atfacilities that are acquired but do not have reliable dates of acqui-sition, as well as the 12-month window surrounding an acquisitionto reduce measurement error in the timing of acquisition.20
III.B. Descriptive Statistics
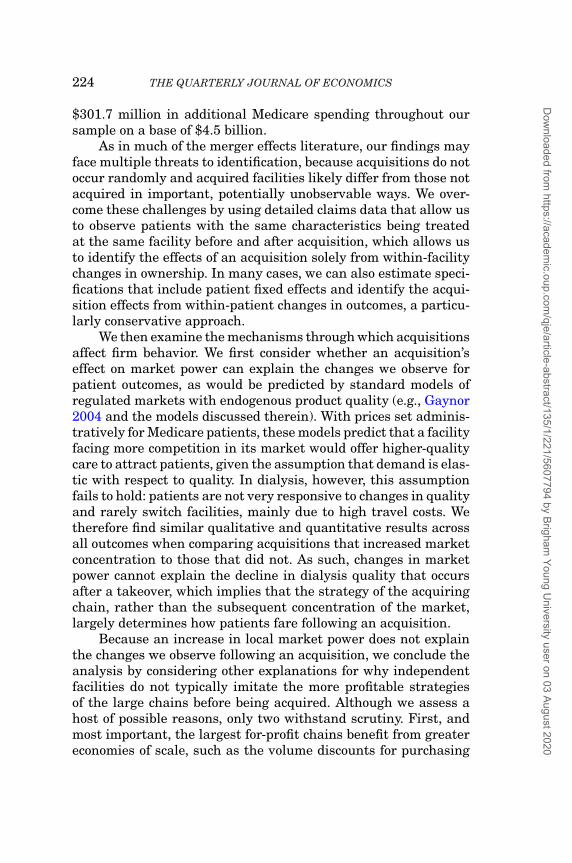
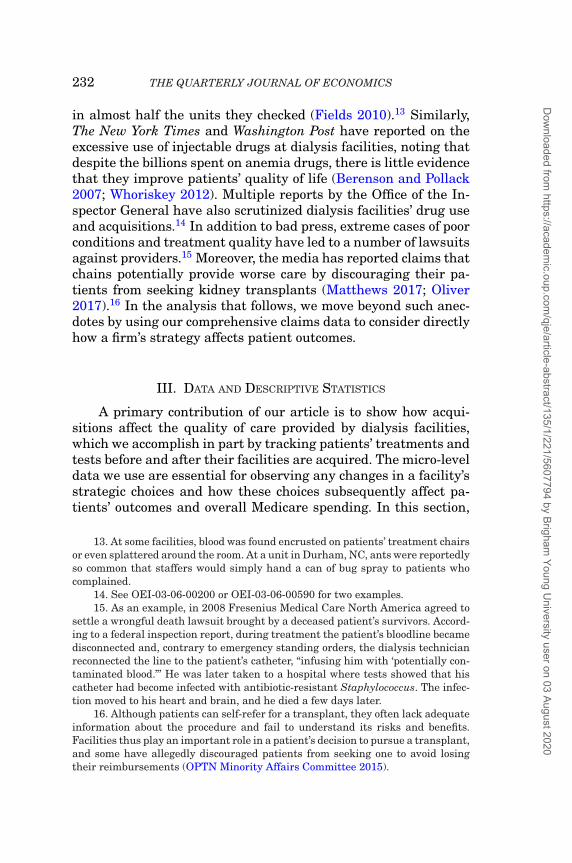
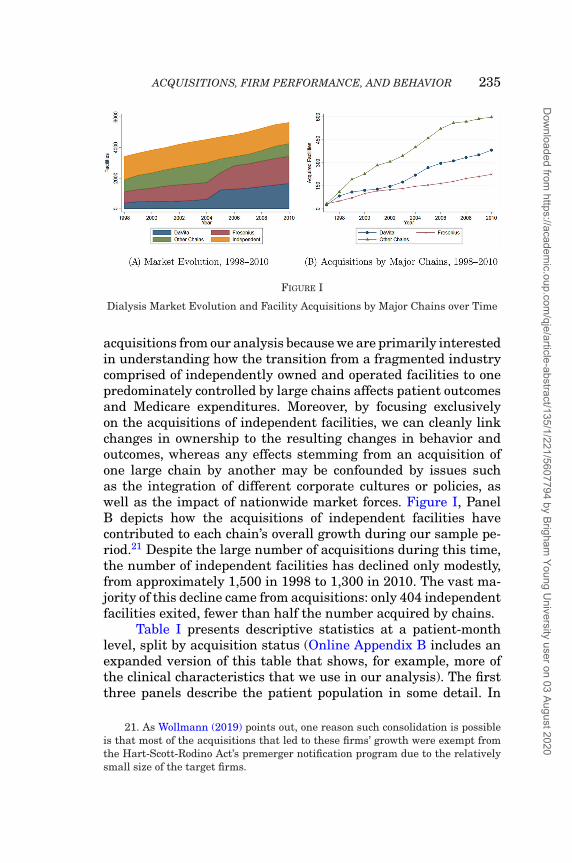
Figure I illustrates the significant change in the dialysis in-dustry’s market structure over our sample period. The number ofacquisitions has varied between 50 to 150 each year, and by 2010we observe over 1,200 first-time acquisitions of independent facil-ities, providing a large sample for conducting our analysis. Con-solidation increased sharply during our sample period. Figure I,Panel A shows the extent of this change, with DaVita andFresenius owning the majority of facilities by 2010 and the otherchains collectively commanding a somewhat smaller marketshare. The two biggest mergers during this time period areDaVita’s and Fresenius’s acquisitions of the large chains Gam-bro and Renal Care Group, respectively. We exclude these large
18. A more detailed description of this matching process is available in OnlineAppendix L.
19. These data allow us to net rebates out of the total acquisition costs forEPO. We validated the fidelity of these data by comparing them to an independentaudit of dialysis facility drug costs conducted by the Office of the Inspector General(OIG Report OEI-03-06-00590) in 2006 and found that the mean acquisition costsfor EPO was very similar in the two sources.
20. Our qualitative results are robust to the inclusion of this time period,though quantitative results are somewhat attenuated due to the introduction ofmeasurement error in the timing of acquisitions. See Online Appendix F.
Dow
nloaded from https://academ
ic.oup.com/qje/article-abstract/135/1/221/5607794 by Brigham
Young University user on 03 August 2020
ACQUISITIONS, FIRM PERFORMANCE, AND BEHAVIOR 235
FIGURE I
Dialysis Market Evolution and Facility Acquisitions by Major Chains over Time
acquisitions from our analysis because we are primarily interestedin understanding how the transition from a fragmented industrycomprised of independently owned and operated facilities to onepredominately controlled by large chains affects patient outcomesand Medicare expenditures. Moreover, by focusing exclusivelyon the acquisitions of independent facilities, we can cleanly linkchanges in ownership to the resulting changes in behavior andoutcomes, whereas any effects stemming from an acquisition ofone large chain by another may be confounded by issues suchas the integration of different corporate cultures or policies, aswell as the impact of nationwide market forces. Figure I, PanelB depicts how the acquisitions of independent facilities havecontributed to each chain’s overall growth during our sample pe-riod.21 Despite the large number of acquisitions during this time,the number of independent facilities has declined only modestly,from approximately 1,500 in 1998 to 1,300 in 2010. The vast ma-jority of this decline came from acquisitions: only 404 independentfacilities exited, fewer than half the number acquired by chains.
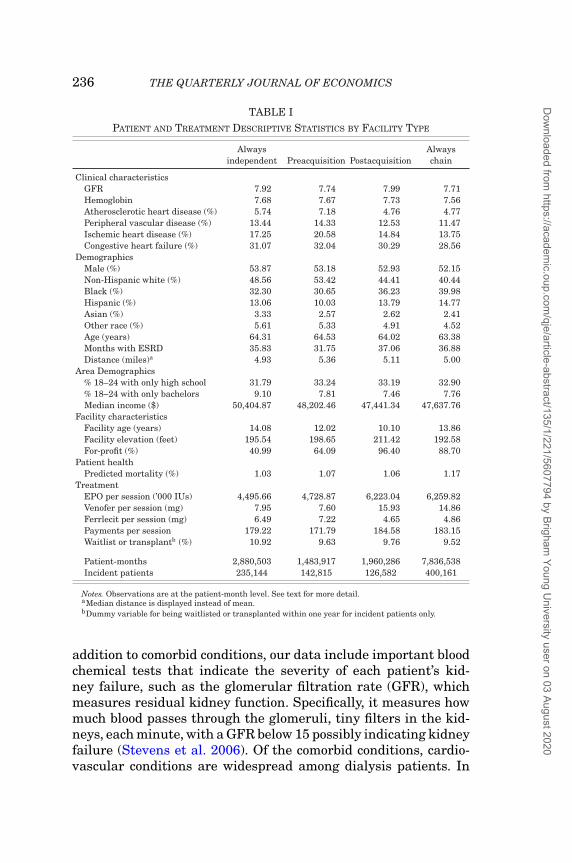
Table I presents descriptive statistics at a patient-monthlevel, split by acquisition status (Online Appendix B includes anexpanded version of this table that shows, for example, more ofthe clinical characteristics that we use in our analysis). The firstthree panels describe the patient population in some detail. In
21. As Wollmann (2019) points out, one reason such consolidation is possibleis that most of the acquisitions that led to these firms’ growth were exempt fromthe Hart-Scott-Rodino Act’s premerger notification program due to the relativelysmall size of the target firms.
Dow
nloaded from https://academ
ic.oup.com/qje/article-abstract/135/1/221/5607794 by Brigham
Young University user on 03 August 2020
236 THE QUARTERLY JOURNAL OF ECONOMICS
TABLE IPATIENT AND TREATMENT DESCRIPTIVE STATISTICS BY FACILITY TYPE
Alwaysindependent Preacquisition Postacquisition
Alwayschain
Clinical characteristicsGFR 7.92 7.74 7.99 7.71Hemoglobin 7.68 7.67 7.73 7.56Atherosclerotic heart disease (%) 5.74 7.18 4.76 4.77Peripheral vascular disease (%) 13.44 14.33 12.53 11.47Ischemic heart disease (%) 17.25 20.58 14.84 13.75Congestive heart failure (%) 31.07 32.04 30.29 28.56
DemographicsMale (%) 53.87 53.18 52.93 52.15Non-Hispanic white (%) 48.56 53.42 44.41 40.44Black (%) 32.30 30.65 36.23 39.98Hispanic (%) 13.06 10.03 13.79 14.77Asian (%) 3.33 2.57 2.62 2.41Other race (%) 5.61 5.33 4.91 4.52Age (years) 64.31 64.53 64.02 63.38Months with ESRD 35.83 31.75 37.06 36.88Distance (miles)a 4.93 5.36 5.11 5.00
Area Demographics% 18–24 with only high school 31.79 33.24 33.19 32.90% 18–24 with only bachelors 9.10 7.81 7.46 7.76Median income ($) 50,404.87 48,202.46 47,441.34 47,637.76
Facility characteristicsFacility age (years) 14.08 12.02 10.10 13.86Facility elevation (feet) 195.54 198.65 211.42 192.58For-profit (%) 40.99 64.09 96.40 88.70
Patient healthPredicted mortality (%) 1.03 1.07 1.06 1.17
TreatmentEPO per session (’000 IUs) 4,495.66 4,728.87 6,223.04 6,259.82Venofer per session (mg) 7.95 7.60 15.93 14.86Ferrlecit per session (mg) 6.49 7.22 4.65 4.86Payments per session 179.22 171.79 184.58 183.15Waitlist or transplantb (%) 10.92 9.63 9.76 9.52
Patient-months 2,880,503 1,483,917 1,960,286 7,836,538Incident patients 235,144 142,815 126,582 400,161
Notes. Observations are at the patient-month level. See text for more detail.aMedian distance is displayed instead of mean.bDummy variable for being waitlisted or transplanted within one year for incident patients only.
addition to comorbid conditions, our data include important bloodchemical tests that indicate the severity of each patient’s kid-ney failure, such as the glomerular filtration rate (GFR), whichmeasures residual kidney function. Specifically, it measures howmuch blood passes through the glomeruli, tiny filters in the kid-neys, each minute, with a GFR below 15 possibly indicating kidneyfailure (Stevens et al. 2006). Of the comorbid conditions, cardio-vascular conditions are widespread among dialysis patients. In
Dow
nloaded from https://academ
ic.oup.com/qje/article-abstract/135/1/221/5607794 by Brigham
Young University user on 03 August 2020
ACQUISITIONS, FIRM PERFORMANCE, AND BEHAVIOR 237
total, approximately 50% of patients have at least one cardiovas-cular condition, with congestive heart failure the most common.The prevalence of such conditions makes any increase in EPOdoses especially hazardous due to the concern that it elevatesa patient’s risk of cardiovascular events (Besarab et al. 1998;Singh et al. 2006). Dialysis patients are also disproportionatelyAfrican American, making up over 30% of our sample comparedto less than 15% of the U.S. population. In our analysis, we includedemographic characteristics that vary both across ZIP Codes andwithin a ZIP Code over time. In our regressions we control forthe age of the facility and, in specifications without facility fixedeffects, the facility’s elevation, as medical evidence suggests thatelevation influences a patient’s need for EPO.22 We also note thatacquirers are more likely to be for-profit firms. To summarize pa-tient health, in the fifth panel we combine the clinical character-istics into a measure of predicted mortality by taking the fittedvalues from regressing an indicator for patient death on patientcharacteristics.23 The table shows that according to this measure,patient health is fairly constant across the four types of facilityownership.
Table I allows us to investigate the potential identificationchallenges that we must address with our empirical strategy.Namely, patients at acquired facilities may be inherently differentfrom patients at facilities that are not acquired, and the patientmix at acquired facilities could change after an acquisition. Formany attributes, we observe no systematic differences across fa-cility types (e.g., GFR and congestive heart disease). We also seeno meaningful difference in the share of privately insured pa-tients across each type of facility. We do observe differences inracial composition and the rates of ischemic heart disease, how-ever, with these differences largely coming from long-run trendsin patient characteristics, as the preacquisition column tends tosample from earlier years and the postacquisition column fromlater years. For example, the prevalence of ischemic heart dis-ease among dialysis patients has declined from 21.8% in 1998
22. At higher elevations, the richness of oxygen in the blood decreases andtissue hypoxia sets in, which causes the body to produce more endogenous erythro-poietin (Brookhart et al. 2011) reducing the need for erythropoietin-stimulatingagents, Eliason et al. (2019a) exploit this feature of anemia treatment to study theeffect of the 2011 dialysis payment reforms on patient and market outcomes.
23. See Online Appendix C for details on the construction of this measure.
Dow
nloaded from https://academ
ic.oup.com/qje/article-abstract/135/1/221/5607794 by Brigham
Young University user on 03 August 2020

238 THE QUARTERLY JOURNAL OF ECONOMICS
to 10.6% in 2010. Reflecting this, when we consider only thosepatients treated within 12 months of the acquisition window, wefind no meaningful difference between the pre- and postacquisi-tion groups (see Online Appendix D). This further suggests thatany meaningful differences in demographics are driven by timetrends, not by changes in the mix of patients treated at facilitiesfollowing an acquisition.
Nevertheless, in the analysis that follows, we directly con-sider the possibility that an acquisition may affect the mix ofpatients in ways that could bias our results. To ensure that timetrends and selection bias do not confound our analysis, we controlfor detailed patient characteristics and include month-year fixedeffects in our regressions. To further address any concerns thatour findings may be driven by changes in patient unobservables,we show that our results are robust to including patient fixed ef-fects in Online Appendix G. In addition, in Section IV.D we presentevidence that patients starting dialysis at acquired facilities maybe healthier than those beginning treatment at the same facilitybefore acquisition, suggesting that the deterioration in outcomeswe estimate may actually be understating the true decline.
These descriptive statistics also highlight stark differencesin the treatments received by patients at each type of facility.As the bottom panel of Table I clearly shows, patients at chain-owned facilities receive substantially more EPO per session andare much more likely to receive Venofer than Ferrlecit. As a re-sult, payments per session (all Medicare payments to the dialysisfacility including injectable drugs per session) jump by about 7%at facilities acquired by a chain.
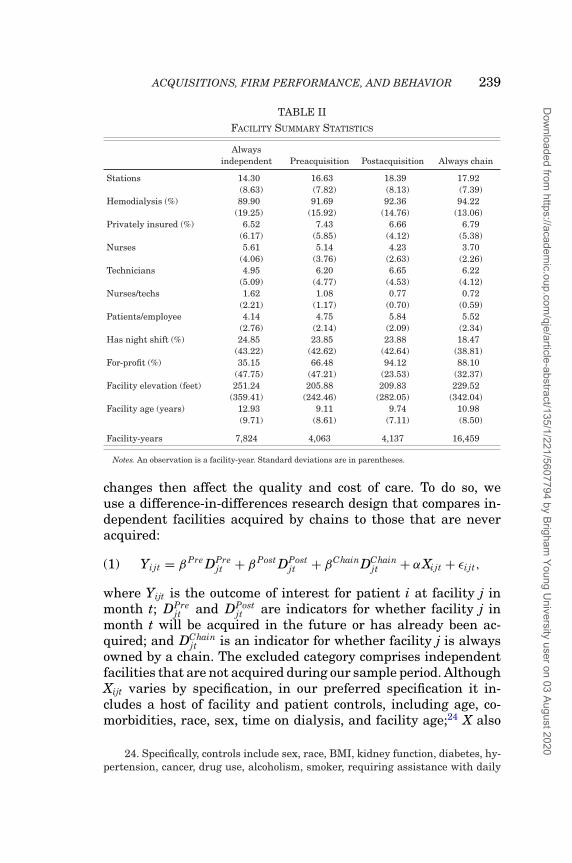
Facilities’ operations also change following an acquisition.Table II shows that chain-owned facilities have more stationsper facility, substitute toward lower-cost technicians and awayfrom higher-cost nurses, and generally stretch resources furtherby treating more patients per employee. All of these differencesare consistent with a firm strategy that prioritizes profits overpatient outcomes, which we consider in greater detail in the nextsection.
IV. THE IMPACT OF ACQUISITIONS ON FIRM STRATEGY, PATIENT
OUTCOMES, AND THE COST OF DIALYSIS CARE
In this section, we show how independent facilities changetheir behavior after being acquired by a chain and how these
Dow
nloaded from https://academ
ic.oup.com/qje/article-abstract/135/1/221/5607794 by Brigham
Young University user on 03 August 2020
ACQUISITIONS, FIRM PERFORMANCE, AND BEHAVIOR 239
TABLE IIFACILITY SUMMARY STATISTICS
Alwaysindependent Preacquisition Postacquisition Always chain
Stations 14.30 16.63 18.39 17.92(8.63) (7.82) (8.13) (7.39)
Hemodialysis (%) 89.90 91.69 92.36 94.22(19.25) (15.92) (14.76) (13.06)
Privately insured (%) 6.52 7.43 6.66 6.79(6.17) (5.85) (4.12) (5.38)
Nurses 5.61 5.14 4.23 3.70(4.06) (3.76) (2.63) (2.26)
Technicians 4.95 6.20 6.65 6.22(5.09) (4.77) (4.53) (4.12)
Nurses/techs 1.62 1.08 0.77 0.72(2.21) (1.17) (0.70) (0.59)
Patients/employee 4.14 4.75 5.84 5.52(2.76) (2.14) (2.09) (2.34)
Has night shift (%) 24.85 23.85 23.88 18.47(43.22) (42.62) (42.64) (38.81)
For-profit (%) 35.15 66.48 94.12 88.10(47.75) (47.21) (23.53) (32.37)
Facility elevation (feet) 251.24 205.88 209.83 229.52(359.41) (242.46) (282.05) (342.04)
Facility age (years) 12.93 9.11 9.74 10.98(9.71) (8.61) (7.11) (8.50)
Facility-years 7,824 4,063 4,137 16,459
Notes. An observation is a facility-year. Standard deviations are in parentheses.
changes then affect the quality and cost of care. To do so, weuse a difference-in-differences research design that compares in-dependent facilities acquired by chains to those that are neveracquired:
(1) Yijt = βPre DPrejt + βPost DPost
jt + βChainDChainjt + αXijt + εi jt,
where Yijt is the outcome of interest for patient i at facility j inmonth t; DPre
jt and DPostjt are indicators for whether facility j in
month t will be acquired in the future or has already been ac-quired; and DChain
jt is an indicator for whether facility j is alwaysowned by a chain. The excluded category comprises independentfacilities that are not acquired during our sample period. AlthoughXijt varies by specification, in our preferred specification it in-cludes a host of facility and patient controls, including age, co-morbidities, race, sex, time on dialysis, and facility age;24 X also
24. Specifically, controls include sex, race, BMI, kidney function, diabetes, hy-pertension, cancer, drug use, alcoholism, smoker, requiring assistance with daily
Dow
nloaded from https://academ
ic.oup.com/qje/article-abstract/135/1/221/5607794 by Brigham
Young University user on 03 August 2020
240 THE QUARTERLY JOURNAL OF ECONOMICS
includes year, state, and facility fixed effects. Without facility fixedeffects, βPost would capture the mean difference in Y for facilitiesthat have been acquired relative to facilities that are never ac-quired in our sample, conditional on other covariates. To avoidmeasurement error in the date of acquisition and to allow enoughtime for a firm’s strategy to be fully implemented at an acquiredfacility, we exclude all observations within a six-month windowon either side of the acquisition date.25 In all specifications, wecluster standard errors at the facility level.26
The primary threat to identification in this setting is thatchains may acquire independent facilities whose patients havecertain characteristics that affect Y through channels other thana change in ownership. As shown in Table I, however, patientstreated at independent facilities acquired by chains are not sys-tematically different along observable characteristics than thosetreated at other independent facilities. In addition, the richness ofour data allows us to control for all clinically relevant covariates,making this an even smaller concern. Last, to make a causal claimabout acquisitions from a specification that includes facility fixedeffects requires only that chains do not systematically change themix of patients along unobservable dimensions when they acquirea facility, a relatively weak assumption. Moreover, our results arerobust to the inclusion of patient fixed effects, which further lim-its this concern. Nevertheless, in Section IV.D we also explore thepossibility that patient selection may be a part of the strategychains implement after acquisition and find that new patients atacquired facilities may be slightly healthier than those who wereat the same facilities before they were acquired. These findings, ifanything, suggest that our results may understate the true effects
activities, chronic obstructive pulmonary disease, atherosclerotic heart disease,peripheral vascular disease, ischemic heart disease, congestive heart failure, facil-ity for-profit status, income quintile, % of those between 18–24 with just a collegedegree, % of those between 18–24 with just a high school diploma, patient age,facility elevation, and facility age. Facility age is constructed and equal to the cur-rent year minus the year of last certification by CMS. This variable occasionallyresets when a facility is recertified. The findings are robust to the exclusion of thisvariable.
25. As shown in Online Appendix F, however, our main results are robustto including this period, although slightly attenuated due to the introduction ofmeasurement error in the timing of acquisitions.
26. Clustering at the patient level yields standard errors 25–75% smallerthan those clustered at the facility level, so we report standard errors clustered byfacility as the more conservative of the two approaches.
Dow
nloaded from https://academ
ic.oup.com/qje/article-abstract/135/1/221/5607794 by Brigham
Young University user on 03 August 2020
ACQUISITIONS, FIRM PERFORMANCE, AND BEHAVIOR 241
of an acquisition. In short, the rich data of our empirical settingallow us to cleanly identify the effects of acquisitions on facilities’practices and patients’ outcomes, affording a unique opportunityto disentangle the otherwise opaque nature and effects of firms’corporate strategies. It is also worth noting that even though theresearch design exploits within-patient changes at the same facil-ity before and after acquisition, chains may target certain areasfor potential growth, so it is possible that acquisitions in theseareas may not be independent of one another. We have exploredwhether there is any noticeable change in the behavior of facili-ties of the same chain when a nearby independent joins the chainand failed to find any. Relatedly, we have found that neighboringcompeting facilities do not noticeably change their behavior in re-sponse to a nearby acquisition. Thus, there do not appear to be“spillover” effects from acquisitions on neighboring facilities. Inaddition, in our discussions with nephrologists, we have been toldthat independent acquisitions are often driven by idiosyncraticreasons on the part of facility owners, such as retirement.
IV.A. Drug Doses
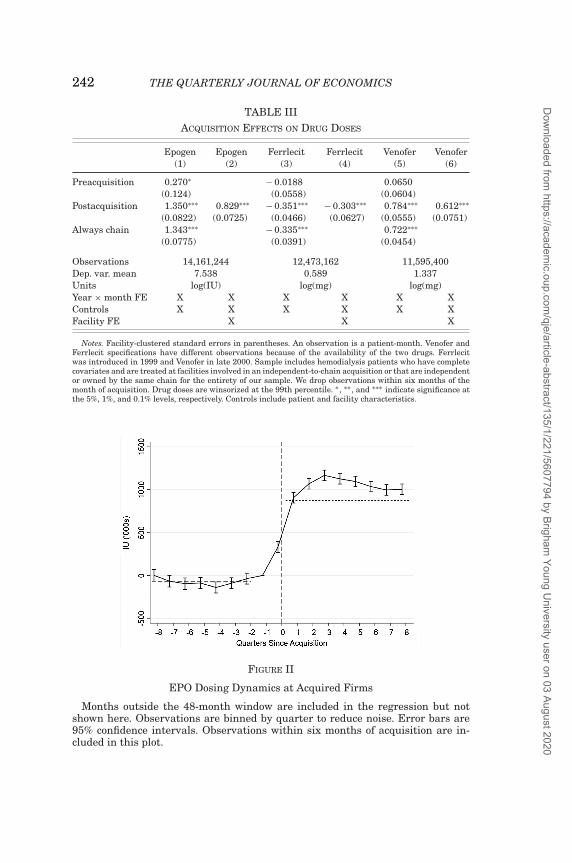
We first consider the use of EPO at dialysis facilities due to itsimportance for firms’ profits, its outsize effect on Medicare’s totalspending on drugs, and its potential for abuse by providers. Thefirst two columns of Table III presents estimates of equation (1)where the dependent variable is the log of EPO doses per treat-ment.27 Column (1) shows that although acquired facilities werealready using slightly more EPO per treatment than independentfacilities that are never acquired, they experience such a substan-tial increase following an acquisition that their levels converge tothose of facilities always owned by a chain. Column (2) adds facil-ity fixed effects and suggests that acquisitions cause EPO doses tomore than double for patients at the same facility with the sameobservable characteristics.
By interpreting this estimate as the causal effect of an acqui-sition on EPO doses, we rely on the assumption that an acquisitioncreates a discontinuous change in facility behavior and that anytrends in dosing during the period surrounding an acquisition arecommon to all of the facilities in the control group. To supportthis assumption, in Figure II we plot EPO doses during the timeperiod around acquisition, where the horizontal axis has the quar-ters relative to acquisition, quarter 0 is the quarter of acquisition
27. Dependent variable is log(1+Dose) in cases where the dose is 0.
Dow
nloaded from https://academ
ic.oup.com/qje/article-abstract/135/1/221/5607794 by Brigham
Young University user on 03 August 2020
242 THE QUARTERLY JOURNAL OF ECONOMICS
TABLE IIIACQUISITION EFFECTS ON DRUG DOSES
Epogen Epogen Ferrlecit Ferrlecit Venofer Venofer(1) (2) (3) (4) (5) (6)
Preacquisition 0.270∗ − 0.0188 0.0650(0.124) (0.0558) (0.0604)
Postacquisition 1.350∗∗∗ 0.829∗∗∗ − 0.351∗∗∗ − 0.303∗∗∗ 0.784∗∗∗ 0.612∗∗∗
(0.0822) (0.0725) (0.0466) (0.0627) (0.0555) (0.0751)Always chain 1.343∗∗∗ − 0.335∗∗∗ 0.722∗∗∗
(0.0775) (0.0391) (0.0454)
Observations 14,161,244 12,473,162 11,595,400Dep. var. mean 7.538 0.589 1.337Units log(IU) log(mg) log(mg)Year × month FE X X X X X XControls X X X X X XFacility FE X X X
Notes. Facility-clustered standard errors in parentheses. An observation is a patient-month. Venofer andFerrlecit specifications have different observations because of the availability of the two drugs. Ferrlecitwas introduced in 1999 and Venofer in late 2000. Sample includes hemodialysis patients who have completecovariates and are treated at facilities involved in an independent-to-chain acquisition or that are independentor owned by the same chain for the entirety of our sample. We drop observations within six months of themonth of acquisition. Drug doses are winsorized at the 99th percentile. ∗ , ∗∗ , and ∗∗∗ indicate significance atthe 5%, 1%, and 0.1% levels, respectively. Controls include patient and facility characteristics.
FIGURE II
EPO Dosing Dynamics at Acquired Firms
Months outside the 48-month window are included in the regression but notshown here. Observations are binned by quarter to reduce noise. Error bars are95% confidence intervals. Observations within six months of acquisition are in-cluded in this plot.
Dow
nloaded from https://academ
ic.oup.com/qje/article-abstract/135/1/221/5607794 by Brigham
Young University user on 03 August 2020
ACQUISITIONS, FIRM PERFORMANCE, AND BEHAVIOR 243
(denoted by a vertical dashed line), and the omitted category isthe quarter prior to acquisition. The graph plots coefficients fromestimating
(2) Yijt =∑
s
δs Dsjt + αXijt + εi jt,
where Dsjt is a dummy variable for facility j being acquired at time
t + s and Xijt includes the same set of controls as equation (1), in-cluding facility fixed effects. We find no evidence of a pretrend. Wedo see a short adjustment period of approximately six months afteracquisition where facilities gradually adjust EPO doses upwardbefore leveling off. For this phenomenon to arise due to selectionbias (in the sense that chains acquire facilities that were goingto increase EPO doses irrespective of being acquired), acquiringfirms would need to observe some indication of a looming increasein doses when negotiating the sale of the facility. This strikes usas implausible given that negotiations occur many months priorto the date of acquisition.
We extend our baseline analysis to study the effect of acqui-sitions on the use of two other commonly used intravenous drugsgiven to patients with anemia: Ferrlecit and Venofer. The lastfour columns of Table III repeats the research design to focus onthese drugs, with the number of observations differing across thecolumns because Ferrlecit and Venofer did not receive FDA ap-proval until 1999 and 2000, respectively, whereas EPO was in useat the start of our sample in 1998. Due to delays in the creationof HCPCS codes, we have Ferrlecit doses since 2001 and Venoferdoses since 2002. The results in Table III show that acquired fa-cilities substantially increase their use of Venofer and decreasetheir use of Ferrlecit.
The switch from Ferrlecit to Venofer reflects the profits atstake. As discussed in Section II.B, Ferrlecit and Venofer are es-sentially substitutes for one another and are reimbursed by Medi-care at nearly the same per unit rate, but differences in how man-ufacturers package the drugs make Venofer a potentially morelucrative drug for providers because it allows them to bill formore “unavoidable” waste. To illustrate the onset of these strate-gies at newly acquired firms, we replicate Figure II for Venoferand Ferrlecit in Online Appendix K.28
28. This appendix also contains event studies for the other dependent vari-ables analyzed in this section.
Dow
nloaded from https://academ
ic.oup.com/qje/article-abstract/135/1/221/5607794 by Brigham
Young University user on 03 August 2020
244 THE QUARTERLY JOURNAL OF ECONOMICS
IV.B. Facility Inputs
The results in Section IV.A clearly show that chains strategi-cally alter the drug doses of patients at newly acquired facilities.In this subsection, we investigate how they alter the input choicesof their targets following takeovers in ways that reduce costs. Todo so, we modify our baseline specification (1) to analyze data atthe facility-year level, because data for many of the inputs (e.g.,staff and the number of dialysis stations) are only available an-nually. Specifically, we include facility fixed effects and estimatespecifications of the form
(3) Yijt = γ Post DPostjt + δXjt + ν jt.
Aside from the change in the unit of observation, this analysisis very similar to our patient-level analysis and relies on similaridentifying assumptions. Namely, for a causal interpretation ofγ Post, we require that the acquisition results in a discrete changein the environment determining facilities’ input choices. With an-nual data, measurement error for the timing of acquisitions is aneven greater concern because some inputs (e.g., staff) may changepartway through the year, but we would not observe the new lev-els until the following year’s report. To remedy this, we drop theentire year of acquisition for each facility that changes ownership,keeping only observations where a facility has the same owner-ship for the entire year.
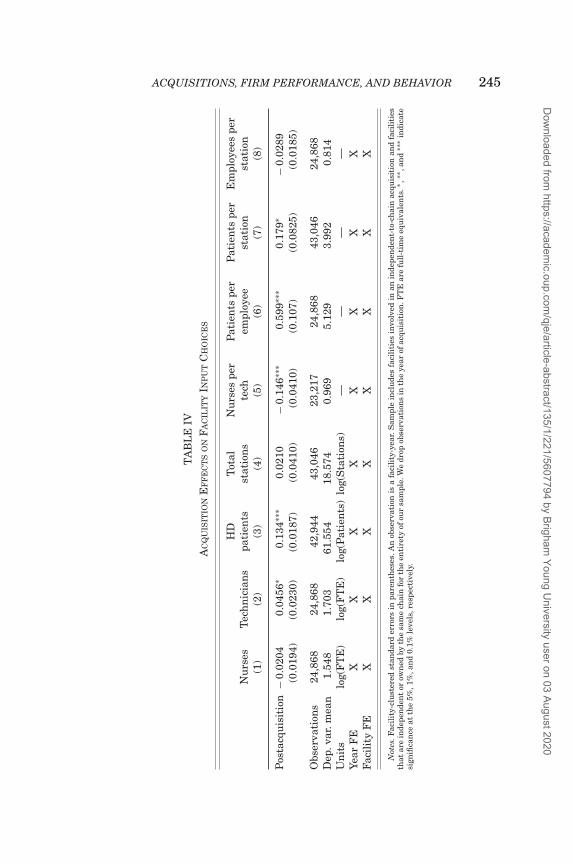
Table IV displays the effect of acquisitions on facility-levellabor and capital decisions. These estimates show a consistentshift in the use of certain inputs by chains, with acquired facil-ities decreasing use of nurses (although the effect is not statis-tically significant) while increasing use of dialysis technicians.Such a switch reduces facilities’ costs because technicians haveless training and are therefore paid less than nurses.29 Uponacquisition, the target firm decreases its nurse-technician ratioby roughly 15.1%. Newly acquired facilities also stretch their re-sources by increasing their patient-to-employee ratio by 11.7%and their patient-to-station ratio by 4.5%. Taken together, wefind that acquiring firms adjust the inputs of their targets bysubstituting away from more experienced, higher-cost labor and
29. Dialysis technicians typically require only 12 months of training, much ofwhich is done on the job. By contrast, nurses are typically required to pass an RNlicensure exam.
Dow
nloaded from https://academ
ic.oup.com/qje/article-abstract/135/1/221/5607794 by Brigham
Young University user on 03 August 2020
ACQUISITIONS, FIRM PERFORMANCE, AND BEHAVIOR 245
TA
BL
EIV
AC
QU
ISIT
ION
EF
FE
CT
SO
NF
AC
ILIT
YIN
PU
TC
HO
ICE
S
HD
Tot
alN
urs
espe
rP
atie
nts
per
Pat
ien
tspe
rE
mpl
oyee
spe
rN
urs
esT
ech
nic
ian
spa
tien
tsst
atio
ns
tech
empl
oyee
stat
ion
stat
ion
(1)
(2)
(3)
(4)
(5)
(6)
(7)
(8)
Pos
tacq
uis
itio
n−
0.02
040.
0456
∗0.
134∗
∗∗0.
0210
−0.
146∗
∗∗0.
599∗
∗∗0.
179∗
−0.
0289
(0.0
194)
(0.0
230)
(0.0
187)
(0.0
410)
(0.0
410)
(0.1
07)
(0.0
825)
(0.0
185)
Obs
erva
tion
s24
,868
24,8
6842
,944
43,0
4623
,217
24,8
6843
,046
24,8
68D
ep.v
ar.m
ean
1.54
81.
703
61.5
5418
.574
0.96
95.
129
3.99
20.
814
Un
its
log(
FT
E)
log(
FT
E)
log(
Pat
ien
ts)
log(
Sta
tion
s)—
——
—Ye
arF
EX
XX
XX
XX
XFa
cili
tyF
EX
XX
XX
XX
X
Not
es.F
acil
ity-
clu
ster
edst
anda
rder
rors
inpa
ren
thes
es.A
nob
serv
atio
nis
afa
cili
ty-y
ear.
Sam
ple
incl
ude
sfa
cili
ties
invo
lved
inan
inde
pen
den
t-to
-ch
ain
acqu
isit
ion
and
faci
liti
esth
atar
ein
depe
nde
nt
orow
ned
byth
esa
me
chai
nfo
rth
een
tire
tyof
our
sam
ple.
We
drop
obse
rvat
ion
sin
the
year
ofac
quis
itio
n.F
TE
are
full
-tim
eeq
uiv
alen
ts.∗
,∗∗ ,
and
∗∗∗
indi
cate
sign
ifica
nce
atth
e5%
,1%
,an
d0.
1%le
vels
,res
pect
ivel
y.
Dow
nloaded from https://academ
ic.oup.com/qje/article-abstract/135/1/221/5607794 by Brigham
Young University user on 03 August 2020
246 THE QUARTERLY JOURNAL OF ECONOMICS
TABLE VACQUISITION EFFECTS ON OUTCOMES
URR Hgb Hgb Hospitalized PaymentsGood Good High any cause per session
(1) (2) (3) (4) (5)
Postacquisition 0.0183∗∗∗ − 0.0266∗∗ 0.0382∗∗∗ 0.00599∗∗∗ 0.0665∗∗∗
(0.00496) (0.00825) (0.00899) (0.00170) (0.00617)
Observations 14,161,244 13,271,104 13,271,104 14,161,244 14,161,243Dep. var. mean 0.881 0.523 0.382 0.141 5.150Units percentage
pointspercentage
pointspercentage
pointspercentage
pointslog($)
Year × month FE X X X X XPat. & fac. controls X X X X XFacility FE X X X X X
Notes. Facility-clustered standard errors in parentheses. An observation is a patient-month. Hemoglobinspecifications have different observations because it is not submitted with non-ESA claims for some of oursample. Sample includes hemodialysis patients who have complete covariates and are treated at facilitiesinvolved in an independent-to-chain acquisition or that are independent or owned by the same chain forthe entirety of our sample. We drop observations within six months of the month of acquisition. Paymentsare winsorized at the 99th percentile. ∗, ∗∗ , and ∗∗∗ indicate significance at the 5%, 1%, and 0.1% levels,respectively.
by increasing both the number of patients per employee andstation.
Although these changes reduce the acquired facilities’ oper-ating costs, patients may have worse outcomes if being treatedby busier employees with less training diminishes their qualityof care. Moreover, if the number of patients per station increasesbecause the time each patient spends on a machine decreases, orbecause machines are not adequately cleaned between patients,this, too, may result in worse outcomes for patients, as shown inGrieco and McDevitt (2017).
IV.C. Patient Outcomes
The richness of our data, along with the clinical and opera-tional links between drugs and facility inputs, allows us to connectthe changes in strategy at an acquired facility to its effects on pa-tient outcomes. In this way, we can demonstrate how acquisitionsdirectly affect the quality of care received by patients and the costof this care for Medicare.
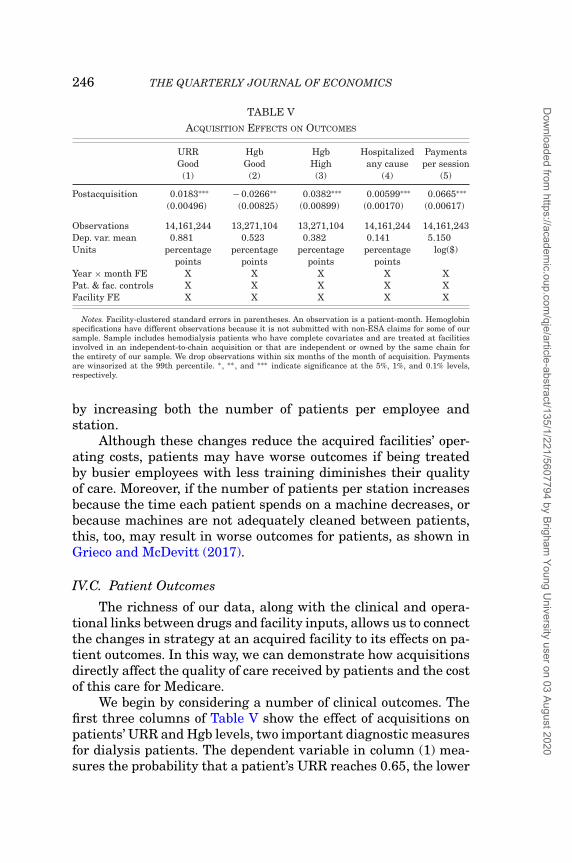
We begin by considering a number of clinical outcomes. Thefirst three columns of Table V show the effect of acquisitions onpatients’ URR and Hgb levels, two important diagnostic measuresfor dialysis patients. The dependent variable in column (1) mea-sures the probability that a patient’s URR reaches 0.65, the lower
Dow
nloaded from https://academ
ic.oup.com/qje/article-abstract/135/1/221/5607794 by Brigham
Young University user on 03 August 2020
ACQUISITIONS, FIRM PERFORMANCE, AND BEHAVIOR 247
bound of how much urea should be removed from a patient’s bloodduring a dialysis session according to accepted standards of care(see Section II.A for details). We find a 2.1% increase in the prob-ability that a patient has an adequate URR following acquisition,one of the few cases where quality improves at independent facil-ities after being acquired by a chain.
In Table V, columns (2) and (3) we examine how acquisitionsaffect patients’ management of anemia. Consistent with patients’higher doses of EPO, we find that Hgb levels at acquired facilitiesrise, with a 10.0% increase in the likelihood that patients haveHgb in excess of the recommended range and a 5.1% decrease inthe likelihood that patients have Hgb within the recommendedrange. In Online Appendix E, we expand Table V to show that theaverage Hgb level increases and the number of patients with lowHgb declines after acquisition.
Hospitalizations represent another indicator of a facility’soverall quality. Table V column (4) shows the results from esti-mating our primary specification where the dependent variableis equal to 1 if a patient was hospitalized for any reason duringthe month and 0 otherwise.30 Hospitalizations increase 4.2% af-ter acquisition, with patients becoming specifically more likelyto be hospitalized for septicemia and cardiac events (see OnlineAppendix E). For septicemia, the blood infection common amongdialysis patients, we find that patients are 10.0% more likely to behospitalized following an acquisition. Because these infections areavoidable through the proper cleaning and disinfecting of dialysismachines between patients (Patel et al. 2013), we consider the twomost likely explanations for the higher rate of infections followinga takeover to be (i) the decrease in per patient staffing levels atacquired facilities, which leave employees with less time to prop-erly clean machines between patients (Table IV, column (7)) and(ii) the relative increase in the use of lower-skilled employees whomay be less likely to follow proper cleaning and treatment proto-cols (Table IV, column (5)). Patients are also 2.1% more likely tobe hospitalized for an adverse cardiac event following acquisition,although this effect is not statistically significant (p = .298).31
Such an increase would be expected given the larger EPO doses
30. Episodes of hospitalization are assigned to the month in which they begin.31. It is worth noting that the estimate is statistically significant when we
include patient fixed effects, suggesting that unobservable patient characteristicsplay an important role in cardiac events. See Online Appendix G, Table G1.
Dow
nloaded from https://academ
ic.oup.com/qje/article-abstract/135/1/221/5607794 by Brigham
Young University user on 03 August 2020
248 THE QUARTERLY JOURNAL OF ECONOMICS
TABLE VIACQUISITION EFFECTS ON TRANSPLANTS AND MORTALITY
Waitlisted or transplantedwithin: Survives for:
365 days 730 days 365 days 730 days(1) (2) (3) (4)
Postacquisition − 0.0108∗ − 0.0188∗ − 0.0127∗∗ − 0.0174∗∗(0.00468) (0.00738) (0.00476) (0.00654)
Observations 610,955 498,056 539,487 457,184Dep. var. mean 0.127 0.208 0.746 0.597Units percentage
pointspercentage
pointspercentage
pointspercentage
pointsYear FE X X X XPat. & fac. controls X X X XFacility FE X X X X
Notes. Estimates from OLS regression. Facility-clustered standard errors in parentheses. An observation isa new dialysis patient. Sample includes new patients starting dialysis at facilities involved in an independent-to-chain acquisition or that are independent or owned by the same chain for the entirety of our sample. Forthe mortality specifications we drop any patients who start dialysis at facilities acquired within six monthsof acquisition. We only include those patients who remain at their original facility until death or the end ofthe observation window. ∗ , ∗∗ , and ∗∗∗ indicate significance at the 5%, 1%, and 0.1% levels, respectively.
received by patients post acquisition (Table III), as the principalrisk of elevated hemoglobin values (Table V) is a higher incidenceof adverse cardiovascular events.
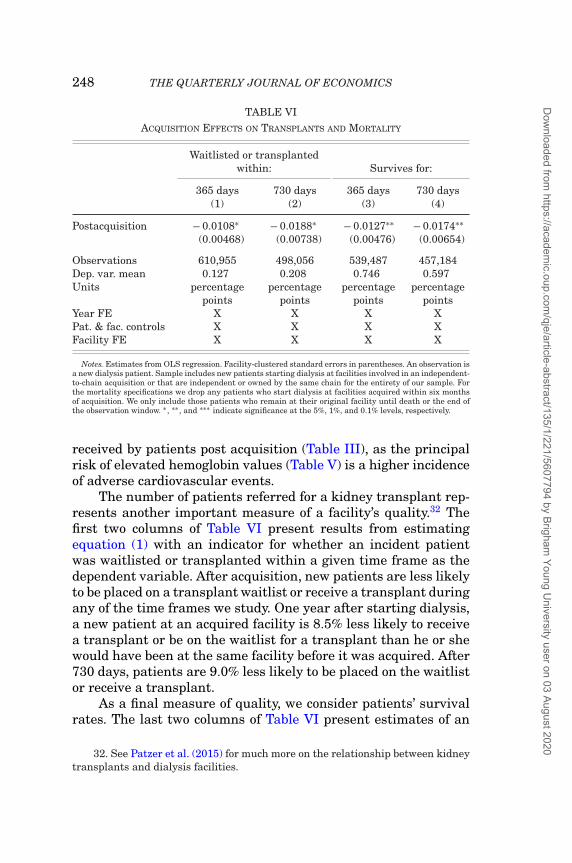
The number of patients referred for a kidney transplant rep-resents another important measure of a facility’s quality.32 Thefirst two columns of Table VI present results from estimatingequation (1) with an indicator for whether an incident patientwas waitlisted or transplanted within a given time frame as thedependent variable. After acquisition, new patients are less likelyto be placed on a transplant waitlist or receive a transplant duringany of the time frames we study. One year after starting dialysis,a new patient at an acquired facility is 8.5% less likely to receivea transplant or be on the waitlist for a transplant than he or shewould have been at the same facility before it was acquired. After730 days, patients are 9.0% less likely to be placed on the waitlistor receive a transplant.
As a final measure of quality, we consider patients’ survivalrates. The last two columns of Table VI present estimates of an
32. See Patzer et al. (2015) for much more on the relationship between kidneytransplants and dialysis facilities.
Dow
nloaded from https://academ
ic.oup.com/qje/article-abstract/135/1/221/5607794 by Brigham
Young University user on 03 August 2020
ACQUISITIONS, FIRM PERFORMANCE, AND BEHAVIOR 249
acquisition’s effect on patients’ survival rates after 365 and730 days since starting dialysis. We restrict our attention to pa-tients starting dialysis at facilities that do not change ownershipor for whom the entire observation window is before or after acqui-sition (e.g., to be included in the 365-day specification, a patientmust start dialysis more than 365 days prior to the acquisitiondate). We further restrict our attention to those patients who re-main at the same facility until their date of death or the end ofthe observation window.33 We find that patients’ 365-day survivalrate decreases by 1.27 percentage points, or 1.7%. After 730 dayspatient survival rates fall by 2.9%.
When considering the totality of our results for clinical out-comes, hospitalizations, transplants, and survival, the overarch-ing finding is that acquisitions result in worse care for patients.But providing high-quality care is costly, so it remains possiblethat these acquisitions could reduce overall spending on dialysis,making the overall impact on welfare inconclusive. We do not findevidence that acquisitions reduce Medicare expenditures in thedialysis industry, however, as the final column of Table V showsthat acquired facilities increase their per session Medicare reim-bursements by 6.9%, amounting to $252.4 million in additionalspending for Medicare throughout our sample. In short, we findthat acquisitions lead to clear changes in firm strategy that sub-stantially worsen the quality of care received by patients andincrease the cost of care borne by Medicare.
IV.D. Patient Selection
Although the results above are robust to controlling for pa-tient observables and (where feasible) patient fixed effects, wealso consider whether a facility changes its mix of patients fol-lowing an acquisition for two reasons. First, if observable patientattributes at a facility change after acquisition, it may suggestthat selection on unobservables could be biasing our results. Sec-ond, the ability of chains to selectively treat desirable patientsmay be an important strategy in and of itself, often referred to as“cream skimming.”
To conduct this analysis, we estimate a series of difference-in-differences specifications with facility and time fixed effects,
33. We have done robustness checks estimating these effects including allpatients as well as those who return to the facility within 30 or 60 days, findingsimilar results.
Dow
nloaded from https://academ
ic.oup.com/qje/article-abstract/135/1/221/5607794 by Brigham
Young University user on 03 August 2020
250 THE QUARTERLY JOURNAL OF ECONOMICS
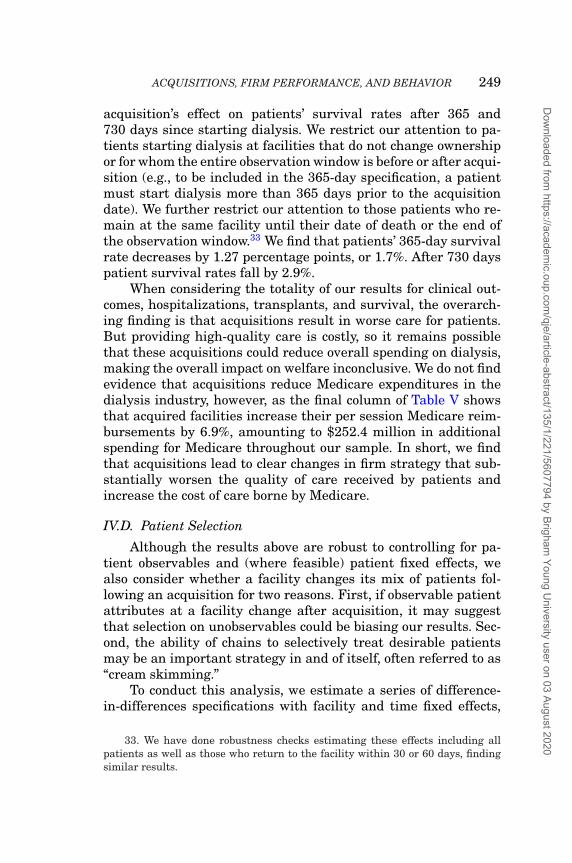
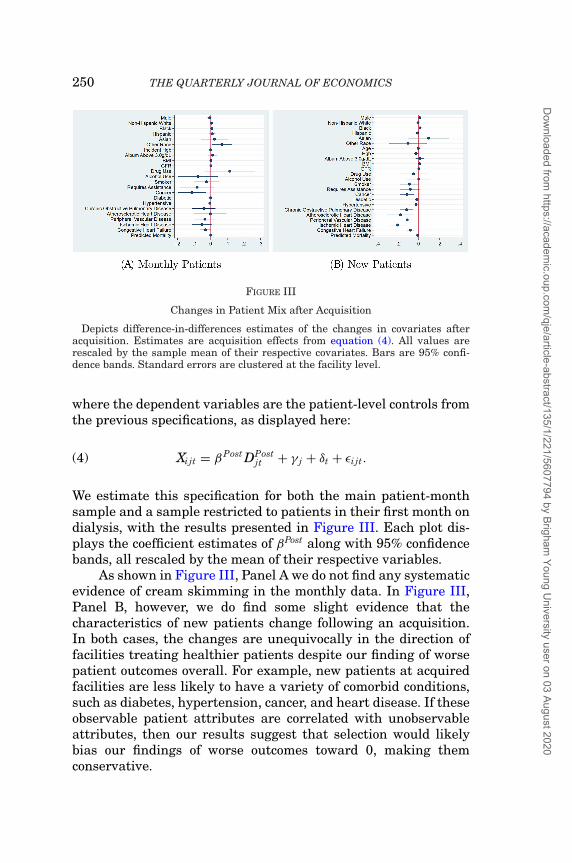
FIGURE III
Changes in Patient Mix after Acquisition
Depicts difference-in-differences estimates of the changes in covariates afteracquisition. Estimates are acquisition effects from equation (4). All values arerescaled by the sample mean of their respective covariates. Bars are 95% confi-dence bands. Standard errors are clustered at the facility level.
where the dependent variables are the patient-level controls fromthe previous specifications, as displayed here:
(4) Xijt = βPost DPostjt + γ j + δt + εi jt.
We estimate this specification for both the main patient-monthsample and a sample restricted to patients in their first month ondialysis, with the results presented in Figure III. Each plot dis-plays the coefficient estimates of βPost along with 95% confidencebands, all rescaled by the mean of their respective variables.
As shown in Figure III, Panel A we do not find any systematicevidence of cream skimming in the monthly data. In Figure III,Panel B, however, we do find some slight evidence that thecharacteristics of new patients change following an acquisition.In both cases, the changes are unequivocally in the direction offacilities treating healthier patients despite our finding of worsepatient outcomes overall. For example, new patients at acquiredfacilities are less likely to have a variety of comorbid conditions,such as diabetes, hypertension, cancer, and heart disease. If theseobservable patient attributes are correlated with unobservableattributes, then our results suggest that selection would likelybias our findings of worse outcomes toward 0, making themconservative.
Dow
nloaded from https://academ
ic.oup.com/qje/article-abstract/135/1/221/5607794 by Brigham
Young University user on 03 August 2020
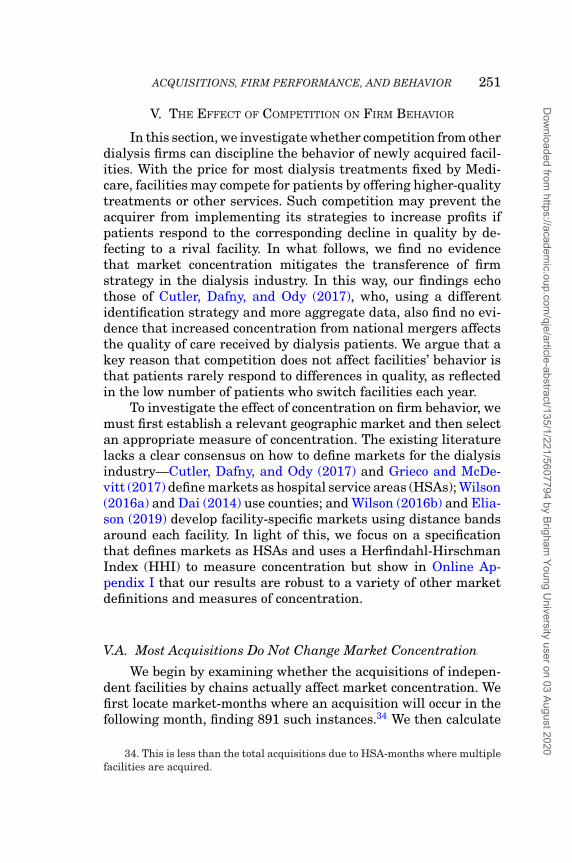
ACQUISITIONS, FIRM PERFORMANCE, AND BEHAVIOR 251
V. THE EFFECT OF COMPETITION ON FIRM BEHAVIOR
In this section, we investigate whether competition from otherdialysis firms can discipline the behavior of newly acquired facil-ities. With the price for most dialysis treatments fixed by Medi-care, facilities may compete for patients by offering higher-qualitytreatments or other services. Such competition may prevent theacquirer from implementing its strategies to increase profits ifpatients respond to the corresponding decline in quality by de-fecting to a rival facility. In what follows, we find no evidencethat market concentration mitigates the transference of firmstrategy in the dialysis industry. In this way, our findings echothose of Cutler, Dafny, and Ody (2017), who, using a differentidentification strategy and more aggregate data, also find no evi-dence that increased concentration from national mergers affectsthe quality of care received by dialysis patients. We argue that akey reason that competition does not affect facilities’ behavior isthat patients rarely respond to differences in quality, as reflectedin the low number of patients who switch facilities each year.
To investigate the effect of concentration on firm behavior, wemust first establish a relevant geographic market and then selectan appropriate measure of concentration. The existing literaturelacks a clear consensus on how to define markets for the dialysisindustry—Cutler, Dafny, and Ody (2017) and Grieco and McDe-vitt (2017) define markets as hospital service areas (HSAs); Wilson(2016a) and Dai (2014) use counties; and Wilson (2016b) and Elia-son (2019) develop facility-specific markets using distance bandsaround each facility. In light of this, we focus on a specificationthat defines markets as HSAs and uses a Herfindahl-HirschmanIndex (HHI) to measure concentration but show in Online Ap-pendix I that our results are robust to a variety of other marketdefinitions and measures of concentration.
V.A. Most Acquisitions Do Not Change Market Concentration
We begin by examining whether the acquisitions of indepen-dent facilities by chains actually affect market concentration. Wefirst locate market-months where an acquisition will occur in thefollowing month, finding 891 such instances.34 We then calculate
34. This is less than the total acquisitions due to HSA-months where multiplefacilities are acquired.
Dow
nloaded from https://academ
ic.oup.com/qje/article-abstract/135/1/221/5607794 by Brigham
Young University user on 03 August 2020
252 THE QUARTERLY JOURNAL OF ECONOMICS
FIGURE IV
Changes in Concentration across Markets
An observation is an acquisition. The horizontal axis depicts the hospital servicearea’s HHI before acquisition. The vertical axis depicts what the HSA’s HHI wouldhave been in the month before acquisition had the facility already been acquired.Opacity is reduced to 30%, so darker regions represent regions of more mass.
the HHI for that market and what the HHI would have been ifthe acquisition had already occurred.35
Figure IV shows a scatterplot of pre- and postacquisition HHIfor each HSA-month where an acquisition is about to occur (wereduced the transparency of each dot to 30% so that darker regionsimply more overlapping markets or more mass in that area). HHIincreases in only 34.4% of HSA-months following an acquisition.36
That HHI increases in so few markets following a takeoverstrongly suggests that changes in facility behavior and patientoutcomes are not driven by changes in market concentration. Tothis point, we find that our results are quantitatively very similarto those in Section IV when we restrict our sample to markets withonly one facility, meaning that the results for these markets couldnot possibly be explained by changes in concentration.37 Rather,firm strategy appears to be the main determining factor.
35. We use this as our definition of postacquisition HHI to avoid confoundingthe effect of acquisition with the entry of new dialysis facilities.
36. Note that 32.6% of markets where acquisitions occur have only one facility,denoted by the mass at (1,1) in the figure.
37. See Online Appendix I, Table I9.
Dow
nloaded from https://academ
ic.oup.com/qje/article-abstract/135/1/221/5607794 by Brigham
Young University user on 03 August 2020
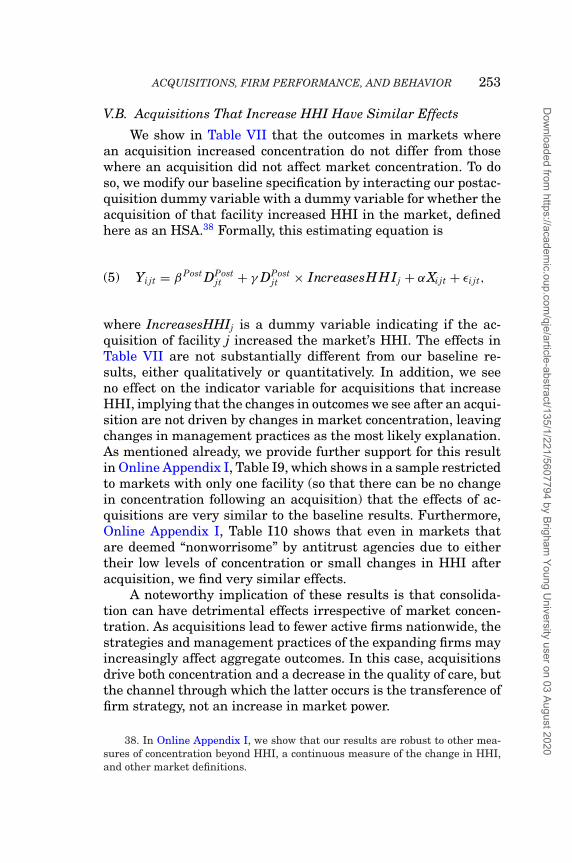
ACQUISITIONS, FIRM PERFORMANCE, AND BEHAVIOR 253
V.B. Acquisitions That Increase HHI Have Similar Effects
We show in Table VII that the outcomes in markets wherean acquisition increased concentration do not differ from thosewhere an acquisition did not affect market concentration. To doso, we modify our baseline specification by interacting our postac-quisition dummy variable with a dummy variable for whether theacquisition of that facility increased HHI in the market, definedhere as an HSA.38 Formally, this estimating equation is
(5) Yijt = βPost DPostjt + γ DPost
jt × IncreasesHHIj + αXijt + εi jt,
where IncreasesHHIj is a dummy variable indicating if the ac-quisition of facility j increased the market’s HHI. The effects inTable VII are not substantially different from our baseline re-sults, either qualitatively or quantitatively. In addition, we seeno effect on the indicator variable for acquisitions that increaseHHI, implying that the changes in outcomes we see after an acqui-sition are not driven by changes in market concentration, leavingchanges in management practices as the most likely explanation.As mentioned already, we provide further support for this resultin Online Appendix I, Table I9, which shows in a sample restrictedto markets with only one facility (so that there can be no changein concentration following an acquisition) that the effects of ac-quisitions are very similar to the baseline results. Furthermore,Online Appendix I, Table I10 shows that even in markets thatare deemed “nonworrisome” by antitrust agencies due to eithertheir low levels of concentration or small changes in HHI afteracquisition, we find very similar effects.
A noteworthy implication of these results is that consolida-tion can have detrimental effects irrespective of market concen-tration. As acquisitions lead to fewer active firms nationwide, thestrategies and management practices of the expanding firms mayincreasingly affect aggregate outcomes. In this case, acquisitionsdrive both concentration and a decrease in the quality of care, butthe channel through which the latter occurs is the transference offirm strategy, not an increase in market power.
38. In Online Appendix I, we show that our results are robust to other mea-sures of concentration beyond HHI, a continuous measure of the change in HHI,and other market definitions.
Dow
nloaded from https://academ
ic.oup.com/qje/article-abstract/135/1/221/5607794 by Brigham
Young University user on 03 August 2020
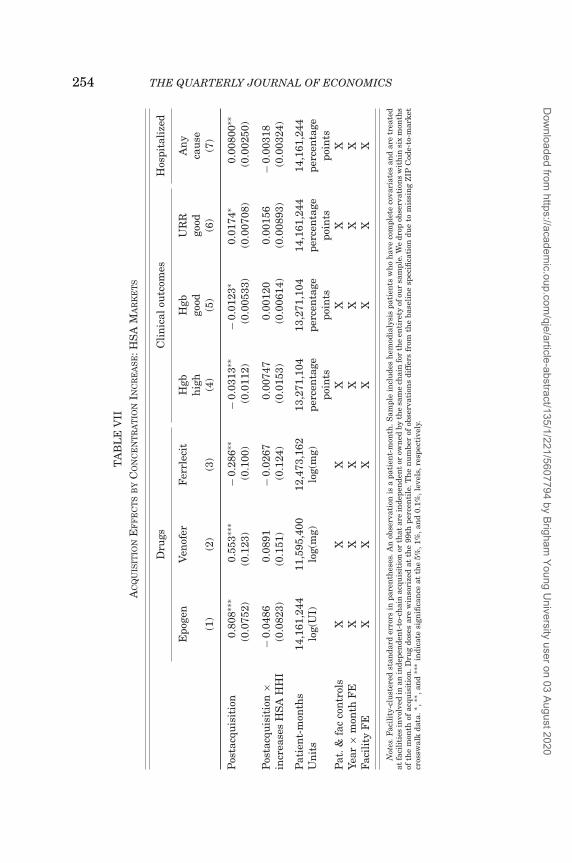
254 THE QUARTERLY JOURNAL OF ECONOMICS
TA
BL
EV
IIA
CQ
UIS
ITIO
NE
FF
EC
TS
BY
CO
NC
EN
TR
AT
ION
INC
RE
AS
E:H
SA
MA
RK
ET
S
Dru
gsC
lin
ical
outc
omes
Hos
pita
lize
d
Epo
gen
Ven
ofer
Fer
rlec
itH
gbH
gbU
RR
An
yh
igh
good
good
cau
se(1
)(2
)(3
)(4
)(5
)(6
)(7
)
Pos
tacq
uis
itio
n0.
808∗
∗∗0.
553∗
∗∗−
0.28
6∗∗
−0.
0313
∗∗−
0.01
23∗
0.01
74∗
0.00
800∗
∗(0
.075
2)(0
.123
)(0
.100
)(0
.011
2)(0
.005
33)
(0.0
0708
)(0
.002
50)
Pos
tacq
uis
itio
n×
−0.
0486
0.08
91−
0.02
670.
0074
70.
0012
00.
0015
6−
0.00
318
incr
ease
sH
SA
HH
I(0
.082
3)(0
.151
)(0
.124
)(0
.015
3)(0
.006
14)
(0.0
0893
)(0
.003
24)
Pat
ien
t-m
onth
s14
,161
,244
11,5
95,4
0012
,473
,162
13,2
71,1
0413
,271
,104
14,1
61,2
4414
,161
,244
Un
its
log(
UI)
log(
mg)
log(
mg)
perc
enta
gepo
ints
perc
enta
gepo
ints
perc
enta
gepo
ints
perc
enta
gepo
ints
Pat
.&fa
cco
ntr
ols
XX
XX
XX
XYe
ar×
mon
thF
EX
XX
XX
XX
Faci
lity
FE
XX
XX
XX
X
Not
es.F
acil
ity-
clu
ster
edst
anda
rder
rors
inpa
ren
thes
es.A
nob
serv
atio
nis
apa
tien
t-m
onth
.Sam
ple
incl
ude
sh
emod
ialy
sis
pati
ents
wh
oh
ave
com
plet
eco
vari
ates
and
are
trea
ted
atfa
cili
ties
invo
lved
inan
inde
pen
den
t-to
-ch
ain
acqu
isit
ion
orth
atar
ein
depe
nde
nt
orow
ned
byth
esa
me
chai
nfo
rth
een
tire
tyof
our
sam
ple.
We
drop
obse
rvat
ion
sw
ith
insi
xm
onth
sof
the
mon
thof
acqu
isit
ion
.Dru
gdo
ses
are
win
sori
zed
atth
e99
thpe
rcen
tile
.Th
en
um
ber
ofob
serv
atio
ns
diff
ers
from
the
base
lin
esp
ecifi
cati
ondu
eto
mis
sin
gZ
IPC
ode-
to-m
arke
tcr
ossw
alk
data
.∗,∗
∗ ,an
d∗∗
∗in
dica
tesi
gnifi
can
ceat
the
5%,1
%,a
nd
0.1%
,lev
els,
resp
ecti
vely
.
Dow
nloaded from https://academ
ic.oup.com/qje/article-abstract/135/1/221/5607794 by Brigham
Young University user on 03 August 2020
ACQUISITIONS, FIRM PERFORMANCE, AND BEHAVIOR 255
V.C. Why Competition Does Not Discipline Provider Behavior
In regulated markets, standard models of competition withendogenous provider quality predict that quality will increasewith the extent of competition in the market (e.g., Gaynor 2004and the models discussed therein). This theoretical result relieson the assumption that demand increases with product quality,which in our setting would mean that patients are more likelyto choose a high-quality facility, all else equal, and thus facili-ties would compete for patients by offering higher-quality care.In practice, patient demand in the U.S. dialysis market does notrespond to the decline in quality following an acquisition. As sug-gested in Table IV, column (7), acquired facilities actually increasethe number of patients they treat per machine despite providinglower-quality treatments.
We look more directly at this result by considering whetherpatients are more likely to switch away from a facility after it isacquired, finding that they are not. In general, it is uncommonfor dialysis patients to switch providers, with 98.4% of patient-months in our sample such that the patient visits the same facilitythe following month. For patients who have completed 12 monthsof dialysis, only 1.3% of patient-months represent a permanentswitch away from a facility.
In addition to the low absolute levels of switching among pa-tients, we show in Table VIII that patients do not become morelikely to switch after their facility is acquired. For the full sam-ple of patients, our point estimate of the effect of acquisition onswitching is −0.06 percentage points, which is small economicallyand not statistically significant at conventional levels. In addi-tion, we find that acquisitions do not have a meaningful effect onpatients’ likelihood of switching in their first year or if we onlyinclude facility switches where the patient does not return to hisor her initial facility.
A host of institutional and behavioral factors explain whypatients do not switch from low-quality providers. In many mar-kets, patients may not have a valid outside option, as one-thirdof markets in our sample have only one facility. Our findings areunchanged, however, if we repeat the analysis in Table VIII butrestrict our sample to include only markets with at least two facil-ities.39 Moreover, even patients who live in markets with multiple
39. Results available on request.
Dow
nloaded from https://academ
ic.oup.com/qje/article-abstract/135/1/221/5607794 by Brigham
Young University user on 03 August 2020
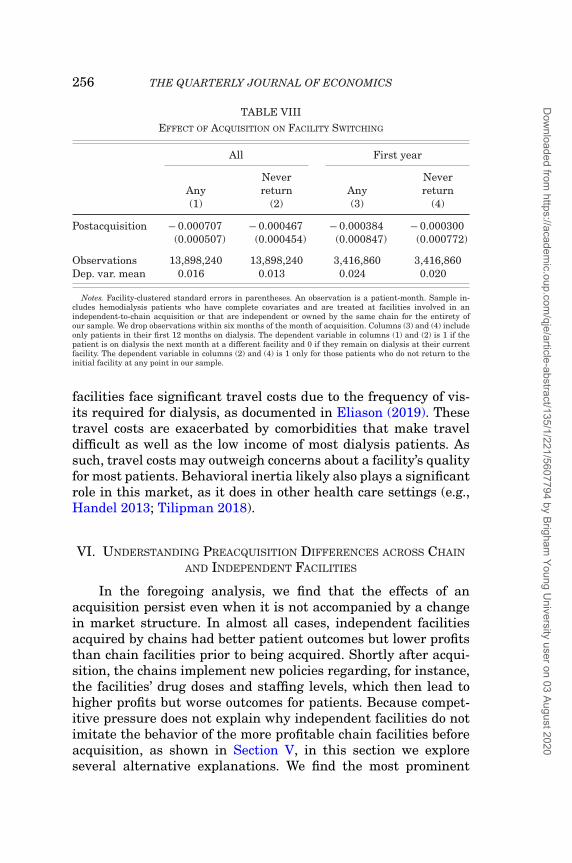
256 THE QUARTERLY JOURNAL OF ECONOMICS
TABLE VIIIEFFECT OF ACQUISITION ON FACILITY SWITCHING
All First year
AnyNeverreturn Any
Neverreturn
(1) (2) (3) (4)
Postacquisition − 0.000707 − 0.000467 − 0.000384 − 0.000300(0.000507) (0.000454) (0.000847) (0.000772)
Observations 13,898,240 13,898,240 3,416,860 3,416,860Dep. var. mean 0.016 0.013 0.024 0.020
Notes. Facility-clustered standard errors in parentheses. An observation is a patient-month. Sample in-cludes hemodialysis patients who have complete covariates and are treated at facilities involved in anindependent-to-chain acquisition or that are independent or owned by the same chain for the entirety ofour sample. We drop observations within six months of the month of acquisition. Columns (3) and (4) includeonly patients in their first 12 months on dialysis. The dependent variable in columns (1) and (2) is 1 if thepatient is on dialysis the next month at a different facility and 0 if they remain on dialysis at their currentfacility. The dependent variable in columns (2) and (4) is 1 only for those patients who do not return to theinitial facility at any point in our sample.
facilities face significant travel costs due to the frequency of vis-its required for dialysis, as documented in Eliason (2019). Thesetravel costs are exacerbated by comorbidities that make traveldifficult as well as the low income of most dialysis patients. Assuch, travel costs may outweigh concerns about a facility’s qualityfor most patients. Behavioral inertia likely also plays a significantrole in this market, as it does in other health care settings (e.g.,Handel 2013; Tilipman 2018).
VI. UNDERSTANDING PREACQUISITION DIFFERENCES ACROSS CHAIN
AND INDEPENDENT FACILITIES
In the foregoing analysis, we find that the effects of anacquisition persist even when it is not accompanied by a changein market structure. In almost all cases, independent facilitiesacquired by chains had better patient outcomes but lower profitsthan chain facilities prior to being acquired. Shortly after acqui-sition, the chains implement new policies regarding, for instance,the facilities’ drug doses and staffing levels, which then lead tohigher profits but worse outcomes for patients. Because compet-itive pressure does not explain why independent facilities do notimitate the behavior of the more profitable chain facilities beforeacquisition, as shown in Section V, in this section we exploreseveral alternative explanations. We find the most prominent
Dow
nloaded from https://academ
ic.oup.com/qje/article-abstract/135/1/221/5607794 by Brigham
Young University user on 03 August 2020
ACQUISITIONS, FIRM PERFORMANCE, AND BEHAVIOR 257
reason relates to differences in the potential trade-offs facilitiesface regarding maximizing their own profits and maintaininghigh standards of care, which stem primarily from differences ineconomies of scale for purchasing injectable drugs.
To conduct this analysis, we supplement the USRDS datawith data from HCRIS that include accounting costs for key facil-ity inputs, such as EPO, which allows us to better understand thedifferences in facilities’ costs and why some might behave differ-ently. We estimate the impact of an acquisition on total variableprofits per dialysis session and several variables related to EPOusing the following specification:
(6) Yjt = βPre DPrejt + βPost DPost
jt + βChainDChainjt + αXjt + ε jt,
where X includes state and year fixed effects. From the resultspresented in Table IX, we find no evidence that chains dispro-portionately acquire the least sophisticated or worst-performingindependent facilities to turn around, unlike in other settingswhere sharply declining financial performance prompts an own-ership change (Brav, Jiang, and Kim 2015). That is, acquired in-dependents are no less profitable than the independents that arenot acquired.40 Column (1) shows that on average, independentfacilities that are eventually acquired earned a statistically in-significant $1.36 more in variable profits per session (these ex-clude fixed costs such as rent) before acquisition compared to theomitted group, independent facilities that are never acquired. Af-ter acquisition, per session variable profits increase by $16.81(= $18.17 – $1.36) at the acquired independent facilities.41 Thissuggests that chains do not selectively acquire low-performingindependent facilities; rather, both acquired and not-acquired in-dependent facilities had similar profits prior to acquisition. Afteracquisition, the new owners then improve the financial perfor-mance of their targets, similar to what Braguinsky et al. (2015)
40. If anything, acquired independents were behaving slightly more like for-profit chains prior to acquisition with respect to EPO doses, as shown in TableIII, column (1) meaning that there were likely fewer profitable opportunities toincrease patients’ doses following acquisition.
41. The difference is $17.73 based on a specification with facility fixed effects.We focus on the specifications without facility fixed effects because they allow usto compare the preacquisition profits of acquired facilities to the profits of facilitiesthat were never acquired.
Dow
nloaded from https://academ
ic.oup.com/qje/article-abstract/135/1/221/5607794 by Brigham
Young University user on 03 August 2020
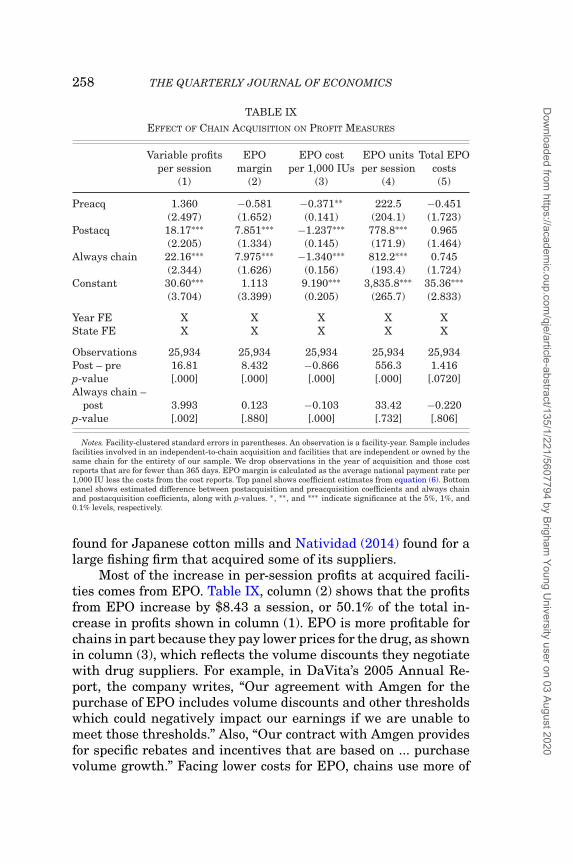
258 THE QUARTERLY JOURNAL OF ECONOMICS
TABLE IXEFFECT OF CHAIN ACQUISITION ON PROFIT MEASURES
Variable profits EPO EPO cost EPO units Total EPOper session margin per 1,000 IUs per session costs
(1) (2) (3) (4) (5)
Preacq 1.360 −0.581 −0.371∗∗ 222.5 −0.451(2.497) (1.652) (0.141) (204.1) (1.723)
Postacq 18.17∗∗∗ 7.851∗∗∗ −1.237∗∗∗ 778.8∗∗∗ 0.965(2.205) (1.334) (0.145) (171.9) (1.464)
Always chain 22.16∗∗∗ 7.975∗∗∗ −1.340∗∗∗ 812.2∗∗∗ 0.745(2.344) (1.626) (0.156) (193.4) (1.724)
Constant 30.60∗∗∗ 1.113 9.190∗∗∗ 3,835.8∗∗∗ 35.36∗∗∗(3.704) (3.399) (0.205) (265.7) (2.833)
Year FE X X X X XState FE X X X X X
Observations 25,934 25,934 25,934 25,934 25,934Post – pre 16.81 8.432 −0.866 556.3 1.416p-value [.000] [.000] [.000] [.000] [.0720]Always chain –
post 3.993 0.123 −0.103 33.42 −0.220p-value [.002] [.880] [.000] [.732] [.806]
Notes. Facility-clustered standard errors in parentheses. An observation is a facility-year. Sample includesfacilities involved in an independent-to-chain acquisition and facilities that are independent or owned by thesame chain for the entirety of our sample. We drop observations in the year of acquisition and those costreports that are for fewer than 365 days. EPO margin is calculated as the average national payment rate per1,000 IU less the costs from the cost reports. Top panel shows coefficient estimates from equation (6). Bottompanel shows estimated difference between postacquisition and preacquisition coefficients and always chainand postacquisition coefficients, along with p-values. ∗ , ∗∗ , and ∗∗∗ indicate significance at the 5%, 1%, and0.1% levels, respectively.
found for Japanese cotton mills and Natividad (2014) found for alarge fishing firm that acquired some of its suppliers.
Most of the increase in per-session profits at acquired facili-ties comes from EPO. Table IX, column (2) shows that the profitsfrom EPO increase by $8.43 a session, or 50.1% of the total in-crease in profits shown in column (1). EPO is more profitable forchains in part because they pay lower prices for the drug, as shownin column (3), which reflects the volume discounts they negotiatewith drug suppliers. For example, in DaVita’s 2005 Annual Re-port, the company writes, “Our agreement with Amgen for thepurchase of EPO includes volume discounts and other thresholdswhich could negatively impact our earnings if we are unable tomeet those thresholds.” Also, “Our contract with Amgen providesfor specific rebates and incentives that are based on ... purchasevolume growth.” Facing lower costs for EPO, chains use more of
Dow
nloaded from https://academ
ic.oup.com/qje/article-abstract/135/1/221/5607794 by Brigham
Young University user on 03 August 2020
ACQUISITIONS, FIRM PERFORMANCE, AND BEHAVIOR 259
it, as shown in column (4), so total EPO expenditures differ littleafter acquisition, as shown in column (5).
The scale economies stemming from buyer power are notavailable to smaller independent facilities, and this is a key rea-son their behavior differs from chains’ prior to acquisition. If inde-pendent providers treated patients with the same doses that thelargest chains do, they would earn only 55% of the profits due totheir higher wholesale costs for EPO.42 If providers balance thefinancial gains of giving patients larger EPO doses against therisks and nonpecuniary costs of doing so, such as an elevated riskof cardiac events for patients, this difference in per unit costs maylead chains to administer more EPO to their patients. That is,these cost differences may induce different dosing strategies evenif chains and independents are both seeking to maximize theirprofits.43
Another possible explanation for why independent and chainfacilities behave differently is that chains may have different un-derlying objectives, perhaps focusing more on financial perfor-mance than on patient outcomes. One way to proxy for the incen-tives that a firm faces is its for-profit status. Because the largestchains are for-profit firms and many independent facilities arenonprofit, the change in for-profit status following an acquisitionmay explain the changes in behavior and outcomes rather than thechange in ownership itself. A related argument is made by Eaton,Howell, and Yannelis (2018), who show that the high-powered in-centives introduced by private equity owners following takeoversin higher education lead to better financial performance but worsestudent outcomes. We explore this possibility in Online AppendixH, finding in Tables H1 and H2 that the postacquisition changesacross most of our measures are largely the same for all acquiredindependent facilities, regardless of whether they were previouslynonprofit or for-profit. There are a few notable exceptions to this:the effects of acquisition on EPO and Venofer doses, as well asthe use of technicians, are all smaller in the case of for-profit in-dependent facilities. The effect is diminished primarily because
42. This assumes that Medicare reimburses $10 per 1,000 IUs of EPO, whichis a close approximation of the actual rate during the study period: 10−(9.19−0.37)
10−(9.19−1.34) =0.5488.
43. The result that newly acquired independents benefit from chain-leveleconomies of scale contrasts somewhat with the results of Blonigen and Pierce(2016), who find little evidence of merger efficiencies in U.S. manufacturing.
Dow
nloaded from https://academ
ic.oup.com/qje/article-abstract/135/1/221/5607794 by Brigham
Young University user on 03 August 2020
260 THE QUARTERLY JOURNAL OF ECONOMICS
for-profit independent facilities were already behaving more likechains along these dimensions before they were acquired, sug-gesting that changes in for-profit status may account for someportion of our results. At the same time, these differences are rel-atively small, suggesting that the effects arising from a changein for-profit status are secondary to the effects from a change inownership.44
In addition, chains’ behavior might seem risky given the po-tential negative effects on patient care resulting from excessivedrug doses or low staffing levels. Chains may be more willing thanindependent facilities to accept this risk if they have large finan-cial reserves to pay for any future litigation, allowing them tobehave in ways that increase their profits even if it makes it morelikely they will face malpractice lawsuits. Perhaps reflecting this,DaVita has made at least four settlements exceeding $100 millionin the past 10 years.
Other possible explanations for the differences in behaviorbetween independent and chain facilities lack empirical support.For example, we showed in Section IV.D that chain and inde-pendent facilities treat a very similar distribution of patients, soit is unlikely that a change in patient mix following a takeoveralters a target’s behavior. Another possible explanation is thatchains may be subject to different regulations than independentfacilities, but both types of facilities face the same regulatory envi-ronment, such as Medicare reimbursement rates and certificationstandards. Given the lack of support for these alternative expla-nations, we conclude that a leading explanation for why indepen-dent facilities do not employ the same strategies as chains is thatthey face different trade-offs when balancing profits and patientcare, the majority of which arise from differences in economies ofscale.
VII. CONCLUSION
Changes in ownership affect the treatment and outcomesof patients at independent dialysis facilities acquired by chains.Our results show that acquired facilities change their behavior inthree broad ways, each of which either increases their revenue ordecreases their operating costs. First, acquired facilities capture
44. These results are in line with those of Duggan (2000), who finds evidencethat nonprofit hospitals are no more altruistic than for-profit ones.
Dow
nloaded from https://academ
ic.oup.com/qje/article-abstract/135/1/221/5607794 by Brigham
Young University user on 03 August 2020
ACQUISITIONS, FIRM PERFORMANCE, AND BEHAVIOR 261
higher per session reimbursements from Medicare by increasingdrug doses and shifting to more lucrative drugs. Second, acquiredfacilities stretch their resources by treating more patients relativeto the number of staff and stations at the facility. Third, acquiredfacilities reduce their costs of providing dialysis by replacing high-skill nurses with lower-skill technicians.
Adopting the acquirer’s strategies causes the acquired facil-ity’s quality of care to decline. Along almost every dimension wemeasure, patients fare worse at the target facility after acqui-sition, most prominently in terms of fewer kidney transplants,more hospitalizations, and lower survival rates. Because Medi-care spends more after acquired facilities implement their strate-gic changes, we interpret the diminished quality to represent anunambiguous decline in the overall value of dialysis treatments,at least in the short run.45 More research is needed to understandthe implications for total welfare, because these acquisitions maypromote access to dialysis in underserved markets.
Our findings have important policy implications, as most ofthe acquisitions we study fall outside the scope of current antitrustlaws, which prohibit acquisitions if “the effect of such acquisitionmay be substantially to lessen competition, or to tend to create amonopoly” (U.S. Department of Justice and Federal Trade Com-mission 2010). To the extent that the diffusion of firm strategy,rather than a change in market concentration, causes the qual-ity of dialysis care to decline, minor adjustments to the currentantitrust statutes may do little to prevent the harmful effects ofthese acquisitions.
One policy prescription would be to avoid enacting regula-tions that could unintentionally spur consolidation, such as cer-tificate of need laws that make new entry more difficult for ex-panding health care providers and lead them to favor acquisitionsinstead (Pozniak et al. 2010). Others have raised concerns that
45. A possible benefit from the cost-cutting strategies of chains is that theymay be eventually incorporated into the reimbursement rate, resulting in lowercosts for Medicare. Although we cannot rule out this possibility because we donot observe the counterfactual reimbursement rate, this effect seems likely to besmall. Over the period of our study, the dialysis reimbursement rate rose steadily.Furthermore, when Medicare combined payments for injectable drugs and dialysisinto a single prospective payment in 2011, the new payment rate was designed tobe approximately budget neutral, based on historic EPO usage. Thus, the high useof EPO by chains resulted in higher prospective payments for all providers after2011.
Dow
nloaded from https://academ
ic.oup.com/qje/article-abstract/135/1/221/5607794 by Brigham
Young University user on 03 August 2020
262 THE QUARTERLY JOURNAL OF ECONOMICS
policies that increase the administrative burdens for facilitiesmay inadvertently increase consolidation (Gaynor 2018), alongwith certain aspects of Medicare’s reimbursement policies. By ty-ing each firm’s reimbursements to the costs of comparable firms,regulators encourage cost minimization through “yardstick com-petition” (Shleifer 1985), which may increase the pressure to con-solidate if greater economies of scale are necessary to decreasecosts and maintain high profit margins. Similarly, the uniformfee-for-service reimbursement policy for injectable drugs may alsocontribute to consolidation, as it favors large firms that can nego-tiate lower prices for drugs. Although each of these policies likelyhas beneficial aspects, their tendency to drive consolidation shouldnevertheless be viewed as a trade-off against those benefits.
Our results also illustrate the importance of well-designedpayment systems in controlling health care costs and improvingpatient outcomes. As we show in the case of EPO, poorly struc-tured reimbursement schemes can induce provider behavior thatnot only wastes resources but also harms patients. By improvingthe design of Medicare’s payment systems, policy makers can si-multaneously reduce costs and improve outcomes. Some changesin this direction have already occurred. In 2011, for example,Medicare bundled payments for dialysis treatments and their as-sociated injectable drugs into a single Prospective Payment Sys-tem, which effectively reduced providers’ financial incentives tooveruse EPO. To address the resulting incentive to use too lit-tle EPO, the Quality Incentive Program initiated in 2012 allowsMedicare to penalize providers that fail to meet certain qualitystandards: providers with too many patients below the benchmarkfor Hgb levels, for example, could lose up to 2% of their entire reim-bursement from Medicare. Although these changes would seem toimprove facilities’ incentives for providing high-quality and cost-effective care, more research is needed to understand how theyhave changed the industry and affected patients (Eliason et al.2019a).
Finally, because dialysis is a market in which the govern-ment, via Medicare, plays an outsize role in subsidizing care andin which patients may find it difficult to observe their facilities’quality, competition may be unlikely to discipline providers’ be-havior. Our findings are therefore likely to be applicable to sim-ilar settings in other areas of health care or higher education.Indeed, Eaton, Howell, and Yannelis (2018) show that private eq-uity buyouts in higher education lead to higher tuition and per
Dow
nloaded from https://academ
ic.oup.com/qje/article-abstract/135/1/221/5607794 by Brigham
Young University user on 03 August 2020
ACQUISITIONS, FIRM PERFORMANCE, AND BEHAVIOR 263
student debt while resulting in lower graduation rates, loan re-payment rates, and earnings among graduates. Complementingthis result, Bernstein and Sheen (2016) find that private equitybuyouts of restaurants lead to better health safety ratings, ar-guably a very visible measure of quality for consumers. As such,future work should consider how the effects of acquisitions differin markets characterized by extensive government intervention,such as health care and education, compared to those without it,such as restaurants, as well as how these effects differ dependingon how well patients or consumers can observe quality.
BRIGHAM YOUNG UNIVERSITY
DUKE UNIVERSITY
FUQUA SCHOOL OF BUSINESS, DUKE UNIVERSITY
DUKE UNIVERSITY AND NATIONAL BUREAU OF ECONOMIC RESEARCH
SUPPLEMENTARY MATERIAL
An Online Appendix for this article can be found at The Quar-terly Journal of Economics online. Code replicating tables and fig-ures in this article can be found in Eliason et al. (2019b), in theHarvard Dataverse, doi:10.7910/DVN/RPOREE.
REFERENCES
Baker, Sam, “The U.S. Health Care System Is Full of Monopolies,”Axios (2019, June 10), https://www.axios.com/health-care-costs-monopolies-competition-hospitals-9839f396-c95d-4792-b106-663a727ef1f4.html.
Berenson, Alex, and Andrew Pollack, “Doctors Reap Millions for AnemiaDrugs,” New York Times (2007, May 9), https://www.nytimes.com/2007/05/09/business/09anemia.html.
Bernstein, Shai, and Albert Sheen, “The Operational Consequences of PrivateEquity Buyouts: Evidence from the Restaurant Industry,” Review of FinancialStudies, 29 (2016), 2387–2418.
Besarab, Anatole, W. Kline Bolton, Jeffrey K. Browne, Joan C. Egrie, Allen R.Nissenson, Douglas M. Okamoto, Steve J. Schwab, and David A. Goodkin,“The Effects of Normal as Compared with Low Hematocrit Values in Patientswith Cardiac Disease Who Are Receiving Hemodialysis and Epoetin,” NewEngland Journal of Medicine, 339 (1998), 584–590.
Blonigen, Bruce A., and Justin R. Pierce, “Evidence for the Effects of Mergers onMarket Power and Efficiency,” NBER Working Paper no. 22750, 2016.
Bloom, Nicholas, Carol Propper, Stephan Seiler, and John Van Reenen, “The Im-pact of Competition on Management Quality: Evidence from Public Hospitals,”Review of Economic Studies, 82 (2015), 457–489.
Boyd, Roddy, “DaVita Inc.: Warren and Charlie’s Excellent Insurance Gam-bit,” Southern Investigative Reporting Foundation: The Investigator (2017,September 22), http://sirf-online.org/2017/09/22/davita-inc-warren-and-charlies-excellent-insurance-gambit/.
Dow
nloaded from https://academ
ic.oup.com/qje/article-abstract/135/1/221/5607794 by Brigham
Young University user on 03 August 2020
264 THE QUARTERLY JOURNAL OF ECONOMICS
Braguinsky, Serguey, Atsushi Ohyama, Tetsuji Okazaki, and Chad Syverson, “Ac-quisitions, Productivity, and Profitability: Evidence from the Japanese CottonSpinning Industry,” American Economic Review, 105 (2015), 2086–2119.
Brav, Alon, Wei Jiang, and Hyunseob Kim, “The Real Effects of Hedge FundActivism: Productivity, Asset Allocation, and Labor Outcomes,” Review of Fi-nancial Studies, 28 (2015), 2723–2769.
Brookhart, Alan, Brian D. Bradbury, Jerry Avorn, Sebastian Schneeweiss, andWolfgang C. Winkelmayer, “The Effect of Altitude Change on Anemia Treat-ment Response in Hemodialysis Patients,” American Journal of Epidemiology,173 (2011), 768–777.
Brookhart, M. Alan, Sebastian Schneeweiss, Jerry Avorn, Brian D. Bradbury, JunLiu, and Wolfgang C. Winkelmayer, “Comparative Mortality Risk of AnemiaManagement Practices in Incident Hemodialysis Patients,” Journal of theAmerican Medical Association, 303 (2010), 857–864.
Capps, Cory S., “The Quality Effects of Hospital Mergers,” Department of Justice,Economic Analysis Group Discussion Paper 05, 2005.
Capps, Corey S., David Dranove, and Christopher Ody, “Physician Practice Consol-idation Driven by Small Acquisitions, so Antitrust Agencies Have Few Toolsto Intervene,” Health Affairs, 36 (2017), 1556–1563.
Cuellar, Alison E., and Paul J. Gertler, “Strategic Integration of Hospitals andPhysicians,” Journal of Health Economics, 25 (2006), 1–28.
Cutler, David, Leemore Dafny, and Christopher Ody, “How Does CompetitionImpact the Quality of Price of Outpatient Service Facilities? A Case Study ofthe U.S. Dialysis Industry,” Harvard Business School Working Paper, 2017.
Dafny, Leemore, “Estimation and Identification of Merger Effects: An Applicationto Hospital Mergers,” Journal of Law and Economics, 52 (2009), 523–550.
Dafny, Leemore, Mark Duggan, and Subramaniam Ramanarayanan, “Paying aPremium on Your Premium? Consolidation in the US Health Insurance In-dustry,” American Economic Review, 102 (2012), 1161–1185.
Dafny, Leemore, Kate Ho, and Robin Lee, “The Price Effects of Cross-MarketMergers: Theory and Evidence from the Hospital Industry,” RAND Journal ofEconomics, 50 (2019), 286–325.
Dai, Mian, “Product Choice under Price Regulation: Evidence from Out-PatientDialysis Markets,” International Journal of Industrial Organization, 32(2014), 24–32.
Dai, Mian, and Xun Tang, “Regulation and Capacity Competition in Health Care:Evidence from US Dialysis Markets,” Review of Economics and Statistics, 97(2015), 965–982.
DaVita, “2004 10-K form,” retrieved from http://investors.davita.com/financial-information/financial-reports (2005).
Duggan, Mark G., “Hospital Ownership and Public Medical Spending,” QuarterlyJournal of Economics, 115 (2000), 1343–1373.
Dunn, Ben, “Private Equity’s Impact on Medical Product Outsourcing,” MedicalProduct Outsourcing Magazine (2016, June 16), https://www.mpo-mag.com/issues/2016-06-01/view_columns/private-equitys-impact-on-medical-product-outsourcing.
Eaton, Charlie, Sabrina Howell, and Constantine Yannelis, “When Investor Incen-tives and Consumer Interests Diverge: Private Equity in Higher Education,”NYU Stern Working Paper, 2018.
Eliason, Paul, “Market Power and Quality: Congestion and Spatial Competitionin the Dialysis Industry,” Brigham Young University Working Paper, 2019.
Eliason, Paul, Benjamin Heebsh, Ryan C. McDevitt, and James W. Roberts, “TheEffect of Medicare Reimbursement Incentives on Patient Outcomes: Evidencefrom the Dialysis Industry,” Duke University Working Paper, 2019a.
Eliason, Paul J., Benjamin Heebsh, Ryan C. McDevitt, and James W. Roberts,“Replication Data for: ‘How Acquisitions Affect Firm Behavior and Perfor-mance: Evidence from the Dialysis Industry’,” (2019b), Harvard Dataverse,doi: 10.7910/DVN/RPOREE.
Dow
nloaded from https://academ
ic.oup.com/qje/article-abstract/135/1/221/5607794 by Brigham
Young University user on 03 August 2020
ACQUISITIONS, FIRM PERFORMANCE, AND BEHAVIOR 265
Fields, Robin, “God Help You. You’re on Dialysis,” The Atlantic (2010, December),https://www.theatlantic.com/magazine/archive/2010/12/-god-help-you-youre-on-dialysis/308308/.
Garg, Pushkal P., Kevin D. Frick, Marie Diener-West, and Neil R. Powe, “Effectof the Ownership of Dialysis Facilities on Patients’ Survival and Referralfor Transplantation,” New England Journal of Medicine, 341 (1999), 1653–1660.
Gaynor, Martin, “Quality and Competition in Health Care Markets: What Do WeKnow? What Don’t We Know?,” Economie Publique, 15 (2004), 87–124.
———, “Examining the Impact of Health Care Consolidation,” Statement before theU.S. House of Representatives Committee on Energy and Commerce Oversightand Investigations (2018).
Gaynor, Martin, Kate Ho, and Robert J. Town, “The Industrial Organization ofHealth-Care Markets,” Journal of Economic Literature, 53 (2015), 235–284.
Gaynor, Martin, Nirav Mehta, and Seth Richards-Shubik, “Optimal Contractingwith Altruistic Agents: A Structural Model of Medicare Reimbursements forDialysis Drugs,” Working Paper, 2018.
Gaynor, Martin, Rodrigo Moreno-Serra, and Carol Propper, “Death by MarketPower: Reform, Competition and Patient Outcomes in the National HealthService,” American Economic Journal: Economic Policy, 5 (2013), 134–166.
Gaynor, Martin, and Robert J. Town, “ Competition in Health Care Markets,” inHandbook of Health Economics, (Amsterdam: Elsevier North-Holland, 2012).
Gowrisankaran, Gautam, Aviv Nevo, and Robert Town, “Mergers When PricesAre Negotiated: Evidence from the Hospital Industry,” American EconomicReview, 105 (2015), 172–203.
Grieco, Paul, and Ryan C. McDevitt, “Productivity and Quality in Health Care:Evidence from the Dialysis Industry,” Review of Economic Studies, 84 (2017),1071–1105.
Handel, Benjamin R., “Adverse Selection and Inertia in Health Insurance Mar-kets: When Nudging Hurts,” American Economic Review, 103 (2013), 2643–2682.
Hayford, Tamara B., “The Impact of Hospital Mergers on Treatment Intensity andHealth Outcomes,” Health Services Research, 47 (2012), 1008–1029.
Ho, Vivian, and Barton H. Hamilton, “Hospital Mergers and Acquisitions: DoesMarket Consolidation Harm Patients?,” Journal of Health Economics, 19(2000), 767–791.
Kessler, Daniel P., and Mark B. McClellan, “Is Hospital Competition SociallyWasteful?,” Quarterly Journal of Economics, 115 (2000), 577–615.
Kocourek, Paul, Steven Y. Chung, and Matthew McKenna, “Strategic Rollups:Overhauling the Multi-Merger Machine,” Strategy+Business (2000, April 1),https://www.strategy-business.com/article/16858?gko=88355.
Kosch, Markus, Udo Bahner, Helga Bettger, Fritz Matzkies, Markus Teschner,and Roland M. Schaefer, “A Randomized, Controlled Parallel-Group Trial onEfficacy and Safety of Iron Sucrose (Venofer) vs Iron Gluconate (Ferrlecit) inHaemodialysis Patients Treated with rHuEpo,” Nephrology Dialysis Trans-plantation, 16 (2001), 1239–1244.
Manns, Braden J., and Marcello Tonelli, “The New FDA Labeling for ESA—Implications for Patients and Providers,” Clinical Journal of the AmericanSociety of Nephrology, 2 (2012), 348–353.
Matthews, Dylan, “John Oliver Targets Dialysis, a Procedure that’s Exhausting,Deadly, and Very Profitable,” Vox (2017, May 15), https://www.vox.com/policy-and-politics/2017/5/15/15641064/john-oliver-kidney-transplant-dialysis-davita.
Natividad, Gabriel, “Integration and Productivity: Satellite-Tracked Evidence,”Management Science, 60 (2014), 1698–1718.
NIH, “Hemodialysis Dose and Adequacys,” Technical Report 09-4556, NationalKidney and Urologic Diseases Information Clearninghouse, National In-stitutes of Health, Bethesda, MD (2009), https://www.niddk.nih.gov/health-information/kidney-disease/kidney-failure/hemodialysis/dose-adequacy.
Dow
nloaded from https://academ
ic.oup.com/qje/article-abstract/135/1/221/5607794 by Brigham
Young University user on 03 August 2020
266 THE QUARTERLY JOURNAL OF ECONOMICS
Oliver, John, “Dialysis,” Last Week Tonight with John Oliver (2017, May 15), HBO,New York City, https://www.youtube.com/watch?v=yw_nqzVfxFQ.
OPTN Minority Affairs Committee, “Educational Guidance on Patient Referralto Kidney Tranplantation,” Technical Report, Organ Procurement and Trans-plantation Network, 2015.
Owen, William F., Nancy L. Lew, Yan Liu, Edmund G. Lowrie, and J. MichaelLazarus, “The Urea Reduction Ratio and Serum Albumin Concentration asPredictors of Mortality in Patients Undergoing Hemodialysis,” New EnglandJournal of Medicine, 329 (1993), 1001–1006.
Patel, Priti R., H. Yi Sarah, Stephanie Booth, Virginia Bren, Gemma Downham,Sally Hess, Karen Kelley, Mary Lincoln, Kathy Morrissette, and Curt Lind-berg et al., “Bloodstream Infection Rates in Outpatient Hemodialysis FacilitiesParticipating in a Collaborative Prevention Effort: A Quality ImprovementReport,” American Journal of Kidney Diseases, 62 (2013), 322–330.
Patzer, Rachel E., Laura C. Plantinga, Sudeshna Paul, Jennifer Gander, JennaKrisher, Leighann Sauls, Eric M. Gibney, Laura Mulloy, and Stephen O.Pastan, “Variation in Dialysis Facility Referral for Kidney Transplantationamong Patients with End-Stage Renal Disease in Georgia,” Journal of theAmerican Medical Association, 314 (2015), 582–594.
Pollack, Andrew, “Lawsuit Says Drugs Were Wasted to Buoy Profit,” NewYork Times (2011, July 25), https://www.nytimes.com/2011/07/26/health/26dialysis.html.
Pozniak, Alyssa S., Richard A. Hirth, Jane Banaszak-Holl, and John R. C. Wheeler,“Predictors of Chain Acquisition among Independent Dialysis Facilities,”Health Services Research, 45 (2010), 476–496.
Ramanarayanan, Subbu, and Jason Snyder, “Information Disclosure and FirmPerformance: Evidence from the Dialysis Industry,” UCLA Working Paper,2014.
Schrier, Robert W., and Wei Wang, “Acute Renal Failure and Sepsis,” New EnglandJournal of Medicine, 351 (2004), 159–169.
Seeking Alpha, “Solar3D: Profitable Solar Roll-Up Poised for a Breakout2016,” (2015), https://seekingalpha.com/article/3769376-solar3d-profitable-solar-roll-poised-breakout-2016.
Shleifer, Andrei, “A Theory of Yardstick Competition,” Rand Journal of Economics,16 (1985), 319–328.
Singh, Ajay K., Lynda Szczech, Kezhen L. Tang, Huiman Barnhart, Shelly Sapp,Marsha Wolfson, and Donal Reddan, “Correction of Anemia with Epoeitin Alfain Chronic Kidney Disease,” New England Journal of Medicine, 355 (2006),2085–2098.
Stempel, Jonathan, “DaVita to Pay $450 Million in Medicare Fraud Lawsuit overWasted Drugs,” Reuters (2015, May 4).
Stevens, Lesley A., Josef Coresh, Tom Greene, and Andrew S. Levey, “Assess-ing Kidney Function—Measured and Estimated Glomerular Filtration Rate,”New England Journal of Medicine, 354 (2006), 2473–2483.
Thamer, Mae, Yi Zhang, James Kaufman, Dennis Cotter, Fan Dong, and Miguel A.Hernan, “Dialysis Facility Ownership and Epoetin Dosing in Patients Receiv-ing Hemodialysis,” Journal of the American Medical Association, 297 (2007),1667–1674.
The Economist, “Serial Thrillers: Roll-ups,” The Economist (2015, December 19),https://www.economist.com/business/2015/12/19/serial-thrillers.
Tilipman, Nicholas, “Cadillac Tax, Narrow Networks, and Consumer Welfare,”University of Illinois at Chicago Working Paper, 2018.
United States Renal Data System, “USRDS 2013 Annual Data Report: Atlas ofChronic Kidney Disease and End-Stage Renal Disease in the United States,”National Institutes of Health, National Institute of Diabetes and Digestiveand Kidney Diseases (2013).
———, “2014 USRDS Annual Data Report: Epidemiology of Kidney Disease in theUnited States.” National Institutes of Health, National Institute of Diabetesand Digestive and Kidney Diseases (2014).
Dow
nloaded from https://academ
ic.oup.com/qje/article-abstract/135/1/221/5607794 by Brigham
Young University user on 03 August 2020
ACQUISITIONS, FIRM PERFORMANCE, AND BEHAVIOR 267
U.S. Department of Justice and Federal Trade Commission, “HorizontalMerger Guidelines,” 2010, https://www.ftc.gov/sites/default/files/attachments/merger-review/100819hmg.pdf.
U.S. Government Accountability Office, “Medicare Part B Drug Spending,” Publi-cation No. GAO-13-46R, 2012, https://www.gao.gov/assets/650/649459.pdf.
Whoriskey, Peter, “Anemia Drug Made Billions, but at What Cost,” WashingtonPost (2012, July 19).
Wilson, Nathan E., “For-Profit Status and Industry Evolution in Health Care Mar-kets: Evidence from the Dialysis Industry,” International Journal of HealthEconomics and Management, 16 (2016a), 297–319.
———, “Market Structure as a Determinant of Patient Care Quality,” AmericanJournal of Health Economics, 2 (2016b), 241–271.
Wollmann, Thomas G., “Stealth Consolidation: Evidence from an Amendment tothe Hart-Scott-Rodino Act,” American Economic Review: Insights, 1 (2019),77–94.
Zhang, Yi, Dennis J. Cotter, and Mae Thamer, “The Effect of Dialysis Chains onMortality among Patients Receiving Hemodialysis,” Health Services Research,46 (2011), 747–767.
Zhang, Yi, Mae Thamer, Onkar Kshirsagar, Dennis J. Cotter, and Mark J.Schlesinger, “Dialysis Chains and Placement on the Waiting List for a Ca-daveric Kidney Transplant,” Transplantation, 98 (2014), 543–551.
Dow
nloaded from https://academ
ic.oup.com/qje/article-abstract/135/1/221/5607794 by Brigham
Young University user on 03 August 2020