Embed Size (px)
Citation preview
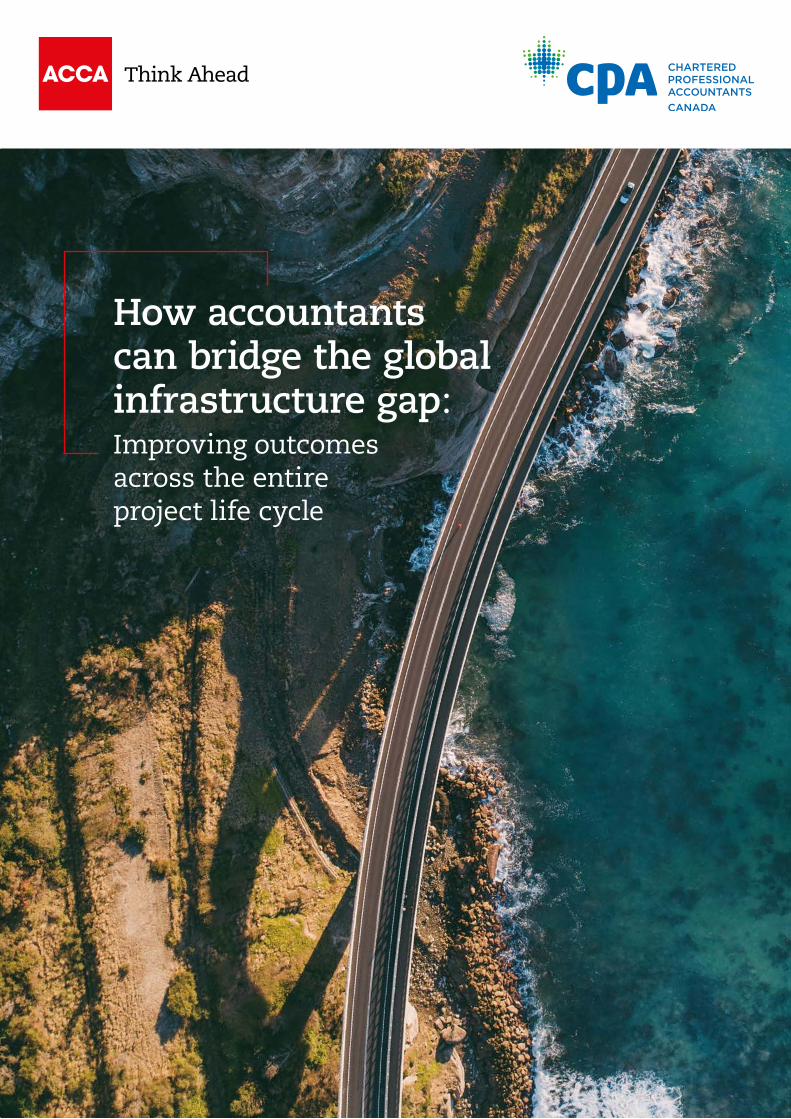
How accountants can bridge the globalinfrastructure gap
Improving outcomes across the entire project life cycle
About ACCA ACCA (the Association of Chartered Certified Accountants) is the global body for professional accountants offering business-relevant first-choice qualifications to people of application ability and ambition around the world who seek a rewarding career in accountancy finance and management
ACCA supports its 208000 members and 503000 students in 179 countries helping them to develop successful careers in accounting and business with the skills required by employers ACCA works through a network of 104 offices and centres and more than 7300 Approved Employers worldwide who provide high standards of employee learning and development Through its public interest remit ACCA promotes appropriate regulation of accounting and conducts relevant research to ensure accountancy continues to grow in reputation and influence
ACCA is currently introducing major innovations to its flagship qualification to ensure its members and future members continue to be the most valued up to date and sought-after accountancy professionals globally
Founded in 1904 ACCA has consistently held unique core values opportunity diversity innovation integrity and accountability
More information is here wwwaccaglobalcom
About CPA Canada
Chartered Professional Accountants of Canada (CPA Canada) is one of the largest national accounting organizations in the world representing more than 210000 members Domestically CPA Canada works cooperatively with the regional CPA bodies who are charged with regulating the profession
Globally it works together with the International Federation of Accountants and the Global Accounting Alliance to build a stronger accounting profession worldwide CPA Canada created through the unification of three legacy accounting designations is a respected voice in the business government education and non-profit sectors and champions sustainable economic growth and social development
The unified organization is celebrating five years of serving the profession advocating for the public interest and supporting the setting of accounting auditing and assurance standards CPA Canada develops leading-edge thought leadership research guidance and educational programs to ensure its members are equipped to drive success and shape the future
More information is here wwwcpacanadaca
Copyright copy 2019 Association of Chartered Certified Accountants and Chartered Professional Accountants of Canada
All rights reserved This publication is protected by copyright and written permission is required to reproduce store in a retrieval system or transmit in any form or by any means (electronic mechanical photocopying recording or otherwise)
For information regarding permission please contact permissionscpacanadaca insightsaccaglobalcom
March 2019
How accountants can bridge the global infrastructure gap
Improving outcomes across the entire project life cycle
About this reportThis report quantifies the global infrastructure gap and demonstrates how bringing the accountant to the forefront of infrastructure decision-making will improve the selection financing and delivery of projects
AUTHORED BY
Alex Metcalfe Head of Public Sector Policy ACCA
Davinder C Valeri CPA CADirector Strategy Risk amp Performance CPA Canada
Contents
Foreword 5
Executive Summary 6
Introduction 11
Research methodology 12
1 Defining the challenge Quantifying the global infrastructure gap 14
2 Capacity for infrastructure investment 20
3 Selecting projects 23
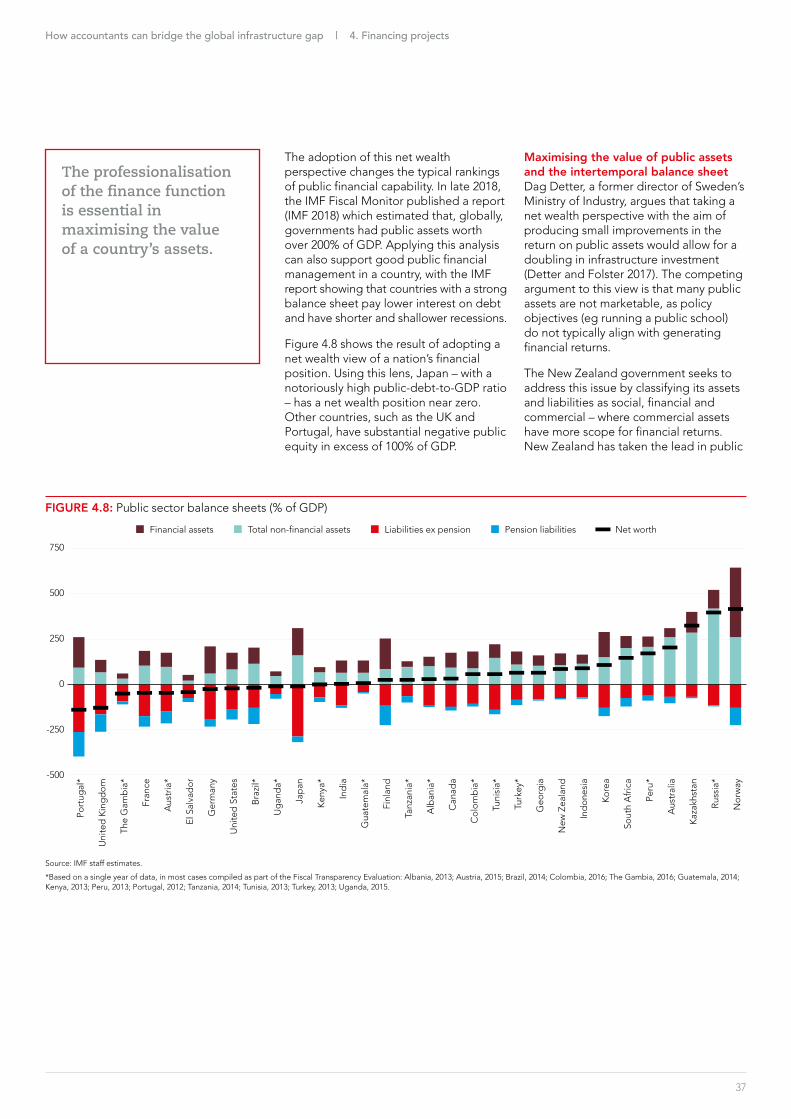
4 Financing projects 29
5 Delivering projects the publicndashprivate relationship 39
6 The role of the accountant in bridging the gap 44
7 Observations and international good practice 46
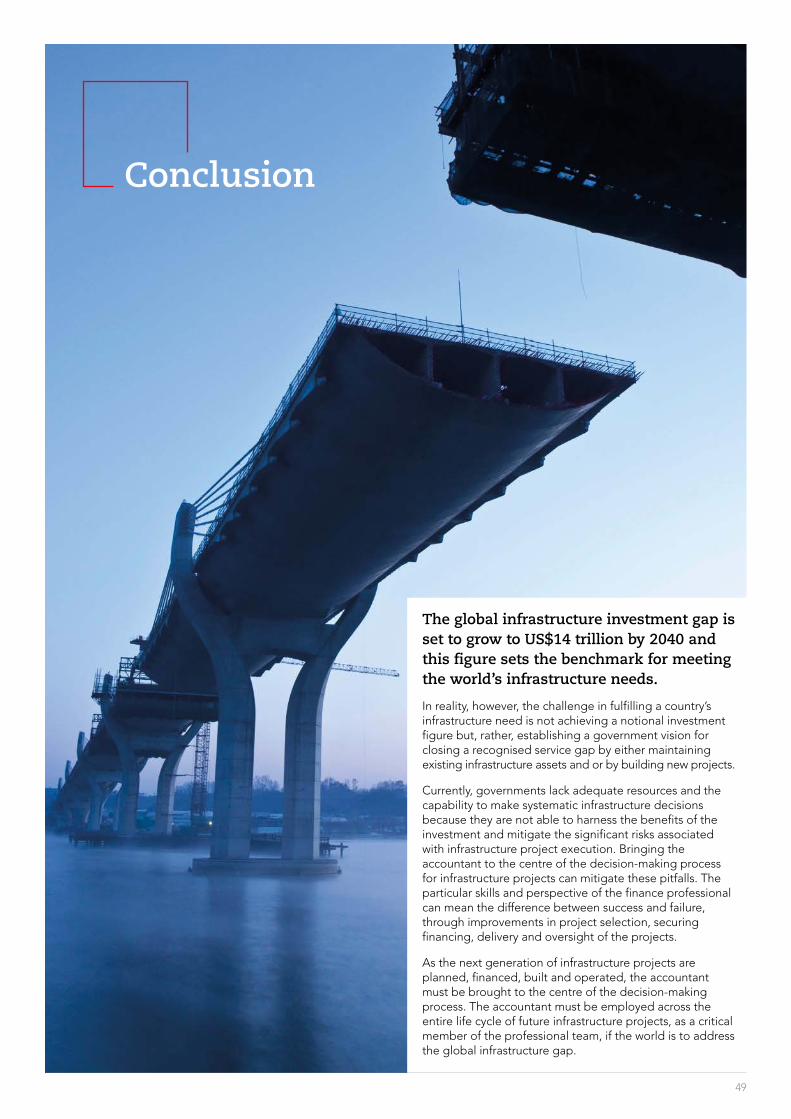
Conclusion 49
Appendix A Detailed methodology of the infrastructure investment gap 50
Appendix B Regional breakdown of investment gap and additional service gap analysis 51
Appendix C Survey and roundtable discussion guide 58
References 61
5
Foreword
Infrastructure is the foundation on which our social and economic well-being is built From the transportation networks that enable people and goods to move safely and effectively to the power and utility systems that provide us with the energy and services that we need to survive we all rely on infrastructure investment
All around the world ndash national regional and local governments make decisions that serve the public and play a critical role in building and maintaining these important and substantial infrastructure investments The outcomes of those decisions will affect us today and into the future
Forces such as demographics rising cyber threats urbanisation and climate change are all converging to increase the global demand for quality infrastructure But efficiently delivering infrastructure can be a challenge given the long asset life and significant sunk costs associated with infrastructure projects Therefore effective decision-making is critical through the entire process of project selection financing construction and operation to provide citizens with value for money
To this end ACCA and Chartered Professional Accountants of Canada (ldquoCPA Canadardquo) are delighted to present this report on the global infrastructure gap A variety of methodologies for quantifying the gap are presented below to explore the size and nature of this global challenge Good practices abound around the world and this report offers a platform for sharing the ideas of practitioners on how governments can best meet the needs of their citizens The report also acts as an example of how the accountant is well placed to tackle many of the major challenges we face in the 21st century ndash from humanityrsquos need to adapt to climate change to helping governments and companies meet the United Nationrsquos Sustainable Development Goals We hope this work initiates conversations on how bringing the accountant to the centre of the decision- and policy-making process can improve outcomes at every point in the project life cycle ndash from planning through to decommissioning
ACCA and CPA Canada would like to thank their respective members who responded to the survey or participated in the roundtable discussions Member contributions add immense value to our thought leadership and this report would not be possible without their assistance
Alan HatfieldExecutive DirectorStrategy and DevelopmentACCA
Gordon BealVice PresidentResearch Guidance amp SupportCPA Canada
Executive summary
DEFINING THE CHALLENGE QUANTIFYING THE GLOBAL INFRASTRUCTURE GAPThe term lsquoglobal infrastructure gaprsquo refers to the difference between the infrastructure investment needed and the resources made available to address that need This report offers two approaches to understanding the global infrastructure gap a notional quantifiable investment gap and a subjective needs-based service gap Together these approaches establish the size and nature of the overall challenge that frames this report
The infrastructure investment gapAnalysis of the G20rsquos Global Infrastructure Outlook shows that the global infrastructure investment gap is set to grow to US$14 trillion by 2040 In 2018 alone the investment gap grew by over US$400bn
Quantifying an infrastructure investment gap across world regions provides an aspirational target for governments looking to improve the provision of infrastructure in their country This methodology highlights global top performers such as Singapore Japan and Canada which exemplify good practices The investment gap approach also reveals that many countries such as Mexico Myanmar and Brazil are facing substantial and growing gaps These countries may benefit from looking at their peers for good practice and novel methods of meeting infrastructure need
6
The infrastructure service gapThe ultimate objective in fulfilling a countryrsquos infrastructure need is not a notional investment figure rather it is closing a recognised service gap Doing this requires that governments develop a vision of what the country seeks to achieve through the development and maintenance of its infrastructure
The ACCA and CPA Canada conducted a global survey of their respective members on the infrastructure gap (ldquothe surveyrsquo) The survey responses showed particular service gaps emerging in certain world regions
across seven types of infrastructure power and energy water and sanitation road and highways other transport (eg air and sea) information and communication technology (ICT) railways and core public service infrastructure (eg hospitals and schools) Finance professionals in Africa and South Asia reported consistently poor levels of infrastructure across all these types with the notable exception of ICT In comparison North American respondents had much higher overall scores but reported a particular dip in their road and highway infrastructure In the Caribbean region respondents to the survey isolated
FIGURE 1 Global infrastructure investment needs and current trends 2015 US$ trillions
50
45
40
35
30
25
20
15
10
05
0
Investment need Current trends
2007
2008
2009
2010
2011
2012
2013
2014
2015
2016
2017
2018
2019
2020
2021
2022
2023
2024
2025
2026
2027
2028
2029
2030
2031
2032
2033
2034
2035
2036
2037
2038
2039
2040
Source GHI and Oxford Economics 2018
How accountants can bridge the global infrastructure gap | Executive summary
7
Just as the barriers to bridging the gap vary by country there is significant variability in the capacity of governments to respond to the infrastructure gap
road and highway infrastructure and core public service infrastructure as key areas requiring intervention to reduce the service gap Respondents from Central and Eastern Europe cited core public service infrastructure and railway infrastructure as areas requiring further investment
OVERALL BARRIERS TO MEETING INFRASTRUCTURE NEEDRespondents to the member survey were also asked what they saw as the biggest barriers to meeting the infrastructure needs of their countries A few top global barriers were
1 a lack of political leadership (cited by 52)
2 a lack of finance or funding (49)
3 planning and regulatory barriers (40)
These results show that the barriers to closing the gap extend beyond having the financial resource to meet need with lsquoa lack of political leadershiprsquo ranking as the number one barrier This suggests that failing to articulate a vision of future infrastructure provision can be a significant barrier in some countries These top three barriers informed the framework for the chapters that follow on the role of the accountant demonstrating that finance professionals have an essential role in addressing all three of the top barriers to closing the gap A lack of political leadership affects a countryrsquos ability to select projects (Chapter 3) the lack of finance and funding clearly impedes effective financing of projects (Chapter 4) and planning and regulatory barriers speak to the interface between the public and private sector in the delivery of infrastructure (Chapter 5)
Capacity for governments to respond to the gapJust as the barriers to bridging the gap vary by country there is significant variability in the capacity of governments to respond to the infrastructure gap Analysis of data from the World Bank the Organisation for Economic Cooperation and Development (OECD) International Monetary Fund (IMF) and Central Intelligence Agency (CIA) World Factbook allowed for the generation of a typology based on the size of the challenge and a countryrsquos ability to respond to this challenge
Countries under the group of lsquoLarge gap fiscally restrictedrsquo such as Pakistan and Nigeria will struggle to meet their growing demands for public infrastructure Others such as China in the top-right corner of the figure are well placed to meet their infrastructure needs compared with their income-group peers
The role of the accountant in closing the gapThe successful provision of public infrastructure requires governments to have the right professional team in place And yet a clear message resounded from the international roundtable discussions a key player is often missing from the infrastructure project table ndash the accountant
The accountant must be brought to the centre of the decision-making process on the selection financing building and operation of infrastructure ndash where the particular skills and perspective of the finance professional can mean the difference between success and failure
TABLE 1 A typology of infrastructure gap responsiveness
LIMITED FISCAL ROOM GREATER FISCAL ROOM
Low infrastructure gap lsquoSmall gap Fiscally restrictedrsquo(eg Canada)
lsquoSmall gap Fiscally flexiblersquo(eg China)
High infrastructure gap lsquoLarge gap Fiscally restrictedrsquo(eg Pakistan Nigeria)
lsquoLarge gap Fiscally flexiblersquo (eg Malaysia)
How accountants can bridge the global infrastructure gap | Executive summary
8
Establishing and comparing the need for infrastructure are key considerations in building the case for planning and selecting a particular project
Planning and selecting infrastructure projectsChapter 3 further explains the two key impediments identified in the survey the lack of a standard for project selection and the misalignment of the infrastructure life cycle and the political cycle Establishing and comparing the need for infrastructure are key considerations in building the case for planning and selecting a particular project This report sets out methods of establishing lsquoneedrsquo in order to inform the planning and project selection process The survey also identifies the misalignment between a political cycle (often four to six years) and the total life cycle of an infrastructure asset (often over 20 years) This mismatch can generate two biases a bias towards short-term decision-making and a bias for creating megaprojects over maintenance
In response to these barriers this report offers the following recommendations based on observed good practice
Governments should1 Establish expert-led bodies to
forecast infrastructure requirements and recommend projects on the basis of need
2 Collect reliable data on the service potential of existing infrastructure and on the performance of past projects
3 Disaggregate expenditure on infrastructure to report both maintenance and new project spend
Accountants should4 Take the lead in applying standard
selection tools to determine the need for and priority of a project
5 Advise on the distributional impact and regional growth outcomes of selecting particular projects good practice in this area can be found in Japan
6 Embed adaptation and resilience into the project-selection process
Financing infrastructure projectsChapter 4 on financing infrastructure highlights three key impediments to closing the infrastructure gap the funding gap accounting for the higher cost of private capital and the need to professionalise the public sector finance function
In response to these barriers the report offers the following recommendations based on observed good practice
Governments should7 Consider innovative solutions for
closing the funding gap such as a value capture civic crowdfunding and other revenue funding schemes
8 Direct supreme audit institutions to monitor the interaction of off balance sheet liabilities and fiscal targets in order to improve the efficient allocation of public sector funds
9 Align long-term infrastructure plans with the annual budget process in order to minimise the use of higher-cost private finance to achieve capital budget flexibility
10 Adopt full accrual accounting and maintain a public sector balance sheet to support decision-making on infrastructure policy
Accountants should11 Advocate a more holistic approach
to maintaining fiscal discipline to avoid poor financial decisions driven by lsquofiscal illusionsrsquo
12 Conduct a balance sheet review to maximise the value of public sector assets
13 Produce an intertemporal balance sheet to improve long-term decision-making and support the sustainability of public finances as is done for example in New Zealand
14 Produce disaggregated assets in the balance sheet to include commercial social and financial assets ndash in order to improve the return on public assets
How accountants can bridge the global infrastructure gap | Executive summary
The roundtable participants identified poor monitoring and oversight by government as key impediments in delivering infrastructure projects
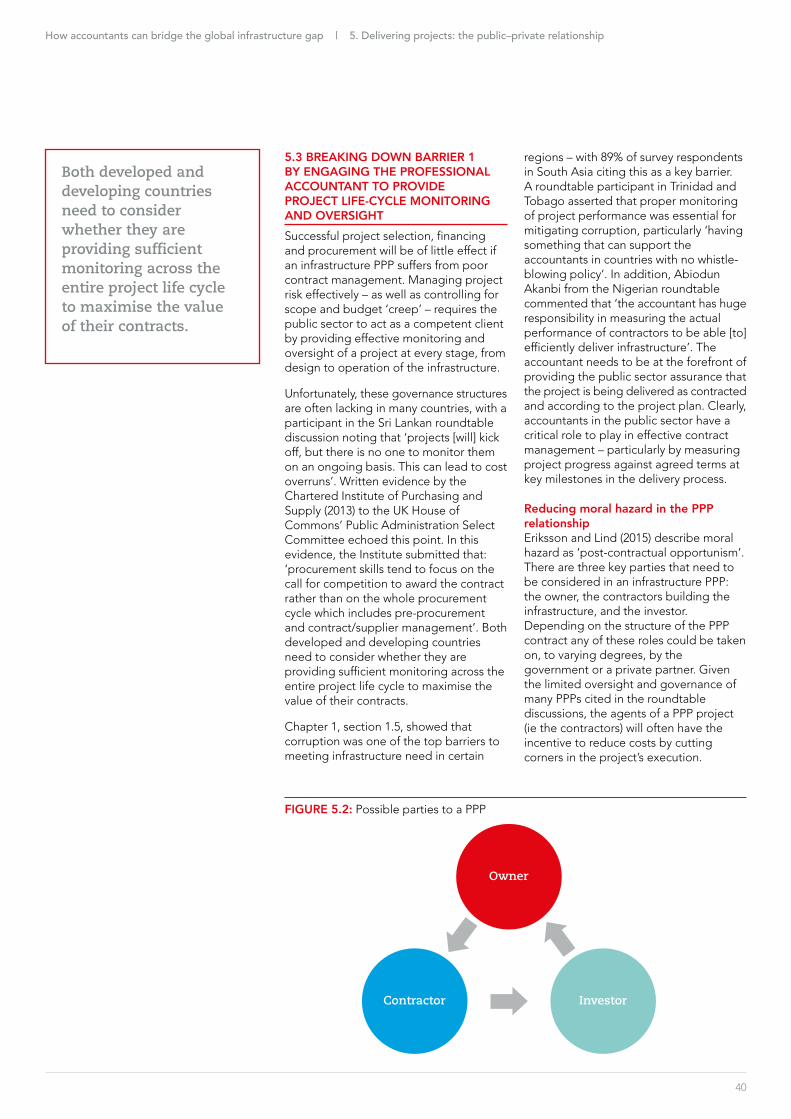
Delivering infrastructure projects The roundtable participants identified poor monitoring and oversight by government as key impediments in delivering infrastructure projects Chapter 5 offers results from the survey demonstrating disagreement about where each party in a PPP agreement provides value Finally the roundtable participants argued that the public sector often lacked the commercial acumen required to manage an infrastructure PPP effectively
In response to these barriers this report offers the following recommendations based on observed good practice
Governments should 15 Enact effective whistle-blowing
legislation and professionalise the public sector finance function to allow public servants to challenge unethical behaviour that can derail infrastructure projects
16 Establish centres of excellence that coordinate public sector expertise in contract management which allows any organisation within the public sector to draw on the specialist skill when negotiating a PPP contract
17 Consider introducing guarantee schemes for nationally significant infrastructure projects in order to encourage additional private sector involvement in infrastructure projects This will help address the assumptions identified in the survey which showed that private finance professionals were less likely to view the public sector as a stable partner
Accountants should 18 Implement proper monitoring and
oversight for all projects
19 Advocate embedding themselves in the professional teams delivering infrastructure by highlighting their expertise of risk management
Professional bodies should 20 Act as facilitators of knowledge
transfer between the public and private sector through thought-leadership events and roundtables
9
10
The global infrastructure gap
1 See Chapter 1 for definitions of the lsquoinfrastructure investment gaprsquo and the lsquoinfrastructure service gaprsquo
Globally some top barriers to meeting infrastructure need were
52 lack of political leadership
49 lack of finance or funding
40 planning and regulatory barriers
Finance professionals reported the largest service gap in Africa the Middle East had the smallest service gap1
The global investment gap will grow to US$14 trillion by 2040
Selecting projects
93 of respondents said governments could improve the infrastructure projection selection process
lsquoRemoving political decision-making and making the process technocraticrsquo was the most cited for improving project selection
Delivering projects and the public-private relationship
62 of public sector respondents arguedthat they offered a lsquolong-term and stable partnershiprsquo for a PPP compared to only
45 of private sector respondents
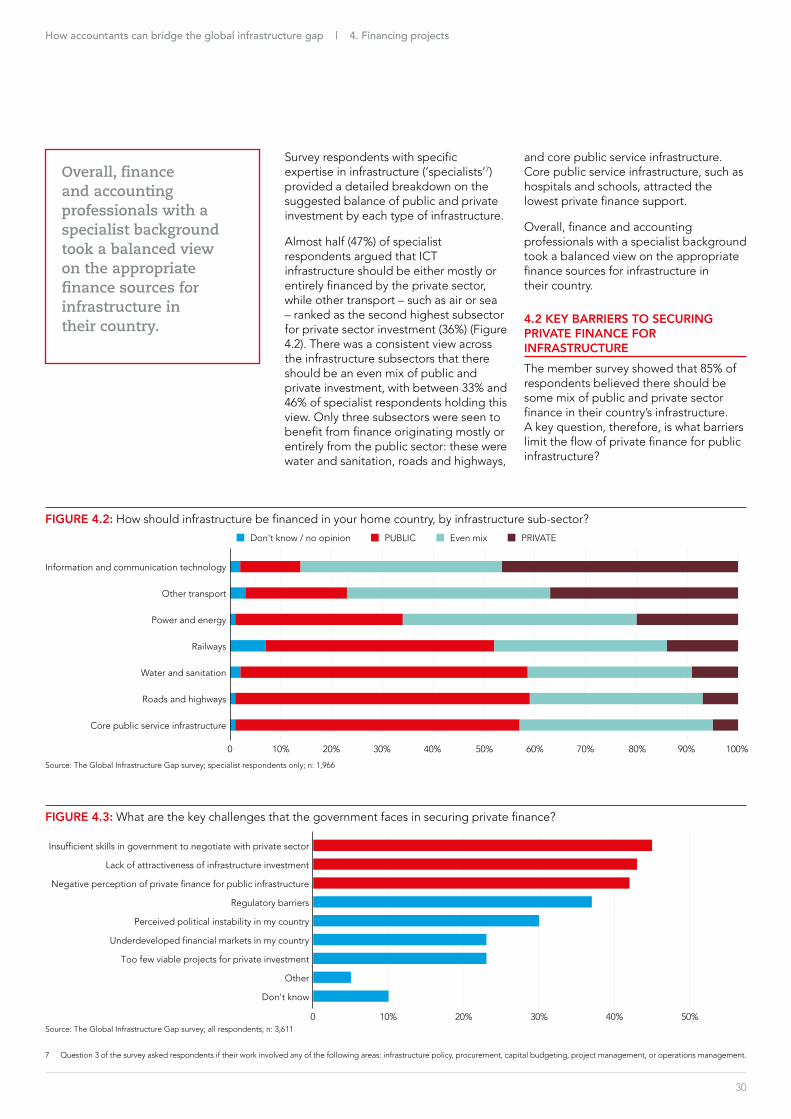
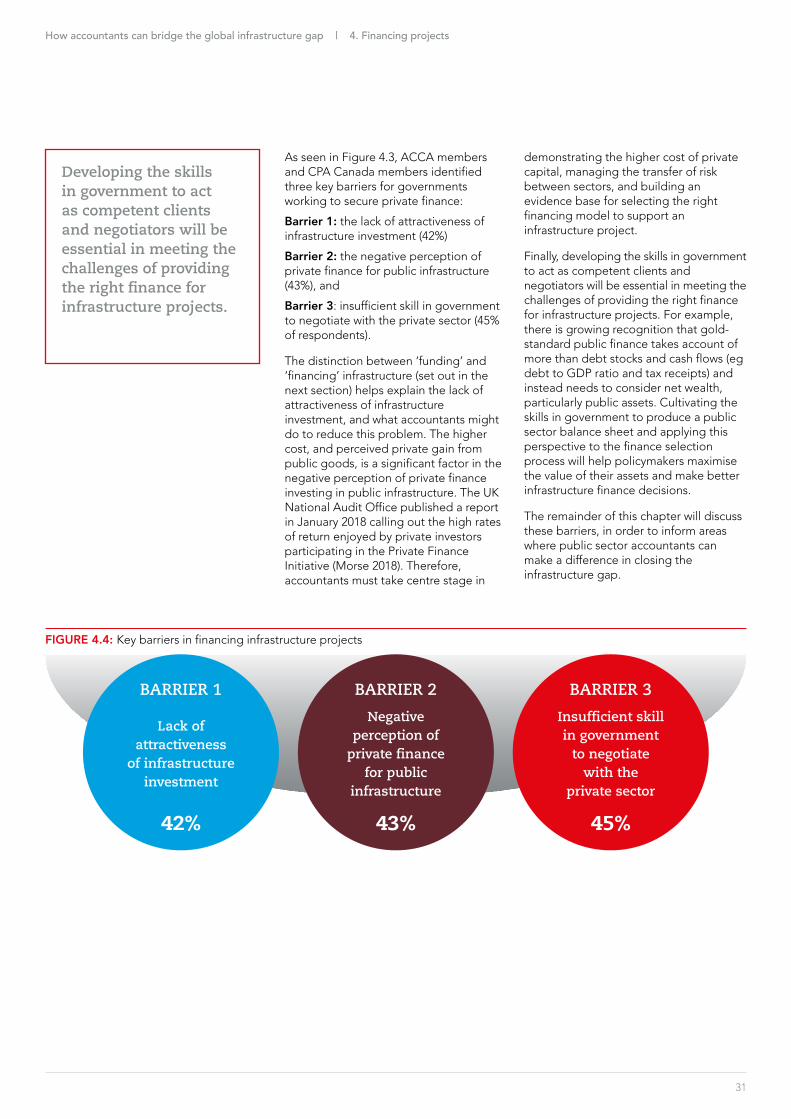
Financing projectsThe most cited barriers for securing private finance for infrastructure were
lsquoInsufficient skills in governmentrsquo 45 and
lsquonegative perception of private financersquo 43
11
Introduction
Infrastructure is critical for economic and social development across the world Physical infrastructure systems ensure that basic human needs are met people need access to energy to light and heat their homes and safe water for drinking sanitation and cooking Transport infrastructure allows people to travel to work and transport goods to different markets
In these and many other ways infrastructure is vital to social and economic activity and development ndash and its provision is intrinsically tied to achieving the United Nationrsquos Sustainable Development Goals to address global challenges such as poverty inequality climate change and environmental degradation and to achieve a better and more sustainable future for all There is also a unique opportunity for governments to respond to the global infrastructure gap challenge The anaemic economic growth following the 2008 financial crisis and the sustained low-interest rate environment means that the cost of increased investment has rarely been lower for governments and the prize is sustainable economic growth a sustained boost to productivity and improved living standards
But execution matters and there are many examples of infrastructure projects that have gone badly wrong Design failures can cause the death of workers as in the case of the Chirajara bridge collapse in Colombia in 2018 poor demand forecasting and design can result in significant infrastructure investments being underused such as the Ciudad Real Airport in Spain which remains abandoned after a construction cost in excess of 1bn euros (BBC 2015)
In addition the collapse of the Morandi Bridge in Genoa Italy demonstrated that to avoid disaster governments must allocate sufficient resources to the maintenance of existing infrastructure fighting the bias towards focusing resources on new-build projects
Finally cases of natural disaster ndash such as the flooding in Bangkok Thailand in 2011 ndash are becoming increasingly common and future infrastructure projects must be adaptable and resilient to enable countries to meet the threats of climate change
Therefore the successful provision of public infrastructure requires governments to have the right professional team in place to be able to harness the benefits of additional investment while working to mitigate the significant risks associated with infrastructure projects The accountant must be brought to the centre of the decision-making process on the selection financing building and operation of infrastructure where the finance professionalrsquos particular skills and perspective can mean the difference between success and failure
Research methodology
How accountants can bridge the global infrastructure gap Improving outcomes across the entire project life cycle report is the result of a joint research project conducted by ACCA and CPA Canada The research objective of this study was to quantify and explain the nature of the global infrastructure gap and explore how professional accountants can contribute to bridging the gap through improvements in the selection financing and delivery of projects
The report encompasses the collection of economic research country-specific narratives and best practices in building and maintaining infrastructure ndash from project selection to completion and evaluation The results and observations that were arrived at are supported by evidence collected through the following mechanisms
bull quantifying the cumulative global infrastructure investment gap to 2040 through desktop research
bull a global online survey of a random sample of ACCA members and CPA Canada members
bull a desktop literature review of specialist publications to determine leading practices
bull in-person roundtable discussions held with experts from four continents
How these four areas were developed is detailed below
ECONOMIC ANALYSIS A quantitative approach was followed for the review of the G20 Global Infrastructure Hubrsquos Global Infrastructure Outlook report (GHI and Oxford Economics 2018) This report uses economic forecasting to quantify the cumulative global infrastructure gap up to 2040 Chapter 1 lsquoQuantifying the Global Infrastructure Gaprsquo provides some detail on the quantification of the investment gap and articulates the challenge for this report More information on the methodology of the economic analysis can be found in Appendix A
GLOBAL SURVEY AND DEMOGRAPHICS ACCA and CPA Canada jointly undertook a survey of a random sample of each bodyrsquos membership This survey used the perspectives of finance professionals to illuminate the nature of the global infrastructure gap highlight the barriers to closing the gap and clarify the diverging expectations of public- and private-sector actors in the use of publicndash
private partnerships (PPPs) in infrastructure projects A copy of the survey is available in Appendix C
The survey design and administration were consistent across both bodies except for the addition of one question on infrastructure planning and sustainability considerations in the CPA Canada survey Therefore unless otherwise specified all survey results cited in the report present the combined output from the CPA Canada and ACCA waves of the survey The ACCA survey was in the field for two weeks in August 2018 and the CPA Canada survey for two weeks in October 2018
Survey demographics The combined total of survey respondents was 3611 across 1182
countries Geographic splits in the survey data typically present output by world region Every world region had at least 150 responses except for South America which is excluded from any figure showing results by geography Finally the
2 Six respondents gave lsquoOtherrsquo for their country of residence thus it is not possible to identify whether they lived in the 118 countries or elsewhere
12
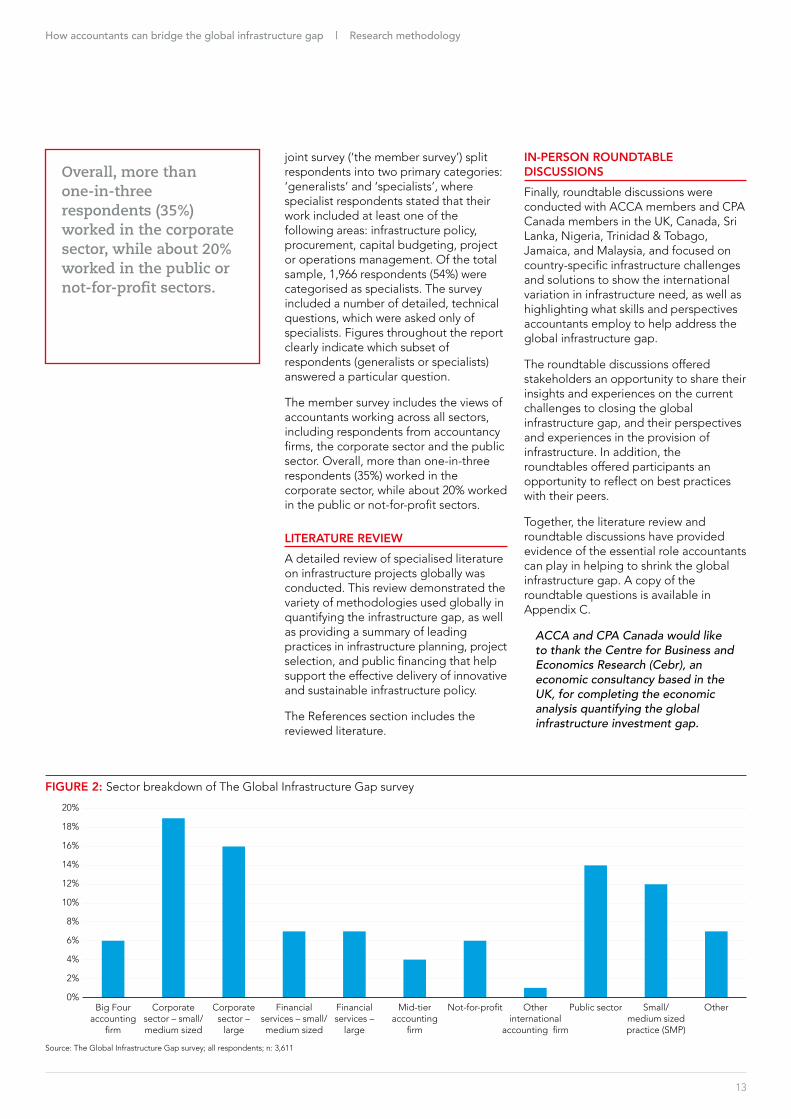
Overall more than one-in-three respondents (35) worked in the corporate sector while about 20 worked in the public or not-for-profit sectors
joint survey (lsquothe member surveyrsquo) split respondents into two primary categories lsquogeneralistsrsquo and lsquospecialistsrsquo where specialist respondents stated that their work included at least one of the following areas infrastructure policy procurement capital budgeting project or operations management Of the total sample 1966 respondents (54) were categorised as specialists The survey included a number of detailed technical questions which were asked only of specialists Figures throughout the report clearly indicate which subset of respondents (generalists or specialists) answered a particular question
The member survey includes the views of accountants working across all sectors including respondents from accountancy firms the corporate sector and the public sector Overall more than one-in-three respondents (35) worked in the corporate sector while about 20 worked in the public or not-for-profit sectors
LITERATURE REVIEWA detailed review of specialised literature on infrastructure projects globally was conducted This review demonstrated the variety of methodologies used globally in quantifying the infrastructure gap as well as providing a summary of leading practices in infrastructure planning project selection and public financing that help support the effective delivery of innovative and sustainable infrastructure policy
The References section includes the reviewed literature
IN-PERSON ROUNDTABLE DISCUSSIONSFinally roundtable discussions were conducted with ACCA members and CPA Canada members in the UK Canada Sri Lanka Nigeria Trinidad amp Tobago Jamaica and Malaysia and focused on country-specific infrastructure challenges and solutions to show the international variation in infrastructure need as well as highlighting what skills and perspectives accountants employ to help address the global infrastructure gap
The roundtable discussions offered stakeholders an opportunity to share their insights and experiences on the current challenges to closing the global infrastructure gap and their perspectives and experiences in the provision of infrastructure In addition the roundtables offered participants an opportunity to reflect on best practices with their peers
Together the literature review and roundtable discussions have provided evidence of the essential role accountants can play in helping to shrink the global infrastructure gap A copy of the roundtable questions is available in Appendix C
ACCA and CPA Canada would like to thank the Centre for Business and Economics Research (Cebr) an economic consultancy based in the UK for completing the economic analysis quantifying the global infrastructure investment gap
13
How accountants can bridge the global infrastructure gap | Research methodology
FIGURE 2 Sector breakdown of The Global Infrastructure Gap survey
20
18
16
14
12
10
8
6
4
2
0Big Four
accounting firm
Corporate sector ndash small medium sized
Corporate sector ndash
large
Financial services ndash smallmedium sized
Financial services ndash
large
Mid-tier accounting
firm
Not-for-profit Other international
accounting firm
Public sector Small medium sized practice (SMP)
Other
Source The Global Infrastructure Gap survey all respondents n 3611
14
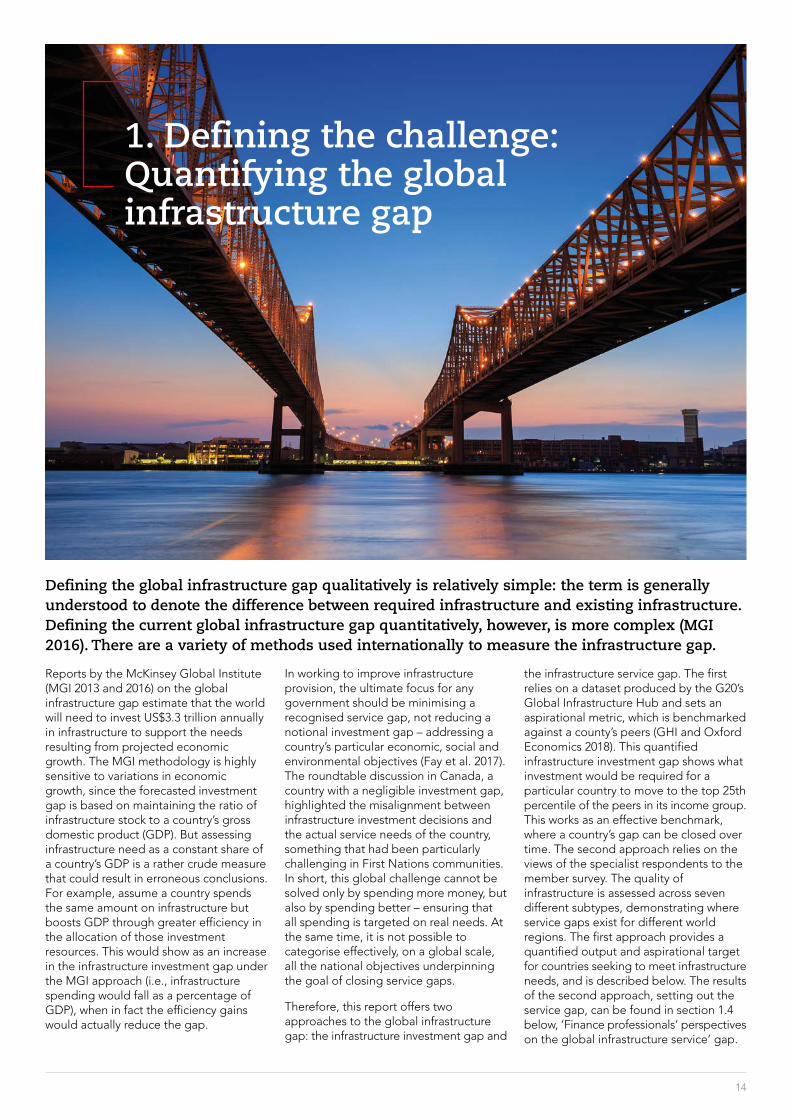
1 Defining the challenge Quantifying the global infrastructure gap
Defining the global infrastructure gap qualitatively is relatively simple the term is generally understood to denote the difference between required infrastructure and existing infrastructure Defining the current global infrastructure gap quantitatively however is more complex (MGI 2016) There are a variety of methods used internationally to measure the infrastructure gap
Reports by the McKinsey Global Institute (MGI 2013 and 2016) on the global infrastructure gap estimate that the world will need to invest US$33 trillion annually in infrastructure to support the needs resulting from projected economic growth The MGI methodology is highly sensitive to variations in economic growth since the forecasted investment gap is based on maintaining the ratio of infrastructure stock to a countryrsquos gross domestic product (GDP) But assessing infrastructure need as a constant share of a countryrsquos GDP is a rather crude measure that could result in erroneous conclusions For example assume a country spends the same amount on infrastructure but boosts GDP through greater efficiency in the allocation of those investment resources This would show as an increase in the infrastructure investment gap under the MGI approach (ie infrastructure spending would fall as a percentage of GDP) when in fact the efficiency gains would actually reduce the gap
In working to improve infrastructure provision the ultimate focus for any government should be minimising a recognised service gap not reducing a notional investment gap ndash addressing a countryrsquos particular economic social and environmental objectives (Fay et al 2017) The roundtable discussion in Canada a country with a negligible investment gap highlighted the misalignment between infrastructure investment decisions and the actual service needs of the country something that had been particularly challenging in First Nations communities In short this global challenge cannot be solved only by spending more money but also by spending better ndash ensuring that all spending is targeted on real needs At the same time it is not possible to categorise effectively on a global scale all the national objectives underpinning the goal of closing service gaps
Therefore this report offers two approaches to the global infrastructure gap the infrastructure investment gap and
the infrastructure service gap The first relies on a dataset produced by the G20rsquos Global Infrastructure Hub and sets an aspirational metric which is benchmarked against a countyrsquos peers (GHI and Oxford Economics 2018) This quantified infrastructure investment gap shows what investment would be required for a particular country to move to the top 25th percentile of the peers in its income group This works as an effective benchmark where a countryrsquos gap can be closed over time The second approach relies on the views of the specialist respondents to the member survey The quality of infrastructure is assessed across seven different subtypes demonstrating where service gaps exist for different world regions The first approach provides a quantified output and aspirational target for countries seeking to meet infrastructure needs and is described below The results of the second approach setting out the service gap can be found in section 14 below lsquoFinance professionalsrsquo perspectives on the global infrastructure servicersquo gap
How accountants can bridge the global infrastructure gap | 1 Defining the challenge Quantifying the global infrastructure gap
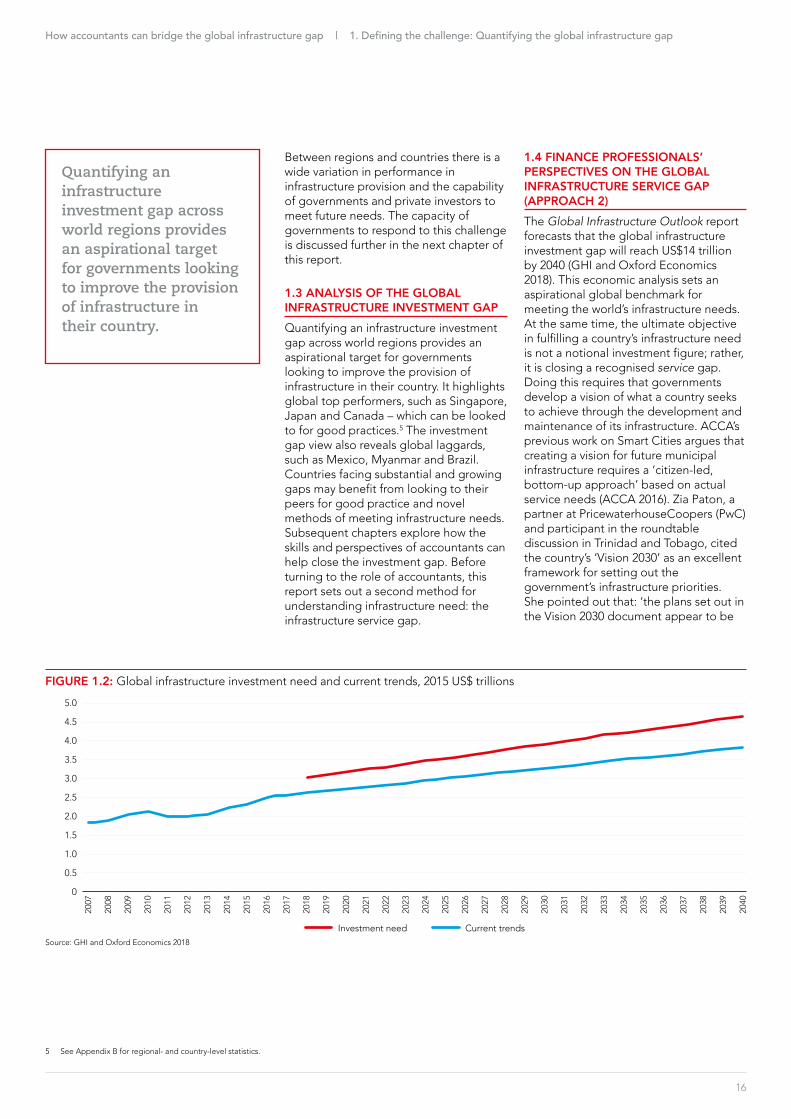
Globally the cumulative level of investment required to bring all countries in line with the best performing nations in their income group is estimated to be almost US$88 trillion between 2018 and 20404
11 THE INFRASTRUCTURE INVESTMENT GAP (APPROACH 1) AN ANALYSIS OF THE GLOBAL INVESTMENT OUTLOOK The Global Infrastructure Outlook report (GHI and Oxford Economics 2018) defines infrastructure investment as lsquoGross Fixed Capital Formation (GFCF) by the public and private sectors on fixed immovable assets that support long-term economic growthrsquo This report takes a comprehensive view of countriesrsquo infrastructure needs ndash including the social and economic infrastructure that would be captured under GFCF This comprehensive view is echoed in the survey analysis which covers seven sub-categories of infrastructure power and energy water and sanitation road and highways other transport (eg air and sea) ICT railways and core public service infrastructure (eg hospitals and schools) The research by the G20rsquos Infrastructure Hub estimates the amount of infrastructure investment needed for a diverse set of countries in each year from 2016 until 20403
The Global Infrastructure Outlook report provides historic data from 2007 to 2015 and then projects these forward to 2040 with increased spending only occurring in response to changes in economic and demographic fundamentals The difference between these estimates (ie the amount invested compared with the
amount needed) allows us to calculate the lsquoinfrastructure investment gaprsquo for each country To improve understanding of this global challenge the account below illustrates the size of this infrastructure gap at the global level Further detail on the nature of the infrastructure investment being measured and the methodology used to calculate the gap are explained in Appendix A Regional and national-level analysis of the investment gap can be found in Appendix B
12 QUANTIFYING THE GLOBAL INFRASTRUCTURE INVESTMENT GAP Globally the cumulative level of investment required to bring all countries in line with the best performing nations in their income group is estimated to be almost US$88 trillion between 2018 and 20404 Current trends indicate however that actual investment over the period is likely to undershoot this by US$14 trillion In 2018 alone the global infrastructure gap is US$409bn and will average US$613bn per year over the entire period In order to close this gap total forecast spending would have to increase by 19 over current investment levels In other words for every five US dollars of infrastructure spending forecast across the world by 2040 governments and investors would need to find a further 95 cents in order to bring the global stock of infrastructure up to standard
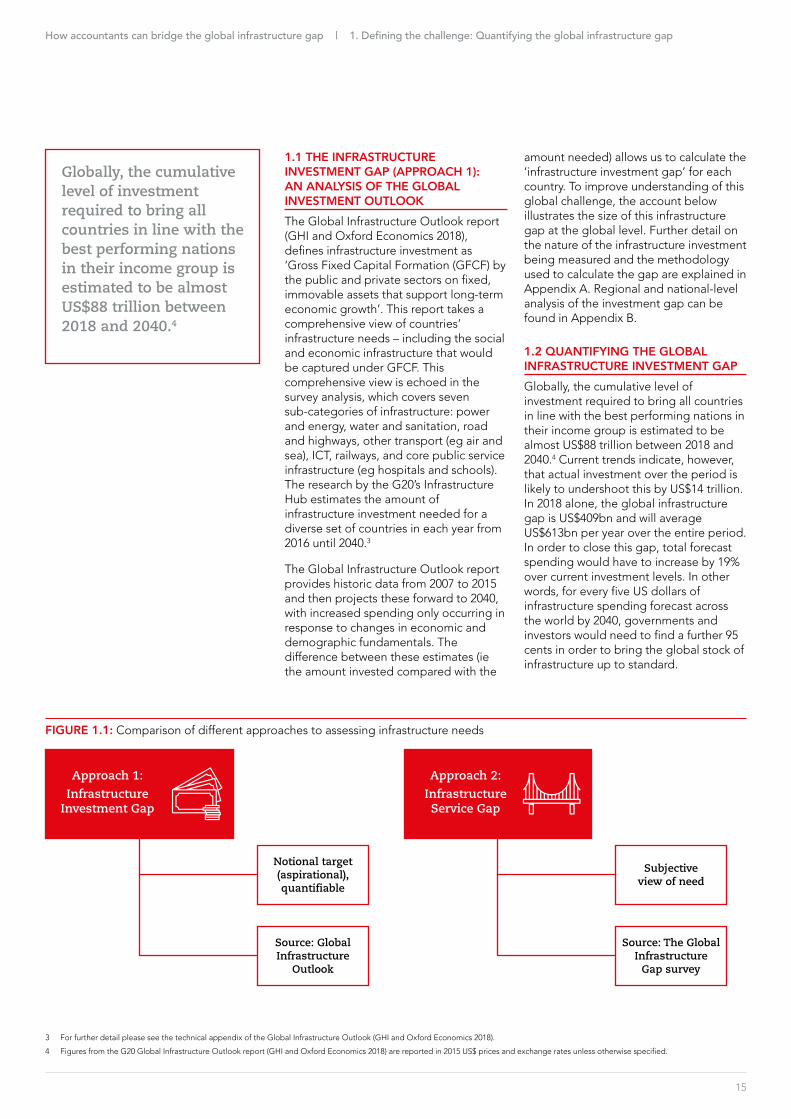
FIGURE 11 Comparison of different approaches to assessing infrastructure needs
Approach 2
Infrastructure Service Gap
Approach 1
Infrastructure Investment Gap
Notional target (aspirational) quantifiable
Source Global Infrastructure
Outlook
Subjective view of need
Source The Global Infrastructure
Gap survey
3 For further detail please see the technical appendix of the Global Infrastructure Outlook (GHI and Oxford Economics 2018)
4 Figures from the G20 Global Infrastructure Outlook report (GHI and Oxford Economics 2018) are reported in 2015 US$ prices and exchange rates unless otherwise specified
15
16
Quantifying an infrastructure investment gap across world regions provides an aspirational target for governments looking to improve the provision of infrastructure in their country
Between regions and countries there is a wide variation in performance in infrastructure provision and the capability of governments and private investors to meet future needs The capacity of governments to respond to this challenge is discussed further in the next chapter of this report
13 ANALYSIS OF THE GLOBAL INFRASTRUCTURE INVESTMENT GAPQuantifying an infrastructure investment gap across world regions provides an aspirational target for governments looking to improve the provision of infrastructure in their country It highlights global top performers such as Singapore Japan and Canada ndash which can be looked to for good practices5 The investment gap view also reveals global laggards such as Mexico Myanmar and Brazil Countries facing substantial and growing gaps may benefit from looking to their peers for good practice and novel methods of meeting infrastructure needs Subsequent chapters explore how the skills and perspectives of accountants can help close the investment gap Before turning to the role of accountants this report sets out a second method for understanding infrastructure need the infrastructure service gap
How accountants can bridge the global infrastructure gap | 1 Defining the challenge Quantifying the global infrastructure gap
14 FINANCE PROFESSIONALSrsquo PERSPECTIVES ON THE GLOBAL INFRASTRUCTURE SERVICE GAP (APPROACH 2)The Global Infrastructure Outlook report forecasts that the global infrastructure investment gap will reach US$14 trillion by 2040 (GHI and Oxford Economics 2018) This economic analysis sets an aspirational global benchmark for meeting the worldrsquos infrastructure needs At the same time the ultimate objective in fulfilling a countryrsquos infrastructure need is not a notional investment figure rather it is closing a recognised service gap Doing this requires that governments develop a vision of what a country seeks to achieve through the development and maintenance of its infrastructure ACCArsquos previous work on Smart Cities argues that creating a vision for future municipal infrastructure requires a lsquocitizen-led bottom-up approachrsquo based on actual service needs (ACCA 2016) Zia Paton a partner at PricewaterhouseCoopers (PwC) and participant in the roundtable discussion in Trinidad and Tobago cited the countryrsquos lsquoVision 2030rsquo as an excellent framework for setting out the governmentrsquos infrastructure priorities She pointed out that lsquothe plans set out in the Vision 2030 document appear to be
FIGURE 12 Global infrastructure investment need and current trends 2015 US$ trillions
50
45
40
35
30
25
20
15
10
05
0
Investment need Current trends
2007
2008
2009
2010
2011
2012
2013
2014
2015
2016
2017
2018
2019
2020
2021
2022
2023
2024
2025
2026
2027
2028
2029
2030
2031
2032
2033
2034
2035
2036
2037
2038
2039
2040
Source GHI and Oxford Economics 2018
5 See Appendix B for regional- and country-level statistics
17
To supplement the economic analysis that produces the investment gap the joint member survey explored the global infrastructure service gap
exactly what we needrsquo but she sees the real challenge as lsquoconverting that plan into action and aligning it with the various frameworks people and Ministries we have in place execution or implementation is where we tend to have challengesrsquo
The following chapters demonstrate the essential role for the accountancy profession in transforming agreed national visions into a reality through improving project selection (Chapter 3) financing decisions (Chapter 4) and project delivery (Chapter 5) To supplement the economic analysis that produces the investment gap the joint member survey explored the global infrastructure service gap This granular
approach captures the perspective of finance professionals from around the world setting out which particular types of infrastructure are viewed as requiring improvement to meet service needs
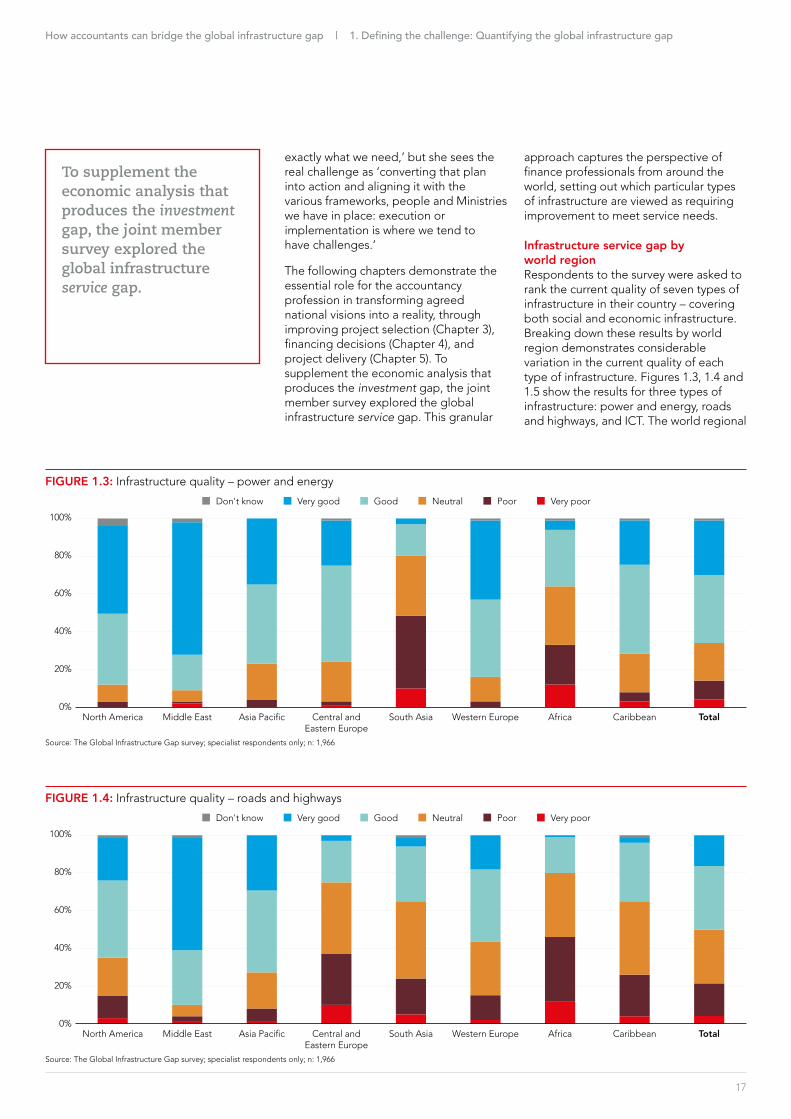
Infrastructure service gap by world regionRespondents to the survey were asked to rank the current quality of seven types of infrastructure in their country ndash covering both social and economic infrastructure Breaking down these results by world region demonstrates considerable variation in the current quality of each type of infrastructure Figures 13 14 and 15 show the results for three types of infrastructure power and energy roads and highways and ICT The world regional
How accountants can bridge the global infrastructure gap | 1 Defining the challenge Quantifying the global infrastructure gap
FIGURE 13 Infrastructure quality ndash power and energy
North America
100
80
60
40
20
0
n Dont know n Very good n Good n Neutral n Poor n Very poor
Middle East Asia Pacific Central and Eastern Europe
South Asia Western Europe Africa Caribbean Total
Source The Global Infrastructure Gap survey specialist respondents only n 1966
FIGURE 14 Infrastructure quality ndash roads and highways
North America
100
80
60
40
20
0
n Dont know n Very good n Good n Neutral n Poor n Very poor
Middle East Asia Pacific Central and Eastern Europe
South Asia Western Europe Africa Caribbean Total
Source The Global Infrastructure Gap survey specialist respondents only n 1966
ICT is a unique form of infrastructure that includes significant non-physical components and its provision must anticipate the future needs of the digital economy
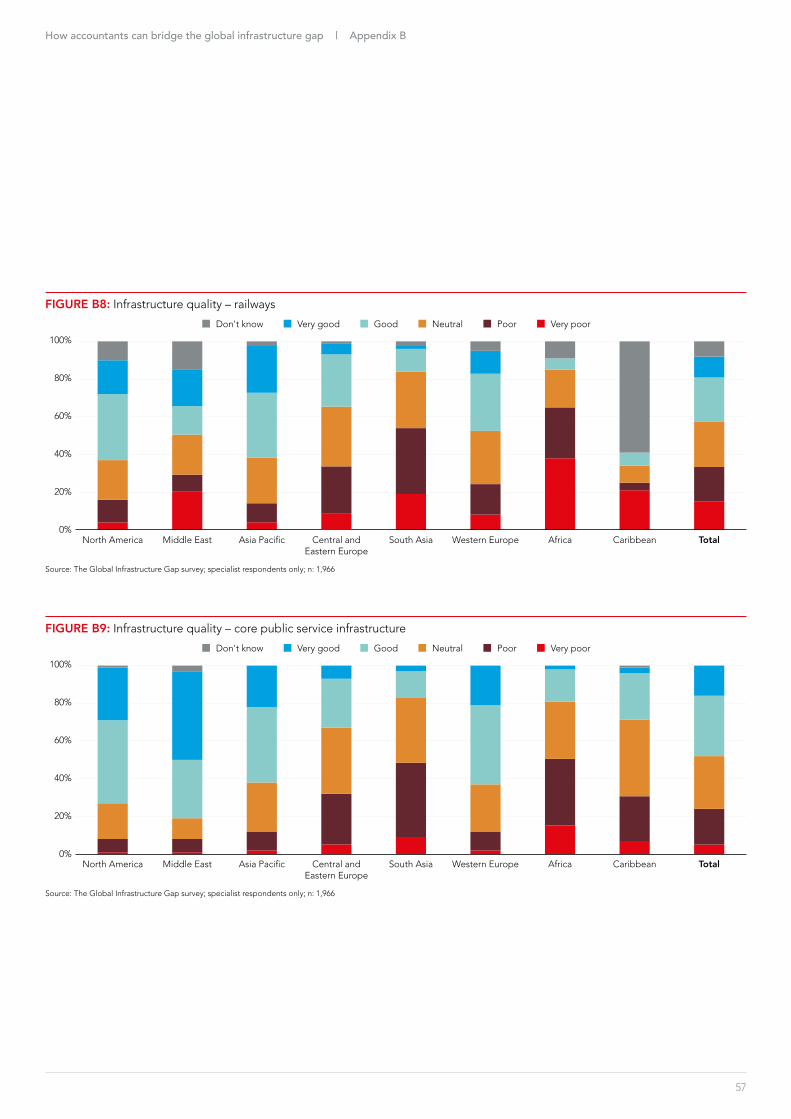
breakdowns for water and sanitation railroad and other transport infrastructure (eg sea and air) and core public service infrastructure can be found in Appendix B Figures B6 B7 B8 and B9 By analysing the specialist responses on each type of infrastructure this report offers a view on the global and regional service gaps that exist in the provision of infrastructure
The survey data shows that South Asia lags other world regions in the quality of its power and energy infrastructure with only one in five (20) of finance professionals in that region stating that power and energy provision in their country was good or very good This compares with 65 of global respondents who found the provision of power and energy to be good or better Africa lagged in this area with about one in three (35) of Africarsquos finance professional respondents stating that power and energy provision was very good or good Unsurprisingly 90 of the Middle Eastern respondents saw their power and energy infrastructure as good quality or above ndash with 71 stating that power and energy provision is lsquovery goodrsquo
Central and Eastern European and African respondents were critical of the quality of their road infrastructure ndash with 37 and 46 respectively stating that their roads and highway infrastructure were poor or very poor In comparison a majority of survey respondents in the Middle East North America and Western Europe reported that the provision of
road and highway infrastructure in their countries was of good or very good quality Globally nearly half the finance professionals (49) reported that that the quality of road and highway infrastructure in their countries was good or very good
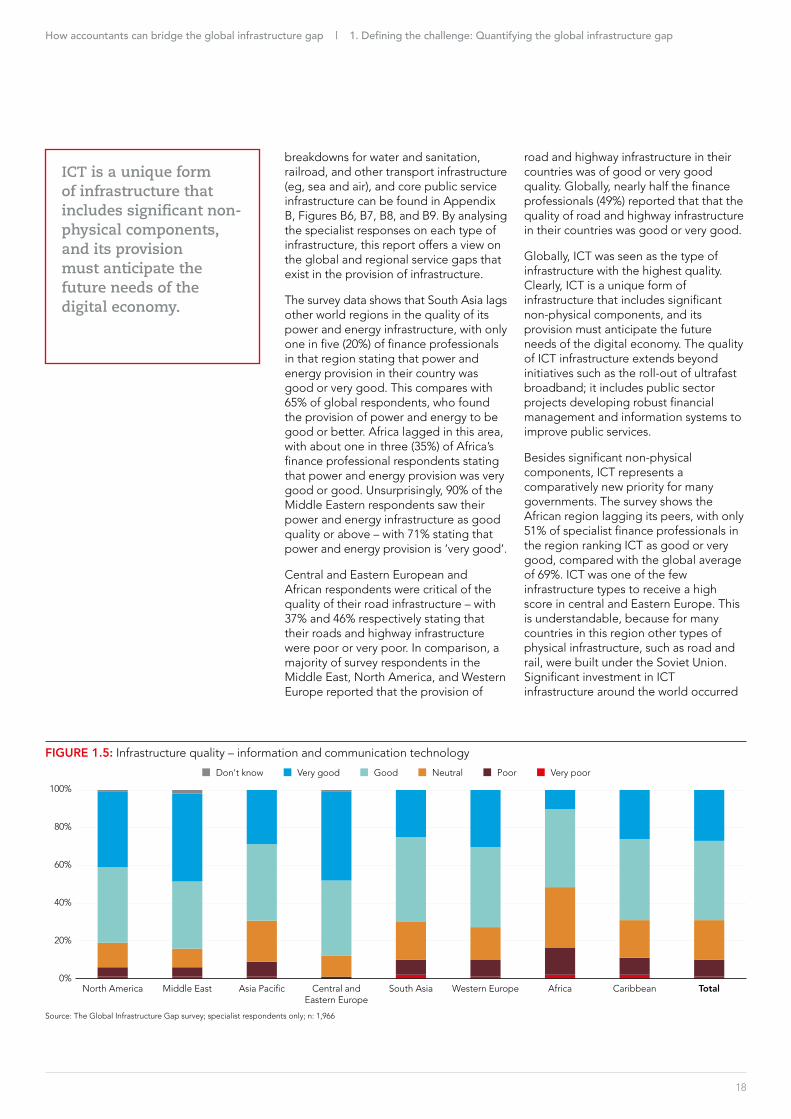
Globally ICT was seen as the type of infrastructure with the highest quality Clearly ICT is a unique form of infrastructure that includes significant non-physical components and its provision must anticipate the future needs of the digital economy The quality of ICT infrastructure extends beyond initiatives such as the roll-out of ultrafast broadband it includes public sector projects developing robust financial management and information systems to improve public services
Besides significant non-physical components ICT represents a comparatively new priority for many governments The survey shows the African region lagging its peers with only 51 of specialist finance professionals in the region ranking ICT as good or very good compared with the global average of 69 ICT was one of the few infrastructure types to receive a high score in central and Eastern Europe This is understandable because for many countries in this region other types of physical infrastructure such as road and rail were built under the Soviet Union Significant investment in ICT infrastructure around the world occurred
18
How accountants can bridge the global infrastructure gap | 1 Defining the challenge Quantifying the global infrastructure gap
FIGURE 15 Infrastructure quality ndash information and communication technology
Source The Global Infrastructure Gap survey specialist respondents only n 1966
North America
100
80
60
40
20
0
n Dont know n Very good n Good n Neutral n Poor n Very poor
Middle East Asia Pacific Central and Eastern Europe
South Asia Western Europe Africa Caribbean Total
19
Comparing specialistsrsquo perceptions of infrastructure quality by country shows particular service gaps emerging across the types of infrastructure
after the fall of the Soviet Union and many new nation-states in Eastern Europe were able to pursue their own infrastructure investment priorities Certain countries such as Estonia are now seen as world leaders in ICT and the provision of a digital public sector
A comparison of regional infrastructure service gaps arising from the survey dataComparing specialistsrsquo perceptions of infrastructure quality by country shows particular service gaps emerging across the types of infrastructure For example finance professionals in Africa and South Asia reported consistently poor levels of infrastructure across all the subtypes with the notable exception of ICT These results suggest that there are considerable service gaps that governments in this world region must address In comparison North American respondents had much higher overall scores but showed a particular dip in their road and highway infrastructure where only 64 of respondents reported that this infrastructure was of good quality In the Caribbean region specialist respondents isolated road and highway infrastructure and core public service infrastructure as key areas requiring intervention to reduce the service gap Specialists in infrastructure policy in central and Eastern Europe cited core public service infrastructure and railway infrastructure as areas requiring further investment
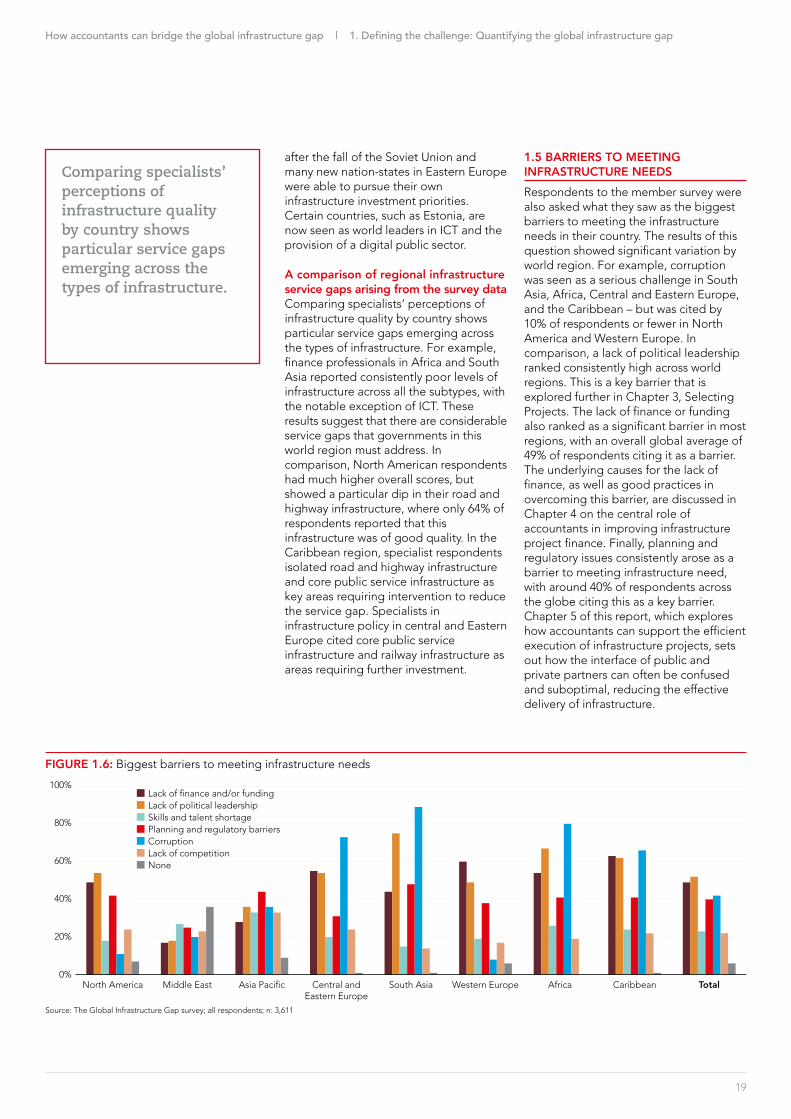
15 BARRIERS TO MEETING INFRASTRUCTURE NEEDSRespondents to the member survey were also asked what they saw as the biggest barriers to meeting the infrastructure needs in their country The results of this question showed significant variation by world region For example corruption was seen as a serious challenge in South Asia Africa Central and Eastern Europe and the Caribbean ndash but was cited by 10 of respondents or fewer in North America and Western Europe In comparison a lack of political leadership ranked consistently high across world regions This is a key barrier that is explored further in Chapter 3 Selecting Projects The lack of finance or funding also ranked as a significant barrier in most regions with an overall global average of 49 of respondents citing it as a barrier The underlying causes for the lack of finance as well as good practices in overcoming this barrier are discussed in Chapter 4 on the central role of accountants in improving infrastructure project finance Finally planning and regulatory issues consistently arose as a barrier to meeting infrastructure need with around 40 of respondents across the globe citing this as a key barrier Chapter 5 of this report which explores how accountants can support the efficient execution of infrastructure projects sets out how the interface of public and private partners can often be confused and suboptimal reducing the effective delivery of infrastructure
How accountants can bridge the global infrastructure gap | 1 Defining the challenge Quantifying the global infrastructure gap
FIGURE 16 Biggest barriers to meeting infrastructure needs
North America
100
80
60
40
20
0
n Lack of finance andor fundingn Lack of political leadershipn Skills and talent shortagen Planning and regulatory barriersn Corruptionn Lack of competitionn None
Middle East Asia Pacific Central and South Asia Western Europe Africa Caribbean Total
Source The Global Infrastructure Gap survey all respondents n 3611
Eastern Europe
2 Capacity for infrastructure investment
For countries at different stages of development the implications of infrastructure spending can also be markedly different The annual rate of growth in output typically much higher during the early phase of industrialisation tends to slow as a countryrsquos economy matures Smaller economies may therefore need to commit a relatively large share of their output to infrastructure investment in order to facilitate rapid growth
Looking at infrastructure investment as a percentage of GDP can therefore be revealing as to governmentsrsquo willingness or ability to make the necessary financial investment as well as the nature of the environment for private investment
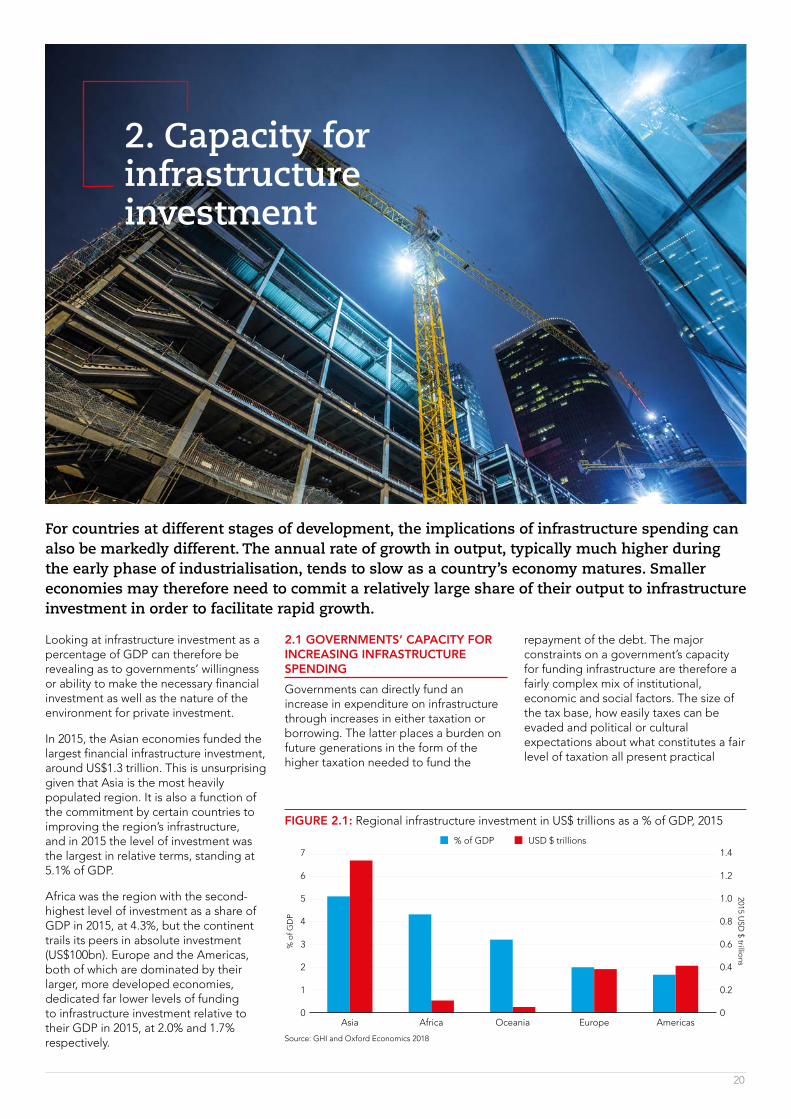
In 2015 the Asian economies funded the largest financial infrastructure investment around US$13 trillion This is unsurprising given that Asia is the most heavily populated region It is also a function of the commitment by certain countries to improving the regionrsquos infrastructure and in 2015 the level of investment was the largest in relative terms standing at 51 of GDP
Africa was the region with the second-highest level of investment as a share of GDP in 2015 at 43 but the continent trails its peers in absolute investment (US$100bn) Europe and the Americas both of which are dominated by their larger more developed economies dedicated far lower levels of funding to infrastructure investment relative to their GDP in 2015 at 20 and 17 respectively
20
21 GOVERNMENTSrsquo CAPACITY FOR INCREASING INFRASTRUCTURE SPENDINGGovernments can directly fund an increase in expenditure on infrastructure through increases in either taxation or borrowing The latter places a burden on future generations in the form of the higher taxation needed to fund the
repayment of the debt The major constraints on a governmentrsquos capacity for funding infrastructure are therefore a fairly complex mix of institutional economic and social factors The size of the tax base how easily taxes can be evaded and political or cultural expectations about what constitutes a fair level of taxation all present practical
FIGURE 21 Regional infrastructure investment in US$ trillions as a of GDP 2015
7
6
5
4
3
2
1
0Asia
14
12
10
08
06
04
02
0Africa Oceania Europe Americas
o
f GD
P
2015 USD
$ trillions
n of GDP n USD $ trillions
Source GHI and Oxford Economics 2018
21
How accountants can bridge the global infrastructure gap | 2 Capacity for infrastructure investment
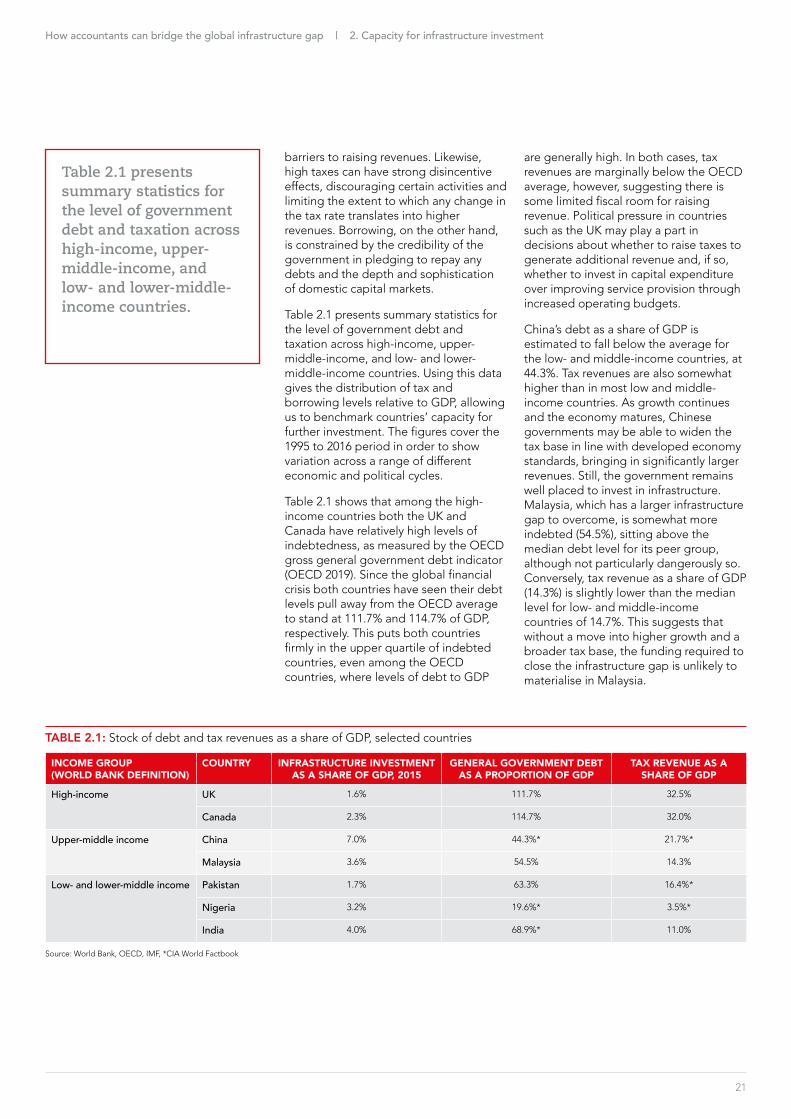
Table 21 presents summary statistics for the level of government debt and taxation across high-income upper-middle-income and low- and lower-middle-income countries
barriers to raising revenues Likewise high taxes can have strong disincentive effects discouraging certain activities and limiting the extent to which any change in the tax rate translates into higher revenues Borrowing on the other hand is constrained by the credibility of the government in pledging to repay any debts and the depth and sophistication of domestic capital markets
Table 21 presents summary statistics for the level of government debt and taxation across high-income upper-middle-income and low- and lower-middle-income countries Using this data gives the distribution of tax and borrowing levels relative to GDP allowing us to benchmark countriesrsquo capacity for further investment The figures cover the 1995 to 2016 period in order to show variation across a range of different economic and political cycles
Table 21 shows that among the high-income countries both the UK and Canada have relatively high levels of indebtedness as measured by the OECD gross general government debt indicator (OECD 2019) Since the global financial crisis both countries have seen their debt levels pull away from the OECD average to stand at 1117 and 1147 of GDP respectively This puts both countries firmly in the upper quartile of indebted countries even among the OECD countries where levels of debt to GDP
are generally high In both cases tax revenues are marginally below the OECD average however suggesting there is some limited fiscal room for raising revenue Political pressure in countries such as the UK may play a part in decisions about whether to raise taxes to generate additional revenue and if so whether to invest in capital expenditure over improving service provision through increased operating budgets
Chinarsquos debt as a share of GDP is estimated to fall below the average for the low- and middle-income countries at 443 Tax revenues are also somewhat higher than in most low and middle-income countries As growth continues and the economy matures Chinese governments may be able to widen the tax base in line with developed economy standards bringing in significantly larger revenues Still the government remains well placed to invest in infrastructure Malaysia which has a larger infrastructure gap to overcome is somewhat more indebted (545) sitting above the median debt level for its peer group although not particularly dangerously so Conversely tax revenue as a share of GDP (143) is slightly lower than the median level for low- and middle-income countries of 147 This suggests that without a move into higher growth and a broader tax base the funding required to close the infrastructure gap is unlikely to materialise in Malaysia
TABLE 21 Stock of debt and tax revenues as a share of GDP selected countries
INCOME GROUP (WORLD BANK DEFINITION)
COUNTRY INFRASTRUCTURE INVESTMENT AS A SHARE OF GDP 2015
GENERAL GOVERNMENT DEBT AS A PROPORTION OF GDP
TAX REVENUE AS A SHARE OF GDP
High-income UK 16 1117 325
Canada 23 1147 320
Upper-middle income China 70 443 217
Malaysia 36 545 143
Low- and lower-middle income Pakistan 17 633 164
Nigeria 32 196 35
India 40 689 110
Source World Bank OECD IMF CIA World Factbook
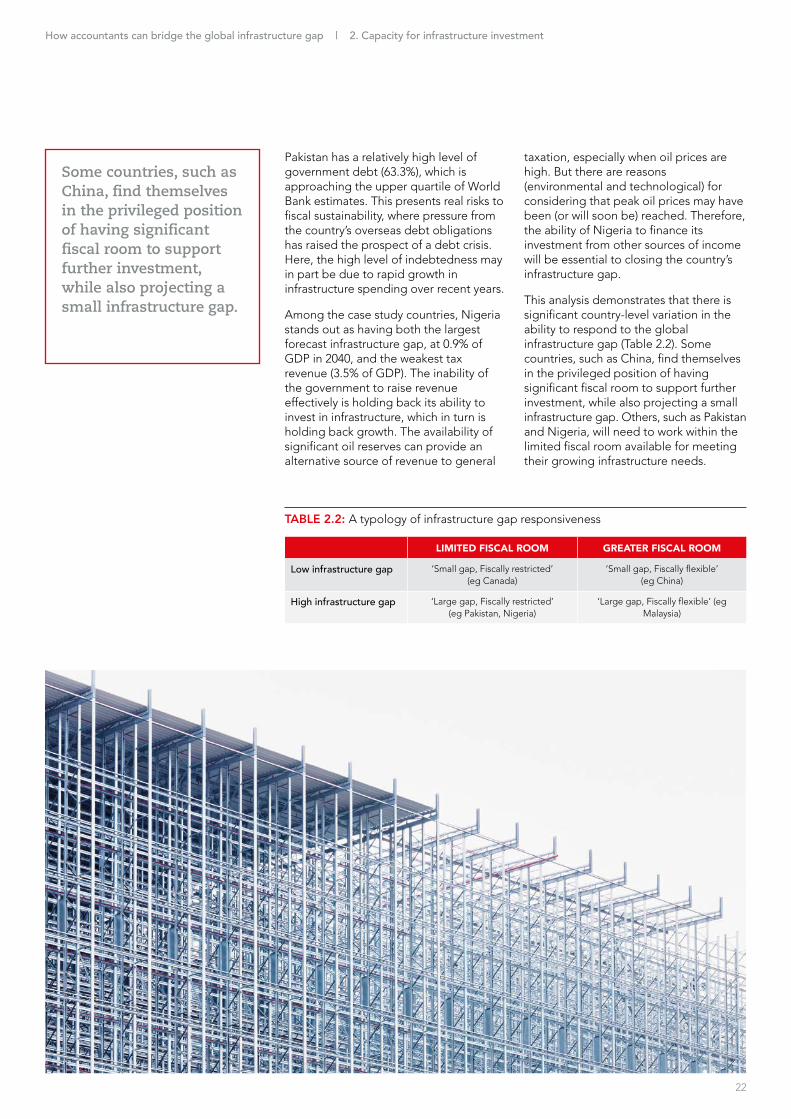
Some countries such as China find themselves in the privileged position of having significant fiscal room to support further investment while also projecting a small infrastructure gap
Pakistan has a relatively high level of government debt (633) which is approaching the upper quartile of World Bank estimates This presents real risks to fiscal sustainability where pressure from the countryrsquos overseas debt obligations has raised the prospect of a debt crisis Here the high level of indebtedness may in part be due to rapid growth in infrastructure spending over recent years
Among the case study countries Nigeriastands out as having both the largest forecast infrastructure gap at 09 of GDP in 2040 and the weakest tax revenue (35 of GDP) The inability of the government to raise revenue effectively is holding back its ability to invest in infrastructure which in turn is holding back growth The availability of significant oil reserves can provide an alternative source of revenue to general
taxation especially when oil prices are high But there are reasons (environmental and technological) for considering that peak oil prices may have been (or will soon be) reached Therefore the ability of Nigeria to finance its investment from other sources of income will be essential to closing the countryrsquos infrastructure gap
This analysis demonstrates that there is significant country-level variation in the ability to respond to the global infrastructure gap (Table 22) Some countries such as China find themselves in the privileged position of having significant fiscal room to support further investment while also projecting a small infrastructure gap Others such as Pakistan and Nigeria will need to work within the limited fiscal room available for meeting their growing infrastructure needs
22
How accountants can bridge the global infrastructure gap | 2 Capacity for infrastructure investment
TABLE 22 A typology of infrastructure gap responsiveness
LIMITED FISCAL ROOM GREATER FISCAL ROOM
Low infrastructure gap lsquoSmall gap Fiscally restrictedrsquo(eg Canada)
lsquoSmall gap Fiscally flexiblersquo(eg China)
High infrastructure gap lsquoLarge gap Fiscally restrictedrsquo(eg Pakistan Nigeria)
lsquoLarge gap Fiscally flexiblersquo (eg Malaysia)
23
3 Selecting projects
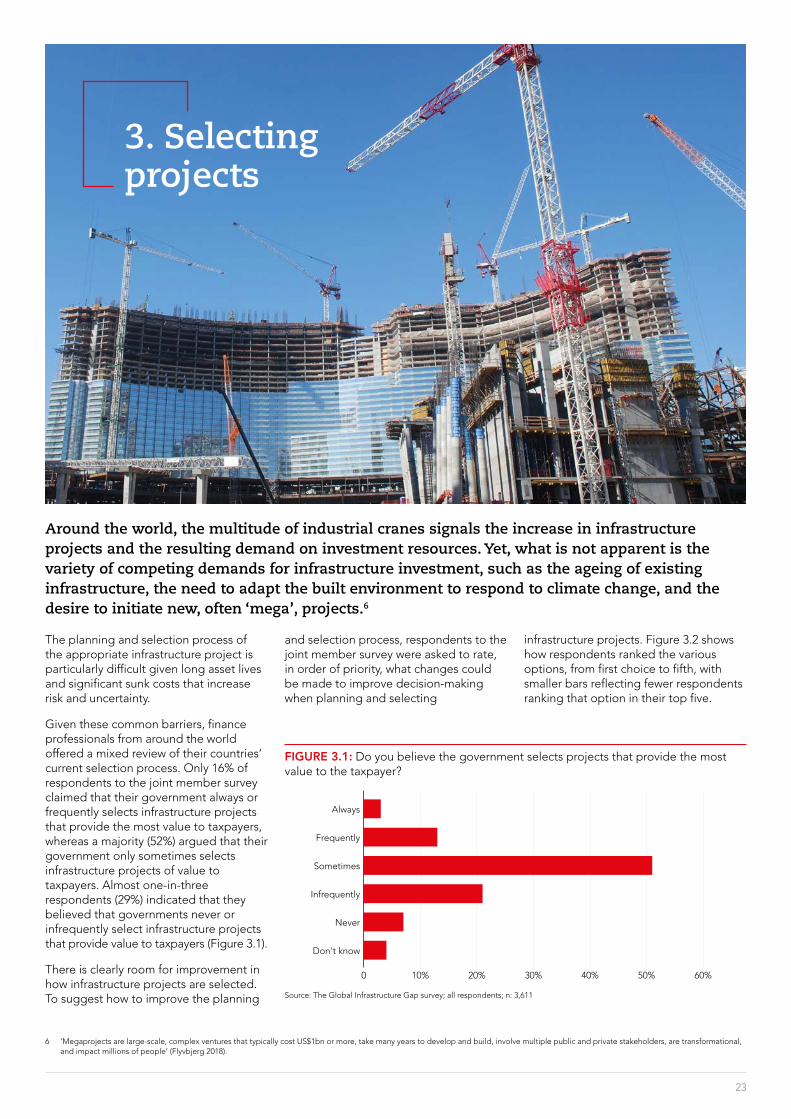
Around the world the multitude of industrial cranes signals the increase in infrastructure projects and the resulting demand on investment resources Yet what is not apparent is the variety of competing demands for infrastructure investment such as the ageing of existing infrastructure the need to adapt the built environment to respond to climate change and the desire to initiate new often lsquomegarsquo projects6
The planning and selection process of the appropriate infrastructure project is particularly difficult given long asset lives and significant sunk costs that increase risk and uncertainty
Given these common barriers finance professionals from around the world offered a mixed review of their countriesrsquo current selection process Only 16 of respondents to the joint member survey claimed that their government always or frequently selects infrastructure projects that provide the most value to taxpayers whereas a majority (52) argued that their government only sometimes selects infrastructure projects of value to taxpayers Almost one-in-three respondents (29) indicated that they believed that governments never or infrequently select infrastructure projects that provide value to taxpayers (Figure 31)
There is clearly room for improvement in how infrastructure projects are selected To suggest how to improve the planning
and selection process respondents to the joint member survey were asked to rate in order of priority what changes could be made to improve decision-making when planning and selecting
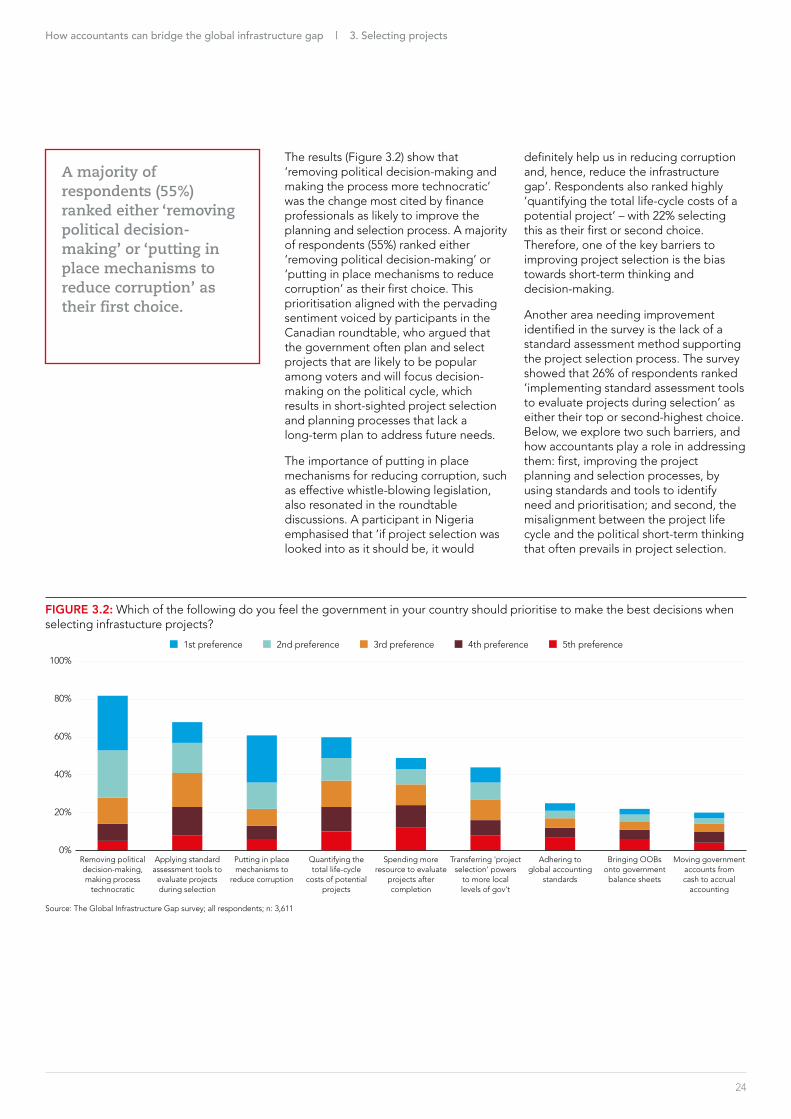
infrastructure projects Figure 32 shows how respondents ranked the various options from first choice to fifth with smaller bars reflecting fewer respondents ranking that option in their top five
FIGURE 31 Do you believe the government selects projects that provide the most value to the taxpayer
0 10 20 30 40 50 60
Always
Frequently
Sometimes
Infrequently
Never
Dont know
Source The Global Infrastructure Gap survey all respondents n 3611
6 lsquoMegaprojects are large-scale complex ventures that typically cost US$1bn or more take many years to develop and build involve multiple public and private stakeholders are transformationaland impact millions of peoplersquo (Flyvbjerg 2018)
24
A majority of respondents (55) ranked either lsquoremoving political decision-makingrsquo or lsquoputting in place mechanisms to reduce corruptionrsquo as their first choice
The results (Figure 32) show that lsquoremoving political decision-making and making the process more technocraticrsquo was the change most cited by finance professionals as likely to improve the planning and selection process A majority of respondents (55) ranked either lsquoremoving political decision-makingrsquo or lsquoputting in place mechanisms to reduce corruptionrsquo as their first choice This prioritisation aligned with the pervading sentiment voiced by participants in the Canadian roundtable who argued that the government often plan and select projects that are likely to be popular among voters and will focus decision-making on the political cycle which results in short-sighted project selection and planning processes that lack a long-term plan to address future needs
The importance of putting in place mechanisms for reducing corruption such as effective whistle-blowing legislation also resonated in the roundtable discussions A participant in Nigeria emphasised that lsquoif project selection was looked into as it should be it would
definitely help us in reducing corruption and hence reduce the infrastructure gaprsquo Respondents also ranked highly lsquoquantifying the total life-cycle costs of a potential projectrsquo ndash with 22 selecting this as their first or second choice Therefore one of the key barriers to improving project selection is the bias towards short-term thinking and decision-making
Another area needing improvement identified in the survey is the lack of a standard assessment method supporting the project selection process The survey showed that 26 of respondents ranked lsquoimplementing standard assessment tools to evaluate projects during selectionrsquo as either their top or second-highest choice Below we explore two such barriers and how accountants play a role in addressing them first improving the project planning and selection processes by using standards and tools to identify need and prioritisation and second the misalignment between the project life cycle and the political short-term thinking that often prevails in project selection
How accountants can bridge the global infrastructure gap | 3 Selecting projects
FIGURE 32 Which of the following do you feel the government in your country should prioritise to make the best decisions when selecting infrastucture projects
Removing political decision-making making process
technocratic
100
80
60
40
20
0
n 1st preference n 2nd preference n 3rd preference n 4th preference n 5th preference
Applying standard assessment tools to
evaluate projects during selection
Putting in place mechanisms to
reduce corruption
Quantifying the total life-cycle
costs of potential projects
Spending more resource to evaluate
projects after completion
Transferring project selection powers
to more local levels of govt
Adhering to global accounting
standards
Bringing OOBs onto government
balance sheets
Moving government accounts from cash to accrual
accounting
Source The Global Infrastructure Gap survey all respondents n 3611
25
How accountants can bridge the global infrastructure gap | 3 Selecting projects
The constrained optimisation method is another tool that can be used for project selection though it is usually reserved for complex and large projects that require mathematical optimisation before decisions are made
31 BARRIER 1 LACK OF A STANDARD PROJECT SELECTION METHOD ndash FACTORING IN lsquoNEEDrsquo AND lsquoPRIORITISATIONrsquoA participant in the Trinidad amp Tobago roundtable commented that planning and project selection is lsquohardly ever done on a needs basis We do not complete a needs assessment when were building a road costing millions of dollars What is the benefit that we are going to bring to society from that new infrastructurersquo Establishing a need is a key consideration in building the case for selecting a particular project Although there are no international standards or regulations for infrastructure project selection the Guide to Project Management Book of Knowledge (PMBOK) (Project Management Institute 2017) sets out a process whereby the lsquoneedrsquo for the project is identified first and classified as most important in the selection This can be done by conducting a needs assessment or feasibility study and supports the reasons for lsquowhyrsquo the project is required The lsquowhyrsquo may be stimuli such as a market demand a business need a customer request a technological advance a legal requirement or a socialenvironmental need
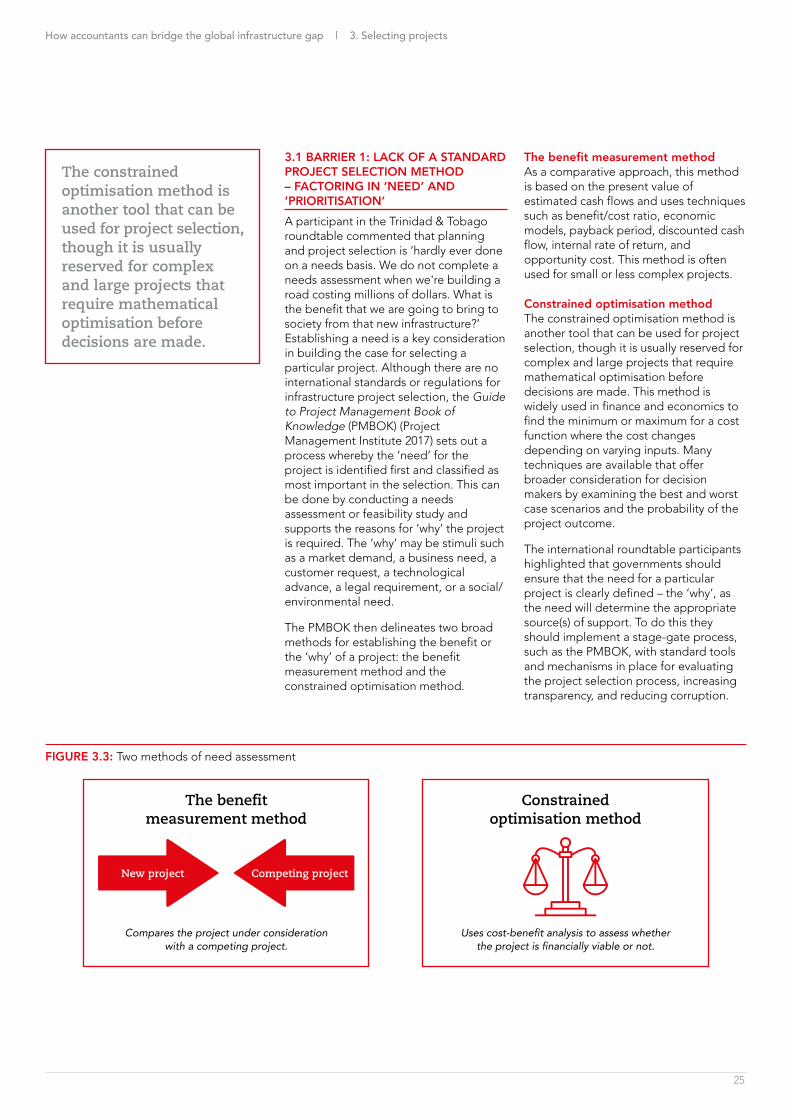
The PMBOK then delineates two broad methods for establishing the benefit or the lsquowhyrsquo of a project the benefit measurement method and the constrained optimisation method
The benefit measurement methodAs a comparative approach this method is based on the present value of estimated cash flows and uses techniques such as benefitcost ratio economic models payback period discounted cash flow internal rate of return and opportunity cost This method is often used for small or less complex projects
Constrained optimisation methodThe constrained optimisation method is another tool that can be used for project selection though it is usually reserved for complex and large projects that require mathematical optimisation before decisions are made This method is widely used in finance and economics to find the minimum or maximum for a cost function where the cost changes depending on varying inputs Many techniques are available that offer broader consideration for decision makers by examining the best and worst case scenarios and the probability of the project outcome
The international roundtable participants highlighted that governments should ensure that the need for a particular project is clearly defined ndash the lsquowhyrsquo as the need will determine the appropriate source(s) of support To do this they should implement a stage-gate process such as the PMBOK with standard tools and mechanisms in place for evaluating the project selection process increasing transparency and reducing corruption
FIGURE 33 Two methods of need assessment
Uses cost-benefit analysis to assess whether the project is financially viable or not
Constrained optimisation method
The benefit measurement method
Compares the project under consideration with a competing project
New project Competing project
How accountants can bridge the global infrastructure gap | 3 Selecting projects
Alongside the technical methods available for isolating need and priority accountants can produce a broader range of metrics to improve the projection selection process
In practice many governments do not have the resources or the capacity to carry out such assessments across all projects and usually with the limited information available they place emphasis on basic elements of project appraisal which include lsquorules of thumbrsquo to confirm that
bull the need for the project is justified
bull the projectrsquos objectives are clearly specified
bull broad alternatives to the project are considered
bull promising options are analysed
bull project costs are fully estimated and
bull project benefits are assessed
Even by applying the basic elements of project appraisal prioritisation (or ultimately selecting the right project) can still be a constraint The World Bank has developed an innovative and adaptable Infrastructure Prioritization Framework (IPF) (Marcelo et al 2016) to assist governments in making the best use of their limited information in the interim until they are able to increase their capacity and resources for conducting a more informed and extensive analysis
The IPF provides a stepping-stone approach to project prioritisation for government decision-making This multi-criterial decision-support tool builds on existing and accessible data to help governments compare projects while promoting the building of analytical capacity and data for more extensive financial and economic analysis It is seen as an extension to the current set of tools available to support project selection It starts from a baseline of ad hoc uninformed project selection (where technical project information is limited and subjective) to partial technical information (where some information and analysis is available) to a full selection by advanced project appraisal (where considerable technical information is available)
Alongside the technical methods available for isolating need and priority accountants can produce a broader range of metrics to improve the projection selection process For example project planning and selection in Japan considers the effect of infrastructure investment on achieving regional equity instead of selecting projects that give the highest direct economic return (International Transport Forum 2017) This approach prioritises more evenly spread economic development in a country even where an optimisation model would suggest investment elsewhere
Box 31 Sustainability and infrastructure A Canadian case
The Canadian wave of the survey included a question on sustainability and infrastructure 80 of Canadian respondents indicated that they believe that it is very important to adapt to the impacts of the changing climate such as severe weather in planning infrastructure projects
It is important now more than ever to build resiliency into infrastructure investments Roads bridges buildings public transit and water and wastewater systems are at increasing physical risk from the impacts of climate change
The Canadian government declared in the 2017 federal budget that it plans to invest CAD219bn in green infrastructure Specifically CAD2bn is dedicated to a Disaster Mitigation and Adaptation fund to support the federal provincialterritorial and municipal infrastructure needed to address climate change Canadian national building codes have been updated to integrate climate adaptation and
resiliency considerations resulting from significant disaster losses Canadian insurance companies are experiencing the impact the annual insured damage for 2016 was CAD49bn ndash a significant increase from the previous annual record of CAD32bn set in 2013 In 2016 the biggest claims arose from the Fort McMurray wildfires which resulted in approximately CAD37bn in insured damage
Any future costs of inaction will likely outweigh the incremental investments made today in enhancing and modifying infrastructure resiliency Nonetheless too often there are challenges in making the business case for projects that incorporate adaptation measures But as with most modifications in the long run it is always easier and cheaper to build resilience considerations into asset development from the start rather than adding them later in response to a major event n
26
How accountants can bridge the global infrastructure gap | 3 Selecting projects
The member survey revealed the need to quantify the total life-cycle cost and remove political decision making in order to improve project selection
32 BARRIER 2 MISALIGNMENT OF THE INFRASTRUCTURE LIFE CYCLE AND THE POLITICAL CYCLE The member survey revealed the need to quantify the total life-cycle cost and remove political decision making in order to improve project selection These two changes are likely prioritised because of the misalignment that commonly exists between the political cycle (often four to six years) and the total life cycle of an infrastructure asset (often over 20 years) This mismatch can generate two biases a bias towards short-term decision-making and a bias towards megaprojects over maintenance
Short-term bias in project selection New infrastructure investment is unavoidably long-term and this carries certain risks At the stages of early planning and project selection infrastructure decision-makers need to consider the forces shaping a country ndash such as social demographic and technological change ndash while providing sufficient flexibility to address unpredictable adjustments in need These variables do not align well with the typically shorter political cycle where there is often a preference for announcements of major projects that can be hard to execute in practice or where fundamental requirements may be missing (eg unfeasible building requirements or little forecasted demand for use of the infrastructure) To counteract this bias the UKrsquos National Infrastructure Commission (NIC) was established in 2015 to produce analysis that is independent of government and to provide advice on major long-term infrastructure challenges ndash with the specific priority of linking long-term priorities with short-term action The NIC publishes an annual National Infrastructure Assessment (eg NIC 2018) to establish infrastructure needs and priorities over many decades
Having an independent body of experts recommending a stable set of priorities can reduce investment risk as potential private sector partners will have certainty that a project aligns with a broader economic plan Establishing a national plan based on agreed priorities is also good practice for reducing short-termism and improving legitimacy but it can also add rigidity to project selection processes Decision-makers must be careful to balance the benefits of a stable framework with maintaining flexibility to respond to a rapidly changing policy environment
Bias towards mega-projects over maintenance There can be considerable bias towards allocating resource to new (preferably high-profile) projects rather than investing in the necessary maintenance of existing assets There can be a natural reluctance to spend money on what a country already has and there is often political appeal in wishing to establish an individual legacy through the construction of a megaproject Accountants are in a pivotal position to draw attention to the issue of prioritising backlog maintenance to ensure that assets remain in serviceable condition As part of any needs assessments careful consideration must be given to the condition of existing capital infrastructure and its ability to maintain the existing levels of service To balance these demands NHS Scotland publishes an annual assets and facilities report which provides an overview of asset performance and planned future investment (see NHS Scotland 2018) This report offers good practices in quantifying and managing the backlog of maintenance including setting out the total outstanding backlog of maintenance costs per square metre of the estate and the proportion of significant and high-risk maintenance By identifying the maintenance backlog NHS Scotland is able to take the appropriate action to mitigate a reduction in public service quality while also prioritising repairs in line with the metrics established in the annual assets and facilities report
27
28
How accountants can bridge the global infrastructure gap | 3 Selecting projects
Box 32 Accountants and climate-change adaptation planning A Canadian case in point
As governments around the globe move to establish planned spending on infrastructure projects designed to adapt to climate change it is essential that accountants have a role in project selection and planning to help make the business case for resiliency and to ensure adequate accountability
In Canada the efficacy of this practice was illustrated when the City of Montreal developed its Climate Change Adaptation Plan Accountants played an integral role in performing the cost-benefit analysis of embedding adaptation into municipal infrastructure decisions (CPA Canada 2016)
lsquoA less costly option may be deemed adequate today but could result in future costsrsquo explained a participant in the Canadian roundtable
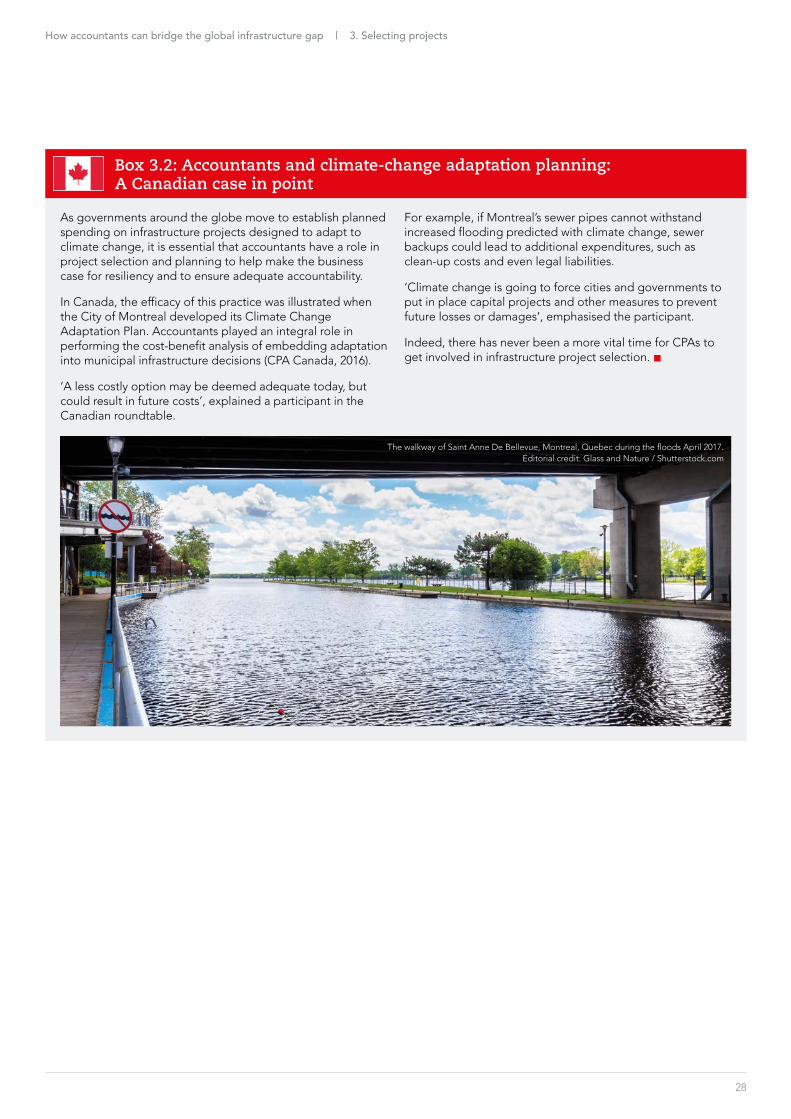
For example if Montrealrsquos sewer pipes cannot withstand increased flooding predicted with climate change sewer backups could lead to additional expenditures such as clean-up costs and even legal liabilities
lsquoClimate change is going to force cities and governments to put in place capital projects and other measures to prevent future losses or damagesrsquo emphasised the participant
Indeed there has never been a more vital time for CPAs to get involved in infrastructure project selection n
The walkway of Saint Anne De Bellevue Montreal Quebec during the floods April 2017Editorial credit Glass and Nature Shutterstockcom
29
4 Financing projects
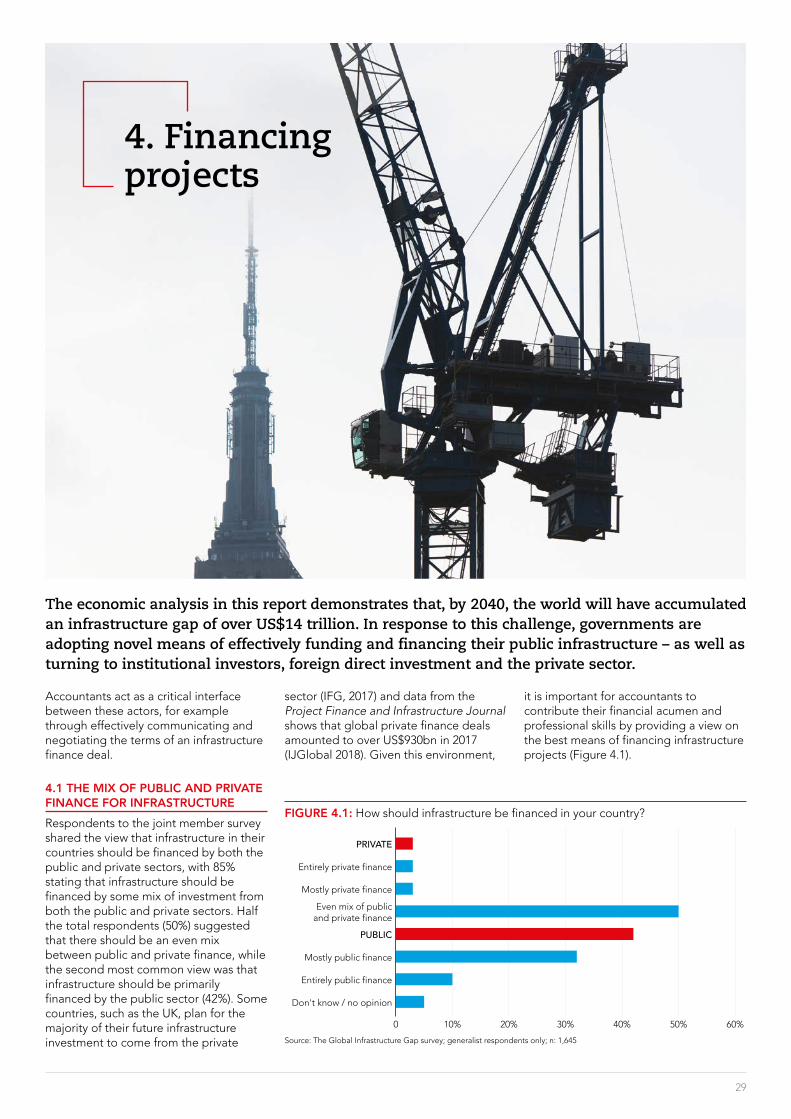
The economic analysis in this report demonstrates that by 2040 the world will have accumulated an infrastructure gap of over US$14 trillion In response to this challenge governments are adopting novel means of effectively funding and financing their public infrastructure ndash as well as turning to institutional investors foreign direct investment and the private sector
Accountants act as a critical interface between these actors for example through effectively communicating and negotiating the terms of an infrastructure finance deal
41 THE MIX OF PUBLIC AND PRIVATE FINANCE FOR INFRASTRUCTURERespondents to the joint member survey shared the view that infrastructure in their countries should be financed by both the public and private sectors with 85 stating that infrastructure should be financed by some mix of investment from both the public and private sectors Half the total respondents (50) suggested that there should be an even mix between public and private finance while the second most common view was that infrastructure should be primarily financed by the public sector (42) Some countries such as the UK plan for the majority of their future infrastructure investment to come from the private
sector (IFG 2017) and data from the Project Finance and Infrastructure Journal shows that global private finance deals amounted to over US$930bn in 2017 (IJGlobal 2018) Given this environment
it is important for accountants to contribute their financial acumen and professional skills by providing a view on the best means of financing infrastructure projects (Figure 41)
FIGURE 41 How should infrastructure be financed in your country
0 10 20 30 40 50 60
PRIVATE
Entirely private finance
Mostly private finance
Even mix of public and private finance
PUBLIC
Mostly public finance
Entirely public finance
Dont know no opinion
Source The Global Infrastructure Gap survey generalist respondents only n 1645
30
and core public service infrastructure Core public service infrastructure such as hospitals and schools attracted the lowest private finance support
Overall finance and accounting professionals with a specialist background took a balanced view on the appropriate finance sources for infrastructure in their country
42 KEY BARRIERS TO SECURING PRIVATE FINANCE FOR INFRASTRUCTUREThe member survey showed that 85 of respondents believed there should be some mix of public and private sector finance in their countryrsquos infrastructure A key question therefore is what barriers limit the flow of private finance for public infrastructure
Survey respondents with specific expertise in infrastructure (lsquospecialistsrsquo ) provided a detailed breakdown on the suggested balance of public and private investment by each type of infrastructure
7
Almost half (47) of specialist respondents argued that ICT infrastructure should be either mostly or entirely financed by the private sector while other transport ndash such as air or sea ndash ranked as the second highest subsector for private sector investment (36) (Figure 42) There was a consistent view across the infrastructure subsectors that there should be an even mix of public and private investment with between 33 and 46 of specialist respondents holding this view Only three subsectors were seen to benefit from finance originating mostly or entirely from the public sector these were water and sanitation roads and highways
How accountants can bridge the global infrastructure gap | 4 Financing projects
Overall finance and accounting professionals with a specialist background took a balanced view on the appropriate finance sources for infrastructure in their country
FIGURE 42 How should infrastructure be financed in your home country by infrastructure sub-sector
Dont know no opinion PUBLIC Even mix PRIVATE
Information and communication technology
Other transport
Power and energy
Railways
Water and sanitation
Roads and highways
Core public service infrastructure
0 10 20 30 40 50 60 70 80 90 100
n n n n
0 10 20 30 40 50
Insufficient skills in government to negotiate with private sector
Lack of attractiveness of infrastructure investment
Negative perception of private finance for public infrastructure
Regulatory barriers
Perceived political instability in my country
Underdeveloped financial markets in my country
Too few viable projects for private investment
Other
Dont know
FIGURE 43 What are the key challenges that the government faces in securing private finance
Source The Global Infrastructure Gap survey all respondents n 3611
Source The Global Infrastructure Gap survey specialist respondents only n 1966
7 Question 3 of the survey asked respondents if their work involved any of the following areas infrastructure policy procurement capital budgeting project management or operations management
How accountants can bridge the global infrastructure gap | 4 Financing projects
Developing the skills in government to act as competent clients and negotiators will be essential in meeting the challenges of providing the right finance for infrastructure projects
As seen in Figure 43 ACCA members and CPA Canada members identified three key barriers for governments working to secure private finance
Barrier 1 the lack of attractiveness of infrastructure investment (42)
Barrier 2 the negative perception of private finance for public infrastructure (43) and
Barrier 3 insufficient skill in government to negotiate with the private sector (45 of respondents)
The distinction between lsquofundingrsquo and lsquofinancingrsquo infrastructure (set out in the next section) helps explain the lack of attractiveness of infrastructure investment and what accountants might do to reduce this problem The higher cost and perceived private gain from public goods is a significant factor in the negative perception of private finance investing in public infrastructure The UK National Audit Office published a report in January 2018 calling out the high rates of return enjoyed by private investors participating in the Private Finance Initiative (Morse 2018) Therefore accountants must take centre stage in
demonstrating the higher cost of private capital managing the transfer of risk between sectors and building an evidence base for selecting the right financing model to support an infrastructure project
Finally developing the skills in government to act as competent clients and negotiators will be essential in meeting the challenges of providing the right finance for infrastructure projects For example there is growing recognition that gold-standard public finance takes account of more than debt stocks and cash flows (eg debt to GDP ratio and tax receipts) and instead needs to consider net wealth particularly public assets Cultivating the skills in government to produce a public sector balance sheet and applying this perspective to the finance selection process will help policymakers maximise the value of their assets and make better infrastructure finance decisions
The remainder of this chapter will discuss these barriers in order to inform areas where public sector accountants can make a difference in closing the infrastructure gap
FIGURE 44 Key barriers in financing infrastructure projects
Lack of attractiveness
of infrastructure investment
Negative perception of
private finance for public
infrastructure
Insufficient skill in government
to negotiate with the
private sector
BARRIER 1 BARRIER 2 BARRIER 3
42 43 45
31
How accountants can bridge the global infrastructure gap | 4 Financing projects
Investment in infrastructure offers the opportunity for private investors to benefit from stable long-term low-risk returns that are tied to a physical asset
43 BREAKING DOWN BARRIER 1 BY CLOSING THE FUNDING GAP
Investment in infrastructure offers the opportunity for private investors to benefit from stable long-term low-risk returns that are tied to a physical asset A key challenge in connecting this pool of private capital with the demand for infrastructure projects is the funding gap Broadly there are three ways of funding (lsquoultimately paying forrsquo) an infrastructure project
Distinguishing between funding and financing It is important to make a clear distinction between the lsquofundingrsquo and lsquofinancingrsquo of infrastructure projects When a private sector institution such as a bank or pension fund finances a public infrastructure project it is providing the upfront money to allow for the design building and operation of that project whereas lsquofundingrsquo is how an infrastructure project is ultimately paid for (Institute for Government 2018)
Global capital markets can help plug the global infrastructure gap Institutional investors with an estimated US$80 trillion in assets under management (Fages et al) seem ideal partners for providing the required finance to reduce the size of the forecasted global infrastructure gap Their risk appetite and the duration of their liabilities match the needs of typical infrastructure projects that will often have life cycles ndash from design to decommission ndash that can span many decades
bull general taxation
bull user charges (eg toll roads) and
bull novel forms of funding (eg value capture and civic crowdfunding)8
This distinction explains why even where private investors have expressed interest in public infrastructure and while the global infrastructure gap grows the response has been relatively muted (McKinsey 2016a) Private investors understandably require a stream of revenue to support their upfront outlay but many potential (even lsquoshovel readyrsquo) projects do not include the long-term funding arrangements to support private finance
FIGURE 45 The funding gap
Global Infrastructure Investment Gap
(forecasting a US$14 trillion gap by 2040) FUNDING
GAP
Institutional Investors
(US$80 trillion under management)
8 Refer to Institute for Government 2018 for an overview of the advantages and disadvantages of different infrastructure funding options
32
Box 41 Hong Kongrsquos MTR Corporation ndash fully funded infrastructure through value capture
Hong Kong has applied a novel form of infrastructure funding that has attracted global attention MTR Corporation is majority owned by the Hong Kong government and manages a passenger rail system that makes a profit It manages to generate revenue in excess of 180 of its operating cost
One factor in MTRrsquos financial success has been its lsquoRail plus Propertyrsquo model where the corporation captures some of the positive externalities of its transit operations by developing and renting the land surrounding its rail stations
Hong Kong is particularly suited to this form of funding with its dense population and high real estate costs which have allowed MTR to create sustainable revenue streams from the development of the land surrounding its stations (Leong 2016 MTR Corporation 2017) n
Innovative models of funding infrastructureGeneral taxation and government capital allocations provide an important foundation for funding public infrastructure while user charges can provide a stream of revenue (eg road tolls) ndash subject to demand risks There are also emerging models that are helping to plug the funding gap Rent capture is attracting attention as a method of funding transit (see Box 41 on the MTR Corporation in Hong Kong for an example) In addition civic crowdfunding a novel form of funding is spreading in popularity A report from Catapult Future Cities (2017) found that 10 of local governments in the UK now make use of some form of civic crowdfunding to transform their communities Spacehive ndash a UK crowdfunding platform ndash has attracted over pound11 million in funding since 2012 to fund over 550 local projects including building new community centre facilities (Spacehive 2019) Platforms such as Spacehive connect grant providers local governments and residents that collectively contribute to projects as well as providing a service to verify that a project is viable and has received the required government permissions In 2017 the Mayor of London committed pound400000 to Spacehive projects (OrsquoDowling-Keane 2017) As governments face constrained budgets public sector
finance officials can play a central role in supporting these novel forms of infrastructure funding by establishing what proposals are financially viable in order to help plug the infrastructure gap
The role of the accountant in addressing the funding gapBeyond these novel funding models accountants can play an important role by helping to identify the most efficient funding models while also taking a leading role on the negotiation with potential private sector investors and representing the public interest through their high ethical standards
Clearly the funding gap is a factor in lsquothe lack of attractiveness of infrastructure investment for private investorsrsquo identified in the member survey Finance professionals should consider a number of factors in formulating effective business cases that can attract private sector finance (eg in articulating the lsquoprivate sector incentiversquo) The financial viability of the project needs to be balanced against affordability for users and access to public goods and services Accountants must consider how they can develop and communicate the private sector incentive for investing in priority projects while also supporting the public interest and providing taxpayers with value for money
33
How accountants can bridge the global infrastructure gap | 4 Financing projects
General taxation and government capital allocations provide an important foundation for funding public infrastructure while user charges can provide a stream of revenue (eg road tolls) ndash subject to demand risks
34
How accountants can bridge the global infrastructure gap | 4 Financing projects
44 BREAKING DOWN BARRIER 2 BY ACCOUNTING FOR THE HIGHER COST OF PRIVATE CAPITALRunning infrastructure projects efficiently for citizens also requires that accountants provide decision-makers with the best advice possible in selecting the appropriate source of project finance
The UK is a global leader in the use of private finance and has over 700 operational private finance deals ndash with total projected future charges arising from these deals of almost pound200bn (Morse 2018) In 2018 The UKrsquos National Audit Office published a report examining the rationale costs and benefits of private finance for public sector projects (Morse 2018) The reportrsquos analysis of Department for Education data showed that the cumulative cost of privately financed projects can exceed the public sector
finance costs by 40 over the life of an infrastructure project The broader benefits of private finance for example transferring risk away from government must therefore outweigh the higher total life-cycle cost of private capital
Off balance sheet liabilities in public sector accountingThe UK is not alone in making use of private finance to provide the upfront capital for public infrastructure The accounting rules set by the European System of Accounts excludes liabilities from public sector balance sheets if the private sector bears most of the projectrsquos risks and rewards The types of risk contributing to this test include construction risks (eg cost and time overruns) and demand risks (eg forecasted and actual use of the infrastructure asset) (Atkins et al 2017) Liabilities not included
By the nature of the public sector there are many competing short-term needs for public capital investment where necessary infrastructure investment must compete with other public spending priorities
35
30
25
20
15
10
05
0
Portu
gal
Slov
akia
Hungar
y
UK
Cypru
s
Irelan
dN
ethe
rland
s
Spain
Denm
ark
Esto
nia
Belgiu
m
Gre
ece
Croat
ia
Austri
a
Malt
a
Italy
Finl
and
Latv
ia
FIGURE 47 Off balance sheet PPPs as of GDP
Source ACCA and CPA Canada analysis of Eurostat 2018
FIGURE 46 Estimated cash flows of a privately and publicly financed projectThe cumulative cash costs of a group of PF2 schools are around forty per cent higher than the costs of a project financed by government borrowing
350000
300000
250000
200000
150000
100000
50000
0
Cumulative cash costs (pound000)
2015 2016 2017 2018 2019 2020 2021 2022 2023 2024 2025 2026 2027 2028 2029 2030 2031 2032 2033 2034 2035 2036 2037 2038 2039 2040 2041 2042
Benefits needed to offset higher costs of private finance procurement
PF2 unitary charges Public sector comparator (PSC) with government borrowing costs
Notes1 Cost estimates taken from data prepared by the Department for Education to compare costs of a group of privately financed (PF2) schools with a public sector comparator (PSC)
2 Interest costs for the PSC have been modelled using an amortising loan with an interest rate of 25 The 20-year government borrowing costs were 25 at the time of financial close of this project and the average life of the project debt was less than 20 years
Source Education Funding Agency National Audit Office analysis Reproduced from Morse 2018
How accountants can bridge the global infrastructure gap | 4 Financing projects
Accountants in the public sector must play a critical role in managing both these benefits while also collecting reliable data to measure whether private finance provides good value for money
on the public sector balance sheet are known as off balance sheet (OBS) liabilities Data from Eurostat shows that other European countries have amassed considerable OBS liabilities ndash with outliers such as Portugal and Slovakia maintaining OBS liabilities in excess of 3 of GDP (Eurostat 2018)
An incentive for using private finance can arise through the combination of fiscal rules such as the EUrsquos Fiscal Compact requiring governments to meet debt reduction targets (European Commission 2017) and the ability to keep certain liabilities off the balance sheet through private finance Governments will be encouraged to use private finance even when it ultimately costs more than traditional public finance when this generates the fiscal illusion of adhering to fiscal rules while at the same time building and operating necessary infrastructure In addition to the fiscal illusion these treatments limit the transparency of infrastructure finance by shielding some politicians and the public from understanding the true cost of infrastructure investment in a particular country
Insufficient flexibility between capital and operational budgets can cause further challenges This is particularly the case where a public sector entity can attribute the unitary charge9 from a private finance deal to its operational budgets in cases where the capital budget includes insufficient funding for a required project By the nature of the public sector there are many competing short-term needs for public capital investment where necessary infrastructure investment must compete with other public spending priorities ndash such as the growing operational costs of health care and education But over time high unitary charges can crowd out operational budgets and prevent future governments from providing quality public services
Why use private finance for public infrastructure Given all these concerns it is unsurprising that in the October 2018 Budget Speech the UK Chancellor confirmed that the government would not sign any new Private Finance Initiative (PFI) contracts (Plimmer 2018) Given this environment it is worth asking what is the genuine rationale for private finance in public infrastructure
Two key benefits can justify the use of private finance for public infrastructure the appropriate transfer of risk from the public to the private sector in the building and running of the infrastructure and efficiencies achieved through the use of private sector money in the financing building and operation of public infrastructure Accountants in the public sector must play a critical role in managing both these benefits while also collecting reliable data to measure whether private finance provides good value for money The next chapter explores findings from the member survey on how best to manage the relationship between public and private actors involved in infrastructure projects
At the early stages of a projectrsquos conception accountants are also critical in selecting the right type of finance where they can provide a transparent assessment of the best finance option based on sound principles (eg value for money affordability for users and distribution impacts) Previous ACCA research shows the high level of trust in the ethical behaviour of accountants Ethics and Trust in a Digital Age (ACCA 2017) found that 9 in 10 professional accountants agree that ethical behaviour helps to build trust in the digital age And almost all C-suite executives (95) assert that the accountantrsquos ethical behaviour helps the organisation build trust with internal and external stakeholders Accountants can offer a collective good through this privileged position of trust by providing sound transparent advice on the best finance option for a particular infrastructure project
9 The recurring payments by governments for privately financed projects
35
How accountants can bridge the global infrastructure gap | 4 Financing projects
The barrier to attracting private finance for infrastructure most cited in the member survey was that governments have insufficient skill to negotiate effectively with the private sector (45)
45 BREAKING DOWN BARRIER 3 BY PROFESSIONALISING THE PUBLIC SECTOR FINANCE FUNCTION The barrier to attracting private finance for infrastructure most cited in the member survey was that governments have insufficient skill to negotiate effectively with the private sector (45) This issue was echoed in the roundtables with participants in Trinidad and Tobago stating that there was a clear need to differentiate professional accountants from those who had no real professional training lsquoterms are used very loosely in this country as to an accountant and most times you would mean ldquobookkeeperrdquorsquo Others in Malaysia noted that lsquomany accountants nowadays lack the right specialisation of skills in terms of having foresight to anticipate what costshellipcome into play [in an infrastructure project]rsquo Clearly there are skills gaps in government that need to be addressed through professionalisation and upskilling if infrastructure is to be properly financed
Finance professionals offer a net wealth perspective Knowing what the country owns and what it owes is a basic requirement for reducing its governmentrsquos information deficits which will allow for improved decision-making in financing infrastructure The professional management of assets and the development of an asset register are two examples of how accountants can take the lead in improving government decision-making In the UK roundtable discussion David Smith associate partner at EY UK also acknowledged the essential role of accounting standards
lsquoAccountantsrsquo work now goes beyond compliance but compliance is our firm foundation Speaking from experience we have global accounting rules that do not necessarily align jurisdiction by jurisdiction but the rules are there for a reason If therersquos deviation or rejection of accounting standards for infrastructure projects at any stage then that is a clear red flagrsquo
Global studies are documenting how the benefits of accrual accounting are leading to broad global adoption For example the 2018 International Public Sector Financial Accountability Index forecasts that within the next five years 65 of governments will report on an accrual accounting basis ndash with particularly high levels of adoption in Africa Asia Latin America and the Caribbean (IFAC and CIPFA 2018)
The professionalisation of the finance function is essential in maximising the value of a countryrsquos assets There is growing recognition that gold-standard public finance practice takes account of more than debt stocks and cash flows (eg debt to GDP and tax receipts) and instead needs to consider net wealth where the right policies can maximise the return on public assets This approach requires the adoption of full accrual accounting and the production of a public sector balance sheet Improving the skills available to government to develop a public sector balance sheet and appreciating the full balance sheet impact of a new project will be an important step in allowing public sector accountants to act as competent clients of and negotiators with the private sector
36
How accountants can bridge the global infrastructure gap | 4 Financing projects
37
Maximising the value of public assets and the intertemporal balance sheetDag Detter a former director of Swedenrsquos Ministry of Industry argues that taking a net wealth perspective with the aim of producing small improvements in the return on public assets would allow for a doubling in infrastructure investment (Detter and Folster 2017) The competing argument to this view is that many public assets are not marketable as policy objectives (eg running a public school) do not typically align with generating financial returns
The New Zealand government seeks to address this issue by classifying its assets and liabilities as social financial and commercial ndash where commercial assets have more scope for financial returns New Zealand has taken the lead in public
The adoption of this net wealth perspective changes the typical rankings of public financial capability In late 2018 the IMF Fiscal Monitor published a report (IMF 2018) which estimated that globally governments had public assets worth over 200 of GDP Applying this analysis can also support good public financial management in a country with the IMF report showing that countries with a strong balance sheet pay lower interest on debt and have shorter and shallower recessions
Figure 48 shows the result of adopting a net wealth view of a nationrsquos financial position Using this lens Japan ndash with a notoriously high public-debt-to-GDP ratio ndash has a net wealth position near zero Other countries such as the UK and Portugal have substantial negative public equity in excess of 100 of GDP
The professionalisation of the finance function is essential in maximising the value of a countryrsquos assets
FIGURE 48 Public sector balance sheets ( of GDP)
750
500
250
0
-250
-500
Port
ugal
Uni
ted
Kin
gd
om
The
Gam
bia
Ger
man
y
Bra
zil
Fran
ce
Aus
tria
El S
alva
do
r
Uni
ted
Sta
tes
Ug
and
a
Jap
an
Ken
ya
Tanz
ania
Can
ada
Ind
ia
Gua
tem
ala
Finl
and
Alb
ania
Co
lom
bia
Tuni
sia
Geo
rgia
Sout
h A
fric
a
Aus
tral
ia
New
Zea
land
Ind
one
sia
Ko
rea
Peru
Kaz
akhs
tan
Russ
ia
No
rway
n Financial assets n Total non-financial assets n Liabilities ex pension n Pension liabilities Net worthTu
rkey
Source IMF staff estimates
Based on a single year of data in most cases compiled as part of the Fiscal Transparency Evaluation Albania 2013 Austria 2015 Brazil 2014 Colombia 2016 The Gambia 2016 Guatemala 2014 Kenya 2013 Peru 2013 Portugal 2012 Tanzania 2014 Tunisia 2013 Turkey 2013 Uganda 2015
38
How accountants can bridge the global infrastructure gap | 4 Financing projects
TABLE 41 New Zealand Intertemporal balance sheet 2016(Percentage of GDP)
ASSETS LIABILITIES NET WORTH
Social 575 71 505
Financial 332 505 -173
Commercial 201 120 81
Static balance sheet 1108 695 413
Fiscal 13819 14800 -981
Intertemporal balance sheet 14927 15495 -568
Source New Zealand 2017 Investment Statement IMF 2018
Box 42 New South Wales Treasury Asset and Liability Committee
The state of New South Wales in Australia has established an Asset and Liability Committee to maximise the value of their assets and properly manage the statersquos liabilities
By using this total balance sheet perspective the New South Wales Treasury has been able to unlock AU$33bn for new social and economic infrastructure projects
This initiative was recorded as part of a series undertaken by ACCA and the International Federation of Accountants (IFAC) documenting good practices in public financial management from around the world To learn more scan the QR code to hear more about this initiative in NSW
If the public sector finance function is professionalised accountants working in the public sector will be able to lead the development of the required governance structures to maximise the value of public assets And where public assets do present commercial opportunity accountants must be at the forefront of proper public commercial asset management By providing independent professional management for public assets governments will be well placed to maximise the value of their assets and minimise the cost of liabilities The member survey shows that reducing political influence in project selection was ranked as the number one issue for improving outcomes Allocating more decision-making authority to independent professional accountants will be an important step in the effective commercial management of public assets
financial management practices not just through this classification but also by producing an intertemporal balance sheet (see Table 41) The country currently maintains a strong net worth position in excess of 40 of GDP but analysis by the New Zealand Treasury shows that the current policy framework will produce recurring deficits that are forecasted to reduce the nationrsquos net worth to almost ndash57 of GDP over the next 40 years Accountants producing this analysis provide decisions-makers with a better long-term view of their policy decisions and can help improve the sustainability of public finances This fits with the maxim that lsquoyou manage what you measurersquo and governments that invest in their finance functions to develop a public sector balance sheet will be better placed to understand the implications of a particular infrastructure project on the nationrsquos net wealth
Where public assets do present commercial opportunity accountants must be at the forefront of proper public commercial asset management
Poor monitoring and oversight of
projects by government
Confusion about where
each side provides value
in a PPP
Uncoordinated commerical
acumen in the public sector
BARRIER 1 BARRIER 2 BARRIER 3
5 Delivering projects the publicndashprivate relationship
Common challenges with infrastructure project selection and financing outlined in the previous chapters may persist through the project delivery phase a shortfall in public capital budgets due to short-term decision-making changing political governance and the lsquomegarsquo risks associated with lsquomegarsquo projects For these reasons public-private partnerships (PPPs) are often chosen for the delivery of public infrastructure projects
51 DEFINING PPP In the context of public infrastructure projects a PPP is a contractual agreement between a public sector entity and a private entity (or group) to provide a public asset or service (World Bank 2018b) Unlike traditional procurement ndash where all the risk will ultimately sit with the government ndash PPPs will explicitly set out the allocation of risk for a project Importantly the scope of private sector involvement can vary substantially including requiring private sector partners to
bull design and build a project
bull design finance and build a project or
bull design finance build operate and maintain a project
Asset ownership is another relevant consideration in establishing the terms of a PPP A project can feature public or private sector ownership of the infrastructure and can include provisions to transfer ownership after a set period (eg a private sector partner operates a toll road for 20 years and thereafter transfers ownership of the road back to the public sector)
The roundtable discussion rightly identified the variety of responsibilities that the private sector can adopt in
a PPP For example a participant in the Canadian roundtable identified that the lsquoprivate sector needs to bring more to the government table than just money it needs to offer expertise or opportunity that the government would not otherwise haversquo
52 KEY BARRIERS TO GETTING THE PPP RELATIONSHIP lsquoRIGHTrsquo The public-private relationship is evolving and getting the terms of this relationship right will be critical for the provision of social and economic infrastructure in the future The roundtable discussions with infrastructure experts highlighted three key barriers to this where there was a particular focus on the need to develop the right relationship between public and private sector actors ndash as getting this
relationship right would support the timely and efficient delivery of infrastructure projects (Figure 51)
The roundtable participants identified poor monitoring and oversight by government as a key challenge in delivering infrastructure projects The member survey demonstrated that there was considerable disagreement about where each party in a PPP agreement provides value in delivery Finally the roundtable participants stated that the public sector was often lacking the commercial acumen required to manage an infrastructure PPP effectively
Below this chapter examines these barriers in greater detail and reviews recommendations for overcoming each one
FIGURE 51 Key barriers in delivering infrastructure projects
3939
How accountants can bridge the global infrastructure gap | 5 Delivering projects the publicndashprivate relationship
Both developed and developing countries need to consider whether they are providing sufficient monitoring across the entire project life cycle to maximise the value of their contracts
53 BREAKING DOWN BARRIER 1 BY ENGAGING THE PROFESSIONAL ACCOUNTANT TO PROVIDE PROJECT LIFE-CYCLE MONITORING AND OVERSIGHT Successful project selection financing and procurement will be of little effect if an infrastructure PPP suffers from poor contract management Managing project risk effectively ndash as well as controlling for scope and budget lsquocreeprsquo ndash requires the public sector to act as a competent client by providing effective monitoring and oversight of a project at every stage from design to operation of the infrastructure
Unfortunately these governance structures are often lacking in many countries with a participant in the Sri Lankan roundtable discussion noting that lsquoprojects [will] kick off but there is no one to monitor them on an ongoing basis This can lead to cost overrunsrsquo Written evidence by the Chartered Institute of Purchasing and Supply (2013) to the UK House of Commonsrsquo Public Administration Select Committee echoed this point In this evidence the Institute submitted that lsquoprocurement skills tend to focus on the call for competition to award the contract rather than on the whole procurement cycle which includes pre-procurement and contractsupplier managementrsquo Both developed and developing countries need to consider whether they are providing sufficient monitoring across the entire project life cycle to maximise the value of their contracts
Chapter 1 section 15 showed that corruption was one of the top barriers to meeting infrastructure need in certain
FIGURE 52 Possible parties to a PPP
regions ndash with 89 of survey respondents in South Asia citing this as a key barrier A roundtable participant in Trinidad and Tobago asserted that proper monitoring of project performance was essential for mitigating corruption particularly lsquohaving something that can support the accountants in countries with no whistle-blowing policyrsquo In addition Abiodun Akanbi from the Nigerian roundtable commented that lsquothe accountant has huge responsibility in measuring the actual performance of contractors to be able [to] efficiently deliver infrastructurersquo The accountant needs to be at the forefront of providing the public sector assurance that the project is being delivered as contracted and according to the project plan Clearly accountants in the public sector have a critical role to play in effective contract management ndash particularly by measuring project progress against agreed terms at key milestones in the delivery process
Reducing moral hazard in the PPP relationship Eriksson and Lind (2015) describe moral hazard as lsquopost-contractual opportunismrsquo There are three key parties that need to be considered in an infrastructure PPP the owner the contractors building the infrastructure and the investor Depending on the structure of the PPP contract any of these roles could be taken on to varying degrees by the government or a private partner Given the limited oversight and governance of many PPPs cited in the roundtable discussions the agents of a PPP project (ie the contractors) will often have the incentive to reduce costs by cutting corners in the projectrsquos execution
Investor Contractor
Owner
40
How accountants can bridge the global infrastructure gap | 5 Delivering projects the publicndashprivate relationship
41
54 BREAKING DOWN BARRIER 2 BY IMPROVING THE INCENTIVES AND RECONCILING DIFFERING VALUE ASSUMPTIONSThe member survey compared the perceptions of public and private sector accountants revealing areas where differing assumptions exist between these parties The survey divided respondents into those working in the public sector and those in the private sector Each group was asked in what ways the other sector provided and received value in PPP infrastructure projects Comparing these results demonstrates where the public and private sectors had a similar view on the purpose of a PPP relationship and where their assumptions on the purpose of the relationship differed (Figure 53) These insights are helpful in highlighting divergent views on the role of each sector where incorrect assumptions can harm the ability of a PPP to deliver a project
Comparing the results from each sector in Figure 53 shows that there was broad agreement on how the private sector adds value to infrastructure projects The ordering of the responses was the same for professionals across the two sectors with the majority of respondents from both sides agreeing that the private sector contributes to the partnership through its knowledge of best practice the application of innovation and access to private capital Interestingly respondents from both sectors were less likely to see risk transfer as an area where the private sector provides value The
These three stakeholders shown in Figure 52 will often have different motivations For example the owner might want to increase the scope of the contract after it is agreed For this reasonaccountants must assess the risks balance the costs and schedule and proactively communicate with all stakeholders to support the success of the project
Allocating risk to reduce moral hazardA CPA Canada roundtable participant rightly identified that lsquothe key areas of interface [between the public and private sector] are between the risks retained by the public sector and their impact on the private sectorrsquos ability to deliver on their contractual commitmentsrsquo Getting this allocation of risk right can significantly improve the prospects that a PPP project will be completed on time and on budget as the right risk balance will act as an incentive to meet contractual obligations (Mann 2018)
Accountants play a clear role here The professional team delivering a project will be aided by an accountantrsquos expertise of risk management ndash particularly the accountantrsquos ability to allocate risk appropriately between the parties in order to minimise moral hazard Although the size and nature of the public sector suggests that it is better placed to bear risk skilled finance professionals will seek to balance the allocation of risks to the private parties such that they maintain the incentive to perform contractual obligations to a high quality standard
Comparing the results from each sector in Figure 53 shows that there was broad agreement on how the private sector adds value to infrastructure projects
Source The Global Infrastructure Gap survey all respondents n 3611
70
60
50
40
30
20
10
0Applying innovative
practices and fresh thinking
Knowledge of best practice and expertise
n Private sector view n Public sector view
Access to private capital
Delivering projects on time
Keeping projects to budget
Transferring risk Dont know None of these
FIGURE 53 Where does the private sector add value in delivering infrastructure
42
How accountants can bridge the global infrastructure gap | 5 Delivering projects the publicndashprivate relationship
assumptions about how each party adds value to an infrastructure PPP contract ndash and suggests that public sector actors overestimate the value of the financial arrangements on offer to private sector partners
The UK Guarantees Scheme (UKGS) offers an example of a good practice that could help improve the private sector incentive for entering PPPs and partially reconciles the differing assumptions of value between both sectors The UK Infrastructure and Projects Authority states that the UKGS lsquosupports private investment in UK infrastructure projects It works by offering a government-backed guarantee to help infrastructure projects access debt finance where they have been unable to raise finance in the financial markets The UKGS can issue up to pound40 billion of guarantees and is open to at least 2026rsquo (UK Government 2017) This long-term commitment guarantees the payment of principal and interest on infrastructure debt and is intended to support lsquonationally significantrsquo projects If well implemented schemes like this can encourage additional private sector involvement in the provision of infrastructure ndash but should be balanced against the need to reduce the risk of moral hazard discussed earlier in this chapter
comparison of perceptions also showed that public sector respondents were slightly more positive about the overall value that private sector actors bring to the relationship
There was considerable divergence in opinion between sector respondents as to the areas where the public sector provided value in an infrastructure PPP (Figure 54)
Public sector respondents were much more likely to argue that they provided both a lsquolong-term and stable partnershiprsquo (62) and knowledge of how the public sector works (60) than their private sector colleagues (45 and 43 respectively) Finance professionals from the public sector were also more likely to claim that they provided the private sector with access to projects (45) compared with 35 in the private sector At the same time there was an agreement that the public sector was less likely to offer knowledge of best practice and innovation to a PPP relationship Therefore both sides took a largely similar view of the origin of knowledge and expertise but the public sector respondents were more optimistic about the value they provided as a financial partner in infrastructure projects Understanding this divergence of viewpoint is helpful in identifying the
There was considerable divergence in opinion between sector respondents as to the areas where the public sector provided value in an infrastructure PPP (Figure 54)
Source The Global Infrastructure Gap survey all respondents n 3611
70
60
50
40
30
20
10
0Long-term and
stable partnershipKnowledge of how the
public sector works
n Private sector view n Public sector view
Access to projects Knowledge of best practice and expertise
Applying innovative practices and fresh thinking
None of these Dont know
FIGURE 54 Where does the private sector receive value from the public sector in delivering infrastructure
How accountants can bridge the global infrastructure gap | 5 Delivering projects the publicndashprivate relationship
To ensure that an infrastructure project is successful strong commercial acumen is essential team members require lsquobusiness savvyrsquo a keen understanding of the market in which the project is being undertaken
55 BREAKING DOWN BARRIER 3 BY FACILITATING PUBLIC SECTOR ACCESS TO BUSINESS EXPERTISE To ensure that an infrastructure project is successful strong commercial acumen is essential team members require lsquobusiness savvyrsquo a keen understanding of the market in which the project is being undertaken Nonetheless as Ajith Lekshmanan a participant in the UK roundtable pointed out
lsquoFor a lot of these projects the [public sector] organisation may just be doing it the one time Itrsquos a one-off and these experts that we are going to [in the private sector] theyrsquove got a whole pool of people doing similar things year after year day after day in this country and other countries The skills required are quite specialist and to train a member of staff [in the public sector] to do it just for the one time that you might be using it is not cost effectiversquo
A public sector entity might manage a large-scale infrastructure project and gain valuable expertise in the process but that expertise may not be accessible to other public sector entities for leveraging in their own infrastructure projects In the public sector project-delivery expertise thus exists in silos It is often the private partners in a PPP who through repeated projects acquire the commercial acumen and therefore potentially hold the expert lsquoreinsrsquo
Centralisation of public sector skills may facilitate removal of this barrier For example the UK Civil Service has created Centres of Excellence that seek to pool the pockets of expertise that exist in the public sector such that any organisation within the public sector can refer to these centres and draw on their specialist skill and thus act as a competent client The professional accountant offers specialist skill and should certainly be a key player in any centre of excellence In fact the accountantrsquos role as an expert team member in such centres may provide as stated by a participant in the Malaysian round table ldquobetter marketing of how the profession contributes to society to encourage professionals to continue doing the right thing and be proud of itrdquo
Centralisation of skills will not however be the answer for all governments Others might seek to encourage cross-departmentministry collaboration to facilitate effective knowledge transfer of commercial acumen across the public sector In both cases collaboration is essential for effective knowledge transfer and as previously outlined the professional accountant with an understanding of life-cycle considerations and with professional frameworks for sound professional judgement and ethics is well-equipped to coordinate such collaboration
43
6 The role of the accountant in bridging the gap
61 CURRENT INFRASTRUCTURE PROJECTS THE MISSING TEAM MEMBER The successful provision of public infrastructure requires governments to have the right professional team in place And yet a clear message resounded from the international roundtable discussions a key player is often missing from the infrastructure project team ndash the accountant A representative at the Malaysian roundtable echoed the sentiment expressed by other participants worldwide that accountants are often only invited to comment on infrastructure projects that have already been selected lsquoSo the harm has been donersquo
As pointed out by a participant in the UK roundtable the role of the accountant has evolved over the years from a focus on lsquoguidelines parameters tick boxes and flowchartsrsquo to a much lsquowider awarenessrsquo Certainly the fact that accountants around the globe work within diverse segments of the economy and serve in key roles such as CEO and CFO and as consultants attests to that lsquowider awarenessrsquo The role of the accountant is at the centre of the planning process and not only in the areas of infrastructure policy The accountant can put the lsquonumbersrsquo on ideas and concepts by applying consistent methodology to ensure they are evaluated against other options for meeting policy goals
Future infrastructure projects the essential team member The previous chapters examined the barriers associated with three fundamental phases of infrastructure projects project selection project financing and project delivery With modern qualifications that facilitate barrier removal in each of these phases the accountant plays an essential role in bridging the global infrastructure gap
The international roundtable participants highlighted the following core competencies
a) Planning and selection of projects The accountant
bull develops strategy identifies goals objectives and ensures they can be achieved (giving consideration to financial constraints and potential monetary gains)
bull sets frameworks and uses standard assessment tools to ensure accountability and transparency and prioritisation according to evidence of need
bull questions project assumptions and assesses alternative scenarios
bull employs mechanisms to ensure ethical behaviour and to eliminate corruption while offering sound risk assessment
bull supports organisationsrsquo holistic decision-making in a way that accounts for the impact of climate change on strategy risk and operational and financial performance thus enhancing organisational resilience
b) Financing projects The accountant
bull considers sustainable finance options including climate-change adaptation and resiliency needs
bull assesses financial viability and identifies long-term impact and strategies for risk mitigation
bull acts as a visionary by providing sound life-cycle advice to decision makers and giving them better understanding of the long-term financial difference between maintaining services and enhancing services and of how the latter can create greater cost pressures over time
bull supports clearer and more objective public discourse increases public awareness of risks and supports taxpayersrsquo better understanding of the value of projects
c) Delivering projects and oversight The accountant
bull implements the required monitoring and oversight
44
How accountants can bridge the global infrastructure gap | 6 The role of the accountant in bridging the gap
Accountants offer important competencies to any business team in any sector But in the face of possible misconceptions of the role of accountants what is the way forward onto the professional infrastructure team
bull allocates project risk between parties of a PPP to reduce moral hazard
bull is supported by several frameworks (eg ICAS 2012 KPMG 2013) for professional judgement and ethics that promote the use of logic flexibility consistency reliability relevant evidence unbiased information and alternative framing to avoid precipitous decisions and that promote a balance of experience knowledge and emotion
62 NEXT STEPS TOWARD THE INFRASTRUCTURE TEAM Accountants offer important competencies to any business team in any sector But in the face of possible misconceptions of the role of accountants what is the way forward onto the professional infrastructure team The international roundtable participants made the following recommendations
bull Increase awareness of the accountantrsquos qualifications as a strategic business adviser and as an essential member of the professional infrastructure team alongside the engineers and architects
bull Equip accountants to voice arguments that are compelling both to political leaders and to the general public
bull Offer elected officials the opportunity to gain financial training from accountants so that they understand the true costs and are better equipped to act as financial ambassadors
bull Establish an accountant-informed certification process for project selection
bull Develop and implement clearer governance structures and decision-making processes that involve the finance function
bull Institute whistle-blowing protection legislation for accountants internationally
45
7 Recommendations based on observed good practice
To tackle the growing global infrastructure gap this report offers a variety of observations and international good practices Below is a summary of the recommendations arising from the reportrsquos analysis demonstrating the variety of functions and actions in which accountants can lead to help close the infrastructure gap
71 SELECTING PROJECTS Chapter 3 demonstrated that the lack of standard assessment tools and ineffective political decision-making hampered project selection To help address these challenges some countries establish expert-led bodies to forecast infrastructure need and make recommendations to government as to which projects to build Governments should also balance maintenance and new infrastructure spending by disaggregating expenditure on maintenance and new projects while prioritising the backlog of maintenance to ensure that assets remain in serviceable condition
To improve decision-making further accountants should collect better data on the service potential of existing infrastructure as well as the performance of past projects Together these data will allow accountants to offer new insights to inform the project selection process To reduce the bias towards large projects over maintenance governments should disaggregate expenditure on infrastructure to report both maintenance and new project spend
This report found that there is no standard project selection process for infrastructure projects used by governments around the world and that the underlying need ndash or service gap ndash is not well established or proven Therefore accountants must take the lead in applying selection standards such as the Project Management Body of Knowledge (Project Management Institute 2017) guide and the World Bankrsquos Investment Project Financing (World Bank 2016) policy to structure decision-making better and move beyond short-term thinking and biases
There is also a growing need to build climate change risk into long-term planning and the decision-making on project selection The Montreal Canada case example (see Chapter 3 Box 32) shows how accountants should produce cost-benefit analysis and business cases to embed adaptation and resilience into municipal infrastructure decisions
In summary governments should 1 Establish expert-led bodies to forecast
infrastructure requirements and recommend projects on the basis of need
2 Collect reliable data on the service potential of existing infrastructure and on the performance of past projects
3 Disaggregate expenditure on infrastructure to report both maintenance and new project spend
Accountants should 4 Take the lead in applying standard
selection tools to determine the need for and priority of a project
5 Advise on the distributional impact and regional growth outcomes of selecting particular projects good practice in this area can be found in Japan
6 Embed adaptation and resilience into the project-selection process
46
How accountants can bridge the global infrastructure gap | 7 Recommendations based on observed good practice
Governments should direct supreme audit institutions to monitor the interaction of off balance sheet liabilities and fiscal targets
72 FINANCING INFRASTRUCTURE PROJECTS
assets Officials in New South Wales Australia were able to unlock an additional AUS$33bn to invest in public infrastructure by adopting a total balance sheet perspective (see Chapter 4 Box 42) Accountants should disaggregate public assets in the balance sheet to include commercial social and financial assets This information will be especially effective for identifying underused commercial assets but it is also important to be aware of overall value for money for citizens when selling an asset (eg selling a public asset that was previously free to use but will now attract a user charge imposed by the private sector owner)
Chapter 4 on financing infrastructure highlights three key barriers closing the funding gap accounting for the higher cost of private capital and the need to professionalise the public sector finance function
This report identifies emerging and good practices from around the world that help reduce the funding gap Decision-makers should consider innovative solutions to closing the funding gap such as a value capture and civic crowdfunding For example the MTR Corporation in Hong Kong demonstrates that implementing a transport model that captures the positive externalities of new transit can make some public infrastructure self-funding (see Box 41)
To ensure value for money in infrastructure policy accountants must advise public sector decision-makers on how to make efficient capital allocations A real challenge in this respect is the interaction of fiscal targets and off balance sheet (OBS) liabilities Chapter 4 showed that some countries such as Portugal and the UK have accumulated significant OBS liabilities Therefore countriesrsquo supreme audit institutions should monitor the interaction of OBS liabilities and fiscal targets At the same time finance officials in government should advocate a more holistic approach to maintaining fiscal discipline beyond a few top-line indicators such as debt to GDP or public sector net borrowing
To improve the efficient allocation of public funds long-term infrastructure plans should be aligned with the annual budget process that sets out capital and operating budgets Effective capital budgeting can improve public finances such that departments or ministries do not need to rely on flexibility of unitary charges to meet infrastructure needs
Many national accounts operating on a cash basis treat investment in public infrastructure as a cost instead of recognising a new asset on the public sectorrsquos balance sheet Governments should adopt full accrual accounting and maintain a public sector balance sheet Public sector accountants should also conduct a balance sheet review to maximise the value of public sector
New Zealand has taken the lead in public financial management practices not just through the adoption of accrual accounting but because their public sector accountants produce an intertemporal balance sheet (see Chapter 4 Table 41) (Government of New Zealand 2018) Accountants producing this analysis provide decisions-makers with a better long-term view of their policy decisions and can help improve the sustainability of public finances
In summary governments should 7 Consider innovative solutions for
closing the funding gap such as a value capture civic crowdfunding and other revenue funding schemes
8 Direct supreme audit institutions to monitor the interaction of off balance sheet liabilities and fiscal targets in order to improve the efficient allocation of public sector funds
9 Align long-term infrastructure plans with the annual budget process in order to minimise the use of higher-cost private finance to achieve capital budget flexibility
10 Adopt full accrual accounting and maintain a public sector balance sheet to support decision-making on infrastructure policy
Accountants should 11 Advocate a more holistic approach to
maintaining fiscal discipline to avoid poor financial decisions driven by lsquofiscal illusionsrsquo
12 Conduct a balance sheet review to maximise the value of public sector assets
47
How accountants can bridge the global infrastructure gap | 7 Recommendations based on observed good practice
Professional bodies can also contribute to the improvements in public sector expertise by facilitating knowledge transfer between the public and private sector through thought-leadership events and roundtable discussions
13 Produce an intertemporal balance sheet to improve long-term decision-making and support the sustainability of public finances as is done for example in New Zealand
14 Produce disaggregated assets in the balance sheet to include commercial social and financial assets ndash in order to improve the return on public assets
73 DELIVERING INFRASTRUCTURE PROJECTS AND THE PUBLIC-PRIVATE RELATIONSHIP Chapter 5 highlights three key barriers to implementing infrastructure projects poor monitoring and oversight of projects by government confusion as to where each side provides value in a PPP and lack of commercial acumen in the public sector
To address these barriers and successfully deliver infrastructure projects governments need to look to accountants to implement the necessary monitoring and oversight of their PPP relationships There is also a clear need for effective mechanisms for reducing corruption which was cited as a key action in the member survey The implementation of effective whistle-blowing legislation and the professionalisation of the public sector finance function will allow public servants to challenge unethical behaviour that can derail infrastructure projects
Chapter 6 demonstrated that moral hazard can limit the probability that infrastructure PPPs will be completed on time on budget and to an acceptable level of quality The allocation of risk between the partners in a PPP can play a central role in reducing this moral hazard by putting the right incentives in place for the contractor Therefore professional teams delivering infrastructure should rely on an accountantrsquos expertise of risk management to minimise moral hazard by allocating risks fairly between the parties
Public sector negotiators should reflect on the assumptions identified in the member survey and consider that private finance professionals were less likely than their public sector counterparts to view the public sector as a stable partner or as a sector that provided access to longshyterm projects To mitigate this mismatch governments should consider introducing guarantee schemes for nationally
significant infrastructure projects in order to encourage additional private sector involvement in the provision of infrastructure
As a result of the varied commercial acumen in the public sector governments should consider establishing centres of excellence to coordinate public sector expertise in contract management so that any organisation within the public sector can draw on that specialist skill when negotiating a PPP contract Professional bodies can also contribute to the improvements in public sector expertise by facilitating knowledge transfer between the public and private sector through thought-leadership events and roundtable discussions
In summary governments should 15 Enact effective whistle-blowing
legislation and professionalise the public sector finance function to allow public servants to challenge unethical behaviour that can derail infrastructure projects
16 Establish centres of excellence that coordinate public sector expertise in contract management which allows any organisation within the public sector to draw on the specialist skill when negotiating a PPP contract
17 Consider introducing guarantee schemes for nationally significant infrastructure projects in order to encourage additional private sector involvement in infrastructure projects This will help address the assumptions identified in themember survey which showed that private finance professionals were less likely to view the public sector as a stable partner
Accountants should 18 Implement proper monitoring and
oversight for all projects
19 Advocate embedding themselves in the professional teams delivering infrastructure by highlighting their expertise of risk management
Professional bodies should 20 Act as facilitators of knowledge
transfer between the public and private sector through thought-leadership events and roundtables
48
49
Conclusion
The global infrastructure investment gap is set to grow to US$14 trillion by 2040 and this figure sets the benchmark for meeting the worldrsquos infrastructure needs
In reality however the challenge in fulfilling a countryrsquos infrastructure need is not achieving a notional investment figure but rather establishing a government vision for closing a recognised service gap by either maintaining existing infrastructure assets and or by building new projects
Currently governments lack adequate resources and the capability to make systematic infrastructure decisions because they are not able to harness the benefits of the investment and mitigate the significant risks associated with infrastructure project execution Bringing the accountant to the centre of the decision-making process for infrastructure projects can mitigate these pitfalls The particular skills and perspective of the finance professional can mean the difference between success and failure through improvements in project selection securing financing delivery and oversight of the projects
As the next generation of infrastructure projects are planned financed built and operated the accountant must be brought to the centre of the decision-making process The accountant must be employed across the entire life cycle of future infrastructure projects as a critical member of the professional team if the world is to address the global infrastructure gap
Appendix A Detailed methodology for establishing the infrastructure investment gap
This appendix examines the key features of the G20 Global Infrastructure Outlook methodology (GHI and Oxford Economics 2018) in order to summarise how the global regional and national estimates of the infrastructure gap used in Chapter 1 of this report were determined For a complete understanding the of the original work the Global Infrastructure Outlook report has a comprehensive treatment of the analytical process
A1 DEFINITION OF INFRASTRUCTURE The Global Infrastructure Outlook report defines infrastructure investment as lsquoGross Fixed Capital Formationrsquo (GFCF) by the public and private sectors on fixed immovable assets that support long- term economic growthrsquo (GHI and Oxford Economics 2018) GFCF is a wider definition of investment than just that for infrastructure and so the calculations included for the purposes of this report exclude land and any moveable assets such as IT equipment The definition does however include both the development of new assets and spending on the replacement or maintenance of existing assets
A2 CURRENT INVESTMENT TRENDS Current investment was calculated for a total of 50 countries using data from multinational data sources such as the OECD or Eurostat where possible If the required data was not available from these sources then national statistics were used to create a comparable estimate Failing that data was imputed using econometric techniques The Global Infrastructure Outlook report was completed during 2016 and includes the most up-to-date datasets collected providing values to 2015 so the forecast years begin at 2016 and continue to 2040 Before 2016 no infrastructure gap was estimated so the charts in Chapter 1 and Appendix B reflect current trends only to 2016
For each country and sector the stock of infrastructure per head was calculated and a set of explanatory factors were determined for each sector eg population density structure of the economy These explanatory variables were projected forwards on the basis of national economic and demographic forecasts to estimate infrastructure investment under current trends for each country
A3 INVESTMENT NEEDS The extent to which each country dedicates resources to infrastructure investment was adjusted for the quality of infrastructure using indicators from the World Economic Forum Global Competitiveness Report (Schwab 2018)
The lsquoquality-adjustedrsquo performance measures were then compared across countries using the performance of countries at the 75th percentile among those of similar income levels as the benchmark The investment-need scenario indicated the extent of infrastructure investment by sector and country which would be required to meet this benchmark level Income groups were based on three World Bank definitions low- and lower-middle income upper-middle income and high income For countries that were already positioned above the 75th percentile (ie the target) the objective in the years ahead is to sustain relatively high levels of investment and maintain their strong performance As a result the minimum value for the investment gap is 0 ndash where those countries in the upper quartile must maintain their performance and their peersrsquo target is to attempt to catch up
50
The following account offers a regional breakdown and description of the global infrastructure investment gap covering Africa the Americas Asia Europe and Oceania
B1 AFRICAIn 2018 an estimated US$1328bn was spent on infrastructure in Africa Meanwhile US$1777bn of investment is estimated to be required in the region putting the infrastructure investment gap at US$455bn Cumulatively between 2018 and 2040 the infrastructure investment gap is expected to stand at US$159 trillion with the amount of infrastructure investment needed expected to be 39 higher than under current trends
51
Appendix BRegional breakdown of the global investment gap and additional service gap analysis
350
300
250
200
150
100
50
0
Investment need Current trends
2007
2008
2009
2010
2011
2012
2013
2014
2015
2016
2017
2018
2019
2020
2021
2022
2023
2024
2025
2026
2027
2028
2029
2030
2031
2032
2033
2034
2035
2036
2037
2038
2039
2040
FIGURE B1 Investment need and current trends in Africa 2015 US$ billions
Source GHI and Oxford Economics 2018
TABLE B1 Projected infrastructure investment and gaps among African countries 2018ndash40 2015 prices
COUNTRY
Angola
Benin
INFRASTRUCTURE INVESTMENT USD BILLIONS
$2514
$199
INFRASTRUCTURE INVESTMENT GAP USD BILLIONS
$920
$134
DIFFERENCE BETWEEN INVESTMENT NEED AND INVESTMENT FORECAST
37
67
Cote dIvoire $614 $129 21
Egypt
Ethiopia
Ghana
$4186
$4215
$685
$2182
$1467
$421
52
35
61
Guinea $167 $140 84
Kenya
Morocco
$1742
$1967
$371
$348
21
18
Nigeria
Rwanda
$6168
$295
$2103
$96
34
33
Senegal
South Africa
$578
$2696
$181
$1442
31
53
Tanzania $1943 $1095 56
Tunisia $502 $206 41
Source GHI and Oxford Economics 2018
52
How accountants can bridge the global infrastructure gap | Appendix B
B2 AMERICASIn 2018 it was anticipated that an estimated US$4771bn would be spent oninfrastructure in the Americas In the sameyear investment need was forecast to be 38 higher at US$6570bn and over the full 2018 to 2040 period the infrastructure investment gap is expected to grow to US$6126 trillion This implies that infrastructure need will be 48 higher than actual investment over the period given the current trend in the Americas
12
1
08
06
04
02
0
Investment need Current trends
2007
2008
2009
2010
2011
2012
2013
2014
2015
2016
2017
2018
2019
2020
2021
2022
2023
2024
2025
2026
2027
2028
2029
2030
2031
2032
2033
2034
2035
2036
2037
2038
2039
2040
FIGURE B2 Investment need and current trends in the America 2015 US$ trillions 2018ndash40
Source GHI and Oxford Economics 2018
TABLE B2 Projected infrastructure investment and gaps among nations in the Americas 2018ndash40 2015 prices
COUNTRY
Argentina
Brazil
INFRASTRUCTURE INVESTMENT USD BILLIONS
$4220
$14207
INFRASTRUCTURE INVESTMENT GAP USD BILLIONS
$3392
$11266
DIFFERENCE BETWEEN INVESTMENT NEED AND INVESTMENT FORECAST
80
79
Canada $11243 $194 2
Chile $1978 $499 25
Colombia $2231 $949 43
Ecuador $743 $523 70
Mexico $4874 $5153 106
Paraguay
Peru
$546
$3072
$165
$675
30
22
US $79637 $36089 45
Uruguay $458 $91 20
Source GHI and Oxford Economics 2018
53
How accountants can bridge the global infrastructure gap | Appendix B
B3 ASIAAmong all nations the top four countries by investment need (China India Japan and the US) account for over half of global need three of these countries are found in Asia Despite this the infrastructure gap is lower in percentage terms across Asia than the other regions and across the 2018 to 2040 period Asian countries would need to increase spending by around 10 to meet their projected investment need The sheer size of the continent means that while relatively small as a proportion of current spending this level of underinvestment creates an infrastructure investment gap of US$43 trillion over the same period
30
25
20
15
10
05
0
Investment need Current trends
2007
2008
2009
2010
2011
2012
2013
2014
2015
2016
2017
2018
2019
2020
2021
2022
2023
2024
2025
2026
2027
2028
2029
2030
2031
2032
2033
2034
2035
2036
2037
2038
2039
2040
FIGURE B3 Investment need and current trends in Asia 2015 US$ trillions 2018ndash40
Source GHI and Oxford Economics 2018
TABLE B3 Projected infrastructure investment and gaps among Asian countries 2018ndash40 2015 prices
COUNTRY
Azerbaijan
Bangladesh
Cambodia
INFRASTRUCTURE INVESTMENT USD BILLIONS
$862
$3931
$560
INFRASTRUCTURE INVESTMENT GAP USD BILLIONS
$76
$1821
$266
DIFFERENCE BETWEEN INVESTMENT NEED AND INVESTMENT FORECAST
9
46
48
China $248858 $18307 7
India $37045 $4995 13
Indonesia $15445 $667 4
Kazakhstan $1955 $792 41
Japan
Jordan
$34810
$591
$868
$168
2
29
Malaysia
Myanmar
Pakistan
$3588
$1050
$3351
$725
$1064
$1179
20
101
35
Philippines
Saudi Arabia
$4031
$4654
$653
$1089
16
23
Singapore
South Korea
$878
$12767
$03
$386
0
3
Thailand $3677 $950 26
Turkey
Vietnam
$5328
$4741
$3841
$968
72
20
Source GHI and Oxford Economics 2018
08
07
06
05
04
03
02
01
0
Investment need Current trends
2007
2008
2009
2010
2011
2012
2013
2014
2015
2016
2017
2018
2019
2020
2021
2022
2023
2024
2025
2026
2027
2028
2029
2030
2031
2032
2033
2034
2035
2036
2037
2038
2039
2040
54
How accountants can bridge the global infrastructure gap | Appendix B
B4 EUROPETotal spending on infrastructure in Europe was forecast to be US$457bn in 2018 in contrast to a projected requirement of US$512bn This investment gap of 11 is projected to grow to US$189 trillion or 16 of the total infrastructure investment needed over the period 2018ndash40
FIGURE B4 Investment need and current trends in Europe 2015 US$ trillions 2018ndash40
Source GHI and Oxford Economics 2018
TABLE B4 Projected infrastructure investment and gaps among European countries 2018ndash40 2015 prices
COUNTRY
Croatia
INFRASTRUCTURE INVESTMENT USD BILLIONS
$591
INFRASTRUCTURE INVESTMENT GAP USD BILLIONS
$101
DIFFERENCE BETWEEN INVESTMENT NEED AND INVESTMENT FORECAST
17
France $16823 $96 1
Germany
Italy
Poland
$13544
$11449
$5143
$07
$3530
$865
0
31
17
Romania $2103 $104 5
Russia $9887 $6892 70
Spain
UK
$9977
$15496
$538
$1403
5
9
Source GHI and Oxford Economics 2018
55
How accountants can bridge the global infrastructure gap | Appendix B
B5 OCEANIADespite the large area covered by the Oceania continental region its relatively small population means the total infrastructure investment need is less thanfor the other regions A further US$18 trillion total spending is likely to be required between 2018 and 2040 although on current trends a shortfall of US$171bn is forecast to emerge over the same period This would represent an infrastructure gap of 10
120
100
80
60
40
20
0
Investment need Current trends
2007
2008
2009
2010
2011
2012
2013
2014
2015
2016
2017
2018
2019
2020
2021
2022
2023
2024
2025
2026
2027
2028
2029
2030
2031
2032
2033
2034
2035
2036
2037
2038
2039
2040
FIGURE B5 Investment need and current trends in Oceania 2015 US$ billions 2018ndash40
Source GHI and Oxford Economics 2018
TABLE B5 Projected infrastructure investment and gaps among countries in Oceania 2018ndash40 2015 prices
COUNTRY INFRASTRUCTURE INVESTMENT USD BILLIONS
INFRASTRUCTURE INVESTMENT GAP USD BILLIONS
DIFFERENCE BETWEEN INVESTMENT NEED AND INVESTMENT FORECAST
Australia $14462 $1499 10
New Zealand $1522 $166 11
Source GHI and Oxford Economics 2018
56
How accountants can bridge the global infrastructure gap | Appendix B
B6 ADDITIONAL INFRASTRUCTURE SERVICE GAP FIGURES BY WORLD REGIONThe following charts compare the views of finance professionals on the remaining four sub-types of infrastructure not included in the main report water and sanitation other transport (eg ports and airports) railways and core public infrastructure (eg hospitals and schools)
Source The Global Infrastructure Gap survey specialist respondents only n 1966
FIGURE B6 Infrastructure quality ndash water and sanitation
North America
100
80
60
40
20
0
n Dont know n Very good n Good n Neutral n Poor n Very poor
Middle East Asia Pacific Central and Eastern Europe
South Asia Western Europe Africa Caribbean Total
Source The Global Infrastructure Gap survey specialist respondents only n 1966
FIGURE B7 Infrastructure quality ndash other transport
North America
100
80
60
40
20
0
n Dont know n Very good n Good n Neutral n Poor n Very poor
Middle East Asia Pacific Central and Eastern Europe
South Asia Western Europe Africa Caribbean Total
57
How accountants can bridge the global infrastructure gap | Appendix B
FIGURE B8 Infrastructure quality ndash railways
FIGURE B9 Infrastructure quality ndash core public service infrastructure
Source The Global Infrastructure Gap survey specialist respondents only n 1966
North America
100
80
60
40
20
0
n Dont know n Very good n Good n Neutral n Poor n Very poor
Middle East Asia Pacific Central and Eastern Europe
South Asia Western Europe Africa Caribbean Total
Source The Global Infrastructure Gap survey specialist respondents only n 1966
North America
100
80
60
40
20
0
n Dont know n Very good n Good n Neutral n Poor n Very poor
Middle East Asia Pacific Central and Eastern Europe
South Asia Western Europe Africa Caribbean Total
Appendix C The Global Infrastructure Gap Survey and Roundtable Discussion Guide
MEMBER SURVEY
Q1 What is your current employment status Full-time or part-time an accounting or finance role Full-time or part-time work in a non-accounting role Not currently in employment Self-employed Retired
Response treated as lsquogeneralistrsquo
Q2 [If employed]In which sector do you work Please tick the one box that best fits your sector Big Four accounting firm Corporate sector - small medium sized Corporate sector ndash large Financial services - small medium sized Financial services ndash large Mid-tier accounting firm Not-for-profit Other international accounting firm Public sector Small or medium-sized practice (SMP) Other (please specify)
Q3 [If employed]Does your work involve any of the following
Infrastructure policy Procurement Capital budgeting Project management or Operations management
Yes (respondent categorised as a lsquospecialistrsquo) No (respondent categorised as a lsquogeneralistrsquo)
Q4 How would you describe the quality of each type of infrastructure in the country where you live Power and energy Water and sanitation Roads and highways Railways Other transport (eg air and sea)
Information and communication technology (eg internet access and mobile service)
Core public service infrastructure (eg hospitals schools emergency services)
Scale 1 ndash Very poor 2 ndash Poor
4 ndash Good 5 ndash Very good Donrsquot know
Q5 What are the biggest barriers in meeting the infrastructure needs in your country Lack of finance andor funding Lack of political leadership Skills and talent shortage Planning and regulatory barriers Corruption Lack of competition Other please specify None
Q6a [To generalists]Over the next 5 years do you feel the infrastructure in your country will Significantly deteriorate Deteriorate Remain the same Improve Significantly improve Donrsquot know
Q6b [To specialists]Over the next 5 years do you feel that each of these types of infrastructure in your country will Power and energy Water and sanitation Roads and highways Railways Other transport (eg air and sea)
Information and communication technology (eg internet access and mobile service)
Core public service infrastructure (eg hospitals schools emergency services)
Scale Significantly deteriorate Deteriorate Remain the same Improve Significantly improve Donrsquot know
Q7 Do you feel the government selects projects that provide the most value to the taxpayer Never Infrequently Sometimes Frequently Always Dont know
58
3
How accountants can bridge the global infrastructure gap | Appendix C
Q8 Which of the following do you feel the government in your country should prioritise to make the best decisions when selecting infrastructure projects Please select up to five which you feel are the most important and rank them by order of importance Please drag and drop your selections from the left box to the right box and order with most important at the top and least at the bottom
Adhering to global accounting standards
Removing political decision-making making the process technocratic (ie decisions by experts)
Putting in place mechanisms to reduce corruption
Moving government accounts from cash to accrual accounting
Bringing OOBs (Obligations Off Balance-Sheet) onto government balance sheets
Quantifying the total life-cycle costs of potential projects
Spending more resource to evaluate projects after completion
Applying standard assessment tools to evaluate projects during selection
Transferring project selection powers to more local levels of government (ie devolution)
Other please specify
Q8a [To CPA Canada respondents only]How important is it that infrastructure planning include the following sustainability considerations Efficient use of energy including where appropriate renewable sources of energy
Adapting to the impacts of a changing climate such as severe weather events
Minimizing environmental impacts on the surrounding community by for example locating near accessible public transit
Reducing or eliminating the production of waste hazardous by-products or other environmental externalities
Assessing the potential of and taking every reasonable step to reduce or eliminate the likelihood of an environmental accident (such as a pipeline spill for example)
Scale 1 - Not important at all 2- Not very important
4 - Quite important 5- Very important 6 - Donrsquot know
Q9a [To generalists]How should infrastructure be financed in your country Entirely public finance Mostly public finance Even mix of public and private finance Mostly private finance Entirely private finance Dont know no opinion
Q9b [To specialists]How should infrastructure be financed in your country (eg a sovereign wealth fund provides the money upfront to build a road) Power and energy Water and sanitation Roads and highways Railways Other transport (eg air and sea)
Information and communication technology (eg internet access and mobile service)
Core public service infrastructure (eg hospitals schools emergency services)
Scale Entirely public finance Mostly public finance Even mix of public and private finance Mostly private finance Entirely private finance Dont know no opinion
Q10 What are your views on the role of foreign direct investment in building and maintaining infrastructure in your country Very concerned Some concern Neutral Positive Very positive Dont know
Q11 What are the key challenges that the government faces in securing private finance Select all that apply Too few viable projects for private investment Regulatory barriers Perceived political instability in my country Underdeveloped financial markets in my country Insufficient skills in government to negotiate with the private sector Negative perception of private finance for public infrastructure Lack of attractiveness of infrastructure investment Dont know Other please specify
Q12a [Asked of those working in Public sector]Where do you feel the private sector particularly adds value in delivering infrastructure projects in your country Select all that apply Knowledge of best practice and expertise
Applying innovative practices and fresh thinking
Delivering projects on time
Keeping projects to budget
Access to private capital
Transferring the risks of delivering infrastructure projects from the public sector to the private sector
None of these
Donrsquot know
59
3
How accountants can bridge the global infrastructure gap | Appendix C
Q12b [Asked of those working in Private sector]Where do you feel the public sector particularly adds value in delivering infrastructure projects in your country Select all that apply Access to projects that provide stable low risk returns Knowledge of how the public sector works Long-term and stable partnership Knowledge of best practice and expertise Applying innovative practices and fresh thinking None of these Donrsquot know
Q13a [Asked of those working in Public sector]Where do you feel the private sector receives value from the public sector in delivering infrastructure projects in your country Select all that apply Access to projects that provide stable low risk returns Knowledge of how the public sector works Long-term and stable partnership Knowledge of best practice and expertise Applying innovative practices and fresh thinking None of these Donrsquot know
Q13b [Asked of those working in Private sector]Where do you feel the public sector receives value from the private sector in delivering infrastructure projects in your country Select all that apply Knowledge of best practice and expertise
Applying innovative practices and fresh thinking
Delivering projects on time
Keeping projects to budget
Access to private capital
Transferring the risks of delivering infrastructure projects from the publicsector to the private sector
None of these
Donrsquot know
Q14 Where are you primarily based [Dropdown list]
Q15 What best describes your gender identity Female Male Prefer not to say Prefer to self-describe
ROUNDTABLE DISCUSSION 1) Understanding the infrastructure gap
a) Whatrsquos the current quality of infrastructure in your country
i Why is it like this
b) How is your business or organization affected by the current quality of infrastructure in your country Please provide examples
2) How accountants can make a difference c) In your experience where do you see accountants making the
greatest difference in delivering infrastructure in your country Please give examples where possible
d) Do you feel that your country has particular good practices in meeting infrastructure need
3) Selecting projects e) How often do you t hink governments select the right projects in
your country
f) What should governments consider when making decisions about infrastructure
4) Financing projects g) Which types of infrastructure are appropriate for private finance
or operation [ie energy water roads railways other transport information and communication technology core public service infrastructure]
i Which ones are more suited to private finance
ii Private operation
h) What do you think about foreign direct investment (FDI) building new infrastructure in your country
5) Interface of public and private i) What skills do governments need to effectively negotiate
contracts with the private sector
i Are any of these skills absent
j) When t he public and private sectors partner to complete and operate infrastructure (for example through a Public-Private Partnership)
i What does the private sector add to the partnership
ii What does the public sector add to the partnership
6) Final k) Over the next 5 years do you think the infrastructure in your
country will improve stay the same or deteriorate
i Why is t hat the case What are the key challenges in meeting the infrastructure needs in your country over the next 5 years
60
References
ACCA (2016) Smarter Cities Simpler Cities Accounting for the City of the Future Spotlight on India lthttpswwwaccaglobalcomcontentdamACCA_GlobalTechnicalFuturepi-smarter-cities-simpler-citiespdf
gt
accessed 4 February 2019
ACCA (2017) Professional Accountants ndash the Future Ethics and Trust in a Digital Age lthttpswwwaccaglobalcomcontentdamACCA_Global TechnicalFuturepi-ethics-trust-digital-agepdfgt accessed 5 February 2019
Atkins G Davies N and Kidney Bishop T (2017) Public versus Private How to Pick the Best Infrastructure Finance Option lthttpswww instituteforgovernmentorguksitesdefaultfilespublicationsInstitute_for_ Government_Infrastructure_Finance_Option_Public_Private_ November_2017_Web_Finalpdfgt accessed 5 February 2019
British Broadcasting Corporation (2015) Spains Ciudad Real airport sold at auction for euro10000 [online article] lthttpswwwbbccouknewsworldshyeurope-33578949gt accessed 6 February
Catapult Future Cities (2017) Civic Crowdfunding A Guidebook for Local Authorities lthttpsfuturecitiescatapultorgukwp-content uploads201703Civic-guidebook-pdfgt accessed 5 February 2019
Central Intelligence Agency (2019) The World Factbook lthttpswwwciagovlibrarypublicationsthe-world-factbook
gt access 7 February 2019
Chartered Institute of Purchasing and Supply (2013) Written evidence submitted by CIPS to the Public Administration Select Committee lthttps publicationsparliamentukpacm201314cmselectcmpubadm123123vw12 htmgt accessed 5 February 2019
Chartered Professional Accountants of Canada (2016) Adaptation Case Study 6 City of Montreal lthttpswwwcpacanadacaenbusiness-and-accountingshyresourcesother-general-business-topicssustainabilitypublications montreal-adapting-to-climate-changegt accessed 5 February 2019
Detter D and Folster S (2017) The Public Wealth of Cities How to Unlock Hidden Assets to Boost Growth and Prosperity (Brookings Institution Press)
Eriksson PE and Lind H (2015) Moral Hazard and Construction Procurement A Conceptual Framework lthttpswwwdiva-portalorgsmashgetdiva2783674FULLTEXT01pdf
gt accessed 5 February 2019
European Commission (2017) Communication from the Commission The Fiscal Compact ndash Taking Stock lthttpseceuropaeuinfopublications fiscal-compact-taking-stock_engt accessed 5 February 2019
Eurostat (2018) lsquoLiabilities Related to PPPs Recorded Off-Balance Sheet of Governmentrsquo downloadable from lthttpsdataeuropaeueuodpendata datasetZxMF0OGutCyj7pgQJdtaiwgt accessed 5 February 2019
Fages R Beardsley B Bromstrup I Donnadieu H Maceacute B Pardasani N Schmitz L Sheridan BTaglioni G and Xu Q (2018) Global Asset Management 2018 The Digital Metamorphosis lthttpswwwbcgcom en-gbpublications2018global-asset-management-2018-digitalshymetamorphosisaspxgt accessed 5 February 2019
Fay M Andres LA Fox C Narloch U Straub S and Slawson M (2017) Rethinking Infrastructure in Latin America and the Caribbean 2017 lthttps openknowledgeworldbankorgbitstreamhandle1098626390114110shyREVISED-PUBLIC-RethinkingInfrastructureFullpdfgt accessed 5 February 2019
Flyvbjerg B (2018) Oxford Handbook of Megaproject Management (Oxford Oxford University Press)
GHI (Global infrastructure Hub) and Oxford Economics (2018) Global Infrastructure Outlook Downloadable from lthttpsoutlookgihuborggt accessed 4 February 2019
Government of New Zealand (2018) lsquoHe Puna Hao Patiki 2018 Investment Statementrsquo lthttpstreasurygovtnzpublicationsinvestment-statementhe-puna-hao-patiki-2018-investment-statement-html
gt accessed 5
February 2019
ICAS (Institute of Chartered Accountants of Scotland) (2012) A Professional Judgement for Financial Reporting lthttpswwwicascomtechnicalshyresourcesa-professional-judgement-framework-for-financial-reportinggt accessed 6 February 2019
IFAC and CIPFA (2018) International Public Sector Financial Accountability Index lthttpswwwifacorgsystemfilesuploadsIFACIFAC-CIPFA-PublicshySector-Index-2018-Statuspdfgt accessed 5 February 2019
IJ Global (2018) H1 Infrastructure and Project Finance League Table Report lthttpsijglobalcomuploadsH120201820League20Tables20Report pdfgt accessed 5 February 2019
IMF (International Monetary Fund) (2018) Fiscal Monitor Managing Public Wealth downloadable from lthttpswwwimforgenPublicationsFM Issues20181004fiscal-monitor-october-2018gt accessed 5 February
Institute for Government (2018) lsquoFunding Infrastructurersquo [webpage] lthttps wwwinstituteforgovernmentorgukexplainersfunding-infrastructuregt accessed 5 February 2019
International Transport Forum (2017) Strategic Infrastructure Planning International Best Practice lthttpsassetspublishingservicegovuk governmentuploadssystemuploadsattachment_datafile601897Strategic_Infrastructure_FINAL_for_web_v2pdf
gt accessed 4 February
KPMG (2013) Elevating Professional Judgment in Auditing and Accounting The KPMG Professional Judgment Framework lthttpwwwdrlilliecom a544kpmgjdgmtKPMG_ProfJudgment_Monographpdfgt accessed 6 February 2019
Leong L (2016) lsquoThe ldquoRail plus Propertyrdquo Model Hong Kongrsquos Successful Self-financing Formularsquo [website article] lthttpswwwmckinseycom industriescapital-projects-and-infrastructureour-insightsthe-rail-plusshyproperty-modelgt accessed 5 February 2019
Mann H (2018) lsquoThe High Cost of lsquoDe-Riskingrsquo Infrastructure Financersquo [website article] lthttpswwwproject-syndicateorgcommentaryworldshybank-ppp-de-risking-by-howard-mann-2018-12gt accessed 5 February 2019
Marcelo D Mandri-Perrott C House S and Schwartz JZ (2016) An Alternative Approach to Project Selection The Infrastructure Prioritization Framework lthttppubdocsworldbankorgen84463146187466270016-04shy23-Infrastructure-Prioritization-Framework-Final-Versionpdfgt accessed 4 February 2019
MGI (McKinsey Global Institute) (2013) Infrastructure productivity How to save $1 trillion a year lthttpswwwmckinseycomindustriescapital-projectsshyand-infrastructureour-insightsinfrastructure-productivitygt accessed 6 February 2019
MGI (2016) Bridging Global Infrastructure Gaps lthttpswwwmckinsey com~mediaMcKinseyIndustriesCapital20Projects20and20 InfrastructureOur20InsightsBridging20global20infrastructure20gaps Bridging-Global-Infrastructure-Gaps-Full-report-June-2016ashxgt accessed 4 February 2019
Morse A (2018) PFI and PF2 Report by the Comptroller and Auditor General lthttpswwwnaoorgukwp-contentuploads201801PFI-and-PF2pdf
gt accessed 5 February 2019
61
How accountants can bridge the global infrastructure gap | References
MTR Corporation (2017) Annual Report 2017 Ten-Year Statistics lthttps wwwmtrcomhkarchivecorporateeninvestor10yr_stat_enpdfgt accessed 5 February 2019
NHS Scotland (2018) NHS Scotland Assets and Facilities 2017 Annual Report lthttpswwwgovscotpublicationsannual-state-nhsscotland-assetsshyfacilities-report-2017gt accessed 5 February 2019
NIC (National Infrastructure Commission) (2018) National Infrastructure Assessment lthttpswwwnicorgukwp-contentuploadsCCS001_ CCS0618917350-001_NIC-NIA_Accessiblepdfgt accessed 4 February 2019
OrsquoDowling-Keane A (2017) lsquoSadiq Khan Joins Crowd of Thousands with pound400000 in Backing for Londonersrsquo Local Project Ideasrsquo [website article] lthttpsaboutspacehivecomsadiq-khan-joins-crowd-of-thousands-withshy400000-in-backing-for-londoners-local-project-ideasgt accessed 5 February
OECD (Organisation for Economic Cooperation and Development) (2019) Databank tax revenue lthttpsdataoecdorgtaxtax-revenuehtmgt government debt lthttpsdataoecdorgggageneral-government-debt htmgt accessed 7 February 2019
Plimmer G (2018) lsquoDeath Knell Sounded for PFI Contractsrsquo [online article] Financial Times lthttpswwwftcomcontent55eb374e-dba5-11e8-8f50shycbae5495d92bgt accessed 6 February
Project Management Institute (2017) Guide to Project Management Book of Knowledge lthttpswwwpmiorgpmbok-guide-standardsfoundational pmbokgt accessed 4 February 2019
Schwab K (2018) Global Competitiveness Report lthttpwww3weforum orgdocsGCR201805FullReportTheGlobalCompetitivenessReport2018 pdfgt accessed 5 February 2019
Spacehive (2019) lsquoMake Your Local Area Betterrsquo [website] lthttpswww spacehivecomgt accessed 5 February 2019
UK Government (2017) UK Guarantees Scheme Guidance lthttpswwwgov ukguidanceuk-guarantees-schemegt accessed 5 February 2019
World Bank (2018a) Private Participation in Infrastructure Annual Report 2017 lthttpppiworldbankorg~mediaGIAWBPPIDocuments Global-NotesPPI_2017_AnnualReportpdfgt
World Bank (2018b) Procuring Infrastructure Public-Private Partnerships Report downloadable from lthttpspppknowledgelaborg documents5453gt accessed 5 February 2019
World Bank (2019) World Bank Open Data tax revenue lthttpsdata worldbankorgindicatorGCTAXTOTLGDZSgt government debt lthttpsdataworldbankorgindicatorGCDODTOTLGDZSgt accessed 7 February 2019
62
18002683793 wwwcpacanadaca
PI-GLOBAL-INFRASTRUCTURE-GAP
DISCLAIMER This paper was prepared by the Association of Chartered Certified Accountants (ACCA) and Chartered Professional Accountants of Canada (CPA Canada) as non-authoritative guidance
ACCA CPA Canada and the authors do not accept any responsibility or liability that might occur directly or indirectly as a consequence of the use application or reliance of this material
ACCA The Adelphi 111 John Adam Street London WC2N 6AU United Kingdom +44 (0)20 7059 5000 wwwaccaglobalcom
CPA Canada 277 Wellington St West Toronto Ontario Canada M5V 3H2
About ACCA ACCA (the Association of Chartered Certified Accountants) is the global body for professional accountants offering business-relevant first-choice qualifications to people of application ability and ambition around the world who seek a rewarding career in accountancy finance and management
ACCA supports its 208000 members and 503000 students in 179 countries helping them to develop successful careers in accounting and business with the skills required by employers ACCA works through a network of 104 offices and centres and more than 7300 Approved Employers worldwide who provide high standards of employee learning and development Through its public interest remit ACCA promotes appropriate regulation of accounting and conducts relevant research to ensure accountancy continues to grow in reputation and influence
ACCA is currently introducing major innovations to its flagship qualification to ensure its members and future members continue to be the most valued up to date and sought-after accountancy professionals globally
Founded in 1904 ACCA has consistently held unique core values opportunity diversity innovation integrity and accountability
More information is here wwwaccaglobalcom
About CPA Canada
Chartered Professional Accountants of Canada (CPA Canada) is one of the largest national accounting organizations in the world representing more than 210000 members Domestically CPA Canada works cooperatively with the regional CPA bodies who are charged with regulating the profession
Globally it works together with the International Federation of Accountants and the Global Accounting Alliance to build a stronger accounting profession worldwide CPA Canada created through the unification of three legacy accounting designations is a respected voice in the business government education and non-profit sectors and champions sustainable economic growth and social development
The unified organization is celebrating five years of serving the profession advocating for the public interest and supporting the setting of accounting auditing and assurance standards CPA Canada develops leading-edge thought leadership research guidance and educational programs to ensure its members are equipped to drive success and shape the future
More information is here wwwcpacanadaca
Copyright copy 2019 Association of Chartered Certified Accountants and Chartered Professional Accountants of Canada
All rights reserved This publication is protected by copyright and written permission is required to reproduce store in a retrieval system or transmit in any form or by any means (electronic mechanical photocopying recording or otherwise)
For information regarding permission please contact permissionscpacanadaca insightsaccaglobalcom
March 2019
How accountants can bridge the global infrastructure gap
Improving outcomes across the entire project life cycle
About this reportThis report quantifies the global infrastructure gap and demonstrates how bringing the accountant to the forefront of infrastructure decision-making will improve the selection financing and delivery of projects
AUTHORED BY
Alex Metcalfe Head of Public Sector Policy ACCA
Davinder C Valeri CPA CADirector Strategy Risk amp Performance CPA Canada
Contents
Foreword 5
Executive Summary 6
Introduction 11
Research methodology 12
1 Defining the challenge Quantifying the global infrastructure gap 14
2 Capacity for infrastructure investment 20
3 Selecting projects 23
4 Financing projects 29
5 Delivering projects the publicndashprivate relationship 39
6 The role of the accountant in bridging the gap 44
7 Observations and international good practice 46
Conclusion 49
Appendix A Detailed methodology of the infrastructure investment gap 50
Appendix B Regional breakdown of investment gap and additional service gap analysis 51
Appendix C Survey and roundtable discussion guide 58
References 61
5
Foreword
Infrastructure is the foundation on which our social and economic well-being is built From the transportation networks that enable people and goods to move safely and effectively to the power and utility systems that provide us with the energy and services that we need to survive we all rely on infrastructure investment
All around the world ndash national regional and local governments make decisions that serve the public and play a critical role in building and maintaining these important and substantial infrastructure investments The outcomes of those decisions will affect us today and into the future
Forces such as demographics rising cyber threats urbanisation and climate change are all converging to increase the global demand for quality infrastructure But efficiently delivering infrastructure can be a challenge given the long asset life and significant sunk costs associated with infrastructure projects Therefore effective decision-making is critical through the entire process of project selection financing construction and operation to provide citizens with value for money
To this end ACCA and Chartered Professional Accountants of Canada (ldquoCPA Canadardquo) are delighted to present this report on the global infrastructure gap A variety of methodologies for quantifying the gap are presented below to explore the size and nature of this global challenge Good practices abound around the world and this report offers a platform for sharing the ideas of practitioners on how governments can best meet the needs of their citizens The report also acts as an example of how the accountant is well placed to tackle many of the major challenges we face in the 21st century ndash from humanityrsquos need to adapt to climate change to helping governments and companies meet the United Nationrsquos Sustainable Development Goals We hope this work initiates conversations on how bringing the accountant to the centre of the decision- and policy-making process can improve outcomes at every point in the project life cycle ndash from planning through to decommissioning
ACCA and CPA Canada would like to thank their respective members who responded to the survey or participated in the roundtable discussions Member contributions add immense value to our thought leadership and this report would not be possible without their assistance
Alan HatfieldExecutive DirectorStrategy and DevelopmentACCA
Gordon BealVice PresidentResearch Guidance amp SupportCPA Canada
Executive summary
DEFINING THE CHALLENGE QUANTIFYING THE GLOBAL INFRASTRUCTURE GAPThe term lsquoglobal infrastructure gaprsquo refers to the difference between the infrastructure investment needed and the resources made available to address that need This report offers two approaches to understanding the global infrastructure gap a notional quantifiable investment gap and a subjective needs-based service gap Together these approaches establish the size and nature of the overall challenge that frames this report
The infrastructure investment gapAnalysis of the G20rsquos Global Infrastructure Outlook shows that the global infrastructure investment gap is set to grow to US$14 trillion by 2040 In 2018 alone the investment gap grew by over US$400bn
Quantifying an infrastructure investment gap across world regions provides an aspirational target for governments looking to improve the provision of infrastructure in their country This methodology highlights global top performers such as Singapore Japan and Canada which exemplify good practices The investment gap approach also reveals that many countries such as Mexico Myanmar and Brazil are facing substantial and growing gaps These countries may benefit from looking at their peers for good practice and novel methods of meeting infrastructure need
6
The infrastructure service gapThe ultimate objective in fulfilling a countryrsquos infrastructure need is not a notional investment figure rather it is closing a recognised service gap Doing this requires that governments develop a vision of what the country seeks to achieve through the development and maintenance of its infrastructure
The ACCA and CPA Canada conducted a global survey of their respective members on the infrastructure gap (ldquothe surveyrsquo) The survey responses showed particular service gaps emerging in certain world regions
across seven types of infrastructure power and energy water and sanitation road and highways other transport (eg air and sea) information and communication technology (ICT) railways and core public service infrastructure (eg hospitals and schools) Finance professionals in Africa and South Asia reported consistently poor levels of infrastructure across all these types with the notable exception of ICT In comparison North American respondents had much higher overall scores but reported a particular dip in their road and highway infrastructure In the Caribbean region respondents to the survey isolated
FIGURE 1 Global infrastructure investment needs and current trends 2015 US$ trillions
50
45
40
35
30
25
20
15
10
05
0
Investment need Current trends
2007
2008
2009
2010
2011
2012
2013
2014
2015
2016
2017
2018
2019
2020
2021
2022
2023
2024
2025
2026
2027
2028
2029
2030
2031
2032
2033
2034
2035
2036
2037
2038
2039
2040
Source GHI and Oxford Economics 2018
How accountants can bridge the global infrastructure gap | Executive summary
7
Just as the barriers to bridging the gap vary by country there is significant variability in the capacity of governments to respond to the infrastructure gap
road and highway infrastructure and core public service infrastructure as key areas requiring intervention to reduce the service gap Respondents from Central and Eastern Europe cited core public service infrastructure and railway infrastructure as areas requiring further investment
OVERALL BARRIERS TO MEETING INFRASTRUCTURE NEEDRespondents to the member survey were also asked what they saw as the biggest barriers to meeting the infrastructure needs of their countries A few top global barriers were
1 a lack of political leadership (cited by 52)
2 a lack of finance or funding (49)
3 planning and regulatory barriers (40)
These results show that the barriers to closing the gap extend beyond having the financial resource to meet need with lsquoa lack of political leadershiprsquo ranking as the number one barrier This suggests that failing to articulate a vision of future infrastructure provision can be a significant barrier in some countries These top three barriers informed the framework for the chapters that follow on the role of the accountant demonstrating that finance professionals have an essential role in addressing all three of the top barriers to closing the gap A lack of political leadership affects a countryrsquos ability to select projects (Chapter 3) the lack of finance and funding clearly impedes effective financing of projects (Chapter 4) and planning and regulatory barriers speak to the interface between the public and private sector in the delivery of infrastructure (Chapter 5)
Capacity for governments to respond to the gapJust as the barriers to bridging the gap vary by country there is significant variability in the capacity of governments to respond to the infrastructure gap Analysis of data from the World Bank the Organisation for Economic Cooperation and Development (OECD) International Monetary Fund (IMF) and Central Intelligence Agency (CIA) World Factbook allowed for the generation of a typology based on the size of the challenge and a countryrsquos ability to respond to this challenge
Countries under the group of lsquoLarge gap fiscally restrictedrsquo such as Pakistan and Nigeria will struggle to meet their growing demands for public infrastructure Others such as China in the top-right corner of the figure are well placed to meet their infrastructure needs compared with their income-group peers
The role of the accountant in closing the gapThe successful provision of public infrastructure requires governments to have the right professional team in place And yet a clear message resounded from the international roundtable discussions a key player is often missing from the infrastructure project table ndash the accountant
The accountant must be brought to the centre of the decision-making process on the selection financing building and operation of infrastructure ndash where the particular skills and perspective of the finance professional can mean the difference between success and failure
TABLE 1 A typology of infrastructure gap responsiveness
LIMITED FISCAL ROOM GREATER FISCAL ROOM
Low infrastructure gap lsquoSmall gap Fiscally restrictedrsquo(eg Canada)
lsquoSmall gap Fiscally flexiblersquo(eg China)
High infrastructure gap lsquoLarge gap Fiscally restrictedrsquo(eg Pakistan Nigeria)
lsquoLarge gap Fiscally flexiblersquo (eg Malaysia)
How accountants can bridge the global infrastructure gap | Executive summary
8
Establishing and comparing the need for infrastructure are key considerations in building the case for planning and selecting a particular project
Planning and selecting infrastructure projectsChapter 3 further explains the two key impediments identified in the survey the lack of a standard for project selection and the misalignment of the infrastructure life cycle and the political cycle Establishing and comparing the need for infrastructure are key considerations in building the case for planning and selecting a particular project This report sets out methods of establishing lsquoneedrsquo in order to inform the planning and project selection process The survey also identifies the misalignment between a political cycle (often four to six years) and the total life cycle of an infrastructure asset (often over 20 years) This mismatch can generate two biases a bias towards short-term decision-making and a bias for creating megaprojects over maintenance
In response to these barriers this report offers the following recommendations based on observed good practice
Governments should1 Establish expert-led bodies to
forecast infrastructure requirements and recommend projects on the basis of need
2 Collect reliable data on the service potential of existing infrastructure and on the performance of past projects
3 Disaggregate expenditure on infrastructure to report both maintenance and new project spend
Accountants should4 Take the lead in applying standard
selection tools to determine the need for and priority of a project
5 Advise on the distributional impact and regional growth outcomes of selecting particular projects good practice in this area can be found in Japan
6 Embed adaptation and resilience into the project-selection process
Financing infrastructure projectsChapter 4 on financing infrastructure highlights three key impediments to closing the infrastructure gap the funding gap accounting for the higher cost of private capital and the need to professionalise the public sector finance function
In response to these barriers the report offers the following recommendations based on observed good practice
Governments should7 Consider innovative solutions for
closing the funding gap such as a value capture civic crowdfunding and other revenue funding schemes
8 Direct supreme audit institutions to monitor the interaction of off balance sheet liabilities and fiscal targets in order to improve the efficient allocation of public sector funds
9 Align long-term infrastructure plans with the annual budget process in order to minimise the use of higher-cost private finance to achieve capital budget flexibility
10 Adopt full accrual accounting and maintain a public sector balance sheet to support decision-making on infrastructure policy
Accountants should11 Advocate a more holistic approach
to maintaining fiscal discipline to avoid poor financial decisions driven by lsquofiscal illusionsrsquo
12 Conduct a balance sheet review to maximise the value of public sector assets
13 Produce an intertemporal balance sheet to improve long-term decision-making and support the sustainability of public finances as is done for example in New Zealand
14 Produce disaggregated assets in the balance sheet to include commercial social and financial assets ndash in order to improve the return on public assets
How accountants can bridge the global infrastructure gap | Executive summary
The roundtable participants identified poor monitoring and oversight by government as key impediments in delivering infrastructure projects
Delivering infrastructure projects The roundtable participants identified poor monitoring and oversight by government as key impediments in delivering infrastructure projects Chapter 5 offers results from the survey demonstrating disagreement about where each party in a PPP agreement provides value Finally the roundtable participants argued that the public sector often lacked the commercial acumen required to manage an infrastructure PPP effectively
In response to these barriers this report offers the following recommendations based on observed good practice
Governments should 15 Enact effective whistle-blowing
legislation and professionalise the public sector finance function to allow public servants to challenge unethical behaviour that can derail infrastructure projects
16 Establish centres of excellence that coordinate public sector expertise in contract management which allows any organisation within the public sector to draw on the specialist skill when negotiating a PPP contract
17 Consider introducing guarantee schemes for nationally significant infrastructure projects in order to encourage additional private sector involvement in infrastructure projects This will help address the assumptions identified in the survey which showed that private finance professionals were less likely to view the public sector as a stable partner
Accountants should 18 Implement proper monitoring and
oversight for all projects
19 Advocate embedding themselves in the professional teams delivering infrastructure by highlighting their expertise of risk management
Professional bodies should 20 Act as facilitators of knowledge
transfer between the public and private sector through thought-leadership events and roundtables
9
10
The global infrastructure gap
1 See Chapter 1 for definitions of the lsquoinfrastructure investment gaprsquo and the lsquoinfrastructure service gaprsquo
Globally some top barriers to meeting infrastructure need were
52 lack of political leadership
49 lack of finance or funding
40 planning and regulatory barriers
Finance professionals reported the largest service gap in Africa the Middle East had the smallest service gap1
The global investment gap will grow to US$14 trillion by 2040
Selecting projects
93 of respondents said governments could improve the infrastructure projection selection process
lsquoRemoving political decision-making and making the process technocraticrsquo was the most cited for improving project selection
Delivering projects and the public-private relationship
62 of public sector respondents arguedthat they offered a lsquolong-term and stable partnershiprsquo for a PPP compared to only
45 of private sector respondents
Financing projectsThe most cited barriers for securing private finance for infrastructure were
lsquoInsufficient skills in governmentrsquo 45 and
lsquonegative perception of private financersquo 43
11
Introduction
Infrastructure is critical for economic and social development across the world Physical infrastructure systems ensure that basic human needs are met people need access to energy to light and heat their homes and safe water for drinking sanitation and cooking Transport infrastructure allows people to travel to work and transport goods to different markets
In these and many other ways infrastructure is vital to social and economic activity and development ndash and its provision is intrinsically tied to achieving the United Nationrsquos Sustainable Development Goals to address global challenges such as poverty inequality climate change and environmental degradation and to achieve a better and more sustainable future for all There is also a unique opportunity for governments to respond to the global infrastructure gap challenge The anaemic economic growth following the 2008 financial crisis and the sustained low-interest rate environment means that the cost of increased investment has rarely been lower for governments and the prize is sustainable economic growth a sustained boost to productivity and improved living standards
But execution matters and there are many examples of infrastructure projects that have gone badly wrong Design failures can cause the death of workers as in the case of the Chirajara bridge collapse in Colombia in 2018 poor demand forecasting and design can result in significant infrastructure investments being underused such as the Ciudad Real Airport in Spain which remains abandoned after a construction cost in excess of 1bn euros (BBC 2015)
In addition the collapse of the Morandi Bridge in Genoa Italy demonstrated that to avoid disaster governments must allocate sufficient resources to the maintenance of existing infrastructure fighting the bias towards focusing resources on new-build projects
Finally cases of natural disaster ndash such as the flooding in Bangkok Thailand in 2011 ndash are becoming increasingly common and future infrastructure projects must be adaptable and resilient to enable countries to meet the threats of climate change
Therefore the successful provision of public infrastructure requires governments to have the right professional team in place to be able to harness the benefits of additional investment while working to mitigate the significant risks associated with infrastructure projects The accountant must be brought to the centre of the decision-making process on the selection financing building and operation of infrastructure where the finance professionalrsquos particular skills and perspective can mean the difference between success and failure
Research methodology
How accountants can bridge the global infrastructure gap Improving outcomes across the entire project life cycle report is the result of a joint research project conducted by ACCA and CPA Canada The research objective of this study was to quantify and explain the nature of the global infrastructure gap and explore how professional accountants can contribute to bridging the gap through improvements in the selection financing and delivery of projects
The report encompasses the collection of economic research country-specific narratives and best practices in building and maintaining infrastructure ndash from project selection to completion and evaluation The results and observations that were arrived at are supported by evidence collected through the following mechanisms
bull quantifying the cumulative global infrastructure investment gap to 2040 through desktop research
bull a global online survey of a random sample of ACCA members and CPA Canada members
bull a desktop literature review of specialist publications to determine leading practices
bull in-person roundtable discussions held with experts from four continents
How these four areas were developed is detailed below
ECONOMIC ANALYSIS A quantitative approach was followed for the review of the G20 Global Infrastructure Hubrsquos Global Infrastructure Outlook report (GHI and Oxford Economics 2018) This report uses economic forecasting to quantify the cumulative global infrastructure gap up to 2040 Chapter 1 lsquoQuantifying the Global Infrastructure Gaprsquo provides some detail on the quantification of the investment gap and articulates the challenge for this report More information on the methodology of the economic analysis can be found in Appendix A
GLOBAL SURVEY AND DEMOGRAPHICS ACCA and CPA Canada jointly undertook a survey of a random sample of each bodyrsquos membership This survey used the perspectives of finance professionals to illuminate the nature of the global infrastructure gap highlight the barriers to closing the gap and clarify the diverging expectations of public- and private-sector actors in the use of publicndash
private partnerships (PPPs) in infrastructure projects A copy of the survey is available in Appendix C
The survey design and administration were consistent across both bodies except for the addition of one question on infrastructure planning and sustainability considerations in the CPA Canada survey Therefore unless otherwise specified all survey results cited in the report present the combined output from the CPA Canada and ACCA waves of the survey The ACCA survey was in the field for two weeks in August 2018 and the CPA Canada survey for two weeks in October 2018
Survey demographics The combined total of survey respondents was 3611 across 1182
countries Geographic splits in the survey data typically present output by world region Every world region had at least 150 responses except for South America which is excluded from any figure showing results by geography Finally the
2 Six respondents gave lsquoOtherrsquo for their country of residence thus it is not possible to identify whether they lived in the 118 countries or elsewhere
12
Overall more than one-in-three respondents (35) worked in the corporate sector while about 20 worked in the public or not-for-profit sectors
joint survey (lsquothe member surveyrsquo) split respondents into two primary categories lsquogeneralistsrsquo and lsquospecialistsrsquo where specialist respondents stated that their work included at least one of the following areas infrastructure policy procurement capital budgeting project or operations management Of the total sample 1966 respondents (54) were categorised as specialists The survey included a number of detailed technical questions which were asked only of specialists Figures throughout the report clearly indicate which subset of respondents (generalists or specialists) answered a particular question
The member survey includes the views of accountants working across all sectors including respondents from accountancy firms the corporate sector and the public sector Overall more than one-in-three respondents (35) worked in the corporate sector while about 20 worked in the public or not-for-profit sectors
LITERATURE REVIEWA detailed review of specialised literature on infrastructure projects globally was conducted This review demonstrated the variety of methodologies used globally in quantifying the infrastructure gap as well as providing a summary of leading practices in infrastructure planning project selection and public financing that help support the effective delivery of innovative and sustainable infrastructure policy
The References section includes the reviewed literature
IN-PERSON ROUNDTABLE DISCUSSIONSFinally roundtable discussions were conducted with ACCA members and CPA Canada members in the UK Canada Sri Lanka Nigeria Trinidad amp Tobago Jamaica and Malaysia and focused on country-specific infrastructure challenges and solutions to show the international variation in infrastructure need as well as highlighting what skills and perspectives accountants employ to help address the global infrastructure gap
The roundtable discussions offered stakeholders an opportunity to share their insights and experiences on the current challenges to closing the global infrastructure gap and their perspectives and experiences in the provision of infrastructure In addition the roundtables offered participants an opportunity to reflect on best practices with their peers
Together the literature review and roundtable discussions have provided evidence of the essential role accountants can play in helping to shrink the global infrastructure gap A copy of the roundtable questions is available in Appendix C
ACCA and CPA Canada would like to thank the Centre for Business and Economics Research (Cebr) an economic consultancy based in the UK for completing the economic analysis quantifying the global infrastructure investment gap
13
How accountants can bridge the global infrastructure gap | Research methodology
FIGURE 2 Sector breakdown of The Global Infrastructure Gap survey
20
18
16
14
12
10
8
6
4
2
0Big Four
accounting firm
Corporate sector ndash small medium sized
Corporate sector ndash
large
Financial services ndash smallmedium sized
Financial services ndash
large
Mid-tier accounting
firm
Not-for-profit Other international
accounting firm
Public sector Small medium sized practice (SMP)
Other
Source The Global Infrastructure Gap survey all respondents n 3611
14
1 Defining the challenge Quantifying the global infrastructure gap
Defining the global infrastructure gap qualitatively is relatively simple the term is generally understood to denote the difference between required infrastructure and existing infrastructure Defining the current global infrastructure gap quantitatively however is more complex (MGI 2016) There are a variety of methods used internationally to measure the infrastructure gap
Reports by the McKinsey Global Institute (MGI 2013 and 2016) on the global infrastructure gap estimate that the world will need to invest US$33 trillion annually in infrastructure to support the needs resulting from projected economic growth The MGI methodology is highly sensitive to variations in economic growth since the forecasted investment gap is based on maintaining the ratio of infrastructure stock to a countryrsquos gross domestic product (GDP) But assessing infrastructure need as a constant share of a countryrsquos GDP is a rather crude measure that could result in erroneous conclusions For example assume a country spends the same amount on infrastructure but boosts GDP through greater efficiency in the allocation of those investment resources This would show as an increase in the infrastructure investment gap under the MGI approach (ie infrastructure spending would fall as a percentage of GDP) when in fact the efficiency gains would actually reduce the gap
In working to improve infrastructure provision the ultimate focus for any government should be minimising a recognised service gap not reducing a notional investment gap ndash addressing a countryrsquos particular economic social and environmental objectives (Fay et al 2017) The roundtable discussion in Canada a country with a negligible investment gap highlighted the misalignment between infrastructure investment decisions and the actual service needs of the country something that had been particularly challenging in First Nations communities In short this global challenge cannot be solved only by spending more money but also by spending better ndash ensuring that all spending is targeted on real needs At the same time it is not possible to categorise effectively on a global scale all the national objectives underpinning the goal of closing service gaps
Therefore this report offers two approaches to the global infrastructure gap the infrastructure investment gap and
the infrastructure service gap The first relies on a dataset produced by the G20rsquos Global Infrastructure Hub and sets an aspirational metric which is benchmarked against a countyrsquos peers (GHI and Oxford Economics 2018) This quantified infrastructure investment gap shows what investment would be required for a particular country to move to the top 25th percentile of the peers in its income group This works as an effective benchmark where a countryrsquos gap can be closed over time The second approach relies on the views of the specialist respondents to the member survey The quality of infrastructure is assessed across seven different subtypes demonstrating where service gaps exist for different world regions The first approach provides a quantified output and aspirational target for countries seeking to meet infrastructure needs and is described below The results of the second approach setting out the service gap can be found in section 14 below lsquoFinance professionalsrsquo perspectives on the global infrastructure servicersquo gap
How accountants can bridge the global infrastructure gap | 1 Defining the challenge Quantifying the global infrastructure gap
Globally the cumulative level of investment required to bring all countries in line with the best performing nations in their income group is estimated to be almost US$88 trillion between 2018 and 20404
11 THE INFRASTRUCTURE INVESTMENT GAP (APPROACH 1) AN ANALYSIS OF THE GLOBAL INVESTMENT OUTLOOK The Global Infrastructure Outlook report (GHI and Oxford Economics 2018) defines infrastructure investment as lsquoGross Fixed Capital Formation (GFCF) by the public and private sectors on fixed immovable assets that support long-term economic growthrsquo This report takes a comprehensive view of countriesrsquo infrastructure needs ndash including the social and economic infrastructure that would be captured under GFCF This comprehensive view is echoed in the survey analysis which covers seven sub-categories of infrastructure power and energy water and sanitation road and highways other transport (eg air and sea) ICT railways and core public service infrastructure (eg hospitals and schools) The research by the G20rsquos Infrastructure Hub estimates the amount of infrastructure investment needed for a diverse set of countries in each year from 2016 until 20403
The Global Infrastructure Outlook report provides historic data from 2007 to 2015 and then projects these forward to 2040 with increased spending only occurring in response to changes in economic and demographic fundamentals The difference between these estimates (ie the amount invested compared with the
amount needed) allows us to calculate the lsquoinfrastructure investment gaprsquo for each country To improve understanding of this global challenge the account below illustrates the size of this infrastructure gap at the global level Further detail on the nature of the infrastructure investment being measured and the methodology used to calculate the gap are explained in Appendix A Regional and national-level analysis of the investment gap can be found in Appendix B
12 QUANTIFYING THE GLOBAL INFRASTRUCTURE INVESTMENT GAP Globally the cumulative level of investment required to bring all countries in line with the best performing nations in their income group is estimated to be almost US$88 trillion between 2018 and 20404 Current trends indicate however that actual investment over the period is likely to undershoot this by US$14 trillion In 2018 alone the global infrastructure gap is US$409bn and will average US$613bn per year over the entire period In order to close this gap total forecast spending would have to increase by 19 over current investment levels In other words for every five US dollars of infrastructure spending forecast across the world by 2040 governments and investors would need to find a further 95 cents in order to bring the global stock of infrastructure up to standard
FIGURE 11 Comparison of different approaches to assessing infrastructure needs
Approach 2
Infrastructure Service Gap
Approach 1
Infrastructure Investment Gap
Notional target (aspirational) quantifiable
Source Global Infrastructure
Outlook
Subjective view of need
Source The Global Infrastructure
Gap survey
3 For further detail please see the technical appendix of the Global Infrastructure Outlook (GHI and Oxford Economics 2018)
4 Figures from the G20 Global Infrastructure Outlook report (GHI and Oxford Economics 2018) are reported in 2015 US$ prices and exchange rates unless otherwise specified
15
16
Quantifying an infrastructure investment gap across world regions provides an aspirational target for governments looking to improve the provision of infrastructure in their country
Between regions and countries there is a wide variation in performance in infrastructure provision and the capability of governments and private investors to meet future needs The capacity of governments to respond to this challenge is discussed further in the next chapter of this report
13 ANALYSIS OF THE GLOBAL INFRASTRUCTURE INVESTMENT GAPQuantifying an infrastructure investment gap across world regions provides an aspirational target for governments looking to improve the provision of infrastructure in their country It highlights global top performers such as Singapore Japan and Canada ndash which can be looked to for good practices5 The investment gap view also reveals global laggards such as Mexico Myanmar and Brazil Countries facing substantial and growing gaps may benefit from looking to their peers for good practice and novel methods of meeting infrastructure needs Subsequent chapters explore how the skills and perspectives of accountants can help close the investment gap Before turning to the role of accountants this report sets out a second method for understanding infrastructure need the infrastructure service gap
How accountants can bridge the global infrastructure gap | 1 Defining the challenge Quantifying the global infrastructure gap
14 FINANCE PROFESSIONALSrsquo PERSPECTIVES ON THE GLOBAL INFRASTRUCTURE SERVICE GAP (APPROACH 2)The Global Infrastructure Outlook report forecasts that the global infrastructure investment gap will reach US$14 trillion by 2040 (GHI and Oxford Economics 2018) This economic analysis sets an aspirational global benchmark for meeting the worldrsquos infrastructure needs At the same time the ultimate objective in fulfilling a countryrsquos infrastructure need is not a notional investment figure rather it is closing a recognised service gap Doing this requires that governments develop a vision of what a country seeks to achieve through the development and maintenance of its infrastructure ACCArsquos previous work on Smart Cities argues that creating a vision for future municipal infrastructure requires a lsquocitizen-led bottom-up approachrsquo based on actual service needs (ACCA 2016) Zia Paton a partner at PricewaterhouseCoopers (PwC) and participant in the roundtable discussion in Trinidad and Tobago cited the countryrsquos lsquoVision 2030rsquo as an excellent framework for setting out the governmentrsquos infrastructure priorities She pointed out that lsquothe plans set out in the Vision 2030 document appear to be
FIGURE 12 Global infrastructure investment need and current trends 2015 US$ trillions
50
45
40
35
30
25
20
15
10
05
0
Investment need Current trends
2007
2008
2009
2010
2011
2012
2013
2014
2015
2016
2017
2018
2019
2020
2021
2022
2023
2024
2025
2026
2027
2028
2029
2030
2031
2032
2033
2034
2035
2036
2037
2038
2039
2040
Source GHI and Oxford Economics 2018
5 See Appendix B for regional- and country-level statistics
17
To supplement the economic analysis that produces the investment gap the joint member survey explored the global infrastructure service gap
exactly what we needrsquo but she sees the real challenge as lsquoconverting that plan into action and aligning it with the various frameworks people and Ministries we have in place execution or implementation is where we tend to have challengesrsquo
The following chapters demonstrate the essential role for the accountancy profession in transforming agreed national visions into a reality through improving project selection (Chapter 3) financing decisions (Chapter 4) and project delivery (Chapter 5) To supplement the economic analysis that produces the investment gap the joint member survey explored the global infrastructure service gap This granular
approach captures the perspective of finance professionals from around the world setting out which particular types of infrastructure are viewed as requiring improvement to meet service needs
Infrastructure service gap by world regionRespondents to the survey were asked to rank the current quality of seven types of infrastructure in their country ndash covering both social and economic infrastructure Breaking down these results by world region demonstrates considerable variation in the current quality of each type of infrastructure Figures 13 14 and 15 show the results for three types of infrastructure power and energy roads and highways and ICT The world regional
How accountants can bridge the global infrastructure gap | 1 Defining the challenge Quantifying the global infrastructure gap
FIGURE 13 Infrastructure quality ndash power and energy
North America
100
80
60
40
20
0
n Dont know n Very good n Good n Neutral n Poor n Very poor
Middle East Asia Pacific Central and Eastern Europe
South Asia Western Europe Africa Caribbean Total
Source The Global Infrastructure Gap survey specialist respondents only n 1966
FIGURE 14 Infrastructure quality ndash roads and highways
North America
100
80
60
40
20
0
n Dont know n Very good n Good n Neutral n Poor n Very poor
Middle East Asia Pacific Central and Eastern Europe
South Asia Western Europe Africa Caribbean Total
Source The Global Infrastructure Gap survey specialist respondents only n 1966
ICT is a unique form of infrastructure that includes significant non-physical components and its provision must anticipate the future needs of the digital economy
breakdowns for water and sanitation railroad and other transport infrastructure (eg sea and air) and core public service infrastructure can be found in Appendix B Figures B6 B7 B8 and B9 By analysing the specialist responses on each type of infrastructure this report offers a view on the global and regional service gaps that exist in the provision of infrastructure
The survey data shows that South Asia lags other world regions in the quality of its power and energy infrastructure with only one in five (20) of finance professionals in that region stating that power and energy provision in their country was good or very good This compares with 65 of global respondents who found the provision of power and energy to be good or better Africa lagged in this area with about one in three (35) of Africarsquos finance professional respondents stating that power and energy provision was very good or good Unsurprisingly 90 of the Middle Eastern respondents saw their power and energy infrastructure as good quality or above ndash with 71 stating that power and energy provision is lsquovery goodrsquo
Central and Eastern European and African respondents were critical of the quality of their road infrastructure ndash with 37 and 46 respectively stating that their roads and highway infrastructure were poor or very poor In comparison a majority of survey respondents in the Middle East North America and Western Europe reported that the provision of
road and highway infrastructure in their countries was of good or very good quality Globally nearly half the finance professionals (49) reported that that the quality of road and highway infrastructure in their countries was good or very good
Globally ICT was seen as the type of infrastructure with the highest quality Clearly ICT is a unique form of infrastructure that includes significant non-physical components and its provision must anticipate the future needs of the digital economy The quality of ICT infrastructure extends beyond initiatives such as the roll-out of ultrafast broadband it includes public sector projects developing robust financial management and information systems to improve public services
Besides significant non-physical components ICT represents a comparatively new priority for many governments The survey shows the African region lagging its peers with only 51 of specialist finance professionals in the region ranking ICT as good or very good compared with the global average of 69 ICT was one of the few infrastructure types to receive a high score in central and Eastern Europe This is understandable because for many countries in this region other types of physical infrastructure such as road and rail were built under the Soviet Union Significant investment in ICT infrastructure around the world occurred
18
How accountants can bridge the global infrastructure gap | 1 Defining the challenge Quantifying the global infrastructure gap
FIGURE 15 Infrastructure quality ndash information and communication technology
Source The Global Infrastructure Gap survey specialist respondents only n 1966
North America
100
80
60
40
20
0
n Dont know n Very good n Good n Neutral n Poor n Very poor
Middle East Asia Pacific Central and Eastern Europe
South Asia Western Europe Africa Caribbean Total
19
Comparing specialistsrsquo perceptions of infrastructure quality by country shows particular service gaps emerging across the types of infrastructure
after the fall of the Soviet Union and many new nation-states in Eastern Europe were able to pursue their own infrastructure investment priorities Certain countries such as Estonia are now seen as world leaders in ICT and the provision of a digital public sector
A comparison of regional infrastructure service gaps arising from the survey dataComparing specialistsrsquo perceptions of infrastructure quality by country shows particular service gaps emerging across the types of infrastructure For example finance professionals in Africa and South Asia reported consistently poor levels of infrastructure across all the subtypes with the notable exception of ICT These results suggest that there are considerable service gaps that governments in this world region must address In comparison North American respondents had much higher overall scores but showed a particular dip in their road and highway infrastructure where only 64 of respondents reported that this infrastructure was of good quality In the Caribbean region specialist respondents isolated road and highway infrastructure and core public service infrastructure as key areas requiring intervention to reduce the service gap Specialists in infrastructure policy in central and Eastern Europe cited core public service infrastructure and railway infrastructure as areas requiring further investment
15 BARRIERS TO MEETING INFRASTRUCTURE NEEDSRespondents to the member survey were also asked what they saw as the biggest barriers to meeting the infrastructure needs in their country The results of this question showed significant variation by world region For example corruption was seen as a serious challenge in South Asia Africa Central and Eastern Europe and the Caribbean ndash but was cited by 10 of respondents or fewer in North America and Western Europe In comparison a lack of political leadership ranked consistently high across world regions This is a key barrier that is explored further in Chapter 3 Selecting Projects The lack of finance or funding also ranked as a significant barrier in most regions with an overall global average of 49 of respondents citing it as a barrier The underlying causes for the lack of finance as well as good practices in overcoming this barrier are discussed in Chapter 4 on the central role of accountants in improving infrastructure project finance Finally planning and regulatory issues consistently arose as a barrier to meeting infrastructure need with around 40 of respondents across the globe citing this as a key barrier Chapter 5 of this report which explores how accountants can support the efficient execution of infrastructure projects sets out how the interface of public and private partners can often be confused and suboptimal reducing the effective delivery of infrastructure
How accountants can bridge the global infrastructure gap | 1 Defining the challenge Quantifying the global infrastructure gap
FIGURE 16 Biggest barriers to meeting infrastructure needs
North America
100
80
60
40
20
0
n Lack of finance andor fundingn Lack of political leadershipn Skills and talent shortagen Planning and regulatory barriersn Corruptionn Lack of competitionn None
Middle East Asia Pacific Central and South Asia Western Europe Africa Caribbean Total
Source The Global Infrastructure Gap survey all respondents n 3611
Eastern Europe
2 Capacity for infrastructure investment
For countries at different stages of development the implications of infrastructure spending can also be markedly different The annual rate of growth in output typically much higher during the early phase of industrialisation tends to slow as a countryrsquos economy matures Smaller economies may therefore need to commit a relatively large share of their output to infrastructure investment in order to facilitate rapid growth
Looking at infrastructure investment as a percentage of GDP can therefore be revealing as to governmentsrsquo willingness or ability to make the necessary financial investment as well as the nature of the environment for private investment
In 2015 the Asian economies funded the largest financial infrastructure investment around US$13 trillion This is unsurprising given that Asia is the most heavily populated region It is also a function of the commitment by certain countries to improving the regionrsquos infrastructure and in 2015 the level of investment was the largest in relative terms standing at 51 of GDP
Africa was the region with the second-highest level of investment as a share of GDP in 2015 at 43 but the continent trails its peers in absolute investment (US$100bn) Europe and the Americas both of which are dominated by their larger more developed economies dedicated far lower levels of funding to infrastructure investment relative to their GDP in 2015 at 20 and 17 respectively
20
21 GOVERNMENTSrsquo CAPACITY FOR INCREASING INFRASTRUCTURE SPENDINGGovernments can directly fund an increase in expenditure on infrastructure through increases in either taxation or borrowing The latter places a burden on future generations in the form of the higher taxation needed to fund the
repayment of the debt The major constraints on a governmentrsquos capacity for funding infrastructure are therefore a fairly complex mix of institutional economic and social factors The size of the tax base how easily taxes can be evaded and political or cultural expectations about what constitutes a fair level of taxation all present practical
FIGURE 21 Regional infrastructure investment in US$ trillions as a of GDP 2015
7
6
5
4
3
2
1
0Asia
14
12
10
08
06
04
02
0Africa Oceania Europe Americas
o
f GD
P
2015 USD
$ trillions
n of GDP n USD $ trillions
Source GHI and Oxford Economics 2018
21
How accountants can bridge the global infrastructure gap | 2 Capacity for infrastructure investment
Table 21 presents summary statistics for the level of government debt and taxation across high-income upper-middle-income and low- and lower-middle-income countries
barriers to raising revenues Likewise high taxes can have strong disincentive effects discouraging certain activities and limiting the extent to which any change in the tax rate translates into higher revenues Borrowing on the other hand is constrained by the credibility of the government in pledging to repay any debts and the depth and sophistication of domestic capital markets
Table 21 presents summary statistics for the level of government debt and taxation across high-income upper-middle-income and low- and lower-middle-income countries Using this data gives the distribution of tax and borrowing levels relative to GDP allowing us to benchmark countriesrsquo capacity for further investment The figures cover the 1995 to 2016 period in order to show variation across a range of different economic and political cycles
Table 21 shows that among the high-income countries both the UK and Canada have relatively high levels of indebtedness as measured by the OECD gross general government debt indicator (OECD 2019) Since the global financial crisis both countries have seen their debt levels pull away from the OECD average to stand at 1117 and 1147 of GDP respectively This puts both countries firmly in the upper quartile of indebted countries even among the OECD countries where levels of debt to GDP
are generally high In both cases tax revenues are marginally below the OECD average however suggesting there is some limited fiscal room for raising revenue Political pressure in countries such as the UK may play a part in decisions about whether to raise taxes to generate additional revenue and if so whether to invest in capital expenditure over improving service provision through increased operating budgets
Chinarsquos debt as a share of GDP is estimated to fall below the average for the low- and middle-income countries at 443 Tax revenues are also somewhat higher than in most low and middle-income countries As growth continues and the economy matures Chinese governments may be able to widen the tax base in line with developed economy standards bringing in significantly larger revenues Still the government remains well placed to invest in infrastructure Malaysia which has a larger infrastructure gap to overcome is somewhat more indebted (545) sitting above the median debt level for its peer group although not particularly dangerously so Conversely tax revenue as a share of GDP (143) is slightly lower than the median level for low- and middle-income countries of 147 This suggests that without a move into higher growth and a broader tax base the funding required to close the infrastructure gap is unlikely to materialise in Malaysia
TABLE 21 Stock of debt and tax revenues as a share of GDP selected countries
INCOME GROUP (WORLD BANK DEFINITION)
COUNTRY INFRASTRUCTURE INVESTMENT AS A SHARE OF GDP 2015
GENERAL GOVERNMENT DEBT AS A PROPORTION OF GDP
TAX REVENUE AS A SHARE OF GDP
High-income UK 16 1117 325
Canada 23 1147 320
Upper-middle income China 70 443 217
Malaysia 36 545 143
Low- and lower-middle income Pakistan 17 633 164
Nigeria 32 196 35
India 40 689 110
Source World Bank OECD IMF CIA World Factbook
Some countries such as China find themselves in the privileged position of having significant fiscal room to support further investment while also projecting a small infrastructure gap
Pakistan has a relatively high level of government debt (633) which is approaching the upper quartile of World Bank estimates This presents real risks to fiscal sustainability where pressure from the countryrsquos overseas debt obligations has raised the prospect of a debt crisis Here the high level of indebtedness may in part be due to rapid growth in infrastructure spending over recent years
Among the case study countries Nigeriastands out as having both the largest forecast infrastructure gap at 09 of GDP in 2040 and the weakest tax revenue (35 of GDP) The inability of the government to raise revenue effectively is holding back its ability to invest in infrastructure which in turn is holding back growth The availability of significant oil reserves can provide an alternative source of revenue to general
taxation especially when oil prices are high But there are reasons (environmental and technological) for considering that peak oil prices may have been (or will soon be) reached Therefore the ability of Nigeria to finance its investment from other sources of income will be essential to closing the countryrsquos infrastructure gap
This analysis demonstrates that there is significant country-level variation in the ability to respond to the global infrastructure gap (Table 22) Some countries such as China find themselves in the privileged position of having significant fiscal room to support further investment while also projecting a small infrastructure gap Others such as Pakistan and Nigeria will need to work within the limited fiscal room available for meeting their growing infrastructure needs
22
How accountants can bridge the global infrastructure gap | 2 Capacity for infrastructure investment
TABLE 22 A typology of infrastructure gap responsiveness
LIMITED FISCAL ROOM GREATER FISCAL ROOM
Low infrastructure gap lsquoSmall gap Fiscally restrictedrsquo(eg Canada)
lsquoSmall gap Fiscally flexiblersquo(eg China)
High infrastructure gap lsquoLarge gap Fiscally restrictedrsquo(eg Pakistan Nigeria)
lsquoLarge gap Fiscally flexiblersquo (eg Malaysia)
23
3 Selecting projects
Around the world the multitude of industrial cranes signals the increase in infrastructure projects and the resulting demand on investment resources Yet what is not apparent is the variety of competing demands for infrastructure investment such as the ageing of existing infrastructure the need to adapt the built environment to respond to climate change and the desire to initiate new often lsquomegarsquo projects6
The planning and selection process of the appropriate infrastructure project is particularly difficult given long asset lives and significant sunk costs that increase risk and uncertainty
Given these common barriers finance professionals from around the world offered a mixed review of their countriesrsquo current selection process Only 16 of respondents to the joint member survey claimed that their government always or frequently selects infrastructure projects that provide the most value to taxpayers whereas a majority (52) argued that their government only sometimes selects infrastructure projects of value to taxpayers Almost one-in-three respondents (29) indicated that they believed that governments never or infrequently select infrastructure projects that provide value to taxpayers (Figure 31)
There is clearly room for improvement in how infrastructure projects are selected To suggest how to improve the planning
and selection process respondents to the joint member survey were asked to rate in order of priority what changes could be made to improve decision-making when planning and selecting
infrastructure projects Figure 32 shows how respondents ranked the various options from first choice to fifth with smaller bars reflecting fewer respondents ranking that option in their top five
FIGURE 31 Do you believe the government selects projects that provide the most value to the taxpayer
0 10 20 30 40 50 60
Always
Frequently
Sometimes
Infrequently
Never
Dont know
Source The Global Infrastructure Gap survey all respondents n 3611
6 lsquoMegaprojects are large-scale complex ventures that typically cost US$1bn or more take many years to develop and build involve multiple public and private stakeholders are transformationaland impact millions of peoplersquo (Flyvbjerg 2018)
24
A majority of respondents (55) ranked either lsquoremoving political decision-makingrsquo or lsquoputting in place mechanisms to reduce corruptionrsquo as their first choice
The results (Figure 32) show that lsquoremoving political decision-making and making the process more technocraticrsquo was the change most cited by finance professionals as likely to improve the planning and selection process A majority of respondents (55) ranked either lsquoremoving political decision-makingrsquo or lsquoputting in place mechanisms to reduce corruptionrsquo as their first choice This prioritisation aligned with the pervading sentiment voiced by participants in the Canadian roundtable who argued that the government often plan and select projects that are likely to be popular among voters and will focus decision-making on the political cycle which results in short-sighted project selection and planning processes that lack a long-term plan to address future needs
The importance of putting in place mechanisms for reducing corruption such as effective whistle-blowing legislation also resonated in the roundtable discussions A participant in Nigeria emphasised that lsquoif project selection was looked into as it should be it would
definitely help us in reducing corruption and hence reduce the infrastructure gaprsquo Respondents also ranked highly lsquoquantifying the total life-cycle costs of a potential projectrsquo ndash with 22 selecting this as their first or second choice Therefore one of the key barriers to improving project selection is the bias towards short-term thinking and decision-making
Another area needing improvement identified in the survey is the lack of a standard assessment method supporting the project selection process The survey showed that 26 of respondents ranked lsquoimplementing standard assessment tools to evaluate projects during selectionrsquo as either their top or second-highest choice Below we explore two such barriers and how accountants play a role in addressing them first improving the project planning and selection processes by using standards and tools to identify need and prioritisation and second the misalignment between the project life cycle and the political short-term thinking that often prevails in project selection
How accountants can bridge the global infrastructure gap | 3 Selecting projects
FIGURE 32 Which of the following do you feel the government in your country should prioritise to make the best decisions when selecting infrastucture projects
Removing political decision-making making process
technocratic
100
80
60
40
20
0
n 1st preference n 2nd preference n 3rd preference n 4th preference n 5th preference
Applying standard assessment tools to
evaluate projects during selection
Putting in place mechanisms to
reduce corruption
Quantifying the total life-cycle
costs of potential projects
Spending more resource to evaluate
projects after completion
Transferring project selection powers
to more local levels of govt
Adhering to global accounting
standards
Bringing OOBs onto government
balance sheets
Moving government accounts from cash to accrual
accounting
Source The Global Infrastructure Gap survey all respondents n 3611
25
How accountants can bridge the global infrastructure gap | 3 Selecting projects
The constrained optimisation method is another tool that can be used for project selection though it is usually reserved for complex and large projects that require mathematical optimisation before decisions are made
31 BARRIER 1 LACK OF A STANDARD PROJECT SELECTION METHOD ndash FACTORING IN lsquoNEEDrsquo AND lsquoPRIORITISATIONrsquoA participant in the Trinidad amp Tobago roundtable commented that planning and project selection is lsquohardly ever done on a needs basis We do not complete a needs assessment when were building a road costing millions of dollars What is the benefit that we are going to bring to society from that new infrastructurersquo Establishing a need is a key consideration in building the case for selecting a particular project Although there are no international standards or regulations for infrastructure project selection the Guide to Project Management Book of Knowledge (PMBOK) (Project Management Institute 2017) sets out a process whereby the lsquoneedrsquo for the project is identified first and classified as most important in the selection This can be done by conducting a needs assessment or feasibility study and supports the reasons for lsquowhyrsquo the project is required The lsquowhyrsquo may be stimuli such as a market demand a business need a customer request a technological advance a legal requirement or a socialenvironmental need
The PMBOK then delineates two broad methods for establishing the benefit or the lsquowhyrsquo of a project the benefit measurement method and the constrained optimisation method
The benefit measurement methodAs a comparative approach this method is based on the present value of estimated cash flows and uses techniques such as benefitcost ratio economic models payback period discounted cash flow internal rate of return and opportunity cost This method is often used for small or less complex projects
Constrained optimisation methodThe constrained optimisation method is another tool that can be used for project selection though it is usually reserved for complex and large projects that require mathematical optimisation before decisions are made This method is widely used in finance and economics to find the minimum or maximum for a cost function where the cost changes depending on varying inputs Many techniques are available that offer broader consideration for decision makers by examining the best and worst case scenarios and the probability of the project outcome
The international roundtable participants highlighted that governments should ensure that the need for a particular project is clearly defined ndash the lsquowhyrsquo as the need will determine the appropriate source(s) of support To do this they should implement a stage-gate process such as the PMBOK with standard tools and mechanisms in place for evaluating the project selection process increasing transparency and reducing corruption
FIGURE 33 Two methods of need assessment
Uses cost-benefit analysis to assess whether the project is financially viable or not
Constrained optimisation method
The benefit measurement method
Compares the project under consideration with a competing project
New project Competing project
How accountants can bridge the global infrastructure gap | 3 Selecting projects
Alongside the technical methods available for isolating need and priority accountants can produce a broader range of metrics to improve the projection selection process
In practice many governments do not have the resources or the capacity to carry out such assessments across all projects and usually with the limited information available they place emphasis on basic elements of project appraisal which include lsquorules of thumbrsquo to confirm that
bull the need for the project is justified
bull the projectrsquos objectives are clearly specified
bull broad alternatives to the project are considered
bull promising options are analysed
bull project costs are fully estimated and
bull project benefits are assessed
Even by applying the basic elements of project appraisal prioritisation (or ultimately selecting the right project) can still be a constraint The World Bank has developed an innovative and adaptable Infrastructure Prioritization Framework (IPF) (Marcelo et al 2016) to assist governments in making the best use of their limited information in the interim until they are able to increase their capacity and resources for conducting a more informed and extensive analysis
The IPF provides a stepping-stone approach to project prioritisation for government decision-making This multi-criterial decision-support tool builds on existing and accessible data to help governments compare projects while promoting the building of analytical capacity and data for more extensive financial and economic analysis It is seen as an extension to the current set of tools available to support project selection It starts from a baseline of ad hoc uninformed project selection (where technical project information is limited and subjective) to partial technical information (where some information and analysis is available) to a full selection by advanced project appraisal (where considerable technical information is available)
Alongside the technical methods available for isolating need and priority accountants can produce a broader range of metrics to improve the projection selection process For example project planning and selection in Japan considers the effect of infrastructure investment on achieving regional equity instead of selecting projects that give the highest direct economic return (International Transport Forum 2017) This approach prioritises more evenly spread economic development in a country even where an optimisation model would suggest investment elsewhere
Box 31 Sustainability and infrastructure A Canadian case
The Canadian wave of the survey included a question on sustainability and infrastructure 80 of Canadian respondents indicated that they believe that it is very important to adapt to the impacts of the changing climate such as severe weather in planning infrastructure projects
It is important now more than ever to build resiliency into infrastructure investments Roads bridges buildings public transit and water and wastewater systems are at increasing physical risk from the impacts of climate change
The Canadian government declared in the 2017 federal budget that it plans to invest CAD219bn in green infrastructure Specifically CAD2bn is dedicated to a Disaster Mitigation and Adaptation fund to support the federal provincialterritorial and municipal infrastructure needed to address climate change Canadian national building codes have been updated to integrate climate adaptation and
resiliency considerations resulting from significant disaster losses Canadian insurance companies are experiencing the impact the annual insured damage for 2016 was CAD49bn ndash a significant increase from the previous annual record of CAD32bn set in 2013 In 2016 the biggest claims arose from the Fort McMurray wildfires which resulted in approximately CAD37bn in insured damage
Any future costs of inaction will likely outweigh the incremental investments made today in enhancing and modifying infrastructure resiliency Nonetheless too often there are challenges in making the business case for projects that incorporate adaptation measures But as with most modifications in the long run it is always easier and cheaper to build resilience considerations into asset development from the start rather than adding them later in response to a major event n
26
How accountants can bridge the global infrastructure gap | 3 Selecting projects
The member survey revealed the need to quantify the total life-cycle cost and remove political decision making in order to improve project selection
32 BARRIER 2 MISALIGNMENT OF THE INFRASTRUCTURE LIFE CYCLE AND THE POLITICAL CYCLE The member survey revealed the need to quantify the total life-cycle cost and remove political decision making in order to improve project selection These two changes are likely prioritised because of the misalignment that commonly exists between the political cycle (often four to six years) and the total life cycle of an infrastructure asset (often over 20 years) This mismatch can generate two biases a bias towards short-term decision-making and a bias towards megaprojects over maintenance
Short-term bias in project selection New infrastructure investment is unavoidably long-term and this carries certain risks At the stages of early planning and project selection infrastructure decision-makers need to consider the forces shaping a country ndash such as social demographic and technological change ndash while providing sufficient flexibility to address unpredictable adjustments in need These variables do not align well with the typically shorter political cycle where there is often a preference for announcements of major projects that can be hard to execute in practice or where fundamental requirements may be missing (eg unfeasible building requirements or little forecasted demand for use of the infrastructure) To counteract this bias the UKrsquos National Infrastructure Commission (NIC) was established in 2015 to produce analysis that is independent of government and to provide advice on major long-term infrastructure challenges ndash with the specific priority of linking long-term priorities with short-term action The NIC publishes an annual National Infrastructure Assessment (eg NIC 2018) to establish infrastructure needs and priorities over many decades
Having an independent body of experts recommending a stable set of priorities can reduce investment risk as potential private sector partners will have certainty that a project aligns with a broader economic plan Establishing a national plan based on agreed priorities is also good practice for reducing short-termism and improving legitimacy but it can also add rigidity to project selection processes Decision-makers must be careful to balance the benefits of a stable framework with maintaining flexibility to respond to a rapidly changing policy environment
Bias towards mega-projects over maintenance There can be considerable bias towards allocating resource to new (preferably high-profile) projects rather than investing in the necessary maintenance of existing assets There can be a natural reluctance to spend money on what a country already has and there is often political appeal in wishing to establish an individual legacy through the construction of a megaproject Accountants are in a pivotal position to draw attention to the issue of prioritising backlog maintenance to ensure that assets remain in serviceable condition As part of any needs assessments careful consideration must be given to the condition of existing capital infrastructure and its ability to maintain the existing levels of service To balance these demands NHS Scotland publishes an annual assets and facilities report which provides an overview of asset performance and planned future investment (see NHS Scotland 2018) This report offers good practices in quantifying and managing the backlog of maintenance including setting out the total outstanding backlog of maintenance costs per square metre of the estate and the proportion of significant and high-risk maintenance By identifying the maintenance backlog NHS Scotland is able to take the appropriate action to mitigate a reduction in public service quality while also prioritising repairs in line with the metrics established in the annual assets and facilities report
27
28
How accountants can bridge the global infrastructure gap | 3 Selecting projects
Box 32 Accountants and climate-change adaptation planning A Canadian case in point
As governments around the globe move to establish planned spending on infrastructure projects designed to adapt to climate change it is essential that accountants have a role in project selection and planning to help make the business case for resiliency and to ensure adequate accountability
In Canada the efficacy of this practice was illustrated when the City of Montreal developed its Climate Change Adaptation Plan Accountants played an integral role in performing the cost-benefit analysis of embedding adaptation into municipal infrastructure decisions (CPA Canada 2016)
lsquoA less costly option may be deemed adequate today but could result in future costsrsquo explained a participant in the Canadian roundtable
For example if Montrealrsquos sewer pipes cannot withstand increased flooding predicted with climate change sewer backups could lead to additional expenditures such as clean-up costs and even legal liabilities
lsquoClimate change is going to force cities and governments to put in place capital projects and other measures to prevent future losses or damagesrsquo emphasised the participant
Indeed there has never been a more vital time for CPAs to get involved in infrastructure project selection n
The walkway of Saint Anne De Bellevue Montreal Quebec during the floods April 2017Editorial credit Glass and Nature Shutterstockcom
29
4 Financing projects
The economic analysis in this report demonstrates that by 2040 the world will have accumulated an infrastructure gap of over US$14 trillion In response to this challenge governments are adopting novel means of effectively funding and financing their public infrastructure ndash as well as turning to institutional investors foreign direct investment and the private sector
Accountants act as a critical interface between these actors for example through effectively communicating and negotiating the terms of an infrastructure finance deal
41 THE MIX OF PUBLIC AND PRIVATE FINANCE FOR INFRASTRUCTURERespondents to the joint member survey shared the view that infrastructure in their countries should be financed by both the public and private sectors with 85 stating that infrastructure should be financed by some mix of investment from both the public and private sectors Half the total respondents (50) suggested that there should be an even mix between public and private finance while the second most common view was that infrastructure should be primarily financed by the public sector (42) Some countries such as the UK plan for the majority of their future infrastructure investment to come from the private
sector (IFG 2017) and data from the Project Finance and Infrastructure Journal shows that global private finance deals amounted to over US$930bn in 2017 (IJGlobal 2018) Given this environment
it is important for accountants to contribute their financial acumen and professional skills by providing a view on the best means of financing infrastructure projects (Figure 41)
FIGURE 41 How should infrastructure be financed in your country
0 10 20 30 40 50 60
PRIVATE
Entirely private finance
Mostly private finance
Even mix of public and private finance
PUBLIC
Mostly public finance
Entirely public finance
Dont know no opinion
Source The Global Infrastructure Gap survey generalist respondents only n 1645
30
and core public service infrastructure Core public service infrastructure such as hospitals and schools attracted the lowest private finance support
Overall finance and accounting professionals with a specialist background took a balanced view on the appropriate finance sources for infrastructure in their country
42 KEY BARRIERS TO SECURING PRIVATE FINANCE FOR INFRASTRUCTUREThe member survey showed that 85 of respondents believed there should be some mix of public and private sector finance in their countryrsquos infrastructure A key question therefore is what barriers limit the flow of private finance for public infrastructure
Survey respondents with specific expertise in infrastructure (lsquospecialistsrsquo ) provided a detailed breakdown on the suggested balance of public and private investment by each type of infrastructure
7
Almost half (47) of specialist respondents argued that ICT infrastructure should be either mostly or entirely financed by the private sector while other transport ndash such as air or sea ndash ranked as the second highest subsector for private sector investment (36) (Figure 42) There was a consistent view across the infrastructure subsectors that there should be an even mix of public and private investment with between 33 and 46 of specialist respondents holding this view Only three subsectors were seen to benefit from finance originating mostly or entirely from the public sector these were water and sanitation roads and highways
How accountants can bridge the global infrastructure gap | 4 Financing projects
Overall finance and accounting professionals with a specialist background took a balanced view on the appropriate finance sources for infrastructure in their country
FIGURE 42 How should infrastructure be financed in your home country by infrastructure sub-sector
Dont know no opinion PUBLIC Even mix PRIVATE
Information and communication technology
Other transport
Power and energy
Railways
Water and sanitation
Roads and highways
Core public service infrastructure
0 10 20 30 40 50 60 70 80 90 100
n n n n
0 10 20 30 40 50
Insufficient skills in government to negotiate with private sector
Lack of attractiveness of infrastructure investment
Negative perception of private finance for public infrastructure
Regulatory barriers
Perceived political instability in my country
Underdeveloped financial markets in my country
Too few viable projects for private investment
Other
Dont know
FIGURE 43 What are the key challenges that the government faces in securing private finance
Source The Global Infrastructure Gap survey all respondents n 3611
Source The Global Infrastructure Gap survey specialist respondents only n 1966
7 Question 3 of the survey asked respondents if their work involved any of the following areas infrastructure policy procurement capital budgeting project management or operations management
How accountants can bridge the global infrastructure gap | 4 Financing projects
Developing the skills in government to act as competent clients and negotiators will be essential in meeting the challenges of providing the right finance for infrastructure projects
As seen in Figure 43 ACCA members and CPA Canada members identified three key barriers for governments working to secure private finance
Barrier 1 the lack of attractiveness of infrastructure investment (42)
Barrier 2 the negative perception of private finance for public infrastructure (43) and
Barrier 3 insufficient skill in government to negotiate with the private sector (45 of respondents)
The distinction between lsquofundingrsquo and lsquofinancingrsquo infrastructure (set out in the next section) helps explain the lack of attractiveness of infrastructure investment and what accountants might do to reduce this problem The higher cost and perceived private gain from public goods is a significant factor in the negative perception of private finance investing in public infrastructure The UK National Audit Office published a report in January 2018 calling out the high rates of return enjoyed by private investors participating in the Private Finance Initiative (Morse 2018) Therefore accountants must take centre stage in
demonstrating the higher cost of private capital managing the transfer of risk between sectors and building an evidence base for selecting the right financing model to support an infrastructure project
Finally developing the skills in government to act as competent clients and negotiators will be essential in meeting the challenges of providing the right finance for infrastructure projects For example there is growing recognition that gold-standard public finance takes account of more than debt stocks and cash flows (eg debt to GDP ratio and tax receipts) and instead needs to consider net wealth particularly public assets Cultivating the skills in government to produce a public sector balance sheet and applying this perspective to the finance selection process will help policymakers maximise the value of their assets and make better infrastructure finance decisions
The remainder of this chapter will discuss these barriers in order to inform areas where public sector accountants can make a difference in closing the infrastructure gap
FIGURE 44 Key barriers in financing infrastructure projects
Lack of attractiveness
of infrastructure investment
Negative perception of
private finance for public
infrastructure
Insufficient skill in government
to negotiate with the
private sector
BARRIER 1 BARRIER 2 BARRIER 3
42 43 45
31
How accountants can bridge the global infrastructure gap | 4 Financing projects
Investment in infrastructure offers the opportunity for private investors to benefit from stable long-term low-risk returns that are tied to a physical asset
43 BREAKING DOWN BARRIER 1 BY CLOSING THE FUNDING GAP
Investment in infrastructure offers the opportunity for private investors to benefit from stable long-term low-risk returns that are tied to a physical asset A key challenge in connecting this pool of private capital with the demand for infrastructure projects is the funding gap Broadly there are three ways of funding (lsquoultimately paying forrsquo) an infrastructure project
Distinguishing between funding and financing It is important to make a clear distinction between the lsquofundingrsquo and lsquofinancingrsquo of infrastructure projects When a private sector institution such as a bank or pension fund finances a public infrastructure project it is providing the upfront money to allow for the design building and operation of that project whereas lsquofundingrsquo is how an infrastructure project is ultimately paid for (Institute for Government 2018)
Global capital markets can help plug the global infrastructure gap Institutional investors with an estimated US$80 trillion in assets under management (Fages et al) seem ideal partners for providing the required finance to reduce the size of the forecasted global infrastructure gap Their risk appetite and the duration of their liabilities match the needs of typical infrastructure projects that will often have life cycles ndash from design to decommission ndash that can span many decades
bull general taxation
bull user charges (eg toll roads) and
bull novel forms of funding (eg value capture and civic crowdfunding)8
This distinction explains why even where private investors have expressed interest in public infrastructure and while the global infrastructure gap grows the response has been relatively muted (McKinsey 2016a) Private investors understandably require a stream of revenue to support their upfront outlay but many potential (even lsquoshovel readyrsquo) projects do not include the long-term funding arrangements to support private finance
FIGURE 45 The funding gap
Global Infrastructure Investment Gap
(forecasting a US$14 trillion gap by 2040) FUNDING
GAP
Institutional Investors
(US$80 trillion under management)
8 Refer to Institute for Government 2018 for an overview of the advantages and disadvantages of different infrastructure funding options
32
Box 41 Hong Kongrsquos MTR Corporation ndash fully funded infrastructure through value capture
Hong Kong has applied a novel form of infrastructure funding that has attracted global attention MTR Corporation is majority owned by the Hong Kong government and manages a passenger rail system that makes a profit It manages to generate revenue in excess of 180 of its operating cost
One factor in MTRrsquos financial success has been its lsquoRail plus Propertyrsquo model where the corporation captures some of the positive externalities of its transit operations by developing and renting the land surrounding its rail stations
Hong Kong is particularly suited to this form of funding with its dense population and high real estate costs which have allowed MTR to create sustainable revenue streams from the development of the land surrounding its stations (Leong 2016 MTR Corporation 2017) n
Innovative models of funding infrastructureGeneral taxation and government capital allocations provide an important foundation for funding public infrastructure while user charges can provide a stream of revenue (eg road tolls) ndash subject to demand risks There are also emerging models that are helping to plug the funding gap Rent capture is attracting attention as a method of funding transit (see Box 41 on the MTR Corporation in Hong Kong for an example) In addition civic crowdfunding a novel form of funding is spreading in popularity A report from Catapult Future Cities (2017) found that 10 of local governments in the UK now make use of some form of civic crowdfunding to transform their communities Spacehive ndash a UK crowdfunding platform ndash has attracted over pound11 million in funding since 2012 to fund over 550 local projects including building new community centre facilities (Spacehive 2019) Platforms such as Spacehive connect grant providers local governments and residents that collectively contribute to projects as well as providing a service to verify that a project is viable and has received the required government permissions In 2017 the Mayor of London committed pound400000 to Spacehive projects (OrsquoDowling-Keane 2017) As governments face constrained budgets public sector
finance officials can play a central role in supporting these novel forms of infrastructure funding by establishing what proposals are financially viable in order to help plug the infrastructure gap
The role of the accountant in addressing the funding gapBeyond these novel funding models accountants can play an important role by helping to identify the most efficient funding models while also taking a leading role on the negotiation with potential private sector investors and representing the public interest through their high ethical standards
Clearly the funding gap is a factor in lsquothe lack of attractiveness of infrastructure investment for private investorsrsquo identified in the member survey Finance professionals should consider a number of factors in formulating effective business cases that can attract private sector finance (eg in articulating the lsquoprivate sector incentiversquo) The financial viability of the project needs to be balanced against affordability for users and access to public goods and services Accountants must consider how they can develop and communicate the private sector incentive for investing in priority projects while also supporting the public interest and providing taxpayers with value for money
33
How accountants can bridge the global infrastructure gap | 4 Financing projects
General taxation and government capital allocations provide an important foundation for funding public infrastructure while user charges can provide a stream of revenue (eg road tolls) ndash subject to demand risks
34
How accountants can bridge the global infrastructure gap | 4 Financing projects
44 BREAKING DOWN BARRIER 2 BY ACCOUNTING FOR THE HIGHER COST OF PRIVATE CAPITALRunning infrastructure projects efficiently for citizens also requires that accountants provide decision-makers with the best advice possible in selecting the appropriate source of project finance
The UK is a global leader in the use of private finance and has over 700 operational private finance deals ndash with total projected future charges arising from these deals of almost pound200bn (Morse 2018) In 2018 The UKrsquos National Audit Office published a report examining the rationale costs and benefits of private finance for public sector projects (Morse 2018) The reportrsquos analysis of Department for Education data showed that the cumulative cost of privately financed projects can exceed the public sector
finance costs by 40 over the life of an infrastructure project The broader benefits of private finance for example transferring risk away from government must therefore outweigh the higher total life-cycle cost of private capital
Off balance sheet liabilities in public sector accountingThe UK is not alone in making use of private finance to provide the upfront capital for public infrastructure The accounting rules set by the European System of Accounts excludes liabilities from public sector balance sheets if the private sector bears most of the projectrsquos risks and rewards The types of risk contributing to this test include construction risks (eg cost and time overruns) and demand risks (eg forecasted and actual use of the infrastructure asset) (Atkins et al 2017) Liabilities not included
By the nature of the public sector there are many competing short-term needs for public capital investment where necessary infrastructure investment must compete with other public spending priorities
35
30
25
20
15
10
05
0
Portu
gal
Slov
akia
Hungar
y
UK
Cypru
s
Irelan
dN
ethe
rland
s
Spain
Denm
ark
Esto
nia
Belgiu
m
Gre
ece
Croat
ia
Austri
a
Malt
a
Italy
Finl
and
Latv
ia
FIGURE 47 Off balance sheet PPPs as of GDP
Source ACCA and CPA Canada analysis of Eurostat 2018
FIGURE 46 Estimated cash flows of a privately and publicly financed projectThe cumulative cash costs of a group of PF2 schools are around forty per cent higher than the costs of a project financed by government borrowing
350000
300000
250000
200000
150000
100000
50000
0
Cumulative cash costs (pound000)
2015 2016 2017 2018 2019 2020 2021 2022 2023 2024 2025 2026 2027 2028 2029 2030 2031 2032 2033 2034 2035 2036 2037 2038 2039 2040 2041 2042
Benefits needed to offset higher costs of private finance procurement
PF2 unitary charges Public sector comparator (PSC) with government borrowing costs
Notes1 Cost estimates taken from data prepared by the Department for Education to compare costs of a group of privately financed (PF2) schools with a public sector comparator (PSC)
2 Interest costs for the PSC have been modelled using an amortising loan with an interest rate of 25 The 20-year government borrowing costs were 25 at the time of financial close of this project and the average life of the project debt was less than 20 years
Source Education Funding Agency National Audit Office analysis Reproduced from Morse 2018
How accountants can bridge the global infrastructure gap | 4 Financing projects
Accountants in the public sector must play a critical role in managing both these benefits while also collecting reliable data to measure whether private finance provides good value for money
on the public sector balance sheet are known as off balance sheet (OBS) liabilities Data from Eurostat shows that other European countries have amassed considerable OBS liabilities ndash with outliers such as Portugal and Slovakia maintaining OBS liabilities in excess of 3 of GDP (Eurostat 2018)
An incentive for using private finance can arise through the combination of fiscal rules such as the EUrsquos Fiscal Compact requiring governments to meet debt reduction targets (European Commission 2017) and the ability to keep certain liabilities off the balance sheet through private finance Governments will be encouraged to use private finance even when it ultimately costs more than traditional public finance when this generates the fiscal illusion of adhering to fiscal rules while at the same time building and operating necessary infrastructure In addition to the fiscal illusion these treatments limit the transparency of infrastructure finance by shielding some politicians and the public from understanding the true cost of infrastructure investment in a particular country
Insufficient flexibility between capital and operational budgets can cause further challenges This is particularly the case where a public sector entity can attribute the unitary charge9 from a private finance deal to its operational budgets in cases where the capital budget includes insufficient funding for a required project By the nature of the public sector there are many competing short-term needs for public capital investment where necessary infrastructure investment must compete with other public spending priorities ndash such as the growing operational costs of health care and education But over time high unitary charges can crowd out operational budgets and prevent future governments from providing quality public services
Why use private finance for public infrastructure Given all these concerns it is unsurprising that in the October 2018 Budget Speech the UK Chancellor confirmed that the government would not sign any new Private Finance Initiative (PFI) contracts (Plimmer 2018) Given this environment it is worth asking what is the genuine rationale for private finance in public infrastructure
Two key benefits can justify the use of private finance for public infrastructure the appropriate transfer of risk from the public to the private sector in the building and running of the infrastructure and efficiencies achieved through the use of private sector money in the financing building and operation of public infrastructure Accountants in the public sector must play a critical role in managing both these benefits while also collecting reliable data to measure whether private finance provides good value for money The next chapter explores findings from the member survey on how best to manage the relationship between public and private actors involved in infrastructure projects
At the early stages of a projectrsquos conception accountants are also critical in selecting the right type of finance where they can provide a transparent assessment of the best finance option based on sound principles (eg value for money affordability for users and distribution impacts) Previous ACCA research shows the high level of trust in the ethical behaviour of accountants Ethics and Trust in a Digital Age (ACCA 2017) found that 9 in 10 professional accountants agree that ethical behaviour helps to build trust in the digital age And almost all C-suite executives (95) assert that the accountantrsquos ethical behaviour helps the organisation build trust with internal and external stakeholders Accountants can offer a collective good through this privileged position of trust by providing sound transparent advice on the best finance option for a particular infrastructure project
9 The recurring payments by governments for privately financed projects
35
How accountants can bridge the global infrastructure gap | 4 Financing projects
The barrier to attracting private finance for infrastructure most cited in the member survey was that governments have insufficient skill to negotiate effectively with the private sector (45)
45 BREAKING DOWN BARRIER 3 BY PROFESSIONALISING THE PUBLIC SECTOR FINANCE FUNCTION The barrier to attracting private finance for infrastructure most cited in the member survey was that governments have insufficient skill to negotiate effectively with the private sector (45) This issue was echoed in the roundtables with participants in Trinidad and Tobago stating that there was a clear need to differentiate professional accountants from those who had no real professional training lsquoterms are used very loosely in this country as to an accountant and most times you would mean ldquobookkeeperrdquorsquo Others in Malaysia noted that lsquomany accountants nowadays lack the right specialisation of skills in terms of having foresight to anticipate what costshellipcome into play [in an infrastructure project]rsquo Clearly there are skills gaps in government that need to be addressed through professionalisation and upskilling if infrastructure is to be properly financed
Finance professionals offer a net wealth perspective Knowing what the country owns and what it owes is a basic requirement for reducing its governmentrsquos information deficits which will allow for improved decision-making in financing infrastructure The professional management of assets and the development of an asset register are two examples of how accountants can take the lead in improving government decision-making In the UK roundtable discussion David Smith associate partner at EY UK also acknowledged the essential role of accounting standards
lsquoAccountantsrsquo work now goes beyond compliance but compliance is our firm foundation Speaking from experience we have global accounting rules that do not necessarily align jurisdiction by jurisdiction but the rules are there for a reason If therersquos deviation or rejection of accounting standards for infrastructure projects at any stage then that is a clear red flagrsquo
Global studies are documenting how the benefits of accrual accounting are leading to broad global adoption For example the 2018 International Public Sector Financial Accountability Index forecasts that within the next five years 65 of governments will report on an accrual accounting basis ndash with particularly high levels of adoption in Africa Asia Latin America and the Caribbean (IFAC and CIPFA 2018)
The professionalisation of the finance function is essential in maximising the value of a countryrsquos assets There is growing recognition that gold-standard public finance practice takes account of more than debt stocks and cash flows (eg debt to GDP and tax receipts) and instead needs to consider net wealth where the right policies can maximise the return on public assets This approach requires the adoption of full accrual accounting and the production of a public sector balance sheet Improving the skills available to government to develop a public sector balance sheet and appreciating the full balance sheet impact of a new project will be an important step in allowing public sector accountants to act as competent clients of and negotiators with the private sector
36
How accountants can bridge the global infrastructure gap | 4 Financing projects
37
Maximising the value of public assets and the intertemporal balance sheetDag Detter a former director of Swedenrsquos Ministry of Industry argues that taking a net wealth perspective with the aim of producing small improvements in the return on public assets would allow for a doubling in infrastructure investment (Detter and Folster 2017) The competing argument to this view is that many public assets are not marketable as policy objectives (eg running a public school) do not typically align with generating financial returns
The New Zealand government seeks to address this issue by classifying its assets and liabilities as social financial and commercial ndash where commercial assets have more scope for financial returns New Zealand has taken the lead in public
The adoption of this net wealth perspective changes the typical rankings of public financial capability In late 2018 the IMF Fiscal Monitor published a report (IMF 2018) which estimated that globally governments had public assets worth over 200 of GDP Applying this analysis can also support good public financial management in a country with the IMF report showing that countries with a strong balance sheet pay lower interest on debt and have shorter and shallower recessions
Figure 48 shows the result of adopting a net wealth view of a nationrsquos financial position Using this lens Japan ndash with a notoriously high public-debt-to-GDP ratio ndash has a net wealth position near zero Other countries such as the UK and Portugal have substantial negative public equity in excess of 100 of GDP
The professionalisation of the finance function is essential in maximising the value of a countryrsquos assets
FIGURE 48 Public sector balance sheets ( of GDP)
750
500
250
0
-250
-500
Port
ugal
Uni
ted
Kin
gd
om
The
Gam
bia
Ger
man
y
Bra
zil
Fran
ce
Aus
tria
El S
alva
do
r
Uni
ted
Sta
tes
Ug
and
a
Jap
an
Ken
ya
Tanz
ania
Can
ada
Ind
ia
Gua
tem
ala
Finl
and
Alb
ania
Co
lom
bia
Tuni
sia
Geo
rgia
Sout
h A
fric
a
Aus
tral
ia
New
Zea
land
Ind
one
sia
Ko
rea
Peru
Kaz
akhs
tan
Russ
ia
No
rway
n Financial assets n Total non-financial assets n Liabilities ex pension n Pension liabilities Net worthTu
rkey
Source IMF staff estimates
Based on a single year of data in most cases compiled as part of the Fiscal Transparency Evaluation Albania 2013 Austria 2015 Brazil 2014 Colombia 2016 The Gambia 2016 Guatemala 2014 Kenya 2013 Peru 2013 Portugal 2012 Tanzania 2014 Tunisia 2013 Turkey 2013 Uganda 2015
38
How accountants can bridge the global infrastructure gap | 4 Financing projects
TABLE 41 New Zealand Intertemporal balance sheet 2016(Percentage of GDP)
ASSETS LIABILITIES NET WORTH
Social 575 71 505
Financial 332 505 -173
Commercial 201 120 81
Static balance sheet 1108 695 413
Fiscal 13819 14800 -981
Intertemporal balance sheet 14927 15495 -568
Source New Zealand 2017 Investment Statement IMF 2018
Box 42 New South Wales Treasury Asset and Liability Committee
The state of New South Wales in Australia has established an Asset and Liability Committee to maximise the value of their assets and properly manage the statersquos liabilities
By using this total balance sheet perspective the New South Wales Treasury has been able to unlock AU$33bn for new social and economic infrastructure projects
This initiative was recorded as part of a series undertaken by ACCA and the International Federation of Accountants (IFAC) documenting good practices in public financial management from around the world To learn more scan the QR code to hear more about this initiative in NSW
If the public sector finance function is professionalised accountants working in the public sector will be able to lead the development of the required governance structures to maximise the value of public assets And where public assets do present commercial opportunity accountants must be at the forefront of proper public commercial asset management By providing independent professional management for public assets governments will be well placed to maximise the value of their assets and minimise the cost of liabilities The member survey shows that reducing political influence in project selection was ranked as the number one issue for improving outcomes Allocating more decision-making authority to independent professional accountants will be an important step in the effective commercial management of public assets
financial management practices not just through this classification but also by producing an intertemporal balance sheet (see Table 41) The country currently maintains a strong net worth position in excess of 40 of GDP but analysis by the New Zealand Treasury shows that the current policy framework will produce recurring deficits that are forecasted to reduce the nationrsquos net worth to almost ndash57 of GDP over the next 40 years Accountants producing this analysis provide decisions-makers with a better long-term view of their policy decisions and can help improve the sustainability of public finances This fits with the maxim that lsquoyou manage what you measurersquo and governments that invest in their finance functions to develop a public sector balance sheet will be better placed to understand the implications of a particular infrastructure project on the nationrsquos net wealth
Where public assets do present commercial opportunity accountants must be at the forefront of proper public commercial asset management
Poor monitoring and oversight of
projects by government
Confusion about where
each side provides value
in a PPP
Uncoordinated commerical
acumen in the public sector
BARRIER 1 BARRIER 2 BARRIER 3
5 Delivering projects the publicndashprivate relationship
Common challenges with infrastructure project selection and financing outlined in the previous chapters may persist through the project delivery phase a shortfall in public capital budgets due to short-term decision-making changing political governance and the lsquomegarsquo risks associated with lsquomegarsquo projects For these reasons public-private partnerships (PPPs) are often chosen for the delivery of public infrastructure projects
51 DEFINING PPP In the context of public infrastructure projects a PPP is a contractual agreement between a public sector entity and a private entity (or group) to provide a public asset or service (World Bank 2018b) Unlike traditional procurement ndash where all the risk will ultimately sit with the government ndash PPPs will explicitly set out the allocation of risk for a project Importantly the scope of private sector involvement can vary substantially including requiring private sector partners to
bull design and build a project
bull design finance and build a project or
bull design finance build operate and maintain a project
Asset ownership is another relevant consideration in establishing the terms of a PPP A project can feature public or private sector ownership of the infrastructure and can include provisions to transfer ownership after a set period (eg a private sector partner operates a toll road for 20 years and thereafter transfers ownership of the road back to the public sector)
The roundtable discussion rightly identified the variety of responsibilities that the private sector can adopt in
a PPP For example a participant in the Canadian roundtable identified that the lsquoprivate sector needs to bring more to the government table than just money it needs to offer expertise or opportunity that the government would not otherwise haversquo
52 KEY BARRIERS TO GETTING THE PPP RELATIONSHIP lsquoRIGHTrsquo The public-private relationship is evolving and getting the terms of this relationship right will be critical for the provision of social and economic infrastructure in the future The roundtable discussions with infrastructure experts highlighted three key barriers to this where there was a particular focus on the need to develop the right relationship between public and private sector actors ndash as getting this
relationship right would support the timely and efficient delivery of infrastructure projects (Figure 51)
The roundtable participants identified poor monitoring and oversight by government as a key challenge in delivering infrastructure projects The member survey demonstrated that there was considerable disagreement about where each party in a PPP agreement provides value in delivery Finally the roundtable participants stated that the public sector was often lacking the commercial acumen required to manage an infrastructure PPP effectively
Below this chapter examines these barriers in greater detail and reviews recommendations for overcoming each one
FIGURE 51 Key barriers in delivering infrastructure projects
3939
How accountants can bridge the global infrastructure gap | 5 Delivering projects the publicndashprivate relationship
Both developed and developing countries need to consider whether they are providing sufficient monitoring across the entire project life cycle to maximise the value of their contracts
53 BREAKING DOWN BARRIER 1 BY ENGAGING THE PROFESSIONAL ACCOUNTANT TO PROVIDE PROJECT LIFE-CYCLE MONITORING AND OVERSIGHT Successful project selection financing and procurement will be of little effect if an infrastructure PPP suffers from poor contract management Managing project risk effectively ndash as well as controlling for scope and budget lsquocreeprsquo ndash requires the public sector to act as a competent client by providing effective monitoring and oversight of a project at every stage from design to operation of the infrastructure
Unfortunately these governance structures are often lacking in many countries with a participant in the Sri Lankan roundtable discussion noting that lsquoprojects [will] kick off but there is no one to monitor them on an ongoing basis This can lead to cost overrunsrsquo Written evidence by the Chartered Institute of Purchasing and Supply (2013) to the UK House of Commonsrsquo Public Administration Select Committee echoed this point In this evidence the Institute submitted that lsquoprocurement skills tend to focus on the call for competition to award the contract rather than on the whole procurement cycle which includes pre-procurement and contractsupplier managementrsquo Both developed and developing countries need to consider whether they are providing sufficient monitoring across the entire project life cycle to maximise the value of their contracts
Chapter 1 section 15 showed that corruption was one of the top barriers to meeting infrastructure need in certain
FIGURE 52 Possible parties to a PPP
regions ndash with 89 of survey respondents in South Asia citing this as a key barrier A roundtable participant in Trinidad and Tobago asserted that proper monitoring of project performance was essential for mitigating corruption particularly lsquohaving something that can support the accountants in countries with no whistle-blowing policyrsquo In addition Abiodun Akanbi from the Nigerian roundtable commented that lsquothe accountant has huge responsibility in measuring the actual performance of contractors to be able [to] efficiently deliver infrastructurersquo The accountant needs to be at the forefront of providing the public sector assurance that the project is being delivered as contracted and according to the project plan Clearly accountants in the public sector have a critical role to play in effective contract management ndash particularly by measuring project progress against agreed terms at key milestones in the delivery process
Reducing moral hazard in the PPP relationship Eriksson and Lind (2015) describe moral hazard as lsquopost-contractual opportunismrsquo There are three key parties that need to be considered in an infrastructure PPP the owner the contractors building the infrastructure and the investor Depending on the structure of the PPP contract any of these roles could be taken on to varying degrees by the government or a private partner Given the limited oversight and governance of many PPPs cited in the roundtable discussions the agents of a PPP project (ie the contractors) will often have the incentive to reduce costs by cutting corners in the projectrsquos execution
Investor Contractor
Owner
40
How accountants can bridge the global infrastructure gap | 5 Delivering projects the publicndashprivate relationship
41
54 BREAKING DOWN BARRIER 2 BY IMPROVING THE INCENTIVES AND RECONCILING DIFFERING VALUE ASSUMPTIONSThe member survey compared the perceptions of public and private sector accountants revealing areas where differing assumptions exist between these parties The survey divided respondents into those working in the public sector and those in the private sector Each group was asked in what ways the other sector provided and received value in PPP infrastructure projects Comparing these results demonstrates where the public and private sectors had a similar view on the purpose of a PPP relationship and where their assumptions on the purpose of the relationship differed (Figure 53) These insights are helpful in highlighting divergent views on the role of each sector where incorrect assumptions can harm the ability of a PPP to deliver a project
Comparing the results from each sector in Figure 53 shows that there was broad agreement on how the private sector adds value to infrastructure projects The ordering of the responses was the same for professionals across the two sectors with the majority of respondents from both sides agreeing that the private sector contributes to the partnership through its knowledge of best practice the application of innovation and access to private capital Interestingly respondents from both sectors were less likely to see risk transfer as an area where the private sector provides value The
These three stakeholders shown in Figure 52 will often have different motivations For example the owner might want to increase the scope of the contract after it is agreed For this reasonaccountants must assess the risks balance the costs and schedule and proactively communicate with all stakeholders to support the success of the project
Allocating risk to reduce moral hazardA CPA Canada roundtable participant rightly identified that lsquothe key areas of interface [between the public and private sector] are between the risks retained by the public sector and their impact on the private sectorrsquos ability to deliver on their contractual commitmentsrsquo Getting this allocation of risk right can significantly improve the prospects that a PPP project will be completed on time and on budget as the right risk balance will act as an incentive to meet contractual obligations (Mann 2018)
Accountants play a clear role here The professional team delivering a project will be aided by an accountantrsquos expertise of risk management ndash particularly the accountantrsquos ability to allocate risk appropriately between the parties in order to minimise moral hazard Although the size and nature of the public sector suggests that it is better placed to bear risk skilled finance professionals will seek to balance the allocation of risks to the private parties such that they maintain the incentive to perform contractual obligations to a high quality standard
Comparing the results from each sector in Figure 53 shows that there was broad agreement on how the private sector adds value to infrastructure projects
Source The Global Infrastructure Gap survey all respondents n 3611
70
60
50
40
30
20
10
0Applying innovative
practices and fresh thinking
Knowledge of best practice and expertise
n Private sector view n Public sector view
Access to private capital
Delivering projects on time
Keeping projects to budget
Transferring risk Dont know None of these
FIGURE 53 Where does the private sector add value in delivering infrastructure
42
How accountants can bridge the global infrastructure gap | 5 Delivering projects the publicndashprivate relationship
assumptions about how each party adds value to an infrastructure PPP contract ndash and suggests that public sector actors overestimate the value of the financial arrangements on offer to private sector partners
The UK Guarantees Scheme (UKGS) offers an example of a good practice that could help improve the private sector incentive for entering PPPs and partially reconciles the differing assumptions of value between both sectors The UK Infrastructure and Projects Authority states that the UKGS lsquosupports private investment in UK infrastructure projects It works by offering a government-backed guarantee to help infrastructure projects access debt finance where they have been unable to raise finance in the financial markets The UKGS can issue up to pound40 billion of guarantees and is open to at least 2026rsquo (UK Government 2017) This long-term commitment guarantees the payment of principal and interest on infrastructure debt and is intended to support lsquonationally significantrsquo projects If well implemented schemes like this can encourage additional private sector involvement in the provision of infrastructure ndash but should be balanced against the need to reduce the risk of moral hazard discussed earlier in this chapter
comparison of perceptions also showed that public sector respondents were slightly more positive about the overall value that private sector actors bring to the relationship
There was considerable divergence in opinion between sector respondents as to the areas where the public sector provided value in an infrastructure PPP (Figure 54)
Public sector respondents were much more likely to argue that they provided both a lsquolong-term and stable partnershiprsquo (62) and knowledge of how the public sector works (60) than their private sector colleagues (45 and 43 respectively) Finance professionals from the public sector were also more likely to claim that they provided the private sector with access to projects (45) compared with 35 in the private sector At the same time there was an agreement that the public sector was less likely to offer knowledge of best practice and innovation to a PPP relationship Therefore both sides took a largely similar view of the origin of knowledge and expertise but the public sector respondents were more optimistic about the value they provided as a financial partner in infrastructure projects Understanding this divergence of viewpoint is helpful in identifying the
There was considerable divergence in opinion between sector respondents as to the areas where the public sector provided value in an infrastructure PPP (Figure 54)
Source The Global Infrastructure Gap survey all respondents n 3611
70
60
50
40
30
20
10
0Long-term and
stable partnershipKnowledge of how the
public sector works
n Private sector view n Public sector view
Access to projects Knowledge of best practice and expertise
Applying innovative practices and fresh thinking
None of these Dont know
FIGURE 54 Where does the private sector receive value from the public sector in delivering infrastructure
How accountants can bridge the global infrastructure gap | 5 Delivering projects the publicndashprivate relationship
To ensure that an infrastructure project is successful strong commercial acumen is essential team members require lsquobusiness savvyrsquo a keen understanding of the market in which the project is being undertaken
55 BREAKING DOWN BARRIER 3 BY FACILITATING PUBLIC SECTOR ACCESS TO BUSINESS EXPERTISE To ensure that an infrastructure project is successful strong commercial acumen is essential team members require lsquobusiness savvyrsquo a keen understanding of the market in which the project is being undertaken Nonetheless as Ajith Lekshmanan a participant in the UK roundtable pointed out
lsquoFor a lot of these projects the [public sector] organisation may just be doing it the one time Itrsquos a one-off and these experts that we are going to [in the private sector] theyrsquove got a whole pool of people doing similar things year after year day after day in this country and other countries The skills required are quite specialist and to train a member of staff [in the public sector] to do it just for the one time that you might be using it is not cost effectiversquo
A public sector entity might manage a large-scale infrastructure project and gain valuable expertise in the process but that expertise may not be accessible to other public sector entities for leveraging in their own infrastructure projects In the public sector project-delivery expertise thus exists in silos It is often the private partners in a PPP who through repeated projects acquire the commercial acumen and therefore potentially hold the expert lsquoreinsrsquo
Centralisation of public sector skills may facilitate removal of this barrier For example the UK Civil Service has created Centres of Excellence that seek to pool the pockets of expertise that exist in the public sector such that any organisation within the public sector can refer to these centres and draw on their specialist skill and thus act as a competent client The professional accountant offers specialist skill and should certainly be a key player in any centre of excellence In fact the accountantrsquos role as an expert team member in such centres may provide as stated by a participant in the Malaysian round table ldquobetter marketing of how the profession contributes to society to encourage professionals to continue doing the right thing and be proud of itrdquo
Centralisation of skills will not however be the answer for all governments Others might seek to encourage cross-departmentministry collaboration to facilitate effective knowledge transfer of commercial acumen across the public sector In both cases collaboration is essential for effective knowledge transfer and as previously outlined the professional accountant with an understanding of life-cycle considerations and with professional frameworks for sound professional judgement and ethics is well-equipped to coordinate such collaboration
43
6 The role of the accountant in bridging the gap
61 CURRENT INFRASTRUCTURE PROJECTS THE MISSING TEAM MEMBER The successful provision of public infrastructure requires governments to have the right professional team in place And yet a clear message resounded from the international roundtable discussions a key player is often missing from the infrastructure project team ndash the accountant A representative at the Malaysian roundtable echoed the sentiment expressed by other participants worldwide that accountants are often only invited to comment on infrastructure projects that have already been selected lsquoSo the harm has been donersquo
As pointed out by a participant in the UK roundtable the role of the accountant has evolved over the years from a focus on lsquoguidelines parameters tick boxes and flowchartsrsquo to a much lsquowider awarenessrsquo Certainly the fact that accountants around the globe work within diverse segments of the economy and serve in key roles such as CEO and CFO and as consultants attests to that lsquowider awarenessrsquo The role of the accountant is at the centre of the planning process and not only in the areas of infrastructure policy The accountant can put the lsquonumbersrsquo on ideas and concepts by applying consistent methodology to ensure they are evaluated against other options for meeting policy goals
Future infrastructure projects the essential team member The previous chapters examined the barriers associated with three fundamental phases of infrastructure projects project selection project financing and project delivery With modern qualifications that facilitate barrier removal in each of these phases the accountant plays an essential role in bridging the global infrastructure gap
The international roundtable participants highlighted the following core competencies
a) Planning and selection of projects The accountant
bull develops strategy identifies goals objectives and ensures they can be achieved (giving consideration to financial constraints and potential monetary gains)
bull sets frameworks and uses standard assessment tools to ensure accountability and transparency and prioritisation according to evidence of need
bull questions project assumptions and assesses alternative scenarios
bull employs mechanisms to ensure ethical behaviour and to eliminate corruption while offering sound risk assessment
bull supports organisationsrsquo holistic decision-making in a way that accounts for the impact of climate change on strategy risk and operational and financial performance thus enhancing organisational resilience
b) Financing projects The accountant
bull considers sustainable finance options including climate-change adaptation and resiliency needs
bull assesses financial viability and identifies long-term impact and strategies for risk mitigation
bull acts as a visionary by providing sound life-cycle advice to decision makers and giving them better understanding of the long-term financial difference between maintaining services and enhancing services and of how the latter can create greater cost pressures over time
bull supports clearer and more objective public discourse increases public awareness of risks and supports taxpayersrsquo better understanding of the value of projects
c) Delivering projects and oversight The accountant
bull implements the required monitoring and oversight
44
How accountants can bridge the global infrastructure gap | 6 The role of the accountant in bridging the gap
Accountants offer important competencies to any business team in any sector But in the face of possible misconceptions of the role of accountants what is the way forward onto the professional infrastructure team
bull allocates project risk between parties of a PPP to reduce moral hazard
bull is supported by several frameworks (eg ICAS 2012 KPMG 2013) for professional judgement and ethics that promote the use of logic flexibility consistency reliability relevant evidence unbiased information and alternative framing to avoid precipitous decisions and that promote a balance of experience knowledge and emotion
62 NEXT STEPS TOWARD THE INFRASTRUCTURE TEAM Accountants offer important competencies to any business team in any sector But in the face of possible misconceptions of the role of accountants what is the way forward onto the professional infrastructure team The international roundtable participants made the following recommendations
bull Increase awareness of the accountantrsquos qualifications as a strategic business adviser and as an essential member of the professional infrastructure team alongside the engineers and architects
bull Equip accountants to voice arguments that are compelling both to political leaders and to the general public
bull Offer elected officials the opportunity to gain financial training from accountants so that they understand the true costs and are better equipped to act as financial ambassadors
bull Establish an accountant-informed certification process for project selection
bull Develop and implement clearer governance structures and decision-making processes that involve the finance function
bull Institute whistle-blowing protection legislation for accountants internationally
45
7 Recommendations based on observed good practice
To tackle the growing global infrastructure gap this report offers a variety of observations and international good practices Below is a summary of the recommendations arising from the reportrsquos analysis demonstrating the variety of functions and actions in which accountants can lead to help close the infrastructure gap
71 SELECTING PROJECTS Chapter 3 demonstrated that the lack of standard assessment tools and ineffective political decision-making hampered project selection To help address these challenges some countries establish expert-led bodies to forecast infrastructure need and make recommendations to government as to which projects to build Governments should also balance maintenance and new infrastructure spending by disaggregating expenditure on maintenance and new projects while prioritising the backlog of maintenance to ensure that assets remain in serviceable condition
To improve decision-making further accountants should collect better data on the service potential of existing infrastructure as well as the performance of past projects Together these data will allow accountants to offer new insights to inform the project selection process To reduce the bias towards large projects over maintenance governments should disaggregate expenditure on infrastructure to report both maintenance and new project spend
This report found that there is no standard project selection process for infrastructure projects used by governments around the world and that the underlying need ndash or service gap ndash is not well established or proven Therefore accountants must take the lead in applying selection standards such as the Project Management Body of Knowledge (Project Management Institute 2017) guide and the World Bankrsquos Investment Project Financing (World Bank 2016) policy to structure decision-making better and move beyond short-term thinking and biases
There is also a growing need to build climate change risk into long-term planning and the decision-making on project selection The Montreal Canada case example (see Chapter 3 Box 32) shows how accountants should produce cost-benefit analysis and business cases to embed adaptation and resilience into municipal infrastructure decisions
In summary governments should 1 Establish expert-led bodies to forecast
infrastructure requirements and recommend projects on the basis of need
2 Collect reliable data on the service potential of existing infrastructure and on the performance of past projects
3 Disaggregate expenditure on infrastructure to report both maintenance and new project spend
Accountants should 4 Take the lead in applying standard
selection tools to determine the need for and priority of a project
5 Advise on the distributional impact and regional growth outcomes of selecting particular projects good practice in this area can be found in Japan
6 Embed adaptation and resilience into the project-selection process
46
How accountants can bridge the global infrastructure gap | 7 Recommendations based on observed good practice
Governments should direct supreme audit institutions to monitor the interaction of off balance sheet liabilities and fiscal targets
72 FINANCING INFRASTRUCTURE PROJECTS
assets Officials in New South Wales Australia were able to unlock an additional AUS$33bn to invest in public infrastructure by adopting a total balance sheet perspective (see Chapter 4 Box 42) Accountants should disaggregate public assets in the balance sheet to include commercial social and financial assets This information will be especially effective for identifying underused commercial assets but it is also important to be aware of overall value for money for citizens when selling an asset (eg selling a public asset that was previously free to use but will now attract a user charge imposed by the private sector owner)
Chapter 4 on financing infrastructure highlights three key barriers closing the funding gap accounting for the higher cost of private capital and the need to professionalise the public sector finance function
This report identifies emerging and good practices from around the world that help reduce the funding gap Decision-makers should consider innovative solutions to closing the funding gap such as a value capture and civic crowdfunding For example the MTR Corporation in Hong Kong demonstrates that implementing a transport model that captures the positive externalities of new transit can make some public infrastructure self-funding (see Box 41)
To ensure value for money in infrastructure policy accountants must advise public sector decision-makers on how to make efficient capital allocations A real challenge in this respect is the interaction of fiscal targets and off balance sheet (OBS) liabilities Chapter 4 showed that some countries such as Portugal and the UK have accumulated significant OBS liabilities Therefore countriesrsquo supreme audit institutions should monitor the interaction of OBS liabilities and fiscal targets At the same time finance officials in government should advocate a more holistic approach to maintaining fiscal discipline beyond a few top-line indicators such as debt to GDP or public sector net borrowing
To improve the efficient allocation of public funds long-term infrastructure plans should be aligned with the annual budget process that sets out capital and operating budgets Effective capital budgeting can improve public finances such that departments or ministries do not need to rely on flexibility of unitary charges to meet infrastructure needs
Many national accounts operating on a cash basis treat investment in public infrastructure as a cost instead of recognising a new asset on the public sectorrsquos balance sheet Governments should adopt full accrual accounting and maintain a public sector balance sheet Public sector accountants should also conduct a balance sheet review to maximise the value of public sector
New Zealand has taken the lead in public financial management practices not just through the adoption of accrual accounting but because their public sector accountants produce an intertemporal balance sheet (see Chapter 4 Table 41) (Government of New Zealand 2018) Accountants producing this analysis provide decisions-makers with a better long-term view of their policy decisions and can help improve the sustainability of public finances
In summary governments should 7 Consider innovative solutions for
closing the funding gap such as a value capture civic crowdfunding and other revenue funding schemes
8 Direct supreme audit institutions to monitor the interaction of off balance sheet liabilities and fiscal targets in order to improve the efficient allocation of public sector funds
9 Align long-term infrastructure plans with the annual budget process in order to minimise the use of higher-cost private finance to achieve capital budget flexibility
10 Adopt full accrual accounting and maintain a public sector balance sheet to support decision-making on infrastructure policy
Accountants should 11 Advocate a more holistic approach to
maintaining fiscal discipline to avoid poor financial decisions driven by lsquofiscal illusionsrsquo
12 Conduct a balance sheet review to maximise the value of public sector assets
47
How accountants can bridge the global infrastructure gap | 7 Recommendations based on observed good practice
Professional bodies can also contribute to the improvements in public sector expertise by facilitating knowledge transfer between the public and private sector through thought-leadership events and roundtable discussions
13 Produce an intertemporal balance sheet to improve long-term decision-making and support the sustainability of public finances as is done for example in New Zealand
14 Produce disaggregated assets in the balance sheet to include commercial social and financial assets ndash in order to improve the return on public assets
73 DELIVERING INFRASTRUCTURE PROJECTS AND THE PUBLIC-PRIVATE RELATIONSHIP Chapter 5 highlights three key barriers to implementing infrastructure projects poor monitoring and oversight of projects by government confusion as to where each side provides value in a PPP and lack of commercial acumen in the public sector
To address these barriers and successfully deliver infrastructure projects governments need to look to accountants to implement the necessary monitoring and oversight of their PPP relationships There is also a clear need for effective mechanisms for reducing corruption which was cited as a key action in the member survey The implementation of effective whistle-blowing legislation and the professionalisation of the public sector finance function will allow public servants to challenge unethical behaviour that can derail infrastructure projects
Chapter 6 demonstrated that moral hazard can limit the probability that infrastructure PPPs will be completed on time on budget and to an acceptable level of quality The allocation of risk between the partners in a PPP can play a central role in reducing this moral hazard by putting the right incentives in place for the contractor Therefore professional teams delivering infrastructure should rely on an accountantrsquos expertise of risk management to minimise moral hazard by allocating risks fairly between the parties
Public sector negotiators should reflect on the assumptions identified in the member survey and consider that private finance professionals were less likely than their public sector counterparts to view the public sector as a stable partner or as a sector that provided access to longshyterm projects To mitigate this mismatch governments should consider introducing guarantee schemes for nationally
significant infrastructure projects in order to encourage additional private sector involvement in the provision of infrastructure
As a result of the varied commercial acumen in the public sector governments should consider establishing centres of excellence to coordinate public sector expertise in contract management so that any organisation within the public sector can draw on that specialist skill when negotiating a PPP contract Professional bodies can also contribute to the improvements in public sector expertise by facilitating knowledge transfer between the public and private sector through thought-leadership events and roundtable discussions
In summary governments should 15 Enact effective whistle-blowing
legislation and professionalise the public sector finance function to allow public servants to challenge unethical behaviour that can derail infrastructure projects
16 Establish centres of excellence that coordinate public sector expertise in contract management which allows any organisation within the public sector to draw on the specialist skill when negotiating a PPP contract
17 Consider introducing guarantee schemes for nationally significant infrastructure projects in order to encourage additional private sector involvement in infrastructure projects This will help address the assumptions identified in themember survey which showed that private finance professionals were less likely to view the public sector as a stable partner
Accountants should 18 Implement proper monitoring and
oversight for all projects
19 Advocate embedding themselves in the professional teams delivering infrastructure by highlighting their expertise of risk management
Professional bodies should 20 Act as facilitators of knowledge
transfer between the public and private sector through thought-leadership events and roundtables
48
49
Conclusion
The global infrastructure investment gap is set to grow to US$14 trillion by 2040 and this figure sets the benchmark for meeting the worldrsquos infrastructure needs
In reality however the challenge in fulfilling a countryrsquos infrastructure need is not achieving a notional investment figure but rather establishing a government vision for closing a recognised service gap by either maintaining existing infrastructure assets and or by building new projects
Currently governments lack adequate resources and the capability to make systematic infrastructure decisions because they are not able to harness the benefits of the investment and mitigate the significant risks associated with infrastructure project execution Bringing the accountant to the centre of the decision-making process for infrastructure projects can mitigate these pitfalls The particular skills and perspective of the finance professional can mean the difference between success and failure through improvements in project selection securing financing delivery and oversight of the projects
As the next generation of infrastructure projects are planned financed built and operated the accountant must be brought to the centre of the decision-making process The accountant must be employed across the entire life cycle of future infrastructure projects as a critical member of the professional team if the world is to address the global infrastructure gap
Appendix A Detailed methodology for establishing the infrastructure investment gap
This appendix examines the key features of the G20 Global Infrastructure Outlook methodology (GHI and Oxford Economics 2018) in order to summarise how the global regional and national estimates of the infrastructure gap used in Chapter 1 of this report were determined For a complete understanding the of the original work the Global Infrastructure Outlook report has a comprehensive treatment of the analytical process
A1 DEFINITION OF INFRASTRUCTURE The Global Infrastructure Outlook report defines infrastructure investment as lsquoGross Fixed Capital Formationrsquo (GFCF) by the public and private sectors on fixed immovable assets that support long- term economic growthrsquo (GHI and Oxford Economics 2018) GFCF is a wider definition of investment than just that for infrastructure and so the calculations included for the purposes of this report exclude land and any moveable assets such as IT equipment The definition does however include both the development of new assets and spending on the replacement or maintenance of existing assets
A2 CURRENT INVESTMENT TRENDS Current investment was calculated for a total of 50 countries using data from multinational data sources such as the OECD or Eurostat where possible If the required data was not available from these sources then national statistics were used to create a comparable estimate Failing that data was imputed using econometric techniques The Global Infrastructure Outlook report was completed during 2016 and includes the most up-to-date datasets collected providing values to 2015 so the forecast years begin at 2016 and continue to 2040 Before 2016 no infrastructure gap was estimated so the charts in Chapter 1 and Appendix B reflect current trends only to 2016
For each country and sector the stock of infrastructure per head was calculated and a set of explanatory factors were determined for each sector eg population density structure of the economy These explanatory variables were projected forwards on the basis of national economic and demographic forecasts to estimate infrastructure investment under current trends for each country
A3 INVESTMENT NEEDS The extent to which each country dedicates resources to infrastructure investment was adjusted for the quality of infrastructure using indicators from the World Economic Forum Global Competitiveness Report (Schwab 2018)
The lsquoquality-adjustedrsquo performance measures were then compared across countries using the performance of countries at the 75th percentile among those of similar income levels as the benchmark The investment-need scenario indicated the extent of infrastructure investment by sector and country which would be required to meet this benchmark level Income groups were based on three World Bank definitions low- and lower-middle income upper-middle income and high income For countries that were already positioned above the 75th percentile (ie the target) the objective in the years ahead is to sustain relatively high levels of investment and maintain their strong performance As a result the minimum value for the investment gap is 0 ndash where those countries in the upper quartile must maintain their performance and their peersrsquo target is to attempt to catch up
50
The following account offers a regional breakdown and description of the global infrastructure investment gap covering Africa the Americas Asia Europe and Oceania
B1 AFRICAIn 2018 an estimated US$1328bn was spent on infrastructure in Africa Meanwhile US$1777bn of investment is estimated to be required in the region putting the infrastructure investment gap at US$455bn Cumulatively between 2018 and 2040 the infrastructure investment gap is expected to stand at US$159 trillion with the amount of infrastructure investment needed expected to be 39 higher than under current trends
51
Appendix BRegional breakdown of the global investment gap and additional service gap analysis
350
300
250
200
150
100
50
0
Investment need Current trends
2007
2008
2009
2010
2011
2012
2013
2014
2015
2016
2017
2018
2019
2020
2021
2022
2023
2024
2025
2026
2027
2028
2029
2030
2031
2032
2033
2034
2035
2036
2037
2038
2039
2040
FIGURE B1 Investment need and current trends in Africa 2015 US$ billions
Source GHI and Oxford Economics 2018
TABLE B1 Projected infrastructure investment and gaps among African countries 2018ndash40 2015 prices
COUNTRY
Angola
Benin
INFRASTRUCTURE INVESTMENT USD BILLIONS
$2514
$199
INFRASTRUCTURE INVESTMENT GAP USD BILLIONS
$920
$134
DIFFERENCE BETWEEN INVESTMENT NEED AND INVESTMENT FORECAST
37
67
Cote dIvoire $614 $129 21
Egypt
Ethiopia
Ghana
$4186
$4215
$685
$2182
$1467
$421
52
35
61
Guinea $167 $140 84
Kenya
Morocco
$1742
$1967
$371
$348
21
18
Nigeria
Rwanda
$6168
$295
$2103
$96
34
33
Senegal
South Africa
$578
$2696
$181
$1442
31
53
Tanzania $1943 $1095 56
Tunisia $502 $206 41
Source GHI and Oxford Economics 2018
52
How accountants can bridge the global infrastructure gap | Appendix B
B2 AMERICASIn 2018 it was anticipated that an estimated US$4771bn would be spent oninfrastructure in the Americas In the sameyear investment need was forecast to be 38 higher at US$6570bn and over the full 2018 to 2040 period the infrastructure investment gap is expected to grow to US$6126 trillion This implies that infrastructure need will be 48 higher than actual investment over the period given the current trend in the Americas
12
1
08
06
04
02
0
Investment need Current trends
2007
2008
2009
2010
2011
2012
2013
2014
2015
2016
2017
2018
2019
2020
2021
2022
2023
2024
2025
2026
2027
2028
2029
2030
2031
2032
2033
2034
2035
2036
2037
2038
2039
2040
FIGURE B2 Investment need and current trends in the America 2015 US$ trillions 2018ndash40
Source GHI and Oxford Economics 2018
TABLE B2 Projected infrastructure investment and gaps among nations in the Americas 2018ndash40 2015 prices
COUNTRY
Argentina
Brazil
INFRASTRUCTURE INVESTMENT USD BILLIONS
$4220
$14207
INFRASTRUCTURE INVESTMENT GAP USD BILLIONS
$3392
$11266
DIFFERENCE BETWEEN INVESTMENT NEED AND INVESTMENT FORECAST
80
79
Canada $11243 $194 2
Chile $1978 $499 25
Colombia $2231 $949 43
Ecuador $743 $523 70
Mexico $4874 $5153 106
Paraguay
Peru
$546
$3072
$165
$675
30
22
US $79637 $36089 45
Uruguay $458 $91 20
Source GHI and Oxford Economics 2018
53
How accountants can bridge the global infrastructure gap | Appendix B
B3 ASIAAmong all nations the top four countries by investment need (China India Japan and the US) account for over half of global need three of these countries are found in Asia Despite this the infrastructure gap is lower in percentage terms across Asia than the other regions and across the 2018 to 2040 period Asian countries would need to increase spending by around 10 to meet their projected investment need The sheer size of the continent means that while relatively small as a proportion of current spending this level of underinvestment creates an infrastructure investment gap of US$43 trillion over the same period
30
25
20
15
10
05
0
Investment need Current trends
2007
2008
2009
2010
2011
2012
2013
2014
2015
2016
2017
2018
2019
2020
2021
2022
2023
2024
2025
2026
2027
2028
2029
2030
2031
2032
2033
2034
2035
2036
2037
2038
2039
2040
FIGURE B3 Investment need and current trends in Asia 2015 US$ trillions 2018ndash40
Source GHI and Oxford Economics 2018
TABLE B3 Projected infrastructure investment and gaps among Asian countries 2018ndash40 2015 prices
COUNTRY
Azerbaijan
Bangladesh
Cambodia
INFRASTRUCTURE INVESTMENT USD BILLIONS
$862
$3931
$560
INFRASTRUCTURE INVESTMENT GAP USD BILLIONS
$76
$1821
$266
DIFFERENCE BETWEEN INVESTMENT NEED AND INVESTMENT FORECAST
9
46
48
China $248858 $18307 7
India $37045 $4995 13
Indonesia $15445 $667 4
Kazakhstan $1955 $792 41
Japan
Jordan
$34810
$591
$868
$168
2
29
Malaysia
Myanmar
Pakistan
$3588
$1050
$3351
$725
$1064
$1179
20
101
35
Philippines
Saudi Arabia
$4031
$4654
$653
$1089
16
23
Singapore
South Korea
$878
$12767
$03
$386
0
3
Thailand $3677 $950 26
Turkey
Vietnam
$5328
$4741
$3841
$968
72
20
Source GHI and Oxford Economics 2018
08
07
06
05
04
03
02
01
0
Investment need Current trends
2007
2008
2009
2010
2011
2012
2013
2014
2015
2016
2017
2018
2019
2020
2021
2022
2023
2024
2025
2026
2027
2028
2029
2030
2031
2032
2033
2034
2035
2036
2037
2038
2039
2040
54
How accountants can bridge the global infrastructure gap | Appendix B
B4 EUROPETotal spending on infrastructure in Europe was forecast to be US$457bn in 2018 in contrast to a projected requirement of US$512bn This investment gap of 11 is projected to grow to US$189 trillion or 16 of the total infrastructure investment needed over the period 2018ndash40
FIGURE B4 Investment need and current trends in Europe 2015 US$ trillions 2018ndash40
Source GHI and Oxford Economics 2018
TABLE B4 Projected infrastructure investment and gaps among European countries 2018ndash40 2015 prices
COUNTRY
Croatia
INFRASTRUCTURE INVESTMENT USD BILLIONS
$591
INFRASTRUCTURE INVESTMENT GAP USD BILLIONS
$101
DIFFERENCE BETWEEN INVESTMENT NEED AND INVESTMENT FORECAST
17
France $16823 $96 1
Germany
Italy
Poland
$13544
$11449
$5143
$07
$3530
$865
0
31
17
Romania $2103 $104 5
Russia $9887 $6892 70
Spain
UK
$9977
$15496
$538
$1403
5
9
Source GHI and Oxford Economics 2018
55
How accountants can bridge the global infrastructure gap | Appendix B
B5 OCEANIADespite the large area covered by the Oceania continental region its relatively small population means the total infrastructure investment need is less thanfor the other regions A further US$18 trillion total spending is likely to be required between 2018 and 2040 although on current trends a shortfall of US$171bn is forecast to emerge over the same period This would represent an infrastructure gap of 10
120
100
80
60
40
20
0
Investment need Current trends
2007
2008
2009
2010
2011
2012
2013
2014
2015
2016
2017
2018
2019
2020
2021
2022
2023
2024
2025
2026
2027
2028
2029
2030
2031
2032
2033
2034
2035
2036
2037
2038
2039
2040
FIGURE B5 Investment need and current trends in Oceania 2015 US$ billions 2018ndash40
Source GHI and Oxford Economics 2018
TABLE B5 Projected infrastructure investment and gaps among countries in Oceania 2018ndash40 2015 prices
COUNTRY INFRASTRUCTURE INVESTMENT USD BILLIONS
INFRASTRUCTURE INVESTMENT GAP USD BILLIONS
DIFFERENCE BETWEEN INVESTMENT NEED AND INVESTMENT FORECAST
Australia $14462 $1499 10
New Zealand $1522 $166 11
Source GHI and Oxford Economics 2018
56
How accountants can bridge the global infrastructure gap | Appendix B
B6 ADDITIONAL INFRASTRUCTURE SERVICE GAP FIGURES BY WORLD REGIONThe following charts compare the views of finance professionals on the remaining four sub-types of infrastructure not included in the main report water and sanitation other transport (eg ports and airports) railways and core public infrastructure (eg hospitals and schools)
Source The Global Infrastructure Gap survey specialist respondents only n 1966
FIGURE B6 Infrastructure quality ndash water and sanitation
North America
100
80
60
40
20
0
n Dont know n Very good n Good n Neutral n Poor n Very poor
Middle East Asia Pacific Central and Eastern Europe
South Asia Western Europe Africa Caribbean Total
Source The Global Infrastructure Gap survey specialist respondents only n 1966
FIGURE B7 Infrastructure quality ndash other transport
North America
100
80
60
40
20
0
n Dont know n Very good n Good n Neutral n Poor n Very poor
Middle East Asia Pacific Central and Eastern Europe
South Asia Western Europe Africa Caribbean Total
57
How accountants can bridge the global infrastructure gap | Appendix B
FIGURE B8 Infrastructure quality ndash railways
FIGURE B9 Infrastructure quality ndash core public service infrastructure
Source The Global Infrastructure Gap survey specialist respondents only n 1966
North America
100
80
60
40
20
0
n Dont know n Very good n Good n Neutral n Poor n Very poor
Middle East Asia Pacific Central and Eastern Europe
South Asia Western Europe Africa Caribbean Total
Source The Global Infrastructure Gap survey specialist respondents only n 1966
North America
100
80
60
40
20
0
n Dont know n Very good n Good n Neutral n Poor n Very poor
Middle East Asia Pacific Central and Eastern Europe
South Asia Western Europe Africa Caribbean Total
Appendix C The Global Infrastructure Gap Survey and Roundtable Discussion Guide
MEMBER SURVEY
Q1 What is your current employment status Full-time or part-time an accounting or finance role Full-time or part-time work in a non-accounting role Not currently in employment Self-employed Retired
Response treated as lsquogeneralistrsquo
Q2 [If employed]In which sector do you work Please tick the one box that best fits your sector Big Four accounting firm Corporate sector - small medium sized Corporate sector ndash large Financial services - small medium sized Financial services ndash large Mid-tier accounting firm Not-for-profit Other international accounting firm Public sector Small or medium-sized practice (SMP) Other (please specify)
Q3 [If employed]Does your work involve any of the following
Infrastructure policy Procurement Capital budgeting Project management or Operations management
Yes (respondent categorised as a lsquospecialistrsquo) No (respondent categorised as a lsquogeneralistrsquo)
Q4 How would you describe the quality of each type of infrastructure in the country where you live Power and energy Water and sanitation Roads and highways Railways Other transport (eg air and sea)
Information and communication technology (eg internet access and mobile service)
Core public service infrastructure (eg hospitals schools emergency services)
Scale 1 ndash Very poor 2 ndash Poor
4 ndash Good 5 ndash Very good Donrsquot know
Q5 What are the biggest barriers in meeting the infrastructure needs in your country Lack of finance andor funding Lack of political leadership Skills and talent shortage Planning and regulatory barriers Corruption Lack of competition Other please specify None
Q6a [To generalists]Over the next 5 years do you feel the infrastructure in your country will Significantly deteriorate Deteriorate Remain the same Improve Significantly improve Donrsquot know
Q6b [To specialists]Over the next 5 years do you feel that each of these types of infrastructure in your country will Power and energy Water and sanitation Roads and highways Railways Other transport (eg air and sea)
Information and communication technology (eg internet access and mobile service)
Core public service infrastructure (eg hospitals schools emergency services)
Scale Significantly deteriorate Deteriorate Remain the same Improve Significantly improve Donrsquot know
Q7 Do you feel the government selects projects that provide the most value to the taxpayer Never Infrequently Sometimes Frequently Always Dont know
58
3
How accountants can bridge the global infrastructure gap | Appendix C
Q8 Which of the following do you feel the government in your country should prioritise to make the best decisions when selecting infrastructure projects Please select up to five which you feel are the most important and rank them by order of importance Please drag and drop your selections from the left box to the right box and order with most important at the top and least at the bottom
Adhering to global accounting standards
Removing political decision-making making the process technocratic (ie decisions by experts)
Putting in place mechanisms to reduce corruption
Moving government accounts from cash to accrual accounting
Bringing OOBs (Obligations Off Balance-Sheet) onto government balance sheets
Quantifying the total life-cycle costs of potential projects
Spending more resource to evaluate projects after completion
Applying standard assessment tools to evaluate projects during selection
Transferring project selection powers to more local levels of government (ie devolution)
Other please specify
Q8a [To CPA Canada respondents only]How important is it that infrastructure planning include the following sustainability considerations Efficient use of energy including where appropriate renewable sources of energy
Adapting to the impacts of a changing climate such as severe weather events
Minimizing environmental impacts on the surrounding community by for example locating near accessible public transit
Reducing or eliminating the production of waste hazardous by-products or other environmental externalities
Assessing the potential of and taking every reasonable step to reduce or eliminate the likelihood of an environmental accident (such as a pipeline spill for example)
Scale 1 - Not important at all 2- Not very important
4 - Quite important 5- Very important 6 - Donrsquot know
Q9a [To generalists]How should infrastructure be financed in your country Entirely public finance Mostly public finance Even mix of public and private finance Mostly private finance Entirely private finance Dont know no opinion
Q9b [To specialists]How should infrastructure be financed in your country (eg a sovereign wealth fund provides the money upfront to build a road) Power and energy Water and sanitation Roads and highways Railways Other transport (eg air and sea)
Information and communication technology (eg internet access and mobile service)
Core public service infrastructure (eg hospitals schools emergency services)
Scale Entirely public finance Mostly public finance Even mix of public and private finance Mostly private finance Entirely private finance Dont know no opinion
Q10 What are your views on the role of foreign direct investment in building and maintaining infrastructure in your country Very concerned Some concern Neutral Positive Very positive Dont know
Q11 What are the key challenges that the government faces in securing private finance Select all that apply Too few viable projects for private investment Regulatory barriers Perceived political instability in my country Underdeveloped financial markets in my country Insufficient skills in government to negotiate with the private sector Negative perception of private finance for public infrastructure Lack of attractiveness of infrastructure investment Dont know Other please specify
Q12a [Asked of those working in Public sector]Where do you feel the private sector particularly adds value in delivering infrastructure projects in your country Select all that apply Knowledge of best practice and expertise
Applying innovative practices and fresh thinking
Delivering projects on time
Keeping projects to budget
Access to private capital
Transferring the risks of delivering infrastructure projects from the public sector to the private sector
None of these
Donrsquot know
59
3
How accountants can bridge the global infrastructure gap | Appendix C
Q12b [Asked of those working in Private sector]Where do you feel the public sector particularly adds value in delivering infrastructure projects in your country Select all that apply Access to projects that provide stable low risk returns Knowledge of how the public sector works Long-term and stable partnership Knowledge of best practice and expertise Applying innovative practices and fresh thinking None of these Donrsquot know
Q13a [Asked of those working in Public sector]Where do you feel the private sector receives value from the public sector in delivering infrastructure projects in your country Select all that apply Access to projects that provide stable low risk returns Knowledge of how the public sector works Long-term and stable partnership Knowledge of best practice and expertise Applying innovative practices and fresh thinking None of these Donrsquot know
Q13b [Asked of those working in Private sector]Where do you feel the public sector receives value from the private sector in delivering infrastructure projects in your country Select all that apply Knowledge of best practice and expertise
Applying innovative practices and fresh thinking
Delivering projects on time
Keeping projects to budget
Access to private capital
Transferring the risks of delivering infrastructure projects from the publicsector to the private sector
None of these
Donrsquot know
Q14 Where are you primarily based [Dropdown list]
Q15 What best describes your gender identity Female Male Prefer not to say Prefer to self-describe
ROUNDTABLE DISCUSSION 1) Understanding the infrastructure gap
a) Whatrsquos the current quality of infrastructure in your country
i Why is it like this
b) How is your business or organization affected by the current quality of infrastructure in your country Please provide examples
2) How accountants can make a difference c) In your experience where do you see accountants making the
greatest difference in delivering infrastructure in your country Please give examples where possible
d) Do you feel that your country has particular good practices in meeting infrastructure need
3) Selecting projects e) How often do you t hink governments select the right projects in
your country
f) What should governments consider when making decisions about infrastructure
4) Financing projects g) Which types of infrastructure are appropriate for private finance
or operation [ie energy water roads railways other transport information and communication technology core public service infrastructure]
i Which ones are more suited to private finance
ii Private operation
h) What do you think about foreign direct investment (FDI) building new infrastructure in your country
5) Interface of public and private i) What skills do governments need to effectively negotiate
contracts with the private sector
i Are any of these skills absent
j) When t he public and private sectors partner to complete and operate infrastructure (for example through a Public-Private Partnership)
i What does the private sector add to the partnership
ii What does the public sector add to the partnership
6) Final k) Over the next 5 years do you think the infrastructure in your
country will improve stay the same or deteriorate
i Why is t hat the case What are the key challenges in meeting the infrastructure needs in your country over the next 5 years
60
References
ACCA (2016) Smarter Cities Simpler Cities Accounting for the City of the Future Spotlight on India lthttpswwwaccaglobalcomcontentdamACCA_GlobalTechnicalFuturepi-smarter-cities-simpler-citiespdf
gt
accessed 4 February 2019
ACCA (2017) Professional Accountants ndash the Future Ethics and Trust in a Digital Age lthttpswwwaccaglobalcomcontentdamACCA_Global TechnicalFuturepi-ethics-trust-digital-agepdfgt accessed 5 February 2019
Atkins G Davies N and Kidney Bishop T (2017) Public versus Private How to Pick the Best Infrastructure Finance Option lthttpswww instituteforgovernmentorguksitesdefaultfilespublicationsInstitute_for_ Government_Infrastructure_Finance_Option_Public_Private_ November_2017_Web_Finalpdfgt accessed 5 February 2019
British Broadcasting Corporation (2015) Spains Ciudad Real airport sold at auction for euro10000 [online article] lthttpswwwbbccouknewsworldshyeurope-33578949gt accessed 6 February
Catapult Future Cities (2017) Civic Crowdfunding A Guidebook for Local Authorities lthttpsfuturecitiescatapultorgukwp-content uploads201703Civic-guidebook-pdfgt accessed 5 February 2019
Central Intelligence Agency (2019) The World Factbook lthttpswwwciagovlibrarypublicationsthe-world-factbook
gt access 7 February 2019
Chartered Institute of Purchasing and Supply (2013) Written evidence submitted by CIPS to the Public Administration Select Committee lthttps publicationsparliamentukpacm201314cmselectcmpubadm123123vw12 htmgt accessed 5 February 2019
Chartered Professional Accountants of Canada (2016) Adaptation Case Study 6 City of Montreal lthttpswwwcpacanadacaenbusiness-and-accountingshyresourcesother-general-business-topicssustainabilitypublications montreal-adapting-to-climate-changegt accessed 5 February 2019
Detter D and Folster S (2017) The Public Wealth of Cities How to Unlock Hidden Assets to Boost Growth and Prosperity (Brookings Institution Press)
Eriksson PE and Lind H (2015) Moral Hazard and Construction Procurement A Conceptual Framework lthttpswwwdiva-portalorgsmashgetdiva2783674FULLTEXT01pdf
gt accessed 5 February 2019
European Commission (2017) Communication from the Commission The Fiscal Compact ndash Taking Stock lthttpseceuropaeuinfopublications fiscal-compact-taking-stock_engt accessed 5 February 2019
Eurostat (2018) lsquoLiabilities Related to PPPs Recorded Off-Balance Sheet of Governmentrsquo downloadable from lthttpsdataeuropaeueuodpendata datasetZxMF0OGutCyj7pgQJdtaiwgt accessed 5 February 2019
Fages R Beardsley B Bromstrup I Donnadieu H Maceacute B Pardasani N Schmitz L Sheridan BTaglioni G and Xu Q (2018) Global Asset Management 2018 The Digital Metamorphosis lthttpswwwbcgcom en-gbpublications2018global-asset-management-2018-digitalshymetamorphosisaspxgt accessed 5 February 2019
Fay M Andres LA Fox C Narloch U Straub S and Slawson M (2017) Rethinking Infrastructure in Latin America and the Caribbean 2017 lthttps openknowledgeworldbankorgbitstreamhandle1098626390114110shyREVISED-PUBLIC-RethinkingInfrastructureFullpdfgt accessed 5 February 2019
Flyvbjerg B (2018) Oxford Handbook of Megaproject Management (Oxford Oxford University Press)
GHI (Global infrastructure Hub) and Oxford Economics (2018) Global Infrastructure Outlook Downloadable from lthttpsoutlookgihuborggt accessed 4 February 2019
Government of New Zealand (2018) lsquoHe Puna Hao Patiki 2018 Investment Statementrsquo lthttpstreasurygovtnzpublicationsinvestment-statementhe-puna-hao-patiki-2018-investment-statement-html
gt accessed 5
February 2019
ICAS (Institute of Chartered Accountants of Scotland) (2012) A Professional Judgement for Financial Reporting lthttpswwwicascomtechnicalshyresourcesa-professional-judgement-framework-for-financial-reportinggt accessed 6 February 2019
IFAC and CIPFA (2018) International Public Sector Financial Accountability Index lthttpswwwifacorgsystemfilesuploadsIFACIFAC-CIPFA-PublicshySector-Index-2018-Statuspdfgt accessed 5 February 2019
IJ Global (2018) H1 Infrastructure and Project Finance League Table Report lthttpsijglobalcomuploadsH120201820League20Tables20Report pdfgt accessed 5 February 2019
IMF (International Monetary Fund) (2018) Fiscal Monitor Managing Public Wealth downloadable from lthttpswwwimforgenPublicationsFM Issues20181004fiscal-monitor-october-2018gt accessed 5 February
Institute for Government (2018) lsquoFunding Infrastructurersquo [webpage] lthttps wwwinstituteforgovernmentorgukexplainersfunding-infrastructuregt accessed 5 February 2019
International Transport Forum (2017) Strategic Infrastructure Planning International Best Practice lthttpsassetspublishingservicegovuk governmentuploadssystemuploadsattachment_datafile601897Strategic_Infrastructure_FINAL_for_web_v2pdf
gt accessed 4 February
KPMG (2013) Elevating Professional Judgment in Auditing and Accounting The KPMG Professional Judgment Framework lthttpwwwdrlilliecom a544kpmgjdgmtKPMG_ProfJudgment_Monographpdfgt accessed 6 February 2019
Leong L (2016) lsquoThe ldquoRail plus Propertyrdquo Model Hong Kongrsquos Successful Self-financing Formularsquo [website article] lthttpswwwmckinseycom industriescapital-projects-and-infrastructureour-insightsthe-rail-plusshyproperty-modelgt accessed 5 February 2019
Mann H (2018) lsquoThe High Cost of lsquoDe-Riskingrsquo Infrastructure Financersquo [website article] lthttpswwwproject-syndicateorgcommentaryworldshybank-ppp-de-risking-by-howard-mann-2018-12gt accessed 5 February 2019
Marcelo D Mandri-Perrott C House S and Schwartz JZ (2016) An Alternative Approach to Project Selection The Infrastructure Prioritization Framework lthttppubdocsworldbankorgen84463146187466270016-04shy23-Infrastructure-Prioritization-Framework-Final-Versionpdfgt accessed 4 February 2019
MGI (McKinsey Global Institute) (2013) Infrastructure productivity How to save $1 trillion a year lthttpswwwmckinseycomindustriescapital-projectsshyand-infrastructureour-insightsinfrastructure-productivitygt accessed 6 February 2019
MGI (2016) Bridging Global Infrastructure Gaps lthttpswwwmckinsey com~mediaMcKinseyIndustriesCapital20Projects20and20 InfrastructureOur20InsightsBridging20global20infrastructure20gaps Bridging-Global-Infrastructure-Gaps-Full-report-June-2016ashxgt accessed 4 February 2019
Morse A (2018) PFI and PF2 Report by the Comptroller and Auditor General lthttpswwwnaoorgukwp-contentuploads201801PFI-and-PF2pdf
gt accessed 5 February 2019
61
How accountants can bridge the global infrastructure gap | References
MTR Corporation (2017) Annual Report 2017 Ten-Year Statistics lthttps wwwmtrcomhkarchivecorporateeninvestor10yr_stat_enpdfgt accessed 5 February 2019
NHS Scotland (2018) NHS Scotland Assets and Facilities 2017 Annual Report lthttpswwwgovscotpublicationsannual-state-nhsscotland-assetsshyfacilities-report-2017gt accessed 5 February 2019
NIC (National Infrastructure Commission) (2018) National Infrastructure Assessment lthttpswwwnicorgukwp-contentuploadsCCS001_ CCS0618917350-001_NIC-NIA_Accessiblepdfgt accessed 4 February 2019
OrsquoDowling-Keane A (2017) lsquoSadiq Khan Joins Crowd of Thousands with pound400000 in Backing for Londonersrsquo Local Project Ideasrsquo [website article] lthttpsaboutspacehivecomsadiq-khan-joins-crowd-of-thousands-withshy400000-in-backing-for-londoners-local-project-ideasgt accessed 5 February
OECD (Organisation for Economic Cooperation and Development) (2019) Databank tax revenue lthttpsdataoecdorgtaxtax-revenuehtmgt government debt lthttpsdataoecdorgggageneral-government-debt htmgt accessed 7 February 2019
Plimmer G (2018) lsquoDeath Knell Sounded for PFI Contractsrsquo [online article] Financial Times lthttpswwwftcomcontent55eb374e-dba5-11e8-8f50shycbae5495d92bgt accessed 6 February
Project Management Institute (2017) Guide to Project Management Book of Knowledge lthttpswwwpmiorgpmbok-guide-standardsfoundational pmbokgt accessed 4 February 2019
Schwab K (2018) Global Competitiveness Report lthttpwww3weforum orgdocsGCR201805FullReportTheGlobalCompetitivenessReport2018 pdfgt accessed 5 February 2019
Spacehive (2019) lsquoMake Your Local Area Betterrsquo [website] lthttpswww spacehivecomgt accessed 5 February 2019
UK Government (2017) UK Guarantees Scheme Guidance lthttpswwwgov ukguidanceuk-guarantees-schemegt accessed 5 February 2019
World Bank (2018a) Private Participation in Infrastructure Annual Report 2017 lthttpppiworldbankorg~mediaGIAWBPPIDocuments Global-NotesPPI_2017_AnnualReportpdfgt
World Bank (2018b) Procuring Infrastructure Public-Private Partnerships Report downloadable from lthttpspppknowledgelaborg documents5453gt accessed 5 February 2019
World Bank (2019) World Bank Open Data tax revenue lthttpsdata worldbankorgindicatorGCTAXTOTLGDZSgt government debt lthttpsdataworldbankorgindicatorGCDODTOTLGDZSgt accessed 7 February 2019
62
18002683793 wwwcpacanadaca
PI-GLOBAL-INFRASTRUCTURE-GAP
DISCLAIMER This paper was prepared by the Association of Chartered Certified Accountants (ACCA) and Chartered Professional Accountants of Canada (CPA Canada) as non-authoritative guidance
ACCA CPA Canada and the authors do not accept any responsibility or liability that might occur directly or indirectly as a consequence of the use application or reliance of this material
ACCA The Adelphi 111 John Adam Street London WC2N 6AU United Kingdom +44 (0)20 7059 5000 wwwaccaglobalcom
CPA Canada 277 Wellington St West Toronto Ontario Canada M5V 3H2
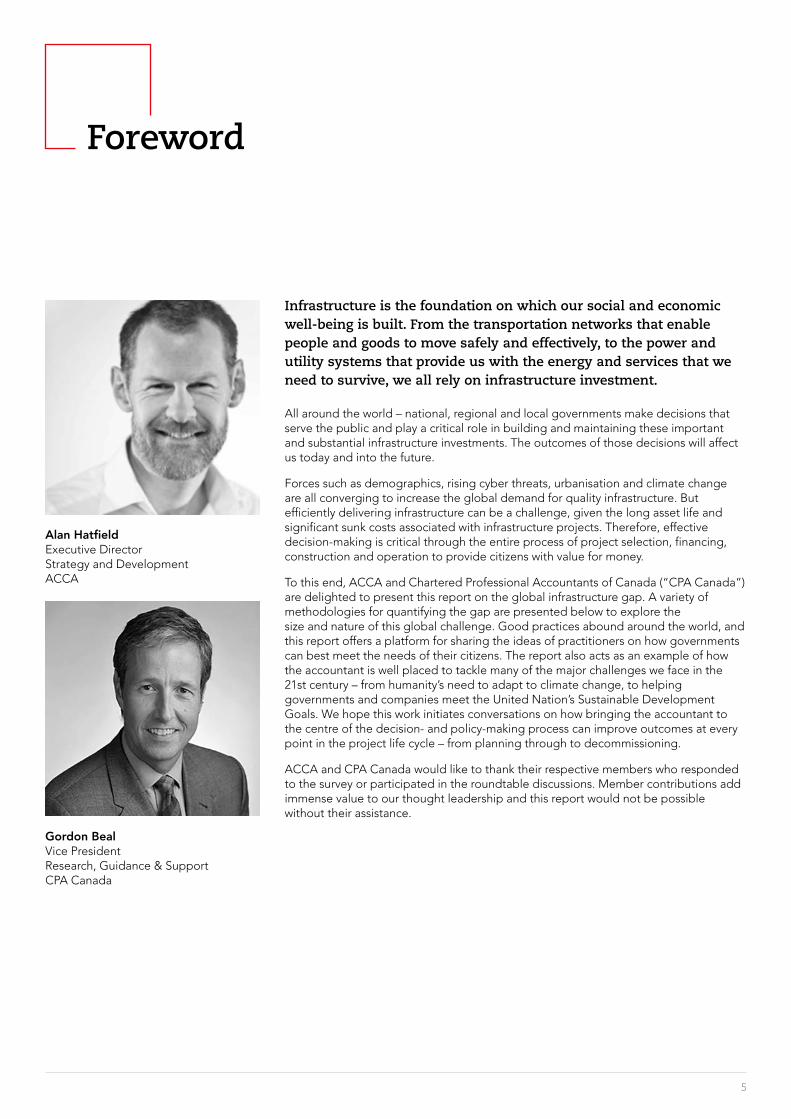
5
Foreword
Infrastructure is the foundation on which our social and economic well-being is built From the transportation networks that enable people and goods to move safely and effectively to the power and utility systems that provide us with the energy and services that we need to survive we all rely on infrastructure investment
All around the world ndash national regional and local governments make decisions that serve the public and play a critical role in building and maintaining these important and substantial infrastructure investments The outcomes of those decisions will affect us today and into the future
Forces such as demographics rising cyber threats urbanisation and climate change are all converging to increase the global demand for quality infrastructure But efficiently delivering infrastructure can be a challenge given the long asset life and significant sunk costs associated with infrastructure projects Therefore effective decision-making is critical through the entire process of project selection financing construction and operation to provide citizens with value for money
To this end ACCA and Chartered Professional Accountants of Canada (ldquoCPA Canadardquo) are delighted to present this report on the global infrastructure gap A variety of methodologies for quantifying the gap are presented below to explore the size and nature of this global challenge Good practices abound around the world and this report offers a platform for sharing the ideas of practitioners on how governments can best meet the needs of their citizens The report also acts as an example of how the accountant is well placed to tackle many of the major challenges we face in the 21st century ndash from humanityrsquos need to adapt to climate change to helping governments and companies meet the United Nationrsquos Sustainable Development Goals We hope this work initiates conversations on how bringing the accountant to the centre of the decision- and policy-making process can improve outcomes at every point in the project life cycle ndash from planning through to decommissioning
ACCA and CPA Canada would like to thank their respective members who responded to the survey or participated in the roundtable discussions Member contributions add immense value to our thought leadership and this report would not be possible without their assistance
Alan HatfieldExecutive DirectorStrategy and DevelopmentACCA
Gordon BealVice PresidentResearch Guidance amp SupportCPA Canada
Executive summary
DEFINING THE CHALLENGE QUANTIFYING THE GLOBAL INFRASTRUCTURE GAPThe term lsquoglobal infrastructure gaprsquo refers to the difference between the infrastructure investment needed and the resources made available to address that need This report offers two approaches to understanding the global infrastructure gap a notional quantifiable investment gap and a subjective needs-based service gap Together these approaches establish the size and nature of the overall challenge that frames this report
The infrastructure investment gapAnalysis of the G20rsquos Global Infrastructure Outlook shows that the global infrastructure investment gap is set to grow to US$14 trillion by 2040 In 2018 alone the investment gap grew by over US$400bn
Quantifying an infrastructure investment gap across world regions provides an aspirational target for governments looking to improve the provision of infrastructure in their country This methodology highlights global top performers such as Singapore Japan and Canada which exemplify good practices The investment gap approach also reveals that many countries such as Mexico Myanmar and Brazil are facing substantial and growing gaps These countries may benefit from looking at their peers for good practice and novel methods of meeting infrastructure need
6
The infrastructure service gapThe ultimate objective in fulfilling a countryrsquos infrastructure need is not a notional investment figure rather it is closing a recognised service gap Doing this requires that governments develop a vision of what the country seeks to achieve through the development and maintenance of its infrastructure
The ACCA and CPA Canada conducted a global survey of their respective members on the infrastructure gap (ldquothe surveyrsquo) The survey responses showed particular service gaps emerging in certain world regions
across seven types of infrastructure power and energy water and sanitation road and highways other transport (eg air and sea) information and communication technology (ICT) railways and core public service infrastructure (eg hospitals and schools) Finance professionals in Africa and South Asia reported consistently poor levels of infrastructure across all these types with the notable exception of ICT In comparison North American respondents had much higher overall scores but reported a particular dip in their road and highway infrastructure In the Caribbean region respondents to the survey isolated
FIGURE 1 Global infrastructure investment needs and current trends 2015 US$ trillions
50
45
40
35
30
25
20
15
10
05
0
Investment need Current trends
2007
2008
2009
2010
2011
2012
2013
2014
2015
2016
2017
2018
2019
2020
2021
2022
2023
2024
2025
2026
2027
2028
2029
2030
2031
2032
2033
2034
2035
2036
2037
2038
2039
2040
Source GHI and Oxford Economics 2018
How accountants can bridge the global infrastructure gap | Executive summary
7
Just as the barriers to bridging the gap vary by country there is significant variability in the capacity of governments to respond to the infrastructure gap
road and highway infrastructure and core public service infrastructure as key areas requiring intervention to reduce the service gap Respondents from Central and Eastern Europe cited core public service infrastructure and railway infrastructure as areas requiring further investment
OVERALL BARRIERS TO MEETING INFRASTRUCTURE NEEDRespondents to the member survey were also asked what they saw as the biggest barriers to meeting the infrastructure needs of their countries A few top global barriers were
1 a lack of political leadership (cited by 52)
2 a lack of finance or funding (49)
3 planning and regulatory barriers (40)
These results show that the barriers to closing the gap extend beyond having the financial resource to meet need with lsquoa lack of political leadershiprsquo ranking as the number one barrier This suggests that failing to articulate a vision of future infrastructure provision can be a significant barrier in some countries These top three barriers informed the framework for the chapters that follow on the role of the accountant demonstrating that finance professionals have an essential role in addressing all three of the top barriers to closing the gap A lack of political leadership affects a countryrsquos ability to select projects (Chapter 3) the lack of finance and funding clearly impedes effective financing of projects (Chapter 4) and planning and regulatory barriers speak to the interface between the public and private sector in the delivery of infrastructure (Chapter 5)
Capacity for governments to respond to the gapJust as the barriers to bridging the gap vary by country there is significant variability in the capacity of governments to respond to the infrastructure gap Analysis of data from the World Bank the Organisation for Economic Cooperation and Development (OECD) International Monetary Fund (IMF) and Central Intelligence Agency (CIA) World Factbook allowed for the generation of a typology based on the size of the challenge and a countryrsquos ability to respond to this challenge
Countries under the group of lsquoLarge gap fiscally restrictedrsquo such as Pakistan and Nigeria will struggle to meet their growing demands for public infrastructure Others such as China in the top-right corner of the figure are well placed to meet their infrastructure needs compared with their income-group peers
The role of the accountant in closing the gapThe successful provision of public infrastructure requires governments to have the right professional team in place And yet a clear message resounded from the international roundtable discussions a key player is often missing from the infrastructure project table ndash the accountant
The accountant must be brought to the centre of the decision-making process on the selection financing building and operation of infrastructure ndash where the particular skills and perspective of the finance professional can mean the difference between success and failure
TABLE 1 A typology of infrastructure gap responsiveness
LIMITED FISCAL ROOM GREATER FISCAL ROOM
Low infrastructure gap lsquoSmall gap Fiscally restrictedrsquo(eg Canada)
lsquoSmall gap Fiscally flexiblersquo(eg China)
High infrastructure gap lsquoLarge gap Fiscally restrictedrsquo(eg Pakistan Nigeria)
lsquoLarge gap Fiscally flexiblersquo (eg Malaysia)
How accountants can bridge the global infrastructure gap | Executive summary
8
Establishing and comparing the need for infrastructure are key considerations in building the case for planning and selecting a particular project
Planning and selecting infrastructure projectsChapter 3 further explains the two key impediments identified in the survey the lack of a standard for project selection and the misalignment of the infrastructure life cycle and the political cycle Establishing and comparing the need for infrastructure are key considerations in building the case for planning and selecting a particular project This report sets out methods of establishing lsquoneedrsquo in order to inform the planning and project selection process The survey also identifies the misalignment between a political cycle (often four to six years) and the total life cycle of an infrastructure asset (often over 20 years) This mismatch can generate two biases a bias towards short-term decision-making and a bias for creating megaprojects over maintenance
In response to these barriers this report offers the following recommendations based on observed good practice
Governments should1 Establish expert-led bodies to
forecast infrastructure requirements and recommend projects on the basis of need
2 Collect reliable data on the service potential of existing infrastructure and on the performance of past projects
3 Disaggregate expenditure on infrastructure to report both maintenance and new project spend
Accountants should4 Take the lead in applying standard
selection tools to determine the need for and priority of a project
5 Advise on the distributional impact and regional growth outcomes of selecting particular projects good practice in this area can be found in Japan
6 Embed adaptation and resilience into the project-selection process
Financing infrastructure projectsChapter 4 on financing infrastructure highlights three key impediments to closing the infrastructure gap the funding gap accounting for the higher cost of private capital and the need to professionalise the public sector finance function
In response to these barriers the report offers the following recommendations based on observed good practice
Governments should7 Consider innovative solutions for
closing the funding gap such as a value capture civic crowdfunding and other revenue funding schemes
8 Direct supreme audit institutions to monitor the interaction of off balance sheet liabilities and fiscal targets in order to improve the efficient allocation of public sector funds
9 Align long-term infrastructure plans with the annual budget process in order to minimise the use of higher-cost private finance to achieve capital budget flexibility
10 Adopt full accrual accounting and maintain a public sector balance sheet to support decision-making on infrastructure policy
Accountants should11 Advocate a more holistic approach
to maintaining fiscal discipline to avoid poor financial decisions driven by lsquofiscal illusionsrsquo
12 Conduct a balance sheet review to maximise the value of public sector assets
13 Produce an intertemporal balance sheet to improve long-term decision-making and support the sustainability of public finances as is done for example in New Zealand
14 Produce disaggregated assets in the balance sheet to include commercial social and financial assets ndash in order to improve the return on public assets
How accountants can bridge the global infrastructure gap | Executive summary
The roundtable participants identified poor monitoring and oversight by government as key impediments in delivering infrastructure projects
Delivering infrastructure projects The roundtable participants identified poor monitoring and oversight by government as key impediments in delivering infrastructure projects Chapter 5 offers results from the survey demonstrating disagreement about where each party in a PPP agreement provides value Finally the roundtable participants argued that the public sector often lacked the commercial acumen required to manage an infrastructure PPP effectively
In response to these barriers this report offers the following recommendations based on observed good practice
Governments should 15 Enact effective whistle-blowing
legislation and professionalise the public sector finance function to allow public servants to challenge unethical behaviour that can derail infrastructure projects
16 Establish centres of excellence that coordinate public sector expertise in contract management which allows any organisation within the public sector to draw on the specialist skill when negotiating a PPP contract
17 Consider introducing guarantee schemes for nationally significant infrastructure projects in order to encourage additional private sector involvement in infrastructure projects This will help address the assumptions identified in the survey which showed that private finance professionals were less likely to view the public sector as a stable partner
Accountants should 18 Implement proper monitoring and
oversight for all projects
19 Advocate embedding themselves in the professional teams delivering infrastructure by highlighting their expertise of risk management
Professional bodies should 20 Act as facilitators of knowledge
transfer between the public and private sector through thought-leadership events and roundtables
9
10
The global infrastructure gap
1 See Chapter 1 for definitions of the lsquoinfrastructure investment gaprsquo and the lsquoinfrastructure service gaprsquo
Globally some top barriers to meeting infrastructure need were
52 lack of political leadership
49 lack of finance or funding
40 planning and regulatory barriers
Finance professionals reported the largest service gap in Africa the Middle East had the smallest service gap1
The global investment gap will grow to US$14 trillion by 2040
Selecting projects
93 of respondents said governments could improve the infrastructure projection selection process
lsquoRemoving political decision-making and making the process technocraticrsquo was the most cited for improving project selection
Delivering projects and the public-private relationship
62 of public sector respondents arguedthat they offered a lsquolong-term and stable partnershiprsquo for a PPP compared to only
45 of private sector respondents
Financing projectsThe most cited barriers for securing private finance for infrastructure were
lsquoInsufficient skills in governmentrsquo 45 and
lsquonegative perception of private financersquo 43
11
Introduction
Infrastructure is critical for economic and social development across the world Physical infrastructure systems ensure that basic human needs are met people need access to energy to light and heat their homes and safe water for drinking sanitation and cooking Transport infrastructure allows people to travel to work and transport goods to different markets
In these and many other ways infrastructure is vital to social and economic activity and development ndash and its provision is intrinsically tied to achieving the United Nationrsquos Sustainable Development Goals to address global challenges such as poverty inequality climate change and environmental degradation and to achieve a better and more sustainable future for all There is also a unique opportunity for governments to respond to the global infrastructure gap challenge The anaemic economic growth following the 2008 financial crisis and the sustained low-interest rate environment means that the cost of increased investment has rarely been lower for governments and the prize is sustainable economic growth a sustained boost to productivity and improved living standards
But execution matters and there are many examples of infrastructure projects that have gone badly wrong Design failures can cause the death of workers as in the case of the Chirajara bridge collapse in Colombia in 2018 poor demand forecasting and design can result in significant infrastructure investments being underused such as the Ciudad Real Airport in Spain which remains abandoned after a construction cost in excess of 1bn euros (BBC 2015)
In addition the collapse of the Morandi Bridge in Genoa Italy demonstrated that to avoid disaster governments must allocate sufficient resources to the maintenance of existing infrastructure fighting the bias towards focusing resources on new-build projects
Finally cases of natural disaster ndash such as the flooding in Bangkok Thailand in 2011 ndash are becoming increasingly common and future infrastructure projects must be adaptable and resilient to enable countries to meet the threats of climate change
Therefore the successful provision of public infrastructure requires governments to have the right professional team in place to be able to harness the benefits of additional investment while working to mitigate the significant risks associated with infrastructure projects The accountant must be brought to the centre of the decision-making process on the selection financing building and operation of infrastructure where the finance professionalrsquos particular skills and perspective can mean the difference between success and failure
Research methodology
How accountants can bridge the global infrastructure gap Improving outcomes across the entire project life cycle report is the result of a joint research project conducted by ACCA and CPA Canada The research objective of this study was to quantify and explain the nature of the global infrastructure gap and explore how professional accountants can contribute to bridging the gap through improvements in the selection financing and delivery of projects
The report encompasses the collection of economic research country-specific narratives and best practices in building and maintaining infrastructure ndash from project selection to completion and evaluation The results and observations that were arrived at are supported by evidence collected through the following mechanisms
bull quantifying the cumulative global infrastructure investment gap to 2040 through desktop research
bull a global online survey of a random sample of ACCA members and CPA Canada members
bull a desktop literature review of specialist publications to determine leading practices
bull in-person roundtable discussions held with experts from four continents
How these four areas were developed is detailed below
ECONOMIC ANALYSIS A quantitative approach was followed for the review of the G20 Global Infrastructure Hubrsquos Global Infrastructure Outlook report (GHI and Oxford Economics 2018) This report uses economic forecasting to quantify the cumulative global infrastructure gap up to 2040 Chapter 1 lsquoQuantifying the Global Infrastructure Gaprsquo provides some detail on the quantification of the investment gap and articulates the challenge for this report More information on the methodology of the economic analysis can be found in Appendix A
GLOBAL SURVEY AND DEMOGRAPHICS ACCA and CPA Canada jointly undertook a survey of a random sample of each bodyrsquos membership This survey used the perspectives of finance professionals to illuminate the nature of the global infrastructure gap highlight the barriers to closing the gap and clarify the diverging expectations of public- and private-sector actors in the use of publicndash
private partnerships (PPPs) in infrastructure projects A copy of the survey is available in Appendix C
The survey design and administration were consistent across both bodies except for the addition of one question on infrastructure planning and sustainability considerations in the CPA Canada survey Therefore unless otherwise specified all survey results cited in the report present the combined output from the CPA Canada and ACCA waves of the survey The ACCA survey was in the field for two weeks in August 2018 and the CPA Canada survey for two weeks in October 2018
Survey demographics The combined total of survey respondents was 3611 across 1182
countries Geographic splits in the survey data typically present output by world region Every world region had at least 150 responses except for South America which is excluded from any figure showing results by geography Finally the
2 Six respondents gave lsquoOtherrsquo for their country of residence thus it is not possible to identify whether they lived in the 118 countries or elsewhere
12
Overall more than one-in-three respondents (35) worked in the corporate sector while about 20 worked in the public or not-for-profit sectors
joint survey (lsquothe member surveyrsquo) split respondents into two primary categories lsquogeneralistsrsquo and lsquospecialistsrsquo where specialist respondents stated that their work included at least one of the following areas infrastructure policy procurement capital budgeting project or operations management Of the total sample 1966 respondents (54) were categorised as specialists The survey included a number of detailed technical questions which were asked only of specialists Figures throughout the report clearly indicate which subset of respondents (generalists or specialists) answered a particular question
The member survey includes the views of accountants working across all sectors including respondents from accountancy firms the corporate sector and the public sector Overall more than one-in-three respondents (35) worked in the corporate sector while about 20 worked in the public or not-for-profit sectors
LITERATURE REVIEWA detailed review of specialised literature on infrastructure projects globally was conducted This review demonstrated the variety of methodologies used globally in quantifying the infrastructure gap as well as providing a summary of leading practices in infrastructure planning project selection and public financing that help support the effective delivery of innovative and sustainable infrastructure policy
The References section includes the reviewed literature
IN-PERSON ROUNDTABLE DISCUSSIONSFinally roundtable discussions were conducted with ACCA members and CPA Canada members in the UK Canada Sri Lanka Nigeria Trinidad amp Tobago Jamaica and Malaysia and focused on country-specific infrastructure challenges and solutions to show the international variation in infrastructure need as well as highlighting what skills and perspectives accountants employ to help address the global infrastructure gap
The roundtable discussions offered stakeholders an opportunity to share their insights and experiences on the current challenges to closing the global infrastructure gap and their perspectives and experiences in the provision of infrastructure In addition the roundtables offered participants an opportunity to reflect on best practices with their peers
Together the literature review and roundtable discussions have provided evidence of the essential role accountants can play in helping to shrink the global infrastructure gap A copy of the roundtable questions is available in Appendix C
ACCA and CPA Canada would like to thank the Centre for Business and Economics Research (Cebr) an economic consultancy based in the UK for completing the economic analysis quantifying the global infrastructure investment gap
13
How accountants can bridge the global infrastructure gap | Research methodology
FIGURE 2 Sector breakdown of The Global Infrastructure Gap survey
20
18
16
14
12
10
8
6
4
2
0Big Four
accounting firm
Corporate sector ndash small medium sized
Corporate sector ndash
large
Financial services ndash smallmedium sized
Financial services ndash
large
Mid-tier accounting
firm
Not-for-profit Other international
accounting firm
Public sector Small medium sized practice (SMP)
Other
Source The Global Infrastructure Gap survey all respondents n 3611
14
1 Defining the challenge Quantifying the global infrastructure gap
Defining the global infrastructure gap qualitatively is relatively simple the term is generally understood to denote the difference between required infrastructure and existing infrastructure Defining the current global infrastructure gap quantitatively however is more complex (MGI 2016) There are a variety of methods used internationally to measure the infrastructure gap
Reports by the McKinsey Global Institute (MGI 2013 and 2016) on the global infrastructure gap estimate that the world will need to invest US$33 trillion annually in infrastructure to support the needs resulting from projected economic growth The MGI methodology is highly sensitive to variations in economic growth since the forecasted investment gap is based on maintaining the ratio of infrastructure stock to a countryrsquos gross domestic product (GDP) But assessing infrastructure need as a constant share of a countryrsquos GDP is a rather crude measure that could result in erroneous conclusions For example assume a country spends the same amount on infrastructure but boosts GDP through greater efficiency in the allocation of those investment resources This would show as an increase in the infrastructure investment gap under the MGI approach (ie infrastructure spending would fall as a percentage of GDP) when in fact the efficiency gains would actually reduce the gap
In working to improve infrastructure provision the ultimate focus for any government should be minimising a recognised service gap not reducing a notional investment gap ndash addressing a countryrsquos particular economic social and environmental objectives (Fay et al 2017) The roundtable discussion in Canada a country with a negligible investment gap highlighted the misalignment between infrastructure investment decisions and the actual service needs of the country something that had been particularly challenging in First Nations communities In short this global challenge cannot be solved only by spending more money but also by spending better ndash ensuring that all spending is targeted on real needs At the same time it is not possible to categorise effectively on a global scale all the national objectives underpinning the goal of closing service gaps
Therefore this report offers two approaches to the global infrastructure gap the infrastructure investment gap and
the infrastructure service gap The first relies on a dataset produced by the G20rsquos Global Infrastructure Hub and sets an aspirational metric which is benchmarked against a countyrsquos peers (GHI and Oxford Economics 2018) This quantified infrastructure investment gap shows what investment would be required for a particular country to move to the top 25th percentile of the peers in its income group This works as an effective benchmark where a countryrsquos gap can be closed over time The second approach relies on the views of the specialist respondents to the member survey The quality of infrastructure is assessed across seven different subtypes demonstrating where service gaps exist for different world regions The first approach provides a quantified output and aspirational target for countries seeking to meet infrastructure needs and is described below The results of the second approach setting out the service gap can be found in section 14 below lsquoFinance professionalsrsquo perspectives on the global infrastructure servicersquo gap
How accountants can bridge the global infrastructure gap | 1 Defining the challenge Quantifying the global infrastructure gap
Globally the cumulative level of investment required to bring all countries in line with the best performing nations in their income group is estimated to be almost US$88 trillion between 2018 and 20404
11 THE INFRASTRUCTURE INVESTMENT GAP (APPROACH 1) AN ANALYSIS OF THE GLOBAL INVESTMENT OUTLOOK The Global Infrastructure Outlook report (GHI and Oxford Economics 2018) defines infrastructure investment as lsquoGross Fixed Capital Formation (GFCF) by the public and private sectors on fixed immovable assets that support long-term economic growthrsquo This report takes a comprehensive view of countriesrsquo infrastructure needs ndash including the social and economic infrastructure that would be captured under GFCF This comprehensive view is echoed in the survey analysis which covers seven sub-categories of infrastructure power and energy water and sanitation road and highways other transport (eg air and sea) ICT railways and core public service infrastructure (eg hospitals and schools) The research by the G20rsquos Infrastructure Hub estimates the amount of infrastructure investment needed for a diverse set of countries in each year from 2016 until 20403
The Global Infrastructure Outlook report provides historic data from 2007 to 2015 and then projects these forward to 2040 with increased spending only occurring in response to changes in economic and demographic fundamentals The difference between these estimates (ie the amount invested compared with the
amount needed) allows us to calculate the lsquoinfrastructure investment gaprsquo for each country To improve understanding of this global challenge the account below illustrates the size of this infrastructure gap at the global level Further detail on the nature of the infrastructure investment being measured and the methodology used to calculate the gap are explained in Appendix A Regional and national-level analysis of the investment gap can be found in Appendix B
12 QUANTIFYING THE GLOBAL INFRASTRUCTURE INVESTMENT GAP Globally the cumulative level of investment required to bring all countries in line with the best performing nations in their income group is estimated to be almost US$88 trillion between 2018 and 20404 Current trends indicate however that actual investment over the period is likely to undershoot this by US$14 trillion In 2018 alone the global infrastructure gap is US$409bn and will average US$613bn per year over the entire period In order to close this gap total forecast spending would have to increase by 19 over current investment levels In other words for every five US dollars of infrastructure spending forecast across the world by 2040 governments and investors would need to find a further 95 cents in order to bring the global stock of infrastructure up to standard
FIGURE 11 Comparison of different approaches to assessing infrastructure needs
Approach 2
Infrastructure Service Gap
Approach 1
Infrastructure Investment Gap
Notional target (aspirational) quantifiable
Source Global Infrastructure
Outlook
Subjective view of need
Source The Global Infrastructure
Gap survey
3 For further detail please see the technical appendix of the Global Infrastructure Outlook (GHI and Oxford Economics 2018)
4 Figures from the G20 Global Infrastructure Outlook report (GHI and Oxford Economics 2018) are reported in 2015 US$ prices and exchange rates unless otherwise specified
15
16
Quantifying an infrastructure investment gap across world regions provides an aspirational target for governments looking to improve the provision of infrastructure in their country
Between regions and countries there is a wide variation in performance in infrastructure provision and the capability of governments and private investors to meet future needs The capacity of governments to respond to this challenge is discussed further in the next chapter of this report
13 ANALYSIS OF THE GLOBAL INFRASTRUCTURE INVESTMENT GAPQuantifying an infrastructure investment gap across world regions provides an aspirational target for governments looking to improve the provision of infrastructure in their country It highlights global top performers such as Singapore Japan and Canada ndash which can be looked to for good practices5 The investment gap view also reveals global laggards such as Mexico Myanmar and Brazil Countries facing substantial and growing gaps may benefit from looking to their peers for good practice and novel methods of meeting infrastructure needs Subsequent chapters explore how the skills and perspectives of accountants can help close the investment gap Before turning to the role of accountants this report sets out a second method for understanding infrastructure need the infrastructure service gap
How accountants can bridge the global infrastructure gap | 1 Defining the challenge Quantifying the global infrastructure gap
14 FINANCE PROFESSIONALSrsquo PERSPECTIVES ON THE GLOBAL INFRASTRUCTURE SERVICE GAP (APPROACH 2)The Global Infrastructure Outlook report forecasts that the global infrastructure investment gap will reach US$14 trillion by 2040 (GHI and Oxford Economics 2018) This economic analysis sets an aspirational global benchmark for meeting the worldrsquos infrastructure needs At the same time the ultimate objective in fulfilling a countryrsquos infrastructure need is not a notional investment figure rather it is closing a recognised service gap Doing this requires that governments develop a vision of what a country seeks to achieve through the development and maintenance of its infrastructure ACCArsquos previous work on Smart Cities argues that creating a vision for future municipal infrastructure requires a lsquocitizen-led bottom-up approachrsquo based on actual service needs (ACCA 2016) Zia Paton a partner at PricewaterhouseCoopers (PwC) and participant in the roundtable discussion in Trinidad and Tobago cited the countryrsquos lsquoVision 2030rsquo as an excellent framework for setting out the governmentrsquos infrastructure priorities She pointed out that lsquothe plans set out in the Vision 2030 document appear to be
FIGURE 12 Global infrastructure investment need and current trends 2015 US$ trillions
50
45
40
35
30
25
20
15
10
05
0
Investment need Current trends
2007
2008
2009
2010
2011
2012
2013
2014
2015
2016
2017
2018
2019
2020
2021
2022
2023
2024
2025
2026
2027
2028
2029
2030
2031
2032
2033
2034
2035
2036
2037
2038
2039
2040
Source GHI and Oxford Economics 2018
5 See Appendix B for regional- and country-level statistics
17
To supplement the economic analysis that produces the investment gap the joint member survey explored the global infrastructure service gap
exactly what we needrsquo but she sees the real challenge as lsquoconverting that plan into action and aligning it with the various frameworks people and Ministries we have in place execution or implementation is where we tend to have challengesrsquo
The following chapters demonstrate the essential role for the accountancy profession in transforming agreed national visions into a reality through improving project selection (Chapter 3) financing decisions (Chapter 4) and project delivery (Chapter 5) To supplement the economic analysis that produces the investment gap the joint member survey explored the global infrastructure service gap This granular
approach captures the perspective of finance professionals from around the world setting out which particular types of infrastructure are viewed as requiring improvement to meet service needs
Infrastructure service gap by world regionRespondents to the survey were asked to rank the current quality of seven types of infrastructure in their country ndash covering both social and economic infrastructure Breaking down these results by world region demonstrates considerable variation in the current quality of each type of infrastructure Figures 13 14 and 15 show the results for three types of infrastructure power and energy roads and highways and ICT The world regional
How accountants can bridge the global infrastructure gap | 1 Defining the challenge Quantifying the global infrastructure gap
FIGURE 13 Infrastructure quality ndash power and energy
North America
100
80
60
40
20
0
n Dont know n Very good n Good n Neutral n Poor n Very poor
Middle East Asia Pacific Central and Eastern Europe
South Asia Western Europe Africa Caribbean Total
Source The Global Infrastructure Gap survey specialist respondents only n 1966
FIGURE 14 Infrastructure quality ndash roads and highways
North America
100
80
60
40
20
0
n Dont know n Very good n Good n Neutral n Poor n Very poor
Middle East Asia Pacific Central and Eastern Europe
South Asia Western Europe Africa Caribbean Total
Source The Global Infrastructure Gap survey specialist respondents only n 1966
ICT is a unique form of infrastructure that includes significant non-physical components and its provision must anticipate the future needs of the digital economy
breakdowns for water and sanitation railroad and other transport infrastructure (eg sea and air) and core public service infrastructure can be found in Appendix B Figures B6 B7 B8 and B9 By analysing the specialist responses on each type of infrastructure this report offers a view on the global and regional service gaps that exist in the provision of infrastructure
The survey data shows that South Asia lags other world regions in the quality of its power and energy infrastructure with only one in five (20) of finance professionals in that region stating that power and energy provision in their country was good or very good This compares with 65 of global respondents who found the provision of power and energy to be good or better Africa lagged in this area with about one in three (35) of Africarsquos finance professional respondents stating that power and energy provision was very good or good Unsurprisingly 90 of the Middle Eastern respondents saw their power and energy infrastructure as good quality or above ndash with 71 stating that power and energy provision is lsquovery goodrsquo
Central and Eastern European and African respondents were critical of the quality of their road infrastructure ndash with 37 and 46 respectively stating that their roads and highway infrastructure were poor or very poor In comparison a majority of survey respondents in the Middle East North America and Western Europe reported that the provision of
road and highway infrastructure in their countries was of good or very good quality Globally nearly half the finance professionals (49) reported that that the quality of road and highway infrastructure in their countries was good or very good
Globally ICT was seen as the type of infrastructure with the highest quality Clearly ICT is a unique form of infrastructure that includes significant non-physical components and its provision must anticipate the future needs of the digital economy The quality of ICT infrastructure extends beyond initiatives such as the roll-out of ultrafast broadband it includes public sector projects developing robust financial management and information systems to improve public services
Besides significant non-physical components ICT represents a comparatively new priority for many governments The survey shows the African region lagging its peers with only 51 of specialist finance professionals in the region ranking ICT as good or very good compared with the global average of 69 ICT was one of the few infrastructure types to receive a high score in central and Eastern Europe This is understandable because for many countries in this region other types of physical infrastructure such as road and rail were built under the Soviet Union Significant investment in ICT infrastructure around the world occurred
18
How accountants can bridge the global infrastructure gap | 1 Defining the challenge Quantifying the global infrastructure gap
FIGURE 15 Infrastructure quality ndash information and communication technology
Source The Global Infrastructure Gap survey specialist respondents only n 1966
North America
100
80
60
40
20
0
n Dont know n Very good n Good n Neutral n Poor n Very poor
Middle East Asia Pacific Central and Eastern Europe
South Asia Western Europe Africa Caribbean Total
19
Comparing specialistsrsquo perceptions of infrastructure quality by country shows particular service gaps emerging across the types of infrastructure
after the fall of the Soviet Union and many new nation-states in Eastern Europe were able to pursue their own infrastructure investment priorities Certain countries such as Estonia are now seen as world leaders in ICT and the provision of a digital public sector
A comparison of regional infrastructure service gaps arising from the survey dataComparing specialistsrsquo perceptions of infrastructure quality by country shows particular service gaps emerging across the types of infrastructure For example finance professionals in Africa and South Asia reported consistently poor levels of infrastructure across all the subtypes with the notable exception of ICT These results suggest that there are considerable service gaps that governments in this world region must address In comparison North American respondents had much higher overall scores but showed a particular dip in their road and highway infrastructure where only 64 of respondents reported that this infrastructure was of good quality In the Caribbean region specialist respondents isolated road and highway infrastructure and core public service infrastructure as key areas requiring intervention to reduce the service gap Specialists in infrastructure policy in central and Eastern Europe cited core public service infrastructure and railway infrastructure as areas requiring further investment
15 BARRIERS TO MEETING INFRASTRUCTURE NEEDSRespondents to the member survey were also asked what they saw as the biggest barriers to meeting the infrastructure needs in their country The results of this question showed significant variation by world region For example corruption was seen as a serious challenge in South Asia Africa Central and Eastern Europe and the Caribbean ndash but was cited by 10 of respondents or fewer in North America and Western Europe In comparison a lack of political leadership ranked consistently high across world regions This is a key barrier that is explored further in Chapter 3 Selecting Projects The lack of finance or funding also ranked as a significant barrier in most regions with an overall global average of 49 of respondents citing it as a barrier The underlying causes for the lack of finance as well as good practices in overcoming this barrier are discussed in Chapter 4 on the central role of accountants in improving infrastructure project finance Finally planning and regulatory issues consistently arose as a barrier to meeting infrastructure need with around 40 of respondents across the globe citing this as a key barrier Chapter 5 of this report which explores how accountants can support the efficient execution of infrastructure projects sets out how the interface of public and private partners can often be confused and suboptimal reducing the effective delivery of infrastructure
How accountants can bridge the global infrastructure gap | 1 Defining the challenge Quantifying the global infrastructure gap
FIGURE 16 Biggest barriers to meeting infrastructure needs
North America
100
80
60
40
20
0
n Lack of finance andor fundingn Lack of political leadershipn Skills and talent shortagen Planning and regulatory barriersn Corruptionn Lack of competitionn None
Middle East Asia Pacific Central and South Asia Western Europe Africa Caribbean Total
Source The Global Infrastructure Gap survey all respondents n 3611
Eastern Europe
2 Capacity for infrastructure investment
For countries at different stages of development the implications of infrastructure spending can also be markedly different The annual rate of growth in output typically much higher during the early phase of industrialisation tends to slow as a countryrsquos economy matures Smaller economies may therefore need to commit a relatively large share of their output to infrastructure investment in order to facilitate rapid growth
Looking at infrastructure investment as a percentage of GDP can therefore be revealing as to governmentsrsquo willingness or ability to make the necessary financial investment as well as the nature of the environment for private investment
In 2015 the Asian economies funded the largest financial infrastructure investment around US$13 trillion This is unsurprising given that Asia is the most heavily populated region It is also a function of the commitment by certain countries to improving the regionrsquos infrastructure and in 2015 the level of investment was the largest in relative terms standing at 51 of GDP
Africa was the region with the second-highest level of investment as a share of GDP in 2015 at 43 but the continent trails its peers in absolute investment (US$100bn) Europe and the Americas both of which are dominated by their larger more developed economies dedicated far lower levels of funding to infrastructure investment relative to their GDP in 2015 at 20 and 17 respectively
20
21 GOVERNMENTSrsquo CAPACITY FOR INCREASING INFRASTRUCTURE SPENDINGGovernments can directly fund an increase in expenditure on infrastructure through increases in either taxation or borrowing The latter places a burden on future generations in the form of the higher taxation needed to fund the
repayment of the debt The major constraints on a governmentrsquos capacity for funding infrastructure are therefore a fairly complex mix of institutional economic and social factors The size of the tax base how easily taxes can be evaded and political or cultural expectations about what constitutes a fair level of taxation all present practical
FIGURE 21 Regional infrastructure investment in US$ trillions as a of GDP 2015
7
6
5
4
3
2
1
0Asia
14
12
10
08
06
04
02
0Africa Oceania Europe Americas
o
f GD
P
2015 USD
$ trillions
n of GDP n USD $ trillions
Source GHI and Oxford Economics 2018
21
How accountants can bridge the global infrastructure gap | 2 Capacity for infrastructure investment
Table 21 presents summary statistics for the level of government debt and taxation across high-income upper-middle-income and low- and lower-middle-income countries
barriers to raising revenues Likewise high taxes can have strong disincentive effects discouraging certain activities and limiting the extent to which any change in the tax rate translates into higher revenues Borrowing on the other hand is constrained by the credibility of the government in pledging to repay any debts and the depth and sophistication of domestic capital markets
Table 21 presents summary statistics for the level of government debt and taxation across high-income upper-middle-income and low- and lower-middle-income countries Using this data gives the distribution of tax and borrowing levels relative to GDP allowing us to benchmark countriesrsquo capacity for further investment The figures cover the 1995 to 2016 period in order to show variation across a range of different economic and political cycles
Table 21 shows that among the high-income countries both the UK and Canada have relatively high levels of indebtedness as measured by the OECD gross general government debt indicator (OECD 2019) Since the global financial crisis both countries have seen their debt levels pull away from the OECD average to stand at 1117 and 1147 of GDP respectively This puts both countries firmly in the upper quartile of indebted countries even among the OECD countries where levels of debt to GDP
are generally high In both cases tax revenues are marginally below the OECD average however suggesting there is some limited fiscal room for raising revenue Political pressure in countries such as the UK may play a part in decisions about whether to raise taxes to generate additional revenue and if so whether to invest in capital expenditure over improving service provision through increased operating budgets
Chinarsquos debt as a share of GDP is estimated to fall below the average for the low- and middle-income countries at 443 Tax revenues are also somewhat higher than in most low and middle-income countries As growth continues and the economy matures Chinese governments may be able to widen the tax base in line with developed economy standards bringing in significantly larger revenues Still the government remains well placed to invest in infrastructure Malaysia which has a larger infrastructure gap to overcome is somewhat more indebted (545) sitting above the median debt level for its peer group although not particularly dangerously so Conversely tax revenue as a share of GDP (143) is slightly lower than the median level for low- and middle-income countries of 147 This suggests that without a move into higher growth and a broader tax base the funding required to close the infrastructure gap is unlikely to materialise in Malaysia
TABLE 21 Stock of debt and tax revenues as a share of GDP selected countries
INCOME GROUP (WORLD BANK DEFINITION)
COUNTRY INFRASTRUCTURE INVESTMENT AS A SHARE OF GDP 2015
GENERAL GOVERNMENT DEBT AS A PROPORTION OF GDP
TAX REVENUE AS A SHARE OF GDP
High-income UK 16 1117 325
Canada 23 1147 320
Upper-middle income China 70 443 217
Malaysia 36 545 143
Low- and lower-middle income Pakistan 17 633 164
Nigeria 32 196 35
India 40 689 110
Source World Bank OECD IMF CIA World Factbook
Some countries such as China find themselves in the privileged position of having significant fiscal room to support further investment while also projecting a small infrastructure gap
Pakistan has a relatively high level of government debt (633) which is approaching the upper quartile of World Bank estimates This presents real risks to fiscal sustainability where pressure from the countryrsquos overseas debt obligations has raised the prospect of a debt crisis Here the high level of indebtedness may in part be due to rapid growth in infrastructure spending over recent years
Among the case study countries Nigeriastands out as having both the largest forecast infrastructure gap at 09 of GDP in 2040 and the weakest tax revenue (35 of GDP) The inability of the government to raise revenue effectively is holding back its ability to invest in infrastructure which in turn is holding back growth The availability of significant oil reserves can provide an alternative source of revenue to general
taxation especially when oil prices are high But there are reasons (environmental and technological) for considering that peak oil prices may have been (or will soon be) reached Therefore the ability of Nigeria to finance its investment from other sources of income will be essential to closing the countryrsquos infrastructure gap
This analysis demonstrates that there is significant country-level variation in the ability to respond to the global infrastructure gap (Table 22) Some countries such as China find themselves in the privileged position of having significant fiscal room to support further investment while also projecting a small infrastructure gap Others such as Pakistan and Nigeria will need to work within the limited fiscal room available for meeting their growing infrastructure needs
22
How accountants can bridge the global infrastructure gap | 2 Capacity for infrastructure investment
TABLE 22 A typology of infrastructure gap responsiveness
LIMITED FISCAL ROOM GREATER FISCAL ROOM
Low infrastructure gap lsquoSmall gap Fiscally restrictedrsquo(eg Canada)
lsquoSmall gap Fiscally flexiblersquo(eg China)
High infrastructure gap lsquoLarge gap Fiscally restrictedrsquo(eg Pakistan Nigeria)
lsquoLarge gap Fiscally flexiblersquo (eg Malaysia)
23
3 Selecting projects
Around the world the multitude of industrial cranes signals the increase in infrastructure projects and the resulting demand on investment resources Yet what is not apparent is the variety of competing demands for infrastructure investment such as the ageing of existing infrastructure the need to adapt the built environment to respond to climate change and the desire to initiate new often lsquomegarsquo projects6
The planning and selection process of the appropriate infrastructure project is particularly difficult given long asset lives and significant sunk costs that increase risk and uncertainty
Given these common barriers finance professionals from around the world offered a mixed review of their countriesrsquo current selection process Only 16 of respondents to the joint member survey claimed that their government always or frequently selects infrastructure projects that provide the most value to taxpayers whereas a majority (52) argued that their government only sometimes selects infrastructure projects of value to taxpayers Almost one-in-three respondents (29) indicated that they believed that governments never or infrequently select infrastructure projects that provide value to taxpayers (Figure 31)
There is clearly room for improvement in how infrastructure projects are selected To suggest how to improve the planning
and selection process respondents to the joint member survey were asked to rate in order of priority what changes could be made to improve decision-making when planning and selecting
infrastructure projects Figure 32 shows how respondents ranked the various options from first choice to fifth with smaller bars reflecting fewer respondents ranking that option in their top five
FIGURE 31 Do you believe the government selects projects that provide the most value to the taxpayer
0 10 20 30 40 50 60
Always
Frequently
Sometimes
Infrequently
Never
Dont know
Source The Global Infrastructure Gap survey all respondents n 3611
6 lsquoMegaprojects are large-scale complex ventures that typically cost US$1bn or more take many years to develop and build involve multiple public and private stakeholders are transformationaland impact millions of peoplersquo (Flyvbjerg 2018)
24
A majority of respondents (55) ranked either lsquoremoving political decision-makingrsquo or lsquoputting in place mechanisms to reduce corruptionrsquo as their first choice
The results (Figure 32) show that lsquoremoving political decision-making and making the process more technocraticrsquo was the change most cited by finance professionals as likely to improve the planning and selection process A majority of respondents (55) ranked either lsquoremoving political decision-makingrsquo or lsquoputting in place mechanisms to reduce corruptionrsquo as their first choice This prioritisation aligned with the pervading sentiment voiced by participants in the Canadian roundtable who argued that the government often plan and select projects that are likely to be popular among voters and will focus decision-making on the political cycle which results in short-sighted project selection and planning processes that lack a long-term plan to address future needs
The importance of putting in place mechanisms for reducing corruption such as effective whistle-blowing legislation also resonated in the roundtable discussions A participant in Nigeria emphasised that lsquoif project selection was looked into as it should be it would
definitely help us in reducing corruption and hence reduce the infrastructure gaprsquo Respondents also ranked highly lsquoquantifying the total life-cycle costs of a potential projectrsquo ndash with 22 selecting this as their first or second choice Therefore one of the key barriers to improving project selection is the bias towards short-term thinking and decision-making
Another area needing improvement identified in the survey is the lack of a standard assessment method supporting the project selection process The survey showed that 26 of respondents ranked lsquoimplementing standard assessment tools to evaluate projects during selectionrsquo as either their top or second-highest choice Below we explore two such barriers and how accountants play a role in addressing them first improving the project planning and selection processes by using standards and tools to identify need and prioritisation and second the misalignment between the project life cycle and the political short-term thinking that often prevails in project selection
How accountants can bridge the global infrastructure gap | 3 Selecting projects
FIGURE 32 Which of the following do you feel the government in your country should prioritise to make the best decisions when selecting infrastucture projects
Removing political decision-making making process
technocratic
100
80
60
40
20
0
n 1st preference n 2nd preference n 3rd preference n 4th preference n 5th preference
Applying standard assessment tools to
evaluate projects during selection
Putting in place mechanisms to
reduce corruption
Quantifying the total life-cycle
costs of potential projects
Spending more resource to evaluate
projects after completion
Transferring project selection powers
to more local levels of govt
Adhering to global accounting
standards
Bringing OOBs onto government
balance sheets
Moving government accounts from cash to accrual
accounting
Source The Global Infrastructure Gap survey all respondents n 3611
25
How accountants can bridge the global infrastructure gap | 3 Selecting projects
The constrained optimisation method is another tool that can be used for project selection though it is usually reserved for complex and large projects that require mathematical optimisation before decisions are made
31 BARRIER 1 LACK OF A STANDARD PROJECT SELECTION METHOD ndash FACTORING IN lsquoNEEDrsquo AND lsquoPRIORITISATIONrsquoA participant in the Trinidad amp Tobago roundtable commented that planning and project selection is lsquohardly ever done on a needs basis We do not complete a needs assessment when were building a road costing millions of dollars What is the benefit that we are going to bring to society from that new infrastructurersquo Establishing a need is a key consideration in building the case for selecting a particular project Although there are no international standards or regulations for infrastructure project selection the Guide to Project Management Book of Knowledge (PMBOK) (Project Management Institute 2017) sets out a process whereby the lsquoneedrsquo for the project is identified first and classified as most important in the selection This can be done by conducting a needs assessment or feasibility study and supports the reasons for lsquowhyrsquo the project is required The lsquowhyrsquo may be stimuli such as a market demand a business need a customer request a technological advance a legal requirement or a socialenvironmental need
The PMBOK then delineates two broad methods for establishing the benefit or the lsquowhyrsquo of a project the benefit measurement method and the constrained optimisation method
The benefit measurement methodAs a comparative approach this method is based on the present value of estimated cash flows and uses techniques such as benefitcost ratio economic models payback period discounted cash flow internal rate of return and opportunity cost This method is often used for small or less complex projects
Constrained optimisation methodThe constrained optimisation method is another tool that can be used for project selection though it is usually reserved for complex and large projects that require mathematical optimisation before decisions are made This method is widely used in finance and economics to find the minimum or maximum for a cost function where the cost changes depending on varying inputs Many techniques are available that offer broader consideration for decision makers by examining the best and worst case scenarios and the probability of the project outcome
The international roundtable participants highlighted that governments should ensure that the need for a particular project is clearly defined ndash the lsquowhyrsquo as the need will determine the appropriate source(s) of support To do this they should implement a stage-gate process such as the PMBOK with standard tools and mechanisms in place for evaluating the project selection process increasing transparency and reducing corruption
FIGURE 33 Two methods of need assessment
Uses cost-benefit analysis to assess whether the project is financially viable or not
Constrained optimisation method
The benefit measurement method
Compares the project under consideration with a competing project
New project Competing project
How accountants can bridge the global infrastructure gap | 3 Selecting projects
Alongside the technical methods available for isolating need and priority accountants can produce a broader range of metrics to improve the projection selection process
In practice many governments do not have the resources or the capacity to carry out such assessments across all projects and usually with the limited information available they place emphasis on basic elements of project appraisal which include lsquorules of thumbrsquo to confirm that
bull the need for the project is justified
bull the projectrsquos objectives are clearly specified
bull broad alternatives to the project are considered
bull promising options are analysed
bull project costs are fully estimated and
bull project benefits are assessed
Even by applying the basic elements of project appraisal prioritisation (or ultimately selecting the right project) can still be a constraint The World Bank has developed an innovative and adaptable Infrastructure Prioritization Framework (IPF) (Marcelo et al 2016) to assist governments in making the best use of their limited information in the interim until they are able to increase their capacity and resources for conducting a more informed and extensive analysis
The IPF provides a stepping-stone approach to project prioritisation for government decision-making This multi-criterial decision-support tool builds on existing and accessible data to help governments compare projects while promoting the building of analytical capacity and data for more extensive financial and economic analysis It is seen as an extension to the current set of tools available to support project selection It starts from a baseline of ad hoc uninformed project selection (where technical project information is limited and subjective) to partial technical information (where some information and analysis is available) to a full selection by advanced project appraisal (where considerable technical information is available)
Alongside the technical methods available for isolating need and priority accountants can produce a broader range of metrics to improve the projection selection process For example project planning and selection in Japan considers the effect of infrastructure investment on achieving regional equity instead of selecting projects that give the highest direct economic return (International Transport Forum 2017) This approach prioritises more evenly spread economic development in a country even where an optimisation model would suggest investment elsewhere
Box 31 Sustainability and infrastructure A Canadian case
The Canadian wave of the survey included a question on sustainability and infrastructure 80 of Canadian respondents indicated that they believe that it is very important to adapt to the impacts of the changing climate such as severe weather in planning infrastructure projects
It is important now more than ever to build resiliency into infrastructure investments Roads bridges buildings public transit and water and wastewater systems are at increasing physical risk from the impacts of climate change
The Canadian government declared in the 2017 federal budget that it plans to invest CAD219bn in green infrastructure Specifically CAD2bn is dedicated to a Disaster Mitigation and Adaptation fund to support the federal provincialterritorial and municipal infrastructure needed to address climate change Canadian national building codes have been updated to integrate climate adaptation and
resiliency considerations resulting from significant disaster losses Canadian insurance companies are experiencing the impact the annual insured damage for 2016 was CAD49bn ndash a significant increase from the previous annual record of CAD32bn set in 2013 In 2016 the biggest claims arose from the Fort McMurray wildfires which resulted in approximately CAD37bn in insured damage
Any future costs of inaction will likely outweigh the incremental investments made today in enhancing and modifying infrastructure resiliency Nonetheless too often there are challenges in making the business case for projects that incorporate adaptation measures But as with most modifications in the long run it is always easier and cheaper to build resilience considerations into asset development from the start rather than adding them later in response to a major event n
26
How accountants can bridge the global infrastructure gap | 3 Selecting projects
The member survey revealed the need to quantify the total life-cycle cost and remove political decision making in order to improve project selection
32 BARRIER 2 MISALIGNMENT OF THE INFRASTRUCTURE LIFE CYCLE AND THE POLITICAL CYCLE The member survey revealed the need to quantify the total life-cycle cost and remove political decision making in order to improve project selection These two changes are likely prioritised because of the misalignment that commonly exists between the political cycle (often four to six years) and the total life cycle of an infrastructure asset (often over 20 years) This mismatch can generate two biases a bias towards short-term decision-making and a bias towards megaprojects over maintenance
Short-term bias in project selection New infrastructure investment is unavoidably long-term and this carries certain risks At the stages of early planning and project selection infrastructure decision-makers need to consider the forces shaping a country ndash such as social demographic and technological change ndash while providing sufficient flexibility to address unpredictable adjustments in need These variables do not align well with the typically shorter political cycle where there is often a preference for announcements of major projects that can be hard to execute in practice or where fundamental requirements may be missing (eg unfeasible building requirements or little forecasted demand for use of the infrastructure) To counteract this bias the UKrsquos National Infrastructure Commission (NIC) was established in 2015 to produce analysis that is independent of government and to provide advice on major long-term infrastructure challenges ndash with the specific priority of linking long-term priorities with short-term action The NIC publishes an annual National Infrastructure Assessment (eg NIC 2018) to establish infrastructure needs and priorities over many decades
Having an independent body of experts recommending a stable set of priorities can reduce investment risk as potential private sector partners will have certainty that a project aligns with a broader economic plan Establishing a national plan based on agreed priorities is also good practice for reducing short-termism and improving legitimacy but it can also add rigidity to project selection processes Decision-makers must be careful to balance the benefits of a stable framework with maintaining flexibility to respond to a rapidly changing policy environment
Bias towards mega-projects over maintenance There can be considerable bias towards allocating resource to new (preferably high-profile) projects rather than investing in the necessary maintenance of existing assets There can be a natural reluctance to spend money on what a country already has and there is often political appeal in wishing to establish an individual legacy through the construction of a megaproject Accountants are in a pivotal position to draw attention to the issue of prioritising backlog maintenance to ensure that assets remain in serviceable condition As part of any needs assessments careful consideration must be given to the condition of existing capital infrastructure and its ability to maintain the existing levels of service To balance these demands NHS Scotland publishes an annual assets and facilities report which provides an overview of asset performance and planned future investment (see NHS Scotland 2018) This report offers good practices in quantifying and managing the backlog of maintenance including setting out the total outstanding backlog of maintenance costs per square metre of the estate and the proportion of significant and high-risk maintenance By identifying the maintenance backlog NHS Scotland is able to take the appropriate action to mitigate a reduction in public service quality while also prioritising repairs in line with the metrics established in the annual assets and facilities report
27
28
How accountants can bridge the global infrastructure gap | 3 Selecting projects
Box 32 Accountants and climate-change adaptation planning A Canadian case in point
As governments around the globe move to establish planned spending on infrastructure projects designed to adapt to climate change it is essential that accountants have a role in project selection and planning to help make the business case for resiliency and to ensure adequate accountability
In Canada the efficacy of this practice was illustrated when the City of Montreal developed its Climate Change Adaptation Plan Accountants played an integral role in performing the cost-benefit analysis of embedding adaptation into municipal infrastructure decisions (CPA Canada 2016)
lsquoA less costly option may be deemed adequate today but could result in future costsrsquo explained a participant in the Canadian roundtable
For example if Montrealrsquos sewer pipes cannot withstand increased flooding predicted with climate change sewer backups could lead to additional expenditures such as clean-up costs and even legal liabilities
lsquoClimate change is going to force cities and governments to put in place capital projects and other measures to prevent future losses or damagesrsquo emphasised the participant
Indeed there has never been a more vital time for CPAs to get involved in infrastructure project selection n
The walkway of Saint Anne De Bellevue Montreal Quebec during the floods April 2017Editorial credit Glass and Nature Shutterstockcom
29
4 Financing projects
The economic analysis in this report demonstrates that by 2040 the world will have accumulated an infrastructure gap of over US$14 trillion In response to this challenge governments are adopting novel means of effectively funding and financing their public infrastructure ndash as well as turning to institutional investors foreign direct investment and the private sector
Accountants act as a critical interface between these actors for example through effectively communicating and negotiating the terms of an infrastructure finance deal
41 THE MIX OF PUBLIC AND PRIVATE FINANCE FOR INFRASTRUCTURERespondents to the joint member survey shared the view that infrastructure in their countries should be financed by both the public and private sectors with 85 stating that infrastructure should be financed by some mix of investment from both the public and private sectors Half the total respondents (50) suggested that there should be an even mix between public and private finance while the second most common view was that infrastructure should be primarily financed by the public sector (42) Some countries such as the UK plan for the majority of their future infrastructure investment to come from the private
sector (IFG 2017) and data from the Project Finance and Infrastructure Journal shows that global private finance deals amounted to over US$930bn in 2017 (IJGlobal 2018) Given this environment
it is important for accountants to contribute their financial acumen and professional skills by providing a view on the best means of financing infrastructure projects (Figure 41)
FIGURE 41 How should infrastructure be financed in your country
0 10 20 30 40 50 60
PRIVATE
Entirely private finance
Mostly private finance
Even mix of public and private finance
PUBLIC
Mostly public finance
Entirely public finance
Dont know no opinion
Source The Global Infrastructure Gap survey generalist respondents only n 1645
30
and core public service infrastructure Core public service infrastructure such as hospitals and schools attracted the lowest private finance support
Overall finance and accounting professionals with a specialist background took a balanced view on the appropriate finance sources for infrastructure in their country
42 KEY BARRIERS TO SECURING PRIVATE FINANCE FOR INFRASTRUCTUREThe member survey showed that 85 of respondents believed there should be some mix of public and private sector finance in their countryrsquos infrastructure A key question therefore is what barriers limit the flow of private finance for public infrastructure
Survey respondents with specific expertise in infrastructure (lsquospecialistsrsquo ) provided a detailed breakdown on the suggested balance of public and private investment by each type of infrastructure
7
Almost half (47) of specialist respondents argued that ICT infrastructure should be either mostly or entirely financed by the private sector while other transport ndash such as air or sea ndash ranked as the second highest subsector for private sector investment (36) (Figure 42) There was a consistent view across the infrastructure subsectors that there should be an even mix of public and private investment with between 33 and 46 of specialist respondents holding this view Only three subsectors were seen to benefit from finance originating mostly or entirely from the public sector these were water and sanitation roads and highways
How accountants can bridge the global infrastructure gap | 4 Financing projects
Overall finance and accounting professionals with a specialist background took a balanced view on the appropriate finance sources for infrastructure in their country
FIGURE 42 How should infrastructure be financed in your home country by infrastructure sub-sector
Dont know no opinion PUBLIC Even mix PRIVATE
Information and communication technology
Other transport
Power and energy
Railways
Water and sanitation
Roads and highways
Core public service infrastructure
0 10 20 30 40 50 60 70 80 90 100
n n n n
0 10 20 30 40 50
Insufficient skills in government to negotiate with private sector
Lack of attractiveness of infrastructure investment
Negative perception of private finance for public infrastructure
Regulatory barriers
Perceived political instability in my country
Underdeveloped financial markets in my country
Too few viable projects for private investment
Other
Dont know
FIGURE 43 What are the key challenges that the government faces in securing private finance
Source The Global Infrastructure Gap survey all respondents n 3611
Source The Global Infrastructure Gap survey specialist respondents only n 1966
7 Question 3 of the survey asked respondents if their work involved any of the following areas infrastructure policy procurement capital budgeting project management or operations management
How accountants can bridge the global infrastructure gap | 4 Financing projects
Developing the skills in government to act as competent clients and negotiators will be essential in meeting the challenges of providing the right finance for infrastructure projects
As seen in Figure 43 ACCA members and CPA Canada members identified three key barriers for governments working to secure private finance
Barrier 1 the lack of attractiveness of infrastructure investment (42)
Barrier 2 the negative perception of private finance for public infrastructure (43) and
Barrier 3 insufficient skill in government to negotiate with the private sector (45 of respondents)
The distinction between lsquofundingrsquo and lsquofinancingrsquo infrastructure (set out in the next section) helps explain the lack of attractiveness of infrastructure investment and what accountants might do to reduce this problem The higher cost and perceived private gain from public goods is a significant factor in the negative perception of private finance investing in public infrastructure The UK National Audit Office published a report in January 2018 calling out the high rates of return enjoyed by private investors participating in the Private Finance Initiative (Morse 2018) Therefore accountants must take centre stage in
demonstrating the higher cost of private capital managing the transfer of risk between sectors and building an evidence base for selecting the right financing model to support an infrastructure project
Finally developing the skills in government to act as competent clients and negotiators will be essential in meeting the challenges of providing the right finance for infrastructure projects For example there is growing recognition that gold-standard public finance takes account of more than debt stocks and cash flows (eg debt to GDP ratio and tax receipts) and instead needs to consider net wealth particularly public assets Cultivating the skills in government to produce a public sector balance sheet and applying this perspective to the finance selection process will help policymakers maximise the value of their assets and make better infrastructure finance decisions
The remainder of this chapter will discuss these barriers in order to inform areas where public sector accountants can make a difference in closing the infrastructure gap
FIGURE 44 Key barriers in financing infrastructure projects
Lack of attractiveness
of infrastructure investment
Negative perception of
private finance for public
infrastructure
Insufficient skill in government
to negotiate with the
private sector
BARRIER 1 BARRIER 2 BARRIER 3
42 43 45
31
How accountants can bridge the global infrastructure gap | 4 Financing projects
Investment in infrastructure offers the opportunity for private investors to benefit from stable long-term low-risk returns that are tied to a physical asset
43 BREAKING DOWN BARRIER 1 BY CLOSING THE FUNDING GAP
Investment in infrastructure offers the opportunity for private investors to benefit from stable long-term low-risk returns that are tied to a physical asset A key challenge in connecting this pool of private capital with the demand for infrastructure projects is the funding gap Broadly there are three ways of funding (lsquoultimately paying forrsquo) an infrastructure project
Distinguishing between funding and financing It is important to make a clear distinction between the lsquofundingrsquo and lsquofinancingrsquo of infrastructure projects When a private sector institution such as a bank or pension fund finances a public infrastructure project it is providing the upfront money to allow for the design building and operation of that project whereas lsquofundingrsquo is how an infrastructure project is ultimately paid for (Institute for Government 2018)
Global capital markets can help plug the global infrastructure gap Institutional investors with an estimated US$80 trillion in assets under management (Fages et al) seem ideal partners for providing the required finance to reduce the size of the forecasted global infrastructure gap Their risk appetite and the duration of their liabilities match the needs of typical infrastructure projects that will often have life cycles ndash from design to decommission ndash that can span many decades
bull general taxation
bull user charges (eg toll roads) and
bull novel forms of funding (eg value capture and civic crowdfunding)8
This distinction explains why even where private investors have expressed interest in public infrastructure and while the global infrastructure gap grows the response has been relatively muted (McKinsey 2016a) Private investors understandably require a stream of revenue to support their upfront outlay but many potential (even lsquoshovel readyrsquo) projects do not include the long-term funding arrangements to support private finance
FIGURE 45 The funding gap
Global Infrastructure Investment Gap
(forecasting a US$14 trillion gap by 2040) FUNDING
GAP
Institutional Investors
(US$80 trillion under management)
8 Refer to Institute for Government 2018 for an overview of the advantages and disadvantages of different infrastructure funding options
32
Box 41 Hong Kongrsquos MTR Corporation ndash fully funded infrastructure through value capture
Hong Kong has applied a novel form of infrastructure funding that has attracted global attention MTR Corporation is majority owned by the Hong Kong government and manages a passenger rail system that makes a profit It manages to generate revenue in excess of 180 of its operating cost
One factor in MTRrsquos financial success has been its lsquoRail plus Propertyrsquo model where the corporation captures some of the positive externalities of its transit operations by developing and renting the land surrounding its rail stations
Hong Kong is particularly suited to this form of funding with its dense population and high real estate costs which have allowed MTR to create sustainable revenue streams from the development of the land surrounding its stations (Leong 2016 MTR Corporation 2017) n
Innovative models of funding infrastructureGeneral taxation and government capital allocations provide an important foundation for funding public infrastructure while user charges can provide a stream of revenue (eg road tolls) ndash subject to demand risks There are also emerging models that are helping to plug the funding gap Rent capture is attracting attention as a method of funding transit (see Box 41 on the MTR Corporation in Hong Kong for an example) In addition civic crowdfunding a novel form of funding is spreading in popularity A report from Catapult Future Cities (2017) found that 10 of local governments in the UK now make use of some form of civic crowdfunding to transform their communities Spacehive ndash a UK crowdfunding platform ndash has attracted over pound11 million in funding since 2012 to fund over 550 local projects including building new community centre facilities (Spacehive 2019) Platforms such as Spacehive connect grant providers local governments and residents that collectively contribute to projects as well as providing a service to verify that a project is viable and has received the required government permissions In 2017 the Mayor of London committed pound400000 to Spacehive projects (OrsquoDowling-Keane 2017) As governments face constrained budgets public sector
finance officials can play a central role in supporting these novel forms of infrastructure funding by establishing what proposals are financially viable in order to help plug the infrastructure gap
The role of the accountant in addressing the funding gapBeyond these novel funding models accountants can play an important role by helping to identify the most efficient funding models while also taking a leading role on the negotiation with potential private sector investors and representing the public interest through their high ethical standards
Clearly the funding gap is a factor in lsquothe lack of attractiveness of infrastructure investment for private investorsrsquo identified in the member survey Finance professionals should consider a number of factors in formulating effective business cases that can attract private sector finance (eg in articulating the lsquoprivate sector incentiversquo) The financial viability of the project needs to be balanced against affordability for users and access to public goods and services Accountants must consider how they can develop and communicate the private sector incentive for investing in priority projects while also supporting the public interest and providing taxpayers with value for money
33
How accountants can bridge the global infrastructure gap | 4 Financing projects
General taxation and government capital allocations provide an important foundation for funding public infrastructure while user charges can provide a stream of revenue (eg road tolls) ndash subject to demand risks
34
How accountants can bridge the global infrastructure gap | 4 Financing projects
44 BREAKING DOWN BARRIER 2 BY ACCOUNTING FOR THE HIGHER COST OF PRIVATE CAPITALRunning infrastructure projects efficiently for citizens also requires that accountants provide decision-makers with the best advice possible in selecting the appropriate source of project finance
The UK is a global leader in the use of private finance and has over 700 operational private finance deals ndash with total projected future charges arising from these deals of almost pound200bn (Morse 2018) In 2018 The UKrsquos National Audit Office published a report examining the rationale costs and benefits of private finance for public sector projects (Morse 2018) The reportrsquos analysis of Department for Education data showed that the cumulative cost of privately financed projects can exceed the public sector
finance costs by 40 over the life of an infrastructure project The broader benefits of private finance for example transferring risk away from government must therefore outweigh the higher total life-cycle cost of private capital
Off balance sheet liabilities in public sector accountingThe UK is not alone in making use of private finance to provide the upfront capital for public infrastructure The accounting rules set by the European System of Accounts excludes liabilities from public sector balance sheets if the private sector bears most of the projectrsquos risks and rewards The types of risk contributing to this test include construction risks (eg cost and time overruns) and demand risks (eg forecasted and actual use of the infrastructure asset) (Atkins et al 2017) Liabilities not included
By the nature of the public sector there are many competing short-term needs for public capital investment where necessary infrastructure investment must compete with other public spending priorities
35
30
25
20
15
10
05
0
Portu
gal
Slov
akia
Hungar
y
UK
Cypru
s
Irelan
dN
ethe
rland
s
Spain
Denm
ark
Esto
nia
Belgiu
m
Gre
ece
Croat
ia
Austri
a
Malt
a
Italy
Finl
and
Latv
ia
FIGURE 47 Off balance sheet PPPs as of GDP
Source ACCA and CPA Canada analysis of Eurostat 2018
FIGURE 46 Estimated cash flows of a privately and publicly financed projectThe cumulative cash costs of a group of PF2 schools are around forty per cent higher than the costs of a project financed by government borrowing
350000
300000
250000
200000
150000
100000
50000
0
Cumulative cash costs (pound000)
2015 2016 2017 2018 2019 2020 2021 2022 2023 2024 2025 2026 2027 2028 2029 2030 2031 2032 2033 2034 2035 2036 2037 2038 2039 2040 2041 2042
Benefits needed to offset higher costs of private finance procurement
PF2 unitary charges Public sector comparator (PSC) with government borrowing costs
Notes1 Cost estimates taken from data prepared by the Department for Education to compare costs of a group of privately financed (PF2) schools with a public sector comparator (PSC)
2 Interest costs for the PSC have been modelled using an amortising loan with an interest rate of 25 The 20-year government borrowing costs were 25 at the time of financial close of this project and the average life of the project debt was less than 20 years
Source Education Funding Agency National Audit Office analysis Reproduced from Morse 2018
How accountants can bridge the global infrastructure gap | 4 Financing projects
Accountants in the public sector must play a critical role in managing both these benefits while also collecting reliable data to measure whether private finance provides good value for money
on the public sector balance sheet are known as off balance sheet (OBS) liabilities Data from Eurostat shows that other European countries have amassed considerable OBS liabilities ndash with outliers such as Portugal and Slovakia maintaining OBS liabilities in excess of 3 of GDP (Eurostat 2018)
An incentive for using private finance can arise through the combination of fiscal rules such as the EUrsquos Fiscal Compact requiring governments to meet debt reduction targets (European Commission 2017) and the ability to keep certain liabilities off the balance sheet through private finance Governments will be encouraged to use private finance even when it ultimately costs more than traditional public finance when this generates the fiscal illusion of adhering to fiscal rules while at the same time building and operating necessary infrastructure In addition to the fiscal illusion these treatments limit the transparency of infrastructure finance by shielding some politicians and the public from understanding the true cost of infrastructure investment in a particular country
Insufficient flexibility between capital and operational budgets can cause further challenges This is particularly the case where a public sector entity can attribute the unitary charge9 from a private finance deal to its operational budgets in cases where the capital budget includes insufficient funding for a required project By the nature of the public sector there are many competing short-term needs for public capital investment where necessary infrastructure investment must compete with other public spending priorities ndash such as the growing operational costs of health care and education But over time high unitary charges can crowd out operational budgets and prevent future governments from providing quality public services
Why use private finance for public infrastructure Given all these concerns it is unsurprising that in the October 2018 Budget Speech the UK Chancellor confirmed that the government would not sign any new Private Finance Initiative (PFI) contracts (Plimmer 2018) Given this environment it is worth asking what is the genuine rationale for private finance in public infrastructure
Two key benefits can justify the use of private finance for public infrastructure the appropriate transfer of risk from the public to the private sector in the building and running of the infrastructure and efficiencies achieved through the use of private sector money in the financing building and operation of public infrastructure Accountants in the public sector must play a critical role in managing both these benefits while also collecting reliable data to measure whether private finance provides good value for money The next chapter explores findings from the member survey on how best to manage the relationship between public and private actors involved in infrastructure projects
At the early stages of a projectrsquos conception accountants are also critical in selecting the right type of finance where they can provide a transparent assessment of the best finance option based on sound principles (eg value for money affordability for users and distribution impacts) Previous ACCA research shows the high level of trust in the ethical behaviour of accountants Ethics and Trust in a Digital Age (ACCA 2017) found that 9 in 10 professional accountants agree that ethical behaviour helps to build trust in the digital age And almost all C-suite executives (95) assert that the accountantrsquos ethical behaviour helps the organisation build trust with internal and external stakeholders Accountants can offer a collective good through this privileged position of trust by providing sound transparent advice on the best finance option for a particular infrastructure project
9 The recurring payments by governments for privately financed projects
35
How accountants can bridge the global infrastructure gap | 4 Financing projects
The barrier to attracting private finance for infrastructure most cited in the member survey was that governments have insufficient skill to negotiate effectively with the private sector (45)
45 BREAKING DOWN BARRIER 3 BY PROFESSIONALISING THE PUBLIC SECTOR FINANCE FUNCTION The barrier to attracting private finance for infrastructure most cited in the member survey was that governments have insufficient skill to negotiate effectively with the private sector (45) This issue was echoed in the roundtables with participants in Trinidad and Tobago stating that there was a clear need to differentiate professional accountants from those who had no real professional training lsquoterms are used very loosely in this country as to an accountant and most times you would mean ldquobookkeeperrdquorsquo Others in Malaysia noted that lsquomany accountants nowadays lack the right specialisation of skills in terms of having foresight to anticipate what costshellipcome into play [in an infrastructure project]rsquo Clearly there are skills gaps in government that need to be addressed through professionalisation and upskilling if infrastructure is to be properly financed
Finance professionals offer a net wealth perspective Knowing what the country owns and what it owes is a basic requirement for reducing its governmentrsquos information deficits which will allow for improved decision-making in financing infrastructure The professional management of assets and the development of an asset register are two examples of how accountants can take the lead in improving government decision-making In the UK roundtable discussion David Smith associate partner at EY UK also acknowledged the essential role of accounting standards
lsquoAccountantsrsquo work now goes beyond compliance but compliance is our firm foundation Speaking from experience we have global accounting rules that do not necessarily align jurisdiction by jurisdiction but the rules are there for a reason If therersquos deviation or rejection of accounting standards for infrastructure projects at any stage then that is a clear red flagrsquo
Global studies are documenting how the benefits of accrual accounting are leading to broad global adoption For example the 2018 International Public Sector Financial Accountability Index forecasts that within the next five years 65 of governments will report on an accrual accounting basis ndash with particularly high levels of adoption in Africa Asia Latin America and the Caribbean (IFAC and CIPFA 2018)
The professionalisation of the finance function is essential in maximising the value of a countryrsquos assets There is growing recognition that gold-standard public finance practice takes account of more than debt stocks and cash flows (eg debt to GDP and tax receipts) and instead needs to consider net wealth where the right policies can maximise the return on public assets This approach requires the adoption of full accrual accounting and the production of a public sector balance sheet Improving the skills available to government to develop a public sector balance sheet and appreciating the full balance sheet impact of a new project will be an important step in allowing public sector accountants to act as competent clients of and negotiators with the private sector
36
How accountants can bridge the global infrastructure gap | 4 Financing projects
37
Maximising the value of public assets and the intertemporal balance sheetDag Detter a former director of Swedenrsquos Ministry of Industry argues that taking a net wealth perspective with the aim of producing small improvements in the return on public assets would allow for a doubling in infrastructure investment (Detter and Folster 2017) The competing argument to this view is that many public assets are not marketable as policy objectives (eg running a public school) do not typically align with generating financial returns
The New Zealand government seeks to address this issue by classifying its assets and liabilities as social financial and commercial ndash where commercial assets have more scope for financial returns New Zealand has taken the lead in public
The adoption of this net wealth perspective changes the typical rankings of public financial capability In late 2018 the IMF Fiscal Monitor published a report (IMF 2018) which estimated that globally governments had public assets worth over 200 of GDP Applying this analysis can also support good public financial management in a country with the IMF report showing that countries with a strong balance sheet pay lower interest on debt and have shorter and shallower recessions
Figure 48 shows the result of adopting a net wealth view of a nationrsquos financial position Using this lens Japan ndash with a notoriously high public-debt-to-GDP ratio ndash has a net wealth position near zero Other countries such as the UK and Portugal have substantial negative public equity in excess of 100 of GDP
The professionalisation of the finance function is essential in maximising the value of a countryrsquos assets
FIGURE 48 Public sector balance sheets ( of GDP)
750
500
250
0
-250
-500
Port
ugal
Uni
ted
Kin
gd
om
The
Gam
bia
Ger
man
y
Bra
zil
Fran
ce
Aus
tria
El S
alva
do
r
Uni
ted
Sta
tes
Ug
and
a
Jap
an
Ken
ya
Tanz
ania
Can
ada
Ind
ia
Gua
tem
ala
Finl
and
Alb
ania
Co
lom
bia
Tuni
sia
Geo
rgia
Sout
h A
fric
a
Aus
tral
ia
New
Zea
land
Ind
one
sia
Ko
rea
Peru
Kaz
akhs
tan
Russ
ia
No
rway
n Financial assets n Total non-financial assets n Liabilities ex pension n Pension liabilities Net worthTu
rkey
Source IMF staff estimates
Based on a single year of data in most cases compiled as part of the Fiscal Transparency Evaluation Albania 2013 Austria 2015 Brazil 2014 Colombia 2016 The Gambia 2016 Guatemala 2014 Kenya 2013 Peru 2013 Portugal 2012 Tanzania 2014 Tunisia 2013 Turkey 2013 Uganda 2015
38
How accountants can bridge the global infrastructure gap | 4 Financing projects
TABLE 41 New Zealand Intertemporal balance sheet 2016(Percentage of GDP)
ASSETS LIABILITIES NET WORTH
Social 575 71 505
Financial 332 505 -173
Commercial 201 120 81
Static balance sheet 1108 695 413
Fiscal 13819 14800 -981
Intertemporal balance sheet 14927 15495 -568
Source New Zealand 2017 Investment Statement IMF 2018
Box 42 New South Wales Treasury Asset and Liability Committee
The state of New South Wales in Australia has established an Asset and Liability Committee to maximise the value of their assets and properly manage the statersquos liabilities
By using this total balance sheet perspective the New South Wales Treasury has been able to unlock AU$33bn for new social and economic infrastructure projects
This initiative was recorded as part of a series undertaken by ACCA and the International Federation of Accountants (IFAC) documenting good practices in public financial management from around the world To learn more scan the QR code to hear more about this initiative in NSW
If the public sector finance function is professionalised accountants working in the public sector will be able to lead the development of the required governance structures to maximise the value of public assets And where public assets do present commercial opportunity accountants must be at the forefront of proper public commercial asset management By providing independent professional management for public assets governments will be well placed to maximise the value of their assets and minimise the cost of liabilities The member survey shows that reducing political influence in project selection was ranked as the number one issue for improving outcomes Allocating more decision-making authority to independent professional accountants will be an important step in the effective commercial management of public assets
financial management practices not just through this classification but also by producing an intertemporal balance sheet (see Table 41) The country currently maintains a strong net worth position in excess of 40 of GDP but analysis by the New Zealand Treasury shows that the current policy framework will produce recurring deficits that are forecasted to reduce the nationrsquos net worth to almost ndash57 of GDP over the next 40 years Accountants producing this analysis provide decisions-makers with a better long-term view of their policy decisions and can help improve the sustainability of public finances This fits with the maxim that lsquoyou manage what you measurersquo and governments that invest in their finance functions to develop a public sector balance sheet will be better placed to understand the implications of a particular infrastructure project on the nationrsquos net wealth
Where public assets do present commercial opportunity accountants must be at the forefront of proper public commercial asset management
Poor monitoring and oversight of
projects by government
Confusion about where
each side provides value
in a PPP
Uncoordinated commerical
acumen in the public sector
BARRIER 1 BARRIER 2 BARRIER 3
5 Delivering projects the publicndashprivate relationship
Common challenges with infrastructure project selection and financing outlined in the previous chapters may persist through the project delivery phase a shortfall in public capital budgets due to short-term decision-making changing political governance and the lsquomegarsquo risks associated with lsquomegarsquo projects For these reasons public-private partnerships (PPPs) are often chosen for the delivery of public infrastructure projects
51 DEFINING PPP In the context of public infrastructure projects a PPP is a contractual agreement between a public sector entity and a private entity (or group) to provide a public asset or service (World Bank 2018b) Unlike traditional procurement ndash where all the risk will ultimately sit with the government ndash PPPs will explicitly set out the allocation of risk for a project Importantly the scope of private sector involvement can vary substantially including requiring private sector partners to
bull design and build a project
bull design finance and build a project or
bull design finance build operate and maintain a project
Asset ownership is another relevant consideration in establishing the terms of a PPP A project can feature public or private sector ownership of the infrastructure and can include provisions to transfer ownership after a set period (eg a private sector partner operates a toll road for 20 years and thereafter transfers ownership of the road back to the public sector)
The roundtable discussion rightly identified the variety of responsibilities that the private sector can adopt in
a PPP For example a participant in the Canadian roundtable identified that the lsquoprivate sector needs to bring more to the government table than just money it needs to offer expertise or opportunity that the government would not otherwise haversquo
52 KEY BARRIERS TO GETTING THE PPP RELATIONSHIP lsquoRIGHTrsquo The public-private relationship is evolving and getting the terms of this relationship right will be critical for the provision of social and economic infrastructure in the future The roundtable discussions with infrastructure experts highlighted three key barriers to this where there was a particular focus on the need to develop the right relationship between public and private sector actors ndash as getting this
relationship right would support the timely and efficient delivery of infrastructure projects (Figure 51)
The roundtable participants identified poor monitoring and oversight by government as a key challenge in delivering infrastructure projects The member survey demonstrated that there was considerable disagreement about where each party in a PPP agreement provides value in delivery Finally the roundtable participants stated that the public sector was often lacking the commercial acumen required to manage an infrastructure PPP effectively
Below this chapter examines these barriers in greater detail and reviews recommendations for overcoming each one
FIGURE 51 Key barriers in delivering infrastructure projects
3939
How accountants can bridge the global infrastructure gap | 5 Delivering projects the publicndashprivate relationship
Both developed and developing countries need to consider whether they are providing sufficient monitoring across the entire project life cycle to maximise the value of their contracts
53 BREAKING DOWN BARRIER 1 BY ENGAGING THE PROFESSIONAL ACCOUNTANT TO PROVIDE PROJECT LIFE-CYCLE MONITORING AND OVERSIGHT Successful project selection financing and procurement will be of little effect if an infrastructure PPP suffers from poor contract management Managing project risk effectively ndash as well as controlling for scope and budget lsquocreeprsquo ndash requires the public sector to act as a competent client by providing effective monitoring and oversight of a project at every stage from design to operation of the infrastructure
Unfortunately these governance structures are often lacking in many countries with a participant in the Sri Lankan roundtable discussion noting that lsquoprojects [will] kick off but there is no one to monitor them on an ongoing basis This can lead to cost overrunsrsquo Written evidence by the Chartered Institute of Purchasing and Supply (2013) to the UK House of Commonsrsquo Public Administration Select Committee echoed this point In this evidence the Institute submitted that lsquoprocurement skills tend to focus on the call for competition to award the contract rather than on the whole procurement cycle which includes pre-procurement and contractsupplier managementrsquo Both developed and developing countries need to consider whether they are providing sufficient monitoring across the entire project life cycle to maximise the value of their contracts
Chapter 1 section 15 showed that corruption was one of the top barriers to meeting infrastructure need in certain
FIGURE 52 Possible parties to a PPP
regions ndash with 89 of survey respondents in South Asia citing this as a key barrier A roundtable participant in Trinidad and Tobago asserted that proper monitoring of project performance was essential for mitigating corruption particularly lsquohaving something that can support the accountants in countries with no whistle-blowing policyrsquo In addition Abiodun Akanbi from the Nigerian roundtable commented that lsquothe accountant has huge responsibility in measuring the actual performance of contractors to be able [to] efficiently deliver infrastructurersquo The accountant needs to be at the forefront of providing the public sector assurance that the project is being delivered as contracted and according to the project plan Clearly accountants in the public sector have a critical role to play in effective contract management ndash particularly by measuring project progress against agreed terms at key milestones in the delivery process
Reducing moral hazard in the PPP relationship Eriksson and Lind (2015) describe moral hazard as lsquopost-contractual opportunismrsquo There are three key parties that need to be considered in an infrastructure PPP the owner the contractors building the infrastructure and the investor Depending on the structure of the PPP contract any of these roles could be taken on to varying degrees by the government or a private partner Given the limited oversight and governance of many PPPs cited in the roundtable discussions the agents of a PPP project (ie the contractors) will often have the incentive to reduce costs by cutting corners in the projectrsquos execution
Investor Contractor
Owner
40
How accountants can bridge the global infrastructure gap | 5 Delivering projects the publicndashprivate relationship
41
54 BREAKING DOWN BARRIER 2 BY IMPROVING THE INCENTIVES AND RECONCILING DIFFERING VALUE ASSUMPTIONSThe member survey compared the perceptions of public and private sector accountants revealing areas where differing assumptions exist between these parties The survey divided respondents into those working in the public sector and those in the private sector Each group was asked in what ways the other sector provided and received value in PPP infrastructure projects Comparing these results demonstrates where the public and private sectors had a similar view on the purpose of a PPP relationship and where their assumptions on the purpose of the relationship differed (Figure 53) These insights are helpful in highlighting divergent views on the role of each sector where incorrect assumptions can harm the ability of a PPP to deliver a project
Comparing the results from each sector in Figure 53 shows that there was broad agreement on how the private sector adds value to infrastructure projects The ordering of the responses was the same for professionals across the two sectors with the majority of respondents from both sides agreeing that the private sector contributes to the partnership through its knowledge of best practice the application of innovation and access to private capital Interestingly respondents from both sectors were less likely to see risk transfer as an area where the private sector provides value The
These three stakeholders shown in Figure 52 will often have different motivations For example the owner might want to increase the scope of the contract after it is agreed For this reasonaccountants must assess the risks balance the costs and schedule and proactively communicate with all stakeholders to support the success of the project
Allocating risk to reduce moral hazardA CPA Canada roundtable participant rightly identified that lsquothe key areas of interface [between the public and private sector] are between the risks retained by the public sector and their impact on the private sectorrsquos ability to deliver on their contractual commitmentsrsquo Getting this allocation of risk right can significantly improve the prospects that a PPP project will be completed on time and on budget as the right risk balance will act as an incentive to meet contractual obligations (Mann 2018)
Accountants play a clear role here The professional team delivering a project will be aided by an accountantrsquos expertise of risk management ndash particularly the accountantrsquos ability to allocate risk appropriately between the parties in order to minimise moral hazard Although the size and nature of the public sector suggests that it is better placed to bear risk skilled finance professionals will seek to balance the allocation of risks to the private parties such that they maintain the incentive to perform contractual obligations to a high quality standard
Comparing the results from each sector in Figure 53 shows that there was broad agreement on how the private sector adds value to infrastructure projects
Source The Global Infrastructure Gap survey all respondents n 3611
70
60
50
40
30
20
10
0Applying innovative
practices and fresh thinking
Knowledge of best practice and expertise
n Private sector view n Public sector view
Access to private capital
Delivering projects on time
Keeping projects to budget
Transferring risk Dont know None of these
FIGURE 53 Where does the private sector add value in delivering infrastructure
42
How accountants can bridge the global infrastructure gap | 5 Delivering projects the publicndashprivate relationship
assumptions about how each party adds value to an infrastructure PPP contract ndash and suggests that public sector actors overestimate the value of the financial arrangements on offer to private sector partners
The UK Guarantees Scheme (UKGS) offers an example of a good practice that could help improve the private sector incentive for entering PPPs and partially reconciles the differing assumptions of value between both sectors The UK Infrastructure and Projects Authority states that the UKGS lsquosupports private investment in UK infrastructure projects It works by offering a government-backed guarantee to help infrastructure projects access debt finance where they have been unable to raise finance in the financial markets The UKGS can issue up to pound40 billion of guarantees and is open to at least 2026rsquo (UK Government 2017) This long-term commitment guarantees the payment of principal and interest on infrastructure debt and is intended to support lsquonationally significantrsquo projects If well implemented schemes like this can encourage additional private sector involvement in the provision of infrastructure ndash but should be balanced against the need to reduce the risk of moral hazard discussed earlier in this chapter
comparison of perceptions also showed that public sector respondents were slightly more positive about the overall value that private sector actors bring to the relationship
There was considerable divergence in opinion between sector respondents as to the areas where the public sector provided value in an infrastructure PPP (Figure 54)
Public sector respondents were much more likely to argue that they provided both a lsquolong-term and stable partnershiprsquo (62) and knowledge of how the public sector works (60) than their private sector colleagues (45 and 43 respectively) Finance professionals from the public sector were also more likely to claim that they provided the private sector with access to projects (45) compared with 35 in the private sector At the same time there was an agreement that the public sector was less likely to offer knowledge of best practice and innovation to a PPP relationship Therefore both sides took a largely similar view of the origin of knowledge and expertise but the public sector respondents were more optimistic about the value they provided as a financial partner in infrastructure projects Understanding this divergence of viewpoint is helpful in identifying the
There was considerable divergence in opinion between sector respondents as to the areas where the public sector provided value in an infrastructure PPP (Figure 54)
Source The Global Infrastructure Gap survey all respondents n 3611
70
60
50
40
30
20
10
0Long-term and
stable partnershipKnowledge of how the
public sector works
n Private sector view n Public sector view
Access to projects Knowledge of best practice and expertise
Applying innovative practices and fresh thinking
None of these Dont know
FIGURE 54 Where does the private sector receive value from the public sector in delivering infrastructure
How accountants can bridge the global infrastructure gap | 5 Delivering projects the publicndashprivate relationship
To ensure that an infrastructure project is successful strong commercial acumen is essential team members require lsquobusiness savvyrsquo a keen understanding of the market in which the project is being undertaken
55 BREAKING DOWN BARRIER 3 BY FACILITATING PUBLIC SECTOR ACCESS TO BUSINESS EXPERTISE To ensure that an infrastructure project is successful strong commercial acumen is essential team members require lsquobusiness savvyrsquo a keen understanding of the market in which the project is being undertaken Nonetheless as Ajith Lekshmanan a participant in the UK roundtable pointed out
lsquoFor a lot of these projects the [public sector] organisation may just be doing it the one time Itrsquos a one-off and these experts that we are going to [in the private sector] theyrsquove got a whole pool of people doing similar things year after year day after day in this country and other countries The skills required are quite specialist and to train a member of staff [in the public sector] to do it just for the one time that you might be using it is not cost effectiversquo
A public sector entity might manage a large-scale infrastructure project and gain valuable expertise in the process but that expertise may not be accessible to other public sector entities for leveraging in their own infrastructure projects In the public sector project-delivery expertise thus exists in silos It is often the private partners in a PPP who through repeated projects acquire the commercial acumen and therefore potentially hold the expert lsquoreinsrsquo
Centralisation of public sector skills may facilitate removal of this barrier For example the UK Civil Service has created Centres of Excellence that seek to pool the pockets of expertise that exist in the public sector such that any organisation within the public sector can refer to these centres and draw on their specialist skill and thus act as a competent client The professional accountant offers specialist skill and should certainly be a key player in any centre of excellence In fact the accountantrsquos role as an expert team member in such centres may provide as stated by a participant in the Malaysian round table ldquobetter marketing of how the profession contributes to society to encourage professionals to continue doing the right thing and be proud of itrdquo
Centralisation of skills will not however be the answer for all governments Others might seek to encourage cross-departmentministry collaboration to facilitate effective knowledge transfer of commercial acumen across the public sector In both cases collaboration is essential for effective knowledge transfer and as previously outlined the professional accountant with an understanding of life-cycle considerations and with professional frameworks for sound professional judgement and ethics is well-equipped to coordinate such collaboration
43
6 The role of the accountant in bridging the gap
61 CURRENT INFRASTRUCTURE PROJECTS THE MISSING TEAM MEMBER The successful provision of public infrastructure requires governments to have the right professional team in place And yet a clear message resounded from the international roundtable discussions a key player is often missing from the infrastructure project team ndash the accountant A representative at the Malaysian roundtable echoed the sentiment expressed by other participants worldwide that accountants are often only invited to comment on infrastructure projects that have already been selected lsquoSo the harm has been donersquo
As pointed out by a participant in the UK roundtable the role of the accountant has evolved over the years from a focus on lsquoguidelines parameters tick boxes and flowchartsrsquo to a much lsquowider awarenessrsquo Certainly the fact that accountants around the globe work within diverse segments of the economy and serve in key roles such as CEO and CFO and as consultants attests to that lsquowider awarenessrsquo The role of the accountant is at the centre of the planning process and not only in the areas of infrastructure policy The accountant can put the lsquonumbersrsquo on ideas and concepts by applying consistent methodology to ensure they are evaluated against other options for meeting policy goals
Future infrastructure projects the essential team member The previous chapters examined the barriers associated with three fundamental phases of infrastructure projects project selection project financing and project delivery With modern qualifications that facilitate barrier removal in each of these phases the accountant plays an essential role in bridging the global infrastructure gap
The international roundtable participants highlighted the following core competencies
a) Planning and selection of projects The accountant
bull develops strategy identifies goals objectives and ensures they can be achieved (giving consideration to financial constraints and potential monetary gains)
bull sets frameworks and uses standard assessment tools to ensure accountability and transparency and prioritisation according to evidence of need
bull questions project assumptions and assesses alternative scenarios
bull employs mechanisms to ensure ethical behaviour and to eliminate corruption while offering sound risk assessment
bull supports organisationsrsquo holistic decision-making in a way that accounts for the impact of climate change on strategy risk and operational and financial performance thus enhancing organisational resilience
b) Financing projects The accountant
bull considers sustainable finance options including climate-change adaptation and resiliency needs
bull assesses financial viability and identifies long-term impact and strategies for risk mitigation
bull acts as a visionary by providing sound life-cycle advice to decision makers and giving them better understanding of the long-term financial difference between maintaining services and enhancing services and of how the latter can create greater cost pressures over time
bull supports clearer and more objective public discourse increases public awareness of risks and supports taxpayersrsquo better understanding of the value of projects
c) Delivering projects and oversight The accountant
bull implements the required monitoring and oversight
44
How accountants can bridge the global infrastructure gap | 6 The role of the accountant in bridging the gap
Accountants offer important competencies to any business team in any sector But in the face of possible misconceptions of the role of accountants what is the way forward onto the professional infrastructure team
bull allocates project risk between parties of a PPP to reduce moral hazard
bull is supported by several frameworks (eg ICAS 2012 KPMG 2013) for professional judgement and ethics that promote the use of logic flexibility consistency reliability relevant evidence unbiased information and alternative framing to avoid precipitous decisions and that promote a balance of experience knowledge and emotion
62 NEXT STEPS TOWARD THE INFRASTRUCTURE TEAM Accountants offer important competencies to any business team in any sector But in the face of possible misconceptions of the role of accountants what is the way forward onto the professional infrastructure team The international roundtable participants made the following recommendations
bull Increase awareness of the accountantrsquos qualifications as a strategic business adviser and as an essential member of the professional infrastructure team alongside the engineers and architects
bull Equip accountants to voice arguments that are compelling both to political leaders and to the general public
bull Offer elected officials the opportunity to gain financial training from accountants so that they understand the true costs and are better equipped to act as financial ambassadors
bull Establish an accountant-informed certification process for project selection
bull Develop and implement clearer governance structures and decision-making processes that involve the finance function
bull Institute whistle-blowing protection legislation for accountants internationally
45
7 Recommendations based on observed good practice
To tackle the growing global infrastructure gap this report offers a variety of observations and international good practices Below is a summary of the recommendations arising from the reportrsquos analysis demonstrating the variety of functions and actions in which accountants can lead to help close the infrastructure gap
71 SELECTING PROJECTS Chapter 3 demonstrated that the lack of standard assessment tools and ineffective political decision-making hampered project selection To help address these challenges some countries establish expert-led bodies to forecast infrastructure need and make recommendations to government as to which projects to build Governments should also balance maintenance and new infrastructure spending by disaggregating expenditure on maintenance and new projects while prioritising the backlog of maintenance to ensure that assets remain in serviceable condition
To improve decision-making further accountants should collect better data on the service potential of existing infrastructure as well as the performance of past projects Together these data will allow accountants to offer new insights to inform the project selection process To reduce the bias towards large projects over maintenance governments should disaggregate expenditure on infrastructure to report both maintenance and new project spend
This report found that there is no standard project selection process for infrastructure projects used by governments around the world and that the underlying need ndash or service gap ndash is not well established or proven Therefore accountants must take the lead in applying selection standards such as the Project Management Body of Knowledge (Project Management Institute 2017) guide and the World Bankrsquos Investment Project Financing (World Bank 2016) policy to structure decision-making better and move beyond short-term thinking and biases
There is also a growing need to build climate change risk into long-term planning and the decision-making on project selection The Montreal Canada case example (see Chapter 3 Box 32) shows how accountants should produce cost-benefit analysis and business cases to embed adaptation and resilience into municipal infrastructure decisions
In summary governments should 1 Establish expert-led bodies to forecast
infrastructure requirements and recommend projects on the basis of need
2 Collect reliable data on the service potential of existing infrastructure and on the performance of past projects
3 Disaggregate expenditure on infrastructure to report both maintenance and new project spend
Accountants should 4 Take the lead in applying standard
selection tools to determine the need for and priority of a project
5 Advise on the distributional impact and regional growth outcomes of selecting particular projects good practice in this area can be found in Japan
6 Embed adaptation and resilience into the project-selection process
46
How accountants can bridge the global infrastructure gap | 7 Recommendations based on observed good practice
Governments should direct supreme audit institutions to monitor the interaction of off balance sheet liabilities and fiscal targets
72 FINANCING INFRASTRUCTURE PROJECTS
assets Officials in New South Wales Australia were able to unlock an additional AUS$33bn to invest in public infrastructure by adopting a total balance sheet perspective (see Chapter 4 Box 42) Accountants should disaggregate public assets in the balance sheet to include commercial social and financial assets This information will be especially effective for identifying underused commercial assets but it is also important to be aware of overall value for money for citizens when selling an asset (eg selling a public asset that was previously free to use but will now attract a user charge imposed by the private sector owner)
Chapter 4 on financing infrastructure highlights three key barriers closing the funding gap accounting for the higher cost of private capital and the need to professionalise the public sector finance function
This report identifies emerging and good practices from around the world that help reduce the funding gap Decision-makers should consider innovative solutions to closing the funding gap such as a value capture and civic crowdfunding For example the MTR Corporation in Hong Kong demonstrates that implementing a transport model that captures the positive externalities of new transit can make some public infrastructure self-funding (see Box 41)
To ensure value for money in infrastructure policy accountants must advise public sector decision-makers on how to make efficient capital allocations A real challenge in this respect is the interaction of fiscal targets and off balance sheet (OBS) liabilities Chapter 4 showed that some countries such as Portugal and the UK have accumulated significant OBS liabilities Therefore countriesrsquo supreme audit institutions should monitor the interaction of OBS liabilities and fiscal targets At the same time finance officials in government should advocate a more holistic approach to maintaining fiscal discipline beyond a few top-line indicators such as debt to GDP or public sector net borrowing
To improve the efficient allocation of public funds long-term infrastructure plans should be aligned with the annual budget process that sets out capital and operating budgets Effective capital budgeting can improve public finances such that departments or ministries do not need to rely on flexibility of unitary charges to meet infrastructure needs
Many national accounts operating on a cash basis treat investment in public infrastructure as a cost instead of recognising a new asset on the public sectorrsquos balance sheet Governments should adopt full accrual accounting and maintain a public sector balance sheet Public sector accountants should also conduct a balance sheet review to maximise the value of public sector
New Zealand has taken the lead in public financial management practices not just through the adoption of accrual accounting but because their public sector accountants produce an intertemporal balance sheet (see Chapter 4 Table 41) (Government of New Zealand 2018) Accountants producing this analysis provide decisions-makers with a better long-term view of their policy decisions and can help improve the sustainability of public finances
In summary governments should 7 Consider innovative solutions for
closing the funding gap such as a value capture civic crowdfunding and other revenue funding schemes
8 Direct supreme audit institutions to monitor the interaction of off balance sheet liabilities and fiscal targets in order to improve the efficient allocation of public sector funds
9 Align long-term infrastructure plans with the annual budget process in order to minimise the use of higher-cost private finance to achieve capital budget flexibility
10 Adopt full accrual accounting and maintain a public sector balance sheet to support decision-making on infrastructure policy
Accountants should 11 Advocate a more holistic approach to
maintaining fiscal discipline to avoid poor financial decisions driven by lsquofiscal illusionsrsquo
12 Conduct a balance sheet review to maximise the value of public sector assets
47
How accountants can bridge the global infrastructure gap | 7 Recommendations based on observed good practice
Professional bodies can also contribute to the improvements in public sector expertise by facilitating knowledge transfer between the public and private sector through thought-leadership events and roundtable discussions
13 Produce an intertemporal balance sheet to improve long-term decision-making and support the sustainability of public finances as is done for example in New Zealand
14 Produce disaggregated assets in the balance sheet to include commercial social and financial assets ndash in order to improve the return on public assets
73 DELIVERING INFRASTRUCTURE PROJECTS AND THE PUBLIC-PRIVATE RELATIONSHIP Chapter 5 highlights three key barriers to implementing infrastructure projects poor monitoring and oversight of projects by government confusion as to where each side provides value in a PPP and lack of commercial acumen in the public sector
To address these barriers and successfully deliver infrastructure projects governments need to look to accountants to implement the necessary monitoring and oversight of their PPP relationships There is also a clear need for effective mechanisms for reducing corruption which was cited as a key action in the member survey The implementation of effective whistle-blowing legislation and the professionalisation of the public sector finance function will allow public servants to challenge unethical behaviour that can derail infrastructure projects
Chapter 6 demonstrated that moral hazard can limit the probability that infrastructure PPPs will be completed on time on budget and to an acceptable level of quality The allocation of risk between the partners in a PPP can play a central role in reducing this moral hazard by putting the right incentives in place for the contractor Therefore professional teams delivering infrastructure should rely on an accountantrsquos expertise of risk management to minimise moral hazard by allocating risks fairly between the parties
Public sector negotiators should reflect on the assumptions identified in the member survey and consider that private finance professionals were less likely than their public sector counterparts to view the public sector as a stable partner or as a sector that provided access to longshyterm projects To mitigate this mismatch governments should consider introducing guarantee schemes for nationally
significant infrastructure projects in order to encourage additional private sector involvement in the provision of infrastructure
As a result of the varied commercial acumen in the public sector governments should consider establishing centres of excellence to coordinate public sector expertise in contract management so that any organisation within the public sector can draw on that specialist skill when negotiating a PPP contract Professional bodies can also contribute to the improvements in public sector expertise by facilitating knowledge transfer between the public and private sector through thought-leadership events and roundtable discussions
In summary governments should 15 Enact effective whistle-blowing
legislation and professionalise the public sector finance function to allow public servants to challenge unethical behaviour that can derail infrastructure projects
16 Establish centres of excellence that coordinate public sector expertise in contract management which allows any organisation within the public sector to draw on the specialist skill when negotiating a PPP contract
17 Consider introducing guarantee schemes for nationally significant infrastructure projects in order to encourage additional private sector involvement in infrastructure projects This will help address the assumptions identified in themember survey which showed that private finance professionals were less likely to view the public sector as a stable partner
Accountants should 18 Implement proper monitoring and
oversight for all projects
19 Advocate embedding themselves in the professional teams delivering infrastructure by highlighting their expertise of risk management
Professional bodies should 20 Act as facilitators of knowledge
transfer between the public and private sector through thought-leadership events and roundtables
48
49
Conclusion
The global infrastructure investment gap is set to grow to US$14 trillion by 2040 and this figure sets the benchmark for meeting the worldrsquos infrastructure needs
In reality however the challenge in fulfilling a countryrsquos infrastructure need is not achieving a notional investment figure but rather establishing a government vision for closing a recognised service gap by either maintaining existing infrastructure assets and or by building new projects
Currently governments lack adequate resources and the capability to make systematic infrastructure decisions because they are not able to harness the benefits of the investment and mitigate the significant risks associated with infrastructure project execution Bringing the accountant to the centre of the decision-making process for infrastructure projects can mitigate these pitfalls The particular skills and perspective of the finance professional can mean the difference between success and failure through improvements in project selection securing financing delivery and oversight of the projects
As the next generation of infrastructure projects are planned financed built and operated the accountant must be brought to the centre of the decision-making process The accountant must be employed across the entire life cycle of future infrastructure projects as a critical member of the professional team if the world is to address the global infrastructure gap
Appendix A Detailed methodology for establishing the infrastructure investment gap
This appendix examines the key features of the G20 Global Infrastructure Outlook methodology (GHI and Oxford Economics 2018) in order to summarise how the global regional and national estimates of the infrastructure gap used in Chapter 1 of this report were determined For a complete understanding the of the original work the Global Infrastructure Outlook report has a comprehensive treatment of the analytical process
A1 DEFINITION OF INFRASTRUCTURE The Global Infrastructure Outlook report defines infrastructure investment as lsquoGross Fixed Capital Formationrsquo (GFCF) by the public and private sectors on fixed immovable assets that support long- term economic growthrsquo (GHI and Oxford Economics 2018) GFCF is a wider definition of investment than just that for infrastructure and so the calculations included for the purposes of this report exclude land and any moveable assets such as IT equipment The definition does however include both the development of new assets and spending on the replacement or maintenance of existing assets
A2 CURRENT INVESTMENT TRENDS Current investment was calculated for a total of 50 countries using data from multinational data sources such as the OECD or Eurostat where possible If the required data was not available from these sources then national statistics were used to create a comparable estimate Failing that data was imputed using econometric techniques The Global Infrastructure Outlook report was completed during 2016 and includes the most up-to-date datasets collected providing values to 2015 so the forecast years begin at 2016 and continue to 2040 Before 2016 no infrastructure gap was estimated so the charts in Chapter 1 and Appendix B reflect current trends only to 2016
For each country and sector the stock of infrastructure per head was calculated and a set of explanatory factors were determined for each sector eg population density structure of the economy These explanatory variables were projected forwards on the basis of national economic and demographic forecasts to estimate infrastructure investment under current trends for each country
A3 INVESTMENT NEEDS The extent to which each country dedicates resources to infrastructure investment was adjusted for the quality of infrastructure using indicators from the World Economic Forum Global Competitiveness Report (Schwab 2018)
The lsquoquality-adjustedrsquo performance measures were then compared across countries using the performance of countries at the 75th percentile among those of similar income levels as the benchmark The investment-need scenario indicated the extent of infrastructure investment by sector and country which would be required to meet this benchmark level Income groups were based on three World Bank definitions low- and lower-middle income upper-middle income and high income For countries that were already positioned above the 75th percentile (ie the target) the objective in the years ahead is to sustain relatively high levels of investment and maintain their strong performance As a result the minimum value for the investment gap is 0 ndash where those countries in the upper quartile must maintain their performance and their peersrsquo target is to attempt to catch up
50
The following account offers a regional breakdown and description of the global infrastructure investment gap covering Africa the Americas Asia Europe and Oceania
B1 AFRICAIn 2018 an estimated US$1328bn was spent on infrastructure in Africa Meanwhile US$1777bn of investment is estimated to be required in the region putting the infrastructure investment gap at US$455bn Cumulatively between 2018 and 2040 the infrastructure investment gap is expected to stand at US$159 trillion with the amount of infrastructure investment needed expected to be 39 higher than under current trends
51
Appendix BRegional breakdown of the global investment gap and additional service gap analysis
350
300
250
200
150
100
50
0
Investment need Current trends
2007
2008
2009
2010
2011
2012
2013
2014
2015
2016
2017
2018
2019
2020
2021
2022
2023
2024
2025
2026
2027
2028
2029
2030
2031
2032
2033
2034
2035
2036
2037
2038
2039
2040
FIGURE B1 Investment need and current trends in Africa 2015 US$ billions
Source GHI and Oxford Economics 2018
TABLE B1 Projected infrastructure investment and gaps among African countries 2018ndash40 2015 prices
COUNTRY
Angola
Benin
INFRASTRUCTURE INVESTMENT USD BILLIONS
$2514
$199
INFRASTRUCTURE INVESTMENT GAP USD BILLIONS
$920
$134
DIFFERENCE BETWEEN INVESTMENT NEED AND INVESTMENT FORECAST
37
67
Cote dIvoire $614 $129 21
Egypt
Ethiopia
Ghana
$4186
$4215
$685
$2182
$1467
$421
52
35
61
Guinea $167 $140 84
Kenya
Morocco
$1742
$1967
$371
$348
21
18
Nigeria
Rwanda
$6168
$295
$2103
$96
34
33
Senegal
South Africa
$578
$2696
$181
$1442
31
53
Tanzania $1943 $1095 56
Tunisia $502 $206 41
Source GHI and Oxford Economics 2018
52
How accountants can bridge the global infrastructure gap | Appendix B
B2 AMERICASIn 2018 it was anticipated that an estimated US$4771bn would be spent oninfrastructure in the Americas In the sameyear investment need was forecast to be 38 higher at US$6570bn and over the full 2018 to 2040 period the infrastructure investment gap is expected to grow to US$6126 trillion This implies that infrastructure need will be 48 higher than actual investment over the period given the current trend in the Americas
12
1
08
06
04
02
0
Investment need Current trends
2007
2008
2009
2010
2011
2012
2013
2014
2015
2016
2017
2018
2019
2020
2021
2022
2023
2024
2025
2026
2027
2028
2029
2030
2031
2032
2033
2034
2035
2036
2037
2038
2039
2040
FIGURE B2 Investment need and current trends in the America 2015 US$ trillions 2018ndash40
Source GHI and Oxford Economics 2018
TABLE B2 Projected infrastructure investment and gaps among nations in the Americas 2018ndash40 2015 prices
COUNTRY
Argentina
Brazil
INFRASTRUCTURE INVESTMENT USD BILLIONS
$4220
$14207
INFRASTRUCTURE INVESTMENT GAP USD BILLIONS
$3392
$11266
DIFFERENCE BETWEEN INVESTMENT NEED AND INVESTMENT FORECAST
80
79
Canada $11243 $194 2
Chile $1978 $499 25
Colombia $2231 $949 43
Ecuador $743 $523 70
Mexico $4874 $5153 106
Paraguay
Peru
$546
$3072
$165
$675
30
22
US $79637 $36089 45
Uruguay $458 $91 20
Source GHI and Oxford Economics 2018
53
How accountants can bridge the global infrastructure gap | Appendix B
B3 ASIAAmong all nations the top four countries by investment need (China India Japan and the US) account for over half of global need three of these countries are found in Asia Despite this the infrastructure gap is lower in percentage terms across Asia than the other regions and across the 2018 to 2040 period Asian countries would need to increase spending by around 10 to meet their projected investment need The sheer size of the continent means that while relatively small as a proportion of current spending this level of underinvestment creates an infrastructure investment gap of US$43 trillion over the same period
30
25
20
15
10
05
0
Investment need Current trends
2007
2008
2009
2010
2011
2012
2013
2014
2015
2016
2017
2018
2019
2020
2021
2022
2023
2024
2025
2026
2027
2028
2029
2030
2031
2032
2033
2034
2035
2036
2037
2038
2039
2040
FIGURE B3 Investment need and current trends in Asia 2015 US$ trillions 2018ndash40
Source GHI and Oxford Economics 2018
TABLE B3 Projected infrastructure investment and gaps among Asian countries 2018ndash40 2015 prices
COUNTRY
Azerbaijan
Bangladesh
Cambodia
INFRASTRUCTURE INVESTMENT USD BILLIONS
$862
$3931
$560
INFRASTRUCTURE INVESTMENT GAP USD BILLIONS
$76
$1821
$266
DIFFERENCE BETWEEN INVESTMENT NEED AND INVESTMENT FORECAST
9
46
48
China $248858 $18307 7
India $37045 $4995 13
Indonesia $15445 $667 4
Kazakhstan $1955 $792 41
Japan
Jordan
$34810
$591
$868
$168
2
29
Malaysia
Myanmar
Pakistan
$3588
$1050
$3351
$725
$1064
$1179
20
101
35
Philippines
Saudi Arabia
$4031
$4654
$653
$1089
16
23
Singapore
South Korea
$878
$12767
$03
$386
0
3
Thailand $3677 $950 26
Turkey
Vietnam
$5328
$4741
$3841
$968
72
20
Source GHI and Oxford Economics 2018
08
07
06
05
04
03
02
01
0
Investment need Current trends
2007
2008
2009
2010
2011
2012
2013
2014
2015
2016
2017
2018
2019
2020
2021
2022
2023
2024
2025
2026
2027
2028
2029
2030
2031
2032
2033
2034
2035
2036
2037
2038
2039
2040
54
How accountants can bridge the global infrastructure gap | Appendix B
B4 EUROPETotal spending on infrastructure in Europe was forecast to be US$457bn in 2018 in contrast to a projected requirement of US$512bn This investment gap of 11 is projected to grow to US$189 trillion or 16 of the total infrastructure investment needed over the period 2018ndash40
FIGURE B4 Investment need and current trends in Europe 2015 US$ trillions 2018ndash40
Source GHI and Oxford Economics 2018
TABLE B4 Projected infrastructure investment and gaps among European countries 2018ndash40 2015 prices
COUNTRY
Croatia
INFRASTRUCTURE INVESTMENT USD BILLIONS
$591
INFRASTRUCTURE INVESTMENT GAP USD BILLIONS
$101
DIFFERENCE BETWEEN INVESTMENT NEED AND INVESTMENT FORECAST
17
France $16823 $96 1
Germany
Italy
Poland
$13544
$11449
$5143
$07
$3530
$865
0
31
17
Romania $2103 $104 5
Russia $9887 $6892 70
Spain
UK
$9977
$15496
$538
$1403
5
9
Source GHI and Oxford Economics 2018
55
How accountants can bridge the global infrastructure gap | Appendix B
B5 OCEANIADespite the large area covered by the Oceania continental region its relatively small population means the total infrastructure investment need is less thanfor the other regions A further US$18 trillion total spending is likely to be required between 2018 and 2040 although on current trends a shortfall of US$171bn is forecast to emerge over the same period This would represent an infrastructure gap of 10
120
100
80
60
40
20
0
Investment need Current trends
2007
2008
2009
2010
2011
2012
2013
2014
2015
2016
2017
2018
2019
2020
2021
2022
2023
2024
2025
2026
2027
2028
2029
2030
2031
2032
2033
2034
2035
2036
2037
2038
2039
2040
FIGURE B5 Investment need and current trends in Oceania 2015 US$ billions 2018ndash40
Source GHI and Oxford Economics 2018
TABLE B5 Projected infrastructure investment and gaps among countries in Oceania 2018ndash40 2015 prices
COUNTRY INFRASTRUCTURE INVESTMENT USD BILLIONS
INFRASTRUCTURE INVESTMENT GAP USD BILLIONS
DIFFERENCE BETWEEN INVESTMENT NEED AND INVESTMENT FORECAST
Australia $14462 $1499 10
New Zealand $1522 $166 11
Source GHI and Oxford Economics 2018
56
How accountants can bridge the global infrastructure gap | Appendix B
B6 ADDITIONAL INFRASTRUCTURE SERVICE GAP FIGURES BY WORLD REGIONThe following charts compare the views of finance professionals on the remaining four sub-types of infrastructure not included in the main report water and sanitation other transport (eg ports and airports) railways and core public infrastructure (eg hospitals and schools)
Source The Global Infrastructure Gap survey specialist respondents only n 1966
FIGURE B6 Infrastructure quality ndash water and sanitation
North America
100
80
60
40
20
0
n Dont know n Very good n Good n Neutral n Poor n Very poor
Middle East Asia Pacific Central and Eastern Europe
South Asia Western Europe Africa Caribbean Total
Source The Global Infrastructure Gap survey specialist respondents only n 1966
FIGURE B7 Infrastructure quality ndash other transport
North America
100
80
60
40
20
0
n Dont know n Very good n Good n Neutral n Poor n Very poor
Middle East Asia Pacific Central and Eastern Europe
South Asia Western Europe Africa Caribbean Total
57
How accountants can bridge the global infrastructure gap | Appendix B
FIGURE B8 Infrastructure quality ndash railways
FIGURE B9 Infrastructure quality ndash core public service infrastructure
Source The Global Infrastructure Gap survey specialist respondents only n 1966
North America
100
80
60
40
20
0
n Dont know n Very good n Good n Neutral n Poor n Very poor
Middle East Asia Pacific Central and Eastern Europe
South Asia Western Europe Africa Caribbean Total
Source The Global Infrastructure Gap survey specialist respondents only n 1966
North America
100
80
60
40
20
0
n Dont know n Very good n Good n Neutral n Poor n Very poor
Middle East Asia Pacific Central and Eastern Europe
South Asia Western Europe Africa Caribbean Total
Appendix C The Global Infrastructure Gap Survey and Roundtable Discussion Guide
MEMBER SURVEY
Q1 What is your current employment status Full-time or part-time an accounting or finance role Full-time or part-time work in a non-accounting role Not currently in employment Self-employed Retired
Response treated as lsquogeneralistrsquo
Q2 [If employed]In which sector do you work Please tick the one box that best fits your sector Big Four accounting firm Corporate sector - small medium sized Corporate sector ndash large Financial services - small medium sized Financial services ndash large Mid-tier accounting firm Not-for-profit Other international accounting firm Public sector Small or medium-sized practice (SMP) Other (please specify)
Q3 [If employed]Does your work involve any of the following
Infrastructure policy Procurement Capital budgeting Project management or Operations management
Yes (respondent categorised as a lsquospecialistrsquo) No (respondent categorised as a lsquogeneralistrsquo)
Q4 How would you describe the quality of each type of infrastructure in the country where you live Power and energy Water and sanitation Roads and highways Railways Other transport (eg air and sea)
Information and communication technology (eg internet access and mobile service)
Core public service infrastructure (eg hospitals schools emergency services)
Scale 1 ndash Very poor 2 ndash Poor
4 ndash Good 5 ndash Very good Donrsquot know
Q5 What are the biggest barriers in meeting the infrastructure needs in your country Lack of finance andor funding Lack of political leadership Skills and talent shortage Planning and regulatory barriers Corruption Lack of competition Other please specify None
Q6a [To generalists]Over the next 5 years do you feel the infrastructure in your country will Significantly deteriorate Deteriorate Remain the same Improve Significantly improve Donrsquot know
Q6b [To specialists]Over the next 5 years do you feel that each of these types of infrastructure in your country will Power and energy Water and sanitation Roads and highways Railways Other transport (eg air and sea)
Information and communication technology (eg internet access and mobile service)
Core public service infrastructure (eg hospitals schools emergency services)
Scale Significantly deteriorate Deteriorate Remain the same Improve Significantly improve Donrsquot know
Q7 Do you feel the government selects projects that provide the most value to the taxpayer Never Infrequently Sometimes Frequently Always Dont know
58
3
How accountants can bridge the global infrastructure gap | Appendix C
Q8 Which of the following do you feel the government in your country should prioritise to make the best decisions when selecting infrastructure projects Please select up to five which you feel are the most important and rank them by order of importance Please drag and drop your selections from the left box to the right box and order with most important at the top and least at the bottom
Adhering to global accounting standards
Removing political decision-making making the process technocratic (ie decisions by experts)
Putting in place mechanisms to reduce corruption
Moving government accounts from cash to accrual accounting
Bringing OOBs (Obligations Off Balance-Sheet) onto government balance sheets
Quantifying the total life-cycle costs of potential projects
Spending more resource to evaluate projects after completion
Applying standard assessment tools to evaluate projects during selection
Transferring project selection powers to more local levels of government (ie devolution)
Other please specify
Q8a [To CPA Canada respondents only]How important is it that infrastructure planning include the following sustainability considerations Efficient use of energy including where appropriate renewable sources of energy
Adapting to the impacts of a changing climate such as severe weather events
Minimizing environmental impacts on the surrounding community by for example locating near accessible public transit
Reducing or eliminating the production of waste hazardous by-products or other environmental externalities
Assessing the potential of and taking every reasonable step to reduce or eliminate the likelihood of an environmental accident (such as a pipeline spill for example)
Scale 1 - Not important at all 2- Not very important
4 - Quite important 5- Very important 6 - Donrsquot know
Q9a [To generalists]How should infrastructure be financed in your country Entirely public finance Mostly public finance Even mix of public and private finance Mostly private finance Entirely private finance Dont know no opinion
Q9b [To specialists]How should infrastructure be financed in your country (eg a sovereign wealth fund provides the money upfront to build a road) Power and energy Water and sanitation Roads and highways Railways Other transport (eg air and sea)
Information and communication technology (eg internet access and mobile service)
Core public service infrastructure (eg hospitals schools emergency services)
Scale Entirely public finance Mostly public finance Even mix of public and private finance Mostly private finance Entirely private finance Dont know no opinion
Q10 What are your views on the role of foreign direct investment in building and maintaining infrastructure in your country Very concerned Some concern Neutral Positive Very positive Dont know
Q11 What are the key challenges that the government faces in securing private finance Select all that apply Too few viable projects for private investment Regulatory barriers Perceived political instability in my country Underdeveloped financial markets in my country Insufficient skills in government to negotiate with the private sector Negative perception of private finance for public infrastructure Lack of attractiveness of infrastructure investment Dont know Other please specify
Q12a [Asked of those working in Public sector]Where do you feel the private sector particularly adds value in delivering infrastructure projects in your country Select all that apply Knowledge of best practice and expertise
Applying innovative practices and fresh thinking
Delivering projects on time
Keeping projects to budget
Access to private capital
Transferring the risks of delivering infrastructure projects from the public sector to the private sector
None of these
Donrsquot know
59
3
How accountants can bridge the global infrastructure gap | Appendix C
Q12b [Asked of those working in Private sector]Where do you feel the public sector particularly adds value in delivering infrastructure projects in your country Select all that apply Access to projects that provide stable low risk returns Knowledge of how the public sector works Long-term and stable partnership Knowledge of best practice and expertise Applying innovative practices and fresh thinking None of these Donrsquot know
Q13a [Asked of those working in Public sector]Where do you feel the private sector receives value from the public sector in delivering infrastructure projects in your country Select all that apply Access to projects that provide stable low risk returns Knowledge of how the public sector works Long-term and stable partnership Knowledge of best practice and expertise Applying innovative practices and fresh thinking None of these Donrsquot know
Q13b [Asked of those working in Private sector]Where do you feel the public sector receives value from the private sector in delivering infrastructure projects in your country Select all that apply Knowledge of best practice and expertise
Applying innovative practices and fresh thinking
Delivering projects on time
Keeping projects to budget
Access to private capital
Transferring the risks of delivering infrastructure projects from the publicsector to the private sector
None of these
Donrsquot know
Q14 Where are you primarily based [Dropdown list]
Q15 What best describes your gender identity Female Male Prefer not to say Prefer to self-describe
ROUNDTABLE DISCUSSION 1) Understanding the infrastructure gap
a) Whatrsquos the current quality of infrastructure in your country
i Why is it like this
b) How is your business or organization affected by the current quality of infrastructure in your country Please provide examples
2) How accountants can make a difference c) In your experience where do you see accountants making the
greatest difference in delivering infrastructure in your country Please give examples where possible
d) Do you feel that your country has particular good practices in meeting infrastructure need
3) Selecting projects e) How often do you t hink governments select the right projects in
your country
f) What should governments consider when making decisions about infrastructure
4) Financing projects g) Which types of infrastructure are appropriate for private finance
or operation [ie energy water roads railways other transport information and communication technology core public service infrastructure]
i Which ones are more suited to private finance
ii Private operation
h) What do you think about foreign direct investment (FDI) building new infrastructure in your country
5) Interface of public and private i) What skills do governments need to effectively negotiate
contracts with the private sector
i Are any of these skills absent
j) When t he public and private sectors partner to complete and operate infrastructure (for example through a Public-Private Partnership)
i What does the private sector add to the partnership
ii What does the public sector add to the partnership
6) Final k) Over the next 5 years do you think the infrastructure in your
country will improve stay the same or deteriorate
i Why is t hat the case What are the key challenges in meeting the infrastructure needs in your country over the next 5 years
60
References
ACCA (2016) Smarter Cities Simpler Cities Accounting for the City of the Future Spotlight on India lthttpswwwaccaglobalcomcontentdamACCA_GlobalTechnicalFuturepi-smarter-cities-simpler-citiespdf
gt
accessed 4 February 2019
ACCA (2017) Professional Accountants ndash the Future Ethics and Trust in a Digital Age lthttpswwwaccaglobalcomcontentdamACCA_Global TechnicalFuturepi-ethics-trust-digital-agepdfgt accessed 5 February 2019
Atkins G Davies N and Kidney Bishop T (2017) Public versus Private How to Pick the Best Infrastructure Finance Option lthttpswww instituteforgovernmentorguksitesdefaultfilespublicationsInstitute_for_ Government_Infrastructure_Finance_Option_Public_Private_ November_2017_Web_Finalpdfgt accessed 5 February 2019
British Broadcasting Corporation (2015) Spains Ciudad Real airport sold at auction for euro10000 [online article] lthttpswwwbbccouknewsworldshyeurope-33578949gt accessed 6 February
Catapult Future Cities (2017) Civic Crowdfunding A Guidebook for Local Authorities lthttpsfuturecitiescatapultorgukwp-content uploads201703Civic-guidebook-pdfgt accessed 5 February 2019
Central Intelligence Agency (2019) The World Factbook lthttpswwwciagovlibrarypublicationsthe-world-factbook
gt access 7 February 2019
Chartered Institute of Purchasing and Supply (2013) Written evidence submitted by CIPS to the Public Administration Select Committee lthttps publicationsparliamentukpacm201314cmselectcmpubadm123123vw12 htmgt accessed 5 February 2019
Chartered Professional Accountants of Canada (2016) Adaptation Case Study 6 City of Montreal lthttpswwwcpacanadacaenbusiness-and-accountingshyresourcesother-general-business-topicssustainabilitypublications montreal-adapting-to-climate-changegt accessed 5 February 2019
Detter D and Folster S (2017) The Public Wealth of Cities How to Unlock Hidden Assets to Boost Growth and Prosperity (Brookings Institution Press)
Eriksson PE and Lind H (2015) Moral Hazard and Construction Procurement A Conceptual Framework lthttpswwwdiva-portalorgsmashgetdiva2783674FULLTEXT01pdf
gt accessed 5 February 2019
European Commission (2017) Communication from the Commission The Fiscal Compact ndash Taking Stock lthttpseceuropaeuinfopublications fiscal-compact-taking-stock_engt accessed 5 February 2019
Eurostat (2018) lsquoLiabilities Related to PPPs Recorded Off-Balance Sheet of Governmentrsquo downloadable from lthttpsdataeuropaeueuodpendata datasetZxMF0OGutCyj7pgQJdtaiwgt accessed 5 February 2019
Fages R Beardsley B Bromstrup I Donnadieu H Maceacute B Pardasani N Schmitz L Sheridan BTaglioni G and Xu Q (2018) Global Asset Management 2018 The Digital Metamorphosis lthttpswwwbcgcom en-gbpublications2018global-asset-management-2018-digitalshymetamorphosisaspxgt accessed 5 February 2019
Fay M Andres LA Fox C Narloch U Straub S and Slawson M (2017) Rethinking Infrastructure in Latin America and the Caribbean 2017 lthttps openknowledgeworldbankorgbitstreamhandle1098626390114110shyREVISED-PUBLIC-RethinkingInfrastructureFullpdfgt accessed 5 February 2019
Flyvbjerg B (2018) Oxford Handbook of Megaproject Management (Oxford Oxford University Press)
GHI (Global infrastructure Hub) and Oxford Economics (2018) Global Infrastructure Outlook Downloadable from lthttpsoutlookgihuborggt accessed 4 February 2019
Government of New Zealand (2018) lsquoHe Puna Hao Patiki 2018 Investment Statementrsquo lthttpstreasurygovtnzpublicationsinvestment-statementhe-puna-hao-patiki-2018-investment-statement-html
gt accessed 5
February 2019
ICAS (Institute of Chartered Accountants of Scotland) (2012) A Professional Judgement for Financial Reporting lthttpswwwicascomtechnicalshyresourcesa-professional-judgement-framework-for-financial-reportinggt accessed 6 February 2019
IFAC and CIPFA (2018) International Public Sector Financial Accountability Index lthttpswwwifacorgsystemfilesuploadsIFACIFAC-CIPFA-PublicshySector-Index-2018-Statuspdfgt accessed 5 February 2019
IJ Global (2018) H1 Infrastructure and Project Finance League Table Report lthttpsijglobalcomuploadsH120201820League20Tables20Report pdfgt accessed 5 February 2019
IMF (International Monetary Fund) (2018) Fiscal Monitor Managing Public Wealth downloadable from lthttpswwwimforgenPublicationsFM Issues20181004fiscal-monitor-october-2018gt accessed 5 February
Institute for Government (2018) lsquoFunding Infrastructurersquo [webpage] lthttps wwwinstituteforgovernmentorgukexplainersfunding-infrastructuregt accessed 5 February 2019
International Transport Forum (2017) Strategic Infrastructure Planning International Best Practice lthttpsassetspublishingservicegovuk governmentuploadssystemuploadsattachment_datafile601897Strategic_Infrastructure_FINAL_for_web_v2pdf
gt accessed 4 February
KPMG (2013) Elevating Professional Judgment in Auditing and Accounting The KPMG Professional Judgment Framework lthttpwwwdrlilliecom a544kpmgjdgmtKPMG_ProfJudgment_Monographpdfgt accessed 6 February 2019
Leong L (2016) lsquoThe ldquoRail plus Propertyrdquo Model Hong Kongrsquos Successful Self-financing Formularsquo [website article] lthttpswwwmckinseycom industriescapital-projects-and-infrastructureour-insightsthe-rail-plusshyproperty-modelgt accessed 5 February 2019
Mann H (2018) lsquoThe High Cost of lsquoDe-Riskingrsquo Infrastructure Financersquo [website article] lthttpswwwproject-syndicateorgcommentaryworldshybank-ppp-de-risking-by-howard-mann-2018-12gt accessed 5 February 2019
Marcelo D Mandri-Perrott C House S and Schwartz JZ (2016) An Alternative Approach to Project Selection The Infrastructure Prioritization Framework lthttppubdocsworldbankorgen84463146187466270016-04shy23-Infrastructure-Prioritization-Framework-Final-Versionpdfgt accessed 4 February 2019
MGI (McKinsey Global Institute) (2013) Infrastructure productivity How to save $1 trillion a year lthttpswwwmckinseycomindustriescapital-projectsshyand-infrastructureour-insightsinfrastructure-productivitygt accessed 6 February 2019
MGI (2016) Bridging Global Infrastructure Gaps lthttpswwwmckinsey com~mediaMcKinseyIndustriesCapital20Projects20and20 InfrastructureOur20InsightsBridging20global20infrastructure20gaps Bridging-Global-Infrastructure-Gaps-Full-report-June-2016ashxgt accessed 4 February 2019
Morse A (2018) PFI and PF2 Report by the Comptroller and Auditor General lthttpswwwnaoorgukwp-contentuploads201801PFI-and-PF2pdf
gt accessed 5 February 2019
61
How accountants can bridge the global infrastructure gap | References
MTR Corporation (2017) Annual Report 2017 Ten-Year Statistics lthttps wwwmtrcomhkarchivecorporateeninvestor10yr_stat_enpdfgt accessed 5 February 2019
NHS Scotland (2018) NHS Scotland Assets and Facilities 2017 Annual Report lthttpswwwgovscotpublicationsannual-state-nhsscotland-assetsshyfacilities-report-2017gt accessed 5 February 2019
NIC (National Infrastructure Commission) (2018) National Infrastructure Assessment lthttpswwwnicorgukwp-contentuploadsCCS001_ CCS0618917350-001_NIC-NIA_Accessiblepdfgt accessed 4 February 2019
OrsquoDowling-Keane A (2017) lsquoSadiq Khan Joins Crowd of Thousands with pound400000 in Backing for Londonersrsquo Local Project Ideasrsquo [website article] lthttpsaboutspacehivecomsadiq-khan-joins-crowd-of-thousands-withshy400000-in-backing-for-londoners-local-project-ideasgt accessed 5 February
OECD (Organisation for Economic Cooperation and Development) (2019) Databank tax revenue lthttpsdataoecdorgtaxtax-revenuehtmgt government debt lthttpsdataoecdorgggageneral-government-debt htmgt accessed 7 February 2019
Plimmer G (2018) lsquoDeath Knell Sounded for PFI Contractsrsquo [online article] Financial Times lthttpswwwftcomcontent55eb374e-dba5-11e8-8f50shycbae5495d92bgt accessed 6 February
Project Management Institute (2017) Guide to Project Management Book of Knowledge lthttpswwwpmiorgpmbok-guide-standardsfoundational pmbokgt accessed 4 February 2019
Schwab K (2018) Global Competitiveness Report lthttpwww3weforum orgdocsGCR201805FullReportTheGlobalCompetitivenessReport2018 pdfgt accessed 5 February 2019
Spacehive (2019) lsquoMake Your Local Area Betterrsquo [website] lthttpswww spacehivecomgt accessed 5 February 2019
UK Government (2017) UK Guarantees Scheme Guidance lthttpswwwgov ukguidanceuk-guarantees-schemegt accessed 5 February 2019
World Bank (2018a) Private Participation in Infrastructure Annual Report 2017 lthttpppiworldbankorg~mediaGIAWBPPIDocuments Global-NotesPPI_2017_AnnualReportpdfgt
World Bank (2018b) Procuring Infrastructure Public-Private Partnerships Report downloadable from lthttpspppknowledgelaborg documents5453gt accessed 5 February 2019
World Bank (2019) World Bank Open Data tax revenue lthttpsdata worldbankorgindicatorGCTAXTOTLGDZSgt government debt lthttpsdataworldbankorgindicatorGCDODTOTLGDZSgt accessed 7 February 2019
62
18002683793 wwwcpacanadaca
PI-GLOBAL-INFRASTRUCTURE-GAP
DISCLAIMER This paper was prepared by the Association of Chartered Certified Accountants (ACCA) and Chartered Professional Accountants of Canada (CPA Canada) as non-authoritative guidance
ACCA CPA Canada and the authors do not accept any responsibility or liability that might occur directly or indirectly as a consequence of the use application or reliance of this material
ACCA The Adelphi 111 John Adam Street London WC2N 6AU United Kingdom +44 (0)20 7059 5000 wwwaccaglobalcom
CPA Canada 277 Wellington St West Toronto Ontario Canada M5V 3H2
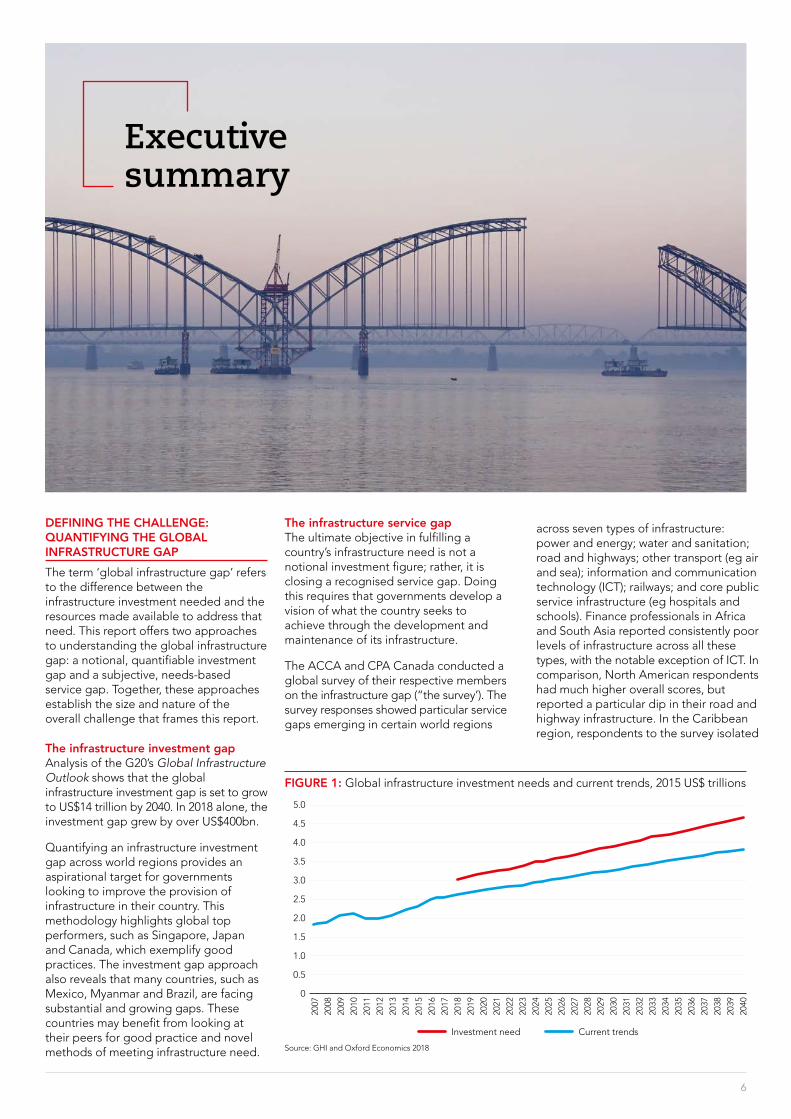
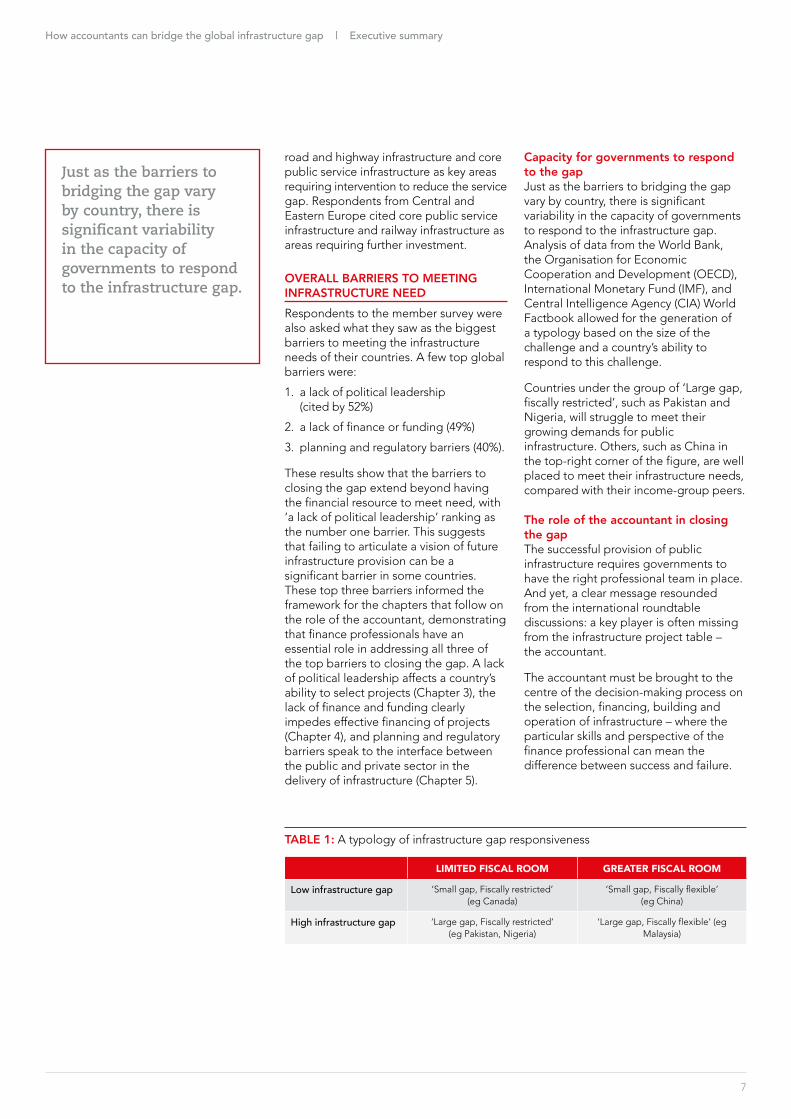
How accountants can bridge the global infrastructure gap | Executive summary
7
Just as the barriers to bridging the gap vary by country there is significant variability in the capacity of governments to respond to the infrastructure gap
road and highway infrastructure and core public service infrastructure as key areas requiring intervention to reduce the service gap Respondents from Central and Eastern Europe cited core public service infrastructure and railway infrastructure as areas requiring further investment
OVERALL BARRIERS TO MEETING INFRASTRUCTURE NEEDRespondents to the member survey were also asked what they saw as the biggest barriers to meeting the infrastructure needs of their countries A few top global barriers were
1 a lack of political leadership (cited by 52)
2 a lack of finance or funding (49)
3 planning and regulatory barriers (40)
These results show that the barriers to closing the gap extend beyond having the financial resource to meet need with lsquoa lack of political leadershiprsquo ranking as the number one barrier This suggests that failing to articulate a vision of future infrastructure provision can be a significant barrier in some countries These top three barriers informed the framework for the chapters that follow on the role of the accountant demonstrating that finance professionals have an essential role in addressing all three of the top barriers to closing the gap A lack of political leadership affects a countryrsquos ability to select projects (Chapter 3) the lack of finance and funding clearly impedes effective financing of projects (Chapter 4) and planning and regulatory barriers speak to the interface between the public and private sector in the delivery of infrastructure (Chapter 5)
Capacity for governments to respond to the gapJust as the barriers to bridging the gap vary by country there is significant variability in the capacity of governments to respond to the infrastructure gap Analysis of data from the World Bank the Organisation for Economic Cooperation and Development (OECD) International Monetary Fund (IMF) and Central Intelligence Agency (CIA) World Factbook allowed for the generation of a typology based on the size of the challenge and a countryrsquos ability to respond to this challenge
Countries under the group of lsquoLarge gap fiscally restrictedrsquo such as Pakistan and Nigeria will struggle to meet their growing demands for public infrastructure Others such as China in the top-right corner of the figure are well placed to meet their infrastructure needs compared with their income-group peers
The role of the accountant in closing the gapThe successful provision of public infrastructure requires governments to have the right professional team in place And yet a clear message resounded from the international roundtable discussions a key player is often missing from the infrastructure project table ndash the accountant
The accountant must be brought to the centre of the decision-making process on the selection financing building and operation of infrastructure ndash where the particular skills and perspective of the finance professional can mean the difference between success and failure
TABLE 1 A typology of infrastructure gap responsiveness
LIMITED FISCAL ROOM GREATER FISCAL ROOM
Low infrastructure gap lsquoSmall gap Fiscally restrictedrsquo(eg Canada)
lsquoSmall gap Fiscally flexiblersquo(eg China)
High infrastructure gap lsquoLarge gap Fiscally restrictedrsquo(eg Pakistan Nigeria)
lsquoLarge gap Fiscally flexiblersquo (eg Malaysia)
How accountants can bridge the global infrastructure gap | Executive summary
8
Establishing and comparing the need for infrastructure are key considerations in building the case for planning and selecting a particular project
Planning and selecting infrastructure projectsChapter 3 further explains the two key impediments identified in the survey the lack of a standard for project selection and the misalignment of the infrastructure life cycle and the political cycle Establishing and comparing the need for infrastructure are key considerations in building the case for planning and selecting a particular project This report sets out methods of establishing lsquoneedrsquo in order to inform the planning and project selection process The survey also identifies the misalignment between a political cycle (often four to six years) and the total life cycle of an infrastructure asset (often over 20 years) This mismatch can generate two biases a bias towards short-term decision-making and a bias for creating megaprojects over maintenance
In response to these barriers this report offers the following recommendations based on observed good practice
Governments should1 Establish expert-led bodies to
forecast infrastructure requirements and recommend projects on the basis of need
2 Collect reliable data on the service potential of existing infrastructure and on the performance of past projects
3 Disaggregate expenditure on infrastructure to report both maintenance and new project spend
Accountants should4 Take the lead in applying standard
selection tools to determine the need for and priority of a project
5 Advise on the distributional impact and regional growth outcomes of selecting particular projects good practice in this area can be found in Japan
6 Embed adaptation and resilience into the project-selection process
Financing infrastructure projectsChapter 4 on financing infrastructure highlights three key impediments to closing the infrastructure gap the funding gap accounting for the higher cost of private capital and the need to professionalise the public sector finance function
In response to these barriers the report offers the following recommendations based on observed good practice
Governments should7 Consider innovative solutions for
closing the funding gap such as a value capture civic crowdfunding and other revenue funding schemes
8 Direct supreme audit institutions to monitor the interaction of off balance sheet liabilities and fiscal targets in order to improve the efficient allocation of public sector funds
9 Align long-term infrastructure plans with the annual budget process in order to minimise the use of higher-cost private finance to achieve capital budget flexibility
10 Adopt full accrual accounting and maintain a public sector balance sheet to support decision-making on infrastructure policy
Accountants should11 Advocate a more holistic approach
to maintaining fiscal discipline to avoid poor financial decisions driven by lsquofiscal illusionsrsquo
12 Conduct a balance sheet review to maximise the value of public sector assets
13 Produce an intertemporal balance sheet to improve long-term decision-making and support the sustainability of public finances as is done for example in New Zealand
14 Produce disaggregated assets in the balance sheet to include commercial social and financial assets ndash in order to improve the return on public assets
How accountants can bridge the global infrastructure gap | Executive summary
The roundtable participants identified poor monitoring and oversight by government as key impediments in delivering infrastructure projects
Delivering infrastructure projects The roundtable participants identified poor monitoring and oversight by government as key impediments in delivering infrastructure projects Chapter 5 offers results from the survey demonstrating disagreement about where each party in a PPP agreement provides value Finally the roundtable participants argued that the public sector often lacked the commercial acumen required to manage an infrastructure PPP effectively
In response to these barriers this report offers the following recommendations based on observed good practice
Governments should 15 Enact effective whistle-blowing
legislation and professionalise the public sector finance function to allow public servants to challenge unethical behaviour that can derail infrastructure projects
16 Establish centres of excellence that coordinate public sector expertise in contract management which allows any organisation within the public sector to draw on the specialist skill when negotiating a PPP contract
17 Consider introducing guarantee schemes for nationally significant infrastructure projects in order to encourage additional private sector involvement in infrastructure projects This will help address the assumptions identified in the survey which showed that private finance professionals were less likely to view the public sector as a stable partner
Accountants should 18 Implement proper monitoring and
oversight for all projects
19 Advocate embedding themselves in the professional teams delivering infrastructure by highlighting their expertise of risk management
Professional bodies should 20 Act as facilitators of knowledge
transfer between the public and private sector through thought-leadership events and roundtables
9
10
The global infrastructure gap
1 See Chapter 1 for definitions of the lsquoinfrastructure investment gaprsquo and the lsquoinfrastructure service gaprsquo
Globally some top barriers to meeting infrastructure need were
52 lack of political leadership
49 lack of finance or funding
40 planning and regulatory barriers
Finance professionals reported the largest service gap in Africa the Middle East had the smallest service gap1
The global investment gap will grow to US$14 trillion by 2040
Selecting projects
93 of respondents said governments could improve the infrastructure projection selection process
lsquoRemoving political decision-making and making the process technocraticrsquo was the most cited for improving project selection
Delivering projects and the public-private relationship
62 of public sector respondents arguedthat they offered a lsquolong-term and stable partnershiprsquo for a PPP compared to only
45 of private sector respondents
Financing projectsThe most cited barriers for securing private finance for infrastructure were
lsquoInsufficient skills in governmentrsquo 45 and
lsquonegative perception of private financersquo 43
11
Introduction
Infrastructure is critical for economic and social development across the world Physical infrastructure systems ensure that basic human needs are met people need access to energy to light and heat their homes and safe water for drinking sanitation and cooking Transport infrastructure allows people to travel to work and transport goods to different markets
In these and many other ways infrastructure is vital to social and economic activity and development ndash and its provision is intrinsically tied to achieving the United Nationrsquos Sustainable Development Goals to address global challenges such as poverty inequality climate change and environmental degradation and to achieve a better and more sustainable future for all There is also a unique opportunity for governments to respond to the global infrastructure gap challenge The anaemic economic growth following the 2008 financial crisis and the sustained low-interest rate environment means that the cost of increased investment has rarely been lower for governments and the prize is sustainable economic growth a sustained boost to productivity and improved living standards
But execution matters and there are many examples of infrastructure projects that have gone badly wrong Design failures can cause the death of workers as in the case of the Chirajara bridge collapse in Colombia in 2018 poor demand forecasting and design can result in significant infrastructure investments being underused such as the Ciudad Real Airport in Spain which remains abandoned after a construction cost in excess of 1bn euros (BBC 2015)
In addition the collapse of the Morandi Bridge in Genoa Italy demonstrated that to avoid disaster governments must allocate sufficient resources to the maintenance of existing infrastructure fighting the bias towards focusing resources on new-build projects
Finally cases of natural disaster ndash such as the flooding in Bangkok Thailand in 2011 ndash are becoming increasingly common and future infrastructure projects must be adaptable and resilient to enable countries to meet the threats of climate change
Therefore the successful provision of public infrastructure requires governments to have the right professional team in place to be able to harness the benefits of additional investment while working to mitigate the significant risks associated with infrastructure projects The accountant must be brought to the centre of the decision-making process on the selection financing building and operation of infrastructure where the finance professionalrsquos particular skills and perspective can mean the difference between success and failure
Research methodology
How accountants can bridge the global infrastructure gap Improving outcomes across the entire project life cycle report is the result of a joint research project conducted by ACCA and CPA Canada The research objective of this study was to quantify and explain the nature of the global infrastructure gap and explore how professional accountants can contribute to bridging the gap through improvements in the selection financing and delivery of projects
The report encompasses the collection of economic research country-specific narratives and best practices in building and maintaining infrastructure ndash from project selection to completion and evaluation The results and observations that were arrived at are supported by evidence collected through the following mechanisms
bull quantifying the cumulative global infrastructure investment gap to 2040 through desktop research
bull a global online survey of a random sample of ACCA members and CPA Canada members
bull a desktop literature review of specialist publications to determine leading practices
bull in-person roundtable discussions held with experts from four continents
How these four areas were developed is detailed below
ECONOMIC ANALYSIS A quantitative approach was followed for the review of the G20 Global Infrastructure Hubrsquos Global Infrastructure Outlook report (GHI and Oxford Economics 2018) This report uses economic forecasting to quantify the cumulative global infrastructure gap up to 2040 Chapter 1 lsquoQuantifying the Global Infrastructure Gaprsquo provides some detail on the quantification of the investment gap and articulates the challenge for this report More information on the methodology of the economic analysis can be found in Appendix A
GLOBAL SURVEY AND DEMOGRAPHICS ACCA and CPA Canada jointly undertook a survey of a random sample of each bodyrsquos membership This survey used the perspectives of finance professionals to illuminate the nature of the global infrastructure gap highlight the barriers to closing the gap and clarify the diverging expectations of public- and private-sector actors in the use of publicndash
private partnerships (PPPs) in infrastructure projects A copy of the survey is available in Appendix C
The survey design and administration were consistent across both bodies except for the addition of one question on infrastructure planning and sustainability considerations in the CPA Canada survey Therefore unless otherwise specified all survey results cited in the report present the combined output from the CPA Canada and ACCA waves of the survey The ACCA survey was in the field for two weeks in August 2018 and the CPA Canada survey for two weeks in October 2018
Survey demographics The combined total of survey respondents was 3611 across 1182
countries Geographic splits in the survey data typically present output by world region Every world region had at least 150 responses except for South America which is excluded from any figure showing results by geography Finally the
2 Six respondents gave lsquoOtherrsquo for their country of residence thus it is not possible to identify whether they lived in the 118 countries or elsewhere
12
Overall more than one-in-three respondents (35) worked in the corporate sector while about 20 worked in the public or not-for-profit sectors
joint survey (lsquothe member surveyrsquo) split respondents into two primary categories lsquogeneralistsrsquo and lsquospecialistsrsquo where specialist respondents stated that their work included at least one of the following areas infrastructure policy procurement capital budgeting project or operations management Of the total sample 1966 respondents (54) were categorised as specialists The survey included a number of detailed technical questions which were asked only of specialists Figures throughout the report clearly indicate which subset of respondents (generalists or specialists) answered a particular question
The member survey includes the views of accountants working across all sectors including respondents from accountancy firms the corporate sector and the public sector Overall more than one-in-three respondents (35) worked in the corporate sector while about 20 worked in the public or not-for-profit sectors
LITERATURE REVIEWA detailed review of specialised literature on infrastructure projects globally was conducted This review demonstrated the variety of methodologies used globally in quantifying the infrastructure gap as well as providing a summary of leading practices in infrastructure planning project selection and public financing that help support the effective delivery of innovative and sustainable infrastructure policy
The References section includes the reviewed literature
IN-PERSON ROUNDTABLE DISCUSSIONSFinally roundtable discussions were conducted with ACCA members and CPA Canada members in the UK Canada Sri Lanka Nigeria Trinidad amp Tobago Jamaica and Malaysia and focused on country-specific infrastructure challenges and solutions to show the international variation in infrastructure need as well as highlighting what skills and perspectives accountants employ to help address the global infrastructure gap
The roundtable discussions offered stakeholders an opportunity to share their insights and experiences on the current challenges to closing the global infrastructure gap and their perspectives and experiences in the provision of infrastructure In addition the roundtables offered participants an opportunity to reflect on best practices with their peers
Together the literature review and roundtable discussions have provided evidence of the essential role accountants can play in helping to shrink the global infrastructure gap A copy of the roundtable questions is available in Appendix C
ACCA and CPA Canada would like to thank the Centre for Business and Economics Research (Cebr) an economic consultancy based in the UK for completing the economic analysis quantifying the global infrastructure investment gap
13
How accountants can bridge the global infrastructure gap | Research methodology
FIGURE 2 Sector breakdown of The Global Infrastructure Gap survey
20
18
16
14
12
10
8
6
4
2
0Big Four
accounting firm
Corporate sector ndash small medium sized
Corporate sector ndash
large
Financial services ndash smallmedium sized
Financial services ndash
large
Mid-tier accounting
firm
Not-for-profit Other international
accounting firm
Public sector Small medium sized practice (SMP)
Other
Source The Global Infrastructure Gap survey all respondents n 3611
14
1 Defining the challenge Quantifying the global infrastructure gap
Defining the global infrastructure gap qualitatively is relatively simple the term is generally understood to denote the difference between required infrastructure and existing infrastructure Defining the current global infrastructure gap quantitatively however is more complex (MGI 2016) There are a variety of methods used internationally to measure the infrastructure gap
Reports by the McKinsey Global Institute (MGI 2013 and 2016) on the global infrastructure gap estimate that the world will need to invest US$33 trillion annually in infrastructure to support the needs resulting from projected economic growth The MGI methodology is highly sensitive to variations in economic growth since the forecasted investment gap is based on maintaining the ratio of infrastructure stock to a countryrsquos gross domestic product (GDP) But assessing infrastructure need as a constant share of a countryrsquos GDP is a rather crude measure that could result in erroneous conclusions For example assume a country spends the same amount on infrastructure but boosts GDP through greater efficiency in the allocation of those investment resources This would show as an increase in the infrastructure investment gap under the MGI approach (ie infrastructure spending would fall as a percentage of GDP) when in fact the efficiency gains would actually reduce the gap
In working to improve infrastructure provision the ultimate focus for any government should be minimising a recognised service gap not reducing a notional investment gap ndash addressing a countryrsquos particular economic social and environmental objectives (Fay et al 2017) The roundtable discussion in Canada a country with a negligible investment gap highlighted the misalignment between infrastructure investment decisions and the actual service needs of the country something that had been particularly challenging in First Nations communities In short this global challenge cannot be solved only by spending more money but also by spending better ndash ensuring that all spending is targeted on real needs At the same time it is not possible to categorise effectively on a global scale all the national objectives underpinning the goal of closing service gaps
Therefore this report offers two approaches to the global infrastructure gap the infrastructure investment gap and
the infrastructure service gap The first relies on a dataset produced by the G20rsquos Global Infrastructure Hub and sets an aspirational metric which is benchmarked against a countyrsquos peers (GHI and Oxford Economics 2018) This quantified infrastructure investment gap shows what investment would be required for a particular country to move to the top 25th percentile of the peers in its income group This works as an effective benchmark where a countryrsquos gap can be closed over time The second approach relies on the views of the specialist respondents to the member survey The quality of infrastructure is assessed across seven different subtypes demonstrating where service gaps exist for different world regions The first approach provides a quantified output and aspirational target for countries seeking to meet infrastructure needs and is described below The results of the second approach setting out the service gap can be found in section 14 below lsquoFinance professionalsrsquo perspectives on the global infrastructure servicersquo gap
How accountants can bridge the global infrastructure gap | 1 Defining the challenge Quantifying the global infrastructure gap
Globally the cumulative level of investment required to bring all countries in line with the best performing nations in their income group is estimated to be almost US$88 trillion between 2018 and 20404
11 THE INFRASTRUCTURE INVESTMENT GAP (APPROACH 1) AN ANALYSIS OF THE GLOBAL INVESTMENT OUTLOOK The Global Infrastructure Outlook report (GHI and Oxford Economics 2018) defines infrastructure investment as lsquoGross Fixed Capital Formation (GFCF) by the public and private sectors on fixed immovable assets that support long-term economic growthrsquo This report takes a comprehensive view of countriesrsquo infrastructure needs ndash including the social and economic infrastructure that would be captured under GFCF This comprehensive view is echoed in the survey analysis which covers seven sub-categories of infrastructure power and energy water and sanitation road and highways other transport (eg air and sea) ICT railways and core public service infrastructure (eg hospitals and schools) The research by the G20rsquos Infrastructure Hub estimates the amount of infrastructure investment needed for a diverse set of countries in each year from 2016 until 20403
The Global Infrastructure Outlook report provides historic data from 2007 to 2015 and then projects these forward to 2040 with increased spending only occurring in response to changes in economic and demographic fundamentals The difference between these estimates (ie the amount invested compared with the
amount needed) allows us to calculate the lsquoinfrastructure investment gaprsquo for each country To improve understanding of this global challenge the account below illustrates the size of this infrastructure gap at the global level Further detail on the nature of the infrastructure investment being measured and the methodology used to calculate the gap are explained in Appendix A Regional and national-level analysis of the investment gap can be found in Appendix B
12 QUANTIFYING THE GLOBAL INFRASTRUCTURE INVESTMENT GAP Globally the cumulative level of investment required to bring all countries in line with the best performing nations in their income group is estimated to be almost US$88 trillion between 2018 and 20404 Current trends indicate however that actual investment over the period is likely to undershoot this by US$14 trillion In 2018 alone the global infrastructure gap is US$409bn and will average US$613bn per year over the entire period In order to close this gap total forecast spending would have to increase by 19 over current investment levels In other words for every five US dollars of infrastructure spending forecast across the world by 2040 governments and investors would need to find a further 95 cents in order to bring the global stock of infrastructure up to standard
FIGURE 11 Comparison of different approaches to assessing infrastructure needs
Approach 2
Infrastructure Service Gap
Approach 1
Infrastructure Investment Gap
Notional target (aspirational) quantifiable
Source Global Infrastructure
Outlook
Subjective view of need
Source The Global Infrastructure
Gap survey
3 For further detail please see the technical appendix of the Global Infrastructure Outlook (GHI and Oxford Economics 2018)
4 Figures from the G20 Global Infrastructure Outlook report (GHI and Oxford Economics 2018) are reported in 2015 US$ prices and exchange rates unless otherwise specified
15
16
Quantifying an infrastructure investment gap across world regions provides an aspirational target for governments looking to improve the provision of infrastructure in their country
Between regions and countries there is a wide variation in performance in infrastructure provision and the capability of governments and private investors to meet future needs The capacity of governments to respond to this challenge is discussed further in the next chapter of this report
13 ANALYSIS OF THE GLOBAL INFRASTRUCTURE INVESTMENT GAPQuantifying an infrastructure investment gap across world regions provides an aspirational target for governments looking to improve the provision of infrastructure in their country It highlights global top performers such as Singapore Japan and Canada ndash which can be looked to for good practices5 The investment gap view also reveals global laggards such as Mexico Myanmar and Brazil Countries facing substantial and growing gaps may benefit from looking to their peers for good practice and novel methods of meeting infrastructure needs Subsequent chapters explore how the skills and perspectives of accountants can help close the investment gap Before turning to the role of accountants this report sets out a second method for understanding infrastructure need the infrastructure service gap
How accountants can bridge the global infrastructure gap | 1 Defining the challenge Quantifying the global infrastructure gap
14 FINANCE PROFESSIONALSrsquo PERSPECTIVES ON THE GLOBAL INFRASTRUCTURE SERVICE GAP (APPROACH 2)The Global Infrastructure Outlook report forecasts that the global infrastructure investment gap will reach US$14 trillion by 2040 (GHI and Oxford Economics 2018) This economic analysis sets an aspirational global benchmark for meeting the worldrsquos infrastructure needs At the same time the ultimate objective in fulfilling a countryrsquos infrastructure need is not a notional investment figure rather it is closing a recognised service gap Doing this requires that governments develop a vision of what a country seeks to achieve through the development and maintenance of its infrastructure ACCArsquos previous work on Smart Cities argues that creating a vision for future municipal infrastructure requires a lsquocitizen-led bottom-up approachrsquo based on actual service needs (ACCA 2016) Zia Paton a partner at PricewaterhouseCoopers (PwC) and participant in the roundtable discussion in Trinidad and Tobago cited the countryrsquos lsquoVision 2030rsquo as an excellent framework for setting out the governmentrsquos infrastructure priorities She pointed out that lsquothe plans set out in the Vision 2030 document appear to be
FIGURE 12 Global infrastructure investment need and current trends 2015 US$ trillions
50
45
40
35
30
25
20
15
10
05
0
Investment need Current trends
2007
2008
2009
2010
2011
2012
2013
2014
2015
2016
2017
2018
2019
2020
2021
2022
2023
2024
2025
2026
2027
2028
2029
2030
2031
2032
2033
2034
2035
2036
2037
2038
2039
2040
Source GHI and Oxford Economics 2018
5 See Appendix B for regional- and country-level statistics
17
To supplement the economic analysis that produces the investment gap the joint member survey explored the global infrastructure service gap
exactly what we needrsquo but she sees the real challenge as lsquoconverting that plan into action and aligning it with the various frameworks people and Ministries we have in place execution or implementation is where we tend to have challengesrsquo
The following chapters demonstrate the essential role for the accountancy profession in transforming agreed national visions into a reality through improving project selection (Chapter 3) financing decisions (Chapter 4) and project delivery (Chapter 5) To supplement the economic analysis that produces the investment gap the joint member survey explored the global infrastructure service gap This granular
approach captures the perspective of finance professionals from around the world setting out which particular types of infrastructure are viewed as requiring improvement to meet service needs
Infrastructure service gap by world regionRespondents to the survey were asked to rank the current quality of seven types of infrastructure in their country ndash covering both social and economic infrastructure Breaking down these results by world region demonstrates considerable variation in the current quality of each type of infrastructure Figures 13 14 and 15 show the results for three types of infrastructure power and energy roads and highways and ICT The world regional
How accountants can bridge the global infrastructure gap | 1 Defining the challenge Quantifying the global infrastructure gap
FIGURE 13 Infrastructure quality ndash power and energy
North America
100
80
60
40
20
0
n Dont know n Very good n Good n Neutral n Poor n Very poor
Middle East Asia Pacific Central and Eastern Europe
South Asia Western Europe Africa Caribbean Total
Source The Global Infrastructure Gap survey specialist respondents only n 1966
FIGURE 14 Infrastructure quality ndash roads and highways
North America
100
80
60
40
20
0
n Dont know n Very good n Good n Neutral n Poor n Very poor
Middle East Asia Pacific Central and Eastern Europe
South Asia Western Europe Africa Caribbean Total
Source The Global Infrastructure Gap survey specialist respondents only n 1966
ICT is a unique form of infrastructure that includes significant non-physical components and its provision must anticipate the future needs of the digital economy
breakdowns for water and sanitation railroad and other transport infrastructure (eg sea and air) and core public service infrastructure can be found in Appendix B Figures B6 B7 B8 and B9 By analysing the specialist responses on each type of infrastructure this report offers a view on the global and regional service gaps that exist in the provision of infrastructure
The survey data shows that South Asia lags other world regions in the quality of its power and energy infrastructure with only one in five (20) of finance professionals in that region stating that power and energy provision in their country was good or very good This compares with 65 of global respondents who found the provision of power and energy to be good or better Africa lagged in this area with about one in three (35) of Africarsquos finance professional respondents stating that power and energy provision was very good or good Unsurprisingly 90 of the Middle Eastern respondents saw their power and energy infrastructure as good quality or above ndash with 71 stating that power and energy provision is lsquovery goodrsquo
Central and Eastern European and African respondents were critical of the quality of their road infrastructure ndash with 37 and 46 respectively stating that their roads and highway infrastructure were poor or very poor In comparison a majority of survey respondents in the Middle East North America and Western Europe reported that the provision of
road and highway infrastructure in their countries was of good or very good quality Globally nearly half the finance professionals (49) reported that that the quality of road and highway infrastructure in their countries was good or very good
Globally ICT was seen as the type of infrastructure with the highest quality Clearly ICT is a unique form of infrastructure that includes significant non-physical components and its provision must anticipate the future needs of the digital economy The quality of ICT infrastructure extends beyond initiatives such as the roll-out of ultrafast broadband it includes public sector projects developing robust financial management and information systems to improve public services
Besides significant non-physical components ICT represents a comparatively new priority for many governments The survey shows the African region lagging its peers with only 51 of specialist finance professionals in the region ranking ICT as good or very good compared with the global average of 69 ICT was one of the few infrastructure types to receive a high score in central and Eastern Europe This is understandable because for many countries in this region other types of physical infrastructure such as road and rail were built under the Soviet Union Significant investment in ICT infrastructure around the world occurred
18
How accountants can bridge the global infrastructure gap | 1 Defining the challenge Quantifying the global infrastructure gap
FIGURE 15 Infrastructure quality ndash information and communication technology
Source The Global Infrastructure Gap survey specialist respondents only n 1966
North America
100
80
60
40
20
0
n Dont know n Very good n Good n Neutral n Poor n Very poor
Middle East Asia Pacific Central and Eastern Europe
South Asia Western Europe Africa Caribbean Total
19
Comparing specialistsrsquo perceptions of infrastructure quality by country shows particular service gaps emerging across the types of infrastructure
after the fall of the Soviet Union and many new nation-states in Eastern Europe were able to pursue their own infrastructure investment priorities Certain countries such as Estonia are now seen as world leaders in ICT and the provision of a digital public sector
A comparison of regional infrastructure service gaps arising from the survey dataComparing specialistsrsquo perceptions of infrastructure quality by country shows particular service gaps emerging across the types of infrastructure For example finance professionals in Africa and South Asia reported consistently poor levels of infrastructure across all the subtypes with the notable exception of ICT These results suggest that there are considerable service gaps that governments in this world region must address In comparison North American respondents had much higher overall scores but showed a particular dip in their road and highway infrastructure where only 64 of respondents reported that this infrastructure was of good quality In the Caribbean region specialist respondents isolated road and highway infrastructure and core public service infrastructure as key areas requiring intervention to reduce the service gap Specialists in infrastructure policy in central and Eastern Europe cited core public service infrastructure and railway infrastructure as areas requiring further investment
15 BARRIERS TO MEETING INFRASTRUCTURE NEEDSRespondents to the member survey were also asked what they saw as the biggest barriers to meeting the infrastructure needs in their country The results of this question showed significant variation by world region For example corruption was seen as a serious challenge in South Asia Africa Central and Eastern Europe and the Caribbean ndash but was cited by 10 of respondents or fewer in North America and Western Europe In comparison a lack of political leadership ranked consistently high across world regions This is a key barrier that is explored further in Chapter 3 Selecting Projects The lack of finance or funding also ranked as a significant barrier in most regions with an overall global average of 49 of respondents citing it as a barrier The underlying causes for the lack of finance as well as good practices in overcoming this barrier are discussed in Chapter 4 on the central role of accountants in improving infrastructure project finance Finally planning and regulatory issues consistently arose as a barrier to meeting infrastructure need with around 40 of respondents across the globe citing this as a key barrier Chapter 5 of this report which explores how accountants can support the efficient execution of infrastructure projects sets out how the interface of public and private partners can often be confused and suboptimal reducing the effective delivery of infrastructure
How accountants can bridge the global infrastructure gap | 1 Defining the challenge Quantifying the global infrastructure gap
FIGURE 16 Biggest barriers to meeting infrastructure needs
North America
100
80
60
40
20
0
n Lack of finance andor fundingn Lack of political leadershipn Skills and talent shortagen Planning and regulatory barriersn Corruptionn Lack of competitionn None
Middle East Asia Pacific Central and South Asia Western Europe Africa Caribbean Total
Source The Global Infrastructure Gap survey all respondents n 3611
Eastern Europe
2 Capacity for infrastructure investment
For countries at different stages of development the implications of infrastructure spending can also be markedly different The annual rate of growth in output typically much higher during the early phase of industrialisation tends to slow as a countryrsquos economy matures Smaller economies may therefore need to commit a relatively large share of their output to infrastructure investment in order to facilitate rapid growth
Looking at infrastructure investment as a percentage of GDP can therefore be revealing as to governmentsrsquo willingness or ability to make the necessary financial investment as well as the nature of the environment for private investment
In 2015 the Asian economies funded the largest financial infrastructure investment around US$13 trillion This is unsurprising given that Asia is the most heavily populated region It is also a function of the commitment by certain countries to improving the regionrsquos infrastructure and in 2015 the level of investment was the largest in relative terms standing at 51 of GDP
Africa was the region with the second-highest level of investment as a share of GDP in 2015 at 43 but the continent trails its peers in absolute investment (US$100bn) Europe and the Americas both of which are dominated by their larger more developed economies dedicated far lower levels of funding to infrastructure investment relative to their GDP in 2015 at 20 and 17 respectively
20
21 GOVERNMENTSrsquo CAPACITY FOR INCREASING INFRASTRUCTURE SPENDINGGovernments can directly fund an increase in expenditure on infrastructure through increases in either taxation or borrowing The latter places a burden on future generations in the form of the higher taxation needed to fund the
repayment of the debt The major constraints on a governmentrsquos capacity for funding infrastructure are therefore a fairly complex mix of institutional economic and social factors The size of the tax base how easily taxes can be evaded and political or cultural expectations about what constitutes a fair level of taxation all present practical
FIGURE 21 Regional infrastructure investment in US$ trillions as a of GDP 2015
7
6
5
4
3
2
1
0Asia
14
12
10
08
06
04
02
0Africa Oceania Europe Americas
o
f GD
P
2015 USD
$ trillions
n of GDP n USD $ trillions
Source GHI and Oxford Economics 2018
21
How accountants can bridge the global infrastructure gap | 2 Capacity for infrastructure investment
Table 21 presents summary statistics for the level of government debt and taxation across high-income upper-middle-income and low- and lower-middle-income countries
barriers to raising revenues Likewise high taxes can have strong disincentive effects discouraging certain activities and limiting the extent to which any change in the tax rate translates into higher revenues Borrowing on the other hand is constrained by the credibility of the government in pledging to repay any debts and the depth and sophistication of domestic capital markets
Table 21 presents summary statistics for the level of government debt and taxation across high-income upper-middle-income and low- and lower-middle-income countries Using this data gives the distribution of tax and borrowing levels relative to GDP allowing us to benchmark countriesrsquo capacity for further investment The figures cover the 1995 to 2016 period in order to show variation across a range of different economic and political cycles
Table 21 shows that among the high-income countries both the UK and Canada have relatively high levels of indebtedness as measured by the OECD gross general government debt indicator (OECD 2019) Since the global financial crisis both countries have seen their debt levels pull away from the OECD average to stand at 1117 and 1147 of GDP respectively This puts both countries firmly in the upper quartile of indebted countries even among the OECD countries where levels of debt to GDP
are generally high In both cases tax revenues are marginally below the OECD average however suggesting there is some limited fiscal room for raising revenue Political pressure in countries such as the UK may play a part in decisions about whether to raise taxes to generate additional revenue and if so whether to invest in capital expenditure over improving service provision through increased operating budgets
Chinarsquos debt as a share of GDP is estimated to fall below the average for the low- and middle-income countries at 443 Tax revenues are also somewhat higher than in most low and middle-income countries As growth continues and the economy matures Chinese governments may be able to widen the tax base in line with developed economy standards bringing in significantly larger revenues Still the government remains well placed to invest in infrastructure Malaysia which has a larger infrastructure gap to overcome is somewhat more indebted (545) sitting above the median debt level for its peer group although not particularly dangerously so Conversely tax revenue as a share of GDP (143) is slightly lower than the median level for low- and middle-income countries of 147 This suggests that without a move into higher growth and a broader tax base the funding required to close the infrastructure gap is unlikely to materialise in Malaysia
TABLE 21 Stock of debt and tax revenues as a share of GDP selected countries
INCOME GROUP (WORLD BANK DEFINITION)
COUNTRY INFRASTRUCTURE INVESTMENT AS A SHARE OF GDP 2015
GENERAL GOVERNMENT DEBT AS A PROPORTION OF GDP
TAX REVENUE AS A SHARE OF GDP
High-income UK 16 1117 325
Canada 23 1147 320
Upper-middle income China 70 443 217
Malaysia 36 545 143
Low- and lower-middle income Pakistan 17 633 164
Nigeria 32 196 35
India 40 689 110
Source World Bank OECD IMF CIA World Factbook
Some countries such as China find themselves in the privileged position of having significant fiscal room to support further investment while also projecting a small infrastructure gap
Pakistan has a relatively high level of government debt (633) which is approaching the upper quartile of World Bank estimates This presents real risks to fiscal sustainability where pressure from the countryrsquos overseas debt obligations has raised the prospect of a debt crisis Here the high level of indebtedness may in part be due to rapid growth in infrastructure spending over recent years
Among the case study countries Nigeriastands out as having both the largest forecast infrastructure gap at 09 of GDP in 2040 and the weakest tax revenue (35 of GDP) The inability of the government to raise revenue effectively is holding back its ability to invest in infrastructure which in turn is holding back growth The availability of significant oil reserves can provide an alternative source of revenue to general
taxation especially when oil prices are high But there are reasons (environmental and technological) for considering that peak oil prices may have been (or will soon be) reached Therefore the ability of Nigeria to finance its investment from other sources of income will be essential to closing the countryrsquos infrastructure gap
This analysis demonstrates that there is significant country-level variation in the ability to respond to the global infrastructure gap (Table 22) Some countries such as China find themselves in the privileged position of having significant fiscal room to support further investment while also projecting a small infrastructure gap Others such as Pakistan and Nigeria will need to work within the limited fiscal room available for meeting their growing infrastructure needs
22
How accountants can bridge the global infrastructure gap | 2 Capacity for infrastructure investment
TABLE 22 A typology of infrastructure gap responsiveness
LIMITED FISCAL ROOM GREATER FISCAL ROOM
Low infrastructure gap lsquoSmall gap Fiscally restrictedrsquo(eg Canada)
lsquoSmall gap Fiscally flexiblersquo(eg China)
High infrastructure gap lsquoLarge gap Fiscally restrictedrsquo(eg Pakistan Nigeria)
lsquoLarge gap Fiscally flexiblersquo (eg Malaysia)
23
3 Selecting projects
Around the world the multitude of industrial cranes signals the increase in infrastructure projects and the resulting demand on investment resources Yet what is not apparent is the variety of competing demands for infrastructure investment such as the ageing of existing infrastructure the need to adapt the built environment to respond to climate change and the desire to initiate new often lsquomegarsquo projects6
The planning and selection process of the appropriate infrastructure project is particularly difficult given long asset lives and significant sunk costs that increase risk and uncertainty
Given these common barriers finance professionals from around the world offered a mixed review of their countriesrsquo current selection process Only 16 of respondents to the joint member survey claimed that their government always or frequently selects infrastructure projects that provide the most value to taxpayers whereas a majority (52) argued that their government only sometimes selects infrastructure projects of value to taxpayers Almost one-in-three respondents (29) indicated that they believed that governments never or infrequently select infrastructure projects that provide value to taxpayers (Figure 31)
There is clearly room for improvement in how infrastructure projects are selected To suggest how to improve the planning
and selection process respondents to the joint member survey were asked to rate in order of priority what changes could be made to improve decision-making when planning and selecting
infrastructure projects Figure 32 shows how respondents ranked the various options from first choice to fifth with smaller bars reflecting fewer respondents ranking that option in their top five
FIGURE 31 Do you believe the government selects projects that provide the most value to the taxpayer
0 10 20 30 40 50 60
Always
Frequently
Sometimes
Infrequently
Never
Dont know
Source The Global Infrastructure Gap survey all respondents n 3611
6 lsquoMegaprojects are large-scale complex ventures that typically cost US$1bn or more take many years to develop and build involve multiple public and private stakeholders are transformationaland impact millions of peoplersquo (Flyvbjerg 2018)
24
A majority of respondents (55) ranked either lsquoremoving political decision-makingrsquo or lsquoputting in place mechanisms to reduce corruptionrsquo as their first choice
The results (Figure 32) show that lsquoremoving political decision-making and making the process more technocraticrsquo was the change most cited by finance professionals as likely to improve the planning and selection process A majority of respondents (55) ranked either lsquoremoving political decision-makingrsquo or lsquoputting in place mechanisms to reduce corruptionrsquo as their first choice This prioritisation aligned with the pervading sentiment voiced by participants in the Canadian roundtable who argued that the government often plan and select projects that are likely to be popular among voters and will focus decision-making on the political cycle which results in short-sighted project selection and planning processes that lack a long-term plan to address future needs
The importance of putting in place mechanisms for reducing corruption such as effective whistle-blowing legislation also resonated in the roundtable discussions A participant in Nigeria emphasised that lsquoif project selection was looked into as it should be it would
definitely help us in reducing corruption and hence reduce the infrastructure gaprsquo Respondents also ranked highly lsquoquantifying the total life-cycle costs of a potential projectrsquo ndash with 22 selecting this as their first or second choice Therefore one of the key barriers to improving project selection is the bias towards short-term thinking and decision-making
Another area needing improvement identified in the survey is the lack of a standard assessment method supporting the project selection process The survey showed that 26 of respondents ranked lsquoimplementing standard assessment tools to evaluate projects during selectionrsquo as either their top or second-highest choice Below we explore two such barriers and how accountants play a role in addressing them first improving the project planning and selection processes by using standards and tools to identify need and prioritisation and second the misalignment between the project life cycle and the political short-term thinking that often prevails in project selection
How accountants can bridge the global infrastructure gap | 3 Selecting projects
FIGURE 32 Which of the following do you feel the government in your country should prioritise to make the best decisions when selecting infrastucture projects
Removing political decision-making making process
technocratic
100
80
60
40
20
0
n 1st preference n 2nd preference n 3rd preference n 4th preference n 5th preference
Applying standard assessment tools to
evaluate projects during selection
Putting in place mechanisms to
reduce corruption
Quantifying the total life-cycle
costs of potential projects
Spending more resource to evaluate
projects after completion
Transferring project selection powers
to more local levels of govt
Adhering to global accounting
standards
Bringing OOBs onto government
balance sheets
Moving government accounts from cash to accrual
accounting
Source The Global Infrastructure Gap survey all respondents n 3611
25
How accountants can bridge the global infrastructure gap | 3 Selecting projects
The constrained optimisation method is another tool that can be used for project selection though it is usually reserved for complex and large projects that require mathematical optimisation before decisions are made
31 BARRIER 1 LACK OF A STANDARD PROJECT SELECTION METHOD ndash FACTORING IN lsquoNEEDrsquo AND lsquoPRIORITISATIONrsquoA participant in the Trinidad amp Tobago roundtable commented that planning and project selection is lsquohardly ever done on a needs basis We do not complete a needs assessment when were building a road costing millions of dollars What is the benefit that we are going to bring to society from that new infrastructurersquo Establishing a need is a key consideration in building the case for selecting a particular project Although there are no international standards or regulations for infrastructure project selection the Guide to Project Management Book of Knowledge (PMBOK) (Project Management Institute 2017) sets out a process whereby the lsquoneedrsquo for the project is identified first and classified as most important in the selection This can be done by conducting a needs assessment or feasibility study and supports the reasons for lsquowhyrsquo the project is required The lsquowhyrsquo may be stimuli such as a market demand a business need a customer request a technological advance a legal requirement or a socialenvironmental need
The PMBOK then delineates two broad methods for establishing the benefit or the lsquowhyrsquo of a project the benefit measurement method and the constrained optimisation method
The benefit measurement methodAs a comparative approach this method is based on the present value of estimated cash flows and uses techniques such as benefitcost ratio economic models payback period discounted cash flow internal rate of return and opportunity cost This method is often used for small or less complex projects
Constrained optimisation methodThe constrained optimisation method is another tool that can be used for project selection though it is usually reserved for complex and large projects that require mathematical optimisation before decisions are made This method is widely used in finance and economics to find the minimum or maximum for a cost function where the cost changes depending on varying inputs Many techniques are available that offer broader consideration for decision makers by examining the best and worst case scenarios and the probability of the project outcome
The international roundtable participants highlighted that governments should ensure that the need for a particular project is clearly defined ndash the lsquowhyrsquo as the need will determine the appropriate source(s) of support To do this they should implement a stage-gate process such as the PMBOK with standard tools and mechanisms in place for evaluating the project selection process increasing transparency and reducing corruption
FIGURE 33 Two methods of need assessment
Uses cost-benefit analysis to assess whether the project is financially viable or not
Constrained optimisation method
The benefit measurement method
Compares the project under consideration with a competing project
New project Competing project
How accountants can bridge the global infrastructure gap | 3 Selecting projects
Alongside the technical methods available for isolating need and priority accountants can produce a broader range of metrics to improve the projection selection process
In practice many governments do not have the resources or the capacity to carry out such assessments across all projects and usually with the limited information available they place emphasis on basic elements of project appraisal which include lsquorules of thumbrsquo to confirm that
bull the need for the project is justified
bull the projectrsquos objectives are clearly specified
bull broad alternatives to the project are considered
bull promising options are analysed
bull project costs are fully estimated and
bull project benefits are assessed
Even by applying the basic elements of project appraisal prioritisation (or ultimately selecting the right project) can still be a constraint The World Bank has developed an innovative and adaptable Infrastructure Prioritization Framework (IPF) (Marcelo et al 2016) to assist governments in making the best use of their limited information in the interim until they are able to increase their capacity and resources for conducting a more informed and extensive analysis
The IPF provides a stepping-stone approach to project prioritisation for government decision-making This multi-criterial decision-support tool builds on existing and accessible data to help governments compare projects while promoting the building of analytical capacity and data for more extensive financial and economic analysis It is seen as an extension to the current set of tools available to support project selection It starts from a baseline of ad hoc uninformed project selection (where technical project information is limited and subjective) to partial technical information (where some information and analysis is available) to a full selection by advanced project appraisal (where considerable technical information is available)
Alongside the technical methods available for isolating need and priority accountants can produce a broader range of metrics to improve the projection selection process For example project planning and selection in Japan considers the effect of infrastructure investment on achieving regional equity instead of selecting projects that give the highest direct economic return (International Transport Forum 2017) This approach prioritises more evenly spread economic development in a country even where an optimisation model would suggest investment elsewhere
Box 31 Sustainability and infrastructure A Canadian case
The Canadian wave of the survey included a question on sustainability and infrastructure 80 of Canadian respondents indicated that they believe that it is very important to adapt to the impacts of the changing climate such as severe weather in planning infrastructure projects
It is important now more than ever to build resiliency into infrastructure investments Roads bridges buildings public transit and water and wastewater systems are at increasing physical risk from the impacts of climate change
The Canadian government declared in the 2017 federal budget that it plans to invest CAD219bn in green infrastructure Specifically CAD2bn is dedicated to a Disaster Mitigation and Adaptation fund to support the federal provincialterritorial and municipal infrastructure needed to address climate change Canadian national building codes have been updated to integrate climate adaptation and
resiliency considerations resulting from significant disaster losses Canadian insurance companies are experiencing the impact the annual insured damage for 2016 was CAD49bn ndash a significant increase from the previous annual record of CAD32bn set in 2013 In 2016 the biggest claims arose from the Fort McMurray wildfires which resulted in approximately CAD37bn in insured damage
Any future costs of inaction will likely outweigh the incremental investments made today in enhancing and modifying infrastructure resiliency Nonetheless too often there are challenges in making the business case for projects that incorporate adaptation measures But as with most modifications in the long run it is always easier and cheaper to build resilience considerations into asset development from the start rather than adding them later in response to a major event n
26
How accountants can bridge the global infrastructure gap | 3 Selecting projects
The member survey revealed the need to quantify the total life-cycle cost and remove political decision making in order to improve project selection
32 BARRIER 2 MISALIGNMENT OF THE INFRASTRUCTURE LIFE CYCLE AND THE POLITICAL CYCLE The member survey revealed the need to quantify the total life-cycle cost and remove political decision making in order to improve project selection These two changes are likely prioritised because of the misalignment that commonly exists between the political cycle (often four to six years) and the total life cycle of an infrastructure asset (often over 20 years) This mismatch can generate two biases a bias towards short-term decision-making and a bias towards megaprojects over maintenance
Short-term bias in project selection New infrastructure investment is unavoidably long-term and this carries certain risks At the stages of early planning and project selection infrastructure decision-makers need to consider the forces shaping a country ndash such as social demographic and technological change ndash while providing sufficient flexibility to address unpredictable adjustments in need These variables do not align well with the typically shorter political cycle where there is often a preference for announcements of major projects that can be hard to execute in practice or where fundamental requirements may be missing (eg unfeasible building requirements or little forecasted demand for use of the infrastructure) To counteract this bias the UKrsquos National Infrastructure Commission (NIC) was established in 2015 to produce analysis that is independent of government and to provide advice on major long-term infrastructure challenges ndash with the specific priority of linking long-term priorities with short-term action The NIC publishes an annual National Infrastructure Assessment (eg NIC 2018) to establish infrastructure needs and priorities over many decades
Having an independent body of experts recommending a stable set of priorities can reduce investment risk as potential private sector partners will have certainty that a project aligns with a broader economic plan Establishing a national plan based on agreed priorities is also good practice for reducing short-termism and improving legitimacy but it can also add rigidity to project selection processes Decision-makers must be careful to balance the benefits of a stable framework with maintaining flexibility to respond to a rapidly changing policy environment
Bias towards mega-projects over maintenance There can be considerable bias towards allocating resource to new (preferably high-profile) projects rather than investing in the necessary maintenance of existing assets There can be a natural reluctance to spend money on what a country already has and there is often political appeal in wishing to establish an individual legacy through the construction of a megaproject Accountants are in a pivotal position to draw attention to the issue of prioritising backlog maintenance to ensure that assets remain in serviceable condition As part of any needs assessments careful consideration must be given to the condition of existing capital infrastructure and its ability to maintain the existing levels of service To balance these demands NHS Scotland publishes an annual assets and facilities report which provides an overview of asset performance and planned future investment (see NHS Scotland 2018) This report offers good practices in quantifying and managing the backlog of maintenance including setting out the total outstanding backlog of maintenance costs per square metre of the estate and the proportion of significant and high-risk maintenance By identifying the maintenance backlog NHS Scotland is able to take the appropriate action to mitigate a reduction in public service quality while also prioritising repairs in line with the metrics established in the annual assets and facilities report
27
28
How accountants can bridge the global infrastructure gap | 3 Selecting projects
Box 32 Accountants and climate-change adaptation planning A Canadian case in point
As governments around the globe move to establish planned spending on infrastructure projects designed to adapt to climate change it is essential that accountants have a role in project selection and planning to help make the business case for resiliency and to ensure adequate accountability
In Canada the efficacy of this practice was illustrated when the City of Montreal developed its Climate Change Adaptation Plan Accountants played an integral role in performing the cost-benefit analysis of embedding adaptation into municipal infrastructure decisions (CPA Canada 2016)
lsquoA less costly option may be deemed adequate today but could result in future costsrsquo explained a participant in the Canadian roundtable
For example if Montrealrsquos sewer pipes cannot withstand increased flooding predicted with climate change sewer backups could lead to additional expenditures such as clean-up costs and even legal liabilities
lsquoClimate change is going to force cities and governments to put in place capital projects and other measures to prevent future losses or damagesrsquo emphasised the participant
Indeed there has never been a more vital time for CPAs to get involved in infrastructure project selection n
The walkway of Saint Anne De Bellevue Montreal Quebec during the floods April 2017Editorial credit Glass and Nature Shutterstockcom
29
4 Financing projects
The economic analysis in this report demonstrates that by 2040 the world will have accumulated an infrastructure gap of over US$14 trillion In response to this challenge governments are adopting novel means of effectively funding and financing their public infrastructure ndash as well as turning to institutional investors foreign direct investment and the private sector
Accountants act as a critical interface between these actors for example through effectively communicating and negotiating the terms of an infrastructure finance deal
41 THE MIX OF PUBLIC AND PRIVATE FINANCE FOR INFRASTRUCTURERespondents to the joint member survey shared the view that infrastructure in their countries should be financed by both the public and private sectors with 85 stating that infrastructure should be financed by some mix of investment from both the public and private sectors Half the total respondents (50) suggested that there should be an even mix between public and private finance while the second most common view was that infrastructure should be primarily financed by the public sector (42) Some countries such as the UK plan for the majority of their future infrastructure investment to come from the private
sector (IFG 2017) and data from the Project Finance and Infrastructure Journal shows that global private finance deals amounted to over US$930bn in 2017 (IJGlobal 2018) Given this environment
it is important for accountants to contribute their financial acumen and professional skills by providing a view on the best means of financing infrastructure projects (Figure 41)
FIGURE 41 How should infrastructure be financed in your country
0 10 20 30 40 50 60
PRIVATE
Entirely private finance
Mostly private finance
Even mix of public and private finance
PUBLIC
Mostly public finance
Entirely public finance
Dont know no opinion
Source The Global Infrastructure Gap survey generalist respondents only n 1645
30
and core public service infrastructure Core public service infrastructure such as hospitals and schools attracted the lowest private finance support
Overall finance and accounting professionals with a specialist background took a balanced view on the appropriate finance sources for infrastructure in their country
42 KEY BARRIERS TO SECURING PRIVATE FINANCE FOR INFRASTRUCTUREThe member survey showed that 85 of respondents believed there should be some mix of public and private sector finance in their countryrsquos infrastructure A key question therefore is what barriers limit the flow of private finance for public infrastructure
Survey respondents with specific expertise in infrastructure (lsquospecialistsrsquo ) provided a detailed breakdown on the suggested balance of public and private investment by each type of infrastructure
7
Almost half (47) of specialist respondents argued that ICT infrastructure should be either mostly or entirely financed by the private sector while other transport ndash such as air or sea ndash ranked as the second highest subsector for private sector investment (36) (Figure 42) There was a consistent view across the infrastructure subsectors that there should be an even mix of public and private investment with between 33 and 46 of specialist respondents holding this view Only three subsectors were seen to benefit from finance originating mostly or entirely from the public sector these were water and sanitation roads and highways
How accountants can bridge the global infrastructure gap | 4 Financing projects
Overall finance and accounting professionals with a specialist background took a balanced view on the appropriate finance sources for infrastructure in their country
FIGURE 42 How should infrastructure be financed in your home country by infrastructure sub-sector
Dont know no opinion PUBLIC Even mix PRIVATE
Information and communication technology
Other transport
Power and energy
Railways
Water and sanitation
Roads and highways
Core public service infrastructure
0 10 20 30 40 50 60 70 80 90 100
n n n n
0 10 20 30 40 50
Insufficient skills in government to negotiate with private sector
Lack of attractiveness of infrastructure investment
Negative perception of private finance for public infrastructure
Regulatory barriers
Perceived political instability in my country
Underdeveloped financial markets in my country
Too few viable projects for private investment
Other
Dont know
FIGURE 43 What are the key challenges that the government faces in securing private finance
Source The Global Infrastructure Gap survey all respondents n 3611
Source The Global Infrastructure Gap survey specialist respondents only n 1966
7 Question 3 of the survey asked respondents if their work involved any of the following areas infrastructure policy procurement capital budgeting project management or operations management
How accountants can bridge the global infrastructure gap | 4 Financing projects
Developing the skills in government to act as competent clients and negotiators will be essential in meeting the challenges of providing the right finance for infrastructure projects
As seen in Figure 43 ACCA members and CPA Canada members identified three key barriers for governments working to secure private finance
Barrier 1 the lack of attractiveness of infrastructure investment (42)
Barrier 2 the negative perception of private finance for public infrastructure (43) and
Barrier 3 insufficient skill in government to negotiate with the private sector (45 of respondents)
The distinction between lsquofundingrsquo and lsquofinancingrsquo infrastructure (set out in the next section) helps explain the lack of attractiveness of infrastructure investment and what accountants might do to reduce this problem The higher cost and perceived private gain from public goods is a significant factor in the negative perception of private finance investing in public infrastructure The UK National Audit Office published a report in January 2018 calling out the high rates of return enjoyed by private investors participating in the Private Finance Initiative (Morse 2018) Therefore accountants must take centre stage in
demonstrating the higher cost of private capital managing the transfer of risk between sectors and building an evidence base for selecting the right financing model to support an infrastructure project
Finally developing the skills in government to act as competent clients and negotiators will be essential in meeting the challenges of providing the right finance for infrastructure projects For example there is growing recognition that gold-standard public finance takes account of more than debt stocks and cash flows (eg debt to GDP ratio and tax receipts) and instead needs to consider net wealth particularly public assets Cultivating the skills in government to produce a public sector balance sheet and applying this perspective to the finance selection process will help policymakers maximise the value of their assets and make better infrastructure finance decisions
The remainder of this chapter will discuss these barriers in order to inform areas where public sector accountants can make a difference in closing the infrastructure gap
FIGURE 44 Key barriers in financing infrastructure projects
Lack of attractiveness
of infrastructure investment
Negative perception of
private finance for public
infrastructure
Insufficient skill in government
to negotiate with the
private sector
BARRIER 1 BARRIER 2 BARRIER 3
42 43 45
31
How accountants can bridge the global infrastructure gap | 4 Financing projects
Investment in infrastructure offers the opportunity for private investors to benefit from stable long-term low-risk returns that are tied to a physical asset
43 BREAKING DOWN BARRIER 1 BY CLOSING THE FUNDING GAP
Investment in infrastructure offers the opportunity for private investors to benefit from stable long-term low-risk returns that are tied to a physical asset A key challenge in connecting this pool of private capital with the demand for infrastructure projects is the funding gap Broadly there are three ways of funding (lsquoultimately paying forrsquo) an infrastructure project
Distinguishing between funding and financing It is important to make a clear distinction between the lsquofundingrsquo and lsquofinancingrsquo of infrastructure projects When a private sector institution such as a bank or pension fund finances a public infrastructure project it is providing the upfront money to allow for the design building and operation of that project whereas lsquofundingrsquo is how an infrastructure project is ultimately paid for (Institute for Government 2018)
Global capital markets can help plug the global infrastructure gap Institutional investors with an estimated US$80 trillion in assets under management (Fages et al) seem ideal partners for providing the required finance to reduce the size of the forecasted global infrastructure gap Their risk appetite and the duration of their liabilities match the needs of typical infrastructure projects that will often have life cycles ndash from design to decommission ndash that can span many decades
bull general taxation
bull user charges (eg toll roads) and
bull novel forms of funding (eg value capture and civic crowdfunding)8
This distinction explains why even where private investors have expressed interest in public infrastructure and while the global infrastructure gap grows the response has been relatively muted (McKinsey 2016a) Private investors understandably require a stream of revenue to support their upfront outlay but many potential (even lsquoshovel readyrsquo) projects do not include the long-term funding arrangements to support private finance
FIGURE 45 The funding gap
Global Infrastructure Investment Gap
(forecasting a US$14 trillion gap by 2040) FUNDING
GAP
Institutional Investors
(US$80 trillion under management)
8 Refer to Institute for Government 2018 for an overview of the advantages and disadvantages of different infrastructure funding options
32
Box 41 Hong Kongrsquos MTR Corporation ndash fully funded infrastructure through value capture
Hong Kong has applied a novel form of infrastructure funding that has attracted global attention MTR Corporation is majority owned by the Hong Kong government and manages a passenger rail system that makes a profit It manages to generate revenue in excess of 180 of its operating cost
One factor in MTRrsquos financial success has been its lsquoRail plus Propertyrsquo model where the corporation captures some of the positive externalities of its transit operations by developing and renting the land surrounding its rail stations
Hong Kong is particularly suited to this form of funding with its dense population and high real estate costs which have allowed MTR to create sustainable revenue streams from the development of the land surrounding its stations (Leong 2016 MTR Corporation 2017) n
Innovative models of funding infrastructureGeneral taxation and government capital allocations provide an important foundation for funding public infrastructure while user charges can provide a stream of revenue (eg road tolls) ndash subject to demand risks There are also emerging models that are helping to plug the funding gap Rent capture is attracting attention as a method of funding transit (see Box 41 on the MTR Corporation in Hong Kong for an example) In addition civic crowdfunding a novel form of funding is spreading in popularity A report from Catapult Future Cities (2017) found that 10 of local governments in the UK now make use of some form of civic crowdfunding to transform their communities Spacehive ndash a UK crowdfunding platform ndash has attracted over pound11 million in funding since 2012 to fund over 550 local projects including building new community centre facilities (Spacehive 2019) Platforms such as Spacehive connect grant providers local governments and residents that collectively contribute to projects as well as providing a service to verify that a project is viable and has received the required government permissions In 2017 the Mayor of London committed pound400000 to Spacehive projects (OrsquoDowling-Keane 2017) As governments face constrained budgets public sector
finance officials can play a central role in supporting these novel forms of infrastructure funding by establishing what proposals are financially viable in order to help plug the infrastructure gap
The role of the accountant in addressing the funding gapBeyond these novel funding models accountants can play an important role by helping to identify the most efficient funding models while also taking a leading role on the negotiation with potential private sector investors and representing the public interest through their high ethical standards
Clearly the funding gap is a factor in lsquothe lack of attractiveness of infrastructure investment for private investorsrsquo identified in the member survey Finance professionals should consider a number of factors in formulating effective business cases that can attract private sector finance (eg in articulating the lsquoprivate sector incentiversquo) The financial viability of the project needs to be balanced against affordability for users and access to public goods and services Accountants must consider how they can develop and communicate the private sector incentive for investing in priority projects while also supporting the public interest and providing taxpayers with value for money
33
How accountants can bridge the global infrastructure gap | 4 Financing projects
General taxation and government capital allocations provide an important foundation for funding public infrastructure while user charges can provide a stream of revenue (eg road tolls) ndash subject to demand risks
34
How accountants can bridge the global infrastructure gap | 4 Financing projects
44 BREAKING DOWN BARRIER 2 BY ACCOUNTING FOR THE HIGHER COST OF PRIVATE CAPITALRunning infrastructure projects efficiently for citizens also requires that accountants provide decision-makers with the best advice possible in selecting the appropriate source of project finance
The UK is a global leader in the use of private finance and has over 700 operational private finance deals ndash with total projected future charges arising from these deals of almost pound200bn (Morse 2018) In 2018 The UKrsquos National Audit Office published a report examining the rationale costs and benefits of private finance for public sector projects (Morse 2018) The reportrsquos analysis of Department for Education data showed that the cumulative cost of privately financed projects can exceed the public sector
finance costs by 40 over the life of an infrastructure project The broader benefits of private finance for example transferring risk away from government must therefore outweigh the higher total life-cycle cost of private capital
Off balance sheet liabilities in public sector accountingThe UK is not alone in making use of private finance to provide the upfront capital for public infrastructure The accounting rules set by the European System of Accounts excludes liabilities from public sector balance sheets if the private sector bears most of the projectrsquos risks and rewards The types of risk contributing to this test include construction risks (eg cost and time overruns) and demand risks (eg forecasted and actual use of the infrastructure asset) (Atkins et al 2017) Liabilities not included
By the nature of the public sector there are many competing short-term needs for public capital investment where necessary infrastructure investment must compete with other public spending priorities
35
30
25
20
15
10
05
0
Portu
gal
Slov
akia
Hungar
y
UK
Cypru
s
Irelan
dN
ethe
rland
s
Spain
Denm
ark
Esto
nia
Belgiu
m
Gre
ece
Croat
ia
Austri
a
Malt
a
Italy
Finl
and
Latv
ia
FIGURE 47 Off balance sheet PPPs as of GDP
Source ACCA and CPA Canada analysis of Eurostat 2018
FIGURE 46 Estimated cash flows of a privately and publicly financed projectThe cumulative cash costs of a group of PF2 schools are around forty per cent higher than the costs of a project financed by government borrowing
350000
300000
250000
200000
150000
100000
50000
0
Cumulative cash costs (pound000)
2015 2016 2017 2018 2019 2020 2021 2022 2023 2024 2025 2026 2027 2028 2029 2030 2031 2032 2033 2034 2035 2036 2037 2038 2039 2040 2041 2042
Benefits needed to offset higher costs of private finance procurement
PF2 unitary charges Public sector comparator (PSC) with government borrowing costs
Notes1 Cost estimates taken from data prepared by the Department for Education to compare costs of a group of privately financed (PF2) schools with a public sector comparator (PSC)
2 Interest costs for the PSC have been modelled using an amortising loan with an interest rate of 25 The 20-year government borrowing costs were 25 at the time of financial close of this project and the average life of the project debt was less than 20 years
Source Education Funding Agency National Audit Office analysis Reproduced from Morse 2018
How accountants can bridge the global infrastructure gap | 4 Financing projects
Accountants in the public sector must play a critical role in managing both these benefits while also collecting reliable data to measure whether private finance provides good value for money
on the public sector balance sheet are known as off balance sheet (OBS) liabilities Data from Eurostat shows that other European countries have amassed considerable OBS liabilities ndash with outliers such as Portugal and Slovakia maintaining OBS liabilities in excess of 3 of GDP (Eurostat 2018)
An incentive for using private finance can arise through the combination of fiscal rules such as the EUrsquos Fiscal Compact requiring governments to meet debt reduction targets (European Commission 2017) and the ability to keep certain liabilities off the balance sheet through private finance Governments will be encouraged to use private finance even when it ultimately costs more than traditional public finance when this generates the fiscal illusion of adhering to fiscal rules while at the same time building and operating necessary infrastructure In addition to the fiscal illusion these treatments limit the transparency of infrastructure finance by shielding some politicians and the public from understanding the true cost of infrastructure investment in a particular country
Insufficient flexibility between capital and operational budgets can cause further challenges This is particularly the case where a public sector entity can attribute the unitary charge9 from a private finance deal to its operational budgets in cases where the capital budget includes insufficient funding for a required project By the nature of the public sector there are many competing short-term needs for public capital investment where necessary infrastructure investment must compete with other public spending priorities ndash such as the growing operational costs of health care and education But over time high unitary charges can crowd out operational budgets and prevent future governments from providing quality public services
Why use private finance for public infrastructure Given all these concerns it is unsurprising that in the October 2018 Budget Speech the UK Chancellor confirmed that the government would not sign any new Private Finance Initiative (PFI) contracts (Plimmer 2018) Given this environment it is worth asking what is the genuine rationale for private finance in public infrastructure
Two key benefits can justify the use of private finance for public infrastructure the appropriate transfer of risk from the public to the private sector in the building and running of the infrastructure and efficiencies achieved through the use of private sector money in the financing building and operation of public infrastructure Accountants in the public sector must play a critical role in managing both these benefits while also collecting reliable data to measure whether private finance provides good value for money The next chapter explores findings from the member survey on how best to manage the relationship between public and private actors involved in infrastructure projects
At the early stages of a projectrsquos conception accountants are also critical in selecting the right type of finance where they can provide a transparent assessment of the best finance option based on sound principles (eg value for money affordability for users and distribution impacts) Previous ACCA research shows the high level of trust in the ethical behaviour of accountants Ethics and Trust in a Digital Age (ACCA 2017) found that 9 in 10 professional accountants agree that ethical behaviour helps to build trust in the digital age And almost all C-suite executives (95) assert that the accountantrsquos ethical behaviour helps the organisation build trust with internal and external stakeholders Accountants can offer a collective good through this privileged position of trust by providing sound transparent advice on the best finance option for a particular infrastructure project
9 The recurring payments by governments for privately financed projects
35
How accountants can bridge the global infrastructure gap | 4 Financing projects
The barrier to attracting private finance for infrastructure most cited in the member survey was that governments have insufficient skill to negotiate effectively with the private sector (45)
45 BREAKING DOWN BARRIER 3 BY PROFESSIONALISING THE PUBLIC SECTOR FINANCE FUNCTION The barrier to attracting private finance for infrastructure most cited in the member survey was that governments have insufficient skill to negotiate effectively with the private sector (45) This issue was echoed in the roundtables with participants in Trinidad and Tobago stating that there was a clear need to differentiate professional accountants from those who had no real professional training lsquoterms are used very loosely in this country as to an accountant and most times you would mean ldquobookkeeperrdquorsquo Others in Malaysia noted that lsquomany accountants nowadays lack the right specialisation of skills in terms of having foresight to anticipate what costshellipcome into play [in an infrastructure project]rsquo Clearly there are skills gaps in government that need to be addressed through professionalisation and upskilling if infrastructure is to be properly financed
Finance professionals offer a net wealth perspective Knowing what the country owns and what it owes is a basic requirement for reducing its governmentrsquos information deficits which will allow for improved decision-making in financing infrastructure The professional management of assets and the development of an asset register are two examples of how accountants can take the lead in improving government decision-making In the UK roundtable discussion David Smith associate partner at EY UK also acknowledged the essential role of accounting standards
lsquoAccountantsrsquo work now goes beyond compliance but compliance is our firm foundation Speaking from experience we have global accounting rules that do not necessarily align jurisdiction by jurisdiction but the rules are there for a reason If therersquos deviation or rejection of accounting standards for infrastructure projects at any stage then that is a clear red flagrsquo
Global studies are documenting how the benefits of accrual accounting are leading to broad global adoption For example the 2018 International Public Sector Financial Accountability Index forecasts that within the next five years 65 of governments will report on an accrual accounting basis ndash with particularly high levels of adoption in Africa Asia Latin America and the Caribbean (IFAC and CIPFA 2018)
The professionalisation of the finance function is essential in maximising the value of a countryrsquos assets There is growing recognition that gold-standard public finance practice takes account of more than debt stocks and cash flows (eg debt to GDP and tax receipts) and instead needs to consider net wealth where the right policies can maximise the return on public assets This approach requires the adoption of full accrual accounting and the production of a public sector balance sheet Improving the skills available to government to develop a public sector balance sheet and appreciating the full balance sheet impact of a new project will be an important step in allowing public sector accountants to act as competent clients of and negotiators with the private sector
36
How accountants can bridge the global infrastructure gap | 4 Financing projects
37
Maximising the value of public assets and the intertemporal balance sheetDag Detter a former director of Swedenrsquos Ministry of Industry argues that taking a net wealth perspective with the aim of producing small improvements in the return on public assets would allow for a doubling in infrastructure investment (Detter and Folster 2017) The competing argument to this view is that many public assets are not marketable as policy objectives (eg running a public school) do not typically align with generating financial returns
The New Zealand government seeks to address this issue by classifying its assets and liabilities as social financial and commercial ndash where commercial assets have more scope for financial returns New Zealand has taken the lead in public
The adoption of this net wealth perspective changes the typical rankings of public financial capability In late 2018 the IMF Fiscal Monitor published a report (IMF 2018) which estimated that globally governments had public assets worth over 200 of GDP Applying this analysis can also support good public financial management in a country with the IMF report showing that countries with a strong balance sheet pay lower interest on debt and have shorter and shallower recessions
Figure 48 shows the result of adopting a net wealth view of a nationrsquos financial position Using this lens Japan ndash with a notoriously high public-debt-to-GDP ratio ndash has a net wealth position near zero Other countries such as the UK and Portugal have substantial negative public equity in excess of 100 of GDP
The professionalisation of the finance function is essential in maximising the value of a countryrsquos assets
FIGURE 48 Public sector balance sheets ( of GDP)
750
500
250
0
-250
-500
Port
ugal
Uni
ted
Kin
gd
om
The
Gam
bia
Ger
man
y
Bra
zil
Fran
ce
Aus
tria
El S
alva
do
r
Uni
ted
Sta
tes
Ug
and
a
Jap
an
Ken
ya
Tanz
ania
Can
ada
Ind
ia
Gua
tem
ala
Finl
and
Alb
ania
Co
lom
bia
Tuni
sia
Geo
rgia
Sout
h A
fric
a
Aus
tral
ia
New
Zea
land
Ind
one
sia
Ko
rea
Peru
Kaz
akhs
tan
Russ
ia
No
rway
n Financial assets n Total non-financial assets n Liabilities ex pension n Pension liabilities Net worthTu
rkey
Source IMF staff estimates
Based on a single year of data in most cases compiled as part of the Fiscal Transparency Evaluation Albania 2013 Austria 2015 Brazil 2014 Colombia 2016 The Gambia 2016 Guatemala 2014 Kenya 2013 Peru 2013 Portugal 2012 Tanzania 2014 Tunisia 2013 Turkey 2013 Uganda 2015
38
How accountants can bridge the global infrastructure gap | 4 Financing projects
TABLE 41 New Zealand Intertemporal balance sheet 2016(Percentage of GDP)
ASSETS LIABILITIES NET WORTH
Social 575 71 505
Financial 332 505 -173
Commercial 201 120 81
Static balance sheet 1108 695 413
Fiscal 13819 14800 -981
Intertemporal balance sheet 14927 15495 -568
Source New Zealand 2017 Investment Statement IMF 2018
Box 42 New South Wales Treasury Asset and Liability Committee
The state of New South Wales in Australia has established an Asset and Liability Committee to maximise the value of their assets and properly manage the statersquos liabilities
By using this total balance sheet perspective the New South Wales Treasury has been able to unlock AU$33bn for new social and economic infrastructure projects
This initiative was recorded as part of a series undertaken by ACCA and the International Federation of Accountants (IFAC) documenting good practices in public financial management from around the world To learn more scan the QR code to hear more about this initiative in NSW
If the public sector finance function is professionalised accountants working in the public sector will be able to lead the development of the required governance structures to maximise the value of public assets And where public assets do present commercial opportunity accountants must be at the forefront of proper public commercial asset management By providing independent professional management for public assets governments will be well placed to maximise the value of their assets and minimise the cost of liabilities The member survey shows that reducing political influence in project selection was ranked as the number one issue for improving outcomes Allocating more decision-making authority to independent professional accountants will be an important step in the effective commercial management of public assets
financial management practices not just through this classification but also by producing an intertemporal balance sheet (see Table 41) The country currently maintains a strong net worth position in excess of 40 of GDP but analysis by the New Zealand Treasury shows that the current policy framework will produce recurring deficits that are forecasted to reduce the nationrsquos net worth to almost ndash57 of GDP over the next 40 years Accountants producing this analysis provide decisions-makers with a better long-term view of their policy decisions and can help improve the sustainability of public finances This fits with the maxim that lsquoyou manage what you measurersquo and governments that invest in their finance functions to develop a public sector balance sheet will be better placed to understand the implications of a particular infrastructure project on the nationrsquos net wealth
Where public assets do present commercial opportunity accountants must be at the forefront of proper public commercial asset management
Poor monitoring and oversight of
projects by government
Confusion about where
each side provides value
in a PPP
Uncoordinated commerical
acumen in the public sector
BARRIER 1 BARRIER 2 BARRIER 3
5 Delivering projects the publicndashprivate relationship
Common challenges with infrastructure project selection and financing outlined in the previous chapters may persist through the project delivery phase a shortfall in public capital budgets due to short-term decision-making changing political governance and the lsquomegarsquo risks associated with lsquomegarsquo projects For these reasons public-private partnerships (PPPs) are often chosen for the delivery of public infrastructure projects
51 DEFINING PPP In the context of public infrastructure projects a PPP is a contractual agreement between a public sector entity and a private entity (or group) to provide a public asset or service (World Bank 2018b) Unlike traditional procurement ndash where all the risk will ultimately sit with the government ndash PPPs will explicitly set out the allocation of risk for a project Importantly the scope of private sector involvement can vary substantially including requiring private sector partners to
bull design and build a project
bull design finance and build a project or
bull design finance build operate and maintain a project
Asset ownership is another relevant consideration in establishing the terms of a PPP A project can feature public or private sector ownership of the infrastructure and can include provisions to transfer ownership after a set period (eg a private sector partner operates a toll road for 20 years and thereafter transfers ownership of the road back to the public sector)
The roundtable discussion rightly identified the variety of responsibilities that the private sector can adopt in
a PPP For example a participant in the Canadian roundtable identified that the lsquoprivate sector needs to bring more to the government table than just money it needs to offer expertise or opportunity that the government would not otherwise haversquo
52 KEY BARRIERS TO GETTING THE PPP RELATIONSHIP lsquoRIGHTrsquo The public-private relationship is evolving and getting the terms of this relationship right will be critical for the provision of social and economic infrastructure in the future The roundtable discussions with infrastructure experts highlighted three key barriers to this where there was a particular focus on the need to develop the right relationship between public and private sector actors ndash as getting this
relationship right would support the timely and efficient delivery of infrastructure projects (Figure 51)
The roundtable participants identified poor monitoring and oversight by government as a key challenge in delivering infrastructure projects The member survey demonstrated that there was considerable disagreement about where each party in a PPP agreement provides value in delivery Finally the roundtable participants stated that the public sector was often lacking the commercial acumen required to manage an infrastructure PPP effectively
Below this chapter examines these barriers in greater detail and reviews recommendations for overcoming each one
FIGURE 51 Key barriers in delivering infrastructure projects
3939
How accountants can bridge the global infrastructure gap | 5 Delivering projects the publicndashprivate relationship
Both developed and developing countries need to consider whether they are providing sufficient monitoring across the entire project life cycle to maximise the value of their contracts
53 BREAKING DOWN BARRIER 1 BY ENGAGING THE PROFESSIONAL ACCOUNTANT TO PROVIDE PROJECT LIFE-CYCLE MONITORING AND OVERSIGHT Successful project selection financing and procurement will be of little effect if an infrastructure PPP suffers from poor contract management Managing project risk effectively ndash as well as controlling for scope and budget lsquocreeprsquo ndash requires the public sector to act as a competent client by providing effective monitoring and oversight of a project at every stage from design to operation of the infrastructure
Unfortunately these governance structures are often lacking in many countries with a participant in the Sri Lankan roundtable discussion noting that lsquoprojects [will] kick off but there is no one to monitor them on an ongoing basis This can lead to cost overrunsrsquo Written evidence by the Chartered Institute of Purchasing and Supply (2013) to the UK House of Commonsrsquo Public Administration Select Committee echoed this point In this evidence the Institute submitted that lsquoprocurement skills tend to focus on the call for competition to award the contract rather than on the whole procurement cycle which includes pre-procurement and contractsupplier managementrsquo Both developed and developing countries need to consider whether they are providing sufficient monitoring across the entire project life cycle to maximise the value of their contracts
Chapter 1 section 15 showed that corruption was one of the top barriers to meeting infrastructure need in certain
FIGURE 52 Possible parties to a PPP
regions ndash with 89 of survey respondents in South Asia citing this as a key barrier A roundtable participant in Trinidad and Tobago asserted that proper monitoring of project performance was essential for mitigating corruption particularly lsquohaving something that can support the accountants in countries with no whistle-blowing policyrsquo In addition Abiodun Akanbi from the Nigerian roundtable commented that lsquothe accountant has huge responsibility in measuring the actual performance of contractors to be able [to] efficiently deliver infrastructurersquo The accountant needs to be at the forefront of providing the public sector assurance that the project is being delivered as contracted and according to the project plan Clearly accountants in the public sector have a critical role to play in effective contract management ndash particularly by measuring project progress against agreed terms at key milestones in the delivery process
Reducing moral hazard in the PPP relationship Eriksson and Lind (2015) describe moral hazard as lsquopost-contractual opportunismrsquo There are three key parties that need to be considered in an infrastructure PPP the owner the contractors building the infrastructure and the investor Depending on the structure of the PPP contract any of these roles could be taken on to varying degrees by the government or a private partner Given the limited oversight and governance of many PPPs cited in the roundtable discussions the agents of a PPP project (ie the contractors) will often have the incentive to reduce costs by cutting corners in the projectrsquos execution
Investor Contractor
Owner
40
How accountants can bridge the global infrastructure gap | 5 Delivering projects the publicndashprivate relationship
41
54 BREAKING DOWN BARRIER 2 BY IMPROVING THE INCENTIVES AND RECONCILING DIFFERING VALUE ASSUMPTIONSThe member survey compared the perceptions of public and private sector accountants revealing areas where differing assumptions exist between these parties The survey divided respondents into those working in the public sector and those in the private sector Each group was asked in what ways the other sector provided and received value in PPP infrastructure projects Comparing these results demonstrates where the public and private sectors had a similar view on the purpose of a PPP relationship and where their assumptions on the purpose of the relationship differed (Figure 53) These insights are helpful in highlighting divergent views on the role of each sector where incorrect assumptions can harm the ability of a PPP to deliver a project
Comparing the results from each sector in Figure 53 shows that there was broad agreement on how the private sector adds value to infrastructure projects The ordering of the responses was the same for professionals across the two sectors with the majority of respondents from both sides agreeing that the private sector contributes to the partnership through its knowledge of best practice the application of innovation and access to private capital Interestingly respondents from both sectors were less likely to see risk transfer as an area where the private sector provides value The
These three stakeholders shown in Figure 52 will often have different motivations For example the owner might want to increase the scope of the contract after it is agreed For this reasonaccountants must assess the risks balance the costs and schedule and proactively communicate with all stakeholders to support the success of the project
Allocating risk to reduce moral hazardA CPA Canada roundtable participant rightly identified that lsquothe key areas of interface [between the public and private sector] are between the risks retained by the public sector and their impact on the private sectorrsquos ability to deliver on their contractual commitmentsrsquo Getting this allocation of risk right can significantly improve the prospects that a PPP project will be completed on time and on budget as the right risk balance will act as an incentive to meet contractual obligations (Mann 2018)
Accountants play a clear role here The professional team delivering a project will be aided by an accountantrsquos expertise of risk management ndash particularly the accountantrsquos ability to allocate risk appropriately between the parties in order to minimise moral hazard Although the size and nature of the public sector suggests that it is better placed to bear risk skilled finance professionals will seek to balance the allocation of risks to the private parties such that they maintain the incentive to perform contractual obligations to a high quality standard
Comparing the results from each sector in Figure 53 shows that there was broad agreement on how the private sector adds value to infrastructure projects
Source The Global Infrastructure Gap survey all respondents n 3611
70
60
50
40
30
20
10
0Applying innovative
practices and fresh thinking
Knowledge of best practice and expertise
n Private sector view n Public sector view
Access to private capital
Delivering projects on time
Keeping projects to budget
Transferring risk Dont know None of these
FIGURE 53 Where does the private sector add value in delivering infrastructure
42
How accountants can bridge the global infrastructure gap | 5 Delivering projects the publicndashprivate relationship
assumptions about how each party adds value to an infrastructure PPP contract ndash and suggests that public sector actors overestimate the value of the financial arrangements on offer to private sector partners
The UK Guarantees Scheme (UKGS) offers an example of a good practice that could help improve the private sector incentive for entering PPPs and partially reconciles the differing assumptions of value between both sectors The UK Infrastructure and Projects Authority states that the UKGS lsquosupports private investment in UK infrastructure projects It works by offering a government-backed guarantee to help infrastructure projects access debt finance where they have been unable to raise finance in the financial markets The UKGS can issue up to pound40 billion of guarantees and is open to at least 2026rsquo (UK Government 2017) This long-term commitment guarantees the payment of principal and interest on infrastructure debt and is intended to support lsquonationally significantrsquo projects If well implemented schemes like this can encourage additional private sector involvement in the provision of infrastructure ndash but should be balanced against the need to reduce the risk of moral hazard discussed earlier in this chapter
comparison of perceptions also showed that public sector respondents were slightly more positive about the overall value that private sector actors bring to the relationship
There was considerable divergence in opinion between sector respondents as to the areas where the public sector provided value in an infrastructure PPP (Figure 54)
Public sector respondents were much more likely to argue that they provided both a lsquolong-term and stable partnershiprsquo (62) and knowledge of how the public sector works (60) than their private sector colleagues (45 and 43 respectively) Finance professionals from the public sector were also more likely to claim that they provided the private sector with access to projects (45) compared with 35 in the private sector At the same time there was an agreement that the public sector was less likely to offer knowledge of best practice and innovation to a PPP relationship Therefore both sides took a largely similar view of the origin of knowledge and expertise but the public sector respondents were more optimistic about the value they provided as a financial partner in infrastructure projects Understanding this divergence of viewpoint is helpful in identifying the
There was considerable divergence in opinion between sector respondents as to the areas where the public sector provided value in an infrastructure PPP (Figure 54)
Source The Global Infrastructure Gap survey all respondents n 3611
70
60
50
40
30
20
10
0Long-term and
stable partnershipKnowledge of how the
public sector works
n Private sector view n Public sector view
Access to projects Knowledge of best practice and expertise
Applying innovative practices and fresh thinking
None of these Dont know
FIGURE 54 Where does the private sector receive value from the public sector in delivering infrastructure
How accountants can bridge the global infrastructure gap | 5 Delivering projects the publicndashprivate relationship
To ensure that an infrastructure project is successful strong commercial acumen is essential team members require lsquobusiness savvyrsquo a keen understanding of the market in which the project is being undertaken
55 BREAKING DOWN BARRIER 3 BY FACILITATING PUBLIC SECTOR ACCESS TO BUSINESS EXPERTISE To ensure that an infrastructure project is successful strong commercial acumen is essential team members require lsquobusiness savvyrsquo a keen understanding of the market in which the project is being undertaken Nonetheless as Ajith Lekshmanan a participant in the UK roundtable pointed out
lsquoFor a lot of these projects the [public sector] organisation may just be doing it the one time Itrsquos a one-off and these experts that we are going to [in the private sector] theyrsquove got a whole pool of people doing similar things year after year day after day in this country and other countries The skills required are quite specialist and to train a member of staff [in the public sector] to do it just for the one time that you might be using it is not cost effectiversquo
A public sector entity might manage a large-scale infrastructure project and gain valuable expertise in the process but that expertise may not be accessible to other public sector entities for leveraging in their own infrastructure projects In the public sector project-delivery expertise thus exists in silos It is often the private partners in a PPP who through repeated projects acquire the commercial acumen and therefore potentially hold the expert lsquoreinsrsquo
Centralisation of public sector skills may facilitate removal of this barrier For example the UK Civil Service has created Centres of Excellence that seek to pool the pockets of expertise that exist in the public sector such that any organisation within the public sector can refer to these centres and draw on their specialist skill and thus act as a competent client The professional accountant offers specialist skill and should certainly be a key player in any centre of excellence In fact the accountantrsquos role as an expert team member in such centres may provide as stated by a participant in the Malaysian round table ldquobetter marketing of how the profession contributes to society to encourage professionals to continue doing the right thing and be proud of itrdquo
Centralisation of skills will not however be the answer for all governments Others might seek to encourage cross-departmentministry collaboration to facilitate effective knowledge transfer of commercial acumen across the public sector In both cases collaboration is essential for effective knowledge transfer and as previously outlined the professional accountant with an understanding of life-cycle considerations and with professional frameworks for sound professional judgement and ethics is well-equipped to coordinate such collaboration
43
6 The role of the accountant in bridging the gap
61 CURRENT INFRASTRUCTURE PROJECTS THE MISSING TEAM MEMBER The successful provision of public infrastructure requires governments to have the right professional team in place And yet a clear message resounded from the international roundtable discussions a key player is often missing from the infrastructure project team ndash the accountant A representative at the Malaysian roundtable echoed the sentiment expressed by other participants worldwide that accountants are often only invited to comment on infrastructure projects that have already been selected lsquoSo the harm has been donersquo
As pointed out by a participant in the UK roundtable the role of the accountant has evolved over the years from a focus on lsquoguidelines parameters tick boxes and flowchartsrsquo to a much lsquowider awarenessrsquo Certainly the fact that accountants around the globe work within diverse segments of the economy and serve in key roles such as CEO and CFO and as consultants attests to that lsquowider awarenessrsquo The role of the accountant is at the centre of the planning process and not only in the areas of infrastructure policy The accountant can put the lsquonumbersrsquo on ideas and concepts by applying consistent methodology to ensure they are evaluated against other options for meeting policy goals
Future infrastructure projects the essential team member The previous chapters examined the barriers associated with three fundamental phases of infrastructure projects project selection project financing and project delivery With modern qualifications that facilitate barrier removal in each of these phases the accountant plays an essential role in bridging the global infrastructure gap
The international roundtable participants highlighted the following core competencies
a) Planning and selection of projects The accountant
bull develops strategy identifies goals objectives and ensures they can be achieved (giving consideration to financial constraints and potential monetary gains)
bull sets frameworks and uses standard assessment tools to ensure accountability and transparency and prioritisation according to evidence of need
bull questions project assumptions and assesses alternative scenarios
bull employs mechanisms to ensure ethical behaviour and to eliminate corruption while offering sound risk assessment
bull supports organisationsrsquo holistic decision-making in a way that accounts for the impact of climate change on strategy risk and operational and financial performance thus enhancing organisational resilience
b) Financing projects The accountant
bull considers sustainable finance options including climate-change adaptation and resiliency needs
bull assesses financial viability and identifies long-term impact and strategies for risk mitigation
bull acts as a visionary by providing sound life-cycle advice to decision makers and giving them better understanding of the long-term financial difference between maintaining services and enhancing services and of how the latter can create greater cost pressures over time
bull supports clearer and more objective public discourse increases public awareness of risks and supports taxpayersrsquo better understanding of the value of projects
c) Delivering projects and oversight The accountant
bull implements the required monitoring and oversight
44
How accountants can bridge the global infrastructure gap | 6 The role of the accountant in bridging the gap
Accountants offer important competencies to any business team in any sector But in the face of possible misconceptions of the role of accountants what is the way forward onto the professional infrastructure team
bull allocates project risk between parties of a PPP to reduce moral hazard
bull is supported by several frameworks (eg ICAS 2012 KPMG 2013) for professional judgement and ethics that promote the use of logic flexibility consistency reliability relevant evidence unbiased information and alternative framing to avoid precipitous decisions and that promote a balance of experience knowledge and emotion
62 NEXT STEPS TOWARD THE INFRASTRUCTURE TEAM Accountants offer important competencies to any business team in any sector But in the face of possible misconceptions of the role of accountants what is the way forward onto the professional infrastructure team The international roundtable participants made the following recommendations
bull Increase awareness of the accountantrsquos qualifications as a strategic business adviser and as an essential member of the professional infrastructure team alongside the engineers and architects
bull Equip accountants to voice arguments that are compelling both to political leaders and to the general public
bull Offer elected officials the opportunity to gain financial training from accountants so that they understand the true costs and are better equipped to act as financial ambassadors
bull Establish an accountant-informed certification process for project selection
bull Develop and implement clearer governance structures and decision-making processes that involve the finance function
bull Institute whistle-blowing protection legislation for accountants internationally
45
7 Recommendations based on observed good practice
To tackle the growing global infrastructure gap this report offers a variety of observations and international good practices Below is a summary of the recommendations arising from the reportrsquos analysis demonstrating the variety of functions and actions in which accountants can lead to help close the infrastructure gap
71 SELECTING PROJECTS Chapter 3 demonstrated that the lack of standard assessment tools and ineffective political decision-making hampered project selection To help address these challenges some countries establish expert-led bodies to forecast infrastructure need and make recommendations to government as to which projects to build Governments should also balance maintenance and new infrastructure spending by disaggregating expenditure on maintenance and new projects while prioritising the backlog of maintenance to ensure that assets remain in serviceable condition
To improve decision-making further accountants should collect better data on the service potential of existing infrastructure as well as the performance of past projects Together these data will allow accountants to offer new insights to inform the project selection process To reduce the bias towards large projects over maintenance governments should disaggregate expenditure on infrastructure to report both maintenance and new project spend
This report found that there is no standard project selection process for infrastructure projects used by governments around the world and that the underlying need ndash or service gap ndash is not well established or proven Therefore accountants must take the lead in applying selection standards such as the Project Management Body of Knowledge (Project Management Institute 2017) guide and the World Bankrsquos Investment Project Financing (World Bank 2016) policy to structure decision-making better and move beyond short-term thinking and biases
There is also a growing need to build climate change risk into long-term planning and the decision-making on project selection The Montreal Canada case example (see Chapter 3 Box 32) shows how accountants should produce cost-benefit analysis and business cases to embed adaptation and resilience into municipal infrastructure decisions
In summary governments should 1 Establish expert-led bodies to forecast
infrastructure requirements and recommend projects on the basis of need
2 Collect reliable data on the service potential of existing infrastructure and on the performance of past projects
3 Disaggregate expenditure on infrastructure to report both maintenance and new project spend
Accountants should 4 Take the lead in applying standard
selection tools to determine the need for and priority of a project
5 Advise on the distributional impact and regional growth outcomes of selecting particular projects good practice in this area can be found in Japan
6 Embed adaptation and resilience into the project-selection process
46
How accountants can bridge the global infrastructure gap | 7 Recommendations based on observed good practice
Governments should direct supreme audit institutions to monitor the interaction of off balance sheet liabilities and fiscal targets
72 FINANCING INFRASTRUCTURE PROJECTS
assets Officials in New South Wales Australia were able to unlock an additional AUS$33bn to invest in public infrastructure by adopting a total balance sheet perspective (see Chapter 4 Box 42) Accountants should disaggregate public assets in the balance sheet to include commercial social and financial assets This information will be especially effective for identifying underused commercial assets but it is also important to be aware of overall value for money for citizens when selling an asset (eg selling a public asset that was previously free to use but will now attract a user charge imposed by the private sector owner)
Chapter 4 on financing infrastructure highlights three key barriers closing the funding gap accounting for the higher cost of private capital and the need to professionalise the public sector finance function
This report identifies emerging and good practices from around the world that help reduce the funding gap Decision-makers should consider innovative solutions to closing the funding gap such as a value capture and civic crowdfunding For example the MTR Corporation in Hong Kong demonstrates that implementing a transport model that captures the positive externalities of new transit can make some public infrastructure self-funding (see Box 41)
To ensure value for money in infrastructure policy accountants must advise public sector decision-makers on how to make efficient capital allocations A real challenge in this respect is the interaction of fiscal targets and off balance sheet (OBS) liabilities Chapter 4 showed that some countries such as Portugal and the UK have accumulated significant OBS liabilities Therefore countriesrsquo supreme audit institutions should monitor the interaction of OBS liabilities and fiscal targets At the same time finance officials in government should advocate a more holistic approach to maintaining fiscal discipline beyond a few top-line indicators such as debt to GDP or public sector net borrowing
To improve the efficient allocation of public funds long-term infrastructure plans should be aligned with the annual budget process that sets out capital and operating budgets Effective capital budgeting can improve public finances such that departments or ministries do not need to rely on flexibility of unitary charges to meet infrastructure needs
Many national accounts operating on a cash basis treat investment in public infrastructure as a cost instead of recognising a new asset on the public sectorrsquos balance sheet Governments should adopt full accrual accounting and maintain a public sector balance sheet Public sector accountants should also conduct a balance sheet review to maximise the value of public sector
New Zealand has taken the lead in public financial management practices not just through the adoption of accrual accounting but because their public sector accountants produce an intertemporal balance sheet (see Chapter 4 Table 41) (Government of New Zealand 2018) Accountants producing this analysis provide decisions-makers with a better long-term view of their policy decisions and can help improve the sustainability of public finances
In summary governments should 7 Consider innovative solutions for
closing the funding gap such as a value capture civic crowdfunding and other revenue funding schemes
8 Direct supreme audit institutions to monitor the interaction of off balance sheet liabilities and fiscal targets in order to improve the efficient allocation of public sector funds
9 Align long-term infrastructure plans with the annual budget process in order to minimise the use of higher-cost private finance to achieve capital budget flexibility
10 Adopt full accrual accounting and maintain a public sector balance sheet to support decision-making on infrastructure policy
Accountants should 11 Advocate a more holistic approach to
maintaining fiscal discipline to avoid poor financial decisions driven by lsquofiscal illusionsrsquo
12 Conduct a balance sheet review to maximise the value of public sector assets
47
How accountants can bridge the global infrastructure gap | 7 Recommendations based on observed good practice
Professional bodies can also contribute to the improvements in public sector expertise by facilitating knowledge transfer between the public and private sector through thought-leadership events and roundtable discussions
13 Produce an intertemporal balance sheet to improve long-term decision-making and support the sustainability of public finances as is done for example in New Zealand
14 Produce disaggregated assets in the balance sheet to include commercial social and financial assets ndash in order to improve the return on public assets
73 DELIVERING INFRASTRUCTURE PROJECTS AND THE PUBLIC-PRIVATE RELATIONSHIP Chapter 5 highlights three key barriers to implementing infrastructure projects poor monitoring and oversight of projects by government confusion as to where each side provides value in a PPP and lack of commercial acumen in the public sector
To address these barriers and successfully deliver infrastructure projects governments need to look to accountants to implement the necessary monitoring and oversight of their PPP relationships There is also a clear need for effective mechanisms for reducing corruption which was cited as a key action in the member survey The implementation of effective whistle-blowing legislation and the professionalisation of the public sector finance function will allow public servants to challenge unethical behaviour that can derail infrastructure projects
Chapter 6 demonstrated that moral hazard can limit the probability that infrastructure PPPs will be completed on time on budget and to an acceptable level of quality The allocation of risk between the partners in a PPP can play a central role in reducing this moral hazard by putting the right incentives in place for the contractor Therefore professional teams delivering infrastructure should rely on an accountantrsquos expertise of risk management to minimise moral hazard by allocating risks fairly between the parties
Public sector negotiators should reflect on the assumptions identified in the member survey and consider that private finance professionals were less likely than their public sector counterparts to view the public sector as a stable partner or as a sector that provided access to longshyterm projects To mitigate this mismatch governments should consider introducing guarantee schemes for nationally
significant infrastructure projects in order to encourage additional private sector involvement in the provision of infrastructure
As a result of the varied commercial acumen in the public sector governments should consider establishing centres of excellence to coordinate public sector expertise in contract management so that any organisation within the public sector can draw on that specialist skill when negotiating a PPP contract Professional bodies can also contribute to the improvements in public sector expertise by facilitating knowledge transfer between the public and private sector through thought-leadership events and roundtable discussions
In summary governments should 15 Enact effective whistle-blowing
legislation and professionalise the public sector finance function to allow public servants to challenge unethical behaviour that can derail infrastructure projects
16 Establish centres of excellence that coordinate public sector expertise in contract management which allows any organisation within the public sector to draw on the specialist skill when negotiating a PPP contract
17 Consider introducing guarantee schemes for nationally significant infrastructure projects in order to encourage additional private sector involvement in infrastructure projects This will help address the assumptions identified in themember survey which showed that private finance professionals were less likely to view the public sector as a stable partner
Accountants should 18 Implement proper monitoring and
oversight for all projects
19 Advocate embedding themselves in the professional teams delivering infrastructure by highlighting their expertise of risk management
Professional bodies should 20 Act as facilitators of knowledge
transfer between the public and private sector through thought-leadership events and roundtables
48
49
Conclusion
The global infrastructure investment gap is set to grow to US$14 trillion by 2040 and this figure sets the benchmark for meeting the worldrsquos infrastructure needs
In reality however the challenge in fulfilling a countryrsquos infrastructure need is not achieving a notional investment figure but rather establishing a government vision for closing a recognised service gap by either maintaining existing infrastructure assets and or by building new projects
Currently governments lack adequate resources and the capability to make systematic infrastructure decisions because they are not able to harness the benefits of the investment and mitigate the significant risks associated with infrastructure project execution Bringing the accountant to the centre of the decision-making process for infrastructure projects can mitigate these pitfalls The particular skills and perspective of the finance professional can mean the difference between success and failure through improvements in project selection securing financing delivery and oversight of the projects
As the next generation of infrastructure projects are planned financed built and operated the accountant must be brought to the centre of the decision-making process The accountant must be employed across the entire life cycle of future infrastructure projects as a critical member of the professional team if the world is to address the global infrastructure gap
Appendix A Detailed methodology for establishing the infrastructure investment gap
This appendix examines the key features of the G20 Global Infrastructure Outlook methodology (GHI and Oxford Economics 2018) in order to summarise how the global regional and national estimates of the infrastructure gap used in Chapter 1 of this report were determined For a complete understanding the of the original work the Global Infrastructure Outlook report has a comprehensive treatment of the analytical process
A1 DEFINITION OF INFRASTRUCTURE The Global Infrastructure Outlook report defines infrastructure investment as lsquoGross Fixed Capital Formationrsquo (GFCF) by the public and private sectors on fixed immovable assets that support long- term economic growthrsquo (GHI and Oxford Economics 2018) GFCF is a wider definition of investment than just that for infrastructure and so the calculations included for the purposes of this report exclude land and any moveable assets such as IT equipment The definition does however include both the development of new assets and spending on the replacement or maintenance of existing assets
A2 CURRENT INVESTMENT TRENDS Current investment was calculated for a total of 50 countries using data from multinational data sources such as the OECD or Eurostat where possible If the required data was not available from these sources then national statistics were used to create a comparable estimate Failing that data was imputed using econometric techniques The Global Infrastructure Outlook report was completed during 2016 and includes the most up-to-date datasets collected providing values to 2015 so the forecast years begin at 2016 and continue to 2040 Before 2016 no infrastructure gap was estimated so the charts in Chapter 1 and Appendix B reflect current trends only to 2016
For each country and sector the stock of infrastructure per head was calculated and a set of explanatory factors were determined for each sector eg population density structure of the economy These explanatory variables were projected forwards on the basis of national economic and demographic forecasts to estimate infrastructure investment under current trends for each country
A3 INVESTMENT NEEDS The extent to which each country dedicates resources to infrastructure investment was adjusted for the quality of infrastructure using indicators from the World Economic Forum Global Competitiveness Report (Schwab 2018)
The lsquoquality-adjustedrsquo performance measures were then compared across countries using the performance of countries at the 75th percentile among those of similar income levels as the benchmark The investment-need scenario indicated the extent of infrastructure investment by sector and country which would be required to meet this benchmark level Income groups were based on three World Bank definitions low- and lower-middle income upper-middle income and high income For countries that were already positioned above the 75th percentile (ie the target) the objective in the years ahead is to sustain relatively high levels of investment and maintain their strong performance As a result the minimum value for the investment gap is 0 ndash where those countries in the upper quartile must maintain their performance and their peersrsquo target is to attempt to catch up
50
The following account offers a regional breakdown and description of the global infrastructure investment gap covering Africa the Americas Asia Europe and Oceania
B1 AFRICAIn 2018 an estimated US$1328bn was spent on infrastructure in Africa Meanwhile US$1777bn of investment is estimated to be required in the region putting the infrastructure investment gap at US$455bn Cumulatively between 2018 and 2040 the infrastructure investment gap is expected to stand at US$159 trillion with the amount of infrastructure investment needed expected to be 39 higher than under current trends
51
Appendix BRegional breakdown of the global investment gap and additional service gap analysis
350
300
250
200
150
100
50
0
Investment need Current trends
2007
2008
2009
2010
2011
2012
2013
2014
2015
2016
2017
2018
2019
2020
2021
2022
2023
2024
2025
2026
2027
2028
2029
2030
2031
2032
2033
2034
2035
2036
2037
2038
2039
2040
FIGURE B1 Investment need and current trends in Africa 2015 US$ billions
Source GHI and Oxford Economics 2018
TABLE B1 Projected infrastructure investment and gaps among African countries 2018ndash40 2015 prices
COUNTRY
Angola
Benin
INFRASTRUCTURE INVESTMENT USD BILLIONS
$2514
$199
INFRASTRUCTURE INVESTMENT GAP USD BILLIONS
$920
$134
DIFFERENCE BETWEEN INVESTMENT NEED AND INVESTMENT FORECAST
37
67
Cote dIvoire $614 $129 21
Egypt
Ethiopia
Ghana
$4186
$4215
$685
$2182
$1467
$421
52
35
61
Guinea $167 $140 84
Kenya
Morocco
$1742
$1967
$371
$348
21
18
Nigeria
Rwanda
$6168
$295
$2103
$96
34
33
Senegal
South Africa
$578
$2696
$181
$1442
31
53
Tanzania $1943 $1095 56
Tunisia $502 $206 41
Source GHI and Oxford Economics 2018
52
How accountants can bridge the global infrastructure gap | Appendix B
B2 AMERICASIn 2018 it was anticipated that an estimated US$4771bn would be spent oninfrastructure in the Americas In the sameyear investment need was forecast to be 38 higher at US$6570bn and over the full 2018 to 2040 period the infrastructure investment gap is expected to grow to US$6126 trillion This implies that infrastructure need will be 48 higher than actual investment over the period given the current trend in the Americas
12
1
08
06
04
02
0
Investment need Current trends
2007
2008
2009
2010
2011
2012
2013
2014
2015
2016
2017
2018
2019
2020
2021
2022
2023
2024
2025
2026
2027
2028
2029
2030
2031
2032
2033
2034
2035
2036
2037
2038
2039
2040
FIGURE B2 Investment need and current trends in the America 2015 US$ trillions 2018ndash40
Source GHI and Oxford Economics 2018
TABLE B2 Projected infrastructure investment and gaps among nations in the Americas 2018ndash40 2015 prices
COUNTRY
Argentina
Brazil
INFRASTRUCTURE INVESTMENT USD BILLIONS
$4220
$14207
INFRASTRUCTURE INVESTMENT GAP USD BILLIONS
$3392
$11266
DIFFERENCE BETWEEN INVESTMENT NEED AND INVESTMENT FORECAST
80
79
Canada $11243 $194 2
Chile $1978 $499 25
Colombia $2231 $949 43
Ecuador $743 $523 70
Mexico $4874 $5153 106
Paraguay
Peru
$546
$3072
$165
$675
30
22
US $79637 $36089 45
Uruguay $458 $91 20
Source GHI and Oxford Economics 2018
53
How accountants can bridge the global infrastructure gap | Appendix B
B3 ASIAAmong all nations the top four countries by investment need (China India Japan and the US) account for over half of global need three of these countries are found in Asia Despite this the infrastructure gap is lower in percentage terms across Asia than the other regions and across the 2018 to 2040 period Asian countries would need to increase spending by around 10 to meet their projected investment need The sheer size of the continent means that while relatively small as a proportion of current spending this level of underinvestment creates an infrastructure investment gap of US$43 trillion over the same period
30
25
20
15
10
05
0
Investment need Current trends
2007
2008
2009
2010
2011
2012
2013
2014
2015
2016
2017
2018
2019
2020
2021
2022
2023
2024
2025
2026
2027
2028
2029
2030
2031
2032
2033
2034
2035
2036
2037
2038
2039
2040
FIGURE B3 Investment need and current trends in Asia 2015 US$ trillions 2018ndash40
Source GHI and Oxford Economics 2018
TABLE B3 Projected infrastructure investment and gaps among Asian countries 2018ndash40 2015 prices
COUNTRY
Azerbaijan
Bangladesh
Cambodia
INFRASTRUCTURE INVESTMENT USD BILLIONS
$862
$3931
$560
INFRASTRUCTURE INVESTMENT GAP USD BILLIONS
$76
$1821
$266
DIFFERENCE BETWEEN INVESTMENT NEED AND INVESTMENT FORECAST
9
46
48
China $248858 $18307 7
India $37045 $4995 13
Indonesia $15445 $667 4
Kazakhstan $1955 $792 41
Japan
Jordan
$34810
$591
$868
$168
2
29
Malaysia
Myanmar
Pakistan
$3588
$1050
$3351
$725
$1064
$1179
20
101
35
Philippines
Saudi Arabia
$4031
$4654
$653
$1089
16
23
Singapore
South Korea
$878
$12767
$03
$386
0
3
Thailand $3677 $950 26
Turkey
Vietnam
$5328
$4741
$3841
$968
72
20
Source GHI and Oxford Economics 2018
08
07
06
05
04
03
02
01
0
Investment need Current trends
2007
2008
2009
2010
2011
2012
2013
2014
2015
2016
2017
2018
2019
2020
2021
2022
2023
2024
2025
2026
2027
2028
2029
2030
2031
2032
2033
2034
2035
2036
2037
2038
2039
2040
54
How accountants can bridge the global infrastructure gap | Appendix B
B4 EUROPETotal spending on infrastructure in Europe was forecast to be US$457bn in 2018 in contrast to a projected requirement of US$512bn This investment gap of 11 is projected to grow to US$189 trillion or 16 of the total infrastructure investment needed over the period 2018ndash40
FIGURE B4 Investment need and current trends in Europe 2015 US$ trillions 2018ndash40
Source GHI and Oxford Economics 2018
TABLE B4 Projected infrastructure investment and gaps among European countries 2018ndash40 2015 prices
COUNTRY
Croatia
INFRASTRUCTURE INVESTMENT USD BILLIONS
$591
INFRASTRUCTURE INVESTMENT GAP USD BILLIONS
$101
DIFFERENCE BETWEEN INVESTMENT NEED AND INVESTMENT FORECAST
17
France $16823 $96 1
Germany
Italy
Poland
$13544
$11449
$5143
$07
$3530
$865
0
31
17
Romania $2103 $104 5
Russia $9887 $6892 70
Spain
UK
$9977
$15496
$538
$1403
5
9
Source GHI and Oxford Economics 2018
55
How accountants can bridge the global infrastructure gap | Appendix B
B5 OCEANIADespite the large area covered by the Oceania continental region its relatively small population means the total infrastructure investment need is less thanfor the other regions A further US$18 trillion total spending is likely to be required between 2018 and 2040 although on current trends a shortfall of US$171bn is forecast to emerge over the same period This would represent an infrastructure gap of 10
120
100
80
60
40
20
0
Investment need Current trends
2007
2008
2009
2010
2011
2012
2013
2014
2015
2016
2017
2018
2019
2020
2021
2022
2023
2024
2025
2026
2027
2028
2029
2030
2031
2032
2033
2034
2035
2036
2037
2038
2039
2040
FIGURE B5 Investment need and current trends in Oceania 2015 US$ billions 2018ndash40
Source GHI and Oxford Economics 2018
TABLE B5 Projected infrastructure investment and gaps among countries in Oceania 2018ndash40 2015 prices
COUNTRY INFRASTRUCTURE INVESTMENT USD BILLIONS
INFRASTRUCTURE INVESTMENT GAP USD BILLIONS
DIFFERENCE BETWEEN INVESTMENT NEED AND INVESTMENT FORECAST
Australia $14462 $1499 10
New Zealand $1522 $166 11
Source GHI and Oxford Economics 2018
56
How accountants can bridge the global infrastructure gap | Appendix B
B6 ADDITIONAL INFRASTRUCTURE SERVICE GAP FIGURES BY WORLD REGIONThe following charts compare the views of finance professionals on the remaining four sub-types of infrastructure not included in the main report water and sanitation other transport (eg ports and airports) railways and core public infrastructure (eg hospitals and schools)
Source The Global Infrastructure Gap survey specialist respondents only n 1966
FIGURE B6 Infrastructure quality ndash water and sanitation
North America
100
80
60
40
20
0
n Dont know n Very good n Good n Neutral n Poor n Very poor
Middle East Asia Pacific Central and Eastern Europe
South Asia Western Europe Africa Caribbean Total
Source The Global Infrastructure Gap survey specialist respondents only n 1966
FIGURE B7 Infrastructure quality ndash other transport
North America
100
80
60
40
20
0
n Dont know n Very good n Good n Neutral n Poor n Very poor
Middle East Asia Pacific Central and Eastern Europe
South Asia Western Europe Africa Caribbean Total
57
How accountants can bridge the global infrastructure gap | Appendix B
FIGURE B8 Infrastructure quality ndash railways
FIGURE B9 Infrastructure quality ndash core public service infrastructure
Source The Global Infrastructure Gap survey specialist respondents only n 1966
North America
100
80
60
40
20
0
n Dont know n Very good n Good n Neutral n Poor n Very poor
Middle East Asia Pacific Central and Eastern Europe
South Asia Western Europe Africa Caribbean Total
Source The Global Infrastructure Gap survey specialist respondents only n 1966
North America
100
80
60
40
20
0
n Dont know n Very good n Good n Neutral n Poor n Very poor
Middle East Asia Pacific Central and Eastern Europe
South Asia Western Europe Africa Caribbean Total
Appendix C The Global Infrastructure Gap Survey and Roundtable Discussion Guide
MEMBER SURVEY
Q1 What is your current employment status Full-time or part-time an accounting or finance role Full-time or part-time work in a non-accounting role Not currently in employment Self-employed Retired
Response treated as lsquogeneralistrsquo
Q2 [If employed]In which sector do you work Please tick the one box that best fits your sector Big Four accounting firm Corporate sector - small medium sized Corporate sector ndash large Financial services - small medium sized Financial services ndash large Mid-tier accounting firm Not-for-profit Other international accounting firm Public sector Small or medium-sized practice (SMP) Other (please specify)
Q3 [If employed]Does your work involve any of the following
Infrastructure policy Procurement Capital budgeting Project management or Operations management
Yes (respondent categorised as a lsquospecialistrsquo) No (respondent categorised as a lsquogeneralistrsquo)
Q4 How would you describe the quality of each type of infrastructure in the country where you live Power and energy Water and sanitation Roads and highways Railways Other transport (eg air and sea)
Information and communication technology (eg internet access and mobile service)
Core public service infrastructure (eg hospitals schools emergency services)
Scale 1 ndash Very poor 2 ndash Poor
4 ndash Good 5 ndash Very good Donrsquot know
Q5 What are the biggest barriers in meeting the infrastructure needs in your country Lack of finance andor funding Lack of political leadership Skills and talent shortage Planning and regulatory barriers Corruption Lack of competition Other please specify None
Q6a [To generalists]Over the next 5 years do you feel the infrastructure in your country will Significantly deteriorate Deteriorate Remain the same Improve Significantly improve Donrsquot know
Q6b [To specialists]Over the next 5 years do you feel that each of these types of infrastructure in your country will Power and energy Water and sanitation Roads and highways Railways Other transport (eg air and sea)
Information and communication technology (eg internet access and mobile service)
Core public service infrastructure (eg hospitals schools emergency services)
Scale Significantly deteriorate Deteriorate Remain the same Improve Significantly improve Donrsquot know
Q7 Do you feel the government selects projects that provide the most value to the taxpayer Never Infrequently Sometimes Frequently Always Dont know
58
3
How accountants can bridge the global infrastructure gap | Appendix C
Q8 Which of the following do you feel the government in your country should prioritise to make the best decisions when selecting infrastructure projects Please select up to five which you feel are the most important and rank them by order of importance Please drag and drop your selections from the left box to the right box and order with most important at the top and least at the bottom
Adhering to global accounting standards
Removing political decision-making making the process technocratic (ie decisions by experts)
Putting in place mechanisms to reduce corruption
Moving government accounts from cash to accrual accounting
Bringing OOBs (Obligations Off Balance-Sheet) onto government balance sheets
Quantifying the total life-cycle costs of potential projects
Spending more resource to evaluate projects after completion
Applying standard assessment tools to evaluate projects during selection
Transferring project selection powers to more local levels of government (ie devolution)
Other please specify
Q8a [To CPA Canada respondents only]How important is it that infrastructure planning include the following sustainability considerations Efficient use of energy including where appropriate renewable sources of energy
Adapting to the impacts of a changing climate such as severe weather events
Minimizing environmental impacts on the surrounding community by for example locating near accessible public transit
Reducing or eliminating the production of waste hazardous by-products or other environmental externalities
Assessing the potential of and taking every reasonable step to reduce or eliminate the likelihood of an environmental accident (such as a pipeline spill for example)
Scale 1 - Not important at all 2- Not very important
4 - Quite important 5- Very important 6 - Donrsquot know
Q9a [To generalists]How should infrastructure be financed in your country Entirely public finance Mostly public finance Even mix of public and private finance Mostly private finance Entirely private finance Dont know no opinion
Q9b [To specialists]How should infrastructure be financed in your country (eg a sovereign wealth fund provides the money upfront to build a road) Power and energy Water and sanitation Roads and highways Railways Other transport (eg air and sea)
Information and communication technology (eg internet access and mobile service)
Core public service infrastructure (eg hospitals schools emergency services)
Scale Entirely public finance Mostly public finance Even mix of public and private finance Mostly private finance Entirely private finance Dont know no opinion
Q10 What are your views on the role of foreign direct investment in building and maintaining infrastructure in your country Very concerned Some concern Neutral Positive Very positive Dont know
Q11 What are the key challenges that the government faces in securing private finance Select all that apply Too few viable projects for private investment Regulatory barriers Perceived political instability in my country Underdeveloped financial markets in my country Insufficient skills in government to negotiate with the private sector Negative perception of private finance for public infrastructure Lack of attractiveness of infrastructure investment Dont know Other please specify
Q12a [Asked of those working in Public sector]Where do you feel the private sector particularly adds value in delivering infrastructure projects in your country Select all that apply Knowledge of best practice and expertise
Applying innovative practices and fresh thinking
Delivering projects on time
Keeping projects to budget
Access to private capital
Transferring the risks of delivering infrastructure projects from the public sector to the private sector
None of these
Donrsquot know
59
3
How accountants can bridge the global infrastructure gap | Appendix C
Q12b [Asked of those working in Private sector]Where do you feel the public sector particularly adds value in delivering infrastructure projects in your country Select all that apply Access to projects that provide stable low risk returns Knowledge of how the public sector works Long-term and stable partnership Knowledge of best practice and expertise Applying innovative practices and fresh thinking None of these Donrsquot know
Q13a [Asked of those working in Public sector]Where do you feel the private sector receives value from the public sector in delivering infrastructure projects in your country Select all that apply Access to projects that provide stable low risk returns Knowledge of how the public sector works Long-term and stable partnership Knowledge of best practice and expertise Applying innovative practices and fresh thinking None of these Donrsquot know
Q13b [Asked of those working in Private sector]Where do you feel the public sector receives value from the private sector in delivering infrastructure projects in your country Select all that apply Knowledge of best practice and expertise
Applying innovative practices and fresh thinking
Delivering projects on time
Keeping projects to budget
Access to private capital
Transferring the risks of delivering infrastructure projects from the publicsector to the private sector
None of these
Donrsquot know
Q14 Where are you primarily based [Dropdown list]
Q15 What best describes your gender identity Female Male Prefer not to say Prefer to self-describe
ROUNDTABLE DISCUSSION 1) Understanding the infrastructure gap
a) Whatrsquos the current quality of infrastructure in your country
i Why is it like this
b) How is your business or organization affected by the current quality of infrastructure in your country Please provide examples
2) How accountants can make a difference c) In your experience where do you see accountants making the
greatest difference in delivering infrastructure in your country Please give examples where possible
d) Do you feel that your country has particular good practices in meeting infrastructure need
3) Selecting projects e) How often do you t hink governments select the right projects in
your country
f) What should governments consider when making decisions about infrastructure
4) Financing projects g) Which types of infrastructure are appropriate for private finance
or operation [ie energy water roads railways other transport information and communication technology core public service infrastructure]
i Which ones are more suited to private finance
ii Private operation
h) What do you think about foreign direct investment (FDI) building new infrastructure in your country
5) Interface of public and private i) What skills do governments need to effectively negotiate
contracts with the private sector
i Are any of these skills absent
j) When t he public and private sectors partner to complete and operate infrastructure (for example through a Public-Private Partnership)
i What does the private sector add to the partnership
ii What does the public sector add to the partnership
6) Final k) Over the next 5 years do you think the infrastructure in your
country will improve stay the same or deteriorate
i Why is t hat the case What are the key challenges in meeting the infrastructure needs in your country over the next 5 years
60
References
ACCA (2016) Smarter Cities Simpler Cities Accounting for the City of the Future Spotlight on India lthttpswwwaccaglobalcomcontentdamACCA_GlobalTechnicalFuturepi-smarter-cities-simpler-citiespdf
gt
accessed 4 February 2019
ACCA (2017) Professional Accountants ndash the Future Ethics and Trust in a Digital Age lthttpswwwaccaglobalcomcontentdamACCA_Global TechnicalFuturepi-ethics-trust-digital-agepdfgt accessed 5 February 2019
Atkins G Davies N and Kidney Bishop T (2017) Public versus Private How to Pick the Best Infrastructure Finance Option lthttpswww instituteforgovernmentorguksitesdefaultfilespublicationsInstitute_for_ Government_Infrastructure_Finance_Option_Public_Private_ November_2017_Web_Finalpdfgt accessed 5 February 2019
British Broadcasting Corporation (2015) Spains Ciudad Real airport sold at auction for euro10000 [online article] lthttpswwwbbccouknewsworldshyeurope-33578949gt accessed 6 February
Catapult Future Cities (2017) Civic Crowdfunding A Guidebook for Local Authorities lthttpsfuturecitiescatapultorgukwp-content uploads201703Civic-guidebook-pdfgt accessed 5 February 2019
Central Intelligence Agency (2019) The World Factbook lthttpswwwciagovlibrarypublicationsthe-world-factbook
gt access 7 February 2019
Chartered Institute of Purchasing and Supply (2013) Written evidence submitted by CIPS to the Public Administration Select Committee lthttps publicationsparliamentukpacm201314cmselectcmpubadm123123vw12 htmgt accessed 5 February 2019
Chartered Professional Accountants of Canada (2016) Adaptation Case Study 6 City of Montreal lthttpswwwcpacanadacaenbusiness-and-accountingshyresourcesother-general-business-topicssustainabilitypublications montreal-adapting-to-climate-changegt accessed 5 February 2019
Detter D and Folster S (2017) The Public Wealth of Cities How to Unlock Hidden Assets to Boost Growth and Prosperity (Brookings Institution Press)
Eriksson PE and Lind H (2015) Moral Hazard and Construction Procurement A Conceptual Framework lthttpswwwdiva-portalorgsmashgetdiva2783674FULLTEXT01pdf
gt accessed 5 February 2019
European Commission (2017) Communication from the Commission The Fiscal Compact ndash Taking Stock lthttpseceuropaeuinfopublications fiscal-compact-taking-stock_engt accessed 5 February 2019
Eurostat (2018) lsquoLiabilities Related to PPPs Recorded Off-Balance Sheet of Governmentrsquo downloadable from lthttpsdataeuropaeueuodpendata datasetZxMF0OGutCyj7pgQJdtaiwgt accessed 5 February 2019
Fages R Beardsley B Bromstrup I Donnadieu H Maceacute B Pardasani N Schmitz L Sheridan BTaglioni G and Xu Q (2018) Global Asset Management 2018 The Digital Metamorphosis lthttpswwwbcgcom en-gbpublications2018global-asset-management-2018-digitalshymetamorphosisaspxgt accessed 5 February 2019
Fay M Andres LA Fox C Narloch U Straub S and Slawson M (2017) Rethinking Infrastructure in Latin America and the Caribbean 2017 lthttps openknowledgeworldbankorgbitstreamhandle1098626390114110shyREVISED-PUBLIC-RethinkingInfrastructureFullpdfgt accessed 5 February 2019
Flyvbjerg B (2018) Oxford Handbook of Megaproject Management (Oxford Oxford University Press)
GHI (Global infrastructure Hub) and Oxford Economics (2018) Global Infrastructure Outlook Downloadable from lthttpsoutlookgihuborggt accessed 4 February 2019
Government of New Zealand (2018) lsquoHe Puna Hao Patiki 2018 Investment Statementrsquo lthttpstreasurygovtnzpublicationsinvestment-statementhe-puna-hao-patiki-2018-investment-statement-html
gt accessed 5
February 2019
ICAS (Institute of Chartered Accountants of Scotland) (2012) A Professional Judgement for Financial Reporting lthttpswwwicascomtechnicalshyresourcesa-professional-judgement-framework-for-financial-reportinggt accessed 6 February 2019
IFAC and CIPFA (2018) International Public Sector Financial Accountability Index lthttpswwwifacorgsystemfilesuploadsIFACIFAC-CIPFA-PublicshySector-Index-2018-Statuspdfgt accessed 5 February 2019
IJ Global (2018) H1 Infrastructure and Project Finance League Table Report lthttpsijglobalcomuploadsH120201820League20Tables20Report pdfgt accessed 5 February 2019
IMF (International Monetary Fund) (2018) Fiscal Monitor Managing Public Wealth downloadable from lthttpswwwimforgenPublicationsFM Issues20181004fiscal-monitor-october-2018gt accessed 5 February
Institute for Government (2018) lsquoFunding Infrastructurersquo [webpage] lthttps wwwinstituteforgovernmentorgukexplainersfunding-infrastructuregt accessed 5 February 2019
International Transport Forum (2017) Strategic Infrastructure Planning International Best Practice lthttpsassetspublishingservicegovuk governmentuploadssystemuploadsattachment_datafile601897Strategic_Infrastructure_FINAL_for_web_v2pdf
gt accessed 4 February
KPMG (2013) Elevating Professional Judgment in Auditing and Accounting The KPMG Professional Judgment Framework lthttpwwwdrlilliecom a544kpmgjdgmtKPMG_ProfJudgment_Monographpdfgt accessed 6 February 2019
Leong L (2016) lsquoThe ldquoRail plus Propertyrdquo Model Hong Kongrsquos Successful Self-financing Formularsquo [website article] lthttpswwwmckinseycom industriescapital-projects-and-infrastructureour-insightsthe-rail-plusshyproperty-modelgt accessed 5 February 2019
Mann H (2018) lsquoThe High Cost of lsquoDe-Riskingrsquo Infrastructure Financersquo [website article] lthttpswwwproject-syndicateorgcommentaryworldshybank-ppp-de-risking-by-howard-mann-2018-12gt accessed 5 February 2019
Marcelo D Mandri-Perrott C House S and Schwartz JZ (2016) An Alternative Approach to Project Selection The Infrastructure Prioritization Framework lthttppubdocsworldbankorgen84463146187466270016-04shy23-Infrastructure-Prioritization-Framework-Final-Versionpdfgt accessed 4 February 2019
MGI (McKinsey Global Institute) (2013) Infrastructure productivity How to save $1 trillion a year lthttpswwwmckinseycomindustriescapital-projectsshyand-infrastructureour-insightsinfrastructure-productivitygt accessed 6 February 2019
MGI (2016) Bridging Global Infrastructure Gaps lthttpswwwmckinsey com~mediaMcKinseyIndustriesCapital20Projects20and20 InfrastructureOur20InsightsBridging20global20infrastructure20gaps Bridging-Global-Infrastructure-Gaps-Full-report-June-2016ashxgt accessed 4 February 2019
Morse A (2018) PFI and PF2 Report by the Comptroller and Auditor General lthttpswwwnaoorgukwp-contentuploads201801PFI-and-PF2pdf
gt accessed 5 February 2019
61
How accountants can bridge the global infrastructure gap | References
MTR Corporation (2017) Annual Report 2017 Ten-Year Statistics lthttps wwwmtrcomhkarchivecorporateeninvestor10yr_stat_enpdfgt accessed 5 February 2019
NHS Scotland (2018) NHS Scotland Assets and Facilities 2017 Annual Report lthttpswwwgovscotpublicationsannual-state-nhsscotland-assetsshyfacilities-report-2017gt accessed 5 February 2019
NIC (National Infrastructure Commission) (2018) National Infrastructure Assessment lthttpswwwnicorgukwp-contentuploadsCCS001_ CCS0618917350-001_NIC-NIA_Accessiblepdfgt accessed 4 February 2019
OrsquoDowling-Keane A (2017) lsquoSadiq Khan Joins Crowd of Thousands with pound400000 in Backing for Londonersrsquo Local Project Ideasrsquo [website article] lthttpsaboutspacehivecomsadiq-khan-joins-crowd-of-thousands-withshy400000-in-backing-for-londoners-local-project-ideasgt accessed 5 February
OECD (Organisation for Economic Cooperation and Development) (2019) Databank tax revenue lthttpsdataoecdorgtaxtax-revenuehtmgt government debt lthttpsdataoecdorgggageneral-government-debt htmgt accessed 7 February 2019
Plimmer G (2018) lsquoDeath Knell Sounded for PFI Contractsrsquo [online article] Financial Times lthttpswwwftcomcontent55eb374e-dba5-11e8-8f50shycbae5495d92bgt accessed 6 February
Project Management Institute (2017) Guide to Project Management Book of Knowledge lthttpswwwpmiorgpmbok-guide-standardsfoundational pmbokgt accessed 4 February 2019
Schwab K (2018) Global Competitiveness Report lthttpwww3weforum orgdocsGCR201805FullReportTheGlobalCompetitivenessReport2018 pdfgt accessed 5 February 2019
Spacehive (2019) lsquoMake Your Local Area Betterrsquo [website] lthttpswww spacehivecomgt accessed 5 February 2019
UK Government (2017) UK Guarantees Scheme Guidance lthttpswwwgov ukguidanceuk-guarantees-schemegt accessed 5 February 2019
World Bank (2018a) Private Participation in Infrastructure Annual Report 2017 lthttpppiworldbankorg~mediaGIAWBPPIDocuments Global-NotesPPI_2017_AnnualReportpdfgt
World Bank (2018b) Procuring Infrastructure Public-Private Partnerships Report downloadable from lthttpspppknowledgelaborg documents5453gt accessed 5 February 2019
World Bank (2019) World Bank Open Data tax revenue lthttpsdata worldbankorgindicatorGCTAXTOTLGDZSgt government debt lthttpsdataworldbankorgindicatorGCDODTOTLGDZSgt accessed 7 February 2019
62
18002683793 wwwcpacanadaca
PI-GLOBAL-INFRASTRUCTURE-GAP
DISCLAIMER This paper was prepared by the Association of Chartered Certified Accountants (ACCA) and Chartered Professional Accountants of Canada (CPA Canada) as non-authoritative guidance
ACCA CPA Canada and the authors do not accept any responsibility or liability that might occur directly or indirectly as a consequence of the use application or reliance of this material
ACCA The Adelphi 111 John Adam Street London WC2N 6AU United Kingdom +44 (0)20 7059 5000 wwwaccaglobalcom
CPA Canada 277 Wellington St West Toronto Ontario Canada M5V 3H2
How accountants can bridge the global infrastructure gap | Executive summary
8
Establishing and comparing the need for infrastructure are key considerations in building the case for planning and selecting a particular project
Planning and selecting infrastructure projectsChapter 3 further explains the two key impediments identified in the survey the lack of a standard for project selection and the misalignment of the infrastructure life cycle and the political cycle Establishing and comparing the need for infrastructure are key considerations in building the case for planning and selecting a particular project This report sets out methods of establishing lsquoneedrsquo in order to inform the planning and project selection process The survey also identifies the misalignment between a political cycle (often four to six years) and the total life cycle of an infrastructure asset (often over 20 years) This mismatch can generate two biases a bias towards short-term decision-making and a bias for creating megaprojects over maintenance
In response to these barriers this report offers the following recommendations based on observed good practice
Governments should1 Establish expert-led bodies to
forecast infrastructure requirements and recommend projects on the basis of need
2 Collect reliable data on the service potential of existing infrastructure and on the performance of past projects
3 Disaggregate expenditure on infrastructure to report both maintenance and new project spend
Accountants should4 Take the lead in applying standard
selection tools to determine the need for and priority of a project
5 Advise on the distributional impact and regional growth outcomes of selecting particular projects good practice in this area can be found in Japan
6 Embed adaptation and resilience into the project-selection process
Financing infrastructure projectsChapter 4 on financing infrastructure highlights three key impediments to closing the infrastructure gap the funding gap accounting for the higher cost of private capital and the need to professionalise the public sector finance function
In response to these barriers the report offers the following recommendations based on observed good practice
Governments should7 Consider innovative solutions for
closing the funding gap such as a value capture civic crowdfunding and other revenue funding schemes
8 Direct supreme audit institutions to monitor the interaction of off balance sheet liabilities and fiscal targets in order to improve the efficient allocation of public sector funds
9 Align long-term infrastructure plans with the annual budget process in order to minimise the use of higher-cost private finance to achieve capital budget flexibility
10 Adopt full accrual accounting and maintain a public sector balance sheet to support decision-making on infrastructure policy
Accountants should11 Advocate a more holistic approach
to maintaining fiscal discipline to avoid poor financial decisions driven by lsquofiscal illusionsrsquo
12 Conduct a balance sheet review to maximise the value of public sector assets
13 Produce an intertemporal balance sheet to improve long-term decision-making and support the sustainability of public finances as is done for example in New Zealand
14 Produce disaggregated assets in the balance sheet to include commercial social and financial assets ndash in order to improve the return on public assets
How accountants can bridge the global infrastructure gap | Executive summary
The roundtable participants identified poor monitoring and oversight by government as key impediments in delivering infrastructure projects
Delivering infrastructure projects The roundtable participants identified poor monitoring and oversight by government as key impediments in delivering infrastructure projects Chapter 5 offers results from the survey demonstrating disagreement about where each party in a PPP agreement provides value Finally the roundtable participants argued that the public sector often lacked the commercial acumen required to manage an infrastructure PPP effectively
In response to these barriers this report offers the following recommendations based on observed good practice
Governments should 15 Enact effective whistle-blowing
legislation and professionalise the public sector finance function to allow public servants to challenge unethical behaviour that can derail infrastructure projects
16 Establish centres of excellence that coordinate public sector expertise in contract management which allows any organisation within the public sector to draw on the specialist skill when negotiating a PPP contract
17 Consider introducing guarantee schemes for nationally significant infrastructure projects in order to encourage additional private sector involvement in infrastructure projects This will help address the assumptions identified in the survey which showed that private finance professionals were less likely to view the public sector as a stable partner
Accountants should 18 Implement proper monitoring and
oversight for all projects
19 Advocate embedding themselves in the professional teams delivering infrastructure by highlighting their expertise of risk management
Professional bodies should 20 Act as facilitators of knowledge
transfer between the public and private sector through thought-leadership events and roundtables
9
10
The global infrastructure gap
1 See Chapter 1 for definitions of the lsquoinfrastructure investment gaprsquo and the lsquoinfrastructure service gaprsquo
Globally some top barriers to meeting infrastructure need were
52 lack of political leadership
49 lack of finance or funding
40 planning and regulatory barriers
Finance professionals reported the largest service gap in Africa the Middle East had the smallest service gap1
The global investment gap will grow to US$14 trillion by 2040
Selecting projects
93 of respondents said governments could improve the infrastructure projection selection process
lsquoRemoving political decision-making and making the process technocraticrsquo was the most cited for improving project selection
Delivering projects and the public-private relationship
62 of public sector respondents arguedthat they offered a lsquolong-term and stable partnershiprsquo for a PPP compared to only
45 of private sector respondents
Financing projectsThe most cited barriers for securing private finance for infrastructure were
lsquoInsufficient skills in governmentrsquo 45 and
lsquonegative perception of private financersquo 43
11
Introduction
Infrastructure is critical for economic and social development across the world Physical infrastructure systems ensure that basic human needs are met people need access to energy to light and heat their homes and safe water for drinking sanitation and cooking Transport infrastructure allows people to travel to work and transport goods to different markets
In these and many other ways infrastructure is vital to social and economic activity and development ndash and its provision is intrinsically tied to achieving the United Nationrsquos Sustainable Development Goals to address global challenges such as poverty inequality climate change and environmental degradation and to achieve a better and more sustainable future for all There is also a unique opportunity for governments to respond to the global infrastructure gap challenge The anaemic economic growth following the 2008 financial crisis and the sustained low-interest rate environment means that the cost of increased investment has rarely been lower for governments and the prize is sustainable economic growth a sustained boost to productivity and improved living standards
But execution matters and there are many examples of infrastructure projects that have gone badly wrong Design failures can cause the death of workers as in the case of the Chirajara bridge collapse in Colombia in 2018 poor demand forecasting and design can result in significant infrastructure investments being underused such as the Ciudad Real Airport in Spain which remains abandoned after a construction cost in excess of 1bn euros (BBC 2015)
In addition the collapse of the Morandi Bridge in Genoa Italy demonstrated that to avoid disaster governments must allocate sufficient resources to the maintenance of existing infrastructure fighting the bias towards focusing resources on new-build projects
Finally cases of natural disaster ndash such as the flooding in Bangkok Thailand in 2011 ndash are becoming increasingly common and future infrastructure projects must be adaptable and resilient to enable countries to meet the threats of climate change
Therefore the successful provision of public infrastructure requires governments to have the right professional team in place to be able to harness the benefits of additional investment while working to mitigate the significant risks associated with infrastructure projects The accountant must be brought to the centre of the decision-making process on the selection financing building and operation of infrastructure where the finance professionalrsquos particular skills and perspective can mean the difference between success and failure
Research methodology
How accountants can bridge the global infrastructure gap Improving outcomes across the entire project life cycle report is the result of a joint research project conducted by ACCA and CPA Canada The research objective of this study was to quantify and explain the nature of the global infrastructure gap and explore how professional accountants can contribute to bridging the gap through improvements in the selection financing and delivery of projects
The report encompasses the collection of economic research country-specific narratives and best practices in building and maintaining infrastructure ndash from project selection to completion and evaluation The results and observations that were arrived at are supported by evidence collected through the following mechanisms
bull quantifying the cumulative global infrastructure investment gap to 2040 through desktop research
bull a global online survey of a random sample of ACCA members and CPA Canada members
bull a desktop literature review of specialist publications to determine leading practices
bull in-person roundtable discussions held with experts from four continents
How these four areas were developed is detailed below
ECONOMIC ANALYSIS A quantitative approach was followed for the review of the G20 Global Infrastructure Hubrsquos Global Infrastructure Outlook report (GHI and Oxford Economics 2018) This report uses economic forecasting to quantify the cumulative global infrastructure gap up to 2040 Chapter 1 lsquoQuantifying the Global Infrastructure Gaprsquo provides some detail on the quantification of the investment gap and articulates the challenge for this report More information on the methodology of the economic analysis can be found in Appendix A
GLOBAL SURVEY AND DEMOGRAPHICS ACCA and CPA Canada jointly undertook a survey of a random sample of each bodyrsquos membership This survey used the perspectives of finance professionals to illuminate the nature of the global infrastructure gap highlight the barriers to closing the gap and clarify the diverging expectations of public- and private-sector actors in the use of publicndash
private partnerships (PPPs) in infrastructure projects A copy of the survey is available in Appendix C
The survey design and administration were consistent across both bodies except for the addition of one question on infrastructure planning and sustainability considerations in the CPA Canada survey Therefore unless otherwise specified all survey results cited in the report present the combined output from the CPA Canada and ACCA waves of the survey The ACCA survey was in the field for two weeks in August 2018 and the CPA Canada survey for two weeks in October 2018
Survey demographics The combined total of survey respondents was 3611 across 1182
countries Geographic splits in the survey data typically present output by world region Every world region had at least 150 responses except for South America which is excluded from any figure showing results by geography Finally the
2 Six respondents gave lsquoOtherrsquo for their country of residence thus it is not possible to identify whether they lived in the 118 countries or elsewhere
12
Overall more than one-in-three respondents (35) worked in the corporate sector while about 20 worked in the public or not-for-profit sectors
joint survey (lsquothe member surveyrsquo) split respondents into two primary categories lsquogeneralistsrsquo and lsquospecialistsrsquo where specialist respondents stated that their work included at least one of the following areas infrastructure policy procurement capital budgeting project or operations management Of the total sample 1966 respondents (54) were categorised as specialists The survey included a number of detailed technical questions which were asked only of specialists Figures throughout the report clearly indicate which subset of respondents (generalists or specialists) answered a particular question
The member survey includes the views of accountants working across all sectors including respondents from accountancy firms the corporate sector and the public sector Overall more than one-in-three respondents (35) worked in the corporate sector while about 20 worked in the public or not-for-profit sectors
LITERATURE REVIEWA detailed review of specialised literature on infrastructure projects globally was conducted This review demonstrated the variety of methodologies used globally in quantifying the infrastructure gap as well as providing a summary of leading practices in infrastructure planning project selection and public financing that help support the effective delivery of innovative and sustainable infrastructure policy
The References section includes the reviewed literature
IN-PERSON ROUNDTABLE DISCUSSIONSFinally roundtable discussions were conducted with ACCA members and CPA Canada members in the UK Canada Sri Lanka Nigeria Trinidad amp Tobago Jamaica and Malaysia and focused on country-specific infrastructure challenges and solutions to show the international variation in infrastructure need as well as highlighting what skills and perspectives accountants employ to help address the global infrastructure gap
The roundtable discussions offered stakeholders an opportunity to share their insights and experiences on the current challenges to closing the global infrastructure gap and their perspectives and experiences in the provision of infrastructure In addition the roundtables offered participants an opportunity to reflect on best practices with their peers
Together the literature review and roundtable discussions have provided evidence of the essential role accountants can play in helping to shrink the global infrastructure gap A copy of the roundtable questions is available in Appendix C
ACCA and CPA Canada would like to thank the Centre for Business and Economics Research (Cebr) an economic consultancy based in the UK for completing the economic analysis quantifying the global infrastructure investment gap
13
How accountants can bridge the global infrastructure gap | Research methodology
FIGURE 2 Sector breakdown of The Global Infrastructure Gap survey
20
18
16
14
12
10
8
6
4
2
0Big Four
accounting firm
Corporate sector ndash small medium sized
Corporate sector ndash
large
Financial services ndash smallmedium sized
Financial services ndash
large
Mid-tier accounting
firm
Not-for-profit Other international
accounting firm
Public sector Small medium sized practice (SMP)
Other
Source The Global Infrastructure Gap survey all respondents n 3611
14
1 Defining the challenge Quantifying the global infrastructure gap
Defining the global infrastructure gap qualitatively is relatively simple the term is generally understood to denote the difference between required infrastructure and existing infrastructure Defining the current global infrastructure gap quantitatively however is more complex (MGI 2016) There are a variety of methods used internationally to measure the infrastructure gap
Reports by the McKinsey Global Institute (MGI 2013 and 2016) on the global infrastructure gap estimate that the world will need to invest US$33 trillion annually in infrastructure to support the needs resulting from projected economic growth The MGI methodology is highly sensitive to variations in economic growth since the forecasted investment gap is based on maintaining the ratio of infrastructure stock to a countryrsquos gross domestic product (GDP) But assessing infrastructure need as a constant share of a countryrsquos GDP is a rather crude measure that could result in erroneous conclusions For example assume a country spends the same amount on infrastructure but boosts GDP through greater efficiency in the allocation of those investment resources This would show as an increase in the infrastructure investment gap under the MGI approach (ie infrastructure spending would fall as a percentage of GDP) when in fact the efficiency gains would actually reduce the gap
In working to improve infrastructure provision the ultimate focus for any government should be minimising a recognised service gap not reducing a notional investment gap ndash addressing a countryrsquos particular economic social and environmental objectives (Fay et al 2017) The roundtable discussion in Canada a country with a negligible investment gap highlighted the misalignment between infrastructure investment decisions and the actual service needs of the country something that had been particularly challenging in First Nations communities In short this global challenge cannot be solved only by spending more money but also by spending better ndash ensuring that all spending is targeted on real needs At the same time it is not possible to categorise effectively on a global scale all the national objectives underpinning the goal of closing service gaps
Therefore this report offers two approaches to the global infrastructure gap the infrastructure investment gap and
the infrastructure service gap The first relies on a dataset produced by the G20rsquos Global Infrastructure Hub and sets an aspirational metric which is benchmarked against a countyrsquos peers (GHI and Oxford Economics 2018) This quantified infrastructure investment gap shows what investment would be required for a particular country to move to the top 25th percentile of the peers in its income group This works as an effective benchmark where a countryrsquos gap can be closed over time The second approach relies on the views of the specialist respondents to the member survey The quality of infrastructure is assessed across seven different subtypes demonstrating where service gaps exist for different world regions The first approach provides a quantified output and aspirational target for countries seeking to meet infrastructure needs and is described below The results of the second approach setting out the service gap can be found in section 14 below lsquoFinance professionalsrsquo perspectives on the global infrastructure servicersquo gap
How accountants can bridge the global infrastructure gap | 1 Defining the challenge Quantifying the global infrastructure gap
Globally the cumulative level of investment required to bring all countries in line with the best performing nations in their income group is estimated to be almost US$88 trillion between 2018 and 20404
11 THE INFRASTRUCTURE INVESTMENT GAP (APPROACH 1) AN ANALYSIS OF THE GLOBAL INVESTMENT OUTLOOK The Global Infrastructure Outlook report (GHI and Oxford Economics 2018) defines infrastructure investment as lsquoGross Fixed Capital Formation (GFCF) by the public and private sectors on fixed immovable assets that support long-term economic growthrsquo This report takes a comprehensive view of countriesrsquo infrastructure needs ndash including the social and economic infrastructure that would be captured under GFCF This comprehensive view is echoed in the survey analysis which covers seven sub-categories of infrastructure power and energy water and sanitation road and highways other transport (eg air and sea) ICT railways and core public service infrastructure (eg hospitals and schools) The research by the G20rsquos Infrastructure Hub estimates the amount of infrastructure investment needed for a diverse set of countries in each year from 2016 until 20403
The Global Infrastructure Outlook report provides historic data from 2007 to 2015 and then projects these forward to 2040 with increased spending only occurring in response to changes in economic and demographic fundamentals The difference between these estimates (ie the amount invested compared with the
amount needed) allows us to calculate the lsquoinfrastructure investment gaprsquo for each country To improve understanding of this global challenge the account below illustrates the size of this infrastructure gap at the global level Further detail on the nature of the infrastructure investment being measured and the methodology used to calculate the gap are explained in Appendix A Regional and national-level analysis of the investment gap can be found in Appendix B
12 QUANTIFYING THE GLOBAL INFRASTRUCTURE INVESTMENT GAP Globally the cumulative level of investment required to bring all countries in line with the best performing nations in their income group is estimated to be almost US$88 trillion between 2018 and 20404 Current trends indicate however that actual investment over the period is likely to undershoot this by US$14 trillion In 2018 alone the global infrastructure gap is US$409bn and will average US$613bn per year over the entire period In order to close this gap total forecast spending would have to increase by 19 over current investment levels In other words for every five US dollars of infrastructure spending forecast across the world by 2040 governments and investors would need to find a further 95 cents in order to bring the global stock of infrastructure up to standard
FIGURE 11 Comparison of different approaches to assessing infrastructure needs
Approach 2
Infrastructure Service Gap
Approach 1
Infrastructure Investment Gap
Notional target (aspirational) quantifiable
Source Global Infrastructure
Outlook
Subjective view of need
Source The Global Infrastructure
Gap survey
3 For further detail please see the technical appendix of the Global Infrastructure Outlook (GHI and Oxford Economics 2018)
4 Figures from the G20 Global Infrastructure Outlook report (GHI and Oxford Economics 2018) are reported in 2015 US$ prices and exchange rates unless otherwise specified
15
16
Quantifying an infrastructure investment gap across world regions provides an aspirational target for governments looking to improve the provision of infrastructure in their country
Between regions and countries there is a wide variation in performance in infrastructure provision and the capability of governments and private investors to meet future needs The capacity of governments to respond to this challenge is discussed further in the next chapter of this report
13 ANALYSIS OF THE GLOBAL INFRASTRUCTURE INVESTMENT GAPQuantifying an infrastructure investment gap across world regions provides an aspirational target for governments looking to improve the provision of infrastructure in their country It highlights global top performers such as Singapore Japan and Canada ndash which can be looked to for good practices5 The investment gap view also reveals global laggards such as Mexico Myanmar and Brazil Countries facing substantial and growing gaps may benefit from looking to their peers for good practice and novel methods of meeting infrastructure needs Subsequent chapters explore how the skills and perspectives of accountants can help close the investment gap Before turning to the role of accountants this report sets out a second method for understanding infrastructure need the infrastructure service gap
How accountants can bridge the global infrastructure gap | 1 Defining the challenge Quantifying the global infrastructure gap
14 FINANCE PROFESSIONALSrsquo PERSPECTIVES ON THE GLOBAL INFRASTRUCTURE SERVICE GAP (APPROACH 2)The Global Infrastructure Outlook report forecasts that the global infrastructure investment gap will reach US$14 trillion by 2040 (GHI and Oxford Economics 2018) This economic analysis sets an aspirational global benchmark for meeting the worldrsquos infrastructure needs At the same time the ultimate objective in fulfilling a countryrsquos infrastructure need is not a notional investment figure rather it is closing a recognised service gap Doing this requires that governments develop a vision of what a country seeks to achieve through the development and maintenance of its infrastructure ACCArsquos previous work on Smart Cities argues that creating a vision for future municipal infrastructure requires a lsquocitizen-led bottom-up approachrsquo based on actual service needs (ACCA 2016) Zia Paton a partner at PricewaterhouseCoopers (PwC) and participant in the roundtable discussion in Trinidad and Tobago cited the countryrsquos lsquoVision 2030rsquo as an excellent framework for setting out the governmentrsquos infrastructure priorities She pointed out that lsquothe plans set out in the Vision 2030 document appear to be
FIGURE 12 Global infrastructure investment need and current trends 2015 US$ trillions
50
45
40
35
30
25
20
15
10
05
0
Investment need Current trends
2007
2008
2009
2010
2011
2012
2013
2014
2015
2016
2017
2018
2019
2020
2021
2022
2023
2024
2025
2026
2027
2028
2029
2030
2031
2032
2033
2034
2035
2036
2037
2038
2039
2040
Source GHI and Oxford Economics 2018
5 See Appendix B for regional- and country-level statistics
17
To supplement the economic analysis that produces the investment gap the joint member survey explored the global infrastructure service gap
exactly what we needrsquo but she sees the real challenge as lsquoconverting that plan into action and aligning it with the various frameworks people and Ministries we have in place execution or implementation is where we tend to have challengesrsquo
The following chapters demonstrate the essential role for the accountancy profession in transforming agreed national visions into a reality through improving project selection (Chapter 3) financing decisions (Chapter 4) and project delivery (Chapter 5) To supplement the economic analysis that produces the investment gap the joint member survey explored the global infrastructure service gap This granular
approach captures the perspective of finance professionals from around the world setting out which particular types of infrastructure are viewed as requiring improvement to meet service needs
Infrastructure service gap by world regionRespondents to the survey were asked to rank the current quality of seven types of infrastructure in their country ndash covering both social and economic infrastructure Breaking down these results by world region demonstrates considerable variation in the current quality of each type of infrastructure Figures 13 14 and 15 show the results for three types of infrastructure power and energy roads and highways and ICT The world regional
How accountants can bridge the global infrastructure gap | 1 Defining the challenge Quantifying the global infrastructure gap
FIGURE 13 Infrastructure quality ndash power and energy
North America
100
80
60
40
20
0
n Dont know n Very good n Good n Neutral n Poor n Very poor
Middle East Asia Pacific Central and Eastern Europe
South Asia Western Europe Africa Caribbean Total
Source The Global Infrastructure Gap survey specialist respondents only n 1966
FIGURE 14 Infrastructure quality ndash roads and highways
North America
100
80
60
40
20
0
n Dont know n Very good n Good n Neutral n Poor n Very poor
Middle East Asia Pacific Central and Eastern Europe
South Asia Western Europe Africa Caribbean Total
Source The Global Infrastructure Gap survey specialist respondents only n 1966
ICT is a unique form of infrastructure that includes significant non-physical components and its provision must anticipate the future needs of the digital economy
breakdowns for water and sanitation railroad and other transport infrastructure (eg sea and air) and core public service infrastructure can be found in Appendix B Figures B6 B7 B8 and B9 By analysing the specialist responses on each type of infrastructure this report offers a view on the global and regional service gaps that exist in the provision of infrastructure
The survey data shows that South Asia lags other world regions in the quality of its power and energy infrastructure with only one in five (20) of finance professionals in that region stating that power and energy provision in their country was good or very good This compares with 65 of global respondents who found the provision of power and energy to be good or better Africa lagged in this area with about one in three (35) of Africarsquos finance professional respondents stating that power and energy provision was very good or good Unsurprisingly 90 of the Middle Eastern respondents saw their power and energy infrastructure as good quality or above ndash with 71 stating that power and energy provision is lsquovery goodrsquo
Central and Eastern European and African respondents were critical of the quality of their road infrastructure ndash with 37 and 46 respectively stating that their roads and highway infrastructure were poor or very poor In comparison a majority of survey respondents in the Middle East North America and Western Europe reported that the provision of
road and highway infrastructure in their countries was of good or very good quality Globally nearly half the finance professionals (49) reported that that the quality of road and highway infrastructure in their countries was good or very good
Globally ICT was seen as the type of infrastructure with the highest quality Clearly ICT is a unique form of infrastructure that includes significant non-physical components and its provision must anticipate the future needs of the digital economy The quality of ICT infrastructure extends beyond initiatives such as the roll-out of ultrafast broadband it includes public sector projects developing robust financial management and information systems to improve public services
Besides significant non-physical components ICT represents a comparatively new priority for many governments The survey shows the African region lagging its peers with only 51 of specialist finance professionals in the region ranking ICT as good or very good compared with the global average of 69 ICT was one of the few infrastructure types to receive a high score in central and Eastern Europe This is understandable because for many countries in this region other types of physical infrastructure such as road and rail were built under the Soviet Union Significant investment in ICT infrastructure around the world occurred
18
How accountants can bridge the global infrastructure gap | 1 Defining the challenge Quantifying the global infrastructure gap
FIGURE 15 Infrastructure quality ndash information and communication technology
Source The Global Infrastructure Gap survey specialist respondents only n 1966
North America
100
80
60
40
20
0
n Dont know n Very good n Good n Neutral n Poor n Very poor
Middle East Asia Pacific Central and Eastern Europe
South Asia Western Europe Africa Caribbean Total
19
Comparing specialistsrsquo perceptions of infrastructure quality by country shows particular service gaps emerging across the types of infrastructure
after the fall of the Soviet Union and many new nation-states in Eastern Europe were able to pursue their own infrastructure investment priorities Certain countries such as Estonia are now seen as world leaders in ICT and the provision of a digital public sector
A comparison of regional infrastructure service gaps arising from the survey dataComparing specialistsrsquo perceptions of infrastructure quality by country shows particular service gaps emerging across the types of infrastructure For example finance professionals in Africa and South Asia reported consistently poor levels of infrastructure across all the subtypes with the notable exception of ICT These results suggest that there are considerable service gaps that governments in this world region must address In comparison North American respondents had much higher overall scores but showed a particular dip in their road and highway infrastructure where only 64 of respondents reported that this infrastructure was of good quality In the Caribbean region specialist respondents isolated road and highway infrastructure and core public service infrastructure as key areas requiring intervention to reduce the service gap Specialists in infrastructure policy in central and Eastern Europe cited core public service infrastructure and railway infrastructure as areas requiring further investment
15 BARRIERS TO MEETING INFRASTRUCTURE NEEDSRespondents to the member survey were also asked what they saw as the biggest barriers to meeting the infrastructure needs in their country The results of this question showed significant variation by world region For example corruption was seen as a serious challenge in South Asia Africa Central and Eastern Europe and the Caribbean ndash but was cited by 10 of respondents or fewer in North America and Western Europe In comparison a lack of political leadership ranked consistently high across world regions This is a key barrier that is explored further in Chapter 3 Selecting Projects The lack of finance or funding also ranked as a significant barrier in most regions with an overall global average of 49 of respondents citing it as a barrier The underlying causes for the lack of finance as well as good practices in overcoming this barrier are discussed in Chapter 4 on the central role of accountants in improving infrastructure project finance Finally planning and regulatory issues consistently arose as a barrier to meeting infrastructure need with around 40 of respondents across the globe citing this as a key barrier Chapter 5 of this report which explores how accountants can support the efficient execution of infrastructure projects sets out how the interface of public and private partners can often be confused and suboptimal reducing the effective delivery of infrastructure
How accountants can bridge the global infrastructure gap | 1 Defining the challenge Quantifying the global infrastructure gap
FIGURE 16 Biggest barriers to meeting infrastructure needs
North America
100
80
60
40
20
0
n Lack of finance andor fundingn Lack of political leadershipn Skills and talent shortagen Planning and regulatory barriersn Corruptionn Lack of competitionn None
Middle East Asia Pacific Central and South Asia Western Europe Africa Caribbean Total
Source The Global Infrastructure Gap survey all respondents n 3611
Eastern Europe
2 Capacity for infrastructure investment
For countries at different stages of development the implications of infrastructure spending can also be markedly different The annual rate of growth in output typically much higher during the early phase of industrialisation tends to slow as a countryrsquos economy matures Smaller economies may therefore need to commit a relatively large share of their output to infrastructure investment in order to facilitate rapid growth
Looking at infrastructure investment as a percentage of GDP can therefore be revealing as to governmentsrsquo willingness or ability to make the necessary financial investment as well as the nature of the environment for private investment
In 2015 the Asian economies funded the largest financial infrastructure investment around US$13 trillion This is unsurprising given that Asia is the most heavily populated region It is also a function of the commitment by certain countries to improving the regionrsquos infrastructure and in 2015 the level of investment was the largest in relative terms standing at 51 of GDP
Africa was the region with the second-highest level of investment as a share of GDP in 2015 at 43 but the continent trails its peers in absolute investment (US$100bn) Europe and the Americas both of which are dominated by their larger more developed economies dedicated far lower levels of funding to infrastructure investment relative to their GDP in 2015 at 20 and 17 respectively
20
21 GOVERNMENTSrsquo CAPACITY FOR INCREASING INFRASTRUCTURE SPENDINGGovernments can directly fund an increase in expenditure on infrastructure through increases in either taxation or borrowing The latter places a burden on future generations in the form of the higher taxation needed to fund the
repayment of the debt The major constraints on a governmentrsquos capacity for funding infrastructure are therefore a fairly complex mix of institutional economic and social factors The size of the tax base how easily taxes can be evaded and political or cultural expectations about what constitutes a fair level of taxation all present practical
FIGURE 21 Regional infrastructure investment in US$ trillions as a of GDP 2015
7
6
5
4
3
2
1
0Asia
14
12
10
08
06
04
02
0Africa Oceania Europe Americas
o
f GD
P
2015 USD
$ trillions
n of GDP n USD $ trillions
Source GHI and Oxford Economics 2018
21
How accountants can bridge the global infrastructure gap | 2 Capacity for infrastructure investment
Table 21 presents summary statistics for the level of government debt and taxation across high-income upper-middle-income and low- and lower-middle-income countries
barriers to raising revenues Likewise high taxes can have strong disincentive effects discouraging certain activities and limiting the extent to which any change in the tax rate translates into higher revenues Borrowing on the other hand is constrained by the credibility of the government in pledging to repay any debts and the depth and sophistication of domestic capital markets
Table 21 presents summary statistics for the level of government debt and taxation across high-income upper-middle-income and low- and lower-middle-income countries Using this data gives the distribution of tax and borrowing levels relative to GDP allowing us to benchmark countriesrsquo capacity for further investment The figures cover the 1995 to 2016 period in order to show variation across a range of different economic and political cycles
Table 21 shows that among the high-income countries both the UK and Canada have relatively high levels of indebtedness as measured by the OECD gross general government debt indicator (OECD 2019) Since the global financial crisis both countries have seen their debt levels pull away from the OECD average to stand at 1117 and 1147 of GDP respectively This puts both countries firmly in the upper quartile of indebted countries even among the OECD countries where levels of debt to GDP
are generally high In both cases tax revenues are marginally below the OECD average however suggesting there is some limited fiscal room for raising revenue Political pressure in countries such as the UK may play a part in decisions about whether to raise taxes to generate additional revenue and if so whether to invest in capital expenditure over improving service provision through increased operating budgets
Chinarsquos debt as a share of GDP is estimated to fall below the average for the low- and middle-income countries at 443 Tax revenues are also somewhat higher than in most low and middle-income countries As growth continues and the economy matures Chinese governments may be able to widen the tax base in line with developed economy standards bringing in significantly larger revenues Still the government remains well placed to invest in infrastructure Malaysia which has a larger infrastructure gap to overcome is somewhat more indebted (545) sitting above the median debt level for its peer group although not particularly dangerously so Conversely tax revenue as a share of GDP (143) is slightly lower than the median level for low- and middle-income countries of 147 This suggests that without a move into higher growth and a broader tax base the funding required to close the infrastructure gap is unlikely to materialise in Malaysia
TABLE 21 Stock of debt and tax revenues as a share of GDP selected countries
INCOME GROUP (WORLD BANK DEFINITION)
COUNTRY INFRASTRUCTURE INVESTMENT AS A SHARE OF GDP 2015
GENERAL GOVERNMENT DEBT AS A PROPORTION OF GDP
TAX REVENUE AS A SHARE OF GDP
High-income UK 16 1117 325
Canada 23 1147 320
Upper-middle income China 70 443 217
Malaysia 36 545 143
Low- and lower-middle income Pakistan 17 633 164
Nigeria 32 196 35
India 40 689 110
Source World Bank OECD IMF CIA World Factbook
Some countries such as China find themselves in the privileged position of having significant fiscal room to support further investment while also projecting a small infrastructure gap
Pakistan has a relatively high level of government debt (633) which is approaching the upper quartile of World Bank estimates This presents real risks to fiscal sustainability where pressure from the countryrsquos overseas debt obligations has raised the prospect of a debt crisis Here the high level of indebtedness may in part be due to rapid growth in infrastructure spending over recent years
Among the case study countries Nigeriastands out as having both the largest forecast infrastructure gap at 09 of GDP in 2040 and the weakest tax revenue (35 of GDP) The inability of the government to raise revenue effectively is holding back its ability to invest in infrastructure which in turn is holding back growth The availability of significant oil reserves can provide an alternative source of revenue to general
taxation especially when oil prices are high But there are reasons (environmental and technological) for considering that peak oil prices may have been (or will soon be) reached Therefore the ability of Nigeria to finance its investment from other sources of income will be essential to closing the countryrsquos infrastructure gap
This analysis demonstrates that there is significant country-level variation in the ability to respond to the global infrastructure gap (Table 22) Some countries such as China find themselves in the privileged position of having significant fiscal room to support further investment while also projecting a small infrastructure gap Others such as Pakistan and Nigeria will need to work within the limited fiscal room available for meeting their growing infrastructure needs
22
How accountants can bridge the global infrastructure gap | 2 Capacity for infrastructure investment
TABLE 22 A typology of infrastructure gap responsiveness
LIMITED FISCAL ROOM GREATER FISCAL ROOM
Low infrastructure gap lsquoSmall gap Fiscally restrictedrsquo(eg Canada)
lsquoSmall gap Fiscally flexiblersquo(eg China)
High infrastructure gap lsquoLarge gap Fiscally restrictedrsquo(eg Pakistan Nigeria)
lsquoLarge gap Fiscally flexiblersquo (eg Malaysia)
23
3 Selecting projects
Around the world the multitude of industrial cranes signals the increase in infrastructure projects and the resulting demand on investment resources Yet what is not apparent is the variety of competing demands for infrastructure investment such as the ageing of existing infrastructure the need to adapt the built environment to respond to climate change and the desire to initiate new often lsquomegarsquo projects6
The planning and selection process of the appropriate infrastructure project is particularly difficult given long asset lives and significant sunk costs that increase risk and uncertainty
Given these common barriers finance professionals from around the world offered a mixed review of their countriesrsquo current selection process Only 16 of respondents to the joint member survey claimed that their government always or frequently selects infrastructure projects that provide the most value to taxpayers whereas a majority (52) argued that their government only sometimes selects infrastructure projects of value to taxpayers Almost one-in-three respondents (29) indicated that they believed that governments never or infrequently select infrastructure projects that provide value to taxpayers (Figure 31)
There is clearly room for improvement in how infrastructure projects are selected To suggest how to improve the planning
and selection process respondents to the joint member survey were asked to rate in order of priority what changes could be made to improve decision-making when planning and selecting
infrastructure projects Figure 32 shows how respondents ranked the various options from first choice to fifth with smaller bars reflecting fewer respondents ranking that option in their top five
FIGURE 31 Do you believe the government selects projects that provide the most value to the taxpayer
0 10 20 30 40 50 60
Always
Frequently
Sometimes
Infrequently
Never
Dont know
Source The Global Infrastructure Gap survey all respondents n 3611
6 lsquoMegaprojects are large-scale complex ventures that typically cost US$1bn or more take many years to develop and build involve multiple public and private stakeholders are transformationaland impact millions of peoplersquo (Flyvbjerg 2018)
24
A majority of respondents (55) ranked either lsquoremoving political decision-makingrsquo or lsquoputting in place mechanisms to reduce corruptionrsquo as their first choice
The results (Figure 32) show that lsquoremoving political decision-making and making the process more technocraticrsquo was the change most cited by finance professionals as likely to improve the planning and selection process A majority of respondents (55) ranked either lsquoremoving political decision-makingrsquo or lsquoputting in place mechanisms to reduce corruptionrsquo as their first choice This prioritisation aligned with the pervading sentiment voiced by participants in the Canadian roundtable who argued that the government often plan and select projects that are likely to be popular among voters and will focus decision-making on the political cycle which results in short-sighted project selection and planning processes that lack a long-term plan to address future needs
The importance of putting in place mechanisms for reducing corruption such as effective whistle-blowing legislation also resonated in the roundtable discussions A participant in Nigeria emphasised that lsquoif project selection was looked into as it should be it would
definitely help us in reducing corruption and hence reduce the infrastructure gaprsquo Respondents also ranked highly lsquoquantifying the total life-cycle costs of a potential projectrsquo ndash with 22 selecting this as their first or second choice Therefore one of the key barriers to improving project selection is the bias towards short-term thinking and decision-making
Another area needing improvement identified in the survey is the lack of a standard assessment method supporting the project selection process The survey showed that 26 of respondents ranked lsquoimplementing standard assessment tools to evaluate projects during selectionrsquo as either their top or second-highest choice Below we explore two such barriers and how accountants play a role in addressing them first improving the project planning and selection processes by using standards and tools to identify need and prioritisation and second the misalignment between the project life cycle and the political short-term thinking that often prevails in project selection
How accountants can bridge the global infrastructure gap | 3 Selecting projects
FIGURE 32 Which of the following do you feel the government in your country should prioritise to make the best decisions when selecting infrastucture projects
Removing political decision-making making process
technocratic
100
80
60
40
20
0
n 1st preference n 2nd preference n 3rd preference n 4th preference n 5th preference
Applying standard assessment tools to
evaluate projects during selection
Putting in place mechanisms to
reduce corruption
Quantifying the total life-cycle
costs of potential projects
Spending more resource to evaluate
projects after completion
Transferring project selection powers
to more local levels of govt
Adhering to global accounting
standards
Bringing OOBs onto government
balance sheets
Moving government accounts from cash to accrual
accounting
Source The Global Infrastructure Gap survey all respondents n 3611
25
How accountants can bridge the global infrastructure gap | 3 Selecting projects
The constrained optimisation method is another tool that can be used for project selection though it is usually reserved for complex and large projects that require mathematical optimisation before decisions are made
31 BARRIER 1 LACK OF A STANDARD PROJECT SELECTION METHOD ndash FACTORING IN lsquoNEEDrsquo AND lsquoPRIORITISATIONrsquoA participant in the Trinidad amp Tobago roundtable commented that planning and project selection is lsquohardly ever done on a needs basis We do not complete a needs assessment when were building a road costing millions of dollars What is the benefit that we are going to bring to society from that new infrastructurersquo Establishing a need is a key consideration in building the case for selecting a particular project Although there are no international standards or regulations for infrastructure project selection the Guide to Project Management Book of Knowledge (PMBOK) (Project Management Institute 2017) sets out a process whereby the lsquoneedrsquo for the project is identified first and classified as most important in the selection This can be done by conducting a needs assessment or feasibility study and supports the reasons for lsquowhyrsquo the project is required The lsquowhyrsquo may be stimuli such as a market demand a business need a customer request a technological advance a legal requirement or a socialenvironmental need
The PMBOK then delineates two broad methods for establishing the benefit or the lsquowhyrsquo of a project the benefit measurement method and the constrained optimisation method
The benefit measurement methodAs a comparative approach this method is based on the present value of estimated cash flows and uses techniques such as benefitcost ratio economic models payback period discounted cash flow internal rate of return and opportunity cost This method is often used for small or less complex projects
Constrained optimisation methodThe constrained optimisation method is another tool that can be used for project selection though it is usually reserved for complex and large projects that require mathematical optimisation before decisions are made This method is widely used in finance and economics to find the minimum or maximum for a cost function where the cost changes depending on varying inputs Many techniques are available that offer broader consideration for decision makers by examining the best and worst case scenarios and the probability of the project outcome
The international roundtable participants highlighted that governments should ensure that the need for a particular project is clearly defined ndash the lsquowhyrsquo as the need will determine the appropriate source(s) of support To do this they should implement a stage-gate process such as the PMBOK with standard tools and mechanisms in place for evaluating the project selection process increasing transparency and reducing corruption
FIGURE 33 Two methods of need assessment
Uses cost-benefit analysis to assess whether the project is financially viable or not
Constrained optimisation method
The benefit measurement method
Compares the project under consideration with a competing project
New project Competing project
How accountants can bridge the global infrastructure gap | 3 Selecting projects
Alongside the technical methods available for isolating need and priority accountants can produce a broader range of metrics to improve the projection selection process
In practice many governments do not have the resources or the capacity to carry out such assessments across all projects and usually with the limited information available they place emphasis on basic elements of project appraisal which include lsquorules of thumbrsquo to confirm that
bull the need for the project is justified
bull the projectrsquos objectives are clearly specified
bull broad alternatives to the project are considered
bull promising options are analysed
bull project costs are fully estimated and
bull project benefits are assessed
Even by applying the basic elements of project appraisal prioritisation (or ultimately selecting the right project) can still be a constraint The World Bank has developed an innovative and adaptable Infrastructure Prioritization Framework (IPF) (Marcelo et al 2016) to assist governments in making the best use of their limited information in the interim until they are able to increase their capacity and resources for conducting a more informed and extensive analysis
The IPF provides a stepping-stone approach to project prioritisation for government decision-making This multi-criterial decision-support tool builds on existing and accessible data to help governments compare projects while promoting the building of analytical capacity and data for more extensive financial and economic analysis It is seen as an extension to the current set of tools available to support project selection It starts from a baseline of ad hoc uninformed project selection (where technical project information is limited and subjective) to partial technical information (where some information and analysis is available) to a full selection by advanced project appraisal (where considerable technical information is available)
Alongside the technical methods available for isolating need and priority accountants can produce a broader range of metrics to improve the projection selection process For example project planning and selection in Japan considers the effect of infrastructure investment on achieving regional equity instead of selecting projects that give the highest direct economic return (International Transport Forum 2017) This approach prioritises more evenly spread economic development in a country even where an optimisation model would suggest investment elsewhere
Box 31 Sustainability and infrastructure A Canadian case
The Canadian wave of the survey included a question on sustainability and infrastructure 80 of Canadian respondents indicated that they believe that it is very important to adapt to the impacts of the changing climate such as severe weather in planning infrastructure projects
It is important now more than ever to build resiliency into infrastructure investments Roads bridges buildings public transit and water and wastewater systems are at increasing physical risk from the impacts of climate change
The Canadian government declared in the 2017 federal budget that it plans to invest CAD219bn in green infrastructure Specifically CAD2bn is dedicated to a Disaster Mitigation and Adaptation fund to support the federal provincialterritorial and municipal infrastructure needed to address climate change Canadian national building codes have been updated to integrate climate adaptation and
resiliency considerations resulting from significant disaster losses Canadian insurance companies are experiencing the impact the annual insured damage for 2016 was CAD49bn ndash a significant increase from the previous annual record of CAD32bn set in 2013 In 2016 the biggest claims arose from the Fort McMurray wildfires which resulted in approximately CAD37bn in insured damage
Any future costs of inaction will likely outweigh the incremental investments made today in enhancing and modifying infrastructure resiliency Nonetheless too often there are challenges in making the business case for projects that incorporate adaptation measures But as with most modifications in the long run it is always easier and cheaper to build resilience considerations into asset development from the start rather than adding them later in response to a major event n
26
How accountants can bridge the global infrastructure gap | 3 Selecting projects
The member survey revealed the need to quantify the total life-cycle cost and remove political decision making in order to improve project selection
32 BARRIER 2 MISALIGNMENT OF THE INFRASTRUCTURE LIFE CYCLE AND THE POLITICAL CYCLE The member survey revealed the need to quantify the total life-cycle cost and remove political decision making in order to improve project selection These two changes are likely prioritised because of the misalignment that commonly exists between the political cycle (often four to six years) and the total life cycle of an infrastructure asset (often over 20 years) This mismatch can generate two biases a bias towards short-term decision-making and a bias towards megaprojects over maintenance
Short-term bias in project selection New infrastructure investment is unavoidably long-term and this carries certain risks At the stages of early planning and project selection infrastructure decision-makers need to consider the forces shaping a country ndash such as social demographic and technological change ndash while providing sufficient flexibility to address unpredictable adjustments in need These variables do not align well with the typically shorter political cycle where there is often a preference for announcements of major projects that can be hard to execute in practice or where fundamental requirements may be missing (eg unfeasible building requirements or little forecasted demand for use of the infrastructure) To counteract this bias the UKrsquos National Infrastructure Commission (NIC) was established in 2015 to produce analysis that is independent of government and to provide advice on major long-term infrastructure challenges ndash with the specific priority of linking long-term priorities with short-term action The NIC publishes an annual National Infrastructure Assessment (eg NIC 2018) to establish infrastructure needs and priorities over many decades
Having an independent body of experts recommending a stable set of priorities can reduce investment risk as potential private sector partners will have certainty that a project aligns with a broader economic plan Establishing a national plan based on agreed priorities is also good practice for reducing short-termism and improving legitimacy but it can also add rigidity to project selection processes Decision-makers must be careful to balance the benefits of a stable framework with maintaining flexibility to respond to a rapidly changing policy environment
Bias towards mega-projects over maintenance There can be considerable bias towards allocating resource to new (preferably high-profile) projects rather than investing in the necessary maintenance of existing assets There can be a natural reluctance to spend money on what a country already has and there is often political appeal in wishing to establish an individual legacy through the construction of a megaproject Accountants are in a pivotal position to draw attention to the issue of prioritising backlog maintenance to ensure that assets remain in serviceable condition As part of any needs assessments careful consideration must be given to the condition of existing capital infrastructure and its ability to maintain the existing levels of service To balance these demands NHS Scotland publishes an annual assets and facilities report which provides an overview of asset performance and planned future investment (see NHS Scotland 2018) This report offers good practices in quantifying and managing the backlog of maintenance including setting out the total outstanding backlog of maintenance costs per square metre of the estate and the proportion of significant and high-risk maintenance By identifying the maintenance backlog NHS Scotland is able to take the appropriate action to mitigate a reduction in public service quality while also prioritising repairs in line with the metrics established in the annual assets and facilities report
27
28
How accountants can bridge the global infrastructure gap | 3 Selecting projects
Box 32 Accountants and climate-change adaptation planning A Canadian case in point
As governments around the globe move to establish planned spending on infrastructure projects designed to adapt to climate change it is essential that accountants have a role in project selection and planning to help make the business case for resiliency and to ensure adequate accountability
In Canada the efficacy of this practice was illustrated when the City of Montreal developed its Climate Change Adaptation Plan Accountants played an integral role in performing the cost-benefit analysis of embedding adaptation into municipal infrastructure decisions (CPA Canada 2016)
lsquoA less costly option may be deemed adequate today but could result in future costsrsquo explained a participant in the Canadian roundtable
For example if Montrealrsquos sewer pipes cannot withstand increased flooding predicted with climate change sewer backups could lead to additional expenditures such as clean-up costs and even legal liabilities
lsquoClimate change is going to force cities and governments to put in place capital projects and other measures to prevent future losses or damagesrsquo emphasised the participant
Indeed there has never been a more vital time for CPAs to get involved in infrastructure project selection n
The walkway of Saint Anne De Bellevue Montreal Quebec during the floods April 2017Editorial credit Glass and Nature Shutterstockcom
29
4 Financing projects
The economic analysis in this report demonstrates that by 2040 the world will have accumulated an infrastructure gap of over US$14 trillion In response to this challenge governments are adopting novel means of effectively funding and financing their public infrastructure ndash as well as turning to institutional investors foreign direct investment and the private sector
Accountants act as a critical interface between these actors for example through effectively communicating and negotiating the terms of an infrastructure finance deal
41 THE MIX OF PUBLIC AND PRIVATE FINANCE FOR INFRASTRUCTURERespondents to the joint member survey shared the view that infrastructure in their countries should be financed by both the public and private sectors with 85 stating that infrastructure should be financed by some mix of investment from both the public and private sectors Half the total respondents (50) suggested that there should be an even mix between public and private finance while the second most common view was that infrastructure should be primarily financed by the public sector (42) Some countries such as the UK plan for the majority of their future infrastructure investment to come from the private
sector (IFG 2017) and data from the Project Finance and Infrastructure Journal shows that global private finance deals amounted to over US$930bn in 2017 (IJGlobal 2018) Given this environment
it is important for accountants to contribute their financial acumen and professional skills by providing a view on the best means of financing infrastructure projects (Figure 41)
FIGURE 41 How should infrastructure be financed in your country
0 10 20 30 40 50 60
PRIVATE
Entirely private finance
Mostly private finance
Even mix of public and private finance
PUBLIC
Mostly public finance
Entirely public finance
Dont know no opinion
Source The Global Infrastructure Gap survey generalist respondents only n 1645
30
and core public service infrastructure Core public service infrastructure such as hospitals and schools attracted the lowest private finance support
Overall finance and accounting professionals with a specialist background took a balanced view on the appropriate finance sources for infrastructure in their country
42 KEY BARRIERS TO SECURING PRIVATE FINANCE FOR INFRASTRUCTUREThe member survey showed that 85 of respondents believed there should be some mix of public and private sector finance in their countryrsquos infrastructure A key question therefore is what barriers limit the flow of private finance for public infrastructure
Survey respondents with specific expertise in infrastructure (lsquospecialistsrsquo ) provided a detailed breakdown on the suggested balance of public and private investment by each type of infrastructure
7
Almost half (47) of specialist respondents argued that ICT infrastructure should be either mostly or entirely financed by the private sector while other transport ndash such as air or sea ndash ranked as the second highest subsector for private sector investment (36) (Figure 42) There was a consistent view across the infrastructure subsectors that there should be an even mix of public and private investment with between 33 and 46 of specialist respondents holding this view Only three subsectors were seen to benefit from finance originating mostly or entirely from the public sector these were water and sanitation roads and highways
How accountants can bridge the global infrastructure gap | 4 Financing projects
Overall finance and accounting professionals with a specialist background took a balanced view on the appropriate finance sources for infrastructure in their country
FIGURE 42 How should infrastructure be financed in your home country by infrastructure sub-sector
Dont know no opinion PUBLIC Even mix PRIVATE
Information and communication technology
Other transport
Power and energy
Railways
Water and sanitation
Roads and highways
Core public service infrastructure
0 10 20 30 40 50 60 70 80 90 100
n n n n
0 10 20 30 40 50
Insufficient skills in government to negotiate with private sector
Lack of attractiveness of infrastructure investment
Negative perception of private finance for public infrastructure
Regulatory barriers
Perceived political instability in my country
Underdeveloped financial markets in my country
Too few viable projects for private investment
Other
Dont know
FIGURE 43 What are the key challenges that the government faces in securing private finance
Source The Global Infrastructure Gap survey all respondents n 3611
Source The Global Infrastructure Gap survey specialist respondents only n 1966
7 Question 3 of the survey asked respondents if their work involved any of the following areas infrastructure policy procurement capital budgeting project management or operations management
How accountants can bridge the global infrastructure gap | 4 Financing projects
Developing the skills in government to act as competent clients and negotiators will be essential in meeting the challenges of providing the right finance for infrastructure projects
As seen in Figure 43 ACCA members and CPA Canada members identified three key barriers for governments working to secure private finance
Barrier 1 the lack of attractiveness of infrastructure investment (42)
Barrier 2 the negative perception of private finance for public infrastructure (43) and
Barrier 3 insufficient skill in government to negotiate with the private sector (45 of respondents)
The distinction between lsquofundingrsquo and lsquofinancingrsquo infrastructure (set out in the next section) helps explain the lack of attractiveness of infrastructure investment and what accountants might do to reduce this problem The higher cost and perceived private gain from public goods is a significant factor in the negative perception of private finance investing in public infrastructure The UK National Audit Office published a report in January 2018 calling out the high rates of return enjoyed by private investors participating in the Private Finance Initiative (Morse 2018) Therefore accountants must take centre stage in
demonstrating the higher cost of private capital managing the transfer of risk between sectors and building an evidence base for selecting the right financing model to support an infrastructure project
Finally developing the skills in government to act as competent clients and negotiators will be essential in meeting the challenges of providing the right finance for infrastructure projects For example there is growing recognition that gold-standard public finance takes account of more than debt stocks and cash flows (eg debt to GDP ratio and tax receipts) and instead needs to consider net wealth particularly public assets Cultivating the skills in government to produce a public sector balance sheet and applying this perspective to the finance selection process will help policymakers maximise the value of their assets and make better infrastructure finance decisions
The remainder of this chapter will discuss these barriers in order to inform areas where public sector accountants can make a difference in closing the infrastructure gap
FIGURE 44 Key barriers in financing infrastructure projects
Lack of attractiveness
of infrastructure investment
Negative perception of
private finance for public
infrastructure
Insufficient skill in government
to negotiate with the
private sector
BARRIER 1 BARRIER 2 BARRIER 3
42 43 45
31
How accountants can bridge the global infrastructure gap | 4 Financing projects
Investment in infrastructure offers the opportunity for private investors to benefit from stable long-term low-risk returns that are tied to a physical asset
43 BREAKING DOWN BARRIER 1 BY CLOSING THE FUNDING GAP
Investment in infrastructure offers the opportunity for private investors to benefit from stable long-term low-risk returns that are tied to a physical asset A key challenge in connecting this pool of private capital with the demand for infrastructure projects is the funding gap Broadly there are three ways of funding (lsquoultimately paying forrsquo) an infrastructure project
Distinguishing between funding and financing It is important to make a clear distinction between the lsquofundingrsquo and lsquofinancingrsquo of infrastructure projects When a private sector institution such as a bank or pension fund finances a public infrastructure project it is providing the upfront money to allow for the design building and operation of that project whereas lsquofundingrsquo is how an infrastructure project is ultimately paid for (Institute for Government 2018)
Global capital markets can help plug the global infrastructure gap Institutional investors with an estimated US$80 trillion in assets under management (Fages et al) seem ideal partners for providing the required finance to reduce the size of the forecasted global infrastructure gap Their risk appetite and the duration of their liabilities match the needs of typical infrastructure projects that will often have life cycles ndash from design to decommission ndash that can span many decades
bull general taxation
bull user charges (eg toll roads) and
bull novel forms of funding (eg value capture and civic crowdfunding)8
This distinction explains why even where private investors have expressed interest in public infrastructure and while the global infrastructure gap grows the response has been relatively muted (McKinsey 2016a) Private investors understandably require a stream of revenue to support their upfront outlay but many potential (even lsquoshovel readyrsquo) projects do not include the long-term funding arrangements to support private finance
FIGURE 45 The funding gap
Global Infrastructure Investment Gap
(forecasting a US$14 trillion gap by 2040) FUNDING
GAP
Institutional Investors
(US$80 trillion under management)
8 Refer to Institute for Government 2018 for an overview of the advantages and disadvantages of different infrastructure funding options
32
Box 41 Hong Kongrsquos MTR Corporation ndash fully funded infrastructure through value capture
Hong Kong has applied a novel form of infrastructure funding that has attracted global attention MTR Corporation is majority owned by the Hong Kong government and manages a passenger rail system that makes a profit It manages to generate revenue in excess of 180 of its operating cost
One factor in MTRrsquos financial success has been its lsquoRail plus Propertyrsquo model where the corporation captures some of the positive externalities of its transit operations by developing and renting the land surrounding its rail stations
Hong Kong is particularly suited to this form of funding with its dense population and high real estate costs which have allowed MTR to create sustainable revenue streams from the development of the land surrounding its stations (Leong 2016 MTR Corporation 2017) n
Innovative models of funding infrastructureGeneral taxation and government capital allocations provide an important foundation for funding public infrastructure while user charges can provide a stream of revenue (eg road tolls) ndash subject to demand risks There are also emerging models that are helping to plug the funding gap Rent capture is attracting attention as a method of funding transit (see Box 41 on the MTR Corporation in Hong Kong for an example) In addition civic crowdfunding a novel form of funding is spreading in popularity A report from Catapult Future Cities (2017) found that 10 of local governments in the UK now make use of some form of civic crowdfunding to transform their communities Spacehive ndash a UK crowdfunding platform ndash has attracted over pound11 million in funding since 2012 to fund over 550 local projects including building new community centre facilities (Spacehive 2019) Platforms such as Spacehive connect grant providers local governments and residents that collectively contribute to projects as well as providing a service to verify that a project is viable and has received the required government permissions In 2017 the Mayor of London committed pound400000 to Spacehive projects (OrsquoDowling-Keane 2017) As governments face constrained budgets public sector
finance officials can play a central role in supporting these novel forms of infrastructure funding by establishing what proposals are financially viable in order to help plug the infrastructure gap
The role of the accountant in addressing the funding gapBeyond these novel funding models accountants can play an important role by helping to identify the most efficient funding models while also taking a leading role on the negotiation with potential private sector investors and representing the public interest through their high ethical standards
Clearly the funding gap is a factor in lsquothe lack of attractiveness of infrastructure investment for private investorsrsquo identified in the member survey Finance professionals should consider a number of factors in formulating effective business cases that can attract private sector finance (eg in articulating the lsquoprivate sector incentiversquo) The financial viability of the project needs to be balanced against affordability for users and access to public goods and services Accountants must consider how they can develop and communicate the private sector incentive for investing in priority projects while also supporting the public interest and providing taxpayers with value for money
33
How accountants can bridge the global infrastructure gap | 4 Financing projects
General taxation and government capital allocations provide an important foundation for funding public infrastructure while user charges can provide a stream of revenue (eg road tolls) ndash subject to demand risks
34
How accountants can bridge the global infrastructure gap | 4 Financing projects
44 BREAKING DOWN BARRIER 2 BY ACCOUNTING FOR THE HIGHER COST OF PRIVATE CAPITALRunning infrastructure projects efficiently for citizens also requires that accountants provide decision-makers with the best advice possible in selecting the appropriate source of project finance
The UK is a global leader in the use of private finance and has over 700 operational private finance deals ndash with total projected future charges arising from these deals of almost pound200bn (Morse 2018) In 2018 The UKrsquos National Audit Office published a report examining the rationale costs and benefits of private finance for public sector projects (Morse 2018) The reportrsquos analysis of Department for Education data showed that the cumulative cost of privately financed projects can exceed the public sector
finance costs by 40 over the life of an infrastructure project The broader benefits of private finance for example transferring risk away from government must therefore outweigh the higher total life-cycle cost of private capital
Off balance sheet liabilities in public sector accountingThe UK is not alone in making use of private finance to provide the upfront capital for public infrastructure The accounting rules set by the European System of Accounts excludes liabilities from public sector balance sheets if the private sector bears most of the projectrsquos risks and rewards The types of risk contributing to this test include construction risks (eg cost and time overruns) and demand risks (eg forecasted and actual use of the infrastructure asset) (Atkins et al 2017) Liabilities not included
By the nature of the public sector there are many competing short-term needs for public capital investment where necessary infrastructure investment must compete with other public spending priorities
35
30
25
20
15
10
05
0
Portu
gal
Slov
akia
Hungar
y
UK
Cypru
s
Irelan
dN
ethe
rland
s
Spain
Denm
ark
Esto
nia
Belgiu
m
Gre
ece
Croat
ia
Austri
a
Malt
a
Italy
Finl
and
Latv
ia
FIGURE 47 Off balance sheet PPPs as of GDP
Source ACCA and CPA Canada analysis of Eurostat 2018
FIGURE 46 Estimated cash flows of a privately and publicly financed projectThe cumulative cash costs of a group of PF2 schools are around forty per cent higher than the costs of a project financed by government borrowing
350000
300000
250000
200000
150000
100000
50000
0
Cumulative cash costs (pound000)
2015 2016 2017 2018 2019 2020 2021 2022 2023 2024 2025 2026 2027 2028 2029 2030 2031 2032 2033 2034 2035 2036 2037 2038 2039 2040 2041 2042
Benefits needed to offset higher costs of private finance procurement
PF2 unitary charges Public sector comparator (PSC) with government borrowing costs
Notes1 Cost estimates taken from data prepared by the Department for Education to compare costs of a group of privately financed (PF2) schools with a public sector comparator (PSC)
2 Interest costs for the PSC have been modelled using an amortising loan with an interest rate of 25 The 20-year government borrowing costs were 25 at the time of financial close of this project and the average life of the project debt was less than 20 years
Source Education Funding Agency National Audit Office analysis Reproduced from Morse 2018
How accountants can bridge the global infrastructure gap | 4 Financing projects
Accountants in the public sector must play a critical role in managing both these benefits while also collecting reliable data to measure whether private finance provides good value for money
on the public sector balance sheet are known as off balance sheet (OBS) liabilities Data from Eurostat shows that other European countries have amassed considerable OBS liabilities ndash with outliers such as Portugal and Slovakia maintaining OBS liabilities in excess of 3 of GDP (Eurostat 2018)
An incentive for using private finance can arise through the combination of fiscal rules such as the EUrsquos Fiscal Compact requiring governments to meet debt reduction targets (European Commission 2017) and the ability to keep certain liabilities off the balance sheet through private finance Governments will be encouraged to use private finance even when it ultimately costs more than traditional public finance when this generates the fiscal illusion of adhering to fiscal rules while at the same time building and operating necessary infrastructure In addition to the fiscal illusion these treatments limit the transparency of infrastructure finance by shielding some politicians and the public from understanding the true cost of infrastructure investment in a particular country
Insufficient flexibility between capital and operational budgets can cause further challenges This is particularly the case where a public sector entity can attribute the unitary charge9 from a private finance deal to its operational budgets in cases where the capital budget includes insufficient funding for a required project By the nature of the public sector there are many competing short-term needs for public capital investment where necessary infrastructure investment must compete with other public spending priorities ndash such as the growing operational costs of health care and education But over time high unitary charges can crowd out operational budgets and prevent future governments from providing quality public services
Why use private finance for public infrastructure Given all these concerns it is unsurprising that in the October 2018 Budget Speech the UK Chancellor confirmed that the government would not sign any new Private Finance Initiative (PFI) contracts (Plimmer 2018) Given this environment it is worth asking what is the genuine rationale for private finance in public infrastructure
Two key benefits can justify the use of private finance for public infrastructure the appropriate transfer of risk from the public to the private sector in the building and running of the infrastructure and efficiencies achieved through the use of private sector money in the financing building and operation of public infrastructure Accountants in the public sector must play a critical role in managing both these benefits while also collecting reliable data to measure whether private finance provides good value for money The next chapter explores findings from the member survey on how best to manage the relationship between public and private actors involved in infrastructure projects
At the early stages of a projectrsquos conception accountants are also critical in selecting the right type of finance where they can provide a transparent assessment of the best finance option based on sound principles (eg value for money affordability for users and distribution impacts) Previous ACCA research shows the high level of trust in the ethical behaviour of accountants Ethics and Trust in a Digital Age (ACCA 2017) found that 9 in 10 professional accountants agree that ethical behaviour helps to build trust in the digital age And almost all C-suite executives (95) assert that the accountantrsquos ethical behaviour helps the organisation build trust with internal and external stakeholders Accountants can offer a collective good through this privileged position of trust by providing sound transparent advice on the best finance option for a particular infrastructure project
9 The recurring payments by governments for privately financed projects
35
How accountants can bridge the global infrastructure gap | 4 Financing projects
The barrier to attracting private finance for infrastructure most cited in the member survey was that governments have insufficient skill to negotiate effectively with the private sector (45)
45 BREAKING DOWN BARRIER 3 BY PROFESSIONALISING THE PUBLIC SECTOR FINANCE FUNCTION The barrier to attracting private finance for infrastructure most cited in the member survey was that governments have insufficient skill to negotiate effectively with the private sector (45) This issue was echoed in the roundtables with participants in Trinidad and Tobago stating that there was a clear need to differentiate professional accountants from those who had no real professional training lsquoterms are used very loosely in this country as to an accountant and most times you would mean ldquobookkeeperrdquorsquo Others in Malaysia noted that lsquomany accountants nowadays lack the right specialisation of skills in terms of having foresight to anticipate what costshellipcome into play [in an infrastructure project]rsquo Clearly there are skills gaps in government that need to be addressed through professionalisation and upskilling if infrastructure is to be properly financed
Finance professionals offer a net wealth perspective Knowing what the country owns and what it owes is a basic requirement for reducing its governmentrsquos information deficits which will allow for improved decision-making in financing infrastructure The professional management of assets and the development of an asset register are two examples of how accountants can take the lead in improving government decision-making In the UK roundtable discussion David Smith associate partner at EY UK also acknowledged the essential role of accounting standards
lsquoAccountantsrsquo work now goes beyond compliance but compliance is our firm foundation Speaking from experience we have global accounting rules that do not necessarily align jurisdiction by jurisdiction but the rules are there for a reason If therersquos deviation or rejection of accounting standards for infrastructure projects at any stage then that is a clear red flagrsquo
Global studies are documenting how the benefits of accrual accounting are leading to broad global adoption For example the 2018 International Public Sector Financial Accountability Index forecasts that within the next five years 65 of governments will report on an accrual accounting basis ndash with particularly high levels of adoption in Africa Asia Latin America and the Caribbean (IFAC and CIPFA 2018)
The professionalisation of the finance function is essential in maximising the value of a countryrsquos assets There is growing recognition that gold-standard public finance practice takes account of more than debt stocks and cash flows (eg debt to GDP and tax receipts) and instead needs to consider net wealth where the right policies can maximise the return on public assets This approach requires the adoption of full accrual accounting and the production of a public sector balance sheet Improving the skills available to government to develop a public sector balance sheet and appreciating the full balance sheet impact of a new project will be an important step in allowing public sector accountants to act as competent clients of and negotiators with the private sector
36
How accountants can bridge the global infrastructure gap | 4 Financing projects
37
Maximising the value of public assets and the intertemporal balance sheetDag Detter a former director of Swedenrsquos Ministry of Industry argues that taking a net wealth perspective with the aim of producing small improvements in the return on public assets would allow for a doubling in infrastructure investment (Detter and Folster 2017) The competing argument to this view is that many public assets are not marketable as policy objectives (eg running a public school) do not typically align with generating financial returns
The New Zealand government seeks to address this issue by classifying its assets and liabilities as social financial and commercial ndash where commercial assets have more scope for financial returns New Zealand has taken the lead in public
The adoption of this net wealth perspective changes the typical rankings of public financial capability In late 2018 the IMF Fiscal Monitor published a report (IMF 2018) which estimated that globally governments had public assets worth over 200 of GDP Applying this analysis can also support good public financial management in a country with the IMF report showing that countries with a strong balance sheet pay lower interest on debt and have shorter and shallower recessions
Figure 48 shows the result of adopting a net wealth view of a nationrsquos financial position Using this lens Japan ndash with a notoriously high public-debt-to-GDP ratio ndash has a net wealth position near zero Other countries such as the UK and Portugal have substantial negative public equity in excess of 100 of GDP
The professionalisation of the finance function is essential in maximising the value of a countryrsquos assets
FIGURE 48 Public sector balance sheets ( of GDP)
750
500
250
0
-250
-500
Port
ugal
Uni
ted
Kin
gd
om
The
Gam
bia
Ger
man
y
Bra
zil
Fran
ce
Aus
tria
El S
alva
do
r
Uni
ted
Sta
tes
Ug
and
a
Jap
an
Ken
ya
Tanz
ania
Can
ada
Ind
ia
Gua
tem
ala
Finl
and
Alb
ania
Co
lom
bia
Tuni
sia
Geo
rgia
Sout
h A
fric
a
Aus
tral
ia
New
Zea
land
Ind
one
sia
Ko
rea
Peru
Kaz
akhs
tan
Russ
ia
No
rway
n Financial assets n Total non-financial assets n Liabilities ex pension n Pension liabilities Net worthTu
rkey
Source IMF staff estimates
Based on a single year of data in most cases compiled as part of the Fiscal Transparency Evaluation Albania 2013 Austria 2015 Brazil 2014 Colombia 2016 The Gambia 2016 Guatemala 2014 Kenya 2013 Peru 2013 Portugal 2012 Tanzania 2014 Tunisia 2013 Turkey 2013 Uganda 2015
38
How accountants can bridge the global infrastructure gap | 4 Financing projects
TABLE 41 New Zealand Intertemporal balance sheet 2016(Percentage of GDP)
ASSETS LIABILITIES NET WORTH
Social 575 71 505
Financial 332 505 -173
Commercial 201 120 81
Static balance sheet 1108 695 413
Fiscal 13819 14800 -981
Intertemporal balance sheet 14927 15495 -568
Source New Zealand 2017 Investment Statement IMF 2018
Box 42 New South Wales Treasury Asset and Liability Committee
The state of New South Wales in Australia has established an Asset and Liability Committee to maximise the value of their assets and properly manage the statersquos liabilities
By using this total balance sheet perspective the New South Wales Treasury has been able to unlock AU$33bn for new social and economic infrastructure projects
This initiative was recorded as part of a series undertaken by ACCA and the International Federation of Accountants (IFAC) documenting good practices in public financial management from around the world To learn more scan the QR code to hear more about this initiative in NSW
If the public sector finance function is professionalised accountants working in the public sector will be able to lead the development of the required governance structures to maximise the value of public assets And where public assets do present commercial opportunity accountants must be at the forefront of proper public commercial asset management By providing independent professional management for public assets governments will be well placed to maximise the value of their assets and minimise the cost of liabilities The member survey shows that reducing political influence in project selection was ranked as the number one issue for improving outcomes Allocating more decision-making authority to independent professional accountants will be an important step in the effective commercial management of public assets
financial management practices not just through this classification but also by producing an intertemporal balance sheet (see Table 41) The country currently maintains a strong net worth position in excess of 40 of GDP but analysis by the New Zealand Treasury shows that the current policy framework will produce recurring deficits that are forecasted to reduce the nationrsquos net worth to almost ndash57 of GDP over the next 40 years Accountants producing this analysis provide decisions-makers with a better long-term view of their policy decisions and can help improve the sustainability of public finances This fits with the maxim that lsquoyou manage what you measurersquo and governments that invest in their finance functions to develop a public sector balance sheet will be better placed to understand the implications of a particular infrastructure project on the nationrsquos net wealth
Where public assets do present commercial opportunity accountants must be at the forefront of proper public commercial asset management
Poor monitoring and oversight of
projects by government
Confusion about where
each side provides value
in a PPP
Uncoordinated commerical
acumen in the public sector
BARRIER 1 BARRIER 2 BARRIER 3
5 Delivering projects the publicndashprivate relationship
Common challenges with infrastructure project selection and financing outlined in the previous chapters may persist through the project delivery phase a shortfall in public capital budgets due to short-term decision-making changing political governance and the lsquomegarsquo risks associated with lsquomegarsquo projects For these reasons public-private partnerships (PPPs) are often chosen for the delivery of public infrastructure projects
51 DEFINING PPP In the context of public infrastructure projects a PPP is a contractual agreement between a public sector entity and a private entity (or group) to provide a public asset or service (World Bank 2018b) Unlike traditional procurement ndash where all the risk will ultimately sit with the government ndash PPPs will explicitly set out the allocation of risk for a project Importantly the scope of private sector involvement can vary substantially including requiring private sector partners to
bull design and build a project
bull design finance and build a project or
bull design finance build operate and maintain a project
Asset ownership is another relevant consideration in establishing the terms of a PPP A project can feature public or private sector ownership of the infrastructure and can include provisions to transfer ownership after a set period (eg a private sector partner operates a toll road for 20 years and thereafter transfers ownership of the road back to the public sector)
The roundtable discussion rightly identified the variety of responsibilities that the private sector can adopt in
a PPP For example a participant in the Canadian roundtable identified that the lsquoprivate sector needs to bring more to the government table than just money it needs to offer expertise or opportunity that the government would not otherwise haversquo
52 KEY BARRIERS TO GETTING THE PPP RELATIONSHIP lsquoRIGHTrsquo The public-private relationship is evolving and getting the terms of this relationship right will be critical for the provision of social and economic infrastructure in the future The roundtable discussions with infrastructure experts highlighted three key barriers to this where there was a particular focus on the need to develop the right relationship between public and private sector actors ndash as getting this
relationship right would support the timely and efficient delivery of infrastructure projects (Figure 51)
The roundtable participants identified poor monitoring and oversight by government as a key challenge in delivering infrastructure projects The member survey demonstrated that there was considerable disagreement about where each party in a PPP agreement provides value in delivery Finally the roundtable participants stated that the public sector was often lacking the commercial acumen required to manage an infrastructure PPP effectively
Below this chapter examines these barriers in greater detail and reviews recommendations for overcoming each one
FIGURE 51 Key barriers in delivering infrastructure projects
3939
How accountants can bridge the global infrastructure gap | 5 Delivering projects the publicndashprivate relationship
Both developed and developing countries need to consider whether they are providing sufficient monitoring across the entire project life cycle to maximise the value of their contracts
53 BREAKING DOWN BARRIER 1 BY ENGAGING THE PROFESSIONAL ACCOUNTANT TO PROVIDE PROJECT LIFE-CYCLE MONITORING AND OVERSIGHT Successful project selection financing and procurement will be of little effect if an infrastructure PPP suffers from poor contract management Managing project risk effectively ndash as well as controlling for scope and budget lsquocreeprsquo ndash requires the public sector to act as a competent client by providing effective monitoring and oversight of a project at every stage from design to operation of the infrastructure
Unfortunately these governance structures are often lacking in many countries with a participant in the Sri Lankan roundtable discussion noting that lsquoprojects [will] kick off but there is no one to monitor them on an ongoing basis This can lead to cost overrunsrsquo Written evidence by the Chartered Institute of Purchasing and Supply (2013) to the UK House of Commonsrsquo Public Administration Select Committee echoed this point In this evidence the Institute submitted that lsquoprocurement skills tend to focus on the call for competition to award the contract rather than on the whole procurement cycle which includes pre-procurement and contractsupplier managementrsquo Both developed and developing countries need to consider whether they are providing sufficient monitoring across the entire project life cycle to maximise the value of their contracts
Chapter 1 section 15 showed that corruption was one of the top barriers to meeting infrastructure need in certain
FIGURE 52 Possible parties to a PPP
regions ndash with 89 of survey respondents in South Asia citing this as a key barrier A roundtable participant in Trinidad and Tobago asserted that proper monitoring of project performance was essential for mitigating corruption particularly lsquohaving something that can support the accountants in countries with no whistle-blowing policyrsquo In addition Abiodun Akanbi from the Nigerian roundtable commented that lsquothe accountant has huge responsibility in measuring the actual performance of contractors to be able [to] efficiently deliver infrastructurersquo The accountant needs to be at the forefront of providing the public sector assurance that the project is being delivered as contracted and according to the project plan Clearly accountants in the public sector have a critical role to play in effective contract management ndash particularly by measuring project progress against agreed terms at key milestones in the delivery process
Reducing moral hazard in the PPP relationship Eriksson and Lind (2015) describe moral hazard as lsquopost-contractual opportunismrsquo There are three key parties that need to be considered in an infrastructure PPP the owner the contractors building the infrastructure and the investor Depending on the structure of the PPP contract any of these roles could be taken on to varying degrees by the government or a private partner Given the limited oversight and governance of many PPPs cited in the roundtable discussions the agents of a PPP project (ie the contractors) will often have the incentive to reduce costs by cutting corners in the projectrsquos execution
Investor Contractor
Owner
40
How accountants can bridge the global infrastructure gap | 5 Delivering projects the publicndashprivate relationship
41
54 BREAKING DOWN BARRIER 2 BY IMPROVING THE INCENTIVES AND RECONCILING DIFFERING VALUE ASSUMPTIONSThe member survey compared the perceptions of public and private sector accountants revealing areas where differing assumptions exist between these parties The survey divided respondents into those working in the public sector and those in the private sector Each group was asked in what ways the other sector provided and received value in PPP infrastructure projects Comparing these results demonstrates where the public and private sectors had a similar view on the purpose of a PPP relationship and where their assumptions on the purpose of the relationship differed (Figure 53) These insights are helpful in highlighting divergent views on the role of each sector where incorrect assumptions can harm the ability of a PPP to deliver a project
Comparing the results from each sector in Figure 53 shows that there was broad agreement on how the private sector adds value to infrastructure projects The ordering of the responses was the same for professionals across the two sectors with the majority of respondents from both sides agreeing that the private sector contributes to the partnership through its knowledge of best practice the application of innovation and access to private capital Interestingly respondents from both sectors were less likely to see risk transfer as an area where the private sector provides value The
These three stakeholders shown in Figure 52 will often have different motivations For example the owner might want to increase the scope of the contract after it is agreed For this reasonaccountants must assess the risks balance the costs and schedule and proactively communicate with all stakeholders to support the success of the project
Allocating risk to reduce moral hazardA CPA Canada roundtable participant rightly identified that lsquothe key areas of interface [between the public and private sector] are between the risks retained by the public sector and their impact on the private sectorrsquos ability to deliver on their contractual commitmentsrsquo Getting this allocation of risk right can significantly improve the prospects that a PPP project will be completed on time and on budget as the right risk balance will act as an incentive to meet contractual obligations (Mann 2018)
Accountants play a clear role here The professional team delivering a project will be aided by an accountantrsquos expertise of risk management ndash particularly the accountantrsquos ability to allocate risk appropriately between the parties in order to minimise moral hazard Although the size and nature of the public sector suggests that it is better placed to bear risk skilled finance professionals will seek to balance the allocation of risks to the private parties such that they maintain the incentive to perform contractual obligations to a high quality standard
Comparing the results from each sector in Figure 53 shows that there was broad agreement on how the private sector adds value to infrastructure projects
Source The Global Infrastructure Gap survey all respondents n 3611
70
60
50
40
30
20
10
0Applying innovative
practices and fresh thinking
Knowledge of best practice and expertise
n Private sector view n Public sector view
Access to private capital
Delivering projects on time
Keeping projects to budget
Transferring risk Dont know None of these
FIGURE 53 Where does the private sector add value in delivering infrastructure
42
How accountants can bridge the global infrastructure gap | 5 Delivering projects the publicndashprivate relationship
assumptions about how each party adds value to an infrastructure PPP contract ndash and suggests that public sector actors overestimate the value of the financial arrangements on offer to private sector partners
The UK Guarantees Scheme (UKGS) offers an example of a good practice that could help improve the private sector incentive for entering PPPs and partially reconciles the differing assumptions of value between both sectors The UK Infrastructure and Projects Authority states that the UKGS lsquosupports private investment in UK infrastructure projects It works by offering a government-backed guarantee to help infrastructure projects access debt finance where they have been unable to raise finance in the financial markets The UKGS can issue up to pound40 billion of guarantees and is open to at least 2026rsquo (UK Government 2017) This long-term commitment guarantees the payment of principal and interest on infrastructure debt and is intended to support lsquonationally significantrsquo projects If well implemented schemes like this can encourage additional private sector involvement in the provision of infrastructure ndash but should be balanced against the need to reduce the risk of moral hazard discussed earlier in this chapter
comparison of perceptions also showed that public sector respondents were slightly more positive about the overall value that private sector actors bring to the relationship
There was considerable divergence in opinion between sector respondents as to the areas where the public sector provided value in an infrastructure PPP (Figure 54)
Public sector respondents were much more likely to argue that they provided both a lsquolong-term and stable partnershiprsquo (62) and knowledge of how the public sector works (60) than their private sector colleagues (45 and 43 respectively) Finance professionals from the public sector were also more likely to claim that they provided the private sector with access to projects (45) compared with 35 in the private sector At the same time there was an agreement that the public sector was less likely to offer knowledge of best practice and innovation to a PPP relationship Therefore both sides took a largely similar view of the origin of knowledge and expertise but the public sector respondents were more optimistic about the value they provided as a financial partner in infrastructure projects Understanding this divergence of viewpoint is helpful in identifying the
There was considerable divergence in opinion between sector respondents as to the areas where the public sector provided value in an infrastructure PPP (Figure 54)
Source The Global Infrastructure Gap survey all respondents n 3611
70
60
50
40
30
20
10
0Long-term and
stable partnershipKnowledge of how the
public sector works
n Private sector view n Public sector view
Access to projects Knowledge of best practice and expertise
Applying innovative practices and fresh thinking
None of these Dont know
FIGURE 54 Where does the private sector receive value from the public sector in delivering infrastructure
How accountants can bridge the global infrastructure gap | 5 Delivering projects the publicndashprivate relationship
To ensure that an infrastructure project is successful strong commercial acumen is essential team members require lsquobusiness savvyrsquo a keen understanding of the market in which the project is being undertaken
55 BREAKING DOWN BARRIER 3 BY FACILITATING PUBLIC SECTOR ACCESS TO BUSINESS EXPERTISE To ensure that an infrastructure project is successful strong commercial acumen is essential team members require lsquobusiness savvyrsquo a keen understanding of the market in which the project is being undertaken Nonetheless as Ajith Lekshmanan a participant in the UK roundtable pointed out
lsquoFor a lot of these projects the [public sector] organisation may just be doing it the one time Itrsquos a one-off and these experts that we are going to [in the private sector] theyrsquove got a whole pool of people doing similar things year after year day after day in this country and other countries The skills required are quite specialist and to train a member of staff [in the public sector] to do it just for the one time that you might be using it is not cost effectiversquo
A public sector entity might manage a large-scale infrastructure project and gain valuable expertise in the process but that expertise may not be accessible to other public sector entities for leveraging in their own infrastructure projects In the public sector project-delivery expertise thus exists in silos It is often the private partners in a PPP who through repeated projects acquire the commercial acumen and therefore potentially hold the expert lsquoreinsrsquo
Centralisation of public sector skills may facilitate removal of this barrier For example the UK Civil Service has created Centres of Excellence that seek to pool the pockets of expertise that exist in the public sector such that any organisation within the public sector can refer to these centres and draw on their specialist skill and thus act as a competent client The professional accountant offers specialist skill and should certainly be a key player in any centre of excellence In fact the accountantrsquos role as an expert team member in such centres may provide as stated by a participant in the Malaysian round table ldquobetter marketing of how the profession contributes to society to encourage professionals to continue doing the right thing and be proud of itrdquo
Centralisation of skills will not however be the answer for all governments Others might seek to encourage cross-departmentministry collaboration to facilitate effective knowledge transfer of commercial acumen across the public sector In both cases collaboration is essential for effective knowledge transfer and as previously outlined the professional accountant with an understanding of life-cycle considerations and with professional frameworks for sound professional judgement and ethics is well-equipped to coordinate such collaboration
43
6 The role of the accountant in bridging the gap
61 CURRENT INFRASTRUCTURE PROJECTS THE MISSING TEAM MEMBER The successful provision of public infrastructure requires governments to have the right professional team in place And yet a clear message resounded from the international roundtable discussions a key player is often missing from the infrastructure project team ndash the accountant A representative at the Malaysian roundtable echoed the sentiment expressed by other participants worldwide that accountants are often only invited to comment on infrastructure projects that have already been selected lsquoSo the harm has been donersquo
As pointed out by a participant in the UK roundtable the role of the accountant has evolved over the years from a focus on lsquoguidelines parameters tick boxes and flowchartsrsquo to a much lsquowider awarenessrsquo Certainly the fact that accountants around the globe work within diverse segments of the economy and serve in key roles such as CEO and CFO and as consultants attests to that lsquowider awarenessrsquo The role of the accountant is at the centre of the planning process and not only in the areas of infrastructure policy The accountant can put the lsquonumbersrsquo on ideas and concepts by applying consistent methodology to ensure they are evaluated against other options for meeting policy goals
Future infrastructure projects the essential team member The previous chapters examined the barriers associated with three fundamental phases of infrastructure projects project selection project financing and project delivery With modern qualifications that facilitate barrier removal in each of these phases the accountant plays an essential role in bridging the global infrastructure gap
The international roundtable participants highlighted the following core competencies
a) Planning and selection of projects The accountant
bull develops strategy identifies goals objectives and ensures they can be achieved (giving consideration to financial constraints and potential monetary gains)
bull sets frameworks and uses standard assessment tools to ensure accountability and transparency and prioritisation according to evidence of need
bull questions project assumptions and assesses alternative scenarios
bull employs mechanisms to ensure ethical behaviour and to eliminate corruption while offering sound risk assessment
bull supports organisationsrsquo holistic decision-making in a way that accounts for the impact of climate change on strategy risk and operational and financial performance thus enhancing organisational resilience
b) Financing projects The accountant
bull considers sustainable finance options including climate-change adaptation and resiliency needs
bull assesses financial viability and identifies long-term impact and strategies for risk mitigation
bull acts as a visionary by providing sound life-cycle advice to decision makers and giving them better understanding of the long-term financial difference between maintaining services and enhancing services and of how the latter can create greater cost pressures over time
bull supports clearer and more objective public discourse increases public awareness of risks and supports taxpayersrsquo better understanding of the value of projects
c) Delivering projects and oversight The accountant
bull implements the required monitoring and oversight
44
How accountants can bridge the global infrastructure gap | 6 The role of the accountant in bridging the gap
Accountants offer important competencies to any business team in any sector But in the face of possible misconceptions of the role of accountants what is the way forward onto the professional infrastructure team
bull allocates project risk between parties of a PPP to reduce moral hazard
bull is supported by several frameworks (eg ICAS 2012 KPMG 2013) for professional judgement and ethics that promote the use of logic flexibility consistency reliability relevant evidence unbiased information and alternative framing to avoid precipitous decisions and that promote a balance of experience knowledge and emotion
62 NEXT STEPS TOWARD THE INFRASTRUCTURE TEAM Accountants offer important competencies to any business team in any sector But in the face of possible misconceptions of the role of accountants what is the way forward onto the professional infrastructure team The international roundtable participants made the following recommendations
bull Increase awareness of the accountantrsquos qualifications as a strategic business adviser and as an essential member of the professional infrastructure team alongside the engineers and architects
bull Equip accountants to voice arguments that are compelling both to political leaders and to the general public
bull Offer elected officials the opportunity to gain financial training from accountants so that they understand the true costs and are better equipped to act as financial ambassadors
bull Establish an accountant-informed certification process for project selection
bull Develop and implement clearer governance structures and decision-making processes that involve the finance function
bull Institute whistle-blowing protection legislation for accountants internationally
45
7 Recommendations based on observed good practice
To tackle the growing global infrastructure gap this report offers a variety of observations and international good practices Below is a summary of the recommendations arising from the reportrsquos analysis demonstrating the variety of functions and actions in which accountants can lead to help close the infrastructure gap
71 SELECTING PROJECTS Chapter 3 demonstrated that the lack of standard assessment tools and ineffective political decision-making hampered project selection To help address these challenges some countries establish expert-led bodies to forecast infrastructure need and make recommendations to government as to which projects to build Governments should also balance maintenance and new infrastructure spending by disaggregating expenditure on maintenance and new projects while prioritising the backlog of maintenance to ensure that assets remain in serviceable condition
To improve decision-making further accountants should collect better data on the service potential of existing infrastructure as well as the performance of past projects Together these data will allow accountants to offer new insights to inform the project selection process To reduce the bias towards large projects over maintenance governments should disaggregate expenditure on infrastructure to report both maintenance and new project spend
This report found that there is no standard project selection process for infrastructure projects used by governments around the world and that the underlying need ndash or service gap ndash is not well established or proven Therefore accountants must take the lead in applying selection standards such as the Project Management Body of Knowledge (Project Management Institute 2017) guide and the World Bankrsquos Investment Project Financing (World Bank 2016) policy to structure decision-making better and move beyond short-term thinking and biases
There is also a growing need to build climate change risk into long-term planning and the decision-making on project selection The Montreal Canada case example (see Chapter 3 Box 32) shows how accountants should produce cost-benefit analysis and business cases to embed adaptation and resilience into municipal infrastructure decisions
In summary governments should 1 Establish expert-led bodies to forecast
infrastructure requirements and recommend projects on the basis of need
2 Collect reliable data on the service potential of existing infrastructure and on the performance of past projects
3 Disaggregate expenditure on infrastructure to report both maintenance and new project spend
Accountants should 4 Take the lead in applying standard
selection tools to determine the need for and priority of a project
5 Advise on the distributional impact and regional growth outcomes of selecting particular projects good practice in this area can be found in Japan
6 Embed adaptation and resilience into the project-selection process
46
How accountants can bridge the global infrastructure gap | 7 Recommendations based on observed good practice
Governments should direct supreme audit institutions to monitor the interaction of off balance sheet liabilities and fiscal targets
72 FINANCING INFRASTRUCTURE PROJECTS
assets Officials in New South Wales Australia were able to unlock an additional AUS$33bn to invest in public infrastructure by adopting a total balance sheet perspective (see Chapter 4 Box 42) Accountants should disaggregate public assets in the balance sheet to include commercial social and financial assets This information will be especially effective for identifying underused commercial assets but it is also important to be aware of overall value for money for citizens when selling an asset (eg selling a public asset that was previously free to use but will now attract a user charge imposed by the private sector owner)
Chapter 4 on financing infrastructure highlights three key barriers closing the funding gap accounting for the higher cost of private capital and the need to professionalise the public sector finance function
This report identifies emerging and good practices from around the world that help reduce the funding gap Decision-makers should consider innovative solutions to closing the funding gap such as a value capture and civic crowdfunding For example the MTR Corporation in Hong Kong demonstrates that implementing a transport model that captures the positive externalities of new transit can make some public infrastructure self-funding (see Box 41)
To ensure value for money in infrastructure policy accountants must advise public sector decision-makers on how to make efficient capital allocations A real challenge in this respect is the interaction of fiscal targets and off balance sheet (OBS) liabilities Chapter 4 showed that some countries such as Portugal and the UK have accumulated significant OBS liabilities Therefore countriesrsquo supreme audit institutions should monitor the interaction of OBS liabilities and fiscal targets At the same time finance officials in government should advocate a more holistic approach to maintaining fiscal discipline beyond a few top-line indicators such as debt to GDP or public sector net borrowing
To improve the efficient allocation of public funds long-term infrastructure plans should be aligned with the annual budget process that sets out capital and operating budgets Effective capital budgeting can improve public finances such that departments or ministries do not need to rely on flexibility of unitary charges to meet infrastructure needs
Many national accounts operating on a cash basis treat investment in public infrastructure as a cost instead of recognising a new asset on the public sectorrsquos balance sheet Governments should adopt full accrual accounting and maintain a public sector balance sheet Public sector accountants should also conduct a balance sheet review to maximise the value of public sector
New Zealand has taken the lead in public financial management practices not just through the adoption of accrual accounting but because their public sector accountants produce an intertemporal balance sheet (see Chapter 4 Table 41) (Government of New Zealand 2018) Accountants producing this analysis provide decisions-makers with a better long-term view of their policy decisions and can help improve the sustainability of public finances
In summary governments should 7 Consider innovative solutions for
closing the funding gap such as a value capture civic crowdfunding and other revenue funding schemes
8 Direct supreme audit institutions to monitor the interaction of off balance sheet liabilities and fiscal targets in order to improve the efficient allocation of public sector funds
9 Align long-term infrastructure plans with the annual budget process in order to minimise the use of higher-cost private finance to achieve capital budget flexibility
10 Adopt full accrual accounting and maintain a public sector balance sheet to support decision-making on infrastructure policy
Accountants should 11 Advocate a more holistic approach to
maintaining fiscal discipline to avoid poor financial decisions driven by lsquofiscal illusionsrsquo
12 Conduct a balance sheet review to maximise the value of public sector assets
47
How accountants can bridge the global infrastructure gap | 7 Recommendations based on observed good practice
Professional bodies can also contribute to the improvements in public sector expertise by facilitating knowledge transfer between the public and private sector through thought-leadership events and roundtable discussions
13 Produce an intertemporal balance sheet to improve long-term decision-making and support the sustainability of public finances as is done for example in New Zealand
14 Produce disaggregated assets in the balance sheet to include commercial social and financial assets ndash in order to improve the return on public assets
73 DELIVERING INFRASTRUCTURE PROJECTS AND THE PUBLIC-PRIVATE RELATIONSHIP Chapter 5 highlights three key barriers to implementing infrastructure projects poor monitoring and oversight of projects by government confusion as to where each side provides value in a PPP and lack of commercial acumen in the public sector
To address these barriers and successfully deliver infrastructure projects governments need to look to accountants to implement the necessary monitoring and oversight of their PPP relationships There is also a clear need for effective mechanisms for reducing corruption which was cited as a key action in the member survey The implementation of effective whistle-blowing legislation and the professionalisation of the public sector finance function will allow public servants to challenge unethical behaviour that can derail infrastructure projects
Chapter 6 demonstrated that moral hazard can limit the probability that infrastructure PPPs will be completed on time on budget and to an acceptable level of quality The allocation of risk between the partners in a PPP can play a central role in reducing this moral hazard by putting the right incentives in place for the contractor Therefore professional teams delivering infrastructure should rely on an accountantrsquos expertise of risk management to minimise moral hazard by allocating risks fairly between the parties
Public sector negotiators should reflect on the assumptions identified in the member survey and consider that private finance professionals were less likely than their public sector counterparts to view the public sector as a stable partner or as a sector that provided access to longshyterm projects To mitigate this mismatch governments should consider introducing guarantee schemes for nationally
significant infrastructure projects in order to encourage additional private sector involvement in the provision of infrastructure
As a result of the varied commercial acumen in the public sector governments should consider establishing centres of excellence to coordinate public sector expertise in contract management so that any organisation within the public sector can draw on that specialist skill when negotiating a PPP contract Professional bodies can also contribute to the improvements in public sector expertise by facilitating knowledge transfer between the public and private sector through thought-leadership events and roundtable discussions
In summary governments should 15 Enact effective whistle-blowing
legislation and professionalise the public sector finance function to allow public servants to challenge unethical behaviour that can derail infrastructure projects
16 Establish centres of excellence that coordinate public sector expertise in contract management which allows any organisation within the public sector to draw on the specialist skill when negotiating a PPP contract
17 Consider introducing guarantee schemes for nationally significant infrastructure projects in order to encourage additional private sector involvement in infrastructure projects This will help address the assumptions identified in themember survey which showed that private finance professionals were less likely to view the public sector as a stable partner
Accountants should 18 Implement proper monitoring and
oversight for all projects
19 Advocate embedding themselves in the professional teams delivering infrastructure by highlighting their expertise of risk management
Professional bodies should 20 Act as facilitators of knowledge
transfer between the public and private sector through thought-leadership events and roundtables
48
49
Conclusion
The global infrastructure investment gap is set to grow to US$14 trillion by 2040 and this figure sets the benchmark for meeting the worldrsquos infrastructure needs
In reality however the challenge in fulfilling a countryrsquos infrastructure need is not achieving a notional investment figure but rather establishing a government vision for closing a recognised service gap by either maintaining existing infrastructure assets and or by building new projects
Currently governments lack adequate resources and the capability to make systematic infrastructure decisions because they are not able to harness the benefits of the investment and mitigate the significant risks associated with infrastructure project execution Bringing the accountant to the centre of the decision-making process for infrastructure projects can mitigate these pitfalls The particular skills and perspective of the finance professional can mean the difference between success and failure through improvements in project selection securing financing delivery and oversight of the projects
As the next generation of infrastructure projects are planned financed built and operated the accountant must be brought to the centre of the decision-making process The accountant must be employed across the entire life cycle of future infrastructure projects as a critical member of the professional team if the world is to address the global infrastructure gap
Appendix A Detailed methodology for establishing the infrastructure investment gap
This appendix examines the key features of the G20 Global Infrastructure Outlook methodology (GHI and Oxford Economics 2018) in order to summarise how the global regional and national estimates of the infrastructure gap used in Chapter 1 of this report were determined For a complete understanding the of the original work the Global Infrastructure Outlook report has a comprehensive treatment of the analytical process
A1 DEFINITION OF INFRASTRUCTURE The Global Infrastructure Outlook report defines infrastructure investment as lsquoGross Fixed Capital Formationrsquo (GFCF) by the public and private sectors on fixed immovable assets that support long- term economic growthrsquo (GHI and Oxford Economics 2018) GFCF is a wider definition of investment than just that for infrastructure and so the calculations included for the purposes of this report exclude land and any moveable assets such as IT equipment The definition does however include both the development of new assets and spending on the replacement or maintenance of existing assets
A2 CURRENT INVESTMENT TRENDS Current investment was calculated for a total of 50 countries using data from multinational data sources such as the OECD or Eurostat where possible If the required data was not available from these sources then national statistics were used to create a comparable estimate Failing that data was imputed using econometric techniques The Global Infrastructure Outlook report was completed during 2016 and includes the most up-to-date datasets collected providing values to 2015 so the forecast years begin at 2016 and continue to 2040 Before 2016 no infrastructure gap was estimated so the charts in Chapter 1 and Appendix B reflect current trends only to 2016
For each country and sector the stock of infrastructure per head was calculated and a set of explanatory factors were determined for each sector eg population density structure of the economy These explanatory variables were projected forwards on the basis of national economic and demographic forecasts to estimate infrastructure investment under current trends for each country
A3 INVESTMENT NEEDS The extent to which each country dedicates resources to infrastructure investment was adjusted for the quality of infrastructure using indicators from the World Economic Forum Global Competitiveness Report (Schwab 2018)
The lsquoquality-adjustedrsquo performance measures were then compared across countries using the performance of countries at the 75th percentile among those of similar income levels as the benchmark The investment-need scenario indicated the extent of infrastructure investment by sector and country which would be required to meet this benchmark level Income groups were based on three World Bank definitions low- and lower-middle income upper-middle income and high income For countries that were already positioned above the 75th percentile (ie the target) the objective in the years ahead is to sustain relatively high levels of investment and maintain their strong performance As a result the minimum value for the investment gap is 0 ndash where those countries in the upper quartile must maintain their performance and their peersrsquo target is to attempt to catch up
50
The following account offers a regional breakdown and description of the global infrastructure investment gap covering Africa the Americas Asia Europe and Oceania
B1 AFRICAIn 2018 an estimated US$1328bn was spent on infrastructure in Africa Meanwhile US$1777bn of investment is estimated to be required in the region putting the infrastructure investment gap at US$455bn Cumulatively between 2018 and 2040 the infrastructure investment gap is expected to stand at US$159 trillion with the amount of infrastructure investment needed expected to be 39 higher than under current trends
51
Appendix BRegional breakdown of the global investment gap and additional service gap analysis
350
300
250
200
150
100
50
0
Investment need Current trends
2007
2008
2009
2010
2011
2012
2013
2014
2015
2016
2017
2018
2019
2020
2021
2022
2023
2024
2025
2026
2027
2028
2029
2030
2031
2032
2033
2034
2035
2036
2037
2038
2039
2040
FIGURE B1 Investment need and current trends in Africa 2015 US$ billions
Source GHI and Oxford Economics 2018
TABLE B1 Projected infrastructure investment and gaps among African countries 2018ndash40 2015 prices
COUNTRY
Angola
Benin
INFRASTRUCTURE INVESTMENT USD BILLIONS
$2514
$199
INFRASTRUCTURE INVESTMENT GAP USD BILLIONS
$920
$134
DIFFERENCE BETWEEN INVESTMENT NEED AND INVESTMENT FORECAST
37
67
Cote dIvoire $614 $129 21
Egypt
Ethiopia
Ghana
$4186
$4215
$685
$2182
$1467
$421
52
35
61
Guinea $167 $140 84
Kenya
Morocco
$1742
$1967
$371
$348
21
18
Nigeria
Rwanda
$6168
$295
$2103
$96
34
33
Senegal
South Africa
$578
$2696
$181
$1442
31
53
Tanzania $1943 $1095 56
Tunisia $502 $206 41
Source GHI and Oxford Economics 2018
52
How accountants can bridge the global infrastructure gap | Appendix B
B2 AMERICASIn 2018 it was anticipated that an estimated US$4771bn would be spent oninfrastructure in the Americas In the sameyear investment need was forecast to be 38 higher at US$6570bn and over the full 2018 to 2040 period the infrastructure investment gap is expected to grow to US$6126 trillion This implies that infrastructure need will be 48 higher than actual investment over the period given the current trend in the Americas
12
1
08
06
04
02
0
Investment need Current trends
2007
2008
2009
2010
2011
2012
2013
2014
2015
2016
2017
2018
2019
2020
2021
2022
2023
2024
2025
2026
2027
2028
2029
2030
2031
2032
2033
2034
2035
2036
2037
2038
2039
2040
FIGURE B2 Investment need and current trends in the America 2015 US$ trillions 2018ndash40
Source GHI and Oxford Economics 2018
TABLE B2 Projected infrastructure investment and gaps among nations in the Americas 2018ndash40 2015 prices
COUNTRY
Argentina
Brazil
INFRASTRUCTURE INVESTMENT USD BILLIONS
$4220
$14207
INFRASTRUCTURE INVESTMENT GAP USD BILLIONS
$3392
$11266
DIFFERENCE BETWEEN INVESTMENT NEED AND INVESTMENT FORECAST
80
79
Canada $11243 $194 2
Chile $1978 $499 25
Colombia $2231 $949 43
Ecuador $743 $523 70
Mexico $4874 $5153 106
Paraguay
Peru
$546
$3072
$165
$675
30
22
US $79637 $36089 45
Uruguay $458 $91 20
Source GHI and Oxford Economics 2018
53
How accountants can bridge the global infrastructure gap | Appendix B
B3 ASIAAmong all nations the top four countries by investment need (China India Japan and the US) account for over half of global need three of these countries are found in Asia Despite this the infrastructure gap is lower in percentage terms across Asia than the other regions and across the 2018 to 2040 period Asian countries would need to increase spending by around 10 to meet their projected investment need The sheer size of the continent means that while relatively small as a proportion of current spending this level of underinvestment creates an infrastructure investment gap of US$43 trillion over the same period
30
25
20
15
10
05
0
Investment need Current trends
2007
2008
2009
2010
2011
2012
2013
2014
2015
2016
2017
2018
2019
2020
2021
2022
2023
2024
2025
2026
2027
2028
2029
2030
2031
2032
2033
2034
2035
2036
2037
2038
2039
2040
FIGURE B3 Investment need and current trends in Asia 2015 US$ trillions 2018ndash40
Source GHI and Oxford Economics 2018
TABLE B3 Projected infrastructure investment and gaps among Asian countries 2018ndash40 2015 prices
COUNTRY
Azerbaijan
Bangladesh
Cambodia
INFRASTRUCTURE INVESTMENT USD BILLIONS
$862
$3931
$560
INFRASTRUCTURE INVESTMENT GAP USD BILLIONS
$76
$1821
$266
DIFFERENCE BETWEEN INVESTMENT NEED AND INVESTMENT FORECAST
9
46
48
China $248858 $18307 7
India $37045 $4995 13
Indonesia $15445 $667 4
Kazakhstan $1955 $792 41
Japan
Jordan
$34810
$591
$868
$168
2
29
Malaysia
Myanmar
Pakistan
$3588
$1050
$3351
$725
$1064
$1179
20
101
35
Philippines
Saudi Arabia
$4031
$4654
$653
$1089
16
23
Singapore
South Korea
$878
$12767
$03
$386
0
3
Thailand $3677 $950 26
Turkey
Vietnam
$5328
$4741
$3841
$968
72
20
Source GHI and Oxford Economics 2018
08
07
06
05
04
03
02
01
0
Investment need Current trends
2007
2008
2009
2010
2011
2012
2013
2014
2015
2016
2017
2018
2019
2020
2021
2022
2023
2024
2025
2026
2027
2028
2029
2030
2031
2032
2033
2034
2035
2036
2037
2038
2039
2040
54
How accountants can bridge the global infrastructure gap | Appendix B
B4 EUROPETotal spending on infrastructure in Europe was forecast to be US$457bn in 2018 in contrast to a projected requirement of US$512bn This investment gap of 11 is projected to grow to US$189 trillion or 16 of the total infrastructure investment needed over the period 2018ndash40
FIGURE B4 Investment need and current trends in Europe 2015 US$ trillions 2018ndash40
Source GHI and Oxford Economics 2018
TABLE B4 Projected infrastructure investment and gaps among European countries 2018ndash40 2015 prices
COUNTRY
Croatia
INFRASTRUCTURE INVESTMENT USD BILLIONS
$591
INFRASTRUCTURE INVESTMENT GAP USD BILLIONS
$101
DIFFERENCE BETWEEN INVESTMENT NEED AND INVESTMENT FORECAST
17
France $16823 $96 1
Germany
Italy
Poland
$13544
$11449
$5143
$07
$3530
$865
0
31
17
Romania $2103 $104 5
Russia $9887 $6892 70
Spain
UK
$9977
$15496
$538
$1403
5
9
Source GHI and Oxford Economics 2018
55
How accountants can bridge the global infrastructure gap | Appendix B
B5 OCEANIADespite the large area covered by the Oceania continental region its relatively small population means the total infrastructure investment need is less thanfor the other regions A further US$18 trillion total spending is likely to be required between 2018 and 2040 although on current trends a shortfall of US$171bn is forecast to emerge over the same period This would represent an infrastructure gap of 10
120
100
80
60
40
20
0
Investment need Current trends
2007
2008
2009
2010
2011
2012
2013
2014
2015
2016
2017
2018
2019
2020
2021
2022
2023
2024
2025
2026
2027
2028
2029
2030
2031
2032
2033
2034
2035
2036
2037
2038
2039
2040
FIGURE B5 Investment need and current trends in Oceania 2015 US$ billions 2018ndash40
Source GHI and Oxford Economics 2018
TABLE B5 Projected infrastructure investment and gaps among countries in Oceania 2018ndash40 2015 prices
COUNTRY INFRASTRUCTURE INVESTMENT USD BILLIONS
INFRASTRUCTURE INVESTMENT GAP USD BILLIONS
DIFFERENCE BETWEEN INVESTMENT NEED AND INVESTMENT FORECAST
Australia $14462 $1499 10
New Zealand $1522 $166 11
Source GHI and Oxford Economics 2018
56
How accountants can bridge the global infrastructure gap | Appendix B
B6 ADDITIONAL INFRASTRUCTURE SERVICE GAP FIGURES BY WORLD REGIONThe following charts compare the views of finance professionals on the remaining four sub-types of infrastructure not included in the main report water and sanitation other transport (eg ports and airports) railways and core public infrastructure (eg hospitals and schools)
Source The Global Infrastructure Gap survey specialist respondents only n 1966
FIGURE B6 Infrastructure quality ndash water and sanitation
North America
100
80
60
40
20
0
n Dont know n Very good n Good n Neutral n Poor n Very poor
Middle East Asia Pacific Central and Eastern Europe
South Asia Western Europe Africa Caribbean Total
Source The Global Infrastructure Gap survey specialist respondents only n 1966
FIGURE B7 Infrastructure quality ndash other transport
North America
100
80
60
40
20
0
n Dont know n Very good n Good n Neutral n Poor n Very poor
Middle East Asia Pacific Central and Eastern Europe
South Asia Western Europe Africa Caribbean Total
57
How accountants can bridge the global infrastructure gap | Appendix B
FIGURE B8 Infrastructure quality ndash railways
FIGURE B9 Infrastructure quality ndash core public service infrastructure
Source The Global Infrastructure Gap survey specialist respondents only n 1966
North America
100
80
60
40
20
0
n Dont know n Very good n Good n Neutral n Poor n Very poor
Middle East Asia Pacific Central and Eastern Europe
South Asia Western Europe Africa Caribbean Total
Source The Global Infrastructure Gap survey specialist respondents only n 1966
North America
100
80
60
40
20
0
n Dont know n Very good n Good n Neutral n Poor n Very poor
Middle East Asia Pacific Central and Eastern Europe
South Asia Western Europe Africa Caribbean Total
Appendix C The Global Infrastructure Gap Survey and Roundtable Discussion Guide
MEMBER SURVEY
Q1 What is your current employment status Full-time or part-time an accounting or finance role Full-time or part-time work in a non-accounting role Not currently in employment Self-employed Retired
Response treated as lsquogeneralistrsquo
Q2 [If employed]In which sector do you work Please tick the one box that best fits your sector Big Four accounting firm Corporate sector - small medium sized Corporate sector ndash large Financial services - small medium sized Financial services ndash large Mid-tier accounting firm Not-for-profit Other international accounting firm Public sector Small or medium-sized practice (SMP) Other (please specify)
Q3 [If employed]Does your work involve any of the following
Infrastructure policy Procurement Capital budgeting Project management or Operations management
Yes (respondent categorised as a lsquospecialistrsquo) No (respondent categorised as a lsquogeneralistrsquo)
Q4 How would you describe the quality of each type of infrastructure in the country where you live Power and energy Water and sanitation Roads and highways Railways Other transport (eg air and sea)
Information and communication technology (eg internet access and mobile service)
Core public service infrastructure (eg hospitals schools emergency services)
Scale 1 ndash Very poor 2 ndash Poor
4 ndash Good 5 ndash Very good Donrsquot know
Q5 What are the biggest barriers in meeting the infrastructure needs in your country Lack of finance andor funding Lack of political leadership Skills and talent shortage Planning and regulatory barriers Corruption Lack of competition Other please specify None
Q6a [To generalists]Over the next 5 years do you feel the infrastructure in your country will Significantly deteriorate Deteriorate Remain the same Improve Significantly improve Donrsquot know
Q6b [To specialists]Over the next 5 years do you feel that each of these types of infrastructure in your country will Power and energy Water and sanitation Roads and highways Railways Other transport (eg air and sea)
Information and communication technology (eg internet access and mobile service)
Core public service infrastructure (eg hospitals schools emergency services)
Scale Significantly deteriorate Deteriorate Remain the same Improve Significantly improve Donrsquot know
Q7 Do you feel the government selects projects that provide the most value to the taxpayer Never Infrequently Sometimes Frequently Always Dont know
58
3
How accountants can bridge the global infrastructure gap | Appendix C
Q8 Which of the following do you feel the government in your country should prioritise to make the best decisions when selecting infrastructure projects Please select up to five which you feel are the most important and rank them by order of importance Please drag and drop your selections from the left box to the right box and order with most important at the top and least at the bottom
Adhering to global accounting standards
Removing political decision-making making the process technocratic (ie decisions by experts)
Putting in place mechanisms to reduce corruption
Moving government accounts from cash to accrual accounting
Bringing OOBs (Obligations Off Balance-Sheet) onto government balance sheets
Quantifying the total life-cycle costs of potential projects
Spending more resource to evaluate projects after completion
Applying standard assessment tools to evaluate projects during selection
Transferring project selection powers to more local levels of government (ie devolution)
Other please specify
Q8a [To CPA Canada respondents only]How important is it that infrastructure planning include the following sustainability considerations Efficient use of energy including where appropriate renewable sources of energy
Adapting to the impacts of a changing climate such as severe weather events
Minimizing environmental impacts on the surrounding community by for example locating near accessible public transit
Reducing or eliminating the production of waste hazardous by-products or other environmental externalities
Assessing the potential of and taking every reasonable step to reduce or eliminate the likelihood of an environmental accident (such as a pipeline spill for example)
Scale 1 - Not important at all 2- Not very important
4 - Quite important 5- Very important 6 - Donrsquot know
Q9a [To generalists]How should infrastructure be financed in your country Entirely public finance Mostly public finance Even mix of public and private finance Mostly private finance Entirely private finance Dont know no opinion
Q9b [To specialists]How should infrastructure be financed in your country (eg a sovereign wealth fund provides the money upfront to build a road) Power and energy Water and sanitation Roads and highways Railways Other transport (eg air and sea)
Information and communication technology (eg internet access and mobile service)
Core public service infrastructure (eg hospitals schools emergency services)
Scale Entirely public finance Mostly public finance Even mix of public and private finance Mostly private finance Entirely private finance Dont know no opinion
Q10 What are your views on the role of foreign direct investment in building and maintaining infrastructure in your country Very concerned Some concern Neutral Positive Very positive Dont know
Q11 What are the key challenges that the government faces in securing private finance Select all that apply Too few viable projects for private investment Regulatory barriers Perceived political instability in my country Underdeveloped financial markets in my country Insufficient skills in government to negotiate with the private sector Negative perception of private finance for public infrastructure Lack of attractiveness of infrastructure investment Dont know Other please specify
Q12a [Asked of those working in Public sector]Where do you feel the private sector particularly adds value in delivering infrastructure projects in your country Select all that apply Knowledge of best practice and expertise
Applying innovative practices and fresh thinking
Delivering projects on time
Keeping projects to budget
Access to private capital
Transferring the risks of delivering infrastructure projects from the public sector to the private sector
None of these
Donrsquot know
59
3
How accountants can bridge the global infrastructure gap | Appendix C
Q12b [Asked of those working in Private sector]Where do you feel the public sector particularly adds value in delivering infrastructure projects in your country Select all that apply Access to projects that provide stable low risk returns Knowledge of how the public sector works Long-term and stable partnership Knowledge of best practice and expertise Applying innovative practices and fresh thinking None of these Donrsquot know
Q13a [Asked of those working in Public sector]Where do you feel the private sector receives value from the public sector in delivering infrastructure projects in your country Select all that apply Access to projects that provide stable low risk returns Knowledge of how the public sector works Long-term and stable partnership Knowledge of best practice and expertise Applying innovative practices and fresh thinking None of these Donrsquot know
Q13b [Asked of those working in Private sector]Where do you feel the public sector receives value from the private sector in delivering infrastructure projects in your country Select all that apply Knowledge of best practice and expertise
Applying innovative practices and fresh thinking
Delivering projects on time
Keeping projects to budget
Access to private capital
Transferring the risks of delivering infrastructure projects from the publicsector to the private sector
None of these
Donrsquot know
Q14 Where are you primarily based [Dropdown list]
Q15 What best describes your gender identity Female Male Prefer not to say Prefer to self-describe
ROUNDTABLE DISCUSSION 1) Understanding the infrastructure gap
a) Whatrsquos the current quality of infrastructure in your country
i Why is it like this
b) How is your business or organization affected by the current quality of infrastructure in your country Please provide examples
2) How accountants can make a difference c) In your experience where do you see accountants making the
greatest difference in delivering infrastructure in your country Please give examples where possible
d) Do you feel that your country has particular good practices in meeting infrastructure need
3) Selecting projects e) How often do you t hink governments select the right projects in
your country
f) What should governments consider when making decisions about infrastructure
4) Financing projects g) Which types of infrastructure are appropriate for private finance
or operation [ie energy water roads railways other transport information and communication technology core public service infrastructure]
i Which ones are more suited to private finance
ii Private operation
h) What do you think about foreign direct investment (FDI) building new infrastructure in your country
5) Interface of public and private i) What skills do governments need to effectively negotiate
contracts with the private sector
i Are any of these skills absent
j) When t he public and private sectors partner to complete and operate infrastructure (for example through a Public-Private Partnership)
i What does the private sector add to the partnership
ii What does the public sector add to the partnership
6) Final k) Over the next 5 years do you think the infrastructure in your
country will improve stay the same or deteriorate
i Why is t hat the case What are the key challenges in meeting the infrastructure needs in your country over the next 5 years
60
References
ACCA (2016) Smarter Cities Simpler Cities Accounting for the City of the Future Spotlight on India lthttpswwwaccaglobalcomcontentdamACCA_GlobalTechnicalFuturepi-smarter-cities-simpler-citiespdf
gt
accessed 4 February 2019
ACCA (2017) Professional Accountants ndash the Future Ethics and Trust in a Digital Age lthttpswwwaccaglobalcomcontentdamACCA_Global TechnicalFuturepi-ethics-trust-digital-agepdfgt accessed 5 February 2019
Atkins G Davies N and Kidney Bishop T (2017) Public versus Private How to Pick the Best Infrastructure Finance Option lthttpswww instituteforgovernmentorguksitesdefaultfilespublicationsInstitute_for_ Government_Infrastructure_Finance_Option_Public_Private_ November_2017_Web_Finalpdfgt accessed 5 February 2019
British Broadcasting Corporation (2015) Spains Ciudad Real airport sold at auction for euro10000 [online article] lthttpswwwbbccouknewsworldshyeurope-33578949gt accessed 6 February
Catapult Future Cities (2017) Civic Crowdfunding A Guidebook for Local Authorities lthttpsfuturecitiescatapultorgukwp-content uploads201703Civic-guidebook-pdfgt accessed 5 February 2019
Central Intelligence Agency (2019) The World Factbook lthttpswwwciagovlibrarypublicationsthe-world-factbook
gt access 7 February 2019
Chartered Institute of Purchasing and Supply (2013) Written evidence submitted by CIPS to the Public Administration Select Committee lthttps publicationsparliamentukpacm201314cmselectcmpubadm123123vw12 htmgt accessed 5 February 2019
Chartered Professional Accountants of Canada (2016) Adaptation Case Study 6 City of Montreal lthttpswwwcpacanadacaenbusiness-and-accountingshyresourcesother-general-business-topicssustainabilitypublications montreal-adapting-to-climate-changegt accessed 5 February 2019
Detter D and Folster S (2017) The Public Wealth of Cities How to Unlock Hidden Assets to Boost Growth and Prosperity (Brookings Institution Press)
Eriksson PE and Lind H (2015) Moral Hazard and Construction Procurement A Conceptual Framework lthttpswwwdiva-portalorgsmashgetdiva2783674FULLTEXT01pdf
gt accessed 5 February 2019
European Commission (2017) Communication from the Commission The Fiscal Compact ndash Taking Stock lthttpseceuropaeuinfopublications fiscal-compact-taking-stock_engt accessed 5 February 2019
Eurostat (2018) lsquoLiabilities Related to PPPs Recorded Off-Balance Sheet of Governmentrsquo downloadable from lthttpsdataeuropaeueuodpendata datasetZxMF0OGutCyj7pgQJdtaiwgt accessed 5 February 2019
Fages R Beardsley B Bromstrup I Donnadieu H Maceacute B Pardasani N Schmitz L Sheridan BTaglioni G and Xu Q (2018) Global Asset Management 2018 The Digital Metamorphosis lthttpswwwbcgcom en-gbpublications2018global-asset-management-2018-digitalshymetamorphosisaspxgt accessed 5 February 2019
Fay M Andres LA Fox C Narloch U Straub S and Slawson M (2017) Rethinking Infrastructure in Latin America and the Caribbean 2017 lthttps openknowledgeworldbankorgbitstreamhandle1098626390114110shyREVISED-PUBLIC-RethinkingInfrastructureFullpdfgt accessed 5 February 2019
Flyvbjerg B (2018) Oxford Handbook of Megaproject Management (Oxford Oxford University Press)
GHI (Global infrastructure Hub) and Oxford Economics (2018) Global Infrastructure Outlook Downloadable from lthttpsoutlookgihuborggt accessed 4 February 2019
Government of New Zealand (2018) lsquoHe Puna Hao Patiki 2018 Investment Statementrsquo lthttpstreasurygovtnzpublicationsinvestment-statementhe-puna-hao-patiki-2018-investment-statement-html
gt accessed 5
February 2019
ICAS (Institute of Chartered Accountants of Scotland) (2012) A Professional Judgement for Financial Reporting lthttpswwwicascomtechnicalshyresourcesa-professional-judgement-framework-for-financial-reportinggt accessed 6 February 2019
IFAC and CIPFA (2018) International Public Sector Financial Accountability Index lthttpswwwifacorgsystemfilesuploadsIFACIFAC-CIPFA-PublicshySector-Index-2018-Statuspdfgt accessed 5 February 2019
IJ Global (2018) H1 Infrastructure and Project Finance League Table Report lthttpsijglobalcomuploadsH120201820League20Tables20Report pdfgt accessed 5 February 2019
IMF (International Monetary Fund) (2018) Fiscal Monitor Managing Public Wealth downloadable from lthttpswwwimforgenPublicationsFM Issues20181004fiscal-monitor-october-2018gt accessed 5 February
Institute for Government (2018) lsquoFunding Infrastructurersquo [webpage] lthttps wwwinstituteforgovernmentorgukexplainersfunding-infrastructuregt accessed 5 February 2019
International Transport Forum (2017) Strategic Infrastructure Planning International Best Practice lthttpsassetspublishingservicegovuk governmentuploadssystemuploadsattachment_datafile601897Strategic_Infrastructure_FINAL_for_web_v2pdf
gt accessed 4 February
KPMG (2013) Elevating Professional Judgment in Auditing and Accounting The KPMG Professional Judgment Framework lthttpwwwdrlilliecom a544kpmgjdgmtKPMG_ProfJudgment_Monographpdfgt accessed 6 February 2019
Leong L (2016) lsquoThe ldquoRail plus Propertyrdquo Model Hong Kongrsquos Successful Self-financing Formularsquo [website article] lthttpswwwmckinseycom industriescapital-projects-and-infrastructureour-insightsthe-rail-plusshyproperty-modelgt accessed 5 February 2019
Mann H (2018) lsquoThe High Cost of lsquoDe-Riskingrsquo Infrastructure Financersquo [website article] lthttpswwwproject-syndicateorgcommentaryworldshybank-ppp-de-risking-by-howard-mann-2018-12gt accessed 5 February 2019
Marcelo D Mandri-Perrott C House S and Schwartz JZ (2016) An Alternative Approach to Project Selection The Infrastructure Prioritization Framework lthttppubdocsworldbankorgen84463146187466270016-04shy23-Infrastructure-Prioritization-Framework-Final-Versionpdfgt accessed 4 February 2019
MGI (McKinsey Global Institute) (2013) Infrastructure productivity How to save $1 trillion a year lthttpswwwmckinseycomindustriescapital-projectsshyand-infrastructureour-insightsinfrastructure-productivitygt accessed 6 February 2019
MGI (2016) Bridging Global Infrastructure Gaps lthttpswwwmckinsey com~mediaMcKinseyIndustriesCapital20Projects20and20 InfrastructureOur20InsightsBridging20global20infrastructure20gaps Bridging-Global-Infrastructure-Gaps-Full-report-June-2016ashxgt accessed 4 February 2019
Morse A (2018) PFI and PF2 Report by the Comptroller and Auditor General lthttpswwwnaoorgukwp-contentuploads201801PFI-and-PF2pdf
gt accessed 5 February 2019
61
How accountants can bridge the global infrastructure gap | References
MTR Corporation (2017) Annual Report 2017 Ten-Year Statistics lthttps wwwmtrcomhkarchivecorporateeninvestor10yr_stat_enpdfgt accessed 5 February 2019
NHS Scotland (2018) NHS Scotland Assets and Facilities 2017 Annual Report lthttpswwwgovscotpublicationsannual-state-nhsscotland-assetsshyfacilities-report-2017gt accessed 5 February 2019
NIC (National Infrastructure Commission) (2018) National Infrastructure Assessment lthttpswwwnicorgukwp-contentuploadsCCS001_ CCS0618917350-001_NIC-NIA_Accessiblepdfgt accessed 4 February 2019
OrsquoDowling-Keane A (2017) lsquoSadiq Khan Joins Crowd of Thousands with pound400000 in Backing for Londonersrsquo Local Project Ideasrsquo [website article] lthttpsaboutspacehivecomsadiq-khan-joins-crowd-of-thousands-withshy400000-in-backing-for-londoners-local-project-ideasgt accessed 5 February
OECD (Organisation for Economic Cooperation and Development) (2019) Databank tax revenue lthttpsdataoecdorgtaxtax-revenuehtmgt government debt lthttpsdataoecdorgggageneral-government-debt htmgt accessed 7 February 2019
Plimmer G (2018) lsquoDeath Knell Sounded for PFI Contractsrsquo [online article] Financial Times lthttpswwwftcomcontent55eb374e-dba5-11e8-8f50shycbae5495d92bgt accessed 6 February
Project Management Institute (2017) Guide to Project Management Book of Knowledge lthttpswwwpmiorgpmbok-guide-standardsfoundational pmbokgt accessed 4 February 2019
Schwab K (2018) Global Competitiveness Report lthttpwww3weforum orgdocsGCR201805FullReportTheGlobalCompetitivenessReport2018 pdfgt accessed 5 February 2019
Spacehive (2019) lsquoMake Your Local Area Betterrsquo [website] lthttpswww spacehivecomgt accessed 5 February 2019
UK Government (2017) UK Guarantees Scheme Guidance lthttpswwwgov ukguidanceuk-guarantees-schemegt accessed 5 February 2019
World Bank (2018a) Private Participation in Infrastructure Annual Report 2017 lthttpppiworldbankorg~mediaGIAWBPPIDocuments Global-NotesPPI_2017_AnnualReportpdfgt
World Bank (2018b) Procuring Infrastructure Public-Private Partnerships Report downloadable from lthttpspppknowledgelaborg documents5453gt accessed 5 February 2019
World Bank (2019) World Bank Open Data tax revenue lthttpsdata worldbankorgindicatorGCTAXTOTLGDZSgt government debt lthttpsdataworldbankorgindicatorGCDODTOTLGDZSgt accessed 7 February 2019
62
18002683793 wwwcpacanadaca
PI-GLOBAL-INFRASTRUCTURE-GAP
DISCLAIMER This paper was prepared by the Association of Chartered Certified Accountants (ACCA) and Chartered Professional Accountants of Canada (CPA Canada) as non-authoritative guidance
ACCA CPA Canada and the authors do not accept any responsibility or liability that might occur directly or indirectly as a consequence of the use application or reliance of this material
ACCA The Adelphi 111 John Adam Street London WC2N 6AU United Kingdom +44 (0)20 7059 5000 wwwaccaglobalcom
CPA Canada 277 Wellington St West Toronto Ontario Canada M5V 3H2
How accountants can bridge the global infrastructure gap | Executive summary
The roundtable participants identified poor monitoring and oversight by government as key impediments in delivering infrastructure projects
Delivering infrastructure projects The roundtable participants identified poor monitoring and oversight by government as key impediments in delivering infrastructure projects Chapter 5 offers results from the survey demonstrating disagreement about where each party in a PPP agreement provides value Finally the roundtable participants argued that the public sector often lacked the commercial acumen required to manage an infrastructure PPP effectively
In response to these barriers this report offers the following recommendations based on observed good practice
Governments should 15 Enact effective whistle-blowing
legislation and professionalise the public sector finance function to allow public servants to challenge unethical behaviour that can derail infrastructure projects
16 Establish centres of excellence that coordinate public sector expertise in contract management which allows any organisation within the public sector to draw on the specialist skill when negotiating a PPP contract
17 Consider introducing guarantee schemes for nationally significant infrastructure projects in order to encourage additional private sector involvement in infrastructure projects This will help address the assumptions identified in the survey which showed that private finance professionals were less likely to view the public sector as a stable partner
Accountants should 18 Implement proper monitoring and
oversight for all projects
19 Advocate embedding themselves in the professional teams delivering infrastructure by highlighting their expertise of risk management
Professional bodies should 20 Act as facilitators of knowledge
transfer between the public and private sector through thought-leadership events and roundtables
9
10
The global infrastructure gap
1 See Chapter 1 for definitions of the lsquoinfrastructure investment gaprsquo and the lsquoinfrastructure service gaprsquo
Globally some top barriers to meeting infrastructure need were
52 lack of political leadership
49 lack of finance or funding
40 planning and regulatory barriers
Finance professionals reported the largest service gap in Africa the Middle East had the smallest service gap1
The global investment gap will grow to US$14 trillion by 2040
Selecting projects
93 of respondents said governments could improve the infrastructure projection selection process
lsquoRemoving political decision-making and making the process technocraticrsquo was the most cited for improving project selection
Delivering projects and the public-private relationship
62 of public sector respondents arguedthat they offered a lsquolong-term and stable partnershiprsquo for a PPP compared to only
45 of private sector respondents
Financing projectsThe most cited barriers for securing private finance for infrastructure were
lsquoInsufficient skills in governmentrsquo 45 and
lsquonegative perception of private financersquo 43
11
Introduction
Infrastructure is critical for economic and social development across the world Physical infrastructure systems ensure that basic human needs are met people need access to energy to light and heat their homes and safe water for drinking sanitation and cooking Transport infrastructure allows people to travel to work and transport goods to different markets
In these and many other ways infrastructure is vital to social and economic activity and development ndash and its provision is intrinsically tied to achieving the United Nationrsquos Sustainable Development Goals to address global challenges such as poverty inequality climate change and environmental degradation and to achieve a better and more sustainable future for all There is also a unique opportunity for governments to respond to the global infrastructure gap challenge The anaemic economic growth following the 2008 financial crisis and the sustained low-interest rate environment means that the cost of increased investment has rarely been lower for governments and the prize is sustainable economic growth a sustained boost to productivity and improved living standards
But execution matters and there are many examples of infrastructure projects that have gone badly wrong Design failures can cause the death of workers as in the case of the Chirajara bridge collapse in Colombia in 2018 poor demand forecasting and design can result in significant infrastructure investments being underused such as the Ciudad Real Airport in Spain which remains abandoned after a construction cost in excess of 1bn euros (BBC 2015)
In addition the collapse of the Morandi Bridge in Genoa Italy demonstrated that to avoid disaster governments must allocate sufficient resources to the maintenance of existing infrastructure fighting the bias towards focusing resources on new-build projects
Finally cases of natural disaster ndash such as the flooding in Bangkok Thailand in 2011 ndash are becoming increasingly common and future infrastructure projects must be adaptable and resilient to enable countries to meet the threats of climate change
Therefore the successful provision of public infrastructure requires governments to have the right professional team in place to be able to harness the benefits of additional investment while working to mitigate the significant risks associated with infrastructure projects The accountant must be brought to the centre of the decision-making process on the selection financing building and operation of infrastructure where the finance professionalrsquos particular skills and perspective can mean the difference between success and failure
Research methodology
How accountants can bridge the global infrastructure gap Improving outcomes across the entire project life cycle report is the result of a joint research project conducted by ACCA and CPA Canada The research objective of this study was to quantify and explain the nature of the global infrastructure gap and explore how professional accountants can contribute to bridging the gap through improvements in the selection financing and delivery of projects
The report encompasses the collection of economic research country-specific narratives and best practices in building and maintaining infrastructure ndash from project selection to completion and evaluation The results and observations that were arrived at are supported by evidence collected through the following mechanisms
bull quantifying the cumulative global infrastructure investment gap to 2040 through desktop research
bull a global online survey of a random sample of ACCA members and CPA Canada members
bull a desktop literature review of specialist publications to determine leading practices
bull in-person roundtable discussions held with experts from four continents
How these four areas were developed is detailed below
ECONOMIC ANALYSIS A quantitative approach was followed for the review of the G20 Global Infrastructure Hubrsquos Global Infrastructure Outlook report (GHI and Oxford Economics 2018) This report uses economic forecasting to quantify the cumulative global infrastructure gap up to 2040 Chapter 1 lsquoQuantifying the Global Infrastructure Gaprsquo provides some detail on the quantification of the investment gap and articulates the challenge for this report More information on the methodology of the economic analysis can be found in Appendix A
GLOBAL SURVEY AND DEMOGRAPHICS ACCA and CPA Canada jointly undertook a survey of a random sample of each bodyrsquos membership This survey used the perspectives of finance professionals to illuminate the nature of the global infrastructure gap highlight the barriers to closing the gap and clarify the diverging expectations of public- and private-sector actors in the use of publicndash
private partnerships (PPPs) in infrastructure projects A copy of the survey is available in Appendix C
The survey design and administration were consistent across both bodies except for the addition of one question on infrastructure planning and sustainability considerations in the CPA Canada survey Therefore unless otherwise specified all survey results cited in the report present the combined output from the CPA Canada and ACCA waves of the survey The ACCA survey was in the field for two weeks in August 2018 and the CPA Canada survey for two weeks in October 2018
Survey demographics The combined total of survey respondents was 3611 across 1182
countries Geographic splits in the survey data typically present output by world region Every world region had at least 150 responses except for South America which is excluded from any figure showing results by geography Finally the
2 Six respondents gave lsquoOtherrsquo for their country of residence thus it is not possible to identify whether they lived in the 118 countries or elsewhere
12
Overall more than one-in-three respondents (35) worked in the corporate sector while about 20 worked in the public or not-for-profit sectors
joint survey (lsquothe member surveyrsquo) split respondents into two primary categories lsquogeneralistsrsquo and lsquospecialistsrsquo where specialist respondents stated that their work included at least one of the following areas infrastructure policy procurement capital budgeting project or operations management Of the total sample 1966 respondents (54) were categorised as specialists The survey included a number of detailed technical questions which were asked only of specialists Figures throughout the report clearly indicate which subset of respondents (generalists or specialists) answered a particular question
The member survey includes the views of accountants working across all sectors including respondents from accountancy firms the corporate sector and the public sector Overall more than one-in-three respondents (35) worked in the corporate sector while about 20 worked in the public or not-for-profit sectors
LITERATURE REVIEWA detailed review of specialised literature on infrastructure projects globally was conducted This review demonstrated the variety of methodologies used globally in quantifying the infrastructure gap as well as providing a summary of leading practices in infrastructure planning project selection and public financing that help support the effective delivery of innovative and sustainable infrastructure policy
The References section includes the reviewed literature
IN-PERSON ROUNDTABLE DISCUSSIONSFinally roundtable discussions were conducted with ACCA members and CPA Canada members in the UK Canada Sri Lanka Nigeria Trinidad amp Tobago Jamaica and Malaysia and focused on country-specific infrastructure challenges and solutions to show the international variation in infrastructure need as well as highlighting what skills and perspectives accountants employ to help address the global infrastructure gap
The roundtable discussions offered stakeholders an opportunity to share their insights and experiences on the current challenges to closing the global infrastructure gap and their perspectives and experiences in the provision of infrastructure In addition the roundtables offered participants an opportunity to reflect on best practices with their peers
Together the literature review and roundtable discussions have provided evidence of the essential role accountants can play in helping to shrink the global infrastructure gap A copy of the roundtable questions is available in Appendix C
ACCA and CPA Canada would like to thank the Centre for Business and Economics Research (Cebr) an economic consultancy based in the UK for completing the economic analysis quantifying the global infrastructure investment gap
13
How accountants can bridge the global infrastructure gap | Research methodology
FIGURE 2 Sector breakdown of The Global Infrastructure Gap survey
20
18
16
14
12
10
8
6
4
2
0Big Four
accounting firm
Corporate sector ndash small medium sized
Corporate sector ndash
large
Financial services ndash smallmedium sized
Financial services ndash
large
Mid-tier accounting
firm
Not-for-profit Other international
accounting firm
Public sector Small medium sized practice (SMP)
Other
Source The Global Infrastructure Gap survey all respondents n 3611
14
1 Defining the challenge Quantifying the global infrastructure gap
Defining the global infrastructure gap qualitatively is relatively simple the term is generally understood to denote the difference between required infrastructure and existing infrastructure Defining the current global infrastructure gap quantitatively however is more complex (MGI 2016) There are a variety of methods used internationally to measure the infrastructure gap
Reports by the McKinsey Global Institute (MGI 2013 and 2016) on the global infrastructure gap estimate that the world will need to invest US$33 trillion annually in infrastructure to support the needs resulting from projected economic growth The MGI methodology is highly sensitive to variations in economic growth since the forecasted investment gap is based on maintaining the ratio of infrastructure stock to a countryrsquos gross domestic product (GDP) But assessing infrastructure need as a constant share of a countryrsquos GDP is a rather crude measure that could result in erroneous conclusions For example assume a country spends the same amount on infrastructure but boosts GDP through greater efficiency in the allocation of those investment resources This would show as an increase in the infrastructure investment gap under the MGI approach (ie infrastructure spending would fall as a percentage of GDP) when in fact the efficiency gains would actually reduce the gap
In working to improve infrastructure provision the ultimate focus for any government should be minimising a recognised service gap not reducing a notional investment gap ndash addressing a countryrsquos particular economic social and environmental objectives (Fay et al 2017) The roundtable discussion in Canada a country with a negligible investment gap highlighted the misalignment between infrastructure investment decisions and the actual service needs of the country something that had been particularly challenging in First Nations communities In short this global challenge cannot be solved only by spending more money but also by spending better ndash ensuring that all spending is targeted on real needs At the same time it is not possible to categorise effectively on a global scale all the national objectives underpinning the goal of closing service gaps
Therefore this report offers two approaches to the global infrastructure gap the infrastructure investment gap and
the infrastructure service gap The first relies on a dataset produced by the G20rsquos Global Infrastructure Hub and sets an aspirational metric which is benchmarked against a countyrsquos peers (GHI and Oxford Economics 2018) This quantified infrastructure investment gap shows what investment would be required for a particular country to move to the top 25th percentile of the peers in its income group This works as an effective benchmark where a countryrsquos gap can be closed over time The second approach relies on the views of the specialist respondents to the member survey The quality of infrastructure is assessed across seven different subtypes demonstrating where service gaps exist for different world regions The first approach provides a quantified output and aspirational target for countries seeking to meet infrastructure needs and is described below The results of the second approach setting out the service gap can be found in section 14 below lsquoFinance professionalsrsquo perspectives on the global infrastructure servicersquo gap
How accountants can bridge the global infrastructure gap | 1 Defining the challenge Quantifying the global infrastructure gap
Globally the cumulative level of investment required to bring all countries in line with the best performing nations in their income group is estimated to be almost US$88 trillion between 2018 and 20404
11 THE INFRASTRUCTURE INVESTMENT GAP (APPROACH 1) AN ANALYSIS OF THE GLOBAL INVESTMENT OUTLOOK The Global Infrastructure Outlook report (GHI and Oxford Economics 2018) defines infrastructure investment as lsquoGross Fixed Capital Formation (GFCF) by the public and private sectors on fixed immovable assets that support long-term economic growthrsquo This report takes a comprehensive view of countriesrsquo infrastructure needs ndash including the social and economic infrastructure that would be captured under GFCF This comprehensive view is echoed in the survey analysis which covers seven sub-categories of infrastructure power and energy water and sanitation road and highways other transport (eg air and sea) ICT railways and core public service infrastructure (eg hospitals and schools) The research by the G20rsquos Infrastructure Hub estimates the amount of infrastructure investment needed for a diverse set of countries in each year from 2016 until 20403
The Global Infrastructure Outlook report provides historic data from 2007 to 2015 and then projects these forward to 2040 with increased spending only occurring in response to changes in economic and demographic fundamentals The difference between these estimates (ie the amount invested compared with the
amount needed) allows us to calculate the lsquoinfrastructure investment gaprsquo for each country To improve understanding of this global challenge the account below illustrates the size of this infrastructure gap at the global level Further detail on the nature of the infrastructure investment being measured and the methodology used to calculate the gap are explained in Appendix A Regional and national-level analysis of the investment gap can be found in Appendix B
12 QUANTIFYING THE GLOBAL INFRASTRUCTURE INVESTMENT GAP Globally the cumulative level of investment required to bring all countries in line with the best performing nations in their income group is estimated to be almost US$88 trillion between 2018 and 20404 Current trends indicate however that actual investment over the period is likely to undershoot this by US$14 trillion In 2018 alone the global infrastructure gap is US$409bn and will average US$613bn per year over the entire period In order to close this gap total forecast spending would have to increase by 19 over current investment levels In other words for every five US dollars of infrastructure spending forecast across the world by 2040 governments and investors would need to find a further 95 cents in order to bring the global stock of infrastructure up to standard
FIGURE 11 Comparison of different approaches to assessing infrastructure needs
Approach 2
Infrastructure Service Gap
Approach 1
Infrastructure Investment Gap
Notional target (aspirational) quantifiable
Source Global Infrastructure
Outlook
Subjective view of need
Source The Global Infrastructure
Gap survey
3 For further detail please see the technical appendix of the Global Infrastructure Outlook (GHI and Oxford Economics 2018)
4 Figures from the G20 Global Infrastructure Outlook report (GHI and Oxford Economics 2018) are reported in 2015 US$ prices and exchange rates unless otherwise specified
15
16
Quantifying an infrastructure investment gap across world regions provides an aspirational target for governments looking to improve the provision of infrastructure in their country
Between regions and countries there is a wide variation in performance in infrastructure provision and the capability of governments and private investors to meet future needs The capacity of governments to respond to this challenge is discussed further in the next chapter of this report
13 ANALYSIS OF THE GLOBAL INFRASTRUCTURE INVESTMENT GAPQuantifying an infrastructure investment gap across world regions provides an aspirational target for governments looking to improve the provision of infrastructure in their country It highlights global top performers such as Singapore Japan and Canada ndash which can be looked to for good practices5 The investment gap view also reveals global laggards such as Mexico Myanmar and Brazil Countries facing substantial and growing gaps may benefit from looking to their peers for good practice and novel methods of meeting infrastructure needs Subsequent chapters explore how the skills and perspectives of accountants can help close the investment gap Before turning to the role of accountants this report sets out a second method for understanding infrastructure need the infrastructure service gap
How accountants can bridge the global infrastructure gap | 1 Defining the challenge Quantifying the global infrastructure gap
14 FINANCE PROFESSIONALSrsquo PERSPECTIVES ON THE GLOBAL INFRASTRUCTURE SERVICE GAP (APPROACH 2)The Global Infrastructure Outlook report forecasts that the global infrastructure investment gap will reach US$14 trillion by 2040 (GHI and Oxford Economics 2018) This economic analysis sets an aspirational global benchmark for meeting the worldrsquos infrastructure needs At the same time the ultimate objective in fulfilling a countryrsquos infrastructure need is not a notional investment figure rather it is closing a recognised service gap Doing this requires that governments develop a vision of what a country seeks to achieve through the development and maintenance of its infrastructure ACCArsquos previous work on Smart Cities argues that creating a vision for future municipal infrastructure requires a lsquocitizen-led bottom-up approachrsquo based on actual service needs (ACCA 2016) Zia Paton a partner at PricewaterhouseCoopers (PwC) and participant in the roundtable discussion in Trinidad and Tobago cited the countryrsquos lsquoVision 2030rsquo as an excellent framework for setting out the governmentrsquos infrastructure priorities She pointed out that lsquothe plans set out in the Vision 2030 document appear to be
FIGURE 12 Global infrastructure investment need and current trends 2015 US$ trillions
50
45
40
35
30
25
20
15
10
05
0
Investment need Current trends
2007
2008
2009
2010
2011
2012
2013
2014
2015
2016
2017
2018
2019
2020
2021
2022
2023
2024
2025
2026
2027
2028
2029
2030
2031
2032
2033
2034
2035
2036
2037
2038
2039
2040
Source GHI and Oxford Economics 2018
5 See Appendix B for regional- and country-level statistics
17
To supplement the economic analysis that produces the investment gap the joint member survey explored the global infrastructure service gap
exactly what we needrsquo but she sees the real challenge as lsquoconverting that plan into action and aligning it with the various frameworks people and Ministries we have in place execution or implementation is where we tend to have challengesrsquo
The following chapters demonstrate the essential role for the accountancy profession in transforming agreed national visions into a reality through improving project selection (Chapter 3) financing decisions (Chapter 4) and project delivery (Chapter 5) To supplement the economic analysis that produces the investment gap the joint member survey explored the global infrastructure service gap This granular
approach captures the perspective of finance professionals from around the world setting out which particular types of infrastructure are viewed as requiring improvement to meet service needs
Infrastructure service gap by world regionRespondents to the survey were asked to rank the current quality of seven types of infrastructure in their country ndash covering both social and economic infrastructure Breaking down these results by world region demonstrates considerable variation in the current quality of each type of infrastructure Figures 13 14 and 15 show the results for three types of infrastructure power and energy roads and highways and ICT The world regional
How accountants can bridge the global infrastructure gap | 1 Defining the challenge Quantifying the global infrastructure gap
FIGURE 13 Infrastructure quality ndash power and energy
North America
100
80
60
40
20
0
n Dont know n Very good n Good n Neutral n Poor n Very poor
Middle East Asia Pacific Central and Eastern Europe
South Asia Western Europe Africa Caribbean Total
Source The Global Infrastructure Gap survey specialist respondents only n 1966
FIGURE 14 Infrastructure quality ndash roads and highways
North America
100
80
60
40
20
0
n Dont know n Very good n Good n Neutral n Poor n Very poor
Middle East Asia Pacific Central and Eastern Europe
South Asia Western Europe Africa Caribbean Total
Source The Global Infrastructure Gap survey specialist respondents only n 1966
ICT is a unique form of infrastructure that includes significant non-physical components and its provision must anticipate the future needs of the digital economy
breakdowns for water and sanitation railroad and other transport infrastructure (eg sea and air) and core public service infrastructure can be found in Appendix B Figures B6 B7 B8 and B9 By analysing the specialist responses on each type of infrastructure this report offers a view on the global and regional service gaps that exist in the provision of infrastructure
The survey data shows that South Asia lags other world regions in the quality of its power and energy infrastructure with only one in five (20) of finance professionals in that region stating that power and energy provision in their country was good or very good This compares with 65 of global respondents who found the provision of power and energy to be good or better Africa lagged in this area with about one in three (35) of Africarsquos finance professional respondents stating that power and energy provision was very good or good Unsurprisingly 90 of the Middle Eastern respondents saw their power and energy infrastructure as good quality or above ndash with 71 stating that power and energy provision is lsquovery goodrsquo
Central and Eastern European and African respondents were critical of the quality of their road infrastructure ndash with 37 and 46 respectively stating that their roads and highway infrastructure were poor or very poor In comparison a majority of survey respondents in the Middle East North America and Western Europe reported that the provision of
road and highway infrastructure in their countries was of good or very good quality Globally nearly half the finance professionals (49) reported that that the quality of road and highway infrastructure in their countries was good or very good
Globally ICT was seen as the type of infrastructure with the highest quality Clearly ICT is a unique form of infrastructure that includes significant non-physical components and its provision must anticipate the future needs of the digital economy The quality of ICT infrastructure extends beyond initiatives such as the roll-out of ultrafast broadband it includes public sector projects developing robust financial management and information systems to improve public services
Besides significant non-physical components ICT represents a comparatively new priority for many governments The survey shows the African region lagging its peers with only 51 of specialist finance professionals in the region ranking ICT as good or very good compared with the global average of 69 ICT was one of the few infrastructure types to receive a high score in central and Eastern Europe This is understandable because for many countries in this region other types of physical infrastructure such as road and rail were built under the Soviet Union Significant investment in ICT infrastructure around the world occurred
18
How accountants can bridge the global infrastructure gap | 1 Defining the challenge Quantifying the global infrastructure gap
FIGURE 15 Infrastructure quality ndash information and communication technology
Source The Global Infrastructure Gap survey specialist respondents only n 1966
North America
100
80
60
40
20
0
n Dont know n Very good n Good n Neutral n Poor n Very poor
Middle East Asia Pacific Central and Eastern Europe
South Asia Western Europe Africa Caribbean Total
19
Comparing specialistsrsquo perceptions of infrastructure quality by country shows particular service gaps emerging across the types of infrastructure
after the fall of the Soviet Union and many new nation-states in Eastern Europe were able to pursue their own infrastructure investment priorities Certain countries such as Estonia are now seen as world leaders in ICT and the provision of a digital public sector
A comparison of regional infrastructure service gaps arising from the survey dataComparing specialistsrsquo perceptions of infrastructure quality by country shows particular service gaps emerging across the types of infrastructure For example finance professionals in Africa and South Asia reported consistently poor levels of infrastructure across all the subtypes with the notable exception of ICT These results suggest that there are considerable service gaps that governments in this world region must address In comparison North American respondents had much higher overall scores but showed a particular dip in their road and highway infrastructure where only 64 of respondents reported that this infrastructure was of good quality In the Caribbean region specialist respondents isolated road and highway infrastructure and core public service infrastructure as key areas requiring intervention to reduce the service gap Specialists in infrastructure policy in central and Eastern Europe cited core public service infrastructure and railway infrastructure as areas requiring further investment
15 BARRIERS TO MEETING INFRASTRUCTURE NEEDSRespondents to the member survey were also asked what they saw as the biggest barriers to meeting the infrastructure needs in their country The results of this question showed significant variation by world region For example corruption was seen as a serious challenge in South Asia Africa Central and Eastern Europe and the Caribbean ndash but was cited by 10 of respondents or fewer in North America and Western Europe In comparison a lack of political leadership ranked consistently high across world regions This is a key barrier that is explored further in Chapter 3 Selecting Projects The lack of finance or funding also ranked as a significant barrier in most regions with an overall global average of 49 of respondents citing it as a barrier The underlying causes for the lack of finance as well as good practices in overcoming this barrier are discussed in Chapter 4 on the central role of accountants in improving infrastructure project finance Finally planning and regulatory issues consistently arose as a barrier to meeting infrastructure need with around 40 of respondents across the globe citing this as a key barrier Chapter 5 of this report which explores how accountants can support the efficient execution of infrastructure projects sets out how the interface of public and private partners can often be confused and suboptimal reducing the effective delivery of infrastructure
How accountants can bridge the global infrastructure gap | 1 Defining the challenge Quantifying the global infrastructure gap
FIGURE 16 Biggest barriers to meeting infrastructure needs
North America
100
80
60
40
20
0
n Lack of finance andor fundingn Lack of political leadershipn Skills and talent shortagen Planning and regulatory barriersn Corruptionn Lack of competitionn None
Middle East Asia Pacific Central and South Asia Western Europe Africa Caribbean Total
Source The Global Infrastructure Gap survey all respondents n 3611
Eastern Europe
2 Capacity for infrastructure investment
For countries at different stages of development the implications of infrastructure spending can also be markedly different The annual rate of growth in output typically much higher during the early phase of industrialisation tends to slow as a countryrsquos economy matures Smaller economies may therefore need to commit a relatively large share of their output to infrastructure investment in order to facilitate rapid growth
Looking at infrastructure investment as a percentage of GDP can therefore be revealing as to governmentsrsquo willingness or ability to make the necessary financial investment as well as the nature of the environment for private investment
In 2015 the Asian economies funded the largest financial infrastructure investment around US$13 trillion This is unsurprising given that Asia is the most heavily populated region It is also a function of the commitment by certain countries to improving the regionrsquos infrastructure and in 2015 the level of investment was the largest in relative terms standing at 51 of GDP
Africa was the region with the second-highest level of investment as a share of GDP in 2015 at 43 but the continent trails its peers in absolute investment (US$100bn) Europe and the Americas both of which are dominated by their larger more developed economies dedicated far lower levels of funding to infrastructure investment relative to their GDP in 2015 at 20 and 17 respectively
20
21 GOVERNMENTSrsquo CAPACITY FOR INCREASING INFRASTRUCTURE SPENDINGGovernments can directly fund an increase in expenditure on infrastructure through increases in either taxation or borrowing The latter places a burden on future generations in the form of the higher taxation needed to fund the
repayment of the debt The major constraints on a governmentrsquos capacity for funding infrastructure are therefore a fairly complex mix of institutional economic and social factors The size of the tax base how easily taxes can be evaded and political or cultural expectations about what constitutes a fair level of taxation all present practical
FIGURE 21 Regional infrastructure investment in US$ trillions as a of GDP 2015
7
6
5
4
3
2
1
0Asia
14
12
10
08
06
04
02
0Africa Oceania Europe Americas
o
f GD
P
2015 USD
$ trillions
n of GDP n USD $ trillions
Source GHI and Oxford Economics 2018
21
How accountants can bridge the global infrastructure gap | 2 Capacity for infrastructure investment
Table 21 presents summary statistics for the level of government debt and taxation across high-income upper-middle-income and low- and lower-middle-income countries
barriers to raising revenues Likewise high taxes can have strong disincentive effects discouraging certain activities and limiting the extent to which any change in the tax rate translates into higher revenues Borrowing on the other hand is constrained by the credibility of the government in pledging to repay any debts and the depth and sophistication of domestic capital markets
Table 21 presents summary statistics for the level of government debt and taxation across high-income upper-middle-income and low- and lower-middle-income countries Using this data gives the distribution of tax and borrowing levels relative to GDP allowing us to benchmark countriesrsquo capacity for further investment The figures cover the 1995 to 2016 period in order to show variation across a range of different economic and political cycles
Table 21 shows that among the high-income countries both the UK and Canada have relatively high levels of indebtedness as measured by the OECD gross general government debt indicator (OECD 2019) Since the global financial crisis both countries have seen their debt levels pull away from the OECD average to stand at 1117 and 1147 of GDP respectively This puts both countries firmly in the upper quartile of indebted countries even among the OECD countries where levels of debt to GDP
are generally high In both cases tax revenues are marginally below the OECD average however suggesting there is some limited fiscal room for raising revenue Political pressure in countries such as the UK may play a part in decisions about whether to raise taxes to generate additional revenue and if so whether to invest in capital expenditure over improving service provision through increased operating budgets
Chinarsquos debt as a share of GDP is estimated to fall below the average for the low- and middle-income countries at 443 Tax revenues are also somewhat higher than in most low and middle-income countries As growth continues and the economy matures Chinese governments may be able to widen the tax base in line with developed economy standards bringing in significantly larger revenues Still the government remains well placed to invest in infrastructure Malaysia which has a larger infrastructure gap to overcome is somewhat more indebted (545) sitting above the median debt level for its peer group although not particularly dangerously so Conversely tax revenue as a share of GDP (143) is slightly lower than the median level for low- and middle-income countries of 147 This suggests that without a move into higher growth and a broader tax base the funding required to close the infrastructure gap is unlikely to materialise in Malaysia
TABLE 21 Stock of debt and tax revenues as a share of GDP selected countries
INCOME GROUP (WORLD BANK DEFINITION)
COUNTRY INFRASTRUCTURE INVESTMENT AS A SHARE OF GDP 2015
GENERAL GOVERNMENT DEBT AS A PROPORTION OF GDP
TAX REVENUE AS A SHARE OF GDP
High-income UK 16 1117 325
Canada 23 1147 320
Upper-middle income China 70 443 217
Malaysia 36 545 143
Low- and lower-middle income Pakistan 17 633 164
Nigeria 32 196 35
India 40 689 110
Source World Bank OECD IMF CIA World Factbook
Some countries such as China find themselves in the privileged position of having significant fiscal room to support further investment while also projecting a small infrastructure gap
Pakistan has a relatively high level of government debt (633) which is approaching the upper quartile of World Bank estimates This presents real risks to fiscal sustainability where pressure from the countryrsquos overseas debt obligations has raised the prospect of a debt crisis Here the high level of indebtedness may in part be due to rapid growth in infrastructure spending over recent years
Among the case study countries Nigeriastands out as having both the largest forecast infrastructure gap at 09 of GDP in 2040 and the weakest tax revenue (35 of GDP) The inability of the government to raise revenue effectively is holding back its ability to invest in infrastructure which in turn is holding back growth The availability of significant oil reserves can provide an alternative source of revenue to general
taxation especially when oil prices are high But there are reasons (environmental and technological) for considering that peak oil prices may have been (or will soon be) reached Therefore the ability of Nigeria to finance its investment from other sources of income will be essential to closing the countryrsquos infrastructure gap
This analysis demonstrates that there is significant country-level variation in the ability to respond to the global infrastructure gap (Table 22) Some countries such as China find themselves in the privileged position of having significant fiscal room to support further investment while also projecting a small infrastructure gap Others such as Pakistan and Nigeria will need to work within the limited fiscal room available for meeting their growing infrastructure needs
22
How accountants can bridge the global infrastructure gap | 2 Capacity for infrastructure investment
TABLE 22 A typology of infrastructure gap responsiveness
LIMITED FISCAL ROOM GREATER FISCAL ROOM
Low infrastructure gap lsquoSmall gap Fiscally restrictedrsquo(eg Canada)
lsquoSmall gap Fiscally flexiblersquo(eg China)
High infrastructure gap lsquoLarge gap Fiscally restrictedrsquo(eg Pakistan Nigeria)
lsquoLarge gap Fiscally flexiblersquo (eg Malaysia)
23
3 Selecting projects
Around the world the multitude of industrial cranes signals the increase in infrastructure projects and the resulting demand on investment resources Yet what is not apparent is the variety of competing demands for infrastructure investment such as the ageing of existing infrastructure the need to adapt the built environment to respond to climate change and the desire to initiate new often lsquomegarsquo projects6
The planning and selection process of the appropriate infrastructure project is particularly difficult given long asset lives and significant sunk costs that increase risk and uncertainty
Given these common barriers finance professionals from around the world offered a mixed review of their countriesrsquo current selection process Only 16 of respondents to the joint member survey claimed that their government always or frequently selects infrastructure projects that provide the most value to taxpayers whereas a majority (52) argued that their government only sometimes selects infrastructure projects of value to taxpayers Almost one-in-three respondents (29) indicated that they believed that governments never or infrequently select infrastructure projects that provide value to taxpayers (Figure 31)
There is clearly room for improvement in how infrastructure projects are selected To suggest how to improve the planning
and selection process respondents to the joint member survey were asked to rate in order of priority what changes could be made to improve decision-making when planning and selecting
infrastructure projects Figure 32 shows how respondents ranked the various options from first choice to fifth with smaller bars reflecting fewer respondents ranking that option in their top five
FIGURE 31 Do you believe the government selects projects that provide the most value to the taxpayer
0 10 20 30 40 50 60
Always
Frequently
Sometimes
Infrequently
Never
Dont know
Source The Global Infrastructure Gap survey all respondents n 3611
6 lsquoMegaprojects are large-scale complex ventures that typically cost US$1bn or more take many years to develop and build involve multiple public and private stakeholders are transformationaland impact millions of peoplersquo (Flyvbjerg 2018)
24
A majority of respondents (55) ranked either lsquoremoving political decision-makingrsquo or lsquoputting in place mechanisms to reduce corruptionrsquo as their first choice
The results (Figure 32) show that lsquoremoving political decision-making and making the process more technocraticrsquo was the change most cited by finance professionals as likely to improve the planning and selection process A majority of respondents (55) ranked either lsquoremoving political decision-makingrsquo or lsquoputting in place mechanisms to reduce corruptionrsquo as their first choice This prioritisation aligned with the pervading sentiment voiced by participants in the Canadian roundtable who argued that the government often plan and select projects that are likely to be popular among voters and will focus decision-making on the political cycle which results in short-sighted project selection and planning processes that lack a long-term plan to address future needs
The importance of putting in place mechanisms for reducing corruption such as effective whistle-blowing legislation also resonated in the roundtable discussions A participant in Nigeria emphasised that lsquoif project selection was looked into as it should be it would
definitely help us in reducing corruption and hence reduce the infrastructure gaprsquo Respondents also ranked highly lsquoquantifying the total life-cycle costs of a potential projectrsquo ndash with 22 selecting this as their first or second choice Therefore one of the key barriers to improving project selection is the bias towards short-term thinking and decision-making
Another area needing improvement identified in the survey is the lack of a standard assessment method supporting the project selection process The survey showed that 26 of respondents ranked lsquoimplementing standard assessment tools to evaluate projects during selectionrsquo as either their top or second-highest choice Below we explore two such barriers and how accountants play a role in addressing them first improving the project planning and selection processes by using standards and tools to identify need and prioritisation and second the misalignment between the project life cycle and the political short-term thinking that often prevails in project selection
How accountants can bridge the global infrastructure gap | 3 Selecting projects
FIGURE 32 Which of the following do you feel the government in your country should prioritise to make the best decisions when selecting infrastucture projects
Removing political decision-making making process
technocratic
100
80
60
40
20
0
n 1st preference n 2nd preference n 3rd preference n 4th preference n 5th preference
Applying standard assessment tools to
evaluate projects during selection
Putting in place mechanisms to
reduce corruption
Quantifying the total life-cycle
costs of potential projects
Spending more resource to evaluate
projects after completion
Transferring project selection powers
to more local levels of govt
Adhering to global accounting
standards
Bringing OOBs onto government
balance sheets
Moving government accounts from cash to accrual
accounting
Source The Global Infrastructure Gap survey all respondents n 3611
25
How accountants can bridge the global infrastructure gap | 3 Selecting projects
The constrained optimisation method is another tool that can be used for project selection though it is usually reserved for complex and large projects that require mathematical optimisation before decisions are made
31 BARRIER 1 LACK OF A STANDARD PROJECT SELECTION METHOD ndash FACTORING IN lsquoNEEDrsquo AND lsquoPRIORITISATIONrsquoA participant in the Trinidad amp Tobago roundtable commented that planning and project selection is lsquohardly ever done on a needs basis We do not complete a needs assessment when were building a road costing millions of dollars What is the benefit that we are going to bring to society from that new infrastructurersquo Establishing a need is a key consideration in building the case for selecting a particular project Although there are no international standards or regulations for infrastructure project selection the Guide to Project Management Book of Knowledge (PMBOK) (Project Management Institute 2017) sets out a process whereby the lsquoneedrsquo for the project is identified first and classified as most important in the selection This can be done by conducting a needs assessment or feasibility study and supports the reasons for lsquowhyrsquo the project is required The lsquowhyrsquo may be stimuli such as a market demand a business need a customer request a technological advance a legal requirement or a socialenvironmental need
The PMBOK then delineates two broad methods for establishing the benefit or the lsquowhyrsquo of a project the benefit measurement method and the constrained optimisation method
The benefit measurement methodAs a comparative approach this method is based on the present value of estimated cash flows and uses techniques such as benefitcost ratio economic models payback period discounted cash flow internal rate of return and opportunity cost This method is often used for small or less complex projects
Constrained optimisation methodThe constrained optimisation method is another tool that can be used for project selection though it is usually reserved for complex and large projects that require mathematical optimisation before decisions are made This method is widely used in finance and economics to find the minimum or maximum for a cost function where the cost changes depending on varying inputs Many techniques are available that offer broader consideration for decision makers by examining the best and worst case scenarios and the probability of the project outcome
The international roundtable participants highlighted that governments should ensure that the need for a particular project is clearly defined ndash the lsquowhyrsquo as the need will determine the appropriate source(s) of support To do this they should implement a stage-gate process such as the PMBOK with standard tools and mechanisms in place for evaluating the project selection process increasing transparency and reducing corruption
FIGURE 33 Two methods of need assessment
Uses cost-benefit analysis to assess whether the project is financially viable or not
Constrained optimisation method
The benefit measurement method
Compares the project under consideration with a competing project
New project Competing project
How accountants can bridge the global infrastructure gap | 3 Selecting projects
Alongside the technical methods available for isolating need and priority accountants can produce a broader range of metrics to improve the projection selection process
In practice many governments do not have the resources or the capacity to carry out such assessments across all projects and usually with the limited information available they place emphasis on basic elements of project appraisal which include lsquorules of thumbrsquo to confirm that
bull the need for the project is justified
bull the projectrsquos objectives are clearly specified
bull broad alternatives to the project are considered
bull promising options are analysed
bull project costs are fully estimated and
bull project benefits are assessed
Even by applying the basic elements of project appraisal prioritisation (or ultimately selecting the right project) can still be a constraint The World Bank has developed an innovative and adaptable Infrastructure Prioritization Framework (IPF) (Marcelo et al 2016) to assist governments in making the best use of their limited information in the interim until they are able to increase their capacity and resources for conducting a more informed and extensive analysis
The IPF provides a stepping-stone approach to project prioritisation for government decision-making This multi-criterial decision-support tool builds on existing and accessible data to help governments compare projects while promoting the building of analytical capacity and data for more extensive financial and economic analysis It is seen as an extension to the current set of tools available to support project selection It starts from a baseline of ad hoc uninformed project selection (where technical project information is limited and subjective) to partial technical information (where some information and analysis is available) to a full selection by advanced project appraisal (where considerable technical information is available)
Alongside the technical methods available for isolating need and priority accountants can produce a broader range of metrics to improve the projection selection process For example project planning and selection in Japan considers the effect of infrastructure investment on achieving regional equity instead of selecting projects that give the highest direct economic return (International Transport Forum 2017) This approach prioritises more evenly spread economic development in a country even where an optimisation model would suggest investment elsewhere
Box 31 Sustainability and infrastructure A Canadian case
The Canadian wave of the survey included a question on sustainability and infrastructure 80 of Canadian respondents indicated that they believe that it is very important to adapt to the impacts of the changing climate such as severe weather in planning infrastructure projects
It is important now more than ever to build resiliency into infrastructure investments Roads bridges buildings public transit and water and wastewater systems are at increasing physical risk from the impacts of climate change
The Canadian government declared in the 2017 federal budget that it plans to invest CAD219bn in green infrastructure Specifically CAD2bn is dedicated to a Disaster Mitigation and Adaptation fund to support the federal provincialterritorial and municipal infrastructure needed to address climate change Canadian national building codes have been updated to integrate climate adaptation and
resiliency considerations resulting from significant disaster losses Canadian insurance companies are experiencing the impact the annual insured damage for 2016 was CAD49bn ndash a significant increase from the previous annual record of CAD32bn set in 2013 In 2016 the biggest claims arose from the Fort McMurray wildfires which resulted in approximately CAD37bn in insured damage
Any future costs of inaction will likely outweigh the incremental investments made today in enhancing and modifying infrastructure resiliency Nonetheless too often there are challenges in making the business case for projects that incorporate adaptation measures But as with most modifications in the long run it is always easier and cheaper to build resilience considerations into asset development from the start rather than adding them later in response to a major event n
26
How accountants can bridge the global infrastructure gap | 3 Selecting projects
The member survey revealed the need to quantify the total life-cycle cost and remove political decision making in order to improve project selection
32 BARRIER 2 MISALIGNMENT OF THE INFRASTRUCTURE LIFE CYCLE AND THE POLITICAL CYCLE The member survey revealed the need to quantify the total life-cycle cost and remove political decision making in order to improve project selection These two changes are likely prioritised because of the misalignment that commonly exists between the political cycle (often four to six years) and the total life cycle of an infrastructure asset (often over 20 years) This mismatch can generate two biases a bias towards short-term decision-making and a bias towards megaprojects over maintenance
Short-term bias in project selection New infrastructure investment is unavoidably long-term and this carries certain risks At the stages of early planning and project selection infrastructure decision-makers need to consider the forces shaping a country ndash such as social demographic and technological change ndash while providing sufficient flexibility to address unpredictable adjustments in need These variables do not align well with the typically shorter political cycle where there is often a preference for announcements of major projects that can be hard to execute in practice or where fundamental requirements may be missing (eg unfeasible building requirements or little forecasted demand for use of the infrastructure) To counteract this bias the UKrsquos National Infrastructure Commission (NIC) was established in 2015 to produce analysis that is independent of government and to provide advice on major long-term infrastructure challenges ndash with the specific priority of linking long-term priorities with short-term action The NIC publishes an annual National Infrastructure Assessment (eg NIC 2018) to establish infrastructure needs and priorities over many decades
Having an independent body of experts recommending a stable set of priorities can reduce investment risk as potential private sector partners will have certainty that a project aligns with a broader economic plan Establishing a national plan based on agreed priorities is also good practice for reducing short-termism and improving legitimacy but it can also add rigidity to project selection processes Decision-makers must be careful to balance the benefits of a stable framework with maintaining flexibility to respond to a rapidly changing policy environment
Bias towards mega-projects over maintenance There can be considerable bias towards allocating resource to new (preferably high-profile) projects rather than investing in the necessary maintenance of existing assets There can be a natural reluctance to spend money on what a country already has and there is often political appeal in wishing to establish an individual legacy through the construction of a megaproject Accountants are in a pivotal position to draw attention to the issue of prioritising backlog maintenance to ensure that assets remain in serviceable condition As part of any needs assessments careful consideration must be given to the condition of existing capital infrastructure and its ability to maintain the existing levels of service To balance these demands NHS Scotland publishes an annual assets and facilities report which provides an overview of asset performance and planned future investment (see NHS Scotland 2018) This report offers good practices in quantifying and managing the backlog of maintenance including setting out the total outstanding backlog of maintenance costs per square metre of the estate and the proportion of significant and high-risk maintenance By identifying the maintenance backlog NHS Scotland is able to take the appropriate action to mitigate a reduction in public service quality while also prioritising repairs in line with the metrics established in the annual assets and facilities report
27
28
How accountants can bridge the global infrastructure gap | 3 Selecting projects
Box 32 Accountants and climate-change adaptation planning A Canadian case in point
As governments around the globe move to establish planned spending on infrastructure projects designed to adapt to climate change it is essential that accountants have a role in project selection and planning to help make the business case for resiliency and to ensure adequate accountability
In Canada the efficacy of this practice was illustrated when the City of Montreal developed its Climate Change Adaptation Plan Accountants played an integral role in performing the cost-benefit analysis of embedding adaptation into municipal infrastructure decisions (CPA Canada 2016)
lsquoA less costly option may be deemed adequate today but could result in future costsrsquo explained a participant in the Canadian roundtable
For example if Montrealrsquos sewer pipes cannot withstand increased flooding predicted with climate change sewer backups could lead to additional expenditures such as clean-up costs and even legal liabilities
lsquoClimate change is going to force cities and governments to put in place capital projects and other measures to prevent future losses or damagesrsquo emphasised the participant
Indeed there has never been a more vital time for CPAs to get involved in infrastructure project selection n
The walkway of Saint Anne De Bellevue Montreal Quebec during the floods April 2017Editorial credit Glass and Nature Shutterstockcom
29
4 Financing projects
The economic analysis in this report demonstrates that by 2040 the world will have accumulated an infrastructure gap of over US$14 trillion In response to this challenge governments are adopting novel means of effectively funding and financing their public infrastructure ndash as well as turning to institutional investors foreign direct investment and the private sector
Accountants act as a critical interface between these actors for example through effectively communicating and negotiating the terms of an infrastructure finance deal
41 THE MIX OF PUBLIC AND PRIVATE FINANCE FOR INFRASTRUCTURERespondents to the joint member survey shared the view that infrastructure in their countries should be financed by both the public and private sectors with 85 stating that infrastructure should be financed by some mix of investment from both the public and private sectors Half the total respondents (50) suggested that there should be an even mix between public and private finance while the second most common view was that infrastructure should be primarily financed by the public sector (42) Some countries such as the UK plan for the majority of their future infrastructure investment to come from the private
sector (IFG 2017) and data from the Project Finance and Infrastructure Journal shows that global private finance deals amounted to over US$930bn in 2017 (IJGlobal 2018) Given this environment
it is important for accountants to contribute their financial acumen and professional skills by providing a view on the best means of financing infrastructure projects (Figure 41)
FIGURE 41 How should infrastructure be financed in your country
0 10 20 30 40 50 60
PRIVATE
Entirely private finance
Mostly private finance
Even mix of public and private finance
PUBLIC
Mostly public finance
Entirely public finance
Dont know no opinion
Source The Global Infrastructure Gap survey generalist respondents only n 1645
30
and core public service infrastructure Core public service infrastructure such as hospitals and schools attracted the lowest private finance support
Overall finance and accounting professionals with a specialist background took a balanced view on the appropriate finance sources for infrastructure in their country
42 KEY BARRIERS TO SECURING PRIVATE FINANCE FOR INFRASTRUCTUREThe member survey showed that 85 of respondents believed there should be some mix of public and private sector finance in their countryrsquos infrastructure A key question therefore is what barriers limit the flow of private finance for public infrastructure
Survey respondents with specific expertise in infrastructure (lsquospecialistsrsquo ) provided a detailed breakdown on the suggested balance of public and private investment by each type of infrastructure
7
Almost half (47) of specialist respondents argued that ICT infrastructure should be either mostly or entirely financed by the private sector while other transport ndash such as air or sea ndash ranked as the second highest subsector for private sector investment (36) (Figure 42) There was a consistent view across the infrastructure subsectors that there should be an even mix of public and private investment with between 33 and 46 of specialist respondents holding this view Only three subsectors were seen to benefit from finance originating mostly or entirely from the public sector these were water and sanitation roads and highways
How accountants can bridge the global infrastructure gap | 4 Financing projects
Overall finance and accounting professionals with a specialist background took a balanced view on the appropriate finance sources for infrastructure in their country
FIGURE 42 How should infrastructure be financed in your home country by infrastructure sub-sector
Dont know no opinion PUBLIC Even mix PRIVATE
Information and communication technology
Other transport
Power and energy
Railways
Water and sanitation
Roads and highways
Core public service infrastructure
0 10 20 30 40 50 60 70 80 90 100
n n n n
0 10 20 30 40 50
Insufficient skills in government to negotiate with private sector
Lack of attractiveness of infrastructure investment
Negative perception of private finance for public infrastructure
Regulatory barriers
Perceived political instability in my country
Underdeveloped financial markets in my country
Too few viable projects for private investment
Other
Dont know
FIGURE 43 What are the key challenges that the government faces in securing private finance
Source The Global Infrastructure Gap survey all respondents n 3611
Source The Global Infrastructure Gap survey specialist respondents only n 1966
7 Question 3 of the survey asked respondents if their work involved any of the following areas infrastructure policy procurement capital budgeting project management or operations management
How accountants can bridge the global infrastructure gap | 4 Financing projects
Developing the skills in government to act as competent clients and negotiators will be essential in meeting the challenges of providing the right finance for infrastructure projects
As seen in Figure 43 ACCA members and CPA Canada members identified three key barriers for governments working to secure private finance
Barrier 1 the lack of attractiveness of infrastructure investment (42)
Barrier 2 the negative perception of private finance for public infrastructure (43) and
Barrier 3 insufficient skill in government to negotiate with the private sector (45 of respondents)
The distinction between lsquofundingrsquo and lsquofinancingrsquo infrastructure (set out in the next section) helps explain the lack of attractiveness of infrastructure investment and what accountants might do to reduce this problem The higher cost and perceived private gain from public goods is a significant factor in the negative perception of private finance investing in public infrastructure The UK National Audit Office published a report in January 2018 calling out the high rates of return enjoyed by private investors participating in the Private Finance Initiative (Morse 2018) Therefore accountants must take centre stage in
demonstrating the higher cost of private capital managing the transfer of risk between sectors and building an evidence base for selecting the right financing model to support an infrastructure project
Finally developing the skills in government to act as competent clients and negotiators will be essential in meeting the challenges of providing the right finance for infrastructure projects For example there is growing recognition that gold-standard public finance takes account of more than debt stocks and cash flows (eg debt to GDP ratio and tax receipts) and instead needs to consider net wealth particularly public assets Cultivating the skills in government to produce a public sector balance sheet and applying this perspective to the finance selection process will help policymakers maximise the value of their assets and make better infrastructure finance decisions
The remainder of this chapter will discuss these barriers in order to inform areas where public sector accountants can make a difference in closing the infrastructure gap
FIGURE 44 Key barriers in financing infrastructure projects
Lack of attractiveness
of infrastructure investment
Negative perception of
private finance for public
infrastructure
Insufficient skill in government
to negotiate with the
private sector
BARRIER 1 BARRIER 2 BARRIER 3
42 43 45
31
How accountants can bridge the global infrastructure gap | 4 Financing projects
Investment in infrastructure offers the opportunity for private investors to benefit from stable long-term low-risk returns that are tied to a physical asset
43 BREAKING DOWN BARRIER 1 BY CLOSING THE FUNDING GAP
Investment in infrastructure offers the opportunity for private investors to benefit from stable long-term low-risk returns that are tied to a physical asset A key challenge in connecting this pool of private capital with the demand for infrastructure projects is the funding gap Broadly there are three ways of funding (lsquoultimately paying forrsquo) an infrastructure project
Distinguishing between funding and financing It is important to make a clear distinction between the lsquofundingrsquo and lsquofinancingrsquo of infrastructure projects When a private sector institution such as a bank or pension fund finances a public infrastructure project it is providing the upfront money to allow for the design building and operation of that project whereas lsquofundingrsquo is how an infrastructure project is ultimately paid for (Institute for Government 2018)
Global capital markets can help plug the global infrastructure gap Institutional investors with an estimated US$80 trillion in assets under management (Fages et al) seem ideal partners for providing the required finance to reduce the size of the forecasted global infrastructure gap Their risk appetite and the duration of their liabilities match the needs of typical infrastructure projects that will often have life cycles ndash from design to decommission ndash that can span many decades
bull general taxation
bull user charges (eg toll roads) and
bull novel forms of funding (eg value capture and civic crowdfunding)8
This distinction explains why even where private investors have expressed interest in public infrastructure and while the global infrastructure gap grows the response has been relatively muted (McKinsey 2016a) Private investors understandably require a stream of revenue to support their upfront outlay but many potential (even lsquoshovel readyrsquo) projects do not include the long-term funding arrangements to support private finance
FIGURE 45 The funding gap
Global Infrastructure Investment Gap
(forecasting a US$14 trillion gap by 2040) FUNDING
GAP
Institutional Investors
(US$80 trillion under management)
8 Refer to Institute for Government 2018 for an overview of the advantages and disadvantages of different infrastructure funding options
32
Box 41 Hong Kongrsquos MTR Corporation ndash fully funded infrastructure through value capture
Hong Kong has applied a novel form of infrastructure funding that has attracted global attention MTR Corporation is majority owned by the Hong Kong government and manages a passenger rail system that makes a profit It manages to generate revenue in excess of 180 of its operating cost
One factor in MTRrsquos financial success has been its lsquoRail plus Propertyrsquo model where the corporation captures some of the positive externalities of its transit operations by developing and renting the land surrounding its rail stations
Hong Kong is particularly suited to this form of funding with its dense population and high real estate costs which have allowed MTR to create sustainable revenue streams from the development of the land surrounding its stations (Leong 2016 MTR Corporation 2017) n
Innovative models of funding infrastructureGeneral taxation and government capital allocations provide an important foundation for funding public infrastructure while user charges can provide a stream of revenue (eg road tolls) ndash subject to demand risks There are also emerging models that are helping to plug the funding gap Rent capture is attracting attention as a method of funding transit (see Box 41 on the MTR Corporation in Hong Kong for an example) In addition civic crowdfunding a novel form of funding is spreading in popularity A report from Catapult Future Cities (2017) found that 10 of local governments in the UK now make use of some form of civic crowdfunding to transform their communities Spacehive ndash a UK crowdfunding platform ndash has attracted over pound11 million in funding since 2012 to fund over 550 local projects including building new community centre facilities (Spacehive 2019) Platforms such as Spacehive connect grant providers local governments and residents that collectively contribute to projects as well as providing a service to verify that a project is viable and has received the required government permissions In 2017 the Mayor of London committed pound400000 to Spacehive projects (OrsquoDowling-Keane 2017) As governments face constrained budgets public sector
finance officials can play a central role in supporting these novel forms of infrastructure funding by establishing what proposals are financially viable in order to help plug the infrastructure gap
The role of the accountant in addressing the funding gapBeyond these novel funding models accountants can play an important role by helping to identify the most efficient funding models while also taking a leading role on the negotiation with potential private sector investors and representing the public interest through their high ethical standards
Clearly the funding gap is a factor in lsquothe lack of attractiveness of infrastructure investment for private investorsrsquo identified in the member survey Finance professionals should consider a number of factors in formulating effective business cases that can attract private sector finance (eg in articulating the lsquoprivate sector incentiversquo) The financial viability of the project needs to be balanced against affordability for users and access to public goods and services Accountants must consider how they can develop and communicate the private sector incentive for investing in priority projects while also supporting the public interest and providing taxpayers with value for money
33
How accountants can bridge the global infrastructure gap | 4 Financing projects
General taxation and government capital allocations provide an important foundation for funding public infrastructure while user charges can provide a stream of revenue (eg road tolls) ndash subject to demand risks
34
How accountants can bridge the global infrastructure gap | 4 Financing projects
44 BREAKING DOWN BARRIER 2 BY ACCOUNTING FOR THE HIGHER COST OF PRIVATE CAPITALRunning infrastructure projects efficiently for citizens also requires that accountants provide decision-makers with the best advice possible in selecting the appropriate source of project finance
The UK is a global leader in the use of private finance and has over 700 operational private finance deals ndash with total projected future charges arising from these deals of almost pound200bn (Morse 2018) In 2018 The UKrsquos National Audit Office published a report examining the rationale costs and benefits of private finance for public sector projects (Morse 2018) The reportrsquos analysis of Department for Education data showed that the cumulative cost of privately financed projects can exceed the public sector
finance costs by 40 over the life of an infrastructure project The broader benefits of private finance for example transferring risk away from government must therefore outweigh the higher total life-cycle cost of private capital
Off balance sheet liabilities in public sector accountingThe UK is not alone in making use of private finance to provide the upfront capital for public infrastructure The accounting rules set by the European System of Accounts excludes liabilities from public sector balance sheets if the private sector bears most of the projectrsquos risks and rewards The types of risk contributing to this test include construction risks (eg cost and time overruns) and demand risks (eg forecasted and actual use of the infrastructure asset) (Atkins et al 2017) Liabilities not included
By the nature of the public sector there are many competing short-term needs for public capital investment where necessary infrastructure investment must compete with other public spending priorities
35
30
25
20
15
10
05
0
Portu
gal
Slov
akia
Hungar
y
UK
Cypru
s
Irelan
dN
ethe
rland
s
Spain
Denm
ark
Esto
nia
Belgiu
m
Gre
ece
Croat
ia
Austri
a
Malt
a
Italy
Finl
and
Latv
ia
FIGURE 47 Off balance sheet PPPs as of GDP
Source ACCA and CPA Canada analysis of Eurostat 2018
FIGURE 46 Estimated cash flows of a privately and publicly financed projectThe cumulative cash costs of a group of PF2 schools are around forty per cent higher than the costs of a project financed by government borrowing
350000
300000
250000
200000
150000
100000
50000
0
Cumulative cash costs (pound000)
2015 2016 2017 2018 2019 2020 2021 2022 2023 2024 2025 2026 2027 2028 2029 2030 2031 2032 2033 2034 2035 2036 2037 2038 2039 2040 2041 2042
Benefits needed to offset higher costs of private finance procurement
PF2 unitary charges Public sector comparator (PSC) with government borrowing costs
Notes1 Cost estimates taken from data prepared by the Department for Education to compare costs of a group of privately financed (PF2) schools with a public sector comparator (PSC)
2 Interest costs for the PSC have been modelled using an amortising loan with an interest rate of 25 The 20-year government borrowing costs were 25 at the time of financial close of this project and the average life of the project debt was less than 20 years
Source Education Funding Agency National Audit Office analysis Reproduced from Morse 2018
How accountants can bridge the global infrastructure gap | 4 Financing projects
Accountants in the public sector must play a critical role in managing both these benefits while also collecting reliable data to measure whether private finance provides good value for money
on the public sector balance sheet are known as off balance sheet (OBS) liabilities Data from Eurostat shows that other European countries have amassed considerable OBS liabilities ndash with outliers such as Portugal and Slovakia maintaining OBS liabilities in excess of 3 of GDP (Eurostat 2018)
An incentive for using private finance can arise through the combination of fiscal rules such as the EUrsquos Fiscal Compact requiring governments to meet debt reduction targets (European Commission 2017) and the ability to keep certain liabilities off the balance sheet through private finance Governments will be encouraged to use private finance even when it ultimately costs more than traditional public finance when this generates the fiscal illusion of adhering to fiscal rules while at the same time building and operating necessary infrastructure In addition to the fiscal illusion these treatments limit the transparency of infrastructure finance by shielding some politicians and the public from understanding the true cost of infrastructure investment in a particular country
Insufficient flexibility between capital and operational budgets can cause further challenges This is particularly the case where a public sector entity can attribute the unitary charge9 from a private finance deal to its operational budgets in cases where the capital budget includes insufficient funding for a required project By the nature of the public sector there are many competing short-term needs for public capital investment where necessary infrastructure investment must compete with other public spending priorities ndash such as the growing operational costs of health care and education But over time high unitary charges can crowd out operational budgets and prevent future governments from providing quality public services
Why use private finance for public infrastructure Given all these concerns it is unsurprising that in the October 2018 Budget Speech the UK Chancellor confirmed that the government would not sign any new Private Finance Initiative (PFI) contracts (Plimmer 2018) Given this environment it is worth asking what is the genuine rationale for private finance in public infrastructure
Two key benefits can justify the use of private finance for public infrastructure the appropriate transfer of risk from the public to the private sector in the building and running of the infrastructure and efficiencies achieved through the use of private sector money in the financing building and operation of public infrastructure Accountants in the public sector must play a critical role in managing both these benefits while also collecting reliable data to measure whether private finance provides good value for money The next chapter explores findings from the member survey on how best to manage the relationship between public and private actors involved in infrastructure projects
At the early stages of a projectrsquos conception accountants are also critical in selecting the right type of finance where they can provide a transparent assessment of the best finance option based on sound principles (eg value for money affordability for users and distribution impacts) Previous ACCA research shows the high level of trust in the ethical behaviour of accountants Ethics and Trust in a Digital Age (ACCA 2017) found that 9 in 10 professional accountants agree that ethical behaviour helps to build trust in the digital age And almost all C-suite executives (95) assert that the accountantrsquos ethical behaviour helps the organisation build trust with internal and external stakeholders Accountants can offer a collective good through this privileged position of trust by providing sound transparent advice on the best finance option for a particular infrastructure project
9 The recurring payments by governments for privately financed projects
35
How accountants can bridge the global infrastructure gap | 4 Financing projects
The barrier to attracting private finance for infrastructure most cited in the member survey was that governments have insufficient skill to negotiate effectively with the private sector (45)
45 BREAKING DOWN BARRIER 3 BY PROFESSIONALISING THE PUBLIC SECTOR FINANCE FUNCTION The barrier to attracting private finance for infrastructure most cited in the member survey was that governments have insufficient skill to negotiate effectively with the private sector (45) This issue was echoed in the roundtables with participants in Trinidad and Tobago stating that there was a clear need to differentiate professional accountants from those who had no real professional training lsquoterms are used very loosely in this country as to an accountant and most times you would mean ldquobookkeeperrdquorsquo Others in Malaysia noted that lsquomany accountants nowadays lack the right specialisation of skills in terms of having foresight to anticipate what costshellipcome into play [in an infrastructure project]rsquo Clearly there are skills gaps in government that need to be addressed through professionalisation and upskilling if infrastructure is to be properly financed
Finance professionals offer a net wealth perspective Knowing what the country owns and what it owes is a basic requirement for reducing its governmentrsquos information deficits which will allow for improved decision-making in financing infrastructure The professional management of assets and the development of an asset register are two examples of how accountants can take the lead in improving government decision-making In the UK roundtable discussion David Smith associate partner at EY UK also acknowledged the essential role of accounting standards
lsquoAccountantsrsquo work now goes beyond compliance but compliance is our firm foundation Speaking from experience we have global accounting rules that do not necessarily align jurisdiction by jurisdiction but the rules are there for a reason If therersquos deviation or rejection of accounting standards for infrastructure projects at any stage then that is a clear red flagrsquo
Global studies are documenting how the benefits of accrual accounting are leading to broad global adoption For example the 2018 International Public Sector Financial Accountability Index forecasts that within the next five years 65 of governments will report on an accrual accounting basis ndash with particularly high levels of adoption in Africa Asia Latin America and the Caribbean (IFAC and CIPFA 2018)
The professionalisation of the finance function is essential in maximising the value of a countryrsquos assets There is growing recognition that gold-standard public finance practice takes account of more than debt stocks and cash flows (eg debt to GDP and tax receipts) and instead needs to consider net wealth where the right policies can maximise the return on public assets This approach requires the adoption of full accrual accounting and the production of a public sector balance sheet Improving the skills available to government to develop a public sector balance sheet and appreciating the full balance sheet impact of a new project will be an important step in allowing public sector accountants to act as competent clients of and negotiators with the private sector
36
How accountants can bridge the global infrastructure gap | 4 Financing projects
37
Maximising the value of public assets and the intertemporal balance sheetDag Detter a former director of Swedenrsquos Ministry of Industry argues that taking a net wealth perspective with the aim of producing small improvements in the return on public assets would allow for a doubling in infrastructure investment (Detter and Folster 2017) The competing argument to this view is that many public assets are not marketable as policy objectives (eg running a public school) do not typically align with generating financial returns
The New Zealand government seeks to address this issue by classifying its assets and liabilities as social financial and commercial ndash where commercial assets have more scope for financial returns New Zealand has taken the lead in public
The adoption of this net wealth perspective changes the typical rankings of public financial capability In late 2018 the IMF Fiscal Monitor published a report (IMF 2018) which estimated that globally governments had public assets worth over 200 of GDP Applying this analysis can also support good public financial management in a country with the IMF report showing that countries with a strong balance sheet pay lower interest on debt and have shorter and shallower recessions
Figure 48 shows the result of adopting a net wealth view of a nationrsquos financial position Using this lens Japan ndash with a notoriously high public-debt-to-GDP ratio ndash has a net wealth position near zero Other countries such as the UK and Portugal have substantial negative public equity in excess of 100 of GDP
The professionalisation of the finance function is essential in maximising the value of a countryrsquos assets
FIGURE 48 Public sector balance sheets ( of GDP)
750
500
250
0
-250
-500
Port
ugal
Uni
ted
Kin
gd
om
The
Gam
bia
Ger
man
y
Bra
zil
Fran
ce
Aus
tria
El S
alva
do
r
Uni
ted
Sta
tes
Ug
and
a
Jap
an
Ken
ya
Tanz
ania
Can
ada
Ind
ia
Gua
tem
ala
Finl
and
Alb
ania
Co
lom
bia
Tuni
sia
Geo
rgia
Sout
h A
fric
a
Aus
tral
ia
New
Zea
land
Ind
one
sia
Ko
rea
Peru
Kaz
akhs
tan
Russ
ia
No
rway
n Financial assets n Total non-financial assets n Liabilities ex pension n Pension liabilities Net worthTu
rkey
Source IMF staff estimates
Based on a single year of data in most cases compiled as part of the Fiscal Transparency Evaluation Albania 2013 Austria 2015 Brazil 2014 Colombia 2016 The Gambia 2016 Guatemala 2014 Kenya 2013 Peru 2013 Portugal 2012 Tanzania 2014 Tunisia 2013 Turkey 2013 Uganda 2015
38
How accountants can bridge the global infrastructure gap | 4 Financing projects
TABLE 41 New Zealand Intertemporal balance sheet 2016(Percentage of GDP)
ASSETS LIABILITIES NET WORTH
Social 575 71 505
Financial 332 505 -173
Commercial 201 120 81
Static balance sheet 1108 695 413
Fiscal 13819 14800 -981
Intertemporal balance sheet 14927 15495 -568
Source New Zealand 2017 Investment Statement IMF 2018
Box 42 New South Wales Treasury Asset and Liability Committee
The state of New South Wales in Australia has established an Asset and Liability Committee to maximise the value of their assets and properly manage the statersquos liabilities
By using this total balance sheet perspective the New South Wales Treasury has been able to unlock AU$33bn for new social and economic infrastructure projects
This initiative was recorded as part of a series undertaken by ACCA and the International Federation of Accountants (IFAC) documenting good practices in public financial management from around the world To learn more scan the QR code to hear more about this initiative in NSW
If the public sector finance function is professionalised accountants working in the public sector will be able to lead the development of the required governance structures to maximise the value of public assets And where public assets do present commercial opportunity accountants must be at the forefront of proper public commercial asset management By providing independent professional management for public assets governments will be well placed to maximise the value of their assets and minimise the cost of liabilities The member survey shows that reducing political influence in project selection was ranked as the number one issue for improving outcomes Allocating more decision-making authority to independent professional accountants will be an important step in the effective commercial management of public assets
financial management practices not just through this classification but also by producing an intertemporal balance sheet (see Table 41) The country currently maintains a strong net worth position in excess of 40 of GDP but analysis by the New Zealand Treasury shows that the current policy framework will produce recurring deficits that are forecasted to reduce the nationrsquos net worth to almost ndash57 of GDP over the next 40 years Accountants producing this analysis provide decisions-makers with a better long-term view of their policy decisions and can help improve the sustainability of public finances This fits with the maxim that lsquoyou manage what you measurersquo and governments that invest in their finance functions to develop a public sector balance sheet will be better placed to understand the implications of a particular infrastructure project on the nationrsquos net wealth
Where public assets do present commercial opportunity accountants must be at the forefront of proper public commercial asset management
Poor monitoring and oversight of
projects by government
Confusion about where
each side provides value
in a PPP
Uncoordinated commerical
acumen in the public sector
BARRIER 1 BARRIER 2 BARRIER 3
5 Delivering projects the publicndashprivate relationship
Common challenges with infrastructure project selection and financing outlined in the previous chapters may persist through the project delivery phase a shortfall in public capital budgets due to short-term decision-making changing political governance and the lsquomegarsquo risks associated with lsquomegarsquo projects For these reasons public-private partnerships (PPPs) are often chosen for the delivery of public infrastructure projects
51 DEFINING PPP In the context of public infrastructure projects a PPP is a contractual agreement between a public sector entity and a private entity (or group) to provide a public asset or service (World Bank 2018b) Unlike traditional procurement ndash where all the risk will ultimately sit with the government ndash PPPs will explicitly set out the allocation of risk for a project Importantly the scope of private sector involvement can vary substantially including requiring private sector partners to
bull design and build a project
bull design finance and build a project or
bull design finance build operate and maintain a project
Asset ownership is another relevant consideration in establishing the terms of a PPP A project can feature public or private sector ownership of the infrastructure and can include provisions to transfer ownership after a set period (eg a private sector partner operates a toll road for 20 years and thereafter transfers ownership of the road back to the public sector)
The roundtable discussion rightly identified the variety of responsibilities that the private sector can adopt in
a PPP For example a participant in the Canadian roundtable identified that the lsquoprivate sector needs to bring more to the government table than just money it needs to offer expertise or opportunity that the government would not otherwise haversquo
52 KEY BARRIERS TO GETTING THE PPP RELATIONSHIP lsquoRIGHTrsquo The public-private relationship is evolving and getting the terms of this relationship right will be critical for the provision of social and economic infrastructure in the future The roundtable discussions with infrastructure experts highlighted three key barriers to this where there was a particular focus on the need to develop the right relationship between public and private sector actors ndash as getting this
relationship right would support the timely and efficient delivery of infrastructure projects (Figure 51)
The roundtable participants identified poor monitoring and oversight by government as a key challenge in delivering infrastructure projects The member survey demonstrated that there was considerable disagreement about where each party in a PPP agreement provides value in delivery Finally the roundtable participants stated that the public sector was often lacking the commercial acumen required to manage an infrastructure PPP effectively
Below this chapter examines these barriers in greater detail and reviews recommendations for overcoming each one
FIGURE 51 Key barriers in delivering infrastructure projects
3939
How accountants can bridge the global infrastructure gap | 5 Delivering projects the publicndashprivate relationship
Both developed and developing countries need to consider whether they are providing sufficient monitoring across the entire project life cycle to maximise the value of their contracts
53 BREAKING DOWN BARRIER 1 BY ENGAGING THE PROFESSIONAL ACCOUNTANT TO PROVIDE PROJECT LIFE-CYCLE MONITORING AND OVERSIGHT Successful project selection financing and procurement will be of little effect if an infrastructure PPP suffers from poor contract management Managing project risk effectively ndash as well as controlling for scope and budget lsquocreeprsquo ndash requires the public sector to act as a competent client by providing effective monitoring and oversight of a project at every stage from design to operation of the infrastructure
Unfortunately these governance structures are often lacking in many countries with a participant in the Sri Lankan roundtable discussion noting that lsquoprojects [will] kick off but there is no one to monitor them on an ongoing basis This can lead to cost overrunsrsquo Written evidence by the Chartered Institute of Purchasing and Supply (2013) to the UK House of Commonsrsquo Public Administration Select Committee echoed this point In this evidence the Institute submitted that lsquoprocurement skills tend to focus on the call for competition to award the contract rather than on the whole procurement cycle which includes pre-procurement and contractsupplier managementrsquo Both developed and developing countries need to consider whether they are providing sufficient monitoring across the entire project life cycle to maximise the value of their contracts
Chapter 1 section 15 showed that corruption was one of the top barriers to meeting infrastructure need in certain
FIGURE 52 Possible parties to a PPP
regions ndash with 89 of survey respondents in South Asia citing this as a key barrier A roundtable participant in Trinidad and Tobago asserted that proper monitoring of project performance was essential for mitigating corruption particularly lsquohaving something that can support the accountants in countries with no whistle-blowing policyrsquo In addition Abiodun Akanbi from the Nigerian roundtable commented that lsquothe accountant has huge responsibility in measuring the actual performance of contractors to be able [to] efficiently deliver infrastructurersquo The accountant needs to be at the forefront of providing the public sector assurance that the project is being delivered as contracted and according to the project plan Clearly accountants in the public sector have a critical role to play in effective contract management ndash particularly by measuring project progress against agreed terms at key milestones in the delivery process
Reducing moral hazard in the PPP relationship Eriksson and Lind (2015) describe moral hazard as lsquopost-contractual opportunismrsquo There are three key parties that need to be considered in an infrastructure PPP the owner the contractors building the infrastructure and the investor Depending on the structure of the PPP contract any of these roles could be taken on to varying degrees by the government or a private partner Given the limited oversight and governance of many PPPs cited in the roundtable discussions the agents of a PPP project (ie the contractors) will often have the incentive to reduce costs by cutting corners in the projectrsquos execution
Investor Contractor
Owner
40
How accountants can bridge the global infrastructure gap | 5 Delivering projects the publicndashprivate relationship
41
54 BREAKING DOWN BARRIER 2 BY IMPROVING THE INCENTIVES AND RECONCILING DIFFERING VALUE ASSUMPTIONSThe member survey compared the perceptions of public and private sector accountants revealing areas where differing assumptions exist between these parties The survey divided respondents into those working in the public sector and those in the private sector Each group was asked in what ways the other sector provided and received value in PPP infrastructure projects Comparing these results demonstrates where the public and private sectors had a similar view on the purpose of a PPP relationship and where their assumptions on the purpose of the relationship differed (Figure 53) These insights are helpful in highlighting divergent views on the role of each sector where incorrect assumptions can harm the ability of a PPP to deliver a project
Comparing the results from each sector in Figure 53 shows that there was broad agreement on how the private sector adds value to infrastructure projects The ordering of the responses was the same for professionals across the two sectors with the majority of respondents from both sides agreeing that the private sector contributes to the partnership through its knowledge of best practice the application of innovation and access to private capital Interestingly respondents from both sectors were less likely to see risk transfer as an area where the private sector provides value The
These three stakeholders shown in Figure 52 will often have different motivations For example the owner might want to increase the scope of the contract after it is agreed For this reasonaccountants must assess the risks balance the costs and schedule and proactively communicate with all stakeholders to support the success of the project
Allocating risk to reduce moral hazardA CPA Canada roundtable participant rightly identified that lsquothe key areas of interface [between the public and private sector] are between the risks retained by the public sector and their impact on the private sectorrsquos ability to deliver on their contractual commitmentsrsquo Getting this allocation of risk right can significantly improve the prospects that a PPP project will be completed on time and on budget as the right risk balance will act as an incentive to meet contractual obligations (Mann 2018)
Accountants play a clear role here The professional team delivering a project will be aided by an accountantrsquos expertise of risk management ndash particularly the accountantrsquos ability to allocate risk appropriately between the parties in order to minimise moral hazard Although the size and nature of the public sector suggests that it is better placed to bear risk skilled finance professionals will seek to balance the allocation of risks to the private parties such that they maintain the incentive to perform contractual obligations to a high quality standard
Comparing the results from each sector in Figure 53 shows that there was broad agreement on how the private sector adds value to infrastructure projects
Source The Global Infrastructure Gap survey all respondents n 3611
70
60
50
40
30
20
10
0Applying innovative
practices and fresh thinking
Knowledge of best practice and expertise
n Private sector view n Public sector view
Access to private capital
Delivering projects on time
Keeping projects to budget
Transferring risk Dont know None of these
FIGURE 53 Where does the private sector add value in delivering infrastructure
42
How accountants can bridge the global infrastructure gap | 5 Delivering projects the publicndashprivate relationship
assumptions about how each party adds value to an infrastructure PPP contract ndash and suggests that public sector actors overestimate the value of the financial arrangements on offer to private sector partners
The UK Guarantees Scheme (UKGS) offers an example of a good practice that could help improve the private sector incentive for entering PPPs and partially reconciles the differing assumptions of value between both sectors The UK Infrastructure and Projects Authority states that the UKGS lsquosupports private investment in UK infrastructure projects It works by offering a government-backed guarantee to help infrastructure projects access debt finance where they have been unable to raise finance in the financial markets The UKGS can issue up to pound40 billion of guarantees and is open to at least 2026rsquo (UK Government 2017) This long-term commitment guarantees the payment of principal and interest on infrastructure debt and is intended to support lsquonationally significantrsquo projects If well implemented schemes like this can encourage additional private sector involvement in the provision of infrastructure ndash but should be balanced against the need to reduce the risk of moral hazard discussed earlier in this chapter
comparison of perceptions also showed that public sector respondents were slightly more positive about the overall value that private sector actors bring to the relationship
There was considerable divergence in opinion between sector respondents as to the areas where the public sector provided value in an infrastructure PPP (Figure 54)
Public sector respondents were much more likely to argue that they provided both a lsquolong-term and stable partnershiprsquo (62) and knowledge of how the public sector works (60) than their private sector colleagues (45 and 43 respectively) Finance professionals from the public sector were also more likely to claim that they provided the private sector with access to projects (45) compared with 35 in the private sector At the same time there was an agreement that the public sector was less likely to offer knowledge of best practice and innovation to a PPP relationship Therefore both sides took a largely similar view of the origin of knowledge and expertise but the public sector respondents were more optimistic about the value they provided as a financial partner in infrastructure projects Understanding this divergence of viewpoint is helpful in identifying the
There was considerable divergence in opinion between sector respondents as to the areas where the public sector provided value in an infrastructure PPP (Figure 54)
Source The Global Infrastructure Gap survey all respondents n 3611
70
60
50
40
30
20
10
0Long-term and
stable partnershipKnowledge of how the
public sector works
n Private sector view n Public sector view
Access to projects Knowledge of best practice and expertise
Applying innovative practices and fresh thinking
None of these Dont know
FIGURE 54 Where does the private sector receive value from the public sector in delivering infrastructure
How accountants can bridge the global infrastructure gap | 5 Delivering projects the publicndashprivate relationship
To ensure that an infrastructure project is successful strong commercial acumen is essential team members require lsquobusiness savvyrsquo a keen understanding of the market in which the project is being undertaken
55 BREAKING DOWN BARRIER 3 BY FACILITATING PUBLIC SECTOR ACCESS TO BUSINESS EXPERTISE To ensure that an infrastructure project is successful strong commercial acumen is essential team members require lsquobusiness savvyrsquo a keen understanding of the market in which the project is being undertaken Nonetheless as Ajith Lekshmanan a participant in the UK roundtable pointed out
lsquoFor a lot of these projects the [public sector] organisation may just be doing it the one time Itrsquos a one-off and these experts that we are going to [in the private sector] theyrsquove got a whole pool of people doing similar things year after year day after day in this country and other countries The skills required are quite specialist and to train a member of staff [in the public sector] to do it just for the one time that you might be using it is not cost effectiversquo
A public sector entity might manage a large-scale infrastructure project and gain valuable expertise in the process but that expertise may not be accessible to other public sector entities for leveraging in their own infrastructure projects In the public sector project-delivery expertise thus exists in silos It is often the private partners in a PPP who through repeated projects acquire the commercial acumen and therefore potentially hold the expert lsquoreinsrsquo
Centralisation of public sector skills may facilitate removal of this barrier For example the UK Civil Service has created Centres of Excellence that seek to pool the pockets of expertise that exist in the public sector such that any organisation within the public sector can refer to these centres and draw on their specialist skill and thus act as a competent client The professional accountant offers specialist skill and should certainly be a key player in any centre of excellence In fact the accountantrsquos role as an expert team member in such centres may provide as stated by a participant in the Malaysian round table ldquobetter marketing of how the profession contributes to society to encourage professionals to continue doing the right thing and be proud of itrdquo
Centralisation of skills will not however be the answer for all governments Others might seek to encourage cross-departmentministry collaboration to facilitate effective knowledge transfer of commercial acumen across the public sector In both cases collaboration is essential for effective knowledge transfer and as previously outlined the professional accountant with an understanding of life-cycle considerations and with professional frameworks for sound professional judgement and ethics is well-equipped to coordinate such collaboration
43
6 The role of the accountant in bridging the gap
61 CURRENT INFRASTRUCTURE PROJECTS THE MISSING TEAM MEMBER The successful provision of public infrastructure requires governments to have the right professional team in place And yet a clear message resounded from the international roundtable discussions a key player is often missing from the infrastructure project team ndash the accountant A representative at the Malaysian roundtable echoed the sentiment expressed by other participants worldwide that accountants are often only invited to comment on infrastructure projects that have already been selected lsquoSo the harm has been donersquo
As pointed out by a participant in the UK roundtable the role of the accountant has evolved over the years from a focus on lsquoguidelines parameters tick boxes and flowchartsrsquo to a much lsquowider awarenessrsquo Certainly the fact that accountants around the globe work within diverse segments of the economy and serve in key roles such as CEO and CFO and as consultants attests to that lsquowider awarenessrsquo The role of the accountant is at the centre of the planning process and not only in the areas of infrastructure policy The accountant can put the lsquonumbersrsquo on ideas and concepts by applying consistent methodology to ensure they are evaluated against other options for meeting policy goals
Future infrastructure projects the essential team member The previous chapters examined the barriers associated with three fundamental phases of infrastructure projects project selection project financing and project delivery With modern qualifications that facilitate barrier removal in each of these phases the accountant plays an essential role in bridging the global infrastructure gap
The international roundtable participants highlighted the following core competencies
a) Planning and selection of projects The accountant
bull develops strategy identifies goals objectives and ensures they can be achieved (giving consideration to financial constraints and potential monetary gains)
bull sets frameworks and uses standard assessment tools to ensure accountability and transparency and prioritisation according to evidence of need
bull questions project assumptions and assesses alternative scenarios
bull employs mechanisms to ensure ethical behaviour and to eliminate corruption while offering sound risk assessment
bull supports organisationsrsquo holistic decision-making in a way that accounts for the impact of climate change on strategy risk and operational and financial performance thus enhancing organisational resilience
b) Financing projects The accountant
bull considers sustainable finance options including climate-change adaptation and resiliency needs
bull assesses financial viability and identifies long-term impact and strategies for risk mitigation
bull acts as a visionary by providing sound life-cycle advice to decision makers and giving them better understanding of the long-term financial difference between maintaining services and enhancing services and of how the latter can create greater cost pressures over time
bull supports clearer and more objective public discourse increases public awareness of risks and supports taxpayersrsquo better understanding of the value of projects
c) Delivering projects and oversight The accountant
bull implements the required monitoring and oversight
44
How accountants can bridge the global infrastructure gap | 6 The role of the accountant in bridging the gap
Accountants offer important competencies to any business team in any sector But in the face of possible misconceptions of the role of accountants what is the way forward onto the professional infrastructure team
bull allocates project risk between parties of a PPP to reduce moral hazard
bull is supported by several frameworks (eg ICAS 2012 KPMG 2013) for professional judgement and ethics that promote the use of logic flexibility consistency reliability relevant evidence unbiased information and alternative framing to avoid precipitous decisions and that promote a balance of experience knowledge and emotion
62 NEXT STEPS TOWARD THE INFRASTRUCTURE TEAM Accountants offer important competencies to any business team in any sector But in the face of possible misconceptions of the role of accountants what is the way forward onto the professional infrastructure team The international roundtable participants made the following recommendations
bull Increase awareness of the accountantrsquos qualifications as a strategic business adviser and as an essential member of the professional infrastructure team alongside the engineers and architects
bull Equip accountants to voice arguments that are compelling both to political leaders and to the general public
bull Offer elected officials the opportunity to gain financial training from accountants so that they understand the true costs and are better equipped to act as financial ambassadors
bull Establish an accountant-informed certification process for project selection
bull Develop and implement clearer governance structures and decision-making processes that involve the finance function
bull Institute whistle-blowing protection legislation for accountants internationally
45
7 Recommendations based on observed good practice
To tackle the growing global infrastructure gap this report offers a variety of observations and international good practices Below is a summary of the recommendations arising from the reportrsquos analysis demonstrating the variety of functions and actions in which accountants can lead to help close the infrastructure gap
71 SELECTING PROJECTS Chapter 3 demonstrated that the lack of standard assessment tools and ineffective political decision-making hampered project selection To help address these challenges some countries establish expert-led bodies to forecast infrastructure need and make recommendations to government as to which projects to build Governments should also balance maintenance and new infrastructure spending by disaggregating expenditure on maintenance and new projects while prioritising the backlog of maintenance to ensure that assets remain in serviceable condition
To improve decision-making further accountants should collect better data on the service potential of existing infrastructure as well as the performance of past projects Together these data will allow accountants to offer new insights to inform the project selection process To reduce the bias towards large projects over maintenance governments should disaggregate expenditure on infrastructure to report both maintenance and new project spend
This report found that there is no standard project selection process for infrastructure projects used by governments around the world and that the underlying need ndash or service gap ndash is not well established or proven Therefore accountants must take the lead in applying selection standards such as the Project Management Body of Knowledge (Project Management Institute 2017) guide and the World Bankrsquos Investment Project Financing (World Bank 2016) policy to structure decision-making better and move beyond short-term thinking and biases
There is also a growing need to build climate change risk into long-term planning and the decision-making on project selection The Montreal Canada case example (see Chapter 3 Box 32) shows how accountants should produce cost-benefit analysis and business cases to embed adaptation and resilience into municipal infrastructure decisions
In summary governments should 1 Establish expert-led bodies to forecast
infrastructure requirements and recommend projects on the basis of need
2 Collect reliable data on the service potential of existing infrastructure and on the performance of past projects
3 Disaggregate expenditure on infrastructure to report both maintenance and new project spend
Accountants should 4 Take the lead in applying standard
selection tools to determine the need for and priority of a project
5 Advise on the distributional impact and regional growth outcomes of selecting particular projects good practice in this area can be found in Japan
6 Embed adaptation and resilience into the project-selection process
46
How accountants can bridge the global infrastructure gap | 7 Recommendations based on observed good practice
Governments should direct supreme audit institutions to monitor the interaction of off balance sheet liabilities and fiscal targets
72 FINANCING INFRASTRUCTURE PROJECTS
assets Officials in New South Wales Australia were able to unlock an additional AUS$33bn to invest in public infrastructure by adopting a total balance sheet perspective (see Chapter 4 Box 42) Accountants should disaggregate public assets in the balance sheet to include commercial social and financial assets This information will be especially effective for identifying underused commercial assets but it is also important to be aware of overall value for money for citizens when selling an asset (eg selling a public asset that was previously free to use but will now attract a user charge imposed by the private sector owner)
Chapter 4 on financing infrastructure highlights three key barriers closing the funding gap accounting for the higher cost of private capital and the need to professionalise the public sector finance function
This report identifies emerging and good practices from around the world that help reduce the funding gap Decision-makers should consider innovative solutions to closing the funding gap such as a value capture and civic crowdfunding For example the MTR Corporation in Hong Kong demonstrates that implementing a transport model that captures the positive externalities of new transit can make some public infrastructure self-funding (see Box 41)
To ensure value for money in infrastructure policy accountants must advise public sector decision-makers on how to make efficient capital allocations A real challenge in this respect is the interaction of fiscal targets and off balance sheet (OBS) liabilities Chapter 4 showed that some countries such as Portugal and the UK have accumulated significant OBS liabilities Therefore countriesrsquo supreme audit institutions should monitor the interaction of OBS liabilities and fiscal targets At the same time finance officials in government should advocate a more holistic approach to maintaining fiscal discipline beyond a few top-line indicators such as debt to GDP or public sector net borrowing
To improve the efficient allocation of public funds long-term infrastructure plans should be aligned with the annual budget process that sets out capital and operating budgets Effective capital budgeting can improve public finances such that departments or ministries do not need to rely on flexibility of unitary charges to meet infrastructure needs
Many national accounts operating on a cash basis treat investment in public infrastructure as a cost instead of recognising a new asset on the public sectorrsquos balance sheet Governments should adopt full accrual accounting and maintain a public sector balance sheet Public sector accountants should also conduct a balance sheet review to maximise the value of public sector
New Zealand has taken the lead in public financial management practices not just through the adoption of accrual accounting but because their public sector accountants produce an intertemporal balance sheet (see Chapter 4 Table 41) (Government of New Zealand 2018) Accountants producing this analysis provide decisions-makers with a better long-term view of their policy decisions and can help improve the sustainability of public finances
In summary governments should 7 Consider innovative solutions for
closing the funding gap such as a value capture civic crowdfunding and other revenue funding schemes
8 Direct supreme audit institutions to monitor the interaction of off balance sheet liabilities and fiscal targets in order to improve the efficient allocation of public sector funds
9 Align long-term infrastructure plans with the annual budget process in order to minimise the use of higher-cost private finance to achieve capital budget flexibility
10 Adopt full accrual accounting and maintain a public sector balance sheet to support decision-making on infrastructure policy
Accountants should 11 Advocate a more holistic approach to
maintaining fiscal discipline to avoid poor financial decisions driven by lsquofiscal illusionsrsquo
12 Conduct a balance sheet review to maximise the value of public sector assets
47
How accountants can bridge the global infrastructure gap | 7 Recommendations based on observed good practice
Professional bodies can also contribute to the improvements in public sector expertise by facilitating knowledge transfer between the public and private sector through thought-leadership events and roundtable discussions
13 Produce an intertemporal balance sheet to improve long-term decision-making and support the sustainability of public finances as is done for example in New Zealand
14 Produce disaggregated assets in the balance sheet to include commercial social and financial assets ndash in order to improve the return on public assets
73 DELIVERING INFRASTRUCTURE PROJECTS AND THE PUBLIC-PRIVATE RELATIONSHIP Chapter 5 highlights three key barriers to implementing infrastructure projects poor monitoring and oversight of projects by government confusion as to where each side provides value in a PPP and lack of commercial acumen in the public sector
To address these barriers and successfully deliver infrastructure projects governments need to look to accountants to implement the necessary monitoring and oversight of their PPP relationships There is also a clear need for effective mechanisms for reducing corruption which was cited as a key action in the member survey The implementation of effective whistle-blowing legislation and the professionalisation of the public sector finance function will allow public servants to challenge unethical behaviour that can derail infrastructure projects
Chapter 6 demonstrated that moral hazard can limit the probability that infrastructure PPPs will be completed on time on budget and to an acceptable level of quality The allocation of risk between the partners in a PPP can play a central role in reducing this moral hazard by putting the right incentives in place for the contractor Therefore professional teams delivering infrastructure should rely on an accountantrsquos expertise of risk management to minimise moral hazard by allocating risks fairly between the parties
Public sector negotiators should reflect on the assumptions identified in the member survey and consider that private finance professionals were less likely than their public sector counterparts to view the public sector as a stable partner or as a sector that provided access to longshyterm projects To mitigate this mismatch governments should consider introducing guarantee schemes for nationally
significant infrastructure projects in order to encourage additional private sector involvement in the provision of infrastructure
As a result of the varied commercial acumen in the public sector governments should consider establishing centres of excellence to coordinate public sector expertise in contract management so that any organisation within the public sector can draw on that specialist skill when negotiating a PPP contract Professional bodies can also contribute to the improvements in public sector expertise by facilitating knowledge transfer between the public and private sector through thought-leadership events and roundtable discussions
In summary governments should 15 Enact effective whistle-blowing
legislation and professionalise the public sector finance function to allow public servants to challenge unethical behaviour that can derail infrastructure projects
16 Establish centres of excellence that coordinate public sector expertise in contract management which allows any organisation within the public sector to draw on the specialist skill when negotiating a PPP contract
17 Consider introducing guarantee schemes for nationally significant infrastructure projects in order to encourage additional private sector involvement in infrastructure projects This will help address the assumptions identified in themember survey which showed that private finance professionals were less likely to view the public sector as a stable partner
Accountants should 18 Implement proper monitoring and
oversight for all projects
19 Advocate embedding themselves in the professional teams delivering infrastructure by highlighting their expertise of risk management
Professional bodies should 20 Act as facilitators of knowledge
transfer between the public and private sector through thought-leadership events and roundtables
48
49
Conclusion
The global infrastructure investment gap is set to grow to US$14 trillion by 2040 and this figure sets the benchmark for meeting the worldrsquos infrastructure needs
In reality however the challenge in fulfilling a countryrsquos infrastructure need is not achieving a notional investment figure but rather establishing a government vision for closing a recognised service gap by either maintaining existing infrastructure assets and or by building new projects
Currently governments lack adequate resources and the capability to make systematic infrastructure decisions because they are not able to harness the benefits of the investment and mitigate the significant risks associated with infrastructure project execution Bringing the accountant to the centre of the decision-making process for infrastructure projects can mitigate these pitfalls The particular skills and perspective of the finance professional can mean the difference between success and failure through improvements in project selection securing financing delivery and oversight of the projects
As the next generation of infrastructure projects are planned financed built and operated the accountant must be brought to the centre of the decision-making process The accountant must be employed across the entire life cycle of future infrastructure projects as a critical member of the professional team if the world is to address the global infrastructure gap
Appendix A Detailed methodology for establishing the infrastructure investment gap
This appendix examines the key features of the G20 Global Infrastructure Outlook methodology (GHI and Oxford Economics 2018) in order to summarise how the global regional and national estimates of the infrastructure gap used in Chapter 1 of this report were determined For a complete understanding the of the original work the Global Infrastructure Outlook report has a comprehensive treatment of the analytical process
A1 DEFINITION OF INFRASTRUCTURE The Global Infrastructure Outlook report defines infrastructure investment as lsquoGross Fixed Capital Formationrsquo (GFCF) by the public and private sectors on fixed immovable assets that support long- term economic growthrsquo (GHI and Oxford Economics 2018) GFCF is a wider definition of investment than just that for infrastructure and so the calculations included for the purposes of this report exclude land and any moveable assets such as IT equipment The definition does however include both the development of new assets and spending on the replacement or maintenance of existing assets
A2 CURRENT INVESTMENT TRENDS Current investment was calculated for a total of 50 countries using data from multinational data sources such as the OECD or Eurostat where possible If the required data was not available from these sources then national statistics were used to create a comparable estimate Failing that data was imputed using econometric techniques The Global Infrastructure Outlook report was completed during 2016 and includes the most up-to-date datasets collected providing values to 2015 so the forecast years begin at 2016 and continue to 2040 Before 2016 no infrastructure gap was estimated so the charts in Chapter 1 and Appendix B reflect current trends only to 2016
For each country and sector the stock of infrastructure per head was calculated and a set of explanatory factors were determined for each sector eg population density structure of the economy These explanatory variables were projected forwards on the basis of national economic and demographic forecasts to estimate infrastructure investment under current trends for each country
A3 INVESTMENT NEEDS The extent to which each country dedicates resources to infrastructure investment was adjusted for the quality of infrastructure using indicators from the World Economic Forum Global Competitiveness Report (Schwab 2018)
The lsquoquality-adjustedrsquo performance measures were then compared across countries using the performance of countries at the 75th percentile among those of similar income levels as the benchmark The investment-need scenario indicated the extent of infrastructure investment by sector and country which would be required to meet this benchmark level Income groups were based on three World Bank definitions low- and lower-middle income upper-middle income and high income For countries that were already positioned above the 75th percentile (ie the target) the objective in the years ahead is to sustain relatively high levels of investment and maintain their strong performance As a result the minimum value for the investment gap is 0 ndash where those countries in the upper quartile must maintain their performance and their peersrsquo target is to attempt to catch up
50
The following account offers a regional breakdown and description of the global infrastructure investment gap covering Africa the Americas Asia Europe and Oceania
B1 AFRICAIn 2018 an estimated US$1328bn was spent on infrastructure in Africa Meanwhile US$1777bn of investment is estimated to be required in the region putting the infrastructure investment gap at US$455bn Cumulatively between 2018 and 2040 the infrastructure investment gap is expected to stand at US$159 trillion with the amount of infrastructure investment needed expected to be 39 higher than under current trends
51
Appendix BRegional breakdown of the global investment gap and additional service gap analysis
350
300
250
200
150
100
50
0
Investment need Current trends
2007
2008
2009
2010
2011
2012
2013
2014
2015
2016
2017
2018
2019
2020
2021
2022
2023
2024
2025
2026
2027
2028
2029
2030
2031
2032
2033
2034
2035
2036
2037
2038
2039
2040
FIGURE B1 Investment need and current trends in Africa 2015 US$ billions
Source GHI and Oxford Economics 2018
TABLE B1 Projected infrastructure investment and gaps among African countries 2018ndash40 2015 prices
COUNTRY
Angola
Benin
INFRASTRUCTURE INVESTMENT USD BILLIONS
$2514
$199
INFRASTRUCTURE INVESTMENT GAP USD BILLIONS
$920
$134
DIFFERENCE BETWEEN INVESTMENT NEED AND INVESTMENT FORECAST
37
67
Cote dIvoire $614 $129 21
Egypt
Ethiopia
Ghana
$4186
$4215
$685
$2182
$1467
$421
52
35
61
Guinea $167 $140 84
Kenya
Morocco
$1742
$1967
$371
$348
21
18
Nigeria
Rwanda
$6168
$295
$2103
$96
34
33
Senegal
South Africa
$578
$2696
$181
$1442
31
53
Tanzania $1943 $1095 56
Tunisia $502 $206 41
Source GHI and Oxford Economics 2018
52
How accountants can bridge the global infrastructure gap | Appendix B
B2 AMERICASIn 2018 it was anticipated that an estimated US$4771bn would be spent oninfrastructure in the Americas In the sameyear investment need was forecast to be 38 higher at US$6570bn and over the full 2018 to 2040 period the infrastructure investment gap is expected to grow to US$6126 trillion This implies that infrastructure need will be 48 higher than actual investment over the period given the current trend in the Americas
12
1
08
06
04
02
0
Investment need Current trends
2007
2008
2009
2010
2011
2012
2013
2014
2015
2016
2017
2018
2019
2020
2021
2022
2023
2024
2025
2026
2027
2028
2029
2030
2031
2032
2033
2034
2035
2036
2037
2038
2039
2040
FIGURE B2 Investment need and current trends in the America 2015 US$ trillions 2018ndash40
Source GHI and Oxford Economics 2018
TABLE B2 Projected infrastructure investment and gaps among nations in the Americas 2018ndash40 2015 prices
COUNTRY
Argentina
Brazil
INFRASTRUCTURE INVESTMENT USD BILLIONS
$4220
$14207
INFRASTRUCTURE INVESTMENT GAP USD BILLIONS
$3392
$11266
DIFFERENCE BETWEEN INVESTMENT NEED AND INVESTMENT FORECAST
80
79
Canada $11243 $194 2
Chile $1978 $499 25
Colombia $2231 $949 43
Ecuador $743 $523 70
Mexico $4874 $5153 106
Paraguay
Peru
$546
$3072
$165
$675
30
22
US $79637 $36089 45
Uruguay $458 $91 20
Source GHI and Oxford Economics 2018
53
How accountants can bridge the global infrastructure gap | Appendix B
B3 ASIAAmong all nations the top four countries by investment need (China India Japan and the US) account for over half of global need three of these countries are found in Asia Despite this the infrastructure gap is lower in percentage terms across Asia than the other regions and across the 2018 to 2040 period Asian countries would need to increase spending by around 10 to meet their projected investment need The sheer size of the continent means that while relatively small as a proportion of current spending this level of underinvestment creates an infrastructure investment gap of US$43 trillion over the same period
30
25
20
15
10
05
0
Investment need Current trends
2007
2008
2009
2010
2011
2012
2013
2014
2015
2016
2017
2018
2019
2020
2021
2022
2023
2024
2025
2026
2027
2028
2029
2030
2031
2032
2033
2034
2035
2036
2037
2038
2039
2040
FIGURE B3 Investment need and current trends in Asia 2015 US$ trillions 2018ndash40
Source GHI and Oxford Economics 2018
TABLE B3 Projected infrastructure investment and gaps among Asian countries 2018ndash40 2015 prices
COUNTRY
Azerbaijan
Bangladesh
Cambodia
INFRASTRUCTURE INVESTMENT USD BILLIONS
$862
$3931
$560
INFRASTRUCTURE INVESTMENT GAP USD BILLIONS
$76
$1821
$266
DIFFERENCE BETWEEN INVESTMENT NEED AND INVESTMENT FORECAST
9
46
48
China $248858 $18307 7
India $37045 $4995 13
Indonesia $15445 $667 4
Kazakhstan $1955 $792 41
Japan
Jordan
$34810
$591
$868
$168
2
29
Malaysia
Myanmar
Pakistan
$3588
$1050
$3351
$725
$1064
$1179
20
101
35
Philippines
Saudi Arabia
$4031
$4654
$653
$1089
16
23
Singapore
South Korea
$878
$12767
$03
$386
0
3
Thailand $3677 $950 26
Turkey
Vietnam
$5328
$4741
$3841
$968
72
20
Source GHI and Oxford Economics 2018
08
07
06
05
04
03
02
01
0
Investment need Current trends
2007
2008
2009
2010
2011
2012
2013
2014
2015
2016
2017
2018
2019
2020
2021
2022
2023
2024
2025
2026
2027
2028
2029
2030
2031
2032
2033
2034
2035
2036
2037
2038
2039
2040
54
How accountants can bridge the global infrastructure gap | Appendix B
B4 EUROPETotal spending on infrastructure in Europe was forecast to be US$457bn in 2018 in contrast to a projected requirement of US$512bn This investment gap of 11 is projected to grow to US$189 trillion or 16 of the total infrastructure investment needed over the period 2018ndash40
FIGURE B4 Investment need and current trends in Europe 2015 US$ trillions 2018ndash40
Source GHI and Oxford Economics 2018
TABLE B4 Projected infrastructure investment and gaps among European countries 2018ndash40 2015 prices
COUNTRY
Croatia
INFRASTRUCTURE INVESTMENT USD BILLIONS
$591
INFRASTRUCTURE INVESTMENT GAP USD BILLIONS
$101
DIFFERENCE BETWEEN INVESTMENT NEED AND INVESTMENT FORECAST
17
France $16823 $96 1
Germany
Italy
Poland
$13544
$11449
$5143
$07
$3530
$865
0
31
17
Romania $2103 $104 5
Russia $9887 $6892 70
Spain
UK
$9977
$15496
$538
$1403
5
9
Source GHI and Oxford Economics 2018
55
How accountants can bridge the global infrastructure gap | Appendix B
B5 OCEANIADespite the large area covered by the Oceania continental region its relatively small population means the total infrastructure investment need is less thanfor the other regions A further US$18 trillion total spending is likely to be required between 2018 and 2040 although on current trends a shortfall of US$171bn is forecast to emerge over the same period This would represent an infrastructure gap of 10
120
100
80
60
40
20
0
Investment need Current trends
2007
2008
2009
2010
2011
2012
2013
2014
2015
2016
2017
2018
2019
2020
2021
2022
2023
2024
2025
2026
2027
2028
2029
2030
2031
2032
2033
2034
2035
2036
2037
2038
2039
2040
FIGURE B5 Investment need and current trends in Oceania 2015 US$ billions 2018ndash40
Source GHI and Oxford Economics 2018
TABLE B5 Projected infrastructure investment and gaps among countries in Oceania 2018ndash40 2015 prices
COUNTRY INFRASTRUCTURE INVESTMENT USD BILLIONS
INFRASTRUCTURE INVESTMENT GAP USD BILLIONS
DIFFERENCE BETWEEN INVESTMENT NEED AND INVESTMENT FORECAST
Australia $14462 $1499 10
New Zealand $1522 $166 11
Source GHI and Oxford Economics 2018
56
How accountants can bridge the global infrastructure gap | Appendix B
B6 ADDITIONAL INFRASTRUCTURE SERVICE GAP FIGURES BY WORLD REGIONThe following charts compare the views of finance professionals on the remaining four sub-types of infrastructure not included in the main report water and sanitation other transport (eg ports and airports) railways and core public infrastructure (eg hospitals and schools)
Source The Global Infrastructure Gap survey specialist respondents only n 1966
FIGURE B6 Infrastructure quality ndash water and sanitation
North America
100
80
60
40
20
0
n Dont know n Very good n Good n Neutral n Poor n Very poor
Middle East Asia Pacific Central and Eastern Europe
South Asia Western Europe Africa Caribbean Total
Source The Global Infrastructure Gap survey specialist respondents only n 1966
FIGURE B7 Infrastructure quality ndash other transport
North America
100
80
60
40
20
0
n Dont know n Very good n Good n Neutral n Poor n Very poor
Middle East Asia Pacific Central and Eastern Europe
South Asia Western Europe Africa Caribbean Total
57
How accountants can bridge the global infrastructure gap | Appendix B
FIGURE B8 Infrastructure quality ndash railways
FIGURE B9 Infrastructure quality ndash core public service infrastructure
Source The Global Infrastructure Gap survey specialist respondents only n 1966
North America
100
80
60
40
20
0
n Dont know n Very good n Good n Neutral n Poor n Very poor
Middle East Asia Pacific Central and Eastern Europe
South Asia Western Europe Africa Caribbean Total
Source The Global Infrastructure Gap survey specialist respondents only n 1966
North America
100
80
60
40
20
0
n Dont know n Very good n Good n Neutral n Poor n Very poor
Middle East Asia Pacific Central and Eastern Europe
South Asia Western Europe Africa Caribbean Total
Appendix C The Global Infrastructure Gap Survey and Roundtable Discussion Guide
MEMBER SURVEY
Q1 What is your current employment status Full-time or part-time an accounting or finance role Full-time or part-time work in a non-accounting role Not currently in employment Self-employed Retired
Response treated as lsquogeneralistrsquo
Q2 [If employed]In which sector do you work Please tick the one box that best fits your sector Big Four accounting firm Corporate sector - small medium sized Corporate sector ndash large Financial services - small medium sized Financial services ndash large Mid-tier accounting firm Not-for-profit Other international accounting firm Public sector Small or medium-sized practice (SMP) Other (please specify)
Q3 [If employed]Does your work involve any of the following
Infrastructure policy Procurement Capital budgeting Project management or Operations management
Yes (respondent categorised as a lsquospecialistrsquo) No (respondent categorised as a lsquogeneralistrsquo)
Q4 How would you describe the quality of each type of infrastructure in the country where you live Power and energy Water and sanitation Roads and highways Railways Other transport (eg air and sea)
Information and communication technology (eg internet access and mobile service)
Core public service infrastructure (eg hospitals schools emergency services)
Scale 1 ndash Very poor 2 ndash Poor
4 ndash Good 5 ndash Very good Donrsquot know
Q5 What are the biggest barriers in meeting the infrastructure needs in your country Lack of finance andor funding Lack of political leadership Skills and talent shortage Planning and regulatory barriers Corruption Lack of competition Other please specify None
Q6a [To generalists]Over the next 5 years do you feel the infrastructure in your country will Significantly deteriorate Deteriorate Remain the same Improve Significantly improve Donrsquot know
Q6b [To specialists]Over the next 5 years do you feel that each of these types of infrastructure in your country will Power and energy Water and sanitation Roads and highways Railways Other transport (eg air and sea)
Information and communication technology (eg internet access and mobile service)
Core public service infrastructure (eg hospitals schools emergency services)
Scale Significantly deteriorate Deteriorate Remain the same Improve Significantly improve Donrsquot know
Q7 Do you feel the government selects projects that provide the most value to the taxpayer Never Infrequently Sometimes Frequently Always Dont know
58
3
How accountants can bridge the global infrastructure gap | Appendix C
Q8 Which of the following do you feel the government in your country should prioritise to make the best decisions when selecting infrastructure projects Please select up to five which you feel are the most important and rank them by order of importance Please drag and drop your selections from the left box to the right box and order with most important at the top and least at the bottom
Adhering to global accounting standards
Removing political decision-making making the process technocratic (ie decisions by experts)
Putting in place mechanisms to reduce corruption
Moving government accounts from cash to accrual accounting
Bringing OOBs (Obligations Off Balance-Sheet) onto government balance sheets
Quantifying the total life-cycle costs of potential projects
Spending more resource to evaluate projects after completion
Applying standard assessment tools to evaluate projects during selection
Transferring project selection powers to more local levels of government (ie devolution)
Other please specify
Q8a [To CPA Canada respondents only]How important is it that infrastructure planning include the following sustainability considerations Efficient use of energy including where appropriate renewable sources of energy
Adapting to the impacts of a changing climate such as severe weather events
Minimizing environmental impacts on the surrounding community by for example locating near accessible public transit
Reducing or eliminating the production of waste hazardous by-products or other environmental externalities
Assessing the potential of and taking every reasonable step to reduce or eliminate the likelihood of an environmental accident (such as a pipeline spill for example)
Scale 1 - Not important at all 2- Not very important
4 - Quite important 5- Very important 6 - Donrsquot know
Q9a [To generalists]How should infrastructure be financed in your country Entirely public finance Mostly public finance Even mix of public and private finance Mostly private finance Entirely private finance Dont know no opinion
Q9b [To specialists]How should infrastructure be financed in your country (eg a sovereign wealth fund provides the money upfront to build a road) Power and energy Water and sanitation Roads and highways Railways Other transport (eg air and sea)
Information and communication technology (eg internet access and mobile service)
Core public service infrastructure (eg hospitals schools emergency services)
Scale Entirely public finance Mostly public finance Even mix of public and private finance Mostly private finance Entirely private finance Dont know no opinion
Q10 What are your views on the role of foreign direct investment in building and maintaining infrastructure in your country Very concerned Some concern Neutral Positive Very positive Dont know
Q11 What are the key challenges that the government faces in securing private finance Select all that apply Too few viable projects for private investment Regulatory barriers Perceived political instability in my country Underdeveloped financial markets in my country Insufficient skills in government to negotiate with the private sector Negative perception of private finance for public infrastructure Lack of attractiveness of infrastructure investment Dont know Other please specify
Q12a [Asked of those working in Public sector]Where do you feel the private sector particularly adds value in delivering infrastructure projects in your country Select all that apply Knowledge of best practice and expertise
Applying innovative practices and fresh thinking
Delivering projects on time
Keeping projects to budget
Access to private capital
Transferring the risks of delivering infrastructure projects from the public sector to the private sector
None of these
Donrsquot know
59
3
How accountants can bridge the global infrastructure gap | Appendix C
Q12b [Asked of those working in Private sector]Where do you feel the public sector particularly adds value in delivering infrastructure projects in your country Select all that apply Access to projects that provide stable low risk returns Knowledge of how the public sector works Long-term and stable partnership Knowledge of best practice and expertise Applying innovative practices and fresh thinking None of these Donrsquot know
Q13a [Asked of those working in Public sector]Where do you feel the private sector receives value from the public sector in delivering infrastructure projects in your country Select all that apply Access to projects that provide stable low risk returns Knowledge of how the public sector works Long-term and stable partnership Knowledge of best practice and expertise Applying innovative practices and fresh thinking None of these Donrsquot know
Q13b [Asked of those working in Private sector]Where do you feel the public sector receives value from the private sector in delivering infrastructure projects in your country Select all that apply Knowledge of best practice and expertise
Applying innovative practices and fresh thinking
Delivering projects on time
Keeping projects to budget
Access to private capital
Transferring the risks of delivering infrastructure projects from the publicsector to the private sector
None of these
Donrsquot know
Q14 Where are you primarily based [Dropdown list]
Q15 What best describes your gender identity Female Male Prefer not to say Prefer to self-describe
ROUNDTABLE DISCUSSION 1) Understanding the infrastructure gap
a) Whatrsquos the current quality of infrastructure in your country
i Why is it like this
b) How is your business or organization affected by the current quality of infrastructure in your country Please provide examples
2) How accountants can make a difference c) In your experience where do you see accountants making the
greatest difference in delivering infrastructure in your country Please give examples where possible
d) Do you feel that your country has particular good practices in meeting infrastructure need
3) Selecting projects e) How often do you t hink governments select the right projects in
your country
f) What should governments consider when making decisions about infrastructure
4) Financing projects g) Which types of infrastructure are appropriate for private finance
or operation [ie energy water roads railways other transport information and communication technology core public service infrastructure]
i Which ones are more suited to private finance
ii Private operation
h) What do you think about foreign direct investment (FDI) building new infrastructure in your country
5) Interface of public and private i) What skills do governments need to effectively negotiate
contracts with the private sector
i Are any of these skills absent
j) When t he public and private sectors partner to complete and operate infrastructure (for example through a Public-Private Partnership)
i What does the private sector add to the partnership
ii What does the public sector add to the partnership
6) Final k) Over the next 5 years do you think the infrastructure in your
country will improve stay the same or deteriorate
i Why is t hat the case What are the key challenges in meeting the infrastructure needs in your country over the next 5 years
60
References
ACCA (2016) Smarter Cities Simpler Cities Accounting for the City of the Future Spotlight on India lthttpswwwaccaglobalcomcontentdamACCA_GlobalTechnicalFuturepi-smarter-cities-simpler-citiespdf
gt
accessed 4 February 2019
ACCA (2017) Professional Accountants ndash the Future Ethics and Trust in a Digital Age lthttpswwwaccaglobalcomcontentdamACCA_Global TechnicalFuturepi-ethics-trust-digital-agepdfgt accessed 5 February 2019
Atkins G Davies N and Kidney Bishop T (2017) Public versus Private How to Pick the Best Infrastructure Finance Option lthttpswww instituteforgovernmentorguksitesdefaultfilespublicationsInstitute_for_ Government_Infrastructure_Finance_Option_Public_Private_ November_2017_Web_Finalpdfgt accessed 5 February 2019
British Broadcasting Corporation (2015) Spains Ciudad Real airport sold at auction for euro10000 [online article] lthttpswwwbbccouknewsworldshyeurope-33578949gt accessed 6 February
Catapult Future Cities (2017) Civic Crowdfunding A Guidebook for Local Authorities lthttpsfuturecitiescatapultorgukwp-content uploads201703Civic-guidebook-pdfgt accessed 5 February 2019
Central Intelligence Agency (2019) The World Factbook lthttpswwwciagovlibrarypublicationsthe-world-factbook
gt access 7 February 2019
Chartered Institute of Purchasing and Supply (2013) Written evidence submitted by CIPS to the Public Administration Select Committee lthttps publicationsparliamentukpacm201314cmselectcmpubadm123123vw12 htmgt accessed 5 February 2019
Chartered Professional Accountants of Canada (2016) Adaptation Case Study 6 City of Montreal lthttpswwwcpacanadacaenbusiness-and-accountingshyresourcesother-general-business-topicssustainabilitypublications montreal-adapting-to-climate-changegt accessed 5 February 2019
Detter D and Folster S (2017) The Public Wealth of Cities How to Unlock Hidden Assets to Boost Growth and Prosperity (Brookings Institution Press)
Eriksson PE and Lind H (2015) Moral Hazard and Construction Procurement A Conceptual Framework lthttpswwwdiva-portalorgsmashgetdiva2783674FULLTEXT01pdf
gt accessed 5 February 2019
European Commission (2017) Communication from the Commission The Fiscal Compact ndash Taking Stock lthttpseceuropaeuinfopublications fiscal-compact-taking-stock_engt accessed 5 February 2019
Eurostat (2018) lsquoLiabilities Related to PPPs Recorded Off-Balance Sheet of Governmentrsquo downloadable from lthttpsdataeuropaeueuodpendata datasetZxMF0OGutCyj7pgQJdtaiwgt accessed 5 February 2019
Fages R Beardsley B Bromstrup I Donnadieu H Maceacute B Pardasani N Schmitz L Sheridan BTaglioni G and Xu Q (2018) Global Asset Management 2018 The Digital Metamorphosis lthttpswwwbcgcom en-gbpublications2018global-asset-management-2018-digitalshymetamorphosisaspxgt accessed 5 February 2019
Fay M Andres LA Fox C Narloch U Straub S and Slawson M (2017) Rethinking Infrastructure in Latin America and the Caribbean 2017 lthttps openknowledgeworldbankorgbitstreamhandle1098626390114110shyREVISED-PUBLIC-RethinkingInfrastructureFullpdfgt accessed 5 February 2019
Flyvbjerg B (2018) Oxford Handbook of Megaproject Management (Oxford Oxford University Press)
GHI (Global infrastructure Hub) and Oxford Economics (2018) Global Infrastructure Outlook Downloadable from lthttpsoutlookgihuborggt accessed 4 February 2019
Government of New Zealand (2018) lsquoHe Puna Hao Patiki 2018 Investment Statementrsquo lthttpstreasurygovtnzpublicationsinvestment-statementhe-puna-hao-patiki-2018-investment-statement-html
gt accessed 5
February 2019
ICAS (Institute of Chartered Accountants of Scotland) (2012) A Professional Judgement for Financial Reporting lthttpswwwicascomtechnicalshyresourcesa-professional-judgement-framework-for-financial-reportinggt accessed 6 February 2019
IFAC and CIPFA (2018) International Public Sector Financial Accountability Index lthttpswwwifacorgsystemfilesuploadsIFACIFAC-CIPFA-PublicshySector-Index-2018-Statuspdfgt accessed 5 February 2019
IJ Global (2018) H1 Infrastructure and Project Finance League Table Report lthttpsijglobalcomuploadsH120201820League20Tables20Report pdfgt accessed 5 February 2019
IMF (International Monetary Fund) (2018) Fiscal Monitor Managing Public Wealth downloadable from lthttpswwwimforgenPublicationsFM Issues20181004fiscal-monitor-october-2018gt accessed 5 February
Institute for Government (2018) lsquoFunding Infrastructurersquo [webpage] lthttps wwwinstituteforgovernmentorgukexplainersfunding-infrastructuregt accessed 5 February 2019
International Transport Forum (2017) Strategic Infrastructure Planning International Best Practice lthttpsassetspublishingservicegovuk governmentuploadssystemuploadsattachment_datafile601897Strategic_Infrastructure_FINAL_for_web_v2pdf
gt accessed 4 February
KPMG (2013) Elevating Professional Judgment in Auditing and Accounting The KPMG Professional Judgment Framework lthttpwwwdrlilliecom a544kpmgjdgmtKPMG_ProfJudgment_Monographpdfgt accessed 6 February 2019
Leong L (2016) lsquoThe ldquoRail plus Propertyrdquo Model Hong Kongrsquos Successful Self-financing Formularsquo [website article] lthttpswwwmckinseycom industriescapital-projects-and-infrastructureour-insightsthe-rail-plusshyproperty-modelgt accessed 5 February 2019
Mann H (2018) lsquoThe High Cost of lsquoDe-Riskingrsquo Infrastructure Financersquo [website article] lthttpswwwproject-syndicateorgcommentaryworldshybank-ppp-de-risking-by-howard-mann-2018-12gt accessed 5 February 2019
Marcelo D Mandri-Perrott C House S and Schwartz JZ (2016) An Alternative Approach to Project Selection The Infrastructure Prioritization Framework lthttppubdocsworldbankorgen84463146187466270016-04shy23-Infrastructure-Prioritization-Framework-Final-Versionpdfgt accessed 4 February 2019
MGI (McKinsey Global Institute) (2013) Infrastructure productivity How to save $1 trillion a year lthttpswwwmckinseycomindustriescapital-projectsshyand-infrastructureour-insightsinfrastructure-productivitygt accessed 6 February 2019
MGI (2016) Bridging Global Infrastructure Gaps lthttpswwwmckinsey com~mediaMcKinseyIndustriesCapital20Projects20and20 InfrastructureOur20InsightsBridging20global20infrastructure20gaps Bridging-Global-Infrastructure-Gaps-Full-report-June-2016ashxgt accessed 4 February 2019
Morse A (2018) PFI and PF2 Report by the Comptroller and Auditor General lthttpswwwnaoorgukwp-contentuploads201801PFI-and-PF2pdf
gt accessed 5 February 2019
61
How accountants can bridge the global infrastructure gap | References
MTR Corporation (2017) Annual Report 2017 Ten-Year Statistics lthttps wwwmtrcomhkarchivecorporateeninvestor10yr_stat_enpdfgt accessed 5 February 2019
NHS Scotland (2018) NHS Scotland Assets and Facilities 2017 Annual Report lthttpswwwgovscotpublicationsannual-state-nhsscotland-assetsshyfacilities-report-2017gt accessed 5 February 2019
NIC (National Infrastructure Commission) (2018) National Infrastructure Assessment lthttpswwwnicorgukwp-contentuploadsCCS001_ CCS0618917350-001_NIC-NIA_Accessiblepdfgt accessed 4 February 2019
OrsquoDowling-Keane A (2017) lsquoSadiq Khan Joins Crowd of Thousands with pound400000 in Backing for Londonersrsquo Local Project Ideasrsquo [website article] lthttpsaboutspacehivecomsadiq-khan-joins-crowd-of-thousands-withshy400000-in-backing-for-londoners-local-project-ideasgt accessed 5 February
OECD (Organisation for Economic Cooperation and Development) (2019) Databank tax revenue lthttpsdataoecdorgtaxtax-revenuehtmgt government debt lthttpsdataoecdorgggageneral-government-debt htmgt accessed 7 February 2019
Plimmer G (2018) lsquoDeath Knell Sounded for PFI Contractsrsquo [online article] Financial Times lthttpswwwftcomcontent55eb374e-dba5-11e8-8f50shycbae5495d92bgt accessed 6 February
Project Management Institute (2017) Guide to Project Management Book of Knowledge lthttpswwwpmiorgpmbok-guide-standardsfoundational pmbokgt accessed 4 February 2019
Schwab K (2018) Global Competitiveness Report lthttpwww3weforum orgdocsGCR201805FullReportTheGlobalCompetitivenessReport2018 pdfgt accessed 5 February 2019
Spacehive (2019) lsquoMake Your Local Area Betterrsquo [website] lthttpswww spacehivecomgt accessed 5 February 2019
UK Government (2017) UK Guarantees Scheme Guidance lthttpswwwgov ukguidanceuk-guarantees-schemegt accessed 5 February 2019
World Bank (2018a) Private Participation in Infrastructure Annual Report 2017 lthttpppiworldbankorg~mediaGIAWBPPIDocuments Global-NotesPPI_2017_AnnualReportpdfgt
World Bank (2018b) Procuring Infrastructure Public-Private Partnerships Report downloadable from lthttpspppknowledgelaborg documents5453gt accessed 5 February 2019
World Bank (2019) World Bank Open Data tax revenue lthttpsdata worldbankorgindicatorGCTAXTOTLGDZSgt government debt lthttpsdataworldbankorgindicatorGCDODTOTLGDZSgt accessed 7 February 2019
62
18002683793 wwwcpacanadaca
PI-GLOBAL-INFRASTRUCTURE-GAP
DISCLAIMER This paper was prepared by the Association of Chartered Certified Accountants (ACCA) and Chartered Professional Accountants of Canada (CPA Canada) as non-authoritative guidance
ACCA CPA Canada and the authors do not accept any responsibility or liability that might occur directly or indirectly as a consequence of the use application or reliance of this material
ACCA The Adelphi 111 John Adam Street London WC2N 6AU United Kingdom +44 (0)20 7059 5000 wwwaccaglobalcom
CPA Canada 277 Wellington St West Toronto Ontario Canada M5V 3H2
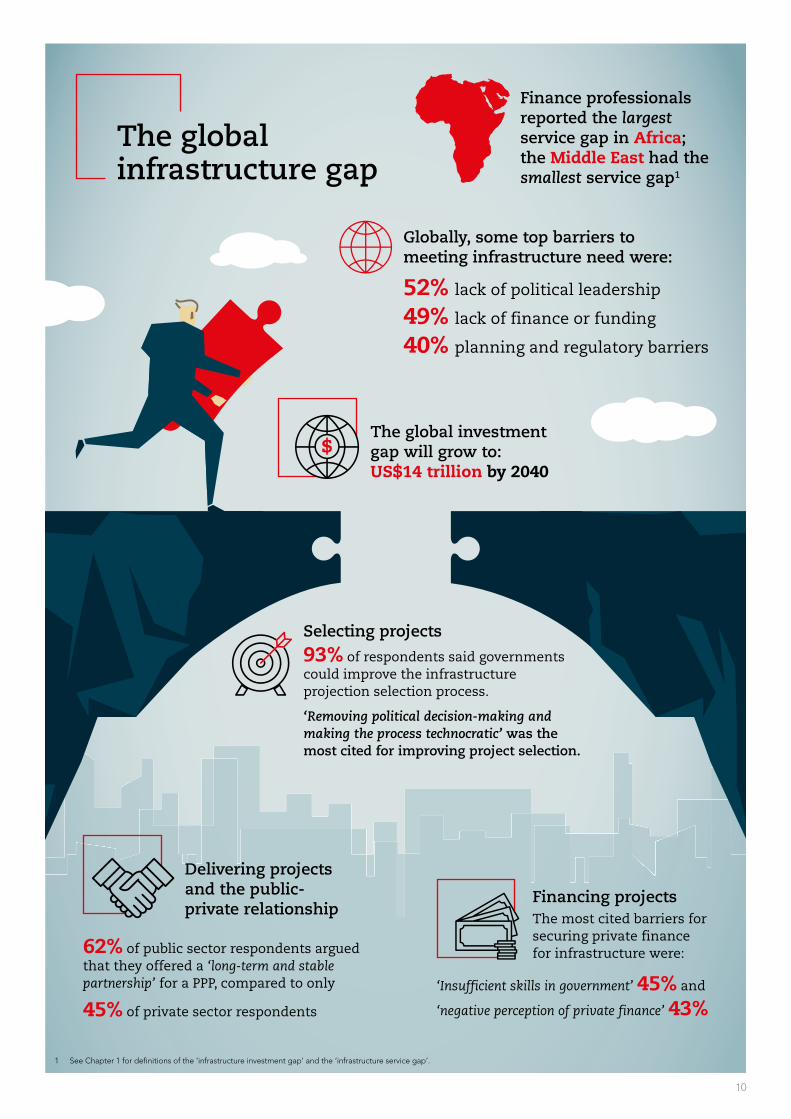
10
The global infrastructure gap
1 See Chapter 1 for definitions of the lsquoinfrastructure investment gaprsquo and the lsquoinfrastructure service gaprsquo
Globally some top barriers to meeting infrastructure need were
52 lack of political leadership
49 lack of finance or funding
40 planning and regulatory barriers
Finance professionals reported the largest service gap in Africa the Middle East had the smallest service gap1
The global investment gap will grow to US$14 trillion by 2040
Selecting projects
93 of respondents said governments could improve the infrastructure projection selection process
lsquoRemoving political decision-making and making the process technocraticrsquo was the most cited for improving project selection
Delivering projects and the public-private relationship
62 of public sector respondents arguedthat they offered a lsquolong-term and stable partnershiprsquo for a PPP compared to only
45 of private sector respondents
Financing projectsThe most cited barriers for securing private finance for infrastructure were
lsquoInsufficient skills in governmentrsquo 45 and
lsquonegative perception of private financersquo 43
11
Introduction
Infrastructure is critical for economic and social development across the world Physical infrastructure systems ensure that basic human needs are met people need access to energy to light and heat their homes and safe water for drinking sanitation and cooking Transport infrastructure allows people to travel to work and transport goods to different markets
In these and many other ways infrastructure is vital to social and economic activity and development ndash and its provision is intrinsically tied to achieving the United Nationrsquos Sustainable Development Goals to address global challenges such as poverty inequality climate change and environmental degradation and to achieve a better and more sustainable future for all There is also a unique opportunity for governments to respond to the global infrastructure gap challenge The anaemic economic growth following the 2008 financial crisis and the sustained low-interest rate environment means that the cost of increased investment has rarely been lower for governments and the prize is sustainable economic growth a sustained boost to productivity and improved living standards
But execution matters and there are many examples of infrastructure projects that have gone badly wrong Design failures can cause the death of workers as in the case of the Chirajara bridge collapse in Colombia in 2018 poor demand forecasting and design can result in significant infrastructure investments being underused such as the Ciudad Real Airport in Spain which remains abandoned after a construction cost in excess of 1bn euros (BBC 2015)
In addition the collapse of the Morandi Bridge in Genoa Italy demonstrated that to avoid disaster governments must allocate sufficient resources to the maintenance of existing infrastructure fighting the bias towards focusing resources on new-build projects
Finally cases of natural disaster ndash such as the flooding in Bangkok Thailand in 2011 ndash are becoming increasingly common and future infrastructure projects must be adaptable and resilient to enable countries to meet the threats of climate change
Therefore the successful provision of public infrastructure requires governments to have the right professional team in place to be able to harness the benefits of additional investment while working to mitigate the significant risks associated with infrastructure projects The accountant must be brought to the centre of the decision-making process on the selection financing building and operation of infrastructure where the finance professionalrsquos particular skills and perspective can mean the difference between success and failure
Research methodology
How accountants can bridge the global infrastructure gap Improving outcomes across the entire project life cycle report is the result of a joint research project conducted by ACCA and CPA Canada The research objective of this study was to quantify and explain the nature of the global infrastructure gap and explore how professional accountants can contribute to bridging the gap through improvements in the selection financing and delivery of projects
The report encompasses the collection of economic research country-specific narratives and best practices in building and maintaining infrastructure ndash from project selection to completion and evaluation The results and observations that were arrived at are supported by evidence collected through the following mechanisms
bull quantifying the cumulative global infrastructure investment gap to 2040 through desktop research
bull a global online survey of a random sample of ACCA members and CPA Canada members
bull a desktop literature review of specialist publications to determine leading practices
bull in-person roundtable discussions held with experts from four continents
How these four areas were developed is detailed below
ECONOMIC ANALYSIS A quantitative approach was followed for the review of the G20 Global Infrastructure Hubrsquos Global Infrastructure Outlook report (GHI and Oxford Economics 2018) This report uses economic forecasting to quantify the cumulative global infrastructure gap up to 2040 Chapter 1 lsquoQuantifying the Global Infrastructure Gaprsquo provides some detail on the quantification of the investment gap and articulates the challenge for this report More information on the methodology of the economic analysis can be found in Appendix A
GLOBAL SURVEY AND DEMOGRAPHICS ACCA and CPA Canada jointly undertook a survey of a random sample of each bodyrsquos membership This survey used the perspectives of finance professionals to illuminate the nature of the global infrastructure gap highlight the barriers to closing the gap and clarify the diverging expectations of public- and private-sector actors in the use of publicndash
private partnerships (PPPs) in infrastructure projects A copy of the survey is available in Appendix C
The survey design and administration were consistent across both bodies except for the addition of one question on infrastructure planning and sustainability considerations in the CPA Canada survey Therefore unless otherwise specified all survey results cited in the report present the combined output from the CPA Canada and ACCA waves of the survey The ACCA survey was in the field for two weeks in August 2018 and the CPA Canada survey for two weeks in October 2018
Survey demographics The combined total of survey respondents was 3611 across 1182
countries Geographic splits in the survey data typically present output by world region Every world region had at least 150 responses except for South America which is excluded from any figure showing results by geography Finally the
2 Six respondents gave lsquoOtherrsquo for their country of residence thus it is not possible to identify whether they lived in the 118 countries or elsewhere
12
Overall more than one-in-three respondents (35) worked in the corporate sector while about 20 worked in the public or not-for-profit sectors
joint survey (lsquothe member surveyrsquo) split respondents into two primary categories lsquogeneralistsrsquo and lsquospecialistsrsquo where specialist respondents stated that their work included at least one of the following areas infrastructure policy procurement capital budgeting project or operations management Of the total sample 1966 respondents (54) were categorised as specialists The survey included a number of detailed technical questions which were asked only of specialists Figures throughout the report clearly indicate which subset of respondents (generalists or specialists) answered a particular question
The member survey includes the views of accountants working across all sectors including respondents from accountancy firms the corporate sector and the public sector Overall more than one-in-three respondents (35) worked in the corporate sector while about 20 worked in the public or not-for-profit sectors
LITERATURE REVIEWA detailed review of specialised literature on infrastructure projects globally was conducted This review demonstrated the variety of methodologies used globally in quantifying the infrastructure gap as well as providing a summary of leading practices in infrastructure planning project selection and public financing that help support the effective delivery of innovative and sustainable infrastructure policy
The References section includes the reviewed literature
IN-PERSON ROUNDTABLE DISCUSSIONSFinally roundtable discussions were conducted with ACCA members and CPA Canada members in the UK Canada Sri Lanka Nigeria Trinidad amp Tobago Jamaica and Malaysia and focused on country-specific infrastructure challenges and solutions to show the international variation in infrastructure need as well as highlighting what skills and perspectives accountants employ to help address the global infrastructure gap
The roundtable discussions offered stakeholders an opportunity to share their insights and experiences on the current challenges to closing the global infrastructure gap and their perspectives and experiences in the provision of infrastructure In addition the roundtables offered participants an opportunity to reflect on best practices with their peers
Together the literature review and roundtable discussions have provided evidence of the essential role accountants can play in helping to shrink the global infrastructure gap A copy of the roundtable questions is available in Appendix C
ACCA and CPA Canada would like to thank the Centre for Business and Economics Research (Cebr) an economic consultancy based in the UK for completing the economic analysis quantifying the global infrastructure investment gap
13
How accountants can bridge the global infrastructure gap | Research methodology
FIGURE 2 Sector breakdown of The Global Infrastructure Gap survey
20
18
16
14
12
10
8
6
4
2
0Big Four
accounting firm
Corporate sector ndash small medium sized
Corporate sector ndash
large
Financial services ndash smallmedium sized
Financial services ndash
large
Mid-tier accounting
firm
Not-for-profit Other international
accounting firm
Public sector Small medium sized practice (SMP)
Other
Source The Global Infrastructure Gap survey all respondents n 3611
14
1 Defining the challenge Quantifying the global infrastructure gap
Defining the global infrastructure gap qualitatively is relatively simple the term is generally understood to denote the difference between required infrastructure and existing infrastructure Defining the current global infrastructure gap quantitatively however is more complex (MGI 2016) There are a variety of methods used internationally to measure the infrastructure gap
Reports by the McKinsey Global Institute (MGI 2013 and 2016) on the global infrastructure gap estimate that the world will need to invest US$33 trillion annually in infrastructure to support the needs resulting from projected economic growth The MGI methodology is highly sensitive to variations in economic growth since the forecasted investment gap is based on maintaining the ratio of infrastructure stock to a countryrsquos gross domestic product (GDP) But assessing infrastructure need as a constant share of a countryrsquos GDP is a rather crude measure that could result in erroneous conclusions For example assume a country spends the same amount on infrastructure but boosts GDP through greater efficiency in the allocation of those investment resources This would show as an increase in the infrastructure investment gap under the MGI approach (ie infrastructure spending would fall as a percentage of GDP) when in fact the efficiency gains would actually reduce the gap
In working to improve infrastructure provision the ultimate focus for any government should be minimising a recognised service gap not reducing a notional investment gap ndash addressing a countryrsquos particular economic social and environmental objectives (Fay et al 2017) The roundtable discussion in Canada a country with a negligible investment gap highlighted the misalignment between infrastructure investment decisions and the actual service needs of the country something that had been particularly challenging in First Nations communities In short this global challenge cannot be solved only by spending more money but also by spending better ndash ensuring that all spending is targeted on real needs At the same time it is not possible to categorise effectively on a global scale all the national objectives underpinning the goal of closing service gaps
Therefore this report offers two approaches to the global infrastructure gap the infrastructure investment gap and
the infrastructure service gap The first relies on a dataset produced by the G20rsquos Global Infrastructure Hub and sets an aspirational metric which is benchmarked against a countyrsquos peers (GHI and Oxford Economics 2018) This quantified infrastructure investment gap shows what investment would be required for a particular country to move to the top 25th percentile of the peers in its income group This works as an effective benchmark where a countryrsquos gap can be closed over time The second approach relies on the views of the specialist respondents to the member survey The quality of infrastructure is assessed across seven different subtypes demonstrating where service gaps exist for different world regions The first approach provides a quantified output and aspirational target for countries seeking to meet infrastructure needs and is described below The results of the second approach setting out the service gap can be found in section 14 below lsquoFinance professionalsrsquo perspectives on the global infrastructure servicersquo gap
How accountants can bridge the global infrastructure gap | 1 Defining the challenge Quantifying the global infrastructure gap
Globally the cumulative level of investment required to bring all countries in line with the best performing nations in their income group is estimated to be almost US$88 trillion between 2018 and 20404
11 THE INFRASTRUCTURE INVESTMENT GAP (APPROACH 1) AN ANALYSIS OF THE GLOBAL INVESTMENT OUTLOOK The Global Infrastructure Outlook report (GHI and Oxford Economics 2018) defines infrastructure investment as lsquoGross Fixed Capital Formation (GFCF) by the public and private sectors on fixed immovable assets that support long-term economic growthrsquo This report takes a comprehensive view of countriesrsquo infrastructure needs ndash including the social and economic infrastructure that would be captured under GFCF This comprehensive view is echoed in the survey analysis which covers seven sub-categories of infrastructure power and energy water and sanitation road and highways other transport (eg air and sea) ICT railways and core public service infrastructure (eg hospitals and schools) The research by the G20rsquos Infrastructure Hub estimates the amount of infrastructure investment needed for a diverse set of countries in each year from 2016 until 20403
The Global Infrastructure Outlook report provides historic data from 2007 to 2015 and then projects these forward to 2040 with increased spending only occurring in response to changes in economic and demographic fundamentals The difference between these estimates (ie the amount invested compared with the
amount needed) allows us to calculate the lsquoinfrastructure investment gaprsquo for each country To improve understanding of this global challenge the account below illustrates the size of this infrastructure gap at the global level Further detail on the nature of the infrastructure investment being measured and the methodology used to calculate the gap are explained in Appendix A Regional and national-level analysis of the investment gap can be found in Appendix B
12 QUANTIFYING THE GLOBAL INFRASTRUCTURE INVESTMENT GAP Globally the cumulative level of investment required to bring all countries in line with the best performing nations in their income group is estimated to be almost US$88 trillion between 2018 and 20404 Current trends indicate however that actual investment over the period is likely to undershoot this by US$14 trillion In 2018 alone the global infrastructure gap is US$409bn and will average US$613bn per year over the entire period In order to close this gap total forecast spending would have to increase by 19 over current investment levels In other words for every five US dollars of infrastructure spending forecast across the world by 2040 governments and investors would need to find a further 95 cents in order to bring the global stock of infrastructure up to standard
FIGURE 11 Comparison of different approaches to assessing infrastructure needs
Approach 2
Infrastructure Service Gap
Approach 1
Infrastructure Investment Gap
Notional target (aspirational) quantifiable
Source Global Infrastructure
Outlook
Subjective view of need
Source The Global Infrastructure
Gap survey
3 For further detail please see the technical appendix of the Global Infrastructure Outlook (GHI and Oxford Economics 2018)
4 Figures from the G20 Global Infrastructure Outlook report (GHI and Oxford Economics 2018) are reported in 2015 US$ prices and exchange rates unless otherwise specified
15
16
Quantifying an infrastructure investment gap across world regions provides an aspirational target for governments looking to improve the provision of infrastructure in their country
Between regions and countries there is a wide variation in performance in infrastructure provision and the capability of governments and private investors to meet future needs The capacity of governments to respond to this challenge is discussed further in the next chapter of this report
13 ANALYSIS OF THE GLOBAL INFRASTRUCTURE INVESTMENT GAPQuantifying an infrastructure investment gap across world regions provides an aspirational target for governments looking to improve the provision of infrastructure in their country It highlights global top performers such as Singapore Japan and Canada ndash which can be looked to for good practices5 The investment gap view also reveals global laggards such as Mexico Myanmar and Brazil Countries facing substantial and growing gaps may benefit from looking to their peers for good practice and novel methods of meeting infrastructure needs Subsequent chapters explore how the skills and perspectives of accountants can help close the investment gap Before turning to the role of accountants this report sets out a second method for understanding infrastructure need the infrastructure service gap
How accountants can bridge the global infrastructure gap | 1 Defining the challenge Quantifying the global infrastructure gap
14 FINANCE PROFESSIONALSrsquo PERSPECTIVES ON THE GLOBAL INFRASTRUCTURE SERVICE GAP (APPROACH 2)The Global Infrastructure Outlook report forecasts that the global infrastructure investment gap will reach US$14 trillion by 2040 (GHI and Oxford Economics 2018) This economic analysis sets an aspirational global benchmark for meeting the worldrsquos infrastructure needs At the same time the ultimate objective in fulfilling a countryrsquos infrastructure need is not a notional investment figure rather it is closing a recognised service gap Doing this requires that governments develop a vision of what a country seeks to achieve through the development and maintenance of its infrastructure ACCArsquos previous work on Smart Cities argues that creating a vision for future municipal infrastructure requires a lsquocitizen-led bottom-up approachrsquo based on actual service needs (ACCA 2016) Zia Paton a partner at PricewaterhouseCoopers (PwC) and participant in the roundtable discussion in Trinidad and Tobago cited the countryrsquos lsquoVision 2030rsquo as an excellent framework for setting out the governmentrsquos infrastructure priorities She pointed out that lsquothe plans set out in the Vision 2030 document appear to be
FIGURE 12 Global infrastructure investment need and current trends 2015 US$ trillions
50
45
40
35
30
25
20
15
10
05
0
Investment need Current trends
2007
2008
2009
2010
2011
2012
2013
2014
2015
2016
2017
2018
2019
2020
2021
2022
2023
2024
2025
2026
2027
2028
2029
2030
2031
2032
2033
2034
2035
2036
2037
2038
2039
2040
Source GHI and Oxford Economics 2018
5 See Appendix B for regional- and country-level statistics
17
To supplement the economic analysis that produces the investment gap the joint member survey explored the global infrastructure service gap
exactly what we needrsquo but she sees the real challenge as lsquoconverting that plan into action and aligning it with the various frameworks people and Ministries we have in place execution or implementation is where we tend to have challengesrsquo
The following chapters demonstrate the essential role for the accountancy profession in transforming agreed national visions into a reality through improving project selection (Chapter 3) financing decisions (Chapter 4) and project delivery (Chapter 5) To supplement the economic analysis that produces the investment gap the joint member survey explored the global infrastructure service gap This granular
approach captures the perspective of finance professionals from around the world setting out which particular types of infrastructure are viewed as requiring improvement to meet service needs
Infrastructure service gap by world regionRespondents to the survey were asked to rank the current quality of seven types of infrastructure in their country ndash covering both social and economic infrastructure Breaking down these results by world region demonstrates considerable variation in the current quality of each type of infrastructure Figures 13 14 and 15 show the results for three types of infrastructure power and energy roads and highways and ICT The world regional
How accountants can bridge the global infrastructure gap | 1 Defining the challenge Quantifying the global infrastructure gap
FIGURE 13 Infrastructure quality ndash power and energy
North America
100
80
60
40
20
0
n Dont know n Very good n Good n Neutral n Poor n Very poor
Middle East Asia Pacific Central and Eastern Europe
South Asia Western Europe Africa Caribbean Total
Source The Global Infrastructure Gap survey specialist respondents only n 1966
FIGURE 14 Infrastructure quality ndash roads and highways
North America
100
80
60
40
20
0
n Dont know n Very good n Good n Neutral n Poor n Very poor
Middle East Asia Pacific Central and Eastern Europe
South Asia Western Europe Africa Caribbean Total
Source The Global Infrastructure Gap survey specialist respondents only n 1966
ICT is a unique form of infrastructure that includes significant non-physical components and its provision must anticipate the future needs of the digital economy
breakdowns for water and sanitation railroad and other transport infrastructure (eg sea and air) and core public service infrastructure can be found in Appendix B Figures B6 B7 B8 and B9 By analysing the specialist responses on each type of infrastructure this report offers a view on the global and regional service gaps that exist in the provision of infrastructure
The survey data shows that South Asia lags other world regions in the quality of its power and energy infrastructure with only one in five (20) of finance professionals in that region stating that power and energy provision in their country was good or very good This compares with 65 of global respondents who found the provision of power and energy to be good or better Africa lagged in this area with about one in three (35) of Africarsquos finance professional respondents stating that power and energy provision was very good or good Unsurprisingly 90 of the Middle Eastern respondents saw their power and energy infrastructure as good quality or above ndash with 71 stating that power and energy provision is lsquovery goodrsquo
Central and Eastern European and African respondents were critical of the quality of their road infrastructure ndash with 37 and 46 respectively stating that their roads and highway infrastructure were poor or very poor In comparison a majority of survey respondents in the Middle East North America and Western Europe reported that the provision of
road and highway infrastructure in their countries was of good or very good quality Globally nearly half the finance professionals (49) reported that that the quality of road and highway infrastructure in their countries was good or very good
Globally ICT was seen as the type of infrastructure with the highest quality Clearly ICT is a unique form of infrastructure that includes significant non-physical components and its provision must anticipate the future needs of the digital economy The quality of ICT infrastructure extends beyond initiatives such as the roll-out of ultrafast broadband it includes public sector projects developing robust financial management and information systems to improve public services
Besides significant non-physical components ICT represents a comparatively new priority for many governments The survey shows the African region lagging its peers with only 51 of specialist finance professionals in the region ranking ICT as good or very good compared with the global average of 69 ICT was one of the few infrastructure types to receive a high score in central and Eastern Europe This is understandable because for many countries in this region other types of physical infrastructure such as road and rail were built under the Soviet Union Significant investment in ICT infrastructure around the world occurred
18
How accountants can bridge the global infrastructure gap | 1 Defining the challenge Quantifying the global infrastructure gap
FIGURE 15 Infrastructure quality ndash information and communication technology
Source The Global Infrastructure Gap survey specialist respondents only n 1966
North America
100
80
60
40
20
0
n Dont know n Very good n Good n Neutral n Poor n Very poor
Middle East Asia Pacific Central and Eastern Europe
South Asia Western Europe Africa Caribbean Total
19
Comparing specialistsrsquo perceptions of infrastructure quality by country shows particular service gaps emerging across the types of infrastructure
after the fall of the Soviet Union and many new nation-states in Eastern Europe were able to pursue their own infrastructure investment priorities Certain countries such as Estonia are now seen as world leaders in ICT and the provision of a digital public sector
A comparison of regional infrastructure service gaps arising from the survey dataComparing specialistsrsquo perceptions of infrastructure quality by country shows particular service gaps emerging across the types of infrastructure For example finance professionals in Africa and South Asia reported consistently poor levels of infrastructure across all the subtypes with the notable exception of ICT These results suggest that there are considerable service gaps that governments in this world region must address In comparison North American respondents had much higher overall scores but showed a particular dip in their road and highway infrastructure where only 64 of respondents reported that this infrastructure was of good quality In the Caribbean region specialist respondents isolated road and highway infrastructure and core public service infrastructure as key areas requiring intervention to reduce the service gap Specialists in infrastructure policy in central and Eastern Europe cited core public service infrastructure and railway infrastructure as areas requiring further investment
15 BARRIERS TO MEETING INFRASTRUCTURE NEEDSRespondents to the member survey were also asked what they saw as the biggest barriers to meeting the infrastructure needs in their country The results of this question showed significant variation by world region For example corruption was seen as a serious challenge in South Asia Africa Central and Eastern Europe and the Caribbean ndash but was cited by 10 of respondents or fewer in North America and Western Europe In comparison a lack of political leadership ranked consistently high across world regions This is a key barrier that is explored further in Chapter 3 Selecting Projects The lack of finance or funding also ranked as a significant barrier in most regions with an overall global average of 49 of respondents citing it as a barrier The underlying causes for the lack of finance as well as good practices in overcoming this barrier are discussed in Chapter 4 on the central role of accountants in improving infrastructure project finance Finally planning and regulatory issues consistently arose as a barrier to meeting infrastructure need with around 40 of respondents across the globe citing this as a key barrier Chapter 5 of this report which explores how accountants can support the efficient execution of infrastructure projects sets out how the interface of public and private partners can often be confused and suboptimal reducing the effective delivery of infrastructure
How accountants can bridge the global infrastructure gap | 1 Defining the challenge Quantifying the global infrastructure gap
FIGURE 16 Biggest barriers to meeting infrastructure needs
North America
100
80
60
40
20
0
n Lack of finance andor fundingn Lack of political leadershipn Skills and talent shortagen Planning and regulatory barriersn Corruptionn Lack of competitionn None
Middle East Asia Pacific Central and South Asia Western Europe Africa Caribbean Total
Source The Global Infrastructure Gap survey all respondents n 3611
Eastern Europe
2 Capacity for infrastructure investment
For countries at different stages of development the implications of infrastructure spending can also be markedly different The annual rate of growth in output typically much higher during the early phase of industrialisation tends to slow as a countryrsquos economy matures Smaller economies may therefore need to commit a relatively large share of their output to infrastructure investment in order to facilitate rapid growth
Looking at infrastructure investment as a percentage of GDP can therefore be revealing as to governmentsrsquo willingness or ability to make the necessary financial investment as well as the nature of the environment for private investment
In 2015 the Asian economies funded the largest financial infrastructure investment around US$13 trillion This is unsurprising given that Asia is the most heavily populated region It is also a function of the commitment by certain countries to improving the regionrsquos infrastructure and in 2015 the level of investment was the largest in relative terms standing at 51 of GDP
Africa was the region with the second-highest level of investment as a share of GDP in 2015 at 43 but the continent trails its peers in absolute investment (US$100bn) Europe and the Americas both of which are dominated by their larger more developed economies dedicated far lower levels of funding to infrastructure investment relative to their GDP in 2015 at 20 and 17 respectively
20
21 GOVERNMENTSrsquo CAPACITY FOR INCREASING INFRASTRUCTURE SPENDINGGovernments can directly fund an increase in expenditure on infrastructure through increases in either taxation or borrowing The latter places a burden on future generations in the form of the higher taxation needed to fund the
repayment of the debt The major constraints on a governmentrsquos capacity for funding infrastructure are therefore a fairly complex mix of institutional economic and social factors The size of the tax base how easily taxes can be evaded and political or cultural expectations about what constitutes a fair level of taxation all present practical
FIGURE 21 Regional infrastructure investment in US$ trillions as a of GDP 2015
7
6
5
4
3
2
1
0Asia
14
12
10
08
06
04
02
0Africa Oceania Europe Americas
o
f GD
P
2015 USD
$ trillions
n of GDP n USD $ trillions
Source GHI and Oxford Economics 2018
21
How accountants can bridge the global infrastructure gap | 2 Capacity for infrastructure investment
Table 21 presents summary statistics for the level of government debt and taxation across high-income upper-middle-income and low- and lower-middle-income countries
barriers to raising revenues Likewise high taxes can have strong disincentive effects discouraging certain activities and limiting the extent to which any change in the tax rate translates into higher revenues Borrowing on the other hand is constrained by the credibility of the government in pledging to repay any debts and the depth and sophistication of domestic capital markets
Table 21 presents summary statistics for the level of government debt and taxation across high-income upper-middle-income and low- and lower-middle-income countries Using this data gives the distribution of tax and borrowing levels relative to GDP allowing us to benchmark countriesrsquo capacity for further investment The figures cover the 1995 to 2016 period in order to show variation across a range of different economic and political cycles
Table 21 shows that among the high-income countries both the UK and Canada have relatively high levels of indebtedness as measured by the OECD gross general government debt indicator (OECD 2019) Since the global financial crisis both countries have seen their debt levels pull away from the OECD average to stand at 1117 and 1147 of GDP respectively This puts both countries firmly in the upper quartile of indebted countries even among the OECD countries where levels of debt to GDP
are generally high In both cases tax revenues are marginally below the OECD average however suggesting there is some limited fiscal room for raising revenue Political pressure in countries such as the UK may play a part in decisions about whether to raise taxes to generate additional revenue and if so whether to invest in capital expenditure over improving service provision through increased operating budgets
Chinarsquos debt as a share of GDP is estimated to fall below the average for the low- and middle-income countries at 443 Tax revenues are also somewhat higher than in most low and middle-income countries As growth continues and the economy matures Chinese governments may be able to widen the tax base in line with developed economy standards bringing in significantly larger revenues Still the government remains well placed to invest in infrastructure Malaysia which has a larger infrastructure gap to overcome is somewhat more indebted (545) sitting above the median debt level for its peer group although not particularly dangerously so Conversely tax revenue as a share of GDP (143) is slightly lower than the median level for low- and middle-income countries of 147 This suggests that without a move into higher growth and a broader tax base the funding required to close the infrastructure gap is unlikely to materialise in Malaysia
TABLE 21 Stock of debt and tax revenues as a share of GDP selected countries
INCOME GROUP (WORLD BANK DEFINITION)
COUNTRY INFRASTRUCTURE INVESTMENT AS A SHARE OF GDP 2015
GENERAL GOVERNMENT DEBT AS A PROPORTION OF GDP
TAX REVENUE AS A SHARE OF GDP
High-income UK 16 1117 325
Canada 23 1147 320
Upper-middle income China 70 443 217
Malaysia 36 545 143
Low- and lower-middle income Pakistan 17 633 164
Nigeria 32 196 35
India 40 689 110
Source World Bank OECD IMF CIA World Factbook
Some countries such as China find themselves in the privileged position of having significant fiscal room to support further investment while also projecting a small infrastructure gap
Pakistan has a relatively high level of government debt (633) which is approaching the upper quartile of World Bank estimates This presents real risks to fiscal sustainability where pressure from the countryrsquos overseas debt obligations has raised the prospect of a debt crisis Here the high level of indebtedness may in part be due to rapid growth in infrastructure spending over recent years
Among the case study countries Nigeriastands out as having both the largest forecast infrastructure gap at 09 of GDP in 2040 and the weakest tax revenue (35 of GDP) The inability of the government to raise revenue effectively is holding back its ability to invest in infrastructure which in turn is holding back growth The availability of significant oil reserves can provide an alternative source of revenue to general
taxation especially when oil prices are high But there are reasons (environmental and technological) for considering that peak oil prices may have been (or will soon be) reached Therefore the ability of Nigeria to finance its investment from other sources of income will be essential to closing the countryrsquos infrastructure gap
This analysis demonstrates that there is significant country-level variation in the ability to respond to the global infrastructure gap (Table 22) Some countries such as China find themselves in the privileged position of having significant fiscal room to support further investment while also projecting a small infrastructure gap Others such as Pakistan and Nigeria will need to work within the limited fiscal room available for meeting their growing infrastructure needs
22
How accountants can bridge the global infrastructure gap | 2 Capacity for infrastructure investment
TABLE 22 A typology of infrastructure gap responsiveness
LIMITED FISCAL ROOM GREATER FISCAL ROOM
Low infrastructure gap lsquoSmall gap Fiscally restrictedrsquo(eg Canada)
lsquoSmall gap Fiscally flexiblersquo(eg China)
High infrastructure gap lsquoLarge gap Fiscally restrictedrsquo(eg Pakistan Nigeria)
lsquoLarge gap Fiscally flexiblersquo (eg Malaysia)
23
3 Selecting projects
Around the world the multitude of industrial cranes signals the increase in infrastructure projects and the resulting demand on investment resources Yet what is not apparent is the variety of competing demands for infrastructure investment such as the ageing of existing infrastructure the need to adapt the built environment to respond to climate change and the desire to initiate new often lsquomegarsquo projects6
The planning and selection process of the appropriate infrastructure project is particularly difficult given long asset lives and significant sunk costs that increase risk and uncertainty
Given these common barriers finance professionals from around the world offered a mixed review of their countriesrsquo current selection process Only 16 of respondents to the joint member survey claimed that their government always or frequently selects infrastructure projects that provide the most value to taxpayers whereas a majority (52) argued that their government only sometimes selects infrastructure projects of value to taxpayers Almost one-in-three respondents (29) indicated that they believed that governments never or infrequently select infrastructure projects that provide value to taxpayers (Figure 31)
There is clearly room for improvement in how infrastructure projects are selected To suggest how to improve the planning
and selection process respondents to the joint member survey were asked to rate in order of priority what changes could be made to improve decision-making when planning and selecting
infrastructure projects Figure 32 shows how respondents ranked the various options from first choice to fifth with smaller bars reflecting fewer respondents ranking that option in their top five
FIGURE 31 Do you believe the government selects projects that provide the most value to the taxpayer
0 10 20 30 40 50 60
Always
Frequently
Sometimes
Infrequently
Never
Dont know
Source The Global Infrastructure Gap survey all respondents n 3611
6 lsquoMegaprojects are large-scale complex ventures that typically cost US$1bn or more take many years to develop and build involve multiple public and private stakeholders are transformationaland impact millions of peoplersquo (Flyvbjerg 2018)
24
A majority of respondents (55) ranked either lsquoremoving political decision-makingrsquo or lsquoputting in place mechanisms to reduce corruptionrsquo as their first choice
The results (Figure 32) show that lsquoremoving political decision-making and making the process more technocraticrsquo was the change most cited by finance professionals as likely to improve the planning and selection process A majority of respondents (55) ranked either lsquoremoving political decision-makingrsquo or lsquoputting in place mechanisms to reduce corruptionrsquo as their first choice This prioritisation aligned with the pervading sentiment voiced by participants in the Canadian roundtable who argued that the government often plan and select projects that are likely to be popular among voters and will focus decision-making on the political cycle which results in short-sighted project selection and planning processes that lack a long-term plan to address future needs
The importance of putting in place mechanisms for reducing corruption such as effective whistle-blowing legislation also resonated in the roundtable discussions A participant in Nigeria emphasised that lsquoif project selection was looked into as it should be it would
definitely help us in reducing corruption and hence reduce the infrastructure gaprsquo Respondents also ranked highly lsquoquantifying the total life-cycle costs of a potential projectrsquo ndash with 22 selecting this as their first or second choice Therefore one of the key barriers to improving project selection is the bias towards short-term thinking and decision-making
Another area needing improvement identified in the survey is the lack of a standard assessment method supporting the project selection process The survey showed that 26 of respondents ranked lsquoimplementing standard assessment tools to evaluate projects during selectionrsquo as either their top or second-highest choice Below we explore two such barriers and how accountants play a role in addressing them first improving the project planning and selection processes by using standards and tools to identify need and prioritisation and second the misalignment between the project life cycle and the political short-term thinking that often prevails in project selection
How accountants can bridge the global infrastructure gap | 3 Selecting projects
FIGURE 32 Which of the following do you feel the government in your country should prioritise to make the best decisions when selecting infrastucture projects
Removing political decision-making making process
technocratic
100
80
60
40
20
0
n 1st preference n 2nd preference n 3rd preference n 4th preference n 5th preference
Applying standard assessment tools to
evaluate projects during selection
Putting in place mechanisms to
reduce corruption
Quantifying the total life-cycle
costs of potential projects
Spending more resource to evaluate
projects after completion
Transferring project selection powers
to more local levels of govt
Adhering to global accounting
standards
Bringing OOBs onto government
balance sheets
Moving government accounts from cash to accrual
accounting
Source The Global Infrastructure Gap survey all respondents n 3611
25
How accountants can bridge the global infrastructure gap | 3 Selecting projects
The constrained optimisation method is another tool that can be used for project selection though it is usually reserved for complex and large projects that require mathematical optimisation before decisions are made
31 BARRIER 1 LACK OF A STANDARD PROJECT SELECTION METHOD ndash FACTORING IN lsquoNEEDrsquo AND lsquoPRIORITISATIONrsquoA participant in the Trinidad amp Tobago roundtable commented that planning and project selection is lsquohardly ever done on a needs basis We do not complete a needs assessment when were building a road costing millions of dollars What is the benefit that we are going to bring to society from that new infrastructurersquo Establishing a need is a key consideration in building the case for selecting a particular project Although there are no international standards or regulations for infrastructure project selection the Guide to Project Management Book of Knowledge (PMBOK) (Project Management Institute 2017) sets out a process whereby the lsquoneedrsquo for the project is identified first and classified as most important in the selection This can be done by conducting a needs assessment or feasibility study and supports the reasons for lsquowhyrsquo the project is required The lsquowhyrsquo may be stimuli such as a market demand a business need a customer request a technological advance a legal requirement or a socialenvironmental need
The PMBOK then delineates two broad methods for establishing the benefit or the lsquowhyrsquo of a project the benefit measurement method and the constrained optimisation method
The benefit measurement methodAs a comparative approach this method is based on the present value of estimated cash flows and uses techniques such as benefitcost ratio economic models payback period discounted cash flow internal rate of return and opportunity cost This method is often used for small or less complex projects
Constrained optimisation methodThe constrained optimisation method is another tool that can be used for project selection though it is usually reserved for complex and large projects that require mathematical optimisation before decisions are made This method is widely used in finance and economics to find the minimum or maximum for a cost function where the cost changes depending on varying inputs Many techniques are available that offer broader consideration for decision makers by examining the best and worst case scenarios and the probability of the project outcome
The international roundtable participants highlighted that governments should ensure that the need for a particular project is clearly defined ndash the lsquowhyrsquo as the need will determine the appropriate source(s) of support To do this they should implement a stage-gate process such as the PMBOK with standard tools and mechanisms in place for evaluating the project selection process increasing transparency and reducing corruption
FIGURE 33 Two methods of need assessment
Uses cost-benefit analysis to assess whether the project is financially viable or not
Constrained optimisation method
The benefit measurement method
Compares the project under consideration with a competing project
New project Competing project
How accountants can bridge the global infrastructure gap | 3 Selecting projects
Alongside the technical methods available for isolating need and priority accountants can produce a broader range of metrics to improve the projection selection process
In practice many governments do not have the resources or the capacity to carry out such assessments across all projects and usually with the limited information available they place emphasis on basic elements of project appraisal which include lsquorules of thumbrsquo to confirm that
bull the need for the project is justified
bull the projectrsquos objectives are clearly specified
bull broad alternatives to the project are considered
bull promising options are analysed
bull project costs are fully estimated and
bull project benefits are assessed
Even by applying the basic elements of project appraisal prioritisation (or ultimately selecting the right project) can still be a constraint The World Bank has developed an innovative and adaptable Infrastructure Prioritization Framework (IPF) (Marcelo et al 2016) to assist governments in making the best use of their limited information in the interim until they are able to increase their capacity and resources for conducting a more informed and extensive analysis
The IPF provides a stepping-stone approach to project prioritisation for government decision-making This multi-criterial decision-support tool builds on existing and accessible data to help governments compare projects while promoting the building of analytical capacity and data for more extensive financial and economic analysis It is seen as an extension to the current set of tools available to support project selection It starts from a baseline of ad hoc uninformed project selection (where technical project information is limited and subjective) to partial technical information (where some information and analysis is available) to a full selection by advanced project appraisal (where considerable technical information is available)
Alongside the technical methods available for isolating need and priority accountants can produce a broader range of metrics to improve the projection selection process For example project planning and selection in Japan considers the effect of infrastructure investment on achieving regional equity instead of selecting projects that give the highest direct economic return (International Transport Forum 2017) This approach prioritises more evenly spread economic development in a country even where an optimisation model would suggest investment elsewhere
Box 31 Sustainability and infrastructure A Canadian case
The Canadian wave of the survey included a question on sustainability and infrastructure 80 of Canadian respondents indicated that they believe that it is very important to adapt to the impacts of the changing climate such as severe weather in planning infrastructure projects
It is important now more than ever to build resiliency into infrastructure investments Roads bridges buildings public transit and water and wastewater systems are at increasing physical risk from the impacts of climate change
The Canadian government declared in the 2017 federal budget that it plans to invest CAD219bn in green infrastructure Specifically CAD2bn is dedicated to a Disaster Mitigation and Adaptation fund to support the federal provincialterritorial and municipal infrastructure needed to address climate change Canadian national building codes have been updated to integrate climate adaptation and
resiliency considerations resulting from significant disaster losses Canadian insurance companies are experiencing the impact the annual insured damage for 2016 was CAD49bn ndash a significant increase from the previous annual record of CAD32bn set in 2013 In 2016 the biggest claims arose from the Fort McMurray wildfires which resulted in approximately CAD37bn in insured damage
Any future costs of inaction will likely outweigh the incremental investments made today in enhancing and modifying infrastructure resiliency Nonetheless too often there are challenges in making the business case for projects that incorporate adaptation measures But as with most modifications in the long run it is always easier and cheaper to build resilience considerations into asset development from the start rather than adding them later in response to a major event n
26
How accountants can bridge the global infrastructure gap | 3 Selecting projects
The member survey revealed the need to quantify the total life-cycle cost and remove political decision making in order to improve project selection
32 BARRIER 2 MISALIGNMENT OF THE INFRASTRUCTURE LIFE CYCLE AND THE POLITICAL CYCLE The member survey revealed the need to quantify the total life-cycle cost and remove political decision making in order to improve project selection These two changes are likely prioritised because of the misalignment that commonly exists between the political cycle (often four to six years) and the total life cycle of an infrastructure asset (often over 20 years) This mismatch can generate two biases a bias towards short-term decision-making and a bias towards megaprojects over maintenance
Short-term bias in project selection New infrastructure investment is unavoidably long-term and this carries certain risks At the stages of early planning and project selection infrastructure decision-makers need to consider the forces shaping a country ndash such as social demographic and technological change ndash while providing sufficient flexibility to address unpredictable adjustments in need These variables do not align well with the typically shorter political cycle where there is often a preference for announcements of major projects that can be hard to execute in practice or where fundamental requirements may be missing (eg unfeasible building requirements or little forecasted demand for use of the infrastructure) To counteract this bias the UKrsquos National Infrastructure Commission (NIC) was established in 2015 to produce analysis that is independent of government and to provide advice on major long-term infrastructure challenges ndash with the specific priority of linking long-term priorities with short-term action The NIC publishes an annual National Infrastructure Assessment (eg NIC 2018) to establish infrastructure needs and priorities over many decades
Having an independent body of experts recommending a stable set of priorities can reduce investment risk as potential private sector partners will have certainty that a project aligns with a broader economic plan Establishing a national plan based on agreed priorities is also good practice for reducing short-termism and improving legitimacy but it can also add rigidity to project selection processes Decision-makers must be careful to balance the benefits of a stable framework with maintaining flexibility to respond to a rapidly changing policy environment
Bias towards mega-projects over maintenance There can be considerable bias towards allocating resource to new (preferably high-profile) projects rather than investing in the necessary maintenance of existing assets There can be a natural reluctance to spend money on what a country already has and there is often political appeal in wishing to establish an individual legacy through the construction of a megaproject Accountants are in a pivotal position to draw attention to the issue of prioritising backlog maintenance to ensure that assets remain in serviceable condition As part of any needs assessments careful consideration must be given to the condition of existing capital infrastructure and its ability to maintain the existing levels of service To balance these demands NHS Scotland publishes an annual assets and facilities report which provides an overview of asset performance and planned future investment (see NHS Scotland 2018) This report offers good practices in quantifying and managing the backlog of maintenance including setting out the total outstanding backlog of maintenance costs per square metre of the estate and the proportion of significant and high-risk maintenance By identifying the maintenance backlog NHS Scotland is able to take the appropriate action to mitigate a reduction in public service quality while also prioritising repairs in line with the metrics established in the annual assets and facilities report
27
28
How accountants can bridge the global infrastructure gap | 3 Selecting projects
Box 32 Accountants and climate-change adaptation planning A Canadian case in point
As governments around the globe move to establish planned spending on infrastructure projects designed to adapt to climate change it is essential that accountants have a role in project selection and planning to help make the business case for resiliency and to ensure adequate accountability
In Canada the efficacy of this practice was illustrated when the City of Montreal developed its Climate Change Adaptation Plan Accountants played an integral role in performing the cost-benefit analysis of embedding adaptation into municipal infrastructure decisions (CPA Canada 2016)
lsquoA less costly option may be deemed adequate today but could result in future costsrsquo explained a participant in the Canadian roundtable
For example if Montrealrsquos sewer pipes cannot withstand increased flooding predicted with climate change sewer backups could lead to additional expenditures such as clean-up costs and even legal liabilities
lsquoClimate change is going to force cities and governments to put in place capital projects and other measures to prevent future losses or damagesrsquo emphasised the participant
Indeed there has never been a more vital time for CPAs to get involved in infrastructure project selection n
The walkway of Saint Anne De Bellevue Montreal Quebec during the floods April 2017Editorial credit Glass and Nature Shutterstockcom
29
4 Financing projects
The economic analysis in this report demonstrates that by 2040 the world will have accumulated an infrastructure gap of over US$14 trillion In response to this challenge governments are adopting novel means of effectively funding and financing their public infrastructure ndash as well as turning to institutional investors foreign direct investment and the private sector
Accountants act as a critical interface between these actors for example through effectively communicating and negotiating the terms of an infrastructure finance deal
41 THE MIX OF PUBLIC AND PRIVATE FINANCE FOR INFRASTRUCTURERespondents to the joint member survey shared the view that infrastructure in their countries should be financed by both the public and private sectors with 85 stating that infrastructure should be financed by some mix of investment from both the public and private sectors Half the total respondents (50) suggested that there should be an even mix between public and private finance while the second most common view was that infrastructure should be primarily financed by the public sector (42) Some countries such as the UK plan for the majority of their future infrastructure investment to come from the private
sector (IFG 2017) and data from the Project Finance and Infrastructure Journal shows that global private finance deals amounted to over US$930bn in 2017 (IJGlobal 2018) Given this environment
it is important for accountants to contribute their financial acumen and professional skills by providing a view on the best means of financing infrastructure projects (Figure 41)
FIGURE 41 How should infrastructure be financed in your country
0 10 20 30 40 50 60
PRIVATE
Entirely private finance
Mostly private finance
Even mix of public and private finance
PUBLIC
Mostly public finance
Entirely public finance
Dont know no opinion
Source The Global Infrastructure Gap survey generalist respondents only n 1645
30
and core public service infrastructure Core public service infrastructure such as hospitals and schools attracted the lowest private finance support
Overall finance and accounting professionals with a specialist background took a balanced view on the appropriate finance sources for infrastructure in their country
42 KEY BARRIERS TO SECURING PRIVATE FINANCE FOR INFRASTRUCTUREThe member survey showed that 85 of respondents believed there should be some mix of public and private sector finance in their countryrsquos infrastructure A key question therefore is what barriers limit the flow of private finance for public infrastructure
Survey respondents with specific expertise in infrastructure (lsquospecialistsrsquo ) provided a detailed breakdown on the suggested balance of public and private investment by each type of infrastructure
7
Almost half (47) of specialist respondents argued that ICT infrastructure should be either mostly or entirely financed by the private sector while other transport ndash such as air or sea ndash ranked as the second highest subsector for private sector investment (36) (Figure 42) There was a consistent view across the infrastructure subsectors that there should be an even mix of public and private investment with between 33 and 46 of specialist respondents holding this view Only three subsectors were seen to benefit from finance originating mostly or entirely from the public sector these were water and sanitation roads and highways
How accountants can bridge the global infrastructure gap | 4 Financing projects
Overall finance and accounting professionals with a specialist background took a balanced view on the appropriate finance sources for infrastructure in their country
FIGURE 42 How should infrastructure be financed in your home country by infrastructure sub-sector
Dont know no opinion PUBLIC Even mix PRIVATE
Information and communication technology
Other transport
Power and energy
Railways
Water and sanitation
Roads and highways
Core public service infrastructure
0 10 20 30 40 50 60 70 80 90 100
n n n n
0 10 20 30 40 50
Insufficient skills in government to negotiate with private sector
Lack of attractiveness of infrastructure investment
Negative perception of private finance for public infrastructure
Regulatory barriers
Perceived political instability in my country
Underdeveloped financial markets in my country
Too few viable projects for private investment
Other
Dont know
FIGURE 43 What are the key challenges that the government faces in securing private finance
Source The Global Infrastructure Gap survey all respondents n 3611
Source The Global Infrastructure Gap survey specialist respondents only n 1966
7 Question 3 of the survey asked respondents if their work involved any of the following areas infrastructure policy procurement capital budgeting project management or operations management
How accountants can bridge the global infrastructure gap | 4 Financing projects
Developing the skills in government to act as competent clients and negotiators will be essential in meeting the challenges of providing the right finance for infrastructure projects
As seen in Figure 43 ACCA members and CPA Canada members identified three key barriers for governments working to secure private finance
Barrier 1 the lack of attractiveness of infrastructure investment (42)
Barrier 2 the negative perception of private finance for public infrastructure (43) and
Barrier 3 insufficient skill in government to negotiate with the private sector (45 of respondents)
The distinction between lsquofundingrsquo and lsquofinancingrsquo infrastructure (set out in the next section) helps explain the lack of attractiveness of infrastructure investment and what accountants might do to reduce this problem The higher cost and perceived private gain from public goods is a significant factor in the negative perception of private finance investing in public infrastructure The UK National Audit Office published a report in January 2018 calling out the high rates of return enjoyed by private investors participating in the Private Finance Initiative (Morse 2018) Therefore accountants must take centre stage in
demonstrating the higher cost of private capital managing the transfer of risk between sectors and building an evidence base for selecting the right financing model to support an infrastructure project
Finally developing the skills in government to act as competent clients and negotiators will be essential in meeting the challenges of providing the right finance for infrastructure projects For example there is growing recognition that gold-standard public finance takes account of more than debt stocks and cash flows (eg debt to GDP ratio and tax receipts) and instead needs to consider net wealth particularly public assets Cultivating the skills in government to produce a public sector balance sheet and applying this perspective to the finance selection process will help policymakers maximise the value of their assets and make better infrastructure finance decisions
The remainder of this chapter will discuss these barriers in order to inform areas where public sector accountants can make a difference in closing the infrastructure gap
FIGURE 44 Key barriers in financing infrastructure projects
Lack of attractiveness
of infrastructure investment
Negative perception of
private finance for public
infrastructure
Insufficient skill in government
to negotiate with the
private sector
BARRIER 1 BARRIER 2 BARRIER 3
42 43 45
31
How accountants can bridge the global infrastructure gap | 4 Financing projects
Investment in infrastructure offers the opportunity for private investors to benefit from stable long-term low-risk returns that are tied to a physical asset
43 BREAKING DOWN BARRIER 1 BY CLOSING THE FUNDING GAP
Investment in infrastructure offers the opportunity for private investors to benefit from stable long-term low-risk returns that are tied to a physical asset A key challenge in connecting this pool of private capital with the demand for infrastructure projects is the funding gap Broadly there are three ways of funding (lsquoultimately paying forrsquo) an infrastructure project
Distinguishing between funding and financing It is important to make a clear distinction between the lsquofundingrsquo and lsquofinancingrsquo of infrastructure projects When a private sector institution such as a bank or pension fund finances a public infrastructure project it is providing the upfront money to allow for the design building and operation of that project whereas lsquofundingrsquo is how an infrastructure project is ultimately paid for (Institute for Government 2018)
Global capital markets can help plug the global infrastructure gap Institutional investors with an estimated US$80 trillion in assets under management (Fages et al) seem ideal partners for providing the required finance to reduce the size of the forecasted global infrastructure gap Their risk appetite and the duration of their liabilities match the needs of typical infrastructure projects that will often have life cycles ndash from design to decommission ndash that can span many decades
bull general taxation
bull user charges (eg toll roads) and
bull novel forms of funding (eg value capture and civic crowdfunding)8
This distinction explains why even where private investors have expressed interest in public infrastructure and while the global infrastructure gap grows the response has been relatively muted (McKinsey 2016a) Private investors understandably require a stream of revenue to support their upfront outlay but many potential (even lsquoshovel readyrsquo) projects do not include the long-term funding arrangements to support private finance
FIGURE 45 The funding gap
Global Infrastructure Investment Gap
(forecasting a US$14 trillion gap by 2040) FUNDING
GAP
Institutional Investors
(US$80 trillion under management)
8 Refer to Institute for Government 2018 for an overview of the advantages and disadvantages of different infrastructure funding options
32
Box 41 Hong Kongrsquos MTR Corporation ndash fully funded infrastructure through value capture
Hong Kong has applied a novel form of infrastructure funding that has attracted global attention MTR Corporation is majority owned by the Hong Kong government and manages a passenger rail system that makes a profit It manages to generate revenue in excess of 180 of its operating cost
One factor in MTRrsquos financial success has been its lsquoRail plus Propertyrsquo model where the corporation captures some of the positive externalities of its transit operations by developing and renting the land surrounding its rail stations
Hong Kong is particularly suited to this form of funding with its dense population and high real estate costs which have allowed MTR to create sustainable revenue streams from the development of the land surrounding its stations (Leong 2016 MTR Corporation 2017) n
Innovative models of funding infrastructureGeneral taxation and government capital allocations provide an important foundation for funding public infrastructure while user charges can provide a stream of revenue (eg road tolls) ndash subject to demand risks There are also emerging models that are helping to plug the funding gap Rent capture is attracting attention as a method of funding transit (see Box 41 on the MTR Corporation in Hong Kong for an example) In addition civic crowdfunding a novel form of funding is spreading in popularity A report from Catapult Future Cities (2017) found that 10 of local governments in the UK now make use of some form of civic crowdfunding to transform their communities Spacehive ndash a UK crowdfunding platform ndash has attracted over pound11 million in funding since 2012 to fund over 550 local projects including building new community centre facilities (Spacehive 2019) Platforms such as Spacehive connect grant providers local governments and residents that collectively contribute to projects as well as providing a service to verify that a project is viable and has received the required government permissions In 2017 the Mayor of London committed pound400000 to Spacehive projects (OrsquoDowling-Keane 2017) As governments face constrained budgets public sector
finance officials can play a central role in supporting these novel forms of infrastructure funding by establishing what proposals are financially viable in order to help plug the infrastructure gap
The role of the accountant in addressing the funding gapBeyond these novel funding models accountants can play an important role by helping to identify the most efficient funding models while also taking a leading role on the negotiation with potential private sector investors and representing the public interest through their high ethical standards
Clearly the funding gap is a factor in lsquothe lack of attractiveness of infrastructure investment for private investorsrsquo identified in the member survey Finance professionals should consider a number of factors in formulating effective business cases that can attract private sector finance (eg in articulating the lsquoprivate sector incentiversquo) The financial viability of the project needs to be balanced against affordability for users and access to public goods and services Accountants must consider how they can develop and communicate the private sector incentive for investing in priority projects while also supporting the public interest and providing taxpayers with value for money
33
How accountants can bridge the global infrastructure gap | 4 Financing projects
General taxation and government capital allocations provide an important foundation for funding public infrastructure while user charges can provide a stream of revenue (eg road tolls) ndash subject to demand risks
34
How accountants can bridge the global infrastructure gap | 4 Financing projects
44 BREAKING DOWN BARRIER 2 BY ACCOUNTING FOR THE HIGHER COST OF PRIVATE CAPITALRunning infrastructure projects efficiently for citizens also requires that accountants provide decision-makers with the best advice possible in selecting the appropriate source of project finance
The UK is a global leader in the use of private finance and has over 700 operational private finance deals ndash with total projected future charges arising from these deals of almost pound200bn (Morse 2018) In 2018 The UKrsquos National Audit Office published a report examining the rationale costs and benefits of private finance for public sector projects (Morse 2018) The reportrsquos analysis of Department for Education data showed that the cumulative cost of privately financed projects can exceed the public sector
finance costs by 40 over the life of an infrastructure project The broader benefits of private finance for example transferring risk away from government must therefore outweigh the higher total life-cycle cost of private capital
Off balance sheet liabilities in public sector accountingThe UK is not alone in making use of private finance to provide the upfront capital for public infrastructure The accounting rules set by the European System of Accounts excludes liabilities from public sector balance sheets if the private sector bears most of the projectrsquos risks and rewards The types of risk contributing to this test include construction risks (eg cost and time overruns) and demand risks (eg forecasted and actual use of the infrastructure asset) (Atkins et al 2017) Liabilities not included
By the nature of the public sector there are many competing short-term needs for public capital investment where necessary infrastructure investment must compete with other public spending priorities
35
30
25
20
15
10
05
0
Portu
gal
Slov
akia
Hungar
y
UK
Cypru
s
Irelan
dN
ethe
rland
s
Spain
Denm
ark
Esto
nia
Belgiu
m
Gre
ece
Croat
ia
Austri
a
Malt
a
Italy
Finl
and
Latv
ia
FIGURE 47 Off balance sheet PPPs as of GDP
Source ACCA and CPA Canada analysis of Eurostat 2018
FIGURE 46 Estimated cash flows of a privately and publicly financed projectThe cumulative cash costs of a group of PF2 schools are around forty per cent higher than the costs of a project financed by government borrowing
350000
300000
250000
200000
150000
100000
50000
0
Cumulative cash costs (pound000)
2015 2016 2017 2018 2019 2020 2021 2022 2023 2024 2025 2026 2027 2028 2029 2030 2031 2032 2033 2034 2035 2036 2037 2038 2039 2040 2041 2042
Benefits needed to offset higher costs of private finance procurement
PF2 unitary charges Public sector comparator (PSC) with government borrowing costs
Notes1 Cost estimates taken from data prepared by the Department for Education to compare costs of a group of privately financed (PF2) schools with a public sector comparator (PSC)
2 Interest costs for the PSC have been modelled using an amortising loan with an interest rate of 25 The 20-year government borrowing costs were 25 at the time of financial close of this project and the average life of the project debt was less than 20 years
Source Education Funding Agency National Audit Office analysis Reproduced from Morse 2018
How accountants can bridge the global infrastructure gap | 4 Financing projects
Accountants in the public sector must play a critical role in managing both these benefits while also collecting reliable data to measure whether private finance provides good value for money
on the public sector balance sheet are known as off balance sheet (OBS) liabilities Data from Eurostat shows that other European countries have amassed considerable OBS liabilities ndash with outliers such as Portugal and Slovakia maintaining OBS liabilities in excess of 3 of GDP (Eurostat 2018)
An incentive for using private finance can arise through the combination of fiscal rules such as the EUrsquos Fiscal Compact requiring governments to meet debt reduction targets (European Commission 2017) and the ability to keep certain liabilities off the balance sheet through private finance Governments will be encouraged to use private finance even when it ultimately costs more than traditional public finance when this generates the fiscal illusion of adhering to fiscal rules while at the same time building and operating necessary infrastructure In addition to the fiscal illusion these treatments limit the transparency of infrastructure finance by shielding some politicians and the public from understanding the true cost of infrastructure investment in a particular country
Insufficient flexibility between capital and operational budgets can cause further challenges This is particularly the case where a public sector entity can attribute the unitary charge9 from a private finance deal to its operational budgets in cases where the capital budget includes insufficient funding for a required project By the nature of the public sector there are many competing short-term needs for public capital investment where necessary infrastructure investment must compete with other public spending priorities ndash such as the growing operational costs of health care and education But over time high unitary charges can crowd out operational budgets and prevent future governments from providing quality public services
Why use private finance for public infrastructure Given all these concerns it is unsurprising that in the October 2018 Budget Speech the UK Chancellor confirmed that the government would not sign any new Private Finance Initiative (PFI) contracts (Plimmer 2018) Given this environment it is worth asking what is the genuine rationale for private finance in public infrastructure
Two key benefits can justify the use of private finance for public infrastructure the appropriate transfer of risk from the public to the private sector in the building and running of the infrastructure and efficiencies achieved through the use of private sector money in the financing building and operation of public infrastructure Accountants in the public sector must play a critical role in managing both these benefits while also collecting reliable data to measure whether private finance provides good value for money The next chapter explores findings from the member survey on how best to manage the relationship between public and private actors involved in infrastructure projects
At the early stages of a projectrsquos conception accountants are also critical in selecting the right type of finance where they can provide a transparent assessment of the best finance option based on sound principles (eg value for money affordability for users and distribution impacts) Previous ACCA research shows the high level of trust in the ethical behaviour of accountants Ethics and Trust in a Digital Age (ACCA 2017) found that 9 in 10 professional accountants agree that ethical behaviour helps to build trust in the digital age And almost all C-suite executives (95) assert that the accountantrsquos ethical behaviour helps the organisation build trust with internal and external stakeholders Accountants can offer a collective good through this privileged position of trust by providing sound transparent advice on the best finance option for a particular infrastructure project
9 The recurring payments by governments for privately financed projects
35
How accountants can bridge the global infrastructure gap | 4 Financing projects
The barrier to attracting private finance for infrastructure most cited in the member survey was that governments have insufficient skill to negotiate effectively with the private sector (45)
45 BREAKING DOWN BARRIER 3 BY PROFESSIONALISING THE PUBLIC SECTOR FINANCE FUNCTION The barrier to attracting private finance for infrastructure most cited in the member survey was that governments have insufficient skill to negotiate effectively with the private sector (45) This issue was echoed in the roundtables with participants in Trinidad and Tobago stating that there was a clear need to differentiate professional accountants from those who had no real professional training lsquoterms are used very loosely in this country as to an accountant and most times you would mean ldquobookkeeperrdquorsquo Others in Malaysia noted that lsquomany accountants nowadays lack the right specialisation of skills in terms of having foresight to anticipate what costshellipcome into play [in an infrastructure project]rsquo Clearly there are skills gaps in government that need to be addressed through professionalisation and upskilling if infrastructure is to be properly financed
Finance professionals offer a net wealth perspective Knowing what the country owns and what it owes is a basic requirement for reducing its governmentrsquos information deficits which will allow for improved decision-making in financing infrastructure The professional management of assets and the development of an asset register are two examples of how accountants can take the lead in improving government decision-making In the UK roundtable discussion David Smith associate partner at EY UK also acknowledged the essential role of accounting standards
lsquoAccountantsrsquo work now goes beyond compliance but compliance is our firm foundation Speaking from experience we have global accounting rules that do not necessarily align jurisdiction by jurisdiction but the rules are there for a reason If therersquos deviation or rejection of accounting standards for infrastructure projects at any stage then that is a clear red flagrsquo
Global studies are documenting how the benefits of accrual accounting are leading to broad global adoption For example the 2018 International Public Sector Financial Accountability Index forecasts that within the next five years 65 of governments will report on an accrual accounting basis ndash with particularly high levels of adoption in Africa Asia Latin America and the Caribbean (IFAC and CIPFA 2018)
The professionalisation of the finance function is essential in maximising the value of a countryrsquos assets There is growing recognition that gold-standard public finance practice takes account of more than debt stocks and cash flows (eg debt to GDP and tax receipts) and instead needs to consider net wealth where the right policies can maximise the return on public assets This approach requires the adoption of full accrual accounting and the production of a public sector balance sheet Improving the skills available to government to develop a public sector balance sheet and appreciating the full balance sheet impact of a new project will be an important step in allowing public sector accountants to act as competent clients of and negotiators with the private sector
36
How accountants can bridge the global infrastructure gap | 4 Financing projects
37
Maximising the value of public assets and the intertemporal balance sheetDag Detter a former director of Swedenrsquos Ministry of Industry argues that taking a net wealth perspective with the aim of producing small improvements in the return on public assets would allow for a doubling in infrastructure investment (Detter and Folster 2017) The competing argument to this view is that many public assets are not marketable as policy objectives (eg running a public school) do not typically align with generating financial returns
The New Zealand government seeks to address this issue by classifying its assets and liabilities as social financial and commercial ndash where commercial assets have more scope for financial returns New Zealand has taken the lead in public
The adoption of this net wealth perspective changes the typical rankings of public financial capability In late 2018 the IMF Fiscal Monitor published a report (IMF 2018) which estimated that globally governments had public assets worth over 200 of GDP Applying this analysis can also support good public financial management in a country with the IMF report showing that countries with a strong balance sheet pay lower interest on debt and have shorter and shallower recessions
Figure 48 shows the result of adopting a net wealth view of a nationrsquos financial position Using this lens Japan ndash with a notoriously high public-debt-to-GDP ratio ndash has a net wealth position near zero Other countries such as the UK and Portugal have substantial negative public equity in excess of 100 of GDP
The professionalisation of the finance function is essential in maximising the value of a countryrsquos assets
FIGURE 48 Public sector balance sheets ( of GDP)
750
500
250
0
-250
-500
Port
ugal
Uni
ted
Kin
gd
om
The
Gam
bia
Ger
man
y
Bra
zil
Fran
ce
Aus
tria
El S
alva
do
r
Uni
ted
Sta
tes
Ug
and
a
Jap
an
Ken
ya
Tanz
ania
Can
ada
Ind
ia
Gua
tem
ala
Finl
and
Alb
ania
Co
lom
bia
Tuni
sia
Geo
rgia
Sout
h A
fric
a
Aus
tral
ia
New
Zea
land
Ind
one
sia
Ko
rea
Peru
Kaz
akhs
tan
Russ
ia
No
rway
n Financial assets n Total non-financial assets n Liabilities ex pension n Pension liabilities Net worthTu
rkey
Source IMF staff estimates
Based on a single year of data in most cases compiled as part of the Fiscal Transparency Evaluation Albania 2013 Austria 2015 Brazil 2014 Colombia 2016 The Gambia 2016 Guatemala 2014 Kenya 2013 Peru 2013 Portugal 2012 Tanzania 2014 Tunisia 2013 Turkey 2013 Uganda 2015
38
How accountants can bridge the global infrastructure gap | 4 Financing projects
TABLE 41 New Zealand Intertemporal balance sheet 2016(Percentage of GDP)
ASSETS LIABILITIES NET WORTH
Social 575 71 505
Financial 332 505 -173
Commercial 201 120 81
Static balance sheet 1108 695 413
Fiscal 13819 14800 -981
Intertemporal balance sheet 14927 15495 -568
Source New Zealand 2017 Investment Statement IMF 2018
Box 42 New South Wales Treasury Asset and Liability Committee
The state of New South Wales in Australia has established an Asset and Liability Committee to maximise the value of their assets and properly manage the statersquos liabilities
By using this total balance sheet perspective the New South Wales Treasury has been able to unlock AU$33bn for new social and economic infrastructure projects
This initiative was recorded as part of a series undertaken by ACCA and the International Federation of Accountants (IFAC) documenting good practices in public financial management from around the world To learn more scan the QR code to hear more about this initiative in NSW
If the public sector finance function is professionalised accountants working in the public sector will be able to lead the development of the required governance structures to maximise the value of public assets And where public assets do present commercial opportunity accountants must be at the forefront of proper public commercial asset management By providing independent professional management for public assets governments will be well placed to maximise the value of their assets and minimise the cost of liabilities The member survey shows that reducing political influence in project selection was ranked as the number one issue for improving outcomes Allocating more decision-making authority to independent professional accountants will be an important step in the effective commercial management of public assets
financial management practices not just through this classification but also by producing an intertemporal balance sheet (see Table 41) The country currently maintains a strong net worth position in excess of 40 of GDP but analysis by the New Zealand Treasury shows that the current policy framework will produce recurring deficits that are forecasted to reduce the nationrsquos net worth to almost ndash57 of GDP over the next 40 years Accountants producing this analysis provide decisions-makers with a better long-term view of their policy decisions and can help improve the sustainability of public finances This fits with the maxim that lsquoyou manage what you measurersquo and governments that invest in their finance functions to develop a public sector balance sheet will be better placed to understand the implications of a particular infrastructure project on the nationrsquos net wealth
Where public assets do present commercial opportunity accountants must be at the forefront of proper public commercial asset management
Poor monitoring and oversight of
projects by government
Confusion about where
each side provides value
in a PPP
Uncoordinated commerical
acumen in the public sector
BARRIER 1 BARRIER 2 BARRIER 3
5 Delivering projects the publicndashprivate relationship
Common challenges with infrastructure project selection and financing outlined in the previous chapters may persist through the project delivery phase a shortfall in public capital budgets due to short-term decision-making changing political governance and the lsquomegarsquo risks associated with lsquomegarsquo projects For these reasons public-private partnerships (PPPs) are often chosen for the delivery of public infrastructure projects
51 DEFINING PPP In the context of public infrastructure projects a PPP is a contractual agreement between a public sector entity and a private entity (or group) to provide a public asset or service (World Bank 2018b) Unlike traditional procurement ndash where all the risk will ultimately sit with the government ndash PPPs will explicitly set out the allocation of risk for a project Importantly the scope of private sector involvement can vary substantially including requiring private sector partners to
bull design and build a project
bull design finance and build a project or
bull design finance build operate and maintain a project
Asset ownership is another relevant consideration in establishing the terms of a PPP A project can feature public or private sector ownership of the infrastructure and can include provisions to transfer ownership after a set period (eg a private sector partner operates a toll road for 20 years and thereafter transfers ownership of the road back to the public sector)
The roundtable discussion rightly identified the variety of responsibilities that the private sector can adopt in
a PPP For example a participant in the Canadian roundtable identified that the lsquoprivate sector needs to bring more to the government table than just money it needs to offer expertise or opportunity that the government would not otherwise haversquo
52 KEY BARRIERS TO GETTING THE PPP RELATIONSHIP lsquoRIGHTrsquo The public-private relationship is evolving and getting the terms of this relationship right will be critical for the provision of social and economic infrastructure in the future The roundtable discussions with infrastructure experts highlighted three key barriers to this where there was a particular focus on the need to develop the right relationship between public and private sector actors ndash as getting this
relationship right would support the timely and efficient delivery of infrastructure projects (Figure 51)
The roundtable participants identified poor monitoring and oversight by government as a key challenge in delivering infrastructure projects The member survey demonstrated that there was considerable disagreement about where each party in a PPP agreement provides value in delivery Finally the roundtable participants stated that the public sector was often lacking the commercial acumen required to manage an infrastructure PPP effectively
Below this chapter examines these barriers in greater detail and reviews recommendations for overcoming each one
FIGURE 51 Key barriers in delivering infrastructure projects
3939
How accountants can bridge the global infrastructure gap | 5 Delivering projects the publicndashprivate relationship
Both developed and developing countries need to consider whether they are providing sufficient monitoring across the entire project life cycle to maximise the value of their contracts
53 BREAKING DOWN BARRIER 1 BY ENGAGING THE PROFESSIONAL ACCOUNTANT TO PROVIDE PROJECT LIFE-CYCLE MONITORING AND OVERSIGHT Successful project selection financing and procurement will be of little effect if an infrastructure PPP suffers from poor contract management Managing project risk effectively ndash as well as controlling for scope and budget lsquocreeprsquo ndash requires the public sector to act as a competent client by providing effective monitoring and oversight of a project at every stage from design to operation of the infrastructure
Unfortunately these governance structures are often lacking in many countries with a participant in the Sri Lankan roundtable discussion noting that lsquoprojects [will] kick off but there is no one to monitor them on an ongoing basis This can lead to cost overrunsrsquo Written evidence by the Chartered Institute of Purchasing and Supply (2013) to the UK House of Commonsrsquo Public Administration Select Committee echoed this point In this evidence the Institute submitted that lsquoprocurement skills tend to focus on the call for competition to award the contract rather than on the whole procurement cycle which includes pre-procurement and contractsupplier managementrsquo Both developed and developing countries need to consider whether they are providing sufficient monitoring across the entire project life cycle to maximise the value of their contracts
Chapter 1 section 15 showed that corruption was one of the top barriers to meeting infrastructure need in certain
FIGURE 52 Possible parties to a PPP
regions ndash with 89 of survey respondents in South Asia citing this as a key barrier A roundtable participant in Trinidad and Tobago asserted that proper monitoring of project performance was essential for mitigating corruption particularly lsquohaving something that can support the accountants in countries with no whistle-blowing policyrsquo In addition Abiodun Akanbi from the Nigerian roundtable commented that lsquothe accountant has huge responsibility in measuring the actual performance of contractors to be able [to] efficiently deliver infrastructurersquo The accountant needs to be at the forefront of providing the public sector assurance that the project is being delivered as contracted and according to the project plan Clearly accountants in the public sector have a critical role to play in effective contract management ndash particularly by measuring project progress against agreed terms at key milestones in the delivery process
Reducing moral hazard in the PPP relationship Eriksson and Lind (2015) describe moral hazard as lsquopost-contractual opportunismrsquo There are three key parties that need to be considered in an infrastructure PPP the owner the contractors building the infrastructure and the investor Depending on the structure of the PPP contract any of these roles could be taken on to varying degrees by the government or a private partner Given the limited oversight and governance of many PPPs cited in the roundtable discussions the agents of a PPP project (ie the contractors) will often have the incentive to reduce costs by cutting corners in the projectrsquos execution
Investor Contractor
Owner
40
How accountants can bridge the global infrastructure gap | 5 Delivering projects the publicndashprivate relationship
41
54 BREAKING DOWN BARRIER 2 BY IMPROVING THE INCENTIVES AND RECONCILING DIFFERING VALUE ASSUMPTIONSThe member survey compared the perceptions of public and private sector accountants revealing areas where differing assumptions exist between these parties The survey divided respondents into those working in the public sector and those in the private sector Each group was asked in what ways the other sector provided and received value in PPP infrastructure projects Comparing these results demonstrates where the public and private sectors had a similar view on the purpose of a PPP relationship and where their assumptions on the purpose of the relationship differed (Figure 53) These insights are helpful in highlighting divergent views on the role of each sector where incorrect assumptions can harm the ability of a PPP to deliver a project
Comparing the results from each sector in Figure 53 shows that there was broad agreement on how the private sector adds value to infrastructure projects The ordering of the responses was the same for professionals across the two sectors with the majority of respondents from both sides agreeing that the private sector contributes to the partnership through its knowledge of best practice the application of innovation and access to private capital Interestingly respondents from both sectors were less likely to see risk transfer as an area where the private sector provides value The
These three stakeholders shown in Figure 52 will often have different motivations For example the owner might want to increase the scope of the contract after it is agreed For this reasonaccountants must assess the risks balance the costs and schedule and proactively communicate with all stakeholders to support the success of the project
Allocating risk to reduce moral hazardA CPA Canada roundtable participant rightly identified that lsquothe key areas of interface [between the public and private sector] are between the risks retained by the public sector and their impact on the private sectorrsquos ability to deliver on their contractual commitmentsrsquo Getting this allocation of risk right can significantly improve the prospects that a PPP project will be completed on time and on budget as the right risk balance will act as an incentive to meet contractual obligations (Mann 2018)
Accountants play a clear role here The professional team delivering a project will be aided by an accountantrsquos expertise of risk management ndash particularly the accountantrsquos ability to allocate risk appropriately between the parties in order to minimise moral hazard Although the size and nature of the public sector suggests that it is better placed to bear risk skilled finance professionals will seek to balance the allocation of risks to the private parties such that they maintain the incentive to perform contractual obligations to a high quality standard
Comparing the results from each sector in Figure 53 shows that there was broad agreement on how the private sector adds value to infrastructure projects
Source The Global Infrastructure Gap survey all respondents n 3611
70
60
50
40
30
20
10
0Applying innovative
practices and fresh thinking
Knowledge of best practice and expertise
n Private sector view n Public sector view
Access to private capital
Delivering projects on time
Keeping projects to budget
Transferring risk Dont know None of these
FIGURE 53 Where does the private sector add value in delivering infrastructure
42
How accountants can bridge the global infrastructure gap | 5 Delivering projects the publicndashprivate relationship
assumptions about how each party adds value to an infrastructure PPP contract ndash and suggests that public sector actors overestimate the value of the financial arrangements on offer to private sector partners
The UK Guarantees Scheme (UKGS) offers an example of a good practice that could help improve the private sector incentive for entering PPPs and partially reconciles the differing assumptions of value between both sectors The UK Infrastructure and Projects Authority states that the UKGS lsquosupports private investment in UK infrastructure projects It works by offering a government-backed guarantee to help infrastructure projects access debt finance where they have been unable to raise finance in the financial markets The UKGS can issue up to pound40 billion of guarantees and is open to at least 2026rsquo (UK Government 2017) This long-term commitment guarantees the payment of principal and interest on infrastructure debt and is intended to support lsquonationally significantrsquo projects If well implemented schemes like this can encourage additional private sector involvement in the provision of infrastructure ndash but should be balanced against the need to reduce the risk of moral hazard discussed earlier in this chapter
comparison of perceptions also showed that public sector respondents were slightly more positive about the overall value that private sector actors bring to the relationship
There was considerable divergence in opinion between sector respondents as to the areas where the public sector provided value in an infrastructure PPP (Figure 54)
Public sector respondents were much more likely to argue that they provided both a lsquolong-term and stable partnershiprsquo (62) and knowledge of how the public sector works (60) than their private sector colleagues (45 and 43 respectively) Finance professionals from the public sector were also more likely to claim that they provided the private sector with access to projects (45) compared with 35 in the private sector At the same time there was an agreement that the public sector was less likely to offer knowledge of best practice and innovation to a PPP relationship Therefore both sides took a largely similar view of the origin of knowledge and expertise but the public sector respondents were more optimistic about the value they provided as a financial partner in infrastructure projects Understanding this divergence of viewpoint is helpful in identifying the
There was considerable divergence in opinion between sector respondents as to the areas where the public sector provided value in an infrastructure PPP (Figure 54)
Source The Global Infrastructure Gap survey all respondents n 3611
70
60
50
40
30
20
10
0Long-term and
stable partnershipKnowledge of how the
public sector works
n Private sector view n Public sector view
Access to projects Knowledge of best practice and expertise
Applying innovative practices and fresh thinking
None of these Dont know
FIGURE 54 Where does the private sector receive value from the public sector in delivering infrastructure
How accountants can bridge the global infrastructure gap | 5 Delivering projects the publicndashprivate relationship
To ensure that an infrastructure project is successful strong commercial acumen is essential team members require lsquobusiness savvyrsquo a keen understanding of the market in which the project is being undertaken
55 BREAKING DOWN BARRIER 3 BY FACILITATING PUBLIC SECTOR ACCESS TO BUSINESS EXPERTISE To ensure that an infrastructure project is successful strong commercial acumen is essential team members require lsquobusiness savvyrsquo a keen understanding of the market in which the project is being undertaken Nonetheless as Ajith Lekshmanan a participant in the UK roundtable pointed out
lsquoFor a lot of these projects the [public sector] organisation may just be doing it the one time Itrsquos a one-off and these experts that we are going to [in the private sector] theyrsquove got a whole pool of people doing similar things year after year day after day in this country and other countries The skills required are quite specialist and to train a member of staff [in the public sector] to do it just for the one time that you might be using it is not cost effectiversquo
A public sector entity might manage a large-scale infrastructure project and gain valuable expertise in the process but that expertise may not be accessible to other public sector entities for leveraging in their own infrastructure projects In the public sector project-delivery expertise thus exists in silos It is often the private partners in a PPP who through repeated projects acquire the commercial acumen and therefore potentially hold the expert lsquoreinsrsquo
Centralisation of public sector skills may facilitate removal of this barrier For example the UK Civil Service has created Centres of Excellence that seek to pool the pockets of expertise that exist in the public sector such that any organisation within the public sector can refer to these centres and draw on their specialist skill and thus act as a competent client The professional accountant offers specialist skill and should certainly be a key player in any centre of excellence In fact the accountantrsquos role as an expert team member in such centres may provide as stated by a participant in the Malaysian round table ldquobetter marketing of how the profession contributes to society to encourage professionals to continue doing the right thing and be proud of itrdquo
Centralisation of skills will not however be the answer for all governments Others might seek to encourage cross-departmentministry collaboration to facilitate effective knowledge transfer of commercial acumen across the public sector In both cases collaboration is essential for effective knowledge transfer and as previously outlined the professional accountant with an understanding of life-cycle considerations and with professional frameworks for sound professional judgement and ethics is well-equipped to coordinate such collaboration
43
6 The role of the accountant in bridging the gap
61 CURRENT INFRASTRUCTURE PROJECTS THE MISSING TEAM MEMBER The successful provision of public infrastructure requires governments to have the right professional team in place And yet a clear message resounded from the international roundtable discussions a key player is often missing from the infrastructure project team ndash the accountant A representative at the Malaysian roundtable echoed the sentiment expressed by other participants worldwide that accountants are often only invited to comment on infrastructure projects that have already been selected lsquoSo the harm has been donersquo
As pointed out by a participant in the UK roundtable the role of the accountant has evolved over the years from a focus on lsquoguidelines parameters tick boxes and flowchartsrsquo to a much lsquowider awarenessrsquo Certainly the fact that accountants around the globe work within diverse segments of the economy and serve in key roles such as CEO and CFO and as consultants attests to that lsquowider awarenessrsquo The role of the accountant is at the centre of the planning process and not only in the areas of infrastructure policy The accountant can put the lsquonumbersrsquo on ideas and concepts by applying consistent methodology to ensure they are evaluated against other options for meeting policy goals
Future infrastructure projects the essential team member The previous chapters examined the barriers associated with three fundamental phases of infrastructure projects project selection project financing and project delivery With modern qualifications that facilitate barrier removal in each of these phases the accountant plays an essential role in bridging the global infrastructure gap
The international roundtable participants highlighted the following core competencies
a) Planning and selection of projects The accountant
bull develops strategy identifies goals objectives and ensures they can be achieved (giving consideration to financial constraints and potential monetary gains)
bull sets frameworks and uses standard assessment tools to ensure accountability and transparency and prioritisation according to evidence of need
bull questions project assumptions and assesses alternative scenarios
bull employs mechanisms to ensure ethical behaviour and to eliminate corruption while offering sound risk assessment
bull supports organisationsrsquo holistic decision-making in a way that accounts for the impact of climate change on strategy risk and operational and financial performance thus enhancing organisational resilience
b) Financing projects The accountant
bull considers sustainable finance options including climate-change adaptation and resiliency needs
bull assesses financial viability and identifies long-term impact and strategies for risk mitigation
bull acts as a visionary by providing sound life-cycle advice to decision makers and giving them better understanding of the long-term financial difference between maintaining services and enhancing services and of how the latter can create greater cost pressures over time
bull supports clearer and more objective public discourse increases public awareness of risks and supports taxpayersrsquo better understanding of the value of projects
c) Delivering projects and oversight The accountant
bull implements the required monitoring and oversight
44
How accountants can bridge the global infrastructure gap | 6 The role of the accountant in bridging the gap
Accountants offer important competencies to any business team in any sector But in the face of possible misconceptions of the role of accountants what is the way forward onto the professional infrastructure team
bull allocates project risk between parties of a PPP to reduce moral hazard
bull is supported by several frameworks (eg ICAS 2012 KPMG 2013) for professional judgement and ethics that promote the use of logic flexibility consistency reliability relevant evidence unbiased information and alternative framing to avoid precipitous decisions and that promote a balance of experience knowledge and emotion
62 NEXT STEPS TOWARD THE INFRASTRUCTURE TEAM Accountants offer important competencies to any business team in any sector But in the face of possible misconceptions of the role of accountants what is the way forward onto the professional infrastructure team The international roundtable participants made the following recommendations
bull Increase awareness of the accountantrsquos qualifications as a strategic business adviser and as an essential member of the professional infrastructure team alongside the engineers and architects
bull Equip accountants to voice arguments that are compelling both to political leaders and to the general public
bull Offer elected officials the opportunity to gain financial training from accountants so that they understand the true costs and are better equipped to act as financial ambassadors
bull Establish an accountant-informed certification process for project selection
bull Develop and implement clearer governance structures and decision-making processes that involve the finance function
bull Institute whistle-blowing protection legislation for accountants internationally
45
7 Recommendations based on observed good practice
To tackle the growing global infrastructure gap this report offers a variety of observations and international good practices Below is a summary of the recommendations arising from the reportrsquos analysis demonstrating the variety of functions and actions in which accountants can lead to help close the infrastructure gap
71 SELECTING PROJECTS Chapter 3 demonstrated that the lack of standard assessment tools and ineffective political decision-making hampered project selection To help address these challenges some countries establish expert-led bodies to forecast infrastructure need and make recommendations to government as to which projects to build Governments should also balance maintenance and new infrastructure spending by disaggregating expenditure on maintenance and new projects while prioritising the backlog of maintenance to ensure that assets remain in serviceable condition
To improve decision-making further accountants should collect better data on the service potential of existing infrastructure as well as the performance of past projects Together these data will allow accountants to offer new insights to inform the project selection process To reduce the bias towards large projects over maintenance governments should disaggregate expenditure on infrastructure to report both maintenance and new project spend
This report found that there is no standard project selection process for infrastructure projects used by governments around the world and that the underlying need ndash or service gap ndash is not well established or proven Therefore accountants must take the lead in applying selection standards such as the Project Management Body of Knowledge (Project Management Institute 2017) guide and the World Bankrsquos Investment Project Financing (World Bank 2016) policy to structure decision-making better and move beyond short-term thinking and biases
There is also a growing need to build climate change risk into long-term planning and the decision-making on project selection The Montreal Canada case example (see Chapter 3 Box 32) shows how accountants should produce cost-benefit analysis and business cases to embed adaptation and resilience into municipal infrastructure decisions
In summary governments should 1 Establish expert-led bodies to forecast
infrastructure requirements and recommend projects on the basis of need
2 Collect reliable data on the service potential of existing infrastructure and on the performance of past projects
3 Disaggregate expenditure on infrastructure to report both maintenance and new project spend
Accountants should 4 Take the lead in applying standard
selection tools to determine the need for and priority of a project
5 Advise on the distributional impact and regional growth outcomes of selecting particular projects good practice in this area can be found in Japan
6 Embed adaptation and resilience into the project-selection process
46
How accountants can bridge the global infrastructure gap | 7 Recommendations based on observed good practice
Governments should direct supreme audit institutions to monitor the interaction of off balance sheet liabilities and fiscal targets
72 FINANCING INFRASTRUCTURE PROJECTS
assets Officials in New South Wales Australia were able to unlock an additional AUS$33bn to invest in public infrastructure by adopting a total balance sheet perspective (see Chapter 4 Box 42) Accountants should disaggregate public assets in the balance sheet to include commercial social and financial assets This information will be especially effective for identifying underused commercial assets but it is also important to be aware of overall value for money for citizens when selling an asset (eg selling a public asset that was previously free to use but will now attract a user charge imposed by the private sector owner)
Chapter 4 on financing infrastructure highlights three key barriers closing the funding gap accounting for the higher cost of private capital and the need to professionalise the public sector finance function
This report identifies emerging and good practices from around the world that help reduce the funding gap Decision-makers should consider innovative solutions to closing the funding gap such as a value capture and civic crowdfunding For example the MTR Corporation in Hong Kong demonstrates that implementing a transport model that captures the positive externalities of new transit can make some public infrastructure self-funding (see Box 41)
To ensure value for money in infrastructure policy accountants must advise public sector decision-makers on how to make efficient capital allocations A real challenge in this respect is the interaction of fiscal targets and off balance sheet (OBS) liabilities Chapter 4 showed that some countries such as Portugal and the UK have accumulated significant OBS liabilities Therefore countriesrsquo supreme audit institutions should monitor the interaction of OBS liabilities and fiscal targets At the same time finance officials in government should advocate a more holistic approach to maintaining fiscal discipline beyond a few top-line indicators such as debt to GDP or public sector net borrowing
To improve the efficient allocation of public funds long-term infrastructure plans should be aligned with the annual budget process that sets out capital and operating budgets Effective capital budgeting can improve public finances such that departments or ministries do not need to rely on flexibility of unitary charges to meet infrastructure needs
Many national accounts operating on a cash basis treat investment in public infrastructure as a cost instead of recognising a new asset on the public sectorrsquos balance sheet Governments should adopt full accrual accounting and maintain a public sector balance sheet Public sector accountants should also conduct a balance sheet review to maximise the value of public sector
New Zealand has taken the lead in public financial management practices not just through the adoption of accrual accounting but because their public sector accountants produce an intertemporal balance sheet (see Chapter 4 Table 41) (Government of New Zealand 2018) Accountants producing this analysis provide decisions-makers with a better long-term view of their policy decisions and can help improve the sustainability of public finances
In summary governments should 7 Consider innovative solutions for
closing the funding gap such as a value capture civic crowdfunding and other revenue funding schemes
8 Direct supreme audit institutions to monitor the interaction of off balance sheet liabilities and fiscal targets in order to improve the efficient allocation of public sector funds
9 Align long-term infrastructure plans with the annual budget process in order to minimise the use of higher-cost private finance to achieve capital budget flexibility
10 Adopt full accrual accounting and maintain a public sector balance sheet to support decision-making on infrastructure policy
Accountants should 11 Advocate a more holistic approach to
maintaining fiscal discipline to avoid poor financial decisions driven by lsquofiscal illusionsrsquo
12 Conduct a balance sheet review to maximise the value of public sector assets
47
How accountants can bridge the global infrastructure gap | 7 Recommendations based on observed good practice
Professional bodies can also contribute to the improvements in public sector expertise by facilitating knowledge transfer between the public and private sector through thought-leadership events and roundtable discussions
13 Produce an intertemporal balance sheet to improve long-term decision-making and support the sustainability of public finances as is done for example in New Zealand
14 Produce disaggregated assets in the balance sheet to include commercial social and financial assets ndash in order to improve the return on public assets
73 DELIVERING INFRASTRUCTURE PROJECTS AND THE PUBLIC-PRIVATE RELATIONSHIP Chapter 5 highlights three key barriers to implementing infrastructure projects poor monitoring and oversight of projects by government confusion as to where each side provides value in a PPP and lack of commercial acumen in the public sector
To address these barriers and successfully deliver infrastructure projects governments need to look to accountants to implement the necessary monitoring and oversight of their PPP relationships There is also a clear need for effective mechanisms for reducing corruption which was cited as a key action in the member survey The implementation of effective whistle-blowing legislation and the professionalisation of the public sector finance function will allow public servants to challenge unethical behaviour that can derail infrastructure projects
Chapter 6 demonstrated that moral hazard can limit the probability that infrastructure PPPs will be completed on time on budget and to an acceptable level of quality The allocation of risk between the partners in a PPP can play a central role in reducing this moral hazard by putting the right incentives in place for the contractor Therefore professional teams delivering infrastructure should rely on an accountantrsquos expertise of risk management to minimise moral hazard by allocating risks fairly between the parties
Public sector negotiators should reflect on the assumptions identified in the member survey and consider that private finance professionals were less likely than their public sector counterparts to view the public sector as a stable partner or as a sector that provided access to longshyterm projects To mitigate this mismatch governments should consider introducing guarantee schemes for nationally
significant infrastructure projects in order to encourage additional private sector involvement in the provision of infrastructure
As a result of the varied commercial acumen in the public sector governments should consider establishing centres of excellence to coordinate public sector expertise in contract management so that any organisation within the public sector can draw on that specialist skill when negotiating a PPP contract Professional bodies can also contribute to the improvements in public sector expertise by facilitating knowledge transfer between the public and private sector through thought-leadership events and roundtable discussions
In summary governments should 15 Enact effective whistle-blowing
legislation and professionalise the public sector finance function to allow public servants to challenge unethical behaviour that can derail infrastructure projects
16 Establish centres of excellence that coordinate public sector expertise in contract management which allows any organisation within the public sector to draw on the specialist skill when negotiating a PPP contract
17 Consider introducing guarantee schemes for nationally significant infrastructure projects in order to encourage additional private sector involvement in infrastructure projects This will help address the assumptions identified in themember survey which showed that private finance professionals were less likely to view the public sector as a stable partner
Accountants should 18 Implement proper monitoring and
oversight for all projects
19 Advocate embedding themselves in the professional teams delivering infrastructure by highlighting their expertise of risk management
Professional bodies should 20 Act as facilitators of knowledge
transfer between the public and private sector through thought-leadership events and roundtables
48
49
Conclusion
The global infrastructure investment gap is set to grow to US$14 trillion by 2040 and this figure sets the benchmark for meeting the worldrsquos infrastructure needs
In reality however the challenge in fulfilling a countryrsquos infrastructure need is not achieving a notional investment figure but rather establishing a government vision for closing a recognised service gap by either maintaining existing infrastructure assets and or by building new projects
Currently governments lack adequate resources and the capability to make systematic infrastructure decisions because they are not able to harness the benefits of the investment and mitigate the significant risks associated with infrastructure project execution Bringing the accountant to the centre of the decision-making process for infrastructure projects can mitigate these pitfalls The particular skills and perspective of the finance professional can mean the difference between success and failure through improvements in project selection securing financing delivery and oversight of the projects
As the next generation of infrastructure projects are planned financed built and operated the accountant must be brought to the centre of the decision-making process The accountant must be employed across the entire life cycle of future infrastructure projects as a critical member of the professional team if the world is to address the global infrastructure gap
Appendix A Detailed methodology for establishing the infrastructure investment gap
This appendix examines the key features of the G20 Global Infrastructure Outlook methodology (GHI and Oxford Economics 2018) in order to summarise how the global regional and national estimates of the infrastructure gap used in Chapter 1 of this report were determined For a complete understanding the of the original work the Global Infrastructure Outlook report has a comprehensive treatment of the analytical process
A1 DEFINITION OF INFRASTRUCTURE The Global Infrastructure Outlook report defines infrastructure investment as lsquoGross Fixed Capital Formationrsquo (GFCF) by the public and private sectors on fixed immovable assets that support long- term economic growthrsquo (GHI and Oxford Economics 2018) GFCF is a wider definition of investment than just that for infrastructure and so the calculations included for the purposes of this report exclude land and any moveable assets such as IT equipment The definition does however include both the development of new assets and spending on the replacement or maintenance of existing assets
A2 CURRENT INVESTMENT TRENDS Current investment was calculated for a total of 50 countries using data from multinational data sources such as the OECD or Eurostat where possible If the required data was not available from these sources then national statistics were used to create a comparable estimate Failing that data was imputed using econometric techniques The Global Infrastructure Outlook report was completed during 2016 and includes the most up-to-date datasets collected providing values to 2015 so the forecast years begin at 2016 and continue to 2040 Before 2016 no infrastructure gap was estimated so the charts in Chapter 1 and Appendix B reflect current trends only to 2016
For each country and sector the stock of infrastructure per head was calculated and a set of explanatory factors were determined for each sector eg population density structure of the economy These explanatory variables were projected forwards on the basis of national economic and demographic forecasts to estimate infrastructure investment under current trends for each country
A3 INVESTMENT NEEDS The extent to which each country dedicates resources to infrastructure investment was adjusted for the quality of infrastructure using indicators from the World Economic Forum Global Competitiveness Report (Schwab 2018)
The lsquoquality-adjustedrsquo performance measures were then compared across countries using the performance of countries at the 75th percentile among those of similar income levels as the benchmark The investment-need scenario indicated the extent of infrastructure investment by sector and country which would be required to meet this benchmark level Income groups were based on three World Bank definitions low- and lower-middle income upper-middle income and high income For countries that were already positioned above the 75th percentile (ie the target) the objective in the years ahead is to sustain relatively high levels of investment and maintain their strong performance As a result the minimum value for the investment gap is 0 ndash where those countries in the upper quartile must maintain their performance and their peersrsquo target is to attempt to catch up
50
The following account offers a regional breakdown and description of the global infrastructure investment gap covering Africa the Americas Asia Europe and Oceania
B1 AFRICAIn 2018 an estimated US$1328bn was spent on infrastructure in Africa Meanwhile US$1777bn of investment is estimated to be required in the region putting the infrastructure investment gap at US$455bn Cumulatively between 2018 and 2040 the infrastructure investment gap is expected to stand at US$159 trillion with the amount of infrastructure investment needed expected to be 39 higher than under current trends
51
Appendix BRegional breakdown of the global investment gap and additional service gap analysis
350
300
250
200
150
100
50
0
Investment need Current trends
2007
2008
2009
2010
2011
2012
2013
2014
2015
2016
2017
2018
2019
2020
2021
2022
2023
2024
2025
2026
2027
2028
2029
2030
2031
2032
2033
2034
2035
2036
2037
2038
2039
2040
FIGURE B1 Investment need and current trends in Africa 2015 US$ billions
Source GHI and Oxford Economics 2018
TABLE B1 Projected infrastructure investment and gaps among African countries 2018ndash40 2015 prices
COUNTRY
Angola
Benin
INFRASTRUCTURE INVESTMENT USD BILLIONS
$2514
$199
INFRASTRUCTURE INVESTMENT GAP USD BILLIONS
$920
$134
DIFFERENCE BETWEEN INVESTMENT NEED AND INVESTMENT FORECAST
37
67
Cote dIvoire $614 $129 21
Egypt
Ethiopia
Ghana
$4186
$4215
$685
$2182
$1467
$421
52
35
61
Guinea $167 $140 84
Kenya
Morocco
$1742
$1967
$371
$348
21
18
Nigeria
Rwanda
$6168
$295
$2103
$96
34
33
Senegal
South Africa
$578
$2696
$181
$1442
31
53
Tanzania $1943 $1095 56
Tunisia $502 $206 41
Source GHI and Oxford Economics 2018
52
How accountants can bridge the global infrastructure gap | Appendix B
B2 AMERICASIn 2018 it was anticipated that an estimated US$4771bn would be spent oninfrastructure in the Americas In the sameyear investment need was forecast to be 38 higher at US$6570bn and over the full 2018 to 2040 period the infrastructure investment gap is expected to grow to US$6126 trillion This implies that infrastructure need will be 48 higher than actual investment over the period given the current trend in the Americas
12
1
08
06
04
02
0
Investment need Current trends
2007
2008
2009
2010
2011
2012
2013
2014
2015
2016
2017
2018
2019
2020
2021
2022
2023
2024
2025
2026
2027
2028
2029
2030
2031
2032
2033
2034
2035
2036
2037
2038
2039
2040
FIGURE B2 Investment need and current trends in the America 2015 US$ trillions 2018ndash40
Source GHI and Oxford Economics 2018
TABLE B2 Projected infrastructure investment and gaps among nations in the Americas 2018ndash40 2015 prices
COUNTRY
Argentina
Brazil
INFRASTRUCTURE INVESTMENT USD BILLIONS
$4220
$14207
INFRASTRUCTURE INVESTMENT GAP USD BILLIONS
$3392
$11266
DIFFERENCE BETWEEN INVESTMENT NEED AND INVESTMENT FORECAST
80
79
Canada $11243 $194 2
Chile $1978 $499 25
Colombia $2231 $949 43
Ecuador $743 $523 70
Mexico $4874 $5153 106
Paraguay
Peru
$546
$3072
$165
$675
30
22
US $79637 $36089 45
Uruguay $458 $91 20
Source GHI and Oxford Economics 2018
53
How accountants can bridge the global infrastructure gap | Appendix B
B3 ASIAAmong all nations the top four countries by investment need (China India Japan and the US) account for over half of global need three of these countries are found in Asia Despite this the infrastructure gap is lower in percentage terms across Asia than the other regions and across the 2018 to 2040 period Asian countries would need to increase spending by around 10 to meet their projected investment need The sheer size of the continent means that while relatively small as a proportion of current spending this level of underinvestment creates an infrastructure investment gap of US$43 trillion over the same period
30
25
20
15
10
05
0
Investment need Current trends
2007
2008
2009
2010
2011
2012
2013
2014
2015
2016
2017
2018
2019
2020
2021
2022
2023
2024
2025
2026
2027
2028
2029
2030
2031
2032
2033
2034
2035
2036
2037
2038
2039
2040
FIGURE B3 Investment need and current trends in Asia 2015 US$ trillions 2018ndash40
Source GHI and Oxford Economics 2018
TABLE B3 Projected infrastructure investment and gaps among Asian countries 2018ndash40 2015 prices
COUNTRY
Azerbaijan
Bangladesh
Cambodia
INFRASTRUCTURE INVESTMENT USD BILLIONS
$862
$3931
$560
INFRASTRUCTURE INVESTMENT GAP USD BILLIONS
$76
$1821
$266
DIFFERENCE BETWEEN INVESTMENT NEED AND INVESTMENT FORECAST
9
46
48
China $248858 $18307 7
India $37045 $4995 13
Indonesia $15445 $667 4
Kazakhstan $1955 $792 41
Japan
Jordan
$34810
$591
$868
$168
2
29
Malaysia
Myanmar
Pakistan
$3588
$1050
$3351
$725
$1064
$1179
20
101
35
Philippines
Saudi Arabia
$4031
$4654
$653
$1089
16
23
Singapore
South Korea
$878
$12767
$03
$386
0
3
Thailand $3677 $950 26
Turkey
Vietnam
$5328
$4741
$3841
$968
72
20
Source GHI and Oxford Economics 2018
08
07
06
05
04
03
02
01
0
Investment need Current trends
2007
2008
2009
2010
2011
2012
2013
2014
2015
2016
2017
2018
2019
2020
2021
2022
2023
2024
2025
2026
2027
2028
2029
2030
2031
2032
2033
2034
2035
2036
2037
2038
2039
2040
54
How accountants can bridge the global infrastructure gap | Appendix B
B4 EUROPETotal spending on infrastructure in Europe was forecast to be US$457bn in 2018 in contrast to a projected requirement of US$512bn This investment gap of 11 is projected to grow to US$189 trillion or 16 of the total infrastructure investment needed over the period 2018ndash40
FIGURE B4 Investment need and current trends in Europe 2015 US$ trillions 2018ndash40
Source GHI and Oxford Economics 2018
TABLE B4 Projected infrastructure investment and gaps among European countries 2018ndash40 2015 prices
COUNTRY
Croatia
INFRASTRUCTURE INVESTMENT USD BILLIONS
$591
INFRASTRUCTURE INVESTMENT GAP USD BILLIONS
$101
DIFFERENCE BETWEEN INVESTMENT NEED AND INVESTMENT FORECAST
17
France $16823 $96 1
Germany
Italy
Poland
$13544
$11449
$5143
$07
$3530
$865
0
31
17
Romania $2103 $104 5
Russia $9887 $6892 70
Spain
UK
$9977
$15496
$538
$1403
5
9
Source GHI and Oxford Economics 2018
55
How accountants can bridge the global infrastructure gap | Appendix B
B5 OCEANIADespite the large area covered by the Oceania continental region its relatively small population means the total infrastructure investment need is less thanfor the other regions A further US$18 trillion total spending is likely to be required between 2018 and 2040 although on current trends a shortfall of US$171bn is forecast to emerge over the same period This would represent an infrastructure gap of 10
120
100
80
60
40
20
0
Investment need Current trends
2007
2008
2009
2010
2011
2012
2013
2014
2015
2016
2017
2018
2019
2020
2021
2022
2023
2024
2025
2026
2027
2028
2029
2030
2031
2032
2033
2034
2035
2036
2037
2038
2039
2040
FIGURE B5 Investment need and current trends in Oceania 2015 US$ billions 2018ndash40
Source GHI and Oxford Economics 2018
TABLE B5 Projected infrastructure investment and gaps among countries in Oceania 2018ndash40 2015 prices
COUNTRY INFRASTRUCTURE INVESTMENT USD BILLIONS
INFRASTRUCTURE INVESTMENT GAP USD BILLIONS
DIFFERENCE BETWEEN INVESTMENT NEED AND INVESTMENT FORECAST
Australia $14462 $1499 10
New Zealand $1522 $166 11
Source GHI and Oxford Economics 2018
56
How accountants can bridge the global infrastructure gap | Appendix B
B6 ADDITIONAL INFRASTRUCTURE SERVICE GAP FIGURES BY WORLD REGIONThe following charts compare the views of finance professionals on the remaining four sub-types of infrastructure not included in the main report water and sanitation other transport (eg ports and airports) railways and core public infrastructure (eg hospitals and schools)
Source The Global Infrastructure Gap survey specialist respondents only n 1966
FIGURE B6 Infrastructure quality ndash water and sanitation
North America
100
80
60
40
20
0
n Dont know n Very good n Good n Neutral n Poor n Very poor
Middle East Asia Pacific Central and Eastern Europe
South Asia Western Europe Africa Caribbean Total
Source The Global Infrastructure Gap survey specialist respondents only n 1966
FIGURE B7 Infrastructure quality ndash other transport
North America
100
80
60
40
20
0
n Dont know n Very good n Good n Neutral n Poor n Very poor
Middle East Asia Pacific Central and Eastern Europe
South Asia Western Europe Africa Caribbean Total
57
How accountants can bridge the global infrastructure gap | Appendix B
FIGURE B8 Infrastructure quality ndash railways
FIGURE B9 Infrastructure quality ndash core public service infrastructure
Source The Global Infrastructure Gap survey specialist respondents only n 1966
North America
100
80
60
40
20
0
n Dont know n Very good n Good n Neutral n Poor n Very poor
Middle East Asia Pacific Central and Eastern Europe
South Asia Western Europe Africa Caribbean Total
Source The Global Infrastructure Gap survey specialist respondents only n 1966
North America
100
80
60
40
20
0
n Dont know n Very good n Good n Neutral n Poor n Very poor
Middle East Asia Pacific Central and Eastern Europe
South Asia Western Europe Africa Caribbean Total
Appendix C The Global Infrastructure Gap Survey and Roundtable Discussion Guide
MEMBER SURVEY
Q1 What is your current employment status Full-time or part-time an accounting or finance role Full-time or part-time work in a non-accounting role Not currently in employment Self-employed Retired
Response treated as lsquogeneralistrsquo
Q2 [If employed]In which sector do you work Please tick the one box that best fits your sector Big Four accounting firm Corporate sector - small medium sized Corporate sector ndash large Financial services - small medium sized Financial services ndash large Mid-tier accounting firm Not-for-profit Other international accounting firm Public sector Small or medium-sized practice (SMP) Other (please specify)
Q3 [If employed]Does your work involve any of the following
Infrastructure policy Procurement Capital budgeting Project management or Operations management
Yes (respondent categorised as a lsquospecialistrsquo) No (respondent categorised as a lsquogeneralistrsquo)
Q4 How would you describe the quality of each type of infrastructure in the country where you live Power and energy Water and sanitation Roads and highways Railways Other transport (eg air and sea)
Information and communication technology (eg internet access and mobile service)
Core public service infrastructure (eg hospitals schools emergency services)
Scale 1 ndash Very poor 2 ndash Poor
4 ndash Good 5 ndash Very good Donrsquot know
Q5 What are the biggest barriers in meeting the infrastructure needs in your country Lack of finance andor funding Lack of political leadership Skills and talent shortage Planning and regulatory barriers Corruption Lack of competition Other please specify None
Q6a [To generalists]Over the next 5 years do you feel the infrastructure in your country will Significantly deteriorate Deteriorate Remain the same Improve Significantly improve Donrsquot know
Q6b [To specialists]Over the next 5 years do you feel that each of these types of infrastructure in your country will Power and energy Water and sanitation Roads and highways Railways Other transport (eg air and sea)
Information and communication technology (eg internet access and mobile service)
Core public service infrastructure (eg hospitals schools emergency services)
Scale Significantly deteriorate Deteriorate Remain the same Improve Significantly improve Donrsquot know
Q7 Do you feel the government selects projects that provide the most value to the taxpayer Never Infrequently Sometimes Frequently Always Dont know
58
3
How accountants can bridge the global infrastructure gap | Appendix C
Q8 Which of the following do you feel the government in your country should prioritise to make the best decisions when selecting infrastructure projects Please select up to five which you feel are the most important and rank them by order of importance Please drag and drop your selections from the left box to the right box and order with most important at the top and least at the bottom
Adhering to global accounting standards
Removing political decision-making making the process technocratic (ie decisions by experts)
Putting in place mechanisms to reduce corruption
Moving government accounts from cash to accrual accounting
Bringing OOBs (Obligations Off Balance-Sheet) onto government balance sheets
Quantifying the total life-cycle costs of potential projects
Spending more resource to evaluate projects after completion
Applying standard assessment tools to evaluate projects during selection
Transferring project selection powers to more local levels of government (ie devolution)
Other please specify
Q8a [To CPA Canada respondents only]How important is it that infrastructure planning include the following sustainability considerations Efficient use of energy including where appropriate renewable sources of energy
Adapting to the impacts of a changing climate such as severe weather events
Minimizing environmental impacts on the surrounding community by for example locating near accessible public transit
Reducing or eliminating the production of waste hazardous by-products or other environmental externalities
Assessing the potential of and taking every reasonable step to reduce or eliminate the likelihood of an environmental accident (such as a pipeline spill for example)
Scale 1 - Not important at all 2- Not very important
4 - Quite important 5- Very important 6 - Donrsquot know
Q9a [To generalists]How should infrastructure be financed in your country Entirely public finance Mostly public finance Even mix of public and private finance Mostly private finance Entirely private finance Dont know no opinion
Q9b [To specialists]How should infrastructure be financed in your country (eg a sovereign wealth fund provides the money upfront to build a road) Power and energy Water and sanitation Roads and highways Railways Other transport (eg air and sea)
Information and communication technology (eg internet access and mobile service)
Core public service infrastructure (eg hospitals schools emergency services)
Scale Entirely public finance Mostly public finance Even mix of public and private finance Mostly private finance Entirely private finance Dont know no opinion
Q10 What are your views on the role of foreign direct investment in building and maintaining infrastructure in your country Very concerned Some concern Neutral Positive Very positive Dont know
Q11 What are the key challenges that the government faces in securing private finance Select all that apply Too few viable projects for private investment Regulatory barriers Perceived political instability in my country Underdeveloped financial markets in my country Insufficient skills in government to negotiate with the private sector Negative perception of private finance for public infrastructure Lack of attractiveness of infrastructure investment Dont know Other please specify
Q12a [Asked of those working in Public sector]Where do you feel the private sector particularly adds value in delivering infrastructure projects in your country Select all that apply Knowledge of best practice and expertise
Applying innovative practices and fresh thinking
Delivering projects on time
Keeping projects to budget
Access to private capital
Transferring the risks of delivering infrastructure projects from the public sector to the private sector
None of these
Donrsquot know
59
3
How accountants can bridge the global infrastructure gap | Appendix C
Q12b [Asked of those working in Private sector]Where do you feel the public sector particularly adds value in delivering infrastructure projects in your country Select all that apply Access to projects that provide stable low risk returns Knowledge of how the public sector works Long-term and stable partnership Knowledge of best practice and expertise Applying innovative practices and fresh thinking None of these Donrsquot know
Q13a [Asked of those working in Public sector]Where do you feel the private sector receives value from the public sector in delivering infrastructure projects in your country Select all that apply Access to projects that provide stable low risk returns Knowledge of how the public sector works Long-term and stable partnership Knowledge of best practice and expertise Applying innovative practices and fresh thinking None of these Donrsquot know
Q13b [Asked of those working in Private sector]Where do you feel the public sector receives value from the private sector in delivering infrastructure projects in your country Select all that apply Knowledge of best practice and expertise
Applying innovative practices and fresh thinking
Delivering projects on time
Keeping projects to budget
Access to private capital
Transferring the risks of delivering infrastructure projects from the publicsector to the private sector
None of these
Donrsquot know
Q14 Where are you primarily based [Dropdown list]
Q15 What best describes your gender identity Female Male Prefer not to say Prefer to self-describe
ROUNDTABLE DISCUSSION 1) Understanding the infrastructure gap
a) Whatrsquos the current quality of infrastructure in your country
i Why is it like this
b) How is your business or organization affected by the current quality of infrastructure in your country Please provide examples
2) How accountants can make a difference c) In your experience where do you see accountants making the
greatest difference in delivering infrastructure in your country Please give examples where possible
d) Do you feel that your country has particular good practices in meeting infrastructure need
3) Selecting projects e) How often do you t hink governments select the right projects in
your country
f) What should governments consider when making decisions about infrastructure
4) Financing projects g) Which types of infrastructure are appropriate for private finance
or operation [ie energy water roads railways other transport information and communication technology core public service infrastructure]
i Which ones are more suited to private finance
ii Private operation
h) What do you think about foreign direct investment (FDI) building new infrastructure in your country
5) Interface of public and private i) What skills do governments need to effectively negotiate
contracts with the private sector
i Are any of these skills absent
j) When t he public and private sectors partner to complete and operate infrastructure (for example through a Public-Private Partnership)
i What does the private sector add to the partnership
ii What does the public sector add to the partnership
6) Final k) Over the next 5 years do you think the infrastructure in your
country will improve stay the same or deteriorate
i Why is t hat the case What are the key challenges in meeting the infrastructure needs in your country over the next 5 years
60
References
ACCA (2016) Smarter Cities Simpler Cities Accounting for the City of the Future Spotlight on India lthttpswwwaccaglobalcomcontentdamACCA_GlobalTechnicalFuturepi-smarter-cities-simpler-citiespdf
gt
accessed 4 February 2019
ACCA (2017) Professional Accountants ndash the Future Ethics and Trust in a Digital Age lthttpswwwaccaglobalcomcontentdamACCA_Global TechnicalFuturepi-ethics-trust-digital-agepdfgt accessed 5 February 2019
Atkins G Davies N and Kidney Bishop T (2017) Public versus Private How to Pick the Best Infrastructure Finance Option lthttpswww instituteforgovernmentorguksitesdefaultfilespublicationsInstitute_for_ Government_Infrastructure_Finance_Option_Public_Private_ November_2017_Web_Finalpdfgt accessed 5 February 2019
British Broadcasting Corporation (2015) Spains Ciudad Real airport sold at auction for euro10000 [online article] lthttpswwwbbccouknewsworldshyeurope-33578949gt accessed 6 February
Catapult Future Cities (2017) Civic Crowdfunding A Guidebook for Local Authorities lthttpsfuturecitiescatapultorgukwp-content uploads201703Civic-guidebook-pdfgt accessed 5 February 2019
Central Intelligence Agency (2019) The World Factbook lthttpswwwciagovlibrarypublicationsthe-world-factbook
gt access 7 February 2019
Chartered Institute of Purchasing and Supply (2013) Written evidence submitted by CIPS to the Public Administration Select Committee lthttps publicationsparliamentukpacm201314cmselectcmpubadm123123vw12 htmgt accessed 5 February 2019
Chartered Professional Accountants of Canada (2016) Adaptation Case Study 6 City of Montreal lthttpswwwcpacanadacaenbusiness-and-accountingshyresourcesother-general-business-topicssustainabilitypublications montreal-adapting-to-climate-changegt accessed 5 February 2019
Detter D and Folster S (2017) The Public Wealth of Cities How to Unlock Hidden Assets to Boost Growth and Prosperity (Brookings Institution Press)
Eriksson PE and Lind H (2015) Moral Hazard and Construction Procurement A Conceptual Framework lthttpswwwdiva-portalorgsmashgetdiva2783674FULLTEXT01pdf
gt accessed 5 February 2019
European Commission (2017) Communication from the Commission The Fiscal Compact ndash Taking Stock lthttpseceuropaeuinfopublications fiscal-compact-taking-stock_engt accessed 5 February 2019
Eurostat (2018) lsquoLiabilities Related to PPPs Recorded Off-Balance Sheet of Governmentrsquo downloadable from lthttpsdataeuropaeueuodpendata datasetZxMF0OGutCyj7pgQJdtaiwgt accessed 5 February 2019
Fages R Beardsley B Bromstrup I Donnadieu H Maceacute B Pardasani N Schmitz L Sheridan BTaglioni G and Xu Q (2018) Global Asset Management 2018 The Digital Metamorphosis lthttpswwwbcgcom en-gbpublications2018global-asset-management-2018-digitalshymetamorphosisaspxgt accessed 5 February 2019
Fay M Andres LA Fox C Narloch U Straub S and Slawson M (2017) Rethinking Infrastructure in Latin America and the Caribbean 2017 lthttps openknowledgeworldbankorgbitstreamhandle1098626390114110shyREVISED-PUBLIC-RethinkingInfrastructureFullpdfgt accessed 5 February 2019
Flyvbjerg B (2018) Oxford Handbook of Megaproject Management (Oxford Oxford University Press)
GHI (Global infrastructure Hub) and Oxford Economics (2018) Global Infrastructure Outlook Downloadable from lthttpsoutlookgihuborggt accessed 4 February 2019
Government of New Zealand (2018) lsquoHe Puna Hao Patiki 2018 Investment Statementrsquo lthttpstreasurygovtnzpublicationsinvestment-statementhe-puna-hao-patiki-2018-investment-statement-html
gt accessed 5
February 2019
ICAS (Institute of Chartered Accountants of Scotland) (2012) A Professional Judgement for Financial Reporting lthttpswwwicascomtechnicalshyresourcesa-professional-judgement-framework-for-financial-reportinggt accessed 6 February 2019
IFAC and CIPFA (2018) International Public Sector Financial Accountability Index lthttpswwwifacorgsystemfilesuploadsIFACIFAC-CIPFA-PublicshySector-Index-2018-Statuspdfgt accessed 5 February 2019
IJ Global (2018) H1 Infrastructure and Project Finance League Table Report lthttpsijglobalcomuploadsH120201820League20Tables20Report pdfgt accessed 5 February 2019
IMF (International Monetary Fund) (2018) Fiscal Monitor Managing Public Wealth downloadable from lthttpswwwimforgenPublicationsFM Issues20181004fiscal-monitor-october-2018gt accessed 5 February
Institute for Government (2018) lsquoFunding Infrastructurersquo [webpage] lthttps wwwinstituteforgovernmentorgukexplainersfunding-infrastructuregt accessed 5 February 2019
International Transport Forum (2017) Strategic Infrastructure Planning International Best Practice lthttpsassetspublishingservicegovuk governmentuploadssystemuploadsattachment_datafile601897Strategic_Infrastructure_FINAL_for_web_v2pdf
gt accessed 4 February
KPMG (2013) Elevating Professional Judgment in Auditing and Accounting The KPMG Professional Judgment Framework lthttpwwwdrlilliecom a544kpmgjdgmtKPMG_ProfJudgment_Monographpdfgt accessed 6 February 2019
Leong L (2016) lsquoThe ldquoRail plus Propertyrdquo Model Hong Kongrsquos Successful Self-financing Formularsquo [website article] lthttpswwwmckinseycom industriescapital-projects-and-infrastructureour-insightsthe-rail-plusshyproperty-modelgt accessed 5 February 2019
Mann H (2018) lsquoThe High Cost of lsquoDe-Riskingrsquo Infrastructure Financersquo [website article] lthttpswwwproject-syndicateorgcommentaryworldshybank-ppp-de-risking-by-howard-mann-2018-12gt accessed 5 February 2019
Marcelo D Mandri-Perrott C House S and Schwartz JZ (2016) An Alternative Approach to Project Selection The Infrastructure Prioritization Framework lthttppubdocsworldbankorgen84463146187466270016-04shy23-Infrastructure-Prioritization-Framework-Final-Versionpdfgt accessed 4 February 2019
MGI (McKinsey Global Institute) (2013) Infrastructure productivity How to save $1 trillion a year lthttpswwwmckinseycomindustriescapital-projectsshyand-infrastructureour-insightsinfrastructure-productivitygt accessed 6 February 2019
MGI (2016) Bridging Global Infrastructure Gaps lthttpswwwmckinsey com~mediaMcKinseyIndustriesCapital20Projects20and20 InfrastructureOur20InsightsBridging20global20infrastructure20gaps Bridging-Global-Infrastructure-Gaps-Full-report-June-2016ashxgt accessed 4 February 2019
Morse A (2018) PFI and PF2 Report by the Comptroller and Auditor General lthttpswwwnaoorgukwp-contentuploads201801PFI-and-PF2pdf
gt accessed 5 February 2019
61
How accountants can bridge the global infrastructure gap | References
MTR Corporation (2017) Annual Report 2017 Ten-Year Statistics lthttps wwwmtrcomhkarchivecorporateeninvestor10yr_stat_enpdfgt accessed 5 February 2019
NHS Scotland (2018) NHS Scotland Assets and Facilities 2017 Annual Report lthttpswwwgovscotpublicationsannual-state-nhsscotland-assetsshyfacilities-report-2017gt accessed 5 February 2019
NIC (National Infrastructure Commission) (2018) National Infrastructure Assessment lthttpswwwnicorgukwp-contentuploadsCCS001_ CCS0618917350-001_NIC-NIA_Accessiblepdfgt accessed 4 February 2019
OrsquoDowling-Keane A (2017) lsquoSadiq Khan Joins Crowd of Thousands with pound400000 in Backing for Londonersrsquo Local Project Ideasrsquo [website article] lthttpsaboutspacehivecomsadiq-khan-joins-crowd-of-thousands-withshy400000-in-backing-for-londoners-local-project-ideasgt accessed 5 February
OECD (Organisation for Economic Cooperation and Development) (2019) Databank tax revenue lthttpsdataoecdorgtaxtax-revenuehtmgt government debt lthttpsdataoecdorgggageneral-government-debt htmgt accessed 7 February 2019
Plimmer G (2018) lsquoDeath Knell Sounded for PFI Contractsrsquo [online article] Financial Times lthttpswwwftcomcontent55eb374e-dba5-11e8-8f50shycbae5495d92bgt accessed 6 February
Project Management Institute (2017) Guide to Project Management Book of Knowledge lthttpswwwpmiorgpmbok-guide-standardsfoundational pmbokgt accessed 4 February 2019
Schwab K (2018) Global Competitiveness Report lthttpwww3weforum orgdocsGCR201805FullReportTheGlobalCompetitivenessReport2018 pdfgt accessed 5 February 2019
Spacehive (2019) lsquoMake Your Local Area Betterrsquo [website] lthttpswww spacehivecomgt accessed 5 February 2019
UK Government (2017) UK Guarantees Scheme Guidance lthttpswwwgov ukguidanceuk-guarantees-schemegt accessed 5 February 2019
World Bank (2018a) Private Participation in Infrastructure Annual Report 2017 lthttpppiworldbankorg~mediaGIAWBPPIDocuments Global-NotesPPI_2017_AnnualReportpdfgt
World Bank (2018b) Procuring Infrastructure Public-Private Partnerships Report downloadable from lthttpspppknowledgelaborg documents5453gt accessed 5 February 2019
World Bank (2019) World Bank Open Data tax revenue lthttpsdata worldbankorgindicatorGCTAXTOTLGDZSgt government debt lthttpsdataworldbankorgindicatorGCDODTOTLGDZSgt accessed 7 February 2019
62
18002683793 wwwcpacanadaca
PI-GLOBAL-INFRASTRUCTURE-GAP
DISCLAIMER This paper was prepared by the Association of Chartered Certified Accountants (ACCA) and Chartered Professional Accountants of Canada (CPA Canada) as non-authoritative guidance
ACCA CPA Canada and the authors do not accept any responsibility or liability that might occur directly or indirectly as a consequence of the use application or reliance of this material
ACCA The Adelphi 111 John Adam Street London WC2N 6AU United Kingdom +44 (0)20 7059 5000 wwwaccaglobalcom
CPA Canada 277 Wellington St West Toronto Ontario Canada M5V 3H2