Embed Size (px)
Citation preview

HOW WE COMPARE Diversity . Education . Employment . Housing . Income . Transportation ____________________________________________
Houston’s Comparison with Major U.S. Cities
April 2009
CITY OF HOUSTON Planning and Development Department
CITY OF HOUSTON Planning and Development Dept. Public Policy Division April 2009
Public Policy Division

HOW WE COMPARE Diversity . Education . Employment . Housing . Income . Transportation ____________________________________________
CITY OF HOUSTON Planning and Development Dept. Public Policy Division April 2009
Table of Contents
• Population
o Figure 1: Total Population o Figure 2: Population Change o Figure 3: Male and Female Population o Figure 4: Population by Race\Ethnicity o Figure 5: Age 18 Years and Over o Figure 6: Age 65 Years and Over o Figure 7: Native and Foreign born
• Households o Figure 8: Total Households o Figure 9: Family and Non-Family Households o Figure 10: Married Couple Family o Figure 11: Female Householder – No husband Present o Figure 12: Average Household Size o Figure 13: Marital Status
• Education o Figure 14: Educational Attainment o Figure 15: High School Graduates o Figure 16: Graduate and Professional
• Income & Poverty o Figure 17: Median Household Income o Figure 18: Individuals Below Poverty Level o Figure 19: Families Below Poverty Level
• Employment o Figure 20: Not in Labor Force o Figure 21: Employment in Educational, Health & Services o Figure 22: Unemployment Rate for Cities o Figure 23: Unemployment Rate for Metro Areas o Figure 24: Class of Workers

HOW WE COMPARE Diversity . Education . Employment . Housing . Income . Transportation ____________________________________________
CITY OF HOUSTON Planning and Development Dept. Public Policy Division April 2009
Table of Contents (Contd)
• Economic Well Being
o Figure 25: Average Hotel Rates o Figure 26: Average Meal Costs o Figure 27: Deposits of all FDIC-Insured Institutions
• Density o Figure 28: Land Area in Square Miles o Figure 29: Land Area Change in Square Miles o Figure 30: Population Density
• Housing o Figure 31: Total Housing Units o Figure 32: Occupied and Vacant Housing Units o Figure 33: Owner and Renter Occupied Housing Units o Figure 34: Residential Building Permits o Figure 35: Single and Multi-Family Permits o Figure 36: Median Housing Value o Figure 37: Median Contract rent o Figure 38: Median Sale Price of Single Family Homes
• Public Safety o Figure 39: Police Officers Per 100,000 Population o Figure 40: Number of Crimes Per 100,000 Population
• Transportation o Figure 41: Commuting to Work o Figure 42: Car Pool to Work o Figure 43: Congestion Cost Per Peak Traveler o Figure 44: Person Hours of Delay Per Peak Traveler o Figure 45: Travel Time to Work
***************

HOW WE COMPARE Diversity . Education . Employment . Housing . Income . Transportation ____________________________________________
CITY OF HOUSTON Planning and Development Dept. Public Policy Division April 2009
Population
HOW WE COMPARE Diversity . Education . Employment . Housing . Income . Transportation ____________________________________________
Figure 1
8,274,527
3,834,340
2,836,658
2,208,180
1,552,2591,449,634 1,328,984 1,266,731 1,240,499
939,899
-
1,000,000
2,000,000
3,000,000
4,000,000
5,000,000
6,000,000
7,000,000
8,000,000
9,000,000
CITY OF HOUSTON Planning and Development Dept. Public Policy Division April 2009
Tota
l Pop
ulat
ion
New Yor
k
Los A
ngele
s
Chicag
o
HOUSTON
Phoen
ix
Philad
elphia
San A
ntonio
San D
iego
Dallas
San Jo
se
Cities
2007 Ten City ComparisonTotal Population
• New York remains the most populated city in the United States, far ahead of other cities with a population over eight million.
• Per the 2007 Census estimate, the City of Houston continues to be the fourth largest city in
the U.S.
• San Jose has replaced Detroit, as the tenth largest city.
Source: U.S. Census Bureau, Annual Population Estimates, 2007

HOW WE COMPARE Diversity . Education . Employment . Housing . Income . Transportation ____________________________________________
Figure 2
6%
5%
4%
4%
16%
-4%
18%
13%
-2%
4%
3%
-10% -5% 0% 5% 10% 15% 20% 25%
U.S.
San Jose
Dallas
San Diego
San Antonio
Philadelphia
Phoenix
HOUSTON
Chicago
Los Angeles
New York
Citi
es
Ten City ComparisonPopulation Change 2000-2007
Population Percentage Change
• Phoenix experienced the highest increase in population, 18% between 2000 and 2007. • Houston had the third highest population increase (13%), behind Phoenix and San Antonio.
CITY OF HOUSTON Planning and Development Dept. Public Policy Division April 2009
• Philadelphia and Chicago witnessed decline in population, 4% and 2%, respectively.
Source: U.S. Census Bureau, 2000 & 2007
HOW WE COMPARE Diversity . Education . Employment . Housing . Income . Transportation ____________________________________________
Figure 3
47.2
%52
.3%
50.1
%49
.9%
48.9
%51
.1%
50.5
%49
.5%
51.1
%48
.9%
46.7
%53
.3%
48.7
%51
.3%
50.5
%49
.5%
51.4
%48
.6%
51.3
%48
.7%
49.2
%50
.8%
0%
10%
20%
30%
40%
50%
60%
70%
80%
90%
100%
CITY OF HOUSTON Planning and Development Dept. Public Policy Division April 2009
Mal
e an
d Fe
mal
e
New York
Los A
ngeles
Chicago
HOUSTON
Phoenix
Philadelp
hia
San A
ntonio
San D
iego
Dallas
San Jo
se U.S.
Cities
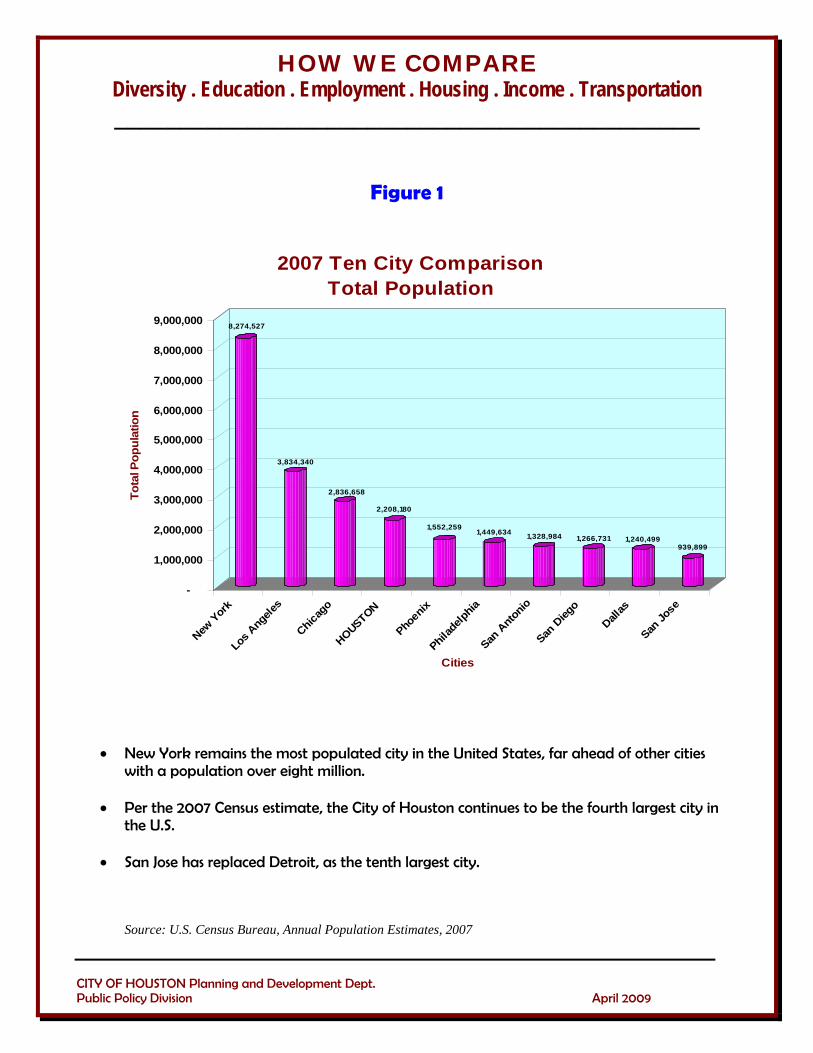
2007 Ten City ComparisonMale and Female Population
Male Female
• The national average for the male population (49.2%) is slightly lower than the female
population.
• Only Houston, San Jose, Dallas, San Diego, Phoenix and Los Angeles register a slightly higher percentage of male population compared to the U.S. average.
• Highest female population is shown for Philadelphia at 53.3%.
Source: U.S. Census Bureau, American Community Survey, 2007

HOW WE COMPARE Diversity . Education . Employment . Housing . Income . Transportation ____________________________________________
Figure 4
35%
24%
27%
12%
2 %
29%
10%
49%
11%
2 %
31%
35%
28%
5%1%
28%
24%
42%
6%1%
48%
5%
42%
4%1%
39%
43%
10%
6%2 %
29%
6%
61%
2%1%
48%
7%
27%
15%
3 %
31%
23%
42%
3%1%
32%
3%
31%
31%
3 %
66%
12%
15%
5%2 %
0%
10%
20%
30%
40%
50%
60%
70%
80%
90%
100%
CITY OF HOUSTON Planning and Development Dept. Public Policy Division April 2009
Rac
e/Et
hnic
ity
New YorkLos A
ngeles
Chicago
HOUSTONPhoen
ixPhila
delphia
San A
ntonioSan
Dieg
o
Dallas
San Jo
se U.S.
Cities
2007 Ten City ComparisonPopulation by Race/Ethnicity
Other
Asian
Hispanic
African-American
White
• San Antonio registers the highest Hispanic population (61%), followed by Los Angeles (49%).
• Houston, Dallas and Phoenix show similar proportions of Hispanic population (42%).
• San Jose’s Asian population at 31% is six times higher than the national average (5%).
• Phoenix and San Diego show much a higher white population than the remaining major cities.
Source: U.S. Census Bureau, American Community Survey, 2007

HOW WE COMPARE Diversity . Education . Employment . Housing . Income . Transportation ____________________________________________
Figure 5
75.3%
75.3%
73.4%
76.9%
71.9%
74.9%
70.9%
73.2%
75.3%
74.8%
76.9%
0% 10% 20% 30% 40% 50% 60% 70% 80% 90% 100%
U.S.
San Jose
Dallas
San Diego
San Antonio
hiladelphia
Phoenix
HOUSTON
Chicago
Los Angeles
New York
P
Citi
es
2007 Ten City ComparisonAge 18 years and Over
Age 18 years and Over
• All major cities reveal percentages closer to the national average (75.3%) except Phoenix.
• San Diego and New York (both at 76.9%) have a slightly higher percentage than the U.S. average.
CITY OF HOUSTON Planning and Development Dept. Public Policy Division April 2009
• Houston’s percentage (73.2%) is slightly lower than the U.S. average.
Source: U.S. Census Bureau, American Community Survey, 2007
HOW WE COMPARE Diversity . Education . Employment . Housing . Income . Transportation ____________________________________________
Figure 6
12.5%
9.5%
8.5%
10.3%
10.3%
13.0%
7.8%
8.7%
10.4%
10.0%
12.2%
0% 2% 4% 6% 8% 10% 12% 14% 16% 18% 20%
U.S.
San Jose
Dallas
San Diego
San Antonio
Philadelphia
Phoenix
HOUSTON
Chicago
Los Angeles
New York
Citi
es
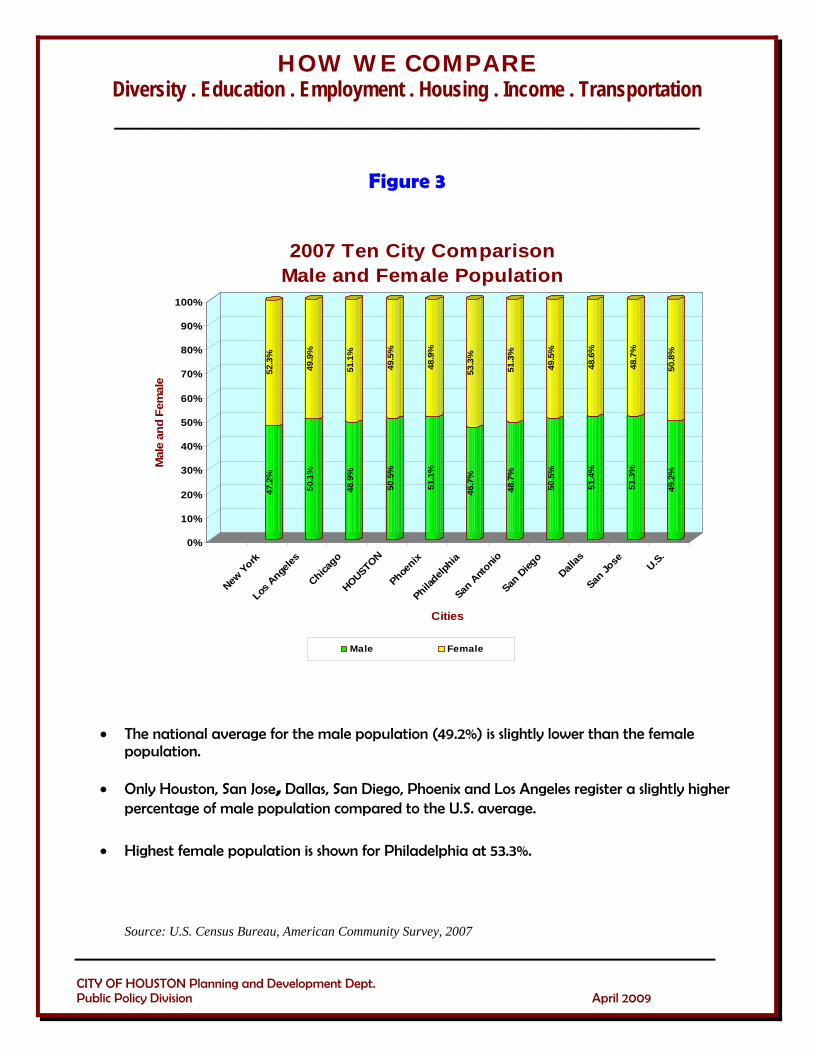
2007 Ten City ComparisonAge 65 years and Over
Age 65 years and Over
• The senior citizen population (65 years and over) in the U.S. is 12.5%. Only New York and Philadelphia are close to this figure.
• Houston, Phoenix, Dallas, San Jose register for less than 10%.
CITY OF HOUSTON Planning and Development Dept. Public Policy Division April 2009
• Phoenix shows the lowest percentage among the major cities.
Source: U.S. Census Bureau, American Community Survey, 2007

HOW WE COMPARE Diversity . Education . Employment . Housing . Income . Transportation ____________________________________________
Figure 7
36.7
%63
.3%
40.0
%60
.0%
21.7
%78
.3%
28.1
%71
.9%
23.7
%76
.3%
10.9
%89
.1%
13.4
%86
.6%
25.9
%74
.1%
26.5
%73
.5%
39.0
%61
.0%
12.5
%87
.5%
0%
10%
20%
30%
40%
50%
60%
70%
80%
90%
100%
CITY OF HOUSTON Planning and Development Dept. Public Policy Division April 2009
Nat
ive
and
Fore
ign
Bor
n
New York
Los A
ngeles
Chicago
HOUSTON
Phoenix
Philadelp
hia
San A
ntonio
San D
iego
Dallas
San Jo
se U.S.
Cities
2007 Ten City ComparisonNative and Foreign Born
Foreign Born Native
• Houston has the fourth highest Foreign Born population at 28.1% compared to all the other major cities.
• The highest of Foreign Born population is in Los Angeles (40%). In contrast only 10% are in
Philadelphia, followed by 13.4% in San Antonio.
• The U.S. average Foreign Born population is 12.5%.
Source: U.S. Census Bureau, American Community Survey, 2007
HOW WE COMPARE Diversity . Education . Employment . Housing . Income . Transportation ____________________________________________
CITY OF HOUSTON Planning and Development Dept. Public Policy Division April 2009
Households

HOW WE COMPARE Diversity . Education . Employment . Housing . Income . Transportation ____________________________________________
Figure 8
3,022,151
1,274,7911,014,120
738,807
483,915 557,985 438,703 464,555440,633
286,965
-
500,000
1,000,000
1,500,000
2,000,000
2,500,000
3,000,000
3,500,000
CITY OF HOUSTON Planning and Development Dept. Public Policy Division April 2009
Tota
l Hou
seho
lds
New York
Los A
ngeles
Chicago
HOUSTON
Phoenix
Philadelp
hia
San A
ntonio
San D
iego
Dallas
San Jo
se
Cities
2007 Ten City ComparisonTotal Households
• Houston registered the fourth largest number of households compared to the nation’s ten largest cities, which is reflected in its population ranking.
• New York has the largest number of households, more than double the number of
households in Los Angeles.
Source: U.S. Census Bureau, American Community Survey, 2007

HOW WE COMPARE Diversity . Education . Employment . Housing . Income . Transportation ____________________________________________
Figure 9
66.9% 33.1%
72.0% 28.0%
58.4% 41.6%
58.8% 41.2%
67.0% 33.0%
55.2% 44.8%
63.8% 36.2%
61.9% 38.1%
57.9% 42.1%
61.2% 38.8%
60.4% 39.6%
0% 10% 20% 30% 40% 50% 60% 70% 80% 90% 100%
U.S.
San Jose
Dallas
San Diego
San Antonio
Philadelphia
Phoenix
HOUSTON
Chicago
Los Angeles
New York
Citi
es
2007 Ten City ComparisonFamily Households and Non-Family Households
Percentage
Family Households
Non-Family Households
CITY OF HOUSTON Planning and Development Dept. Public Policy Division April 2009
• Only San Jose (72%) exceeds the U.S. average (66.9%).
• Houston ranks fourth among the ten largest cities, with 61.9% traditional family households.
• Philadelphia registered lowest percentage of family households at 55.2%.
Source: U.S. Census Bureau, American Community Survey, 2007

HOW WE COMPARE Diversity . Education . Employment . Housing . Income . Transportation ____________________________________________
Figure 10
2007 Ten City ComparisonMarried Couple Family
Cities
Mar
ried
Cou
ple
Fam
ily
36.1%33.7%
40.3%43.8%
28.4%
45.3%43.2%
37.2%
54.3%
49.8%
39.4%
0%
10%
20%
30%
40%
50%
60%
New York
Los Angele
s
Chicago
HOUSTON
Phoenix
Philadelp
hia
San A
ntonio
San D
iego
Dallas
San Jo
se U.S.
CITY OF HOUSTON Planning and Development Dept. Public Policy Division April 2009
• Houston ranks sixth (40.3%) among the major cities.
• Only San Jose’s percentage is higher than the national average showing, 54.3%
• Philadelphia has the least percentage of Married Couple Families, at 28.4, followed by Chicago at 33.7%.
Note: Married Couple percentage is to the total households Source: U.S. Census Bureau, American Community Survey, 2007
HOW WE COMPARE Diversity . Education . Employment . Housing . Income . Transportation ____________________________________________
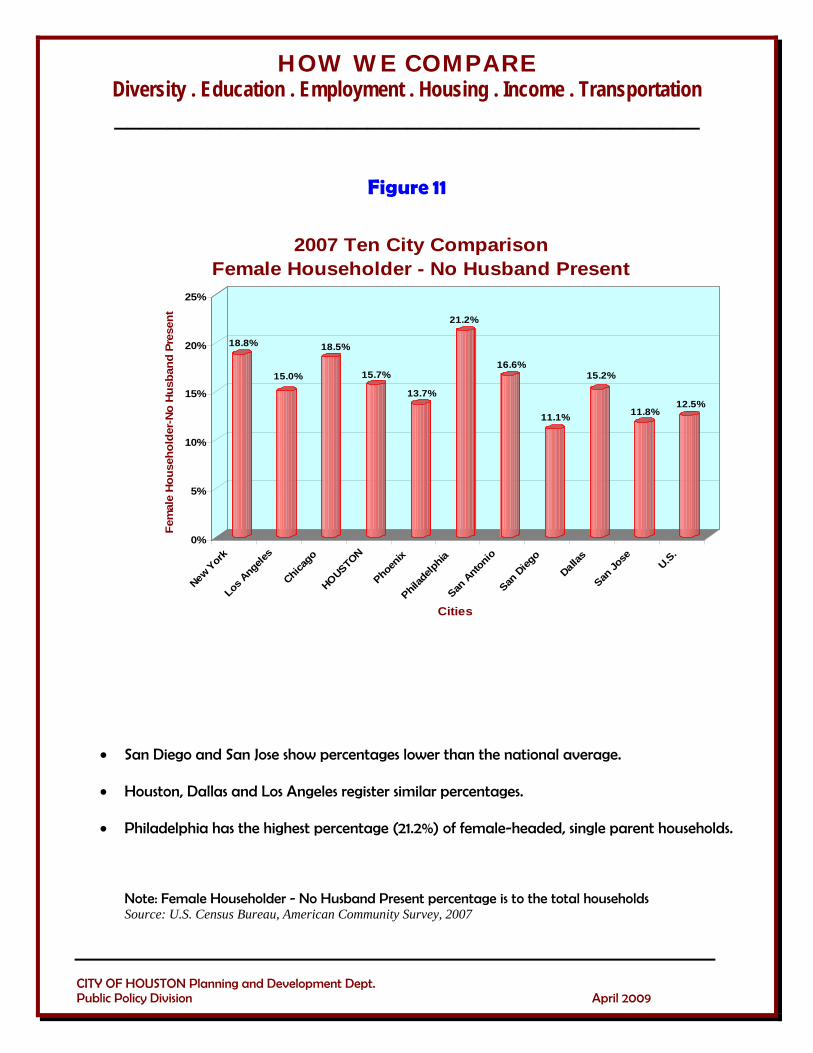
Figure 11
18.8%
15.0%
18.5%
15.7%
13.7%
21.2%
16.6%
11.1%
15.2%
11.8%12.5%
0%
5%
10%
15%
20%
25%
CITY OF HOUSTON Planning and Development Dept. Public Policy Division April 2009
Fem
ale
Hou
seho
lder
-No
Hus
band
Pre
sent
New Yor
k
Los A
ngele
s
Chicag
o
HOUSTON
Phoen
ix
Philad
elphia
San A
ntonio
San D
iego
Dallas
San Jo
se U.S.
Cities
2007 Ten City ComparisonFemale Householder - No Husband Present
• San Diego and San Jose show percentages lower than the national average.
• Houston, Dallas and Los Angeles register similar percentages.
• Philadelphia has the highest percentage (21.2%) of female-headed, single parent households.
Note: Female Householder - No Husband Present percentage is to the total households Source: U.S. Census Bureau, American Community Survey, 2007

HOW WE COMPARE Diversity . Education . Employment . Housing . Income . Transportation ____________________________________________
Figure 12
2.67
2.89
2.642.71
2.93
2.51
2.812.60 2.65
3.10
2.60
0.00
0.50
1.00
1.50
2.00
2.50
3.00
3.50
CITY OF HOUSTON Planning and Development Dept. Public Policy Division April 2009
Avg
Hou
seho
ld S
ize
New York
Los Angeles
Chicago
HOUSTON
Phoenix
Philadelphia
San Antonio
San DiegoDallas
San JoseU.S.
Cities
2007 Ten City ComparisonAverage Household Size
• The average household size for the U.S. is 2.60.
• Only San Jose shows an average household size larger than 3.00 compared to other major U.S. Cities.
• All ten cities show an average household size larger than the U.S. average except
Philadelphia and Chicago.
Source: U.S. Census Bureau, American Community Survey, 2007

HOW WE COMPARE Diversity . Education . Employment . Housing . Income . Transportation ____________________________________________
Figure 13
2007 Ten City ComparisonMarital Status (Population 15 years and Over)
40
50
60
70
Cities
Mar
ital S
tatu
s
6.4% 7.1% 7.4% 8.9% 11.3% 8.1% 10.1% 7.9% 9.8% 7.2% 9.2%
33.7%36.1%41.1%43.2%35.5%
49.3%38.9%39.5%
47.6%45.7%43.7%
52.6%53.4%44.0%45.4%49.2%35.3%45.7%46.3%39.5%42.5%44.4%
0%
10%
20%
30%
%
%
%
%
80%
90%
100%
New York
Los A
ngeles
Chicago
HOUSTON
Phoenix
Philadelp
hia
San A
ntonio
San D
iego
Dallas
San Jo
se U.S.
Never Married Married Separated Widowed Divorced
• The percentage of ‘Never Married” is higher than the national average (33.7%) for all of the major cities.
• Houston ranks third among married couple families, at 46.3%.
CITY OF HOUSTON Planning and Development Dept. Public Policy Division April 2009
• The U.S. average for married couples is 52.6%. All other cities are lower than the U.S. average except San Jose (53.4%).
Source: U.S. Census Bureau, American Community Survey, 2007

HOW WE COMPARE Diversity . Education . Employment . Housing . Income . Transportation ____________________________________________
CITY OF HOUSTON Planning and Development Dept. Public Policy Division April 2009
Education

HOW WE COMPARE Diversity . Education . Employment . Housing . Income . Transportation ____________________________________________
Figure 14
2007 Ten City ComparisonEducational Attainment (Persons 25 Years and Over)
17.1%
22.7%
17.8%
24.4%
14.6%
12.2%
15.4%
17.1%
17.7%
19.1%
19.1%
0% 10% 20% 30% 40% 50% 60% 70% 80% 90% 100%
U.S.
San Jose
Dallas
San Diego
San Antonio
Philadelphia
Phoenix
HOUSTON
Chicago
Los Angeles
New York
Citi
es
Educational Attainment
< 9th No HS Diploma HS Grad Some College Assoc Degree Bachelor's Grad or Prof
CITY OF HOUSTON Planning and Development Dept. Public Policy Division April 2009
• Persons with no High School Diploma are lower than the U.S. average in San Jose and San Diego.
• Houston, Chicago and Dallas register similar percentages of Bachelor’s Degree holders.
• One fourth of the persons 25 years and older have Bachelor’s Degree in San Diego, followed
by 22.7% in San Jose.
Source: U.S. Census Bureau, American Community Survey, 2007

HOW WE COMPARE Diversity . Education . Employment . Housing . Income . Transportation ____________________________________________
Figure 15
30.0%
20.7%
22.2%
18.2%
27.5%
36.9%
26.1%
24.3%
25.4%
21.7%
27.3%
0% 5% 10% 15% 20% 25% 30% 35% 40% 45% 50%
U.S.
San Jose
Dallas
San Diego
San Antonio
hiladelphia
Phoenix
HOUSTON
Chicago
Los Angeles
New York
P
Citi
es
2007 Ten City ComparisonHigh School Graduates (Persons 25 years and over)
High School Graduates
CITY OF HOUSTON Planning and Development Dept. Public Policy Division April 2009
• Philadelphia registers much higher percentage (36.9%) of High School graduates.
• The U.S. average of High School graduates is 30%.
• Houston ranks sixth among the major U.S. cities.
Source: U.S. Census Bureau, American Community Survey, 2007

HOW WE COMPARE Diversity . Education . Employment . Housing . Income . Transportation ____________________________________________
Figure 16
9.9%
12.6%
9.5%
15.5%
8.5%
8.8%
8.1%
10.0%
11.7%
9.7%
13.0%
0% 2% 4% 6% 8% 10% 12% 14% 16% 18% 20%
U.S.
San Jose
Dallas
San Diego
San Antonio
Philadelphia
Phoenix
HOUSTON
Chicago
Los Angeles
New York
Citi
es
2007 Ten City ComparisonGraduate and Professional (Persons 25 years and over)
Graduate and Professional
CITY OF HOUSTON Planning and Development Dept. Public Policy Division April 2009
• San Diego shows the highest percentage of Graduates and Professionals, at 15%.
• The U.S. average is close to 10%. Houston, Dallas and Los Angeles experience similar percentages.
• Phoenix shows the lowest, at 8.1%
Source: U.S. Census Bureau, American Community Survey, 2007

HOW WE COMPARE Diversity . Education . Employment . Housing . Income . Transportation ____________________________________________
CITY OF HOUSTON Planning and Development Dept. Public Policy Division April 2009
Income and Poverty

HOW WE COMPARE Diversity . Education . Employment . Housing . Income . Transportation ____________________________________________
Figure 17
$47,
581
$46,
292
$44,
473
$40,
285 $47,
223
$34,
767 $4
2,21
7
$60,
185
$40,
147
$76,
354
$50,
007
$-
$10,000
$20,000
$30,000
$40,000
$50,000
$60,000
$70,000
$80,000
CITY OF HOUSTON Planning and Development Dept. Public Policy Division April 2009
Med
ian
Hou
seho
ld In
com
e
New Yor
kLo
s Ange
les
Chicag
o
HOUSTON
Phoen
ixPhil
adelp
hiaSan
Anto
nio
San D
iego
Dallas
San Jo
se U.S.
Cities
2007 Ten City Comparison Median Household Income
• Houston and Dallas experience similar median household incomes.
• San Jose and San Diego show income levels higher than the U.S. average, at $76,354 and $60,185, respectively.
• According to the 2007 American Community Survey, the median household income for the
U.S. is $50,007.
Source: U.S. Census Bureau, American Community Survey, 2007

HOW WE COMPARE Diversity . Education . Employment . Housing . Income . Transportation ____________________________________________
Figure 18
18.9% 19.3%
21.0%21.8%
17.3%
24.5%
18.3%
13.3%
21.7%
10.2%
13.3%
0%
5%
10%
15%
20%
25%
CITY OF HOUSTON Planning and Development Dept. Public Policy Division April 2009
Indi
vidu
als
Bel
ow P
over
ty L
evel
New York
Los Angele
s
Chicago
HOUSTON
Phoenix
Philadelp
hia
San A
ntonio
San D
iego
Dallas
San Jo
se U.S.
Cities
2007 Ten City ComparisonIndividuals Below Poverty Level
• Philadelphia has the highest poverty rate, at 24.5%, compared to the U.S. average at 13.3%
• Houston’s poverty level is similar to those of Dallas and Chicago.
• San Jose has the lowest poverty rate, at 10.2%.
Source: U.S. Census Bureau, American Community Survey, 2007

HOW WE COMPARE Diversity . Education . Employment . Housing . Income . Transportation ____________________________________________
Figure 19
16.2% 15.8%17.2%
18.1%
13.2%
19.3%
14.7%
9.1%
18.7%
7.4%
9.8%
0%
2%
4%
6%
8%
10%
12%
14%
16%
18%
20%
CITY OF HOUSTON Planning and Development Dept. Public Policy Division April 2009
Fam
ilies
Bel
ow P
over
ty L
evel
New York
Los Angele
s
Chicago
HOUSTON
Phoenix
Philadelp
hia
San Antonio
San Dieg
oDalla
s
San Jo
se U.S.
Cities
2007 Ten City ComparisonFamilies Below Poverty Level
• San Jose has the lowest rate of families below the poverty level, at 7.4%
• Houston ranks third after Philadelphia and Dallas.
• The U.S. average is registered at 9.8%
Source: U.S. Census Bureau, American Community Survey, 2007

HOW WE COMPARE Diversity . Education . Employment . Housing . Income . Transportation ____________________________________________
CITY OF HOUSTON Planning and Development Dept. Public Policy Division April 2009
Employment

HOW WE COMPARE Diversity . Education . Employment . Housing . Income . Transportation ____________________________________________
Figure 20
2007 Ten City Comparison Not in Labor Force (Population 16 Years and Over)
Ph
Citi
es
Not in labor Force
35.3%
36.1%
38.4%
33.1%
31.8%
33.3%
42.2%
31.5%
32.8%
35.3%
34.8%
0% 5% 10% 15% 20% 25% 30% 35% 40% 45% 50%
U.S.
San Jose
Dallas
San Diego
San Antonio
iladelphia
Phoenix
HOUSTON
Chicago
Los Angeles
New York
• Houston ranks seventh (32.8%) among persons 16 years and older who are not in the labor force.
• Philadelphia registers the highest percentage, at 42.2%, followed by New York, at 38.4%.
CITY OF HOUSTON Planning and Development Dept. Public Policy Division April 2009
• The U.S. average is at 35.3%.
Source: U.S. Census Bureau, American Community Survey, 2007
HOW WE COMPARE Diversity . Education . Employment . Housing . Income . Transportation ____________________________________________
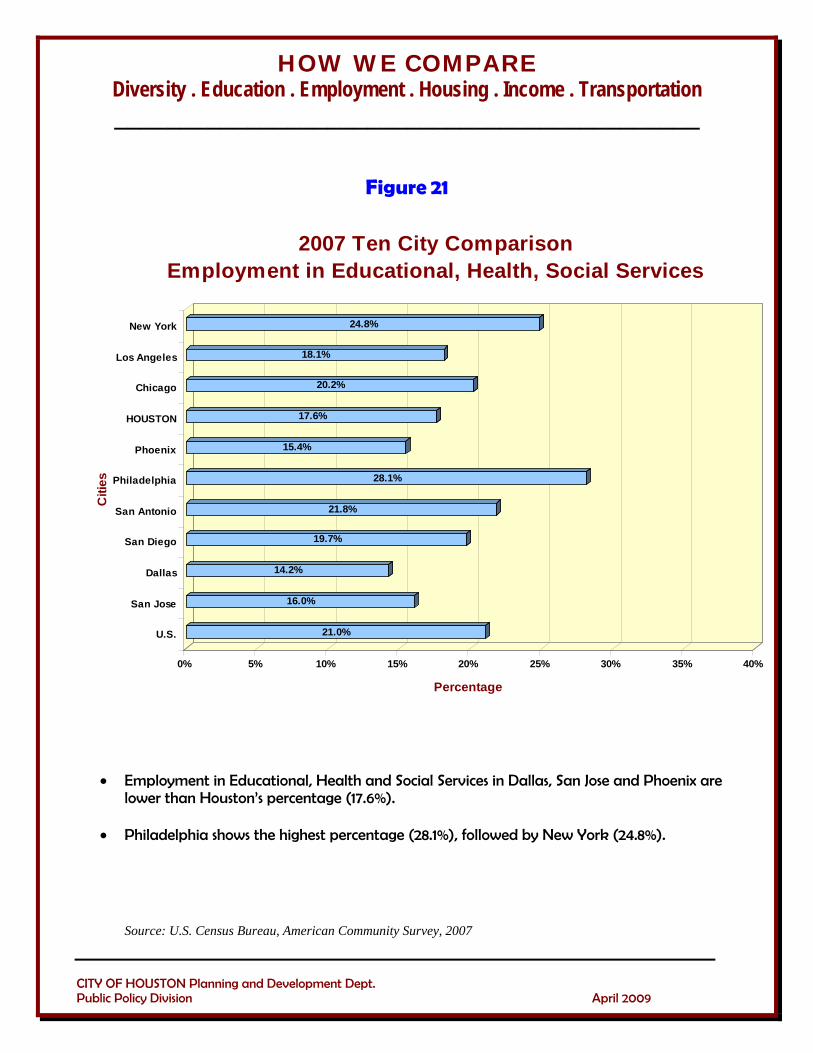
Figure 21
21.0%
16.0%
14.2%
19.7%
21.8%
28.1%
15.4%
17.6%
20.2%
18.1%
24.8%
0% 5% 10% 15% 20% 25% 30% 35% 40%
New York
Los Angeles
Chicago
HOUSTON
Phoenix
hiladelphia
San Antonio
San Diego
Dallas
San Jose
U.S.
P
Citi
es
2007 Ten City ComparisonEmployment in Educational, Health, Social Services
Percentage
CITY OF HOUSTON Planning and Development Dept. Public Policy Division April 2009
• Employment in Educational, Health and Social Services in Dallas, San Jose and Phoenix are lower than Houston’s percentage (17.6%).
• Philadelphia shows the highest percentage (28.1%), followed by New York (24.8%).
Source: U.S. Census Bureau, American Community Survey, 2007

HOW WE COMPARE Diversity . Education . Employment . Housing . Income . Transportation ____________________________________________
Figure 22
4.2%
4.6%
5.4%
3.4%
4.2%
6.9%
3.6%
5.6%
6.6%
4.8%
4.9%
0% 1% 2% 3% 4% 5% 6% 7% 8% 9% 10%
U.S.
San Jose
Dallas
San Diego
San Antonio
iladelphia
Phoenix
HOUSTON
Chicago
Los Angeles
New York
Ph
Citi
es
2007 Ten City Comparison Unemployment Rate (Population 16 Years and Over)
Unemployment Rate
• Only Phoenix’s unemployment rate (3.6%) is lower than the U.S. average (4.2%).
• Chicago and Philadelphia have an unemployment rate greater than 6%.
CITY OF HOUSTON Planning and Development Dept. Public Policy Division April 2009
• Houston ranks third among the major U.S. cities.
Source: U.S. Census Bureau, American Community Survey, 2007

HOW WE COMPARE Diversity . Education . Employment . Housing . Income . Transportation ____________________________________________
Figure 23
4.8%8.1%
5.1%10.0%
4.4%6.9%
5.5%8.8%
4.1%6.0%
4.9%8.0%
3.8%6.9%
4.3%6.4%
5.7%9.2%
5.5%10.2%
4.7%8.2%
0% 2% 4% 6% 8% 10% 12% 14%
U.S.
San Jose
Dallas
San Diego
San Antonio
Philadelphia
Phoenix
HOUSTON
Chicago
Los Angeles
New York
Met
ropo
litan
Are
as
2008 & 2009 Ten City Comparison Unemployment Rate for Metropolitan Areas
Unemployment Rate
Unemployment Feb 2008 Unemployment Feb 2009
s
• Between Feb 2008 and Feb 2009, the unemployment rate (more or less) doubled in Los Angeles and San Jose.
• The U.S. average increased from 4.8% to 8.1% for the same period.
• Houston and Dallas experienced similar increases, but lower than the U.S. average.
Note: Unemployment Rate for persons 16 years and over
CITY OF HOUSTON Planning and Development Dept. Public Policy Division April 2009
Source: Bureau of Labor Stati tics, 2008 & 2009

HOW WE COMPARE Diversity . Education . Employment . Housing . Income . Transportation ____________________________________________
Figure 24
2007 Ten City ComparisonClass of Workers
0% 10% 20% 30% 40% 50% 60% 70% 80% 90% 100%
U.S.
San Jose
Dallas
San Diego
San Antonio
Philadelphia
Phoenix
HOUSTON
Chicago
Los Angeles
New York
Citi
es
Class of Workers
Private Government Self Employed Unpaid Family Workers
CITY OF HOUSTON Planning and Development Dept. Public Policy Division April 2009
• All cities show significant employment in the Private Sector.
• Only San Diego and New York show a slightly lower proportion in the Private Sector.
• Self Employment percentages are higher than the U.S. average is Houston, Los Angeles, San Diego, Dallas and San Jose.
• Slightly higher Government employment rates are shown in San Diego, Philadelphia and
New York.
Note: Data for Workers 16 years and Over Source: U.S. Census Bureau, American Community Survey, 2007

HOW WE COMPARE Diversity . Education . Employment . Housing . Income . Transportation ____________________________________________
CITY OF HOUSTON Planning and Development Dept. Public Policy Division April 2009
Economic Well Being

HOW WE COMPARE Diversity . Education . Employment . Housing . Income . Transportation ____________________________________________
Figure 25
$297
$138
$113$94
$137
$174
$110
$141
$104
$143
$0
$50
$100
$150
$200
$250
$300
CITY OF HOUSTON Planning and Development Dept. Public Policy Division April 2009
Ave
rage
Hot
el R
ates
New York
Los Angele
s
Chicago
HOUSTON
Phoenix
Philadelp
hia
San A
ntonio
San D
iego
Dallas
San Jo
se
Cities
2009 Ten City Comparison Average Hotel Rates
• Average Hotel rate per night in New York is significantly higher than other major U.S. cities, at $297.
• Houston’s hotel rate is the lowest at $94, followed by Dallas, at $104.
Sources: Hotelnewsnow.com for New York, Chicago, Houston, San Jose and Phoenix; Latimes.com for Los Angeles; Dallascityhall.com for Dallas; Visitsanantonio.com for San Antonio; Sandiego.org for San Diego; Gophila.com for Philadelphia; Compiled by Planning Department in March 2009.

HOW WE COMPARE Diversity . Education . Employment . Housing . Income . Transportation ____________________________________________
Figure 26
$39
$31.93$33.75
$27.04
$32.81
$26.57
$35.78$33.36
$35.96
$0
$5
$10
$15
$20
$25
$30
$35
$40
$45
$50
CITY OF HOUSTON Planning and Development Dept. Public Policy Division April 2009
Ave
rage
Mea
l Cos
ts
New York
Los Angeles
Chicago
HOUSTON
Philadelphia
San Antonio
San Diego
Dallas
San JoseCities
2007 Ten City Comparison Average Meal Costs
• Average meal cost in New York ($39) is the highest among other major cities, followed by San Jose (35.96%) and San Diego ($35.78).
• Houston’s cost is the second lowest at $27.04 after San Antonio, at $26.57.
Note: Data for Phoenix is not available. Source:Zagat Ratings, 2007
HOW WE COMPARE Diversity . Education . Employment . Housing . Income . Transportation ____________________________________________
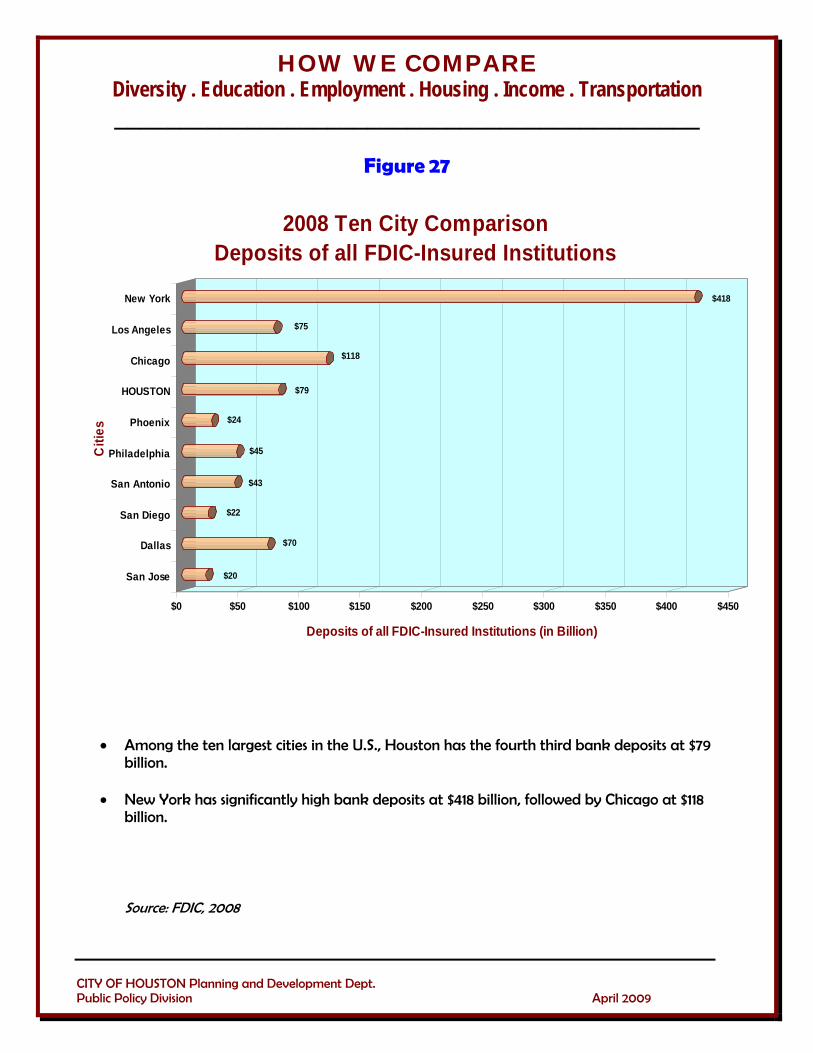
Figure 27
$20
$70
$22
$43
$45
$24
$79
$118
$75
$418
$0 $50 $100 $150 $200 $250 $300 $350 $400 $450
San Jose
Dallas
San Diego
San Antonio
hiladelphia
Phoenix
HOUSTON
Chicago
Los Angeles
New York
PCiti
es
2008 Ten City Comparison Deposits of all FDIC-Insured Institutions
Deposits of all FDIC-Insured Institutions (in Billion)
• Among the ten largest cities in the U.S., Houston has the fourth third bank deposits at $79 billion.
CITY OF HOUSTON Planning and Development Dept. Public Policy Division April 2009
• New York has significantly high bank deposits at $418 billion, followed by Chicago at $118 billion.
Source: FDIC, 2008

HOW WE COMPARE Diversity . Education . Employment . Housing . Income . Transportation ____________________________________________
CITY OF HOUSTON Planning and Development Dept. Public Policy Division April 2009
Density

HOW WE COMPARE Diversity . Education . Employment . Housing . Income . Transportation ____________________________________________
Figure 28
305
498
234
656
517
135
467
385 372
175
-
100
200
300
400
500
600
700
CITY OF HOUSTON Planning and Development Dept. Public Policy Division April 2009
Land
Are
a in
Squ
are
Mile
s
New York
Los Angele
s
Chicago
HOUSTON
Phoenix
Philadelp
hia
San A
ntonio
San D
iego
Dallas
San Jo
se
Cities
2008 Ten City ComparisonLand Area in Square Miles
• Compared to the ten largest cities in the U.S., Houston has the largest geographical area (656 square miles), followed by Phoenix (517 square miles).
• The City of Philadelphia has the least land area at 135 square miles, followed by San Jose, at
175 square miles.
Source: Compiled by Planning and Development Dept. 2009

HOW WE COMPARE Diversity . Education . Employment . Housing . Income . Transportation ____________________________________________
Figure 29
321305
469498
229 234
636656
514517
135 135
512467
385 385
342372
175175
-
100
200
300
400
500
600
700
CITY OF HOUSTON Planning and Development Dept. Public Policy Division April 2009
Tota
l Lan
d A
rea
New York
Los Angele
s
Chicago
HOUSTON
Phoenix
Philadelp
hia
San A
ntonio
San D
iego
Dallas
San Jo
se
Cities
2004-08 Ten City ComparisonLand Area Change in Square Miles
2004 2008
• Houston gained 3% land area from 636 square miles in 2004 to 656 square miles in 2008.
• Between the same years, the City of San Antonio lost 9% or 45 square miles, the largest decrease in land area compared to the other major cities.
Source: Compiled by Planning and Development Dept. 2009

HOW WE COMPARE Diversity . Education . Employment . Housing . Income . Transportation ____________________________________________
Figure 30
5,374
3,335
3,291
2,846
10,728
3,000
3,384
12,122
7,695
27,130
0 5,000 10,000 15,000 20,000 25,000 30,000
New York
Los Angeles
Chicago
HOUSTON
Phoenix
Philadelphia
San Antonio
San Diego
Dallas
San Jose
Citi
es
2008 Ten City ComparisonPopulation Density (Persons Per Square Mile)
Population Density
CITY OF HOUSTON Planning and Development Dept. Public Policy Division April 2009
• New York has the highest density (27,130 persons per square mile), followed by Chicago and Philadelphia.
• San Antonio has the lowest density at 2,846 persons per square mile. Houston and Dallas
have comparable densities.
• Houston has the fifth lowest density compared to the major cities, with 3,384 persons per square mile.
Source: Compiled by Planning and Development Dept. 2009

HOW WE COMPARE Diversity . Education . Employment . Housing . Income . Transportation ____________________________________________
CITY OF HOUSTON Planning and Development Dept. Public Policy Division April 2009
Housing

HOW WE COMPARE Diversity . Education . Employment . Housing . Income . Transportation ____________________________________________
Figure 31
299,218
510,591
501,609
486,568
660,244
543,568
855,839
1,173,754
1,356,808
3,306,212
0 500,000 1,000,000 1,500,000 2,000,000 2,500,000 3,000,000 3,500,000 4,000,000
New York
Los Angeles
Chicago
HOUSTON
Phoenix
iladelphia
San Antonio
San Diego
Dallas
San Jose
PhCiti
es
2007 Ten City ComparisonTotal Housing Units
Housing Units
CITY OF HOUSTON Planning and Development Dept. Public Policy Division April 2009
• Houston has the fourth highest number of housing units among the ten largest cities.
• New York’s figure is similar to a cumulative total of housing units in Los Angeles, Chicago and Houston.
Source: U.S. Census Bureau, American Community Survey, 2007

HOW WE COMPARE Diversity . Education . Employment . Housing . Income . Transportation ____________________________________________
Figure 32
88.4% 11.6%
95.9% 4.1%
86.3% 13.7%
92.6% 7.4%
90.2% 9.8%
84.5% 15.5%
89.0% 11.0%
86.3% 13.7%
86.4% 13.6%
94.0% 6.0%
91.4% 8.6%
0% 20% 40% 60% 80% 100%
New York
Los Angeles
Chicago
HOUSTON
Phoenix
hiladelphia
San Antonio
San Diego
Dallas
San Jose
U.S.
P
Citi
es
2007 Ten City ComparisonOccupied and Vacant Housing Units
Occupied and Vacant Housing Units
% Occupied %Vacant
• The U.S. average of occupied units is 88.4%
• Houston, Chicago & Dallas show similar percentages of occupied units.
• Philadelphia shows the highest percentage of vacant units at 15.5%.
CITY OF HOUSTON Planning and Development Dept. Public Policy Division April 2009
Source: U.S. Census Bureau, American Community Survey, 2007

HOW WE COMPARE Diversity . Education . Employment . Housing . Income . Transportation ____________________________________________
Figure 33
67.3% 32.7%
61.6% 38.4%
47.0% 53.0%
50.5% 49.5%
60.6% 39.4%
57.4% 42.6%
60.9% 39.1%
47.2% 52.8%
49.3% 50.7%
39.9% 60.1%
33.9% 66.1%
0% 20% 40% 60% 80% 100%
New York
Los Angeles
Chicago
HOUSTON
Phoenix
Philadelphia
San Antonio
San Diego
Dallas
San Jose
U.S.
Citi
es
2007 Ten City ComparisonOwner Occupied and Renter Occupied Housing Units
Owner Occupied Renter OccupiedOwner Occupied and Renter Occupied
• None of the major cities shows a higher percentage of occupied units than the U.S. average of 67.3%
• New York has the highest percentage of renter occupied units at 66.1%, followed by Los
Angeles at 60%.
CITY OF HOUSTON Planning and Development Dept. Public Policy Division April 2009
• Houston ranks 4th among renter occupied units, at 52.8%.
Source: U.S. Census Bureau, American Community Survey, 2007

HOW WE COMPARE Diversity . Education . Employment . Housing . Income . Transportation ____________________________________________
Figure 34
9,762
13,461
16,505
12,529
1,972
7,328
3,760
6,497
1,942
-
2,000
4,000
6,000
8,000
10,000
12,000
14,000
16,000
18,000
CITY OF HOUSTON Planning and Development Dept. Public Policy Division April 2009
Tota
l Bui
ldin
g Pe
rmits
Los Angele
s
Chicago
HOUSTON
Phoenix
Philadelp
hia
San A
ntonio
San D
iego
Dallas
San Jo
se
Cities
2007 Ten City ComparisonResidential Building Permits
• Houston issued the highest number of residential permits (16,505) in 2007 among the major U.S. cities.
• San Jose issued the fewest permits issued (1,942), followed by Philadelphia (1,972).
Note: Data for New York is not reported. Source: U.S. Census Bureau, Building Permit Data, 2007

HOW WE COMPARE Diversity . Education . Employment . Housing . Income . Transportation ____________________________________________
Figure 35
1,551
8,211
870
12,591
6,525
9,980
6,560
5,969
591
1,381
4,253
3,075
748
3,012
2,090
4,407
325
1,617
-
2,000
4,000
6,000
8,000
10,000
12,000
14,000
16,000
18,000
CITY OF HOUSTON Planning and Development Dept. Public Policy Division April 2009
Sing
le a
nd M
ulti
Fam
ily P
erm
its
Los Angele
s
Chicago
HOUSTON
Phoenix
Philadelp
hia
San A
ntonio
San D
iego
Dallas
San Jo
se
Cities
2007 Ten City ComparisonSingle and Multi Family Permits
Single Family Multi-Family
• Chicago and New York show a significant number of multi-family permits that were issued in 2007.
• Houston and Phoenix have issued a similar number of permits for constructing multi-family
units.
• Only Philadelphia and San Jose have issued fewer single family permits.
Note: Data for New York is not reported. Source: U.S. Census Bureau, Building Permit Data, 2007

HOW WE COMPARE Diversity . Education . Employment . Housing . Income . Transportation ____________________________________________
Figure 36
$492,400
$594,900
$270,700
$119,300
$230,300
$117,500$96,100
$567,100
$128,200
$665,200
$181,800
$-
$100,000
$200,000
$300,000
$400,000
$500,000
$600,000
$700,000
CITY OF HOUSTON Planning and Development Dept. Public Policy Division April 2009
Med
ian
Hou
sing
Val
ue
New YorkLos A
ngeles
Chicago
HOUSTON
Phoenix
Philadelp
hiaSan
Antonio
San D
iego
Dallas
San Jo
se U.S.
Cities
2007 Ten City Comparison Median Housing Value
• Houston’s median housing value is third lowest ($119,300) after Philadelphia ($117,500) and San Antonio ($96,100).
• The U.S. median housing value is $181,800. Houston’s median value is much lower than the
nation.
• The three cities with highest median housing values are in the State of California.
Source: U.S. Census Bureau, American Community Survey, 2007

HOW WE COMPARE Diversity . Education . Employment . Housing . Income . Transportation ____________________________________________
Figure 37
$973 $962
$830
$740$778 $765
$696
$1,184
$738
$1,227
$781
$-
$200
$400
$600
$800
$1,000
$1,200
$1,400
CITY OF HOUSTON Planning and Development Dept. Public Policy Division April 2009
Med
ian
Con
tract
Ren
t
New YorkLos A
ngeles
Chicago
HOUSTON
Phoenix
Philadelp
hiaSan
Antonio
San D
iego
Dallas
San Jo
se U.S.
Cities
2007 Ten City Comparison Median Contract Rent
• The highest median contract rent is in San Jose and San Diego, showing $1,227 and $1,184, respectively.
• Houston had the third lowest median contract rent at $740.
• The median contract for the nation is $781.
Source: U.S. Census Bureau, American Community Survey, 2007

HOW WE COMPARE Diversity . Education . Employment . Housing . Income . Transportation ____________________________________________
Figure 38
$ 469,700
$ 437,500
$ 593,600
$402,100
$ 246,600
$ 245,600$ 152,500
$151,600
$257,400
$191,300
$ 234,900
$ 231,400$153,200
$152,800
$588,700
$ 385,600
$ 150,900
$ 145,800
$ 836,800
$ 668,000
$ 217,900
$197,100
$-
$100,000
$200,000
$300,000
$400,000
$500,000
$600,000
$700,000
$800,000
$900,000
CITY OF HOUSTON Planning and Development Dept. Public Policy Division April 2009
Med
ian
Sale
Pric
e
New York
Los A
ngeles
Chicago
HOUSTON
Phoenix
Philadelp
hiaSan
Anto
nioSan
Dieg
o
Dallas
San Jo
se U.S.
Major Metropolitan Areas
2007 & 2008 Ten City Comparison Median Sale Price of Single Family Homes (Metro Areas)
Median Sale Price 2007 Median Sale Price 2008
• San Diego witnessed the largest decline in the median sale price of single family homes (-34%) from $588,700 in 2007 to $385,600 in 2008, followed by Los Angeles (-32%) and Phoenix (-26%).
• Houston and Philadelphia have experienced the smallest declines in median sale prices for
the same period (-1%).
• In 2008, the lowest median sale price for single family homes was in Dallas at $145,800, followed by Houston at $151,600.
Source: National Association of Realtors, 2007 & 2008

HOW WE COMPARE Diversity . Education . Employment . Housing . Income . Transportation ____________________________________________
CITY OF HOUSTON Planning and Development Dept. Public Policy Division April 2009
Public Safety

HOW WE COMPARE Diversity . Education . Employment . Housing . Income . Transportation ____________________________________________
Figure 39
149
155
254
160
463
203
222
482
249
428
0 50 100 150 200 250 300 350 400 450 500
San Jose
San Diego
Dallas
San Antonio
hiladelphia
Phoenix
HOUSTON
Chicago
Los Angeles
New York
PCiti
es
2007 Ten City ComparisonPolice Officers per 100,000 population
Police Officers per 100,000 population
• In Houston, the number of police officers per 100,000 persons is 222, which is fifth highest in the nation.
• Chicago, New York and Philadelphia have the highest number of officers per capita (more
than 400).
CITY OF HOUSTON Planning and Development Dept. Public Policy Division April 2009
• San Jose has the lowest number at 149 police officers per 100,000 persons.
Note: 2008 data is not available. Source: FBI, Uniform Crime Report, 2007
HOW WE COMPARE Diversity . Education . Employment . Housing . Income . Transportation ____________________________________________
Figure 40
2,960
4,071
7,674
6,883
5,724
6,506
6,698
3,371
2,416
- 1,000 2,000 3,000 4,000 5,000 6,000 7,000 8,000
CITY OF HOUSTON Planning and Development Dept. Public Policy Division April 2009
Number of Crimes per 100,000 population
San Jose
San Diego
Dallas
San Antonio
hiladelphia
Phoenix
HOUSTON
Los Angeles
New York
P
Citi
es
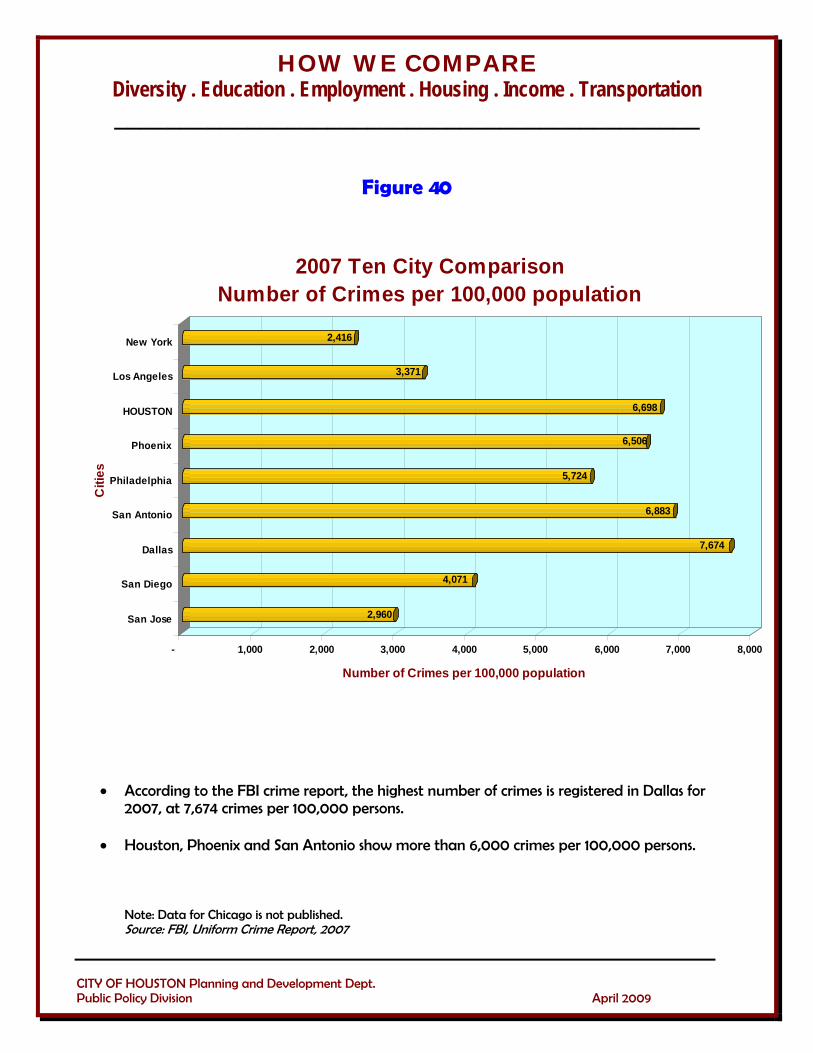
2007 Ten City ComparisonNumber of Crimes per 100,000 population
• According to the FBI crime report, the highest number of crimes is registered in Dallas for 2007, at 7,674 crimes per 100,000 persons.
• Houston, Phoenix and San Antonio show more than 6,000 crimes per 100,000 persons.
Note: Data for Chicago is not published. Source: FBI, Uniform Crime Report, 2007
HOW WE COMPARE Diversity . Education . Employment . Housing . Income . Transportation ____________________________________________
CITY OF HOUSTON Planning and Development Dept. Public Policy Division April 2009
Transportation
HOW WE COMPARE Diversity . Education . Employment . Housing . Income . Transportation ____________________________________________
Figure 41
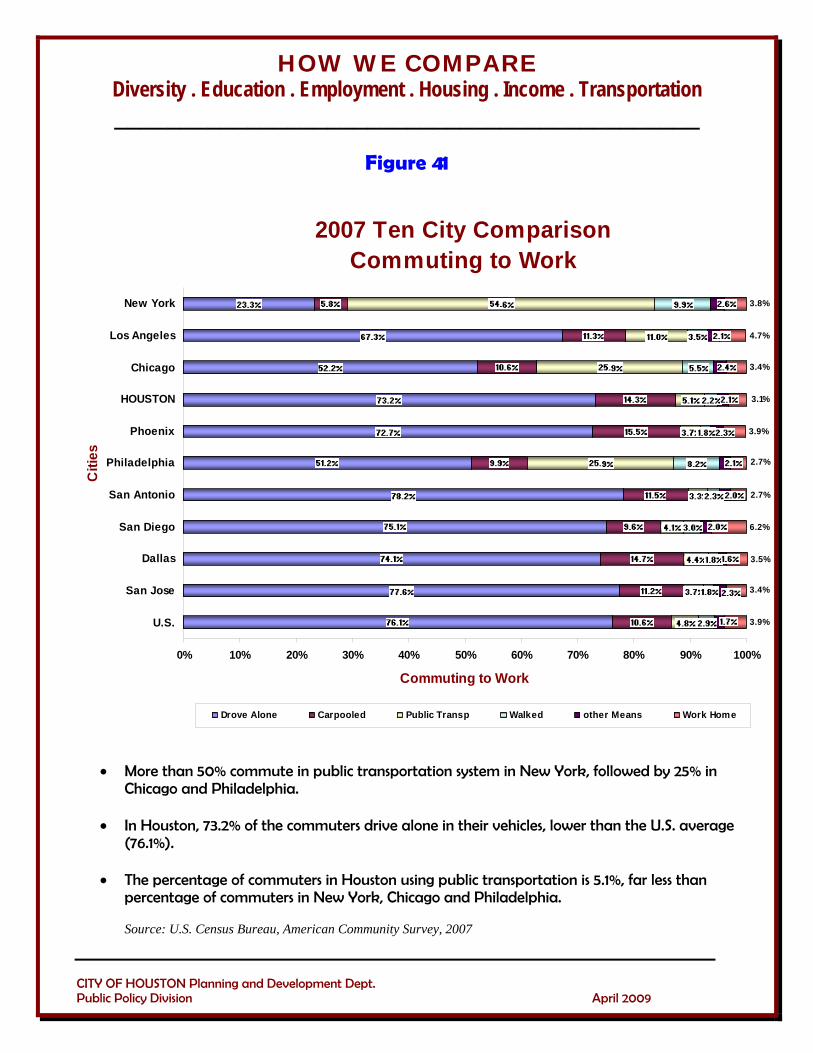
2007 Ten City ComparisonCommuting to Work
3.9%
3.4%
3.5%
6.2%
2.7%
2.7%
3.9%
3.1%
3.4%
4.7%
3.8%
0% 10% 20% 30% 40% 50% 60% 70% 80% 90% 100%
U.S.
San Jose
Dallas
San Diego
San Antonio
Philadelphia
Phoenix
HOUSTON
Chicago
Los Angeles
New York
Citi
es
Commuting to Work
Drove Alone Carpooled Public Transp Walked other Means Work Home
CITY OF HOUSTON Planning and Development Dept. Public Policy Division April 2009
• More than 50% commute in public transportation system in New York, followed by 25% in Chicago and Philadelphia.
• In Houston, 73.2% of the commuters drive alone in their vehicles, lower than the U.S. average
(76.1%).
• The percentage of commuters in Houston using public transportation is 5.1%, far less than percentage of commuters in New York, Chicago and Philadelphia. Source: U.S. Census Bureau, American Community Survey, 2007

HOW WE COMPARE Diversity . Education . Employment . Housing . Income . Transportation ____________________________________________
Figure 42
5.8%
11.3%10.6%
14.3%15.5%
9.9%
11.5%
9.6%
14.7%
11.2% 10.6%
0%
2%
4%
6%
8%
10%
12%
14%
16%
CITY OF HOUSTON Planning and Development Dept. Public Policy Division April 2009
Hig
h Sc
hool
Gra
duat
es P
erce
nt
New York
Los Angele
s
Chicago
HOUSTON
Phoenix
Philadelp
hia
San Antonio
San Dieg
oDalla
s
San Jo
se U.S.
Cities
2007 Ten City ComparisonCar Pool to Work
• Phoenix shows the highest percentage (15.5%) of commuters taking a car pool to work, followed by Dallas (14.7%) and Houston (14.3%).
• The U.S. average for commuters car pooling to work is 10.6%.
• New York has the lowest percentage of commuters car pooling to work at 5.8%.
Source: U.S. Census Bureau, American Community Survey, 2007

HOW WE COMPARE Diversity . Education . Employment . Housing . Income . Transportation ____________________________________________
Figure 43
2005 Ten City Comparison Congestion Cost Per Peak Traveler
$1,
Cities
Con
gest
ion
Cos
t
$1,3
74
$906 $1
,012
$981
$711
$706
$1,0
46
$1,0
65
$973
$888
$0
$200
$400
$600
$800
000
$1,200
$1,400
$1,600
New Yor
k
Los A
ngeles
Chicag
o
HOUSTON
Phoen
ix
Philad
elphia
San A
ntonio
San D
iego
Dallas
San Jo
se
• The City of Los Angeles has the highest Congestion Cost Per Peak Traveler ($1,374).
• Houston ranks fourth among other major cities.
CITY OF HOUSTON Planning and Development Dept. Public Policy Division April 2009
• Sa Antonio’s congestion cost is the lowest, followed by Philadelphia, at $706 and $711, respectively.
Data for 2007 is not available. Note: Congestion Cost Per Traveler means dollar value of travel delay and extra fuel consumed in traffic congestion annually per peak traveler.Source: Texas Transportation Institute, The 2007 Urban Mobility Report

HOW WE COMPARE Diversity . Education . Employment . Housing . Income . Transportation ____________________________________________
Figure 44
46
72
46
56
48
3839
58 5754
0
10
20
30
40
50
60
70
80
CITY OF HOUSTON Planning and Development Dept. Public Policy Division April 2009
Pers
on H
ours
of D
elay
Per
Pea
k Tr
avel
ler
New York
Los Angele
s
Chicago
HOUSTON
Phoenix
Philadelp
hia
San A
ntonio
San D
iego
Dallas
San Jo
se
Cities
2005 Ten City ComparisonPerson Hours of Delay Per Peak Traveler
• Los Angeles leads the nation’s other cities in terms of Person Hours Delay Per Peak Traveler,
at 72 hours, followed by San Diego at distant second, at 58 hours.
• Houston ranks fourth among other major cities.
• The lowest number of delay hours is registered for Philadelphia.
Data for 2007 is not available. Note: Hours of Delay Per Traveler means the extra time required during peak conditions compared to free flow conditions. The hours of delay per peak traveler – those who begin a trip during the morning or evening peak travel periods (6 to 9 a.m. or 4 to 7 p.m.) Source: Texas Transportation Institute, The 2007 Urban Mobility Report

HOW WE COMPARE Diversity . Education . Employment . Housing . Income . Transportation ____________________________________________
Figure 45
1.22
1.33
1.19 1.151.09 1.1 1.07
1.12 1.13 1.16
0
0.2
0.4
0.6
0.8
1
1.2
1.4
1.6
CITY OF HOUSTON Planning and Development Dept. Public Policy Division April 2009
Trav
el T
ime
Inde
xNew York
Los Angele
s
Chicago
HOUSTON
Phoenix
Philadelp
hiaSan
Antonio
San D
iego
Dallas
San Jo
se
Cities
2005 Ten City Comparison Travel Time Index
• Travel Time Index indicated additional time needed to commute due to congestion.
• Los Angeles registers for 30% more time needed to commute, followed by New York at 22%.
• Houston ranks sixth in terms of more time needed to commute due to congestion at 15%.
Data for 2007 is not available. Note: The Travel Time Index (TTI) is the ratio of peak period travel time to free flow travel time. The TTI expresses the average amount of extra time it takes to travel in the peak relative to free-flow travel. A TTI of 1.3, for example, indicates a 20-minute free-flow trip will take 26 minutes during the peak travel time periods, a 6-minute (30 percent) travel time penalty. Source: Texas Transportation Institute, The 2007 Urban Mobility Report

HOW WE COMPARE Diversity . Education . Employment . Housing . Income . Transportation ____________________________________________
CITY OF HOUSTON Planning and Development Dept. Public Policy Division April 2009
Data Sources
• U.S. Census Bureau: American Community Survey, 2007 • U.S. Census Bureau: Building Permits, 2007 • Bureau of Labor Statistics, 2008 & 2009 • Texas Transportation Institute: The 2007 Urban Mobility Report, 2005 • FDIC: Bank Deposits of all FDIC-Insured Institutions, 2008 • National Association of Realtors, 2007 & 2008 • FBI: Police and Crime data, 2007 • Planning Dept Research: Land Area, Hotel, Meals, 2009
***********