Embed Size (px)
Citation preview
BACKGROUNDERNo. 3594 | March 11, 2021
cENTEr FOr EDUcaTION POLIcY
This paper, in its entirety, can be found at http://report.heritage.org/bg3594
The heritage Foundation | 214 Massachusetts avenue, NE | Washington, Dc 20002 | (202) 546-4400 | heritage.org
Nothing written here is to be construed as necessarily reflecting the views of The Heritage Foundation or as an attempt to aid or hinder the passage of any bill before Congress.
Housing Redlining and Its Lingering Effects on Education OpportunityLindsey M. Burke, PhD, and Jude Schwalbach
Federally sanctioned redlining in the 1930s highlights the negative conse-quences of government intervention in the housing market, which has ripple effects on education.
KEY TAKEAWAYS
Unevenness in education opportunity per-sists in part because schooling is tied to housing, with public school access deter-mined by attendance zone boundaries.
There is a specific remedy to this problem. Districts should cease drawing attendance zone boundaries, and states should adopt broad school choice policies.
In the early 20th century, the federal government engaged in housing “redlining”—a practice that conditioned access to federally backed home loans
on the perceived economic health of a neighborhood and used demographic factors such as race in those decisions. Redlining is a term derived from maps drawn by the Home Owners Loan Corporation (HOLC) in the 1930s, which color-coded neighborhoods, using red to denote areas that were perceived to be “hazardous” for lending. This practice of redlining had an effect on access to credit and where people could live and, because where families live determines what public schools their children attend, meant families living in “hazardous” areas were often zoned to underperforming schools.
Although in the 1960s and 1970s Congress reversed actions taken by government officials in the early 20th century to segregate housing in both the South and
March 11, 2021 | 2BACKGROUNDER | No. 3594heritage.org
the North, the ripple effects on education are still felt today. Education opportunity remains limited in part as a result of attendance zone bound-aries maintained by school districts across the country. Too often, there appears to be a strong similarity between 1930s-era redlining maps and the attendance zone boundaries within school district borders.
Unevenness in education opportunity persists in large part because schooling is tied to housing, with the public school a student can attend being a function of the attendance zone boundary in which his or her home is located. This arrangement impedes opportunity, limits choice, and pre-vents parents from selecting a school that is the best fit for their child. There is, however, a clear policy remedy to diminish the lasting negative effects of government redlining in the housing sector on education access. Correcting course largely depends on state- and local-level action—namely, school dis-tricts should cease drawing attendance zone boundaries within their borders, residentially assigning students to particular public schools based on zip code or other geographic criteria. At the same time, broader reforms geared toward funding students directly through education choice measures would help all students select into learning environments that fit them best.
Housing and Schooling “Practically Enmeshed”
Housing and schooling are intrinsically linked in the United States, not only in terms of education opportunity, but also in terms of property values. As Dartmouth economist William A. Fischel explains, “Schools matter for property values. A house built on the favorable side of a school district line may have its value enhanced by 10 or 20 percent, a boundary-line premium that is seldom matched by any municipal boundary unless the city and school district boundaries are the same.”1 The Joint Economic Committee (JEC) recently found that “the average U.S. ZIP code associated with the highest quality (A+) public elementary school has a 4-fold ($486,104) higher median home price than the average neighborhood associated with the lowest quality (D or less) public elementary schools ($122,061).”2 For more than 70 percent of students, where a family can afford to live determines the public school to which their children are assigned.3 Yet, as the JEC explains, although housing and schooling are “practically enmeshed,” with income and housing being a “gateway to educational opportunity,” housing policy and education policy are divorced as issue areas.4 This problem is com-pounded by restrictive zoning policies, which segregate housing by income.5
Although Congress outlawed discriminatory lending policies in the mid-20th century, federal policies leading up to that time limited where people
March 11, 2021 | 3BACKGROUNDER | No. 3594heritage.org
could live, creating geographic concentrations of lower-income families and fueling suburban growth for higher-income families. Official practices pertaining to zoning and mortgage lending, along with restrictive cove-nants, impacted the shape of neighborhoods across the country. The effect of those practices was illustrated through federal redlining maps created by the HOLC and advanced by the Federal Housing Administration. Although these redlining maps conveyed reservations about lending in neighbor-hoods that were already economically depressed, making the impact race played in redlining difficult to isolate empirically, official practices outlined in the Federal Housing Administration’s Underwriting Manual make it clear that race did indeed play a role in lending decisions.
Historical Background
The federal government’s involvement in mortgage lending in the early to mid-20th century implicated it in private-sector practice in a way that negatively impacted more black than white borrowers. In 1933, the Franklin D. Roosevelt Administration established the HOLC, which purchased mortgages at risk of foreclosure due to the Great Depression and, for the first time, provided low-interest loans with 15-year repayment schedules.6 Once established, the HOLC made color-coded maps of the majority of metropolitan cities across the country, denoting “desirable” areas in green or blue and “declining” or
“hazardous” areas in yellow or red, respectively. These maps reflected policies conditioning access to government-backed home loans on living or building in “desirable” areas. Writing for the Federal Reserve Banks of Chicago and Richmond, Michael Berry and Jessie Romero explain that “redlined” areas
“had a large minority population, poorer households, and older housing stock.”7
The HOLC created such maps of 239 metropolitan areas throughout the United States. Experts disagree, however, about the impact of the HOLC’s maps on African Americans’ ability to secure home loans, as they were “nei-ther a blanket guarantee nor proscription for New Deal aid.”8 Some scholars have argued that rather than creating discriminatory lending practices, the maps reflected reticence to lend in neighborhoods that were already eco-nomically depressed. Economists Price Fishback, Jessica LaVoice, Allison Shertzer, and Randall Walsh write that
the HOLC maps are best viewed as providing clear evidence of how decades
of unequal treatment effectively limited where black households lived in
the 1930s rather than reflecting racial bias in the construction of the maps
themselves.9
March 11, 2021 | 4BACKGROUNDER | No. 3594heritage.org
Similarly, as University of Pennsylvania housing and planning scholar Amy Hillier has noted, the HOLC maps, rather than being the genesis of dis-criminatory lending policies, instead reflected the impact of existing local practices. Moreover, she explains that the HOLC did indeed underwrite loans to African Americans and had actually completed its lending prior to finishing the first set of redlining maps.10
Although a matter of debate, scholars of housing policy in this era agree that the maps “compiled the common understanding of local level lending decision makers of the risk in the neighborhoods of their cities” and indicated
“areas which may have been subject to ‘redlining’ by banks when making lend-ing decisions.”11 Although the HOLC’s maps were not used to gauge mortgage qualification,12 and while more recent scholarship has demonstrated that the HOLC did lend to African American buyers,13 the HOLC’s lending practices provided financing “in already-established centers of black residence”14 and
“did so in ways that reinforced racial segregation”15 by “codifying already existing boundaries and restrictions that were created by developers and homeowners associations,”16 which had often included restrictive covenants.
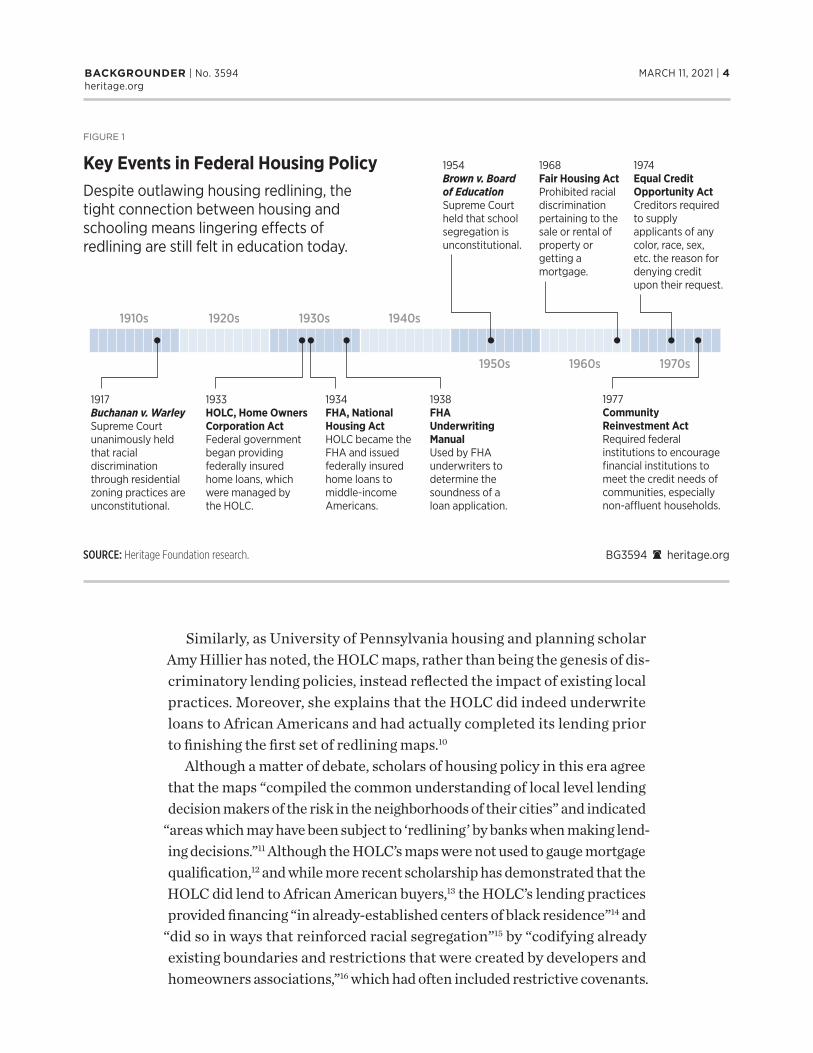
1917Buchanan v. Warley Supreme Court unanimously held that racial discrimination through residential zoning practices are unconstitutional.
1933HOLC, Home Owners Corporation ActFederal government began providing federally insured home loans, which were managed by the HOLC.
1934FHA, National Housing ActHOLC became the FHA and issued federally insured home loans to middle-income Americans.
1938FHA Underwriting ManualUsed by FHA underwriters to determine the soundness of a loan application.
1954Brown v. Board of EducationSupreme Court held that school segregation is unconstitutional.
1968Fair Housing ActProhibited racial discrimination pertaining to the sale or rental of property or getting a mortgage.
1974Equal Credit Opportunity ActCreditors required to supply applicants of any color, race, sex, etc. the reason for denying credit upon their request.
1977Community Reinvestment ActRequired federal institutions to encourage financial institutions to meet the credit needs of communities, especially non-a�uent households.
1910s 1920s 1930s 1940s
1950s 1960s 1970s
BG3594 A heritage.orgSOURCE: Heritage Foundation research.
FIGURE 1
Key Events in Federal Housing PolicyDespite outlawing housing redlining, the tight connection between housing and schooling means lingering e�ects of redlining are still felt in education today.
March 11, 2021 | 5BACKGROUNDER | No. 3594heritage.org
The Federal Housing Administration (FHA), established in 1934 to provide federally insured private home loans, thus making mortgages available to middle-income Americans, did more to reinforce housing seg-regation than the HOLC did, argue scholars such as Hillier. For example, in 1938 the FHA published an Underwriting Manual17 that contained uni-form underwriting standards and distributed it to all FHA underwriters. Although the manual incorporated numerous factors into its algorithm for determining the soundness of a home loan—including the structural soundness of the dwelling, “architectural attractiveness,” and “resistance to elements”—it also included more nefarious underwriting “standards,” such as whether “incompatible racial and social groups are present” in surrounding neighborhoods. “If a neighborhood is to retain stability, it is necessary that properties shall continue to be occupied by the same social and racial classes,” Section 937 of the manual reads.18 The algo-rithms favored suburbs over urban areas and led to “mortgage insuring patterns that drove urban decline.”19 The Underwriting Manual also made explicit the link between housing and schooling. As the manual states, “[I]f the children of people living in such an [desirable] area are compelled to attend school where the majority or a considerable number of the pupils represent a far lower level of society or an incompatible racial element, the neighborhood under consideration will prove far less stable and desirable than if this condition did not exist.”20
Although lenders’ use of underwriting standards for home loans and loan insurance is rational, as banks incur significant losses in the event of loan defaults, early 20th-century laws and policies crafted by federal officials went beyond these basic determinations of a home’s or neighborhood’s soundness. In 1968, President Lyndon Johnson signed into law the Fair Housing Act, which prohibited racial discrimination in the sale or lease of housing. Congress followed that law with the Equal Credit Opportunity Act of 1974, which prohibited discrimination on the basis of race, sex, and marital status, and the Community Reinvestment Act of 1977, which out-lawed redlining.21
Although mid-century efforts prohibited the type of discrimination evi-dent in the Underwriting Manual and reflected in HOLC redlining maps, going forward, they “did nothing to reverse residential patterns that had become deeply embedded.”22 And because of the tight connection between housing and schooling, the impact on education opportunity remains in the 21st century.
March 11, 2021 | 6BACKGROUNDER | No. 3594heritage.org
BG3594 A heritage.org
SOURCES: Tim DeRoche, A Fine Line: How Most American Kids Are Kept Out of the Best Public Schools (Los Angeles: Redtail Press, 2020); “Mapping Inequality,” https://dsl.richmond.edu/panorama/redlining/ (accessed March 4, 2021); and Heritage Foundation research.
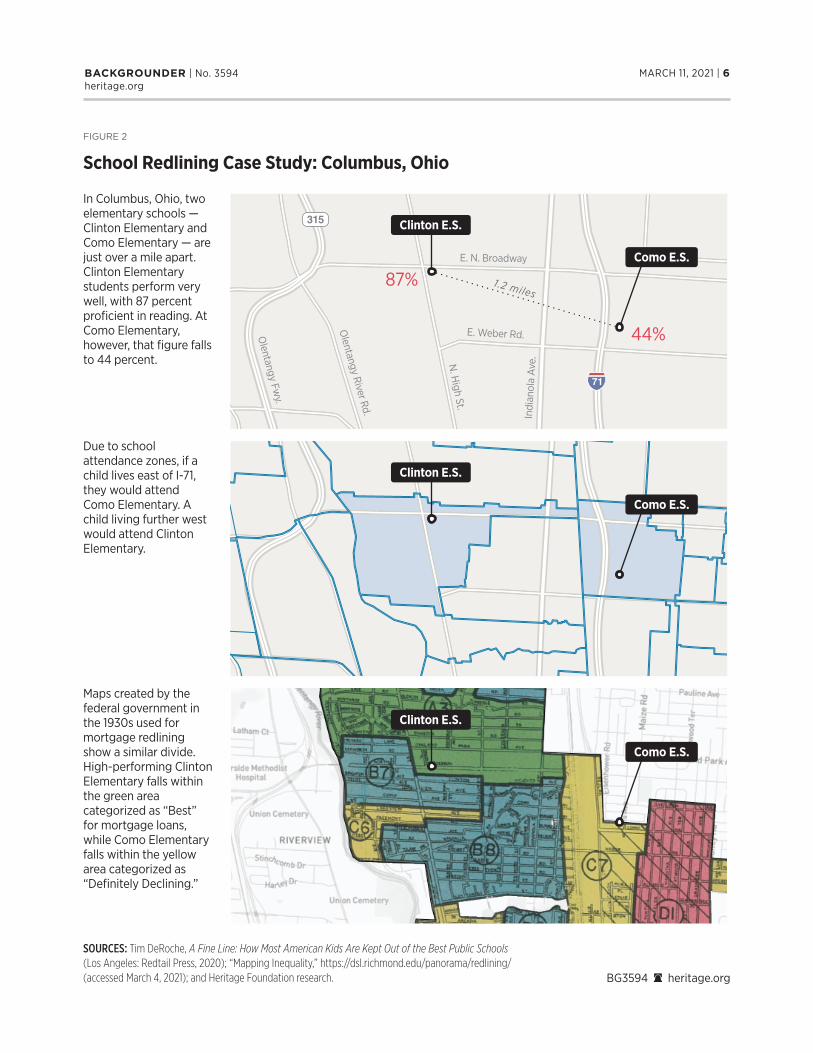
FIGURE 2
School Redlining Case Study: Columbus, Ohio
In Columbus, Ohio, two elementary schools — Clinton Elementary and Como Elementary — are just over a mile apart. Clinton Elementary students perform very well, with 87 percent proficient in reading. At Como Elementary, however, that figure falls to 44 percent.
Due to school attendance zones, if a child lives east of I-71, they would attend Como Elementary. A child living further west would attend Clinton Elementary.
Maps created by the federal government in the 1930s used for mortgage redlining show a similar divide. High-performing Clinton Elementary falls within the green area categorized as “Best” for mortgage loans, while Como Elementary falls within the yellow area categorized as “Definitely Declining.”
Clinton E.S.
Como E.S.
Clinton E.S.
Como E.S.
Clinton E.S.
Como E.S.
E. N. Broadway
E. Weber Rd.
N. H
igh St.
Olentangy River Rd.
Olentangy Fw
y.In
dian
ola
Ave
.
1.2 miles87%
44%
March 11, 2021 | 7BACKGROUNDER | No. 3594heritage.org
Limits to Education Opportunity in the 21st Century
The Supreme Court outlawed school segregation in Brown v. Board of Education (1954), yet many schools remain racially and econom-ically segregated. As author Tim DeRoche argues in his book A Fine Line: How Most American Kids Are Kept Out of the Best Public Schools,23 de facto “educational redlining” is maintained in the 21st century in two ways: through school district lines and through attendance zone boundaries.
School District Boundaries (Lines Between School Districts). Early 20th-century housing policy had an impact on the shape of school districts and boundary lines within districts, as did the desire to move away from one-room schools to age-graded schools. Demand for high schools at the time also contributed to the development of school districts.24 Today, school districts function as “geographic entities and single purpose governmental units that operate schools and provide public educational services at the local level.”25 The distinction between school districts and attendance zones is a legal one:
Attendance zones are administrative service areas. Government employees
carve up the map and determine who gets preferred enrollment at what
school. There are no elected officials at the attendance-zone level, and the
residents of an attendance zone are not subject to special taxes. School-dis-
trict boundaries, by contrast, are political subdivisions. They are jurisdictional.
As governmental entities, school districts are typically overseen by elected
or appointed school board members. School districts often have the legal
authority to assess taxes on their constituents or issue bonds in order to fund
the district’s activities.26
The school boards that oversee school districts yield significant policy power. There are nearly 14,000 school boards and 100,000 school board members managing school districts across the country. Those school board members determine curricular content, school bus routes, and superin-tendent hiring and pay; influence district budgets, spending, construction projects, and school calendars; and navigate collective bargaining processes, among numerous other tasks.
Not only do school districts create a geographic boundary containing all public schools within the district, but critically, school boards and district officials determine the attendance zone boundaries within the school dis-trict they govern.
March 11, 2021 | 8BACKGROUNDER | No. 3594heritage.org
Attendance Zone Boundaries (Lines Within Districts). In most states, school district officials and local school boards establish attendance zone boundaries—lines within school districts—assigning students to public schools based on where they live. This means that even within the same school district, students living in neighboring attendance zones could have dramatically different educational opportunities and outcomes, determined by which side of a street they live on.
Historian Meyer Weinberg, in his 1967 report Race and Place: A Legal History of the Neighborhood School, showed that many districts’ atten-dance boundaries in the mid-20th century were racially motivated, used to “to replace the former system of school assignment by race. And they gerrymandered the boundaries so as to keep the races separate, while avoiding the explicit racial segregation that had been forbidden by the courts.”27 In the mid-1960s, federal policymakers introduced bills to prohibit districts from continuing to draw attending zone boundaries
“to achieve or perpetuate racial imbalance.”28 Nonetheless, by dictating which public schools children may attend based on where they live, these boundaries limit education opportunity for families within the same neighborhood. Some even argue that these boundaries appear similar to those used for redlining.29
Currently, attendance zone boundaries are drawn by school dis-trict officials in accordance with state law (in some cases required by state law, in other cases not prohibited by state law). As DeRoche suggests, although a school district boundary may protect against non-residents enrolling in schools paid for by local residents, this is not the case with attendance zone boundaries, as all schools within a district are financed by the same local tax base. According to the Con-gressional Research Service, “Under the traditional, and still most common, method of allocating resources within [school districts], there are no specific budgets for individual schools. Available state and local funds are managed centrally, by [local educational agency] staff, and various resources—facilities, teachers, support staff, school administrators, instructional equipment, etc.—are assigned to indi-vidual schools.”30
Open Enrollment Policies. School district lines and attendance zone boundaries dictate which taxpayer-funded public schools a child may attend. Over 70 percent of public school students attend their assigned (i.e., attendance-zone-dictated) schools.31 These administrative boundaries sort students to schools regardless of performance or fit.
March 11, 2021 | 9BACKGROUNDER | No. 3594heritage.org
Today, only 19 states allow for intradistrict public school choice, which effectively erases attendance zone boundaries.32 And, although 30 states have some form of interdistrict public school choice (meaning students can attend public schools outside their districts), just 23 out of those 30 require public schools to admit students from outside their districts. That means the receiving school district—rather than the parents—has the final say as to whether or not a student from a neighboring school district may enroll. Even in states with open enrollment policies—meaning any student may attend any school within or outside his or her district—families may still be excluded from attending their chosen public schools.
Special Interest Groups Fight to Maintain Residential Assignment
There are no more politically powerful interest groups in education than the two national teachers’ unions. The National Education Association (NEA) boasts three million members,33 and the American Federation of Teachers (AFT) reports 1.7 million members.34 The NEA collected $375 million in dues revenues in 2019,35 and the AFT and its affiliates brought in an estimated $587 million in revenue in 2018.36 The two unions spend tens of millions annually on political campaigns and initiatives. The NEA raised $23 million to fund outside campaigns through its NEA Advocacy Fund in 2020, 99 percent of which went to Democratic candidates. Similarly, more than 98 percent of the campaign money raised by the AFT during the 2020 election cycle went to Democrats.37 Support of policies that maintain the status quo—including opposition to school choice measures, increased spending on traditional district schools, increases in public school person-nel, and support for arrangements such as residential assignment—have made policy changes difficult.
The NEA recognizes the problems inherent in tying housing to school-ing. “Housing and school policies are inextricably linked and deeply affect patterns of school funding and academic success,” stated Harry Lawson, director of the NEA’s Human and Civil Rights Office.38 Yet its solutions are geared toward influencing where school boundary lines are drawn rather than eliminating these antiquated practices. In an NEA-sponsored report on housing and schooling in which the union—ironically—enthusiasti-cally endorsed housing vouchers, the authors suggest that one benefit of
“education advocates” working with housing officials could be reducing “student turnover and churning by keeping children in the same school attendance zone.”39
March 11, 2021 | 10BACKGROUNDER | No. 3594heritage.org
A New Vision—Education Separated from Housing
Federal law does not create a fundamental right to education, nor is education an enumerated power of the federal government. However, every state constitution has some form of guarantee of public education at the elementary and secondary levels for resident students. Therefore, improving education opportunity primarily requires state-level action. The proposals in this paper are consistent with that charge and would carry out this mission. The proposed reforms are to better carry out the spirit and letter of those laws and ensure that all children have access to a quality education.
To that end, states and school districts should:
l Stop creating and maintaining attendance zone boundaries. School districts should cease drawing attendance zone boundaries within their borders and assigning students to particular public schools based on their parents’ address. In the event of oversub-scription—that is, interest in enrollment in a particular public school exceeding available seats—districts should employ a lottery system similar to that used by public charter schools across the country.
l Improve open enrollment. State, district, and public school officials have wide latitude in how these policies are crafted and implemented, with many states giving districts the option to participate or not. Protectionist districts too often decline participation. States should adopt statewide open enrollment policies such as Florida’s, which allows students to enroll in any public school in the Sunshine State and requires all 67 of the state’s school districts to participate.40
l Establish private school choice options. States should also expand access to private schools of choice and learning options such as private tutoring, microschools, and online learning. To do so, states should follow the lead of Arizona, Florida, Mississippi, North Carolina, and Tennessee, and establish education savings accounts (ESAs), providing a portion of the funding that would have been spent on students in the public school system directly to their parents. With ESAs, families can pay for private schools of choice along with any education-related ser-vice, product, or provider. Unused funds can also be rolled over from year to year—and even into a college savings account. Such options have proven particularly beneficial to students with special needs,
March 11, 2021 | 11BACKGROUNDER | No. 3594heritage.org
who, rather than being beholden to frequently litigious individualized education plan battles, can customize and access education services and products that meet their unique needs.41
Time to End Attendance Zone Boundaries
Redlining highlights the long-term negative effects of government inter-vention in the housing market. The individuals who implemented housing redlining policy in the 1930s are gone and cannot be held accountable today, yet the effects of these policies on education remain—a cautionary tale for officials who are inclined to intervene in the market.
Where a family can afford to live should not determine the quality of education to which its children have access. Understanding the history of government-sanctioned redlining policies in the housing sector demon-strates one of many problems with continuing to tie housing to schooling. Underperforming public schools in the 21st century are too often located in the areas “redlined” in the 20th century. Yet local government policies largely maintain attendance zone boundaries and residential assignment, relegating students with few means to whatever public school is on their side of the street. This is an anachronism with a clear policy remedy. Elim-inating attendance zone boundaries within public school districts while pursuing broader school choice efforts, funding children directly rather than systems of schools, can rid education of the artificial barriers continu-ing to limit opportunity for too many children across the country.
Lindsey M. Burke, PhD, is Mark A. Kolokotrones Fellow in Education Policy and Director of
the Center for Education Policy, of the Institute for Family, Community, and Opportunity,
at The Heritage Foundation. Jude Schwalbach is Research Associate and Project
Coordinator in the Center for Education Policy.
March 11, 2021 | 12BACKGROUNDER | No. 3594heritage.org
Endnotes
1. William A. Fischel, Making the Grade: The Economic Evolution of American School Districts (Chicago, IL: University of Chicago Press, 2009).
2. Vanessa Brown Calder, “Zoned Out: How School and Residential Zoning Limit Educational Opportunity,” Joint Economic Committee, U.S. Senate, November 2019, https://www.jec.senate.gov/public/_cache/files/f4880936-8db9-4b77-a632-86e1728f33f0/jec-report-zoned-out.pdf (accessed March 5, 2021).
3. U.S. Department of Education, National Center for Education Statistics, Digest of Education Statistics, 2018 (NCES 2020-009), Table 206.40, https://nces.ed.gov/programs/digest/d18/tables/dt18_206.40.asp (accessed March 5, 2021).
4. Calder, “Zoned Out.”
5. Ibid.
6. Richard Rothstein, The Color of Law (New York: Liveright Publishing Corporation, 2017).
7. Michael Berry and Jessie Romero, “Community Reinvestment Act of 1977,” Federal Reserve Bank History, https://www.federalreservehistory.org/essays/community-reinvestment-act (accessed March 5, 2021).
8. Mapping Inequality, “Redlining in New Deal America,” https://dsl.richmond.edu/panorama/redlining/#loc=5/37.583/-115.84&text=intro (accessed March 5, 2021).
9. Price V. Fishback et al., “Race, Risk, and the Emergence of Federal Redlining,” National Bureau of Economic Research, Working Paper No. 28146, November 2020, https://www.nber.org/papers/w28146 (accessed March 5, 2021).
10. Amy E. Hillier, “Redlining and the Homeowners’ Loan Corporation,” University of Pennsylvania, 2003, https://repository.upenn.edu/cgi/viewcontent.cgi?article=1002&context=cplan_papers (accessed March 5, 2021).
11. Bruce Mitchell and Juan Franco, “HOLC ‘Redlining’ Maps: The Persistent Structure of Segregation and Economic Inequality,” National Community Reinvestment Coalition, 2018, https://ncrc.org/wp-content/uploads/dlm_uploads/2018/02/NCRC-Research-HOLC-10.pdf (accessed March 5, 2021).
12. Ibid.
13. Todd M. Michney and LaDale Winling, “New Perspectives on New Deal Housing Policy: Explicating and Mapping HOLC Loans to African Americans,” Journal of Urban History, Vol. 46, No. 1 (2020), https://journals.sagepub.com/doi/abs/10.1177/0096144218819429 (accessed March 5, 2021).
14. Sarah Shoenfeld, “Mapping Segregation in D.C.,” D.C. Policy Center, April 23, 2019, https://www.dcpolicycenter.org/publications/mapping-segregation-fha/ (accessed March 5, 2021).
15. Michney and Winling, “New Perspectives on New Deal Housing Policy.”
16. Brad Broberg, “Learning from Our Past: The History of the Fair Housing Project,” National Association of Realtors, May 15, 2018, https://www.nar.realtor/on-common-ground/learning-from-our-past-the-history-of-the-fair-housing-act (accessed March 5, 2021).
17. FHA, Underwriting Manual: Underwriting and Valuation Procedure Under Title II of the National Housing Act, 1938, § 937, https://www.huduser.gov/portal/sites/default/files/pdf/Federal-Housing-Administration-Underwriting-Manual.pdf (accessed March 5, 2021).
18. The National Association of Realtors has since denounced the language in the Underwriting Manual. See Broberg, “Learning from Our Past.”
19. Lauren Greenawalt, “The History of U.S. Housing Segregation Points to the Devastating Consequences of Algorithmic Bias,” New America Foundation, December 12, 2018, https://www.newamerica.org/pit/blog/history-us-housing-segregation-points-devastating-consequences-algorithmic-bias/ (accessed March 5, 2021).
20. FHA, Underwriting Manual, § 951.
21. Berry and Romero, “Community Reinvestment Act of 1977.”
22. Rothstein, The Color of Law, preface.
23. Tim DeRoche, A Fine Line: How Most American Kids Are Kept Out of the Best Public Schools (Los Angeles: Redtail Press, 2020).
24. Fischel, Making the Grade.
25. U.S. Department of Education, National Center for Education Statistics, “School District Boundaries,” https://nces.ed.gov/programs/edge/Geographic/DistrictBoundaries (accessed March 5, 2021).
26. DeRoche, A Fine Line, p. 71.
27. Meyer Weinberg, “Race and Place: A Legal History of the Neighborhood School,” Office of Education, 1967, https://files.eric.ed.gov/fulltext/ED023751.pdf (accessed March 5, 2021).
28. Ibid.
29. Unite for Better Education, “Stand Together,” https://www.youtube.com/watch?v=zi76hEjPdhY (accessed March 5, 2021).
March 11, 2021 | 13BACKGROUNDER | No. 3594heritage.org
30. Rebecca R. Skinner, “State and Local Financing of Public Schools,” Congressional Research Service Report for Congress, updated August 26, 2019, https://crsreports.congress.gov/product/pdf/R/R45827 (accessed March 5, 2021).
31. U.S. Department of Education, National Center for Education Statistics, Digest of Education Statistics, 2018, Table 206.40.
32. U.S. Department of Education, National Center for Education Statistics, “Table 4.2. Numbers and Types of Open Enrollment Policies, by State: 2017,” https://nces.ed.gov/programs/statereform/tab4_2.asp (accessed March 5, 2021).
33. National Education Association, “About NEA,” https://www.nea.org/about-nea (accessed March 5, 2021).
34. American Federation of Teachers, “About Us,” https://www.aft.org/about (accessed March 5, 2021).
35. Mike Antonucci, “Analysis: NEA Wants an End to Tax Breaks for the Rich. With Its Hundreds of Millions in Tax-Free Revenue, Those Pleas Ring Hollow,” The 74, December 2, 2020, https://www.the74million.org/article/analysis-nea-wants-an-end-to-tax-breaks-for-the-rich-with-its-hundreds-of-millions-in-tax-free-revenue-those-pleas-ring-hollow/ (accessed March 5, 2021).
36. Mike Antonucci, “Union Report: The Numbers Are Complicated, but AFT Is Worth Around $580 Million, Financial Filings Show,” The 74, January 14, 2020, https://www.the74million.org/article/union-report-the-numbers-are-complicated-but-aft-is-worth-around-580-million-financial-filings-show/ (accessed March 5, 2021).
37. Mike Antonucci, “Analysis: How Much NEA and AFT Are Spending on the 2020 Campaign, and Where They Are Spending It,” The 74, October 21, 2020, https://www.the74million.org/article/analysis-how-much-nea-and-aft-are-spending-on-the-2020-campaign-and-where-they-are-spending-it/ (accessed March 5, 2021).
38. John Rosales, “Fulfilling the Promise of Brown v. Board: From School and Housing Policies to the Courts,” National Education Association, May 10, 2019, https://www.nea.org/advocating-for-change/new-from-nea/fulfilling-promise-brown-v-board-school-and-housing-policies (accessed March 5, 2021).
39. National Education Association, Housing and Schools: The Importance of Engagement for Educators and Education Advocates, https://prrac.org/pdf/NEA-PRRAC_housing-schools.pdf (accessed March 5, 2021).
40. Aaron Garth Smith, “Open Enrollment Provides Substantial Benefits to Students and Families,” Reason, January 28, 2020, https://reason.org/commentary/open-enrollment-provides-substantial-benefits-to-students-and-families/ (accessed March 5, 2021).
41. Lindsey M. Burke and Romina Boccia, “A Bright IDEA: Modernizing the Individuals with Disabilities Education Act to Meet Student Needs and Support Integrated Employment,” Heritage Foundation Backgrounder No. 3520, August 12, 2020, https://www.heritage.org/education/report/bright-idea-modernizing-the-individuals-disabilities-education-act-meet-student.


![pf.circuitdebater.orgTFA_19)_AC... · Web viewStatus Quo housing policy is failing – three warrants. 1] Public housing re-entrenches redlining—government policy is incredibly](https://img.pdfslide.us/doc/110x75/6132571edfd10f4dd73a62da/pf-tfa19ac-web-view-status-quo-housing-policy-is-failing-a-three-warrants.jpg)