Embed Size (px)
Citation preview
Housing, Health & Happiness
Matías D. Cattaneo, UC BerkeleySebastián Galiani, Un. San AndresPaul Gertler, UC Berkeley & World BankSebastián Martínez, World BankRocío Titiunik, UC Berkeley
Housing along with food & water are considered basic needs
Most countries devote substantial resources toSlum upgradingImproving housing quality
Existing housing & new housingUS spends more on housing than other welfare programs such as TANF (Olsen, 2003).
Welfare effectsQuality of life and mental healthEnvironmental health
Air Quality, Parasites & Bacteria
Little work on welfare effects of housing: Economics ….
Katz et al. (2001) examine impacts of Δs in residential neighborhoods on well being
families in high-poverty housing projects received housing vouchers in random lotteryImproved well being of treatments, including better health
Health literature
Survey is critical of the existing literature as it is mainly cross-sectional correlations.(Thomson et al., 2001)
Clean water critical to contain the spread of infectious and parasitic diseases
Safe water has large impact on health e.g. (Cebu Team, 1991; Lavy et al., 1996, Jalan & Ravallion, 2003)
sanitation also has significant health effects(Esrey et al, 1991).
• Air PollutionChay and Greenstone, etc….
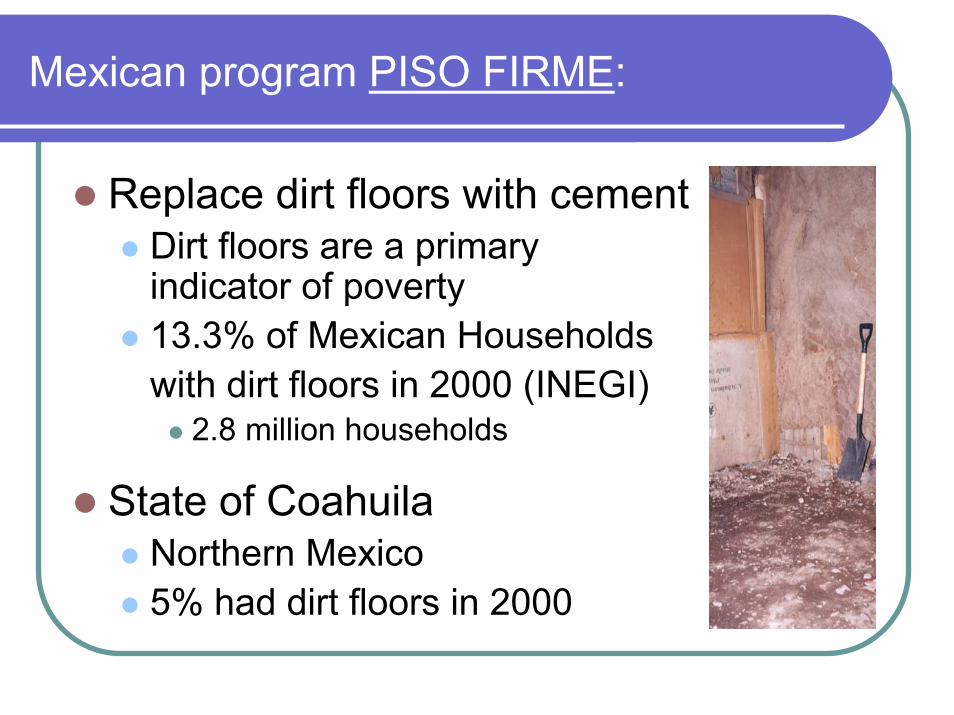
Mexican program PISO FIRME:
Replace dirt floors with cementDirt floors are a primary indicator of poverty13.3% of Mexican Householdswith dirt floors in 2000 (INEGI)
2.8 million households
State of CoahuilaNorthern Mexico5% had dirt floors in 2000
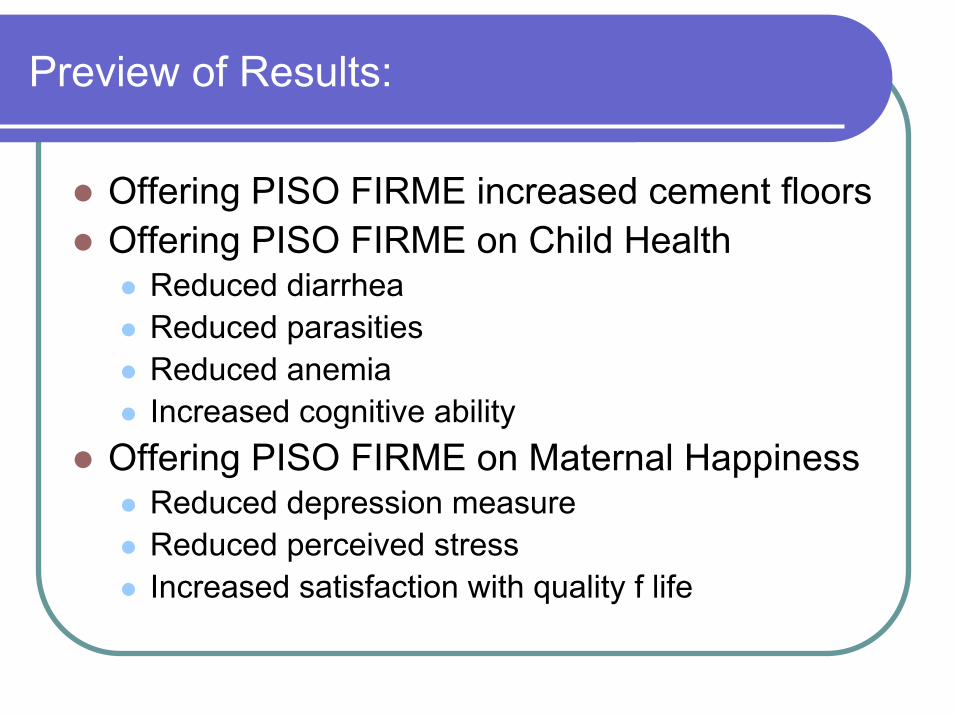
Preview of Results:
Offering PISO FIRME increased cement floorsOffering PISO FIRME on Child Health
Reduced diarrheaReduced parasitiesReduced anemiaIncreased cognitive ability
Offering PISO FIRME on Maternal HappinessReduced depression measureReduced perceived stressIncreased satisfaction with quality f life
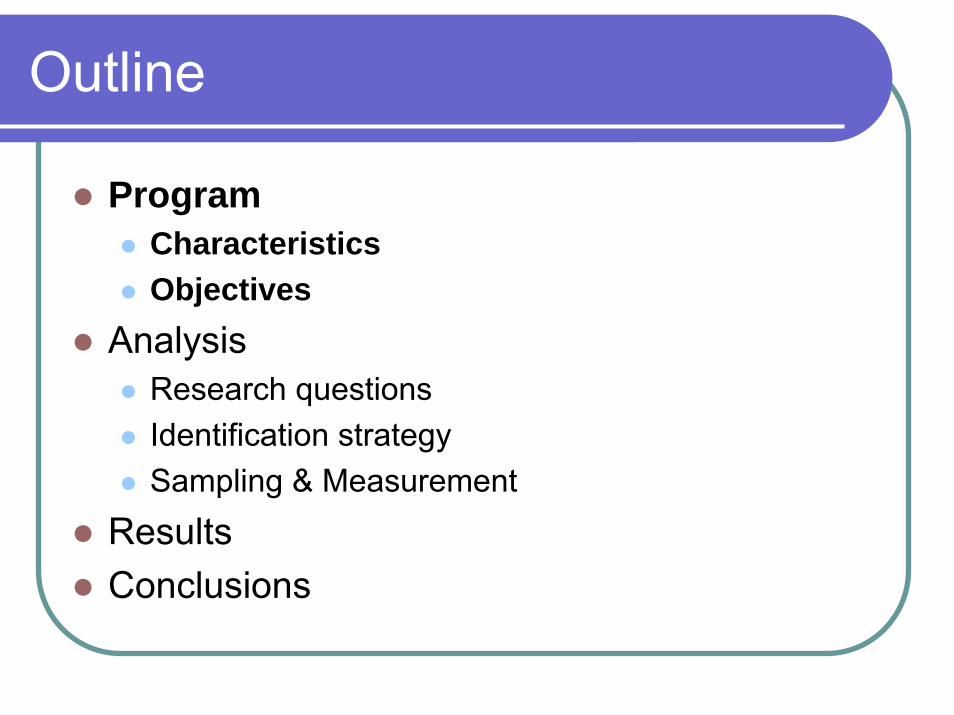
Outline
Program CharacteristicsObjectives
AnalysisResearch questionsIdentification strategySampling & Measurement
ResultsConclusions
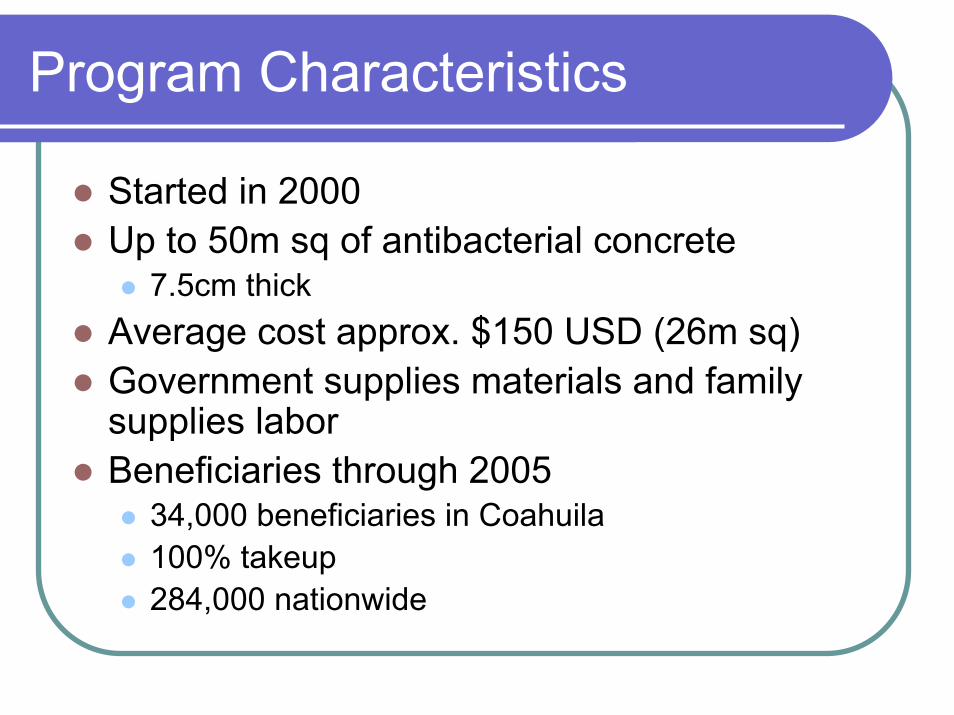
Program Characteristics
Started in 2000Up to 50m sq of antibacterial concrete
7.5cm thickAverage cost approx. $150 USD (26m sq)Government supplies materials and family supplies laborBeneficiaries through 2005
34,000 beneficiaries in Coahuila100% takeup284,000 nationwide
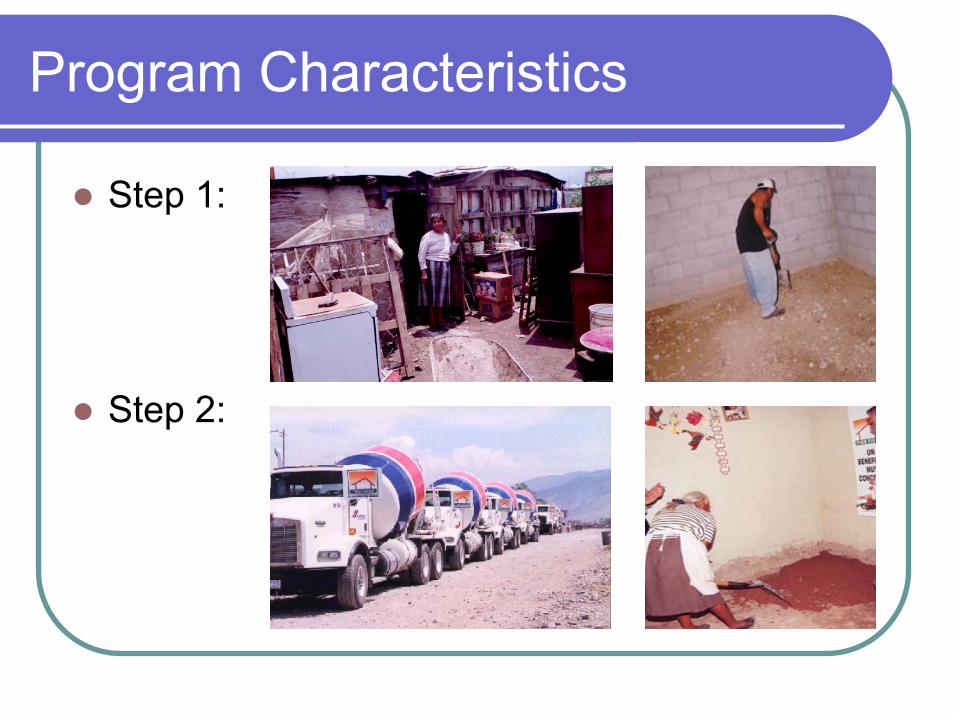
Program Characteristics
Step 1:
Step 2:
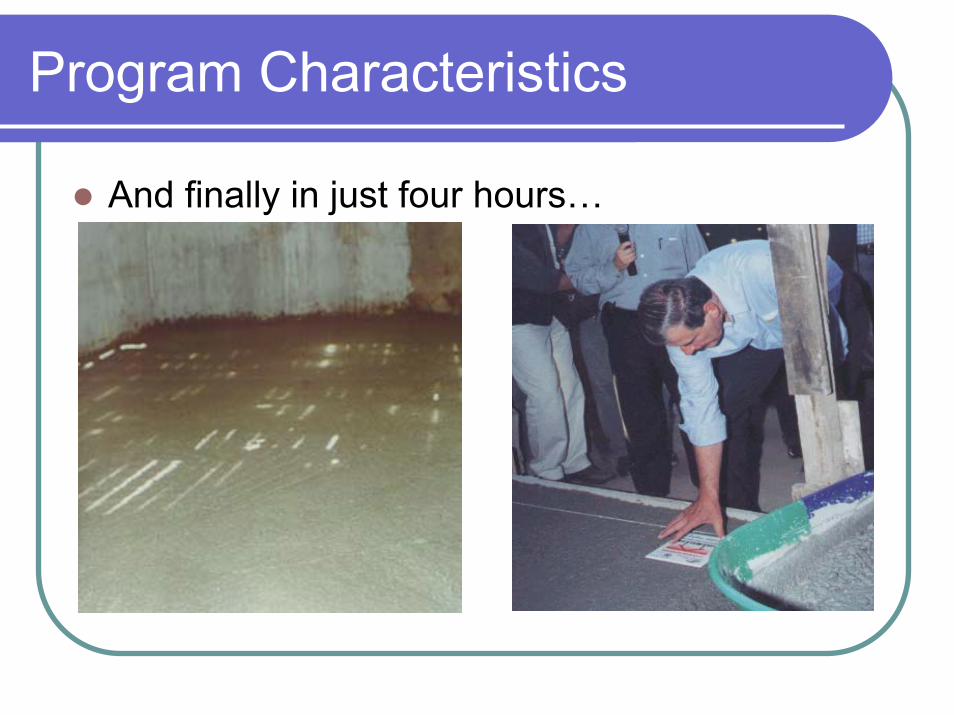
Program Characteristics
And finally in just four hours…
Program Objectives:
Objective 1: Improve Child HealthObjective 2: Improve Quality of Life
Program Objectives I: Child Health
Interrupt transmission of parasitic infections (Walker et al, 1992 and Stephenson et al., 1990)
Parasites live in fecal matter Dirt floors are hard to cleanHard to see fecal matter on dirt floors
Expect large effect on young childrenPlay on floorsIngest fecal matter by putting hands in mouthDon’t understand consequences
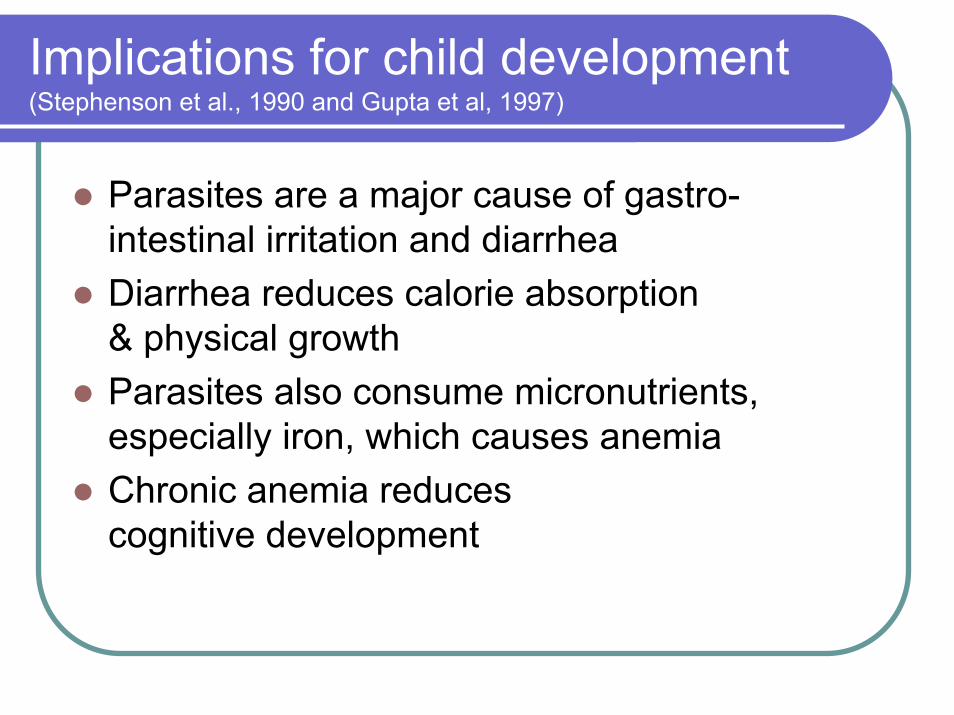
Implications for child development(Stephenson et al., 1990 and Gupta et al, 1997)
Parasites are a major cause of gastro-intestinal irritation and diarrheaDiarrhea reduces calorie absorption & physical growthParasites also consume micronutrients, especially iron, which causes anemiaChronic anemia reduces cognitive development
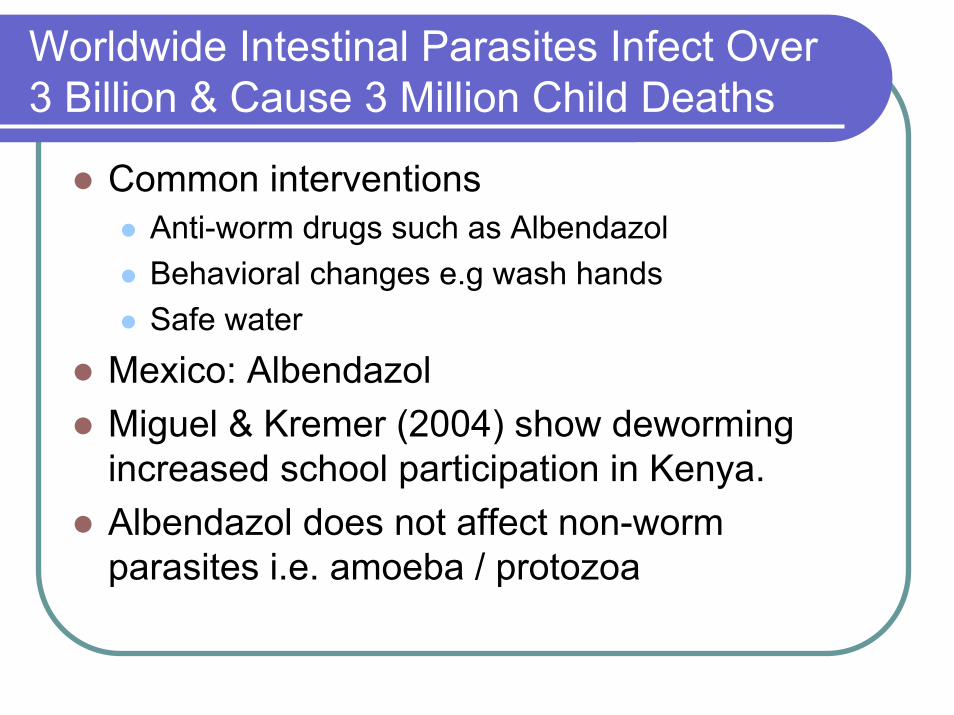
Worldwide Intestinal Parasites Infect Over 3 Billion & Cause 3 Million Child Deaths
Common interventionsAnti-worm drugs such as AlbendazolBehavioral changes e.g wash handsSafe water
Mexico: AlbendazolMiguel & Kremer (2004) show dewormingincreased school participation in Kenya. Albendazol does not affect non-worm parasites i.e. amoeba / protozoa
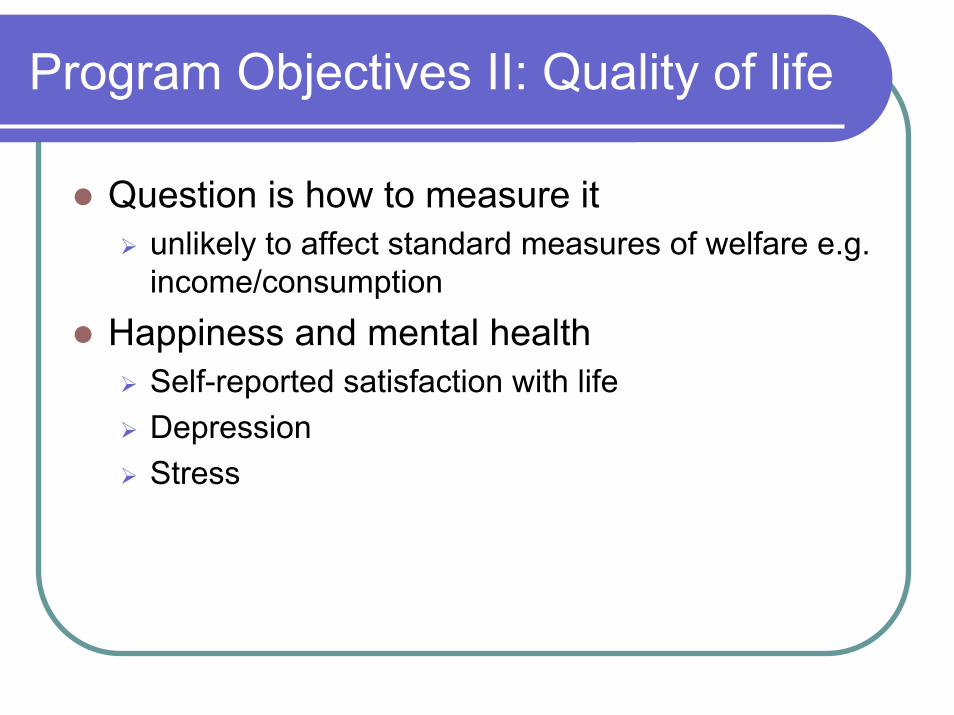
Program Objectives II: Quality of life
Question is how to measure itunlikely to affect standard measures of welfare e.g. income/consumption
Happiness and mental healthSelf-reported satisfaction with lifeDepressionStress
Outline
Program CharacteristicsObjectives
AnalysisResearch questionsIdentification strategySampling & Measurement
ResultsConclusions
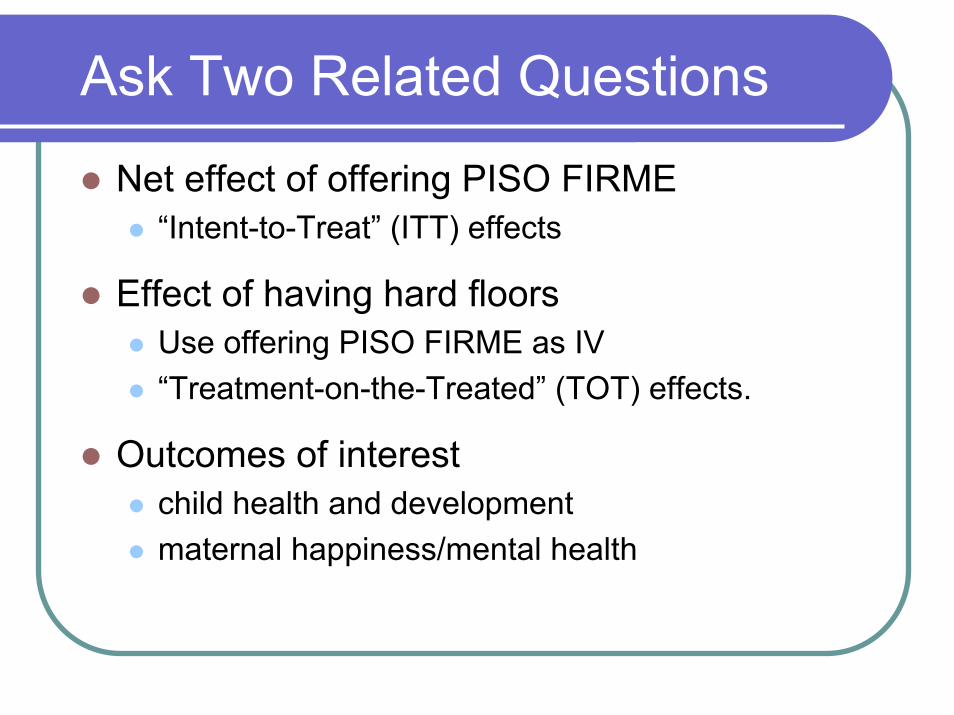
Ask Two Related Questions
Net effect of offering PISO FIRME“Intent-to-Treat” (ITT) effects
Effect of having hard floors Use offering PISO FIRME as IV“Treatment-on-the-Treated” (TOT) effects.
Outcomes of interestchild health and developmentmaternal happiness/mental health
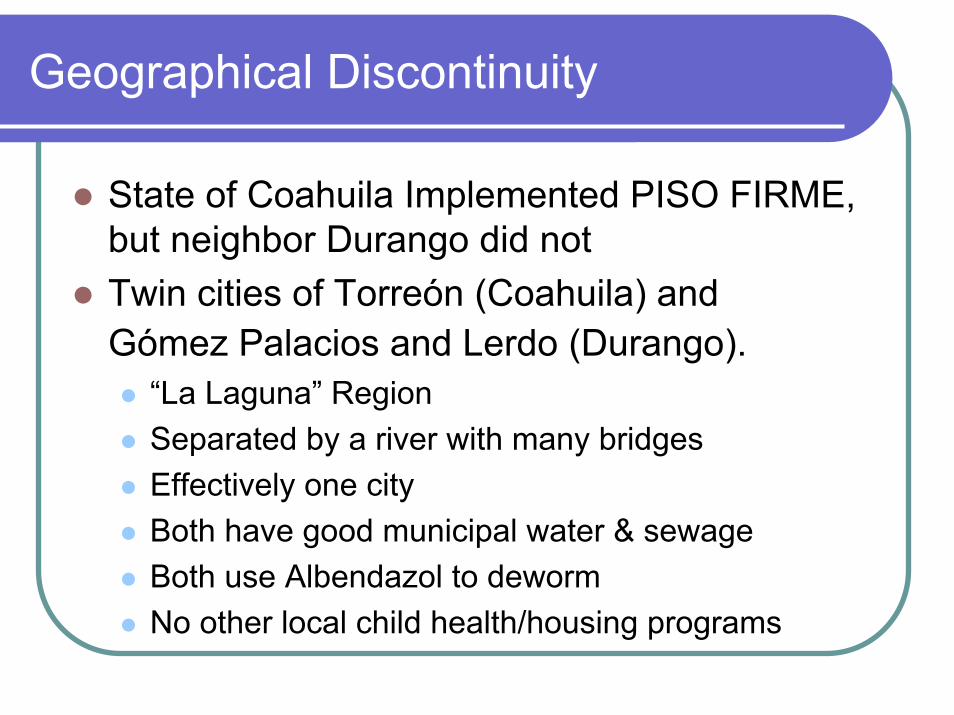
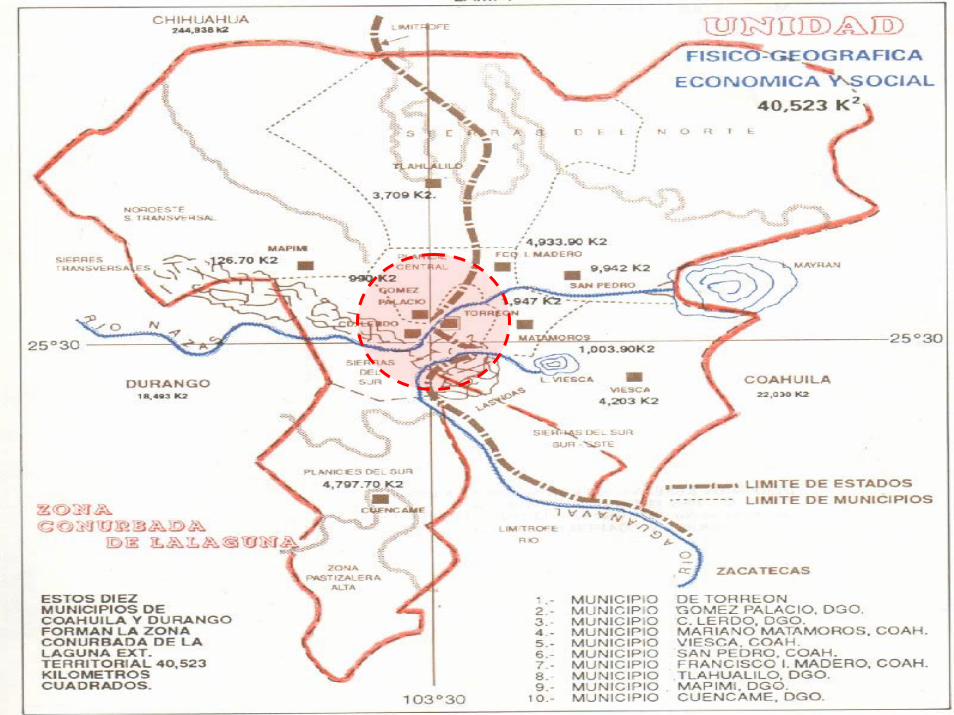
Geographical Discontinuity
State of Coahuila Implemented PISO FIRME, but neighbor Durango did notTwin cities of Torreón (Coahuila) and Gómez Palacios and Lerdo (Durango).
“La Laguna” RegionSeparated by a river with many bridgesEffectively one cityBoth have good municipal water & sewageBoth use Albendazol to dewormNo other local child health/housing programs
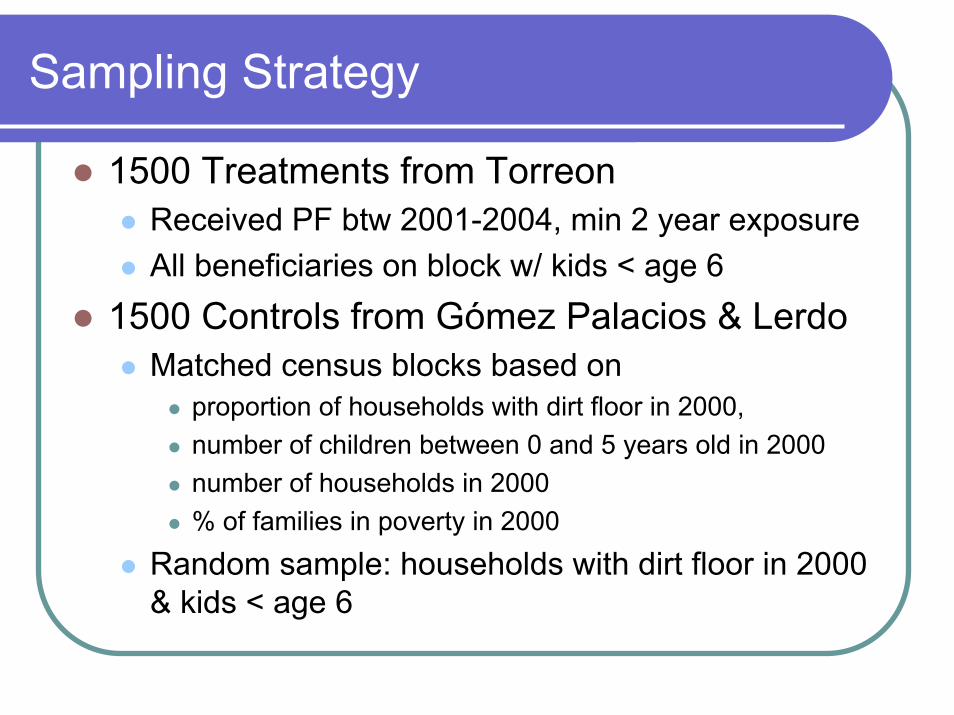
Sampling Strategy
1500 Treatments from TorreonReceived PF btw 2001-2004, min 2 year exposureAll beneficiaries on block w/ kids < age 6
1500 Controls from Gómez Palacios & LerdoMatched census blocks based on
proportion of households with dirt floor in 2000, number of children between 0 and 5 years old in 2000number of households in 2000% of families in poverty in 2000
Random sample: households with dirt floor in 2000 & kids < age 6
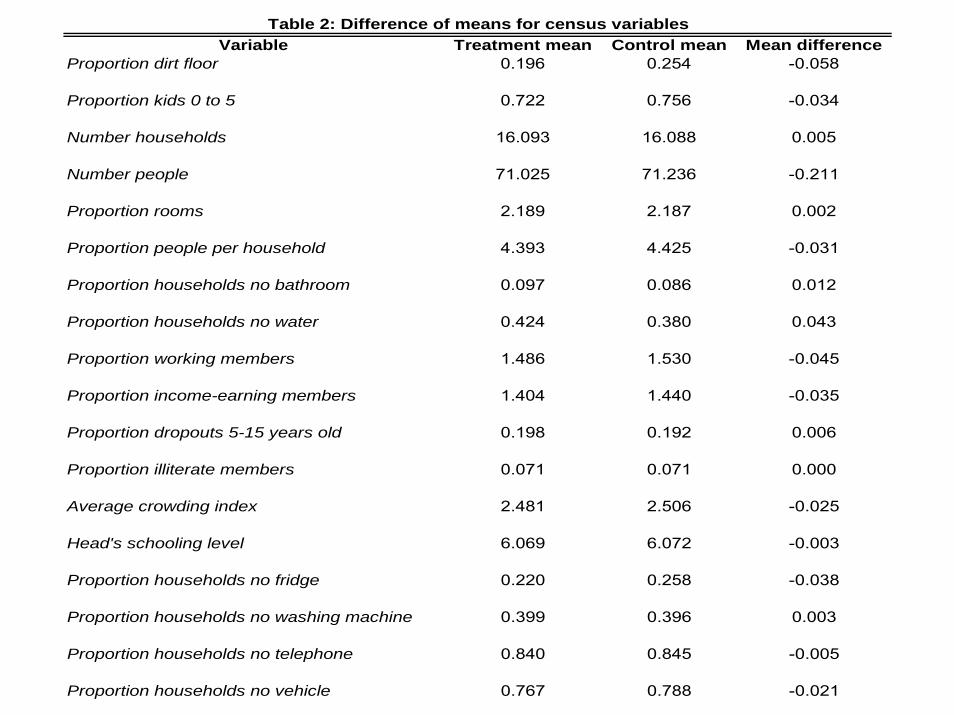
Variable Treatment mean Control mean Mean differenceProportion dirt floor 0.196 0.254 -0.058
Proportion kids 0 to 5 0.722 0.756 -0.034
Number households 16.093 16.088 0.005
Number people 71.025 71.236 -0.211
Proportion rooms 2.189 2.187 0.002
Proportion people per household 4.393 4.425 -0.031
Proportion households no bathroom 0.097 0.086 0.012
Proportion households no water 0.424 0.380 0.043
Proportion working members 1.486 1.530 -0.045
Proportion income-earning members 1.404 1.440 -0.035
Proportion dropouts 5-15 years old 0.198 0.192 0.006
Proportion illiterate members 0.071 0.071 0.000
Average crowding index 2.481 2.506 -0.025
Head's schooling level 6.069 6.072 -0.003
Proportion households no fridge 0.220 0.258 -0.038
Proportion households no washing machine 0.399 0.396 0.003
Proportion households no telephone 0.840 0.845 -0.005
Proportion households no vehicle 0.767 0.788 -0.021
Table 2: Difference of means for census variables
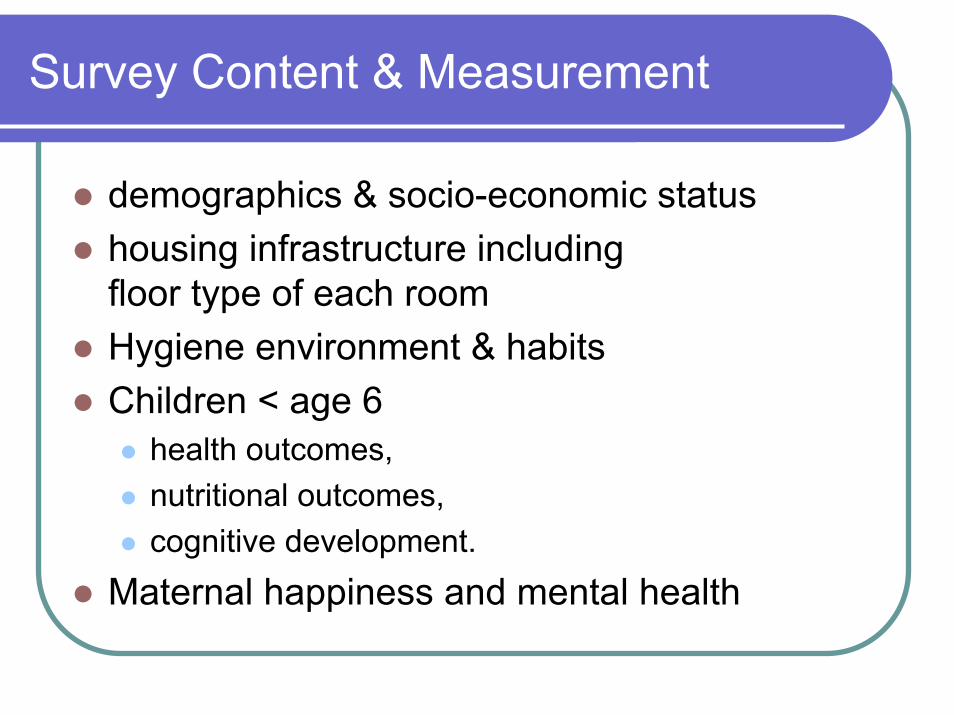
Survey Content & Measurement
demographics & socio-economic statushousing infrastructure including floor type of each room Hygiene environment & habitsChildren < age 6
health outcomes, nutritional outcomes, cognitive development.
Maternal happiness and mental health
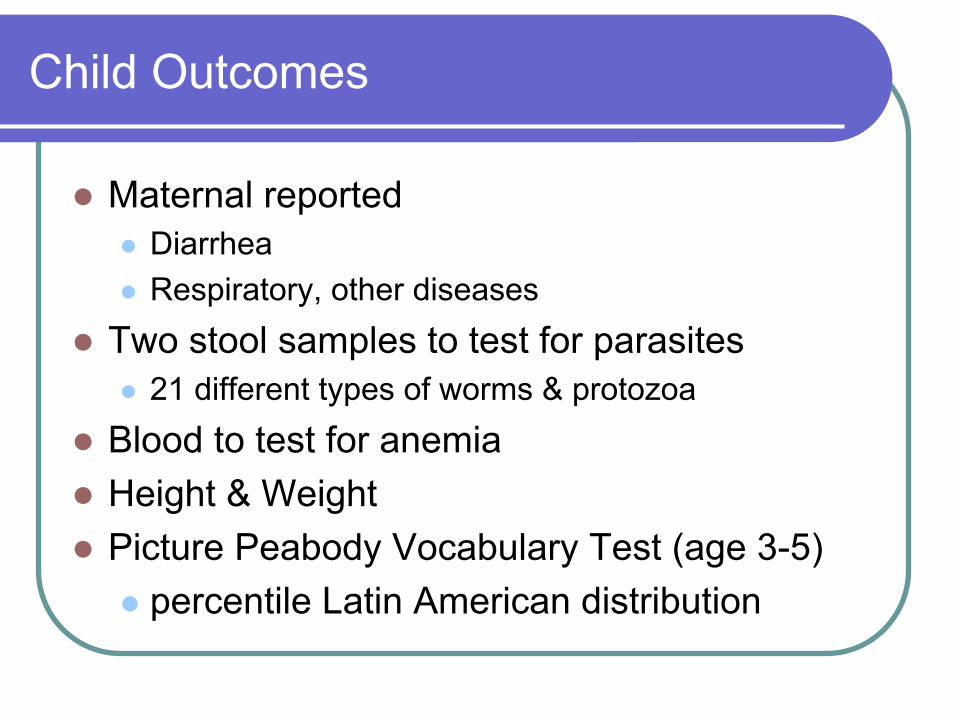
Child Outcomes
Maternal reported DiarrheaRespiratory, other diseases
Two stool samples to test for parasites21 different types of worms & protozoa
Blood to test for anemiaHeight & WeightPicture Peabody Vocabulary Test (age 3-5)
percentile Latin American distribution
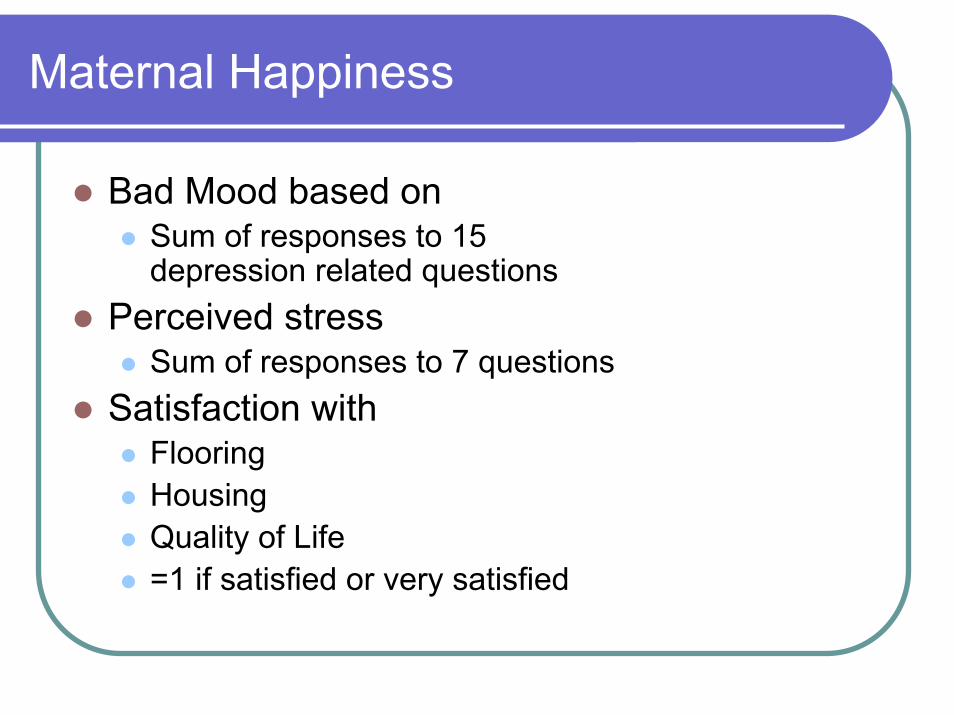
Maternal Happiness
Bad Mood based onSum of responses to 15 depression related questions
Perceived stressSum of responses to 7 questions
Satisfaction withFlooringHousingQuality of Life=1 if satisfied or very satisfied
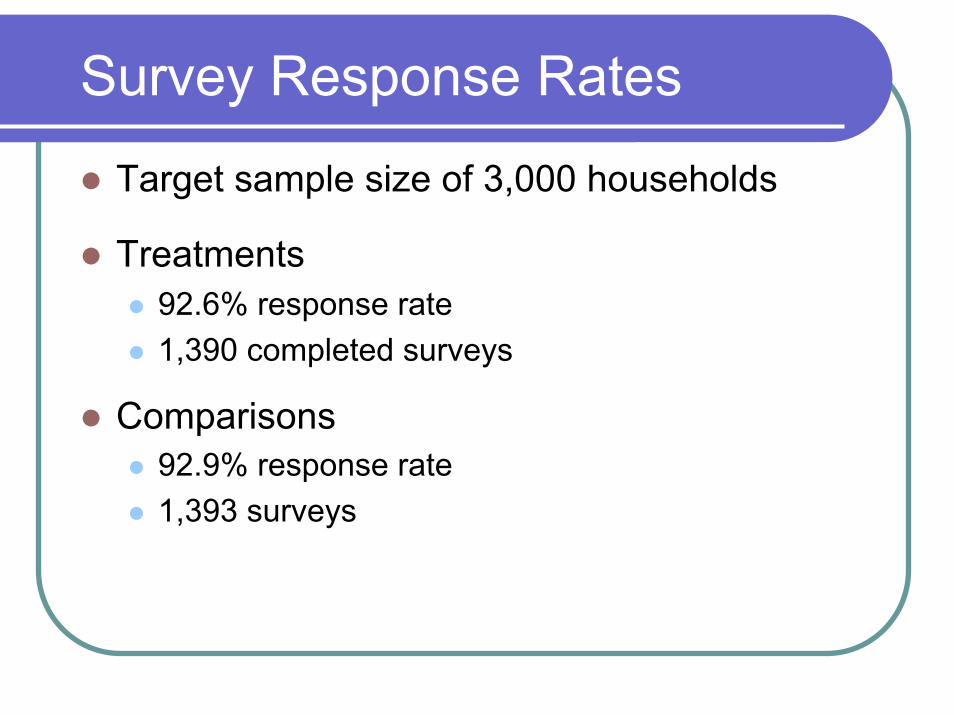
Survey Response Rates
Target sample size of 3,000 households
Treatments92.6% response rate1,390 completed surveys
Comparisons92.9% response rate1,393 surveys

Outline
Program CharacteristicsObjectives
AnalysisResearch questionsIdentification strategySampling & Measurement
ResultsConclusions
Results outline
Sample BalanceEffect of PISO FIRME on cement floorsChild Health
Intent to TreatmentTreatment on Treated
Maternal HappinessIntent to TreatmentTreatment on Treated
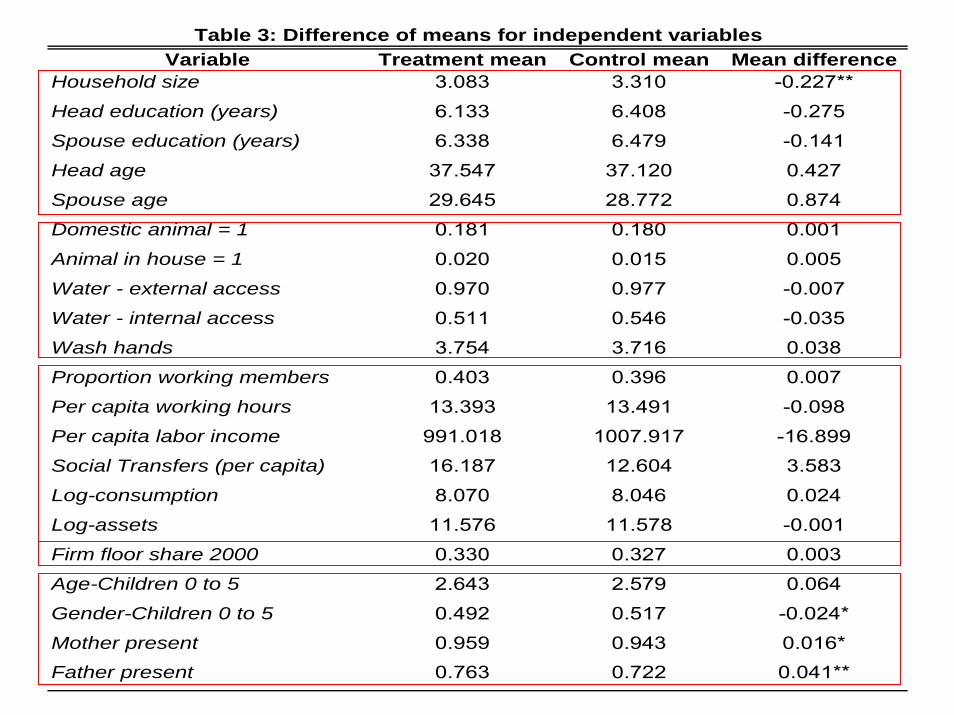
Variable Treatment mean Control mean Mean differenceHousehold size 3.083 3.310 -0.227**
Head education (years) 6.133 6.408 -0.275
Spouse education (years) 6.338 6.479 -0.141
Head age 37.547 37.120 0.427
Spouse age 29.645 28.772 0.874
Domestic animal = 1 0.181 0.180 0.001
Animal in house = 1 0.020 0.015 0.005
Water - external access 0.970 0.977 -0.007
Water - internal access 0.511 0.546 -0.035
Wash hands 3.754 3.716 0.038
Proportion working members 0.403 0.396 0.007
Per capita working hours 13.393 13.491 -0.098
Per capita labor income 991.018 1007.917 -16.899
Social Transfers (per capita) 16.187 12.604 3.583
Log-consumption 8.070 8.046 0.024
Log-assets 11.576 11.578 -0.001
Firm floor share 2000 0.330 0.327 0.003
Age-Children 0 to 5 2.643 2.579 0.064
Gender-Children 0 to 5 0.492 0.517 -0.024*
Mother present 0.959 0.943 0.016*
Father present 0.763 0.722 0.041**
Table 3: Difference of means for independent variables
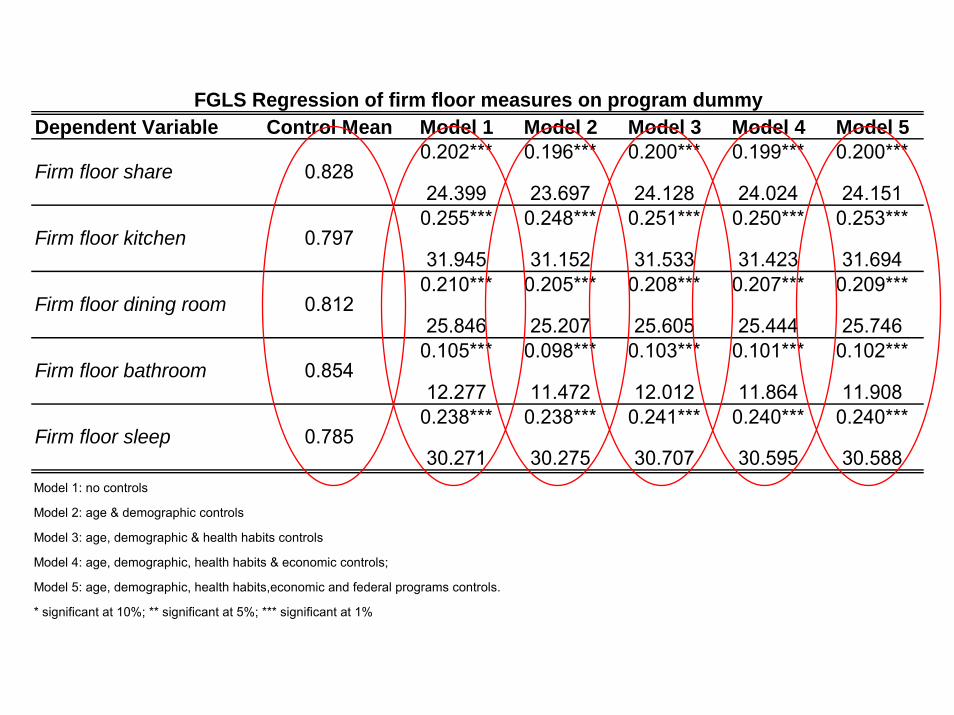
Dependent Variable Control Mean Model 1 Model 2 Model 3 Model 4 Model 50.202*** 0.196*** 0.200*** 0.199*** 0.200***
24.399 23.697 24.128 24.024 24.1510.255*** 0.248*** 0.251*** 0.250*** 0.253***
31.945 31.152 31.533 31.423 31.6940.210*** 0.205*** 0.208*** 0.207*** 0.209***
25.846 25.207 25.605 25.444 25.7460.105*** 0.098*** 0.103*** 0.101*** 0.102***
12.277 11.472 12.012 11.864 11.9080.238*** 0.238*** 0.241*** 0.240*** 0.240***
30.271 30.275 30.707 30.595 30.588Model 1: no controls
Model 2: age & demographic controls
Model 3: age, demographic & health habits controls
Model 4: age, demographic, health habits & economic controls;
Model 5: age, demographic, health habits,economic and federal programs controls.
* significant at 10%; ** significant at 5%; *** significant at 1%
Firm floor sleep 0.785
Firm floor dining room 0.812
Firm floor bathroom 0.854
FGLS Regression of firm floor measures on program dummy
Firm floor share 0.828
Firm floor kitchen 0.797
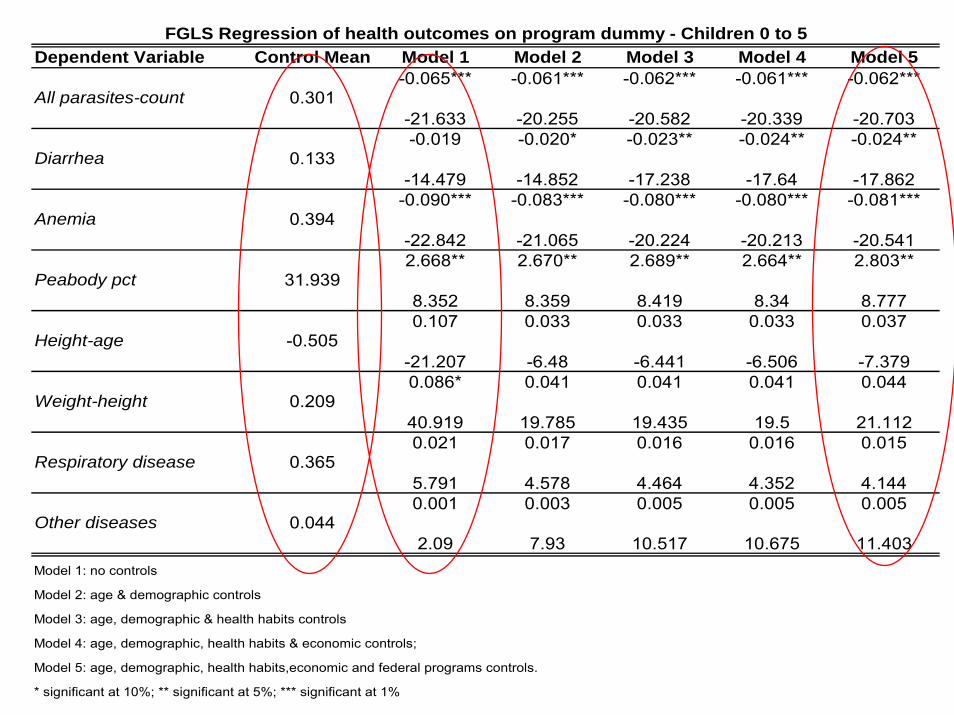
Dependent Variable Control Mean Model 1 Model 2 Model 3 Model 4 Model 5-0.065*** -0.061*** -0.062*** -0.061*** -0.062***
-21.633 -20.255 -20.582 -20.339 -20.703-0.019 -0.020* -0.023** -0.024** -0.024**
-14.479 -14.852 -17.238 -17.64 -17.862-0.090*** -0.083*** -0.080*** -0.080*** -0.081***
-22.842 -21.065 -20.224 -20.213 -20.5412.668** 2.670** 2.689** 2.664** 2.803**
8.352 8.359 8.419 8.34 8.7770.107 0.033 0.033 0.033 0.037
-21.207 -6.48 -6.441 -6.506 -7.3790.086* 0.041 0.041 0.041 0.044
40.919 19.785 19.435 19.5 21.1120.021 0.017 0.016 0.016 0.015
5.791 4.578 4.464 4.352 4.1440.001 0.003 0.005 0.005 0.005
2.09 7.93 10.517 10.675 11.403Model 1: no controls
Model 2: age & demographic controls
Model 3: age, demographic & health habits controls
Model 4: age, demographic, health habits & economic controls;
Model 5: age, demographic, health habits,economic and federal programs controls.
* significant at 10%; ** significant at 5%; *** significant at 1%
Respiratory disease 0.365
Other diseases 0.044
Height-age -0.505
Weight-height 0.209
Anemia 0.394
Peabody pct 31.939
FGLS Regression of health outcomes on program dummy - Children 0 to 5
All parasites-count 0.301
Diarrhea 0.133
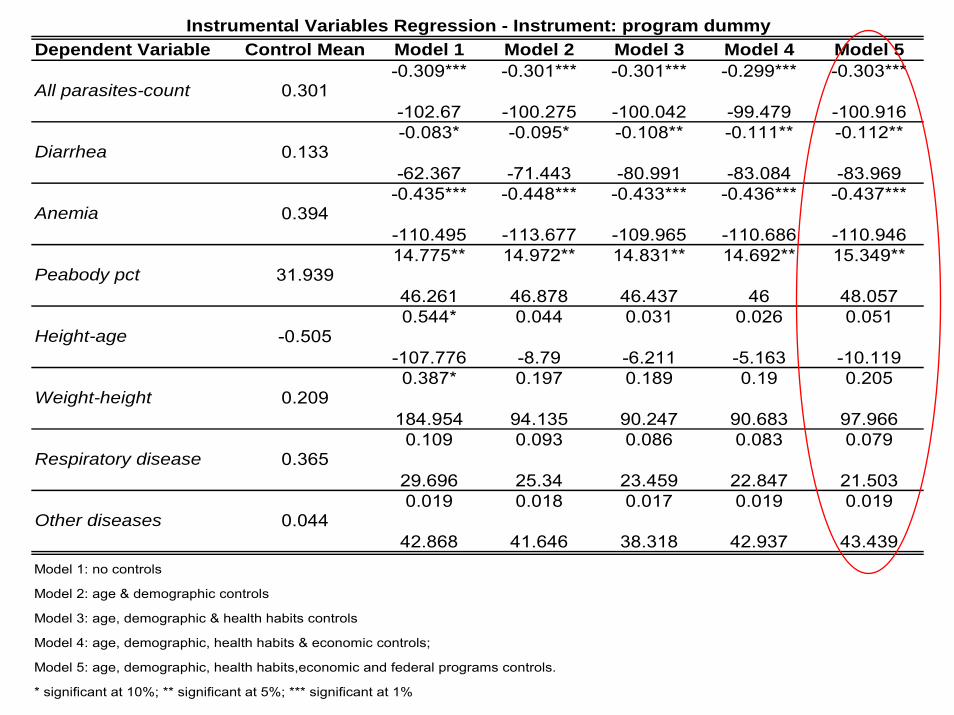
Dependent Variable Control Mean Model 1 Model 2 Model 3 Model 4 Model 5-0.309*** -0.301*** -0.301*** -0.299*** -0.303***
-102.67 -100.275 -100.042 -99.479 -100.916-0.083* -0.095* -0.108** -0.111** -0.112**
-62.367 -71.443 -80.991 -83.084 -83.969-0.435*** -0.448*** -0.433*** -0.436*** -0.437***
-110.495 -113.677 -109.965 -110.686 -110.94614.775** 14.972** 14.831** 14.692** 15.349**
46.261 46.878 46.437 46 48.0570.544* 0.044 0.031 0.026 0.051
-107.776 -8.79 -6.211 -5.163 -10.1190.387* 0.197 0.189 0.19 0.205
184.954 94.135 90.247 90.683 97.9660.109 0.093 0.086 0.083 0.079
29.696 25.34 23.459 22.847 21.5030.019 0.018 0.017 0.019 0.019
42.868 41.646 38.318 42.937 43.439Model 1: no controls
Model 2: age & demographic controls
Model 3: age, demographic & health habits controls
Model 4: age, demographic, health habits & economic controls;
Model 5: age, demographic, health habits,economic and federal programs controls.
* significant at 10%; ** significant at 5%; *** significant at 1%
Respiratory disease 0.365
Other diseases 0.044
Height-age -0.505
Weight-height 0.209
Anemia 0.394
Peabody pct 31.939
Instrumental Variables Regression - Instrument: program dummy
All parasites-count 0.301
Diarrhea 0.133
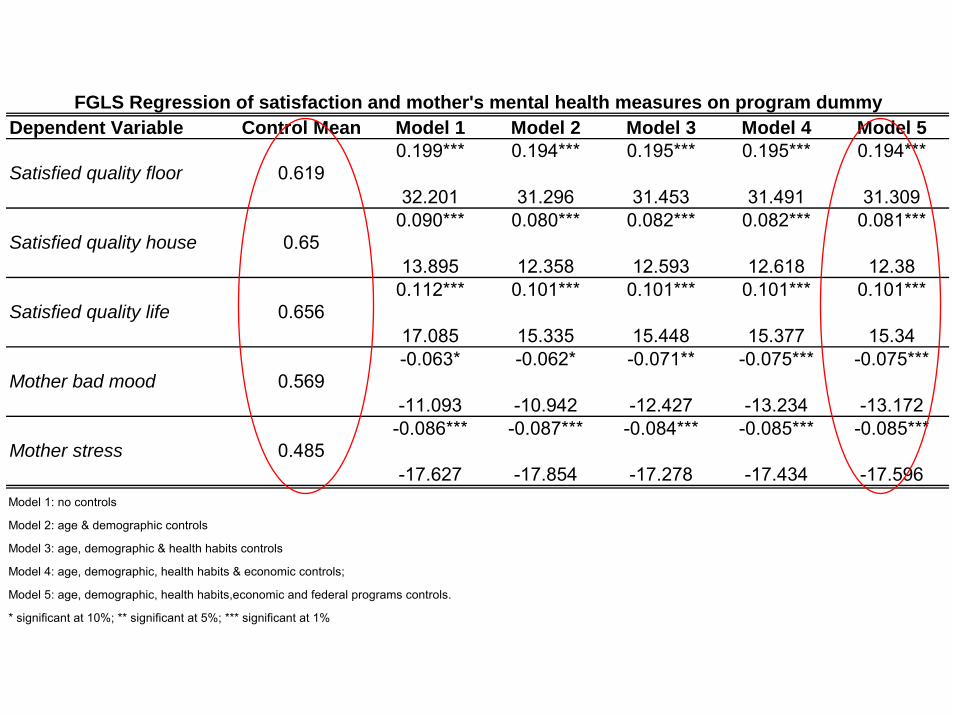
Dependent Variable Control Mean Model 1 Model 2 Model 3 Model 4 Model 50.199*** 0.194*** 0.195*** 0.195*** 0.194***
32.201 31.296 31.453 31.491 31.3090.090*** 0.080*** 0.082*** 0.082*** 0.081***
13.895 12.358 12.593 12.618 12.380.112*** 0.101*** 0.101*** 0.101*** 0.101***
17.085 15.335 15.448 15.377 15.34-0.063* -0.062* -0.071** -0.075*** -0.075***
-11.093 -10.942 -12.427 -13.234 -13.172-0.086*** -0.087*** -0.084*** -0.085*** -0.085***
-17.627 -17.854 -17.278 -17.434 -17.596Model 1: no controls
Model 2: age & demographic controls
Model 3: age, demographic & health habits controls
Model 4: age, demographic, health habits & economic controls;
Model 5: age, demographic, health habits,economic and federal programs controls.
* significant at 10%; ** significant at 5%; *** significant at 1%
Mother stress 0.485
Satisfied quality life 0.656
Mother bad mood 0.569
FGLS Regression of satisfaction and mother's mental health measures on program dummy
Satisfied quality floor 0.619
Satisfied quality house 0.65
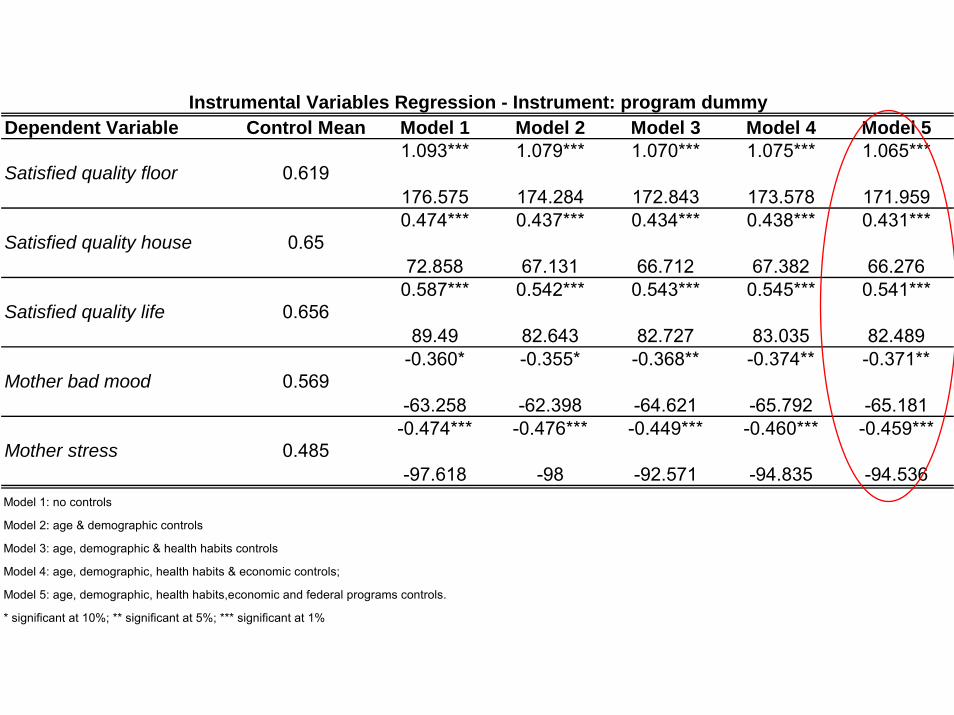
Dependent Variable Control Mean Model 1 Model 2 Model 3 Model 4 Model 51.093*** 1.079*** 1.070*** 1.075*** 1.065***
176.575 174.284 172.843 173.578 171.9590.474*** 0.437*** 0.434*** 0.438*** 0.431***
72.858 67.131 66.712 67.382 66.2760.587*** 0.542*** 0.543*** 0.545*** 0.541***
89.49 82.643 82.727 83.035 82.489-0.360* -0.355* -0.368** -0.374** -0.371**
-63.258 -62.398 -64.621 -65.792 -65.181-0.474*** -0.476*** -0.449*** -0.460*** -0.459***
-97.618 -98 -92.571 -94.835 -94.536Model 1: no controls
Model 2: age & demographic controls
Model 3: age, demographic & health habits controls
Model 4: age, demographic, health habits & economic controls;
Model 5: age, demographic, health habits,economic and federal programs controls.
* significant at 10%; ** significant at 5%; *** significant at 1%
Mother bad mood 0.569
Mother stress 0.485
Satisfied quality house 0.65
Satisfied quality life 0.656
Instrumental Variables Regression - Instrument: program dummy
Satisfied quality floor 0.619
Outline
Program CharacteristicsObjectives
AnalysisResearch questionsIdentification strategySampling & Measurement
ResultsConclusions
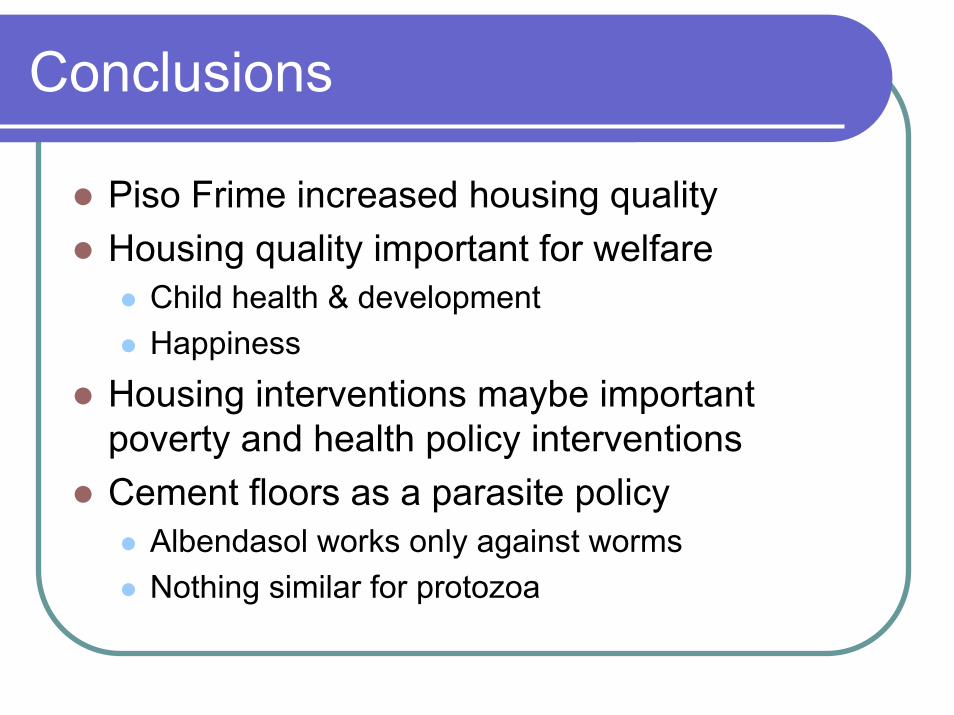
Conclusions
Piso Frime increased housing qualityHousing quality important for welfare
Child health & developmentHappiness
Housing interventions maybe important poverty and health policy interventionsCement floors as a parasite policy
Albendasol works only against wormsNothing similar for protozoa

Thank you…

![UNIVERSIDAD DR. JOSÉ MATÍAS DELGADO RED BIBLIOTECARIA ... · [escribir texto] universidad dr. josÉ matÍas delgado . red bibliotecaria matÍas . derechos de publicaciÓn . del](https://img.pdfslide.us/doc/110x75/5f0fd3d17e708231d4461456/universidad-dr-jos-matas-delgado-red-bibliotecaria-escribir-texto-universidad.jpg)