Embed Size (px)
Citation preview

75
American Economic Journal: Economic Policy 2009, 1:1, 75–105http://www.aeaweb.org/articles.php?doi=10.1257/pol.1.1.75
Housing, food, and water are considered to be basic requirements for daily liv-ing. Unfortunately, inadequate housing with poor water supply, sanitation, and
ventilation threatens the lives and health of some 600 million urban dwellers world-wide (see, among others, Cebu Study Team 1991; S. A. Esrey et al. 1991; Galiani, Gertler, and Ernesto Schargrodsky 2005; and World Bank 2005). For this reason, most countries in the world devote substantial resources to upgrading slum areas and improving housing quality for poor groups in the population. For example, the US Government spends more on housing programs than on other better-known welfare programs, such as food stamps and temporary assistance for needy families (Edgar O. Olsen 2003). In the developing world, where urbanization is strongly associated with the rapid spread of slums, and where slum dwellers account for 45 percent of the urban population, policies to improve the welfare of slum dwellers focus on such areas as upgrading slum housing in situ and relocating slum dwellers to better qual-ity, low-cost housing (World Bank 2005). Despite the importance of housing as a
* Cattaneo: Department of Economics, University of Michigan, 238 Lorch Hall, 611 Tappan St., Ann Arbor, MI 48109-1220 (e-mail: [email protected]); Galiani: Department of Economics, Washington University in St. Louis, 388 Seigle Hall, St. Louis, MO 63130 (e-mail: [email protected]); Gertler: Haas School of Business MC1900, University of California, Berkeley 94720 (e-mail: [email protected]); Martinez: World Bank, 1818 H Street, NW, Washington, DC 20433 (e-mail: [email protected]); Titiunik: Department of Agricultural and Resource Economics, University of California at Berkeley, 207 Giannini Hall #3310, Berkeley, CA 94720-3310 (e-mail: [email protected]). We thank Albert Fishlow, Larry Katz, Ted Miguel, Norbert Schady, Jennifer Sturdy, two anonymous referees, and seminar participants at Columbia University, the University of Michigan, University of California, Berkeley, University of Toulouse, and the World Bank for useful com-ments. We gratefully acknowledge support from the State of Coahuila, and thank Gonzalo Hernandez, Enrique Martinez y Morales, Ricardo Mujica and Gustavo Olaiz, and the Government of the State of Coahuila for their contribution to our understanding of the program and for helping us with our work in Mexico. Galiani thanks the hospitality of the Stanford Institute for Economic Policy Research while he was revising this paper.
† To comment on this article in the online discussion forum visit the articles page at:http://www.aeaweb.org/articles.php?doi=10.1257/pol.1.1.75
Housing, Health, and Happiness†
By Matias D. Cattaneo, Sebastian Galiani, Paul J. Gertler, Sebastian Martinez, and Rocio Titiunik*
We investigate the impact of a large-scale Mexican program to replace dirt floors with cement floors on child health and adult hap-piness. We find that replacing dirt floors with cement significantly improves the health of young children measured by decreases in the incidence of parasitic infestations, diarrhea, and the prevalence of anemia, and an improvement in children’s cognitive development. Additionally, we find significant improvements in adult welfare mea-sured by increased satisfaction with their housing and quality of life, as well as by lower scores on depression and perceived stress scales. (JEL I12, I31, J13, O15)

76 AMEricAn EconoMic JournAL: EconoMic PoLicy fEBruAry 2009
factor influencing well-being, little work has been done to assess the causal impact of housing and housing improvement programs on health and welfare.
In this paper, we examine one particular aspect of housing, floor quality, and its impact on the health of young children, as well as the mental health and happiness of their mothers. Specifically, we examine a large-scale effort by the Mexican govern-ment to replace dirt floors with cement floors as a means of identifying the impact of cement floors on child health and maternal happiness. The program, called Piso Firme, offered households with dirt floors up to 50 square meters (538 square feet) of concrete cement flooring.
In order to identify the effects of this intervention on child health and develop-ment, as well as maternal happiness outcomes, we take advantage of the geographic variability in the implementation of the program. Piso Firme was first implemented as a local program in the State of Coahuila. The program was later adopted nation-ally and gradually extended to other states. In principle, we could compare benefi-ciary families in the State of Coahuila to families in the neighboring states that had not yet implemented Piso Firme.
While this provides us with an administrative source of variability in treatment exposure among households across states, we are not guaranteed that the outcomes of interest would be, on average, the same in these two states in the absence of the intervention. We take several steps to improve the comparability of the treatment and control groups. First, we restrict our analysis exclusively to the contrast of the outcomes of interest between families residing in the twin cities of Gómez Palacios and Lerdo (control) and Torreón (treatment) that straddle the border of the States of Durango and Coahuila, respectively. Although these cities are split administratively between the two states, they are effectively a single urban area in socioeconomic terms. Therefore, households residing in this area face the same socioeconomic cir-cumstances and a similar cultural and natural environment. Consequently, house-holds residing near the border in these cities are likely to be similar except for the influence of state policies. Second, we further improve the comparability of the treat-ment and control groups by sampling from census blocks in the control area that best match the census blocks from the treatment area using preintervention information from the 2000 Mexican national census.
Thus, to the extent that the only important difference in state policies is Piso Firme, we can estimate its impact on the outcomes of interest for households resid-ing near the state border in the city of Torreón, using the households from Gómez Palacio/Lerdo as a control group. In order to provide evidence in support of this identification strategy, we show that treatment and control areas had very simi-lar secular health and socioeconomic environments before and after the State of Coahuila implemented Piso Firme.
We find that Piso Firme significantly increased the share of cement floors and child health among treated households. Specifically, we find significant decreases in the incidence of parasitic infestations, diarrhea, and the prevalence of anemia, as well as a significant improvement in the cognitive development of treated children.
The improvement in cognitive development of young children is very important, as research in neuroscience, psychology, and cognition has established that learning is easier in early childhood than later in life and that it is critical for school readiness
VoL. 1 no. 1 77cAttAnEo Et AL.: Housing, HEALtH, And HAPPinEss
and long-term skill development (see, among others, John D. Bransford 1979, Robert J. Sternberg 1985, Rima Shore 1997, and Jack P. Shonkoff and Deborah A. Phillips 2000). Gary S. Becker (1964) points out that the returns to investments made in early childhood are likely to be higher than those investments made later in life simply because beneficiaries have a longer time to reap the rewards. Pedro Carneiro and James J. Heckman (2004) and Heckman and Dimitriy V. Masterov (2007) note that investments in human capital have dynamic complementarities, so that “learning begets learning.” Additionally, poor cognitive development affects school enroll-ment and learning, and, consequently, also influences lifetime earnings and welfare (see, among others, Jere R. Behrman 1996).
These results are important inputs into public resource allocation decisions regarding efforts to improve child development outcomes. Piso Firme has a comparable absolute impact on child cognitive development when compared to Mexico’s anti-poverty con-ditional cash transfer program, Oportunidades, formerly called PROGRESA, (Gertler 2004, Juan A. Rivera et al. 2004, and Lia C. H. Fernald, Gertler, and Lynnette M. Neufeld 2008). Our results also indicate that replacing dirt floors with cement floors appears to be at least as effective as nutritional supplementation and early childhood cognitive stimulation (Patrice L. Engle et al. 2007).
We also find that, following the implementation of the program, adults are sub-stantially happier, as measured by their degree of satisfaction with their housing and quality of life, and have significantly lower scores on depression and perceived stress assessment tools. The reasons adults are happier may have to do with the fact that they are living in a better environment and that their children are healthier. These results also indicate that housing has a significant effect on welfare, which would not be captured by standard monetary indicators such as income, consumption, or assets, or by the types of health outcomes used in this study.
Our results contribute to a small body of literature on the benefits of slum upgrading. There are a large number of papers in the medical literature that document associations between housing and health. In a critical survey of this literature, Hilary Thomson, Mark Petticrew, and David Morrison (2001) report no randomized or quasi-experi-mental studies and assert that most of the work in this area consists of cross-sectional associations. The economics literature has focused on the identification of the market value of various housing characteristics (see, among others, Emmanuel Jiménez 1983; Randall Crane, Amrita Daniere, and Stacy Harwood 1997; and Kenneth Y. Chay and Michael Greenstone 2005) or the gain in welfare obtained from housing upgrades as reflected by the compensating variation measured via estimated utility functions (Daniel Kaufmann and John M. Quigley 1987, and Akie Takeuchi, Maureen Cropper, and Antonio Bento 2006). An exception is Lawrence F. Katz, Jeffrey R. Kling, and Jeffrey B. Liebman (2001), who examine the impacts of changes in residential neigh-borhoods on the well-being of families residing in high-poverty areas that received housing vouchers through a random lottery in the United States. They find that house-holds that were offered vouchers experienced improvements in multiple measures of well-being, including improved health among heads of household and a reduction in the likelihood of asthma attacks and injuries among children.
The rest of the paper is organized as follows. In Section I, we present a discus-sion and conceptual framework of the Mexican Piso Firme program. In Section II,

78 AMEricAn EconoMic JournAL: EconoMic PoLicy fEBruAry 2009
we outline our identification and sampling strategies. In Section III, we describe the data. In Section IV, we demonstrate that the control and treatment groups are balanced. In Section V, we present the program impacts, analyzing the effect of offering Piso Firme on the installation of cement floors, child health, and maternal mental health and happiness. In Section VI, we present a series of tests to address the robustness of the results to alternative explanations and specifications. Finally, in Section VII, we outline our conclusions.
I. Conceptual Framework
Piso Firme, which means “firm floor,” is a program designed to replace dirt floors with cement floors in the homes of low-income families in Mexico. While this type of intervention had been a small subcomponent of two federal programs targeting rural and indigenous areas,1 the first large-scale, stand-alone program targeted to both rural areas and urban slums was implemented by the northern State of Coahuila starting in 2000.2 Subsequently, starting in late 2003, other states and other federally funded programs adopted Piso Firme.3,4 Through these initiatives, by 2005 cement floors were installed in about 300,000 of the estimated 3 million houses that reported dirt floors in the 2000 Mexican census.
Coahuila’s Piso Firme grew out of Governor Enrique Martinez y Martinez’s (2000–2005) campaign pledge to reduce the prevalence of households with dirt floors in the state. The Coahuila program was developed out of situational assess-ments conducted by the Martinez electoral campaign prior to his election. The stated objective of Piso Firme was to improve the living standards, and especially health standards, of vulnerable groups that live in high-density, low-income neighborhoods (Secretaria de Desarrollo Social de Coahuila 2004). By 2005, Piso Firme had cov-ered over 34,000 households in 650 neighborhoods and 200 suburban communities in the state, at a cost of approximately $5.5 million dollars (Secretaria de Desarrollo Social de Coahuila 2005).
Eligibility for Piso Firme is based on two main factors. First, the household must have dirt floors. Second, the household must prove home ownership prior to receiv-ing Piso Firme. Municipalities identified eligible households and submitted ros-ters of beneficiaries to the state. The state then validated the municipal proposal,
1 Microregiones and Comision Nacional para el de Desarrollo de los Pueblos Indigenas (CDI) included inter-ventions similar to Piso Firme prior to 2000. The flooring components of these programs were relatively small and targeted to rural areas with a high density of indigenous populations. Microregiones, for example, covered select communities in six municipalities in Coahuila and nine municipalities in Durango in 2003 (http://www.microregiones.gob.mx). These municipalities were not part of our study.
2 Interviews with Ricardo Mujica, deputy director general of Social Program Evaluation, Ministry of Social Development, and Enrique Martinez y Morales, under-secretary of finance in the State of Coahuila, contributed to our better understanding of the origins of Piso Firme in Coahuila.
3 For example, state-level Piso Firme programs have been established in the states of Chihuahua (http://municipios.chihuahua.gob.mx) and Guanajuato (http://www.leon.gob.mx), and the Piso Firme subcomponent of the Programa para Desarrollo Local Microregiones (Program for Local Development Microregiones) has been expanded with the objective of achieving full coverage of cement floors in targeted areas by 2012 (http://www.sedesol.gob.mx).
4 Interviews with government officials suggest that the subsequent adoption of Piso Firme was based, in part, on the Coahuila experience as Governor Martinez was a prominent member of the political party in power in the federal government and, in part, based on situational analyses.

VoL. 1 no. 1 79cAttAnEo Et AL.: Housing, HEALtH, And HAPPinEss
contracted the inputs, and provided oversight for the implementation of the program (Secretaria de Desarrollo Social de Coahuila 2004). Eligible neighborhoods were surveyed door-to-door and housing units that met these criteria were offered up to 50 square meters (538 square feet) of cement valued at about 1,500 Mexican pesos (approximately $150 US).
State officials reported that almost no one turned down the offer of the program, and that they believed that all of the eligible households were identified and offered the program. In fact, official records of Coahuila’s Piso Firme program confirm that in the aggregate there has been almost full compliance with the program. The 2000 census registered approximately 4.6 percent or approximately 25,000 households with dirt floors in the State of Coahuila, while approximately 34,000 households had received Piso Firme by 2005, according to the official records.
The program covers the cost of the cement through equal contributions of munici-pal and state resources. Households supply the labor input needed to prepare and lay the floor. Community volunteers typically assist households that are unable to provide the labor input. Beneficiaries are informed of the delivery date and asked to prepare the rooms following a set of technical specifications. The cement is deliv-ered by large trucks that roll through the neighborhoods, spreading the cement house-by-house. Each cement truck carries approximately seven cubic meters of cement, enough for four to five houses. After the cement is poured, each family smoothes out the floor according to the instructions they received. The entire pro-cess is completed in one day.5
The primary objective of the program is to improve standards of living, par-ticularly health standards, through improvements in the physical environment in which families live. Replacing dirt floors with cement floors improves the cleanli-ness, warmth, and aesthetics of the home environment. Most parasites live and breed in feces and are transmitted to humans when ingested. Fecal matter enters the house through various modes of transmission, including on the shoes of people, through animals, spillage of unclean water, and from young children with inadequate dia-pers. Dirt floors provide a vector for parasites to infest people, especially young chil-dren, since fecal matter tends to remain on the floor because it is less easy to spot and dirt floors are not easy to clean. Emma Marianela Morales-Espinoza et al. (2003) find that among deprived households in Mexico, ceteris paribus, children residing in houses with dirt floors are more likely to be infected with intestinal parasites. Similar evidence is found for other Latin American countries (see, among others, M. I. Gamboa et al. 1998 for Argentina, Kathryn H. Jacobsen et al. 2007 for Ecuador, and Adriana S. Lopez et al. 2003 for Haiti).
Parasitic infestations pose serious threats to young children. More than 3 million children die from parasitic diseases each year (World Bank 2002). Parasitic infesta-tions are associated with diarrhea and micronutrient malnutrition which often leads to iron-deficiency anemia, protein-energy malnutrition, and enlargement of the liver and spleen (see, among others, Roy M. Anderson and Robert M. May 1992, and M. S. Hesham, A. B. Edariah, and M. Norhayati 2004). Currently, anemia, which leads to
5 Laying the cement typically takes 30 minutes per household and requires 4 hours to dry.

80 AMEricAn EconoMic JournAL: EconoMic PoLicy fEBruAry 2009
slow cognitive development, is a widespread global health problem (see, among others, C. Nokes et al. 1992, and Ernesto Pollit 1990).
By providing cement floors to households with dirt floors, Piso Firme interrupts the transmission of parasitic infestations, particularly for young children. For this reason, we expect to find lower incidences of diarrhea, malnutrition, and micronutri-ent deficiency (particularly anemia), and thereby improved cognitive development among children in beneficiary households. Our study of this intervention is similar in spirit to the study by Edward Miguel and Michael Kremer (2004), which evalu-ated the impact of chemotherapeutic deworming of school-aged children using a randomized experiment in Kenya and found that such deworming reduced school absenteeism by one-quarter. Our study complements Miguel and Kremer’s results as we demonstrate that cement floors can reduce the incidence of those parasites (amoebas) that remain even after deworming.
In addition to analyzing the health effects of Piso Firme, we expect that, as a result of the improved home environment, family members may enjoy spending time in the home with cement floors more than they did with dirt floors. Therefore, we hypoth-esize that one would be happier and less depressed living in a cleaner, warmer, and more aesthetically pleasing environment.
II. Identification Strategy
In order to identify the impacts of replacing dirt floors with cement floors, we need to assess the counterfactual (i.e., to examine what would have happened to the households in the treatment group had they not received treatment). We exploit geographical variability in the implementation of the program to construct a com-parison group that estimates this counterfactual.6
This study focuses on the State of Coahuila, in Northern Mexico, which began implementing Piso Firme in 2000, and provided cement floors to more than 34,000 households by 2005. While Piso Firme began as a state program in Coahuila, it was later adopted by the Federal Government and gradually scaled up to other states over time. One state that did not fully scale up Piso Firme by 2005 was the neighboring State of Durango. This state committed to implement Piso Firme in 2004 as part of the national scale up, and had just started limited rollout in 2005. Durango straddles the south-western corner of Coahuila and shares a major urban area.
In order to ensure that the treatment and control groups are comparable in terms of observable characteristics, we implemented the following sampling procedure. First, we geographically restricted the sample to families residing in the twin cit-ies of Gómez Palacio and Lerdo (control) and Torreón (treatment) that straddle the border of the States of Durango and Coahuila, respectively. The Piso Firme program had not yet reached Gómez Palacio and Lerdo by the time of our survey in the spring of 2005, nor had Durango announced if or when these two cities would receive the program. In addition, there are no major barriers between Gómez Palacio and
6 As a retrospective study, where benefits had already been assigned to the universe of eligible population, random assignment of the treatment was not feasible, and so an alternative source of exogenous variation was required to construct a valid counterfactual.

VoL. 1 no. 1 81cAttAnEo Et AL.: Housing, HEALtH, And HAPPinEss
Lerdo and Torreón. Instead, neighborhoods spill across the two states’ border form-ing a single urban agglomeration. Although the two cities are split, administratively, between the two states, they are effectively a single urban area in socioeconomic terms. In principle, households residing near the border in these cities are likely to be similar except for the influence of state policies.
Second, we randomly drew the sample of treated households from administrative records of the universe of households included in Piso Firme in the city of Torreón in the State of Coahuila between 2001 and 2003. Since data collection was conducted in the spring of 2005, this time frame provides us with a sample of treated house-holds with two to four years of exposure to treatment.
Third, using preintervention information gathered from the 2000 population census, we identified the census blocks (AGEBs) where our sample of treated households was located and calculated average pretreatment characteristics at this census level. Similarly, we also identified a sample of census blocks in the cities of Lerdo and Gómez Palacio that were geographically close to the border with Torreón.
Fourth, using a minimum distance algorithm, we matched samples of treated and potential control census blocks using data on the following pretreatment characteris-tics at the census block level: proportion of blocks within each census block with dirt floors, proportion of households with dirt floors, number of children between zero and five years of age, and number of households. Specifically, we calculated the dis-tance measure as the maximum of the absolute value differences between these four variables (L-infinite distance) for each possible pair of treatment and control census blocks. We then selected as control areas those census blocks that were closest to the treated areas in terms of this distance measure. The sample of control households was randomly drawn from the blocks within these specific selected areas, condi-tional on the presence of dirt floors in 2000.
Finally, we imposed the following eligibility criteria on all (i.e., both treatment and control) surveyed households: households had to own the house where they reside, since homeownership is an eligibility requirement for the Piso Firme pro-gram; the family groups must have resided in that specific dwelling since 2000; the houses must have had at least one room with a dirt floor in 2000 (since, otherwise, the household could have not received the program benefits); and households must have at least one child younger than six years old at the time of the interview. This last requirement was based on the fact that the treatment was expected to render its main health benefits to individuals in this age group.
III. Data
The data for all of our analyses comes from a cross-sectional household survey of control and treatment groups that we conducted with the Mexican National Institute of Public Health in the spring of 2005. We supplement these data with information from the 2000 Mexican census, the vital statistic mortality files, and the 1994–2000 national household surveys. These supplement data are used solely for the purposes of checking preintervention control and treatment group balance in the levels and trends of key characteristics.

82 AMEricAn EconoMic JournAL: EconoMic PoLicy fEBruAry 2009
The survey’s target sample size was 3,000 households equally split between treat-ment and control groups. Response rates were very high. In the treatment area, the response rate was 92.6 percent or 1,390 completed surveys, while in the control area the response rate was 92.9 percent or 1,393 completed surveys. Of these 2,783 households, we have complete geographical location information for 2,755 of them (99 percent). This group constitutes the final sample used in this analysis.
We collected detailed information on household demographic structure, socio-economic status, housing infrastructure (including detailed information on the type of floor in each room of the house), health outcomes, and cognitive development of children less than six years old, as well as happiness and mental health indicators for their mothers. All variables measured contemporaneous values at the time of the survey, except for the share of rooms that had cement floors in 2000, which is a retrospective measurement. Table 1 provides a description of all the outcomes used in this study and the corresponding sample sizes.
The child health and development outcomes include: maternal reported cases of diarrhea in children in the four weeks prior to the survey, stool samples to determine the prevalence of parasites in fecal matter, height and weight anthropometric statis-tics to measure stunting and wasting, blood from a finger prick to assess hemoglobin levels and anemia, and measures of language and communication ability.
In order to measure the presence of intestinal parasites, we collected two stool samples from every child less than six years old. We used standard parasite ova cen-trifuge concentration techniques on the fixed specimens with direct visualization in order to detect the presence of 19 different types of common parasites, both worms and protozoa (D. M. Melvin and M. M. Brooke 1982).7,8 We then compared the measurement for the two samples and found convergence in more than 99 percent of the subjects.
We measured the height and weight of all the children less than six years old using standard international procedures and regularly calibrated portable scales and stadiometers. The measurement instruments were regularly recalibrated (twice weekly) in the field. Repeated measurements were taken of all children in order to monitor quality control. In accordance with World Health Organization guidelines, we converted these measurements into height-for-age and weight-for-height z-scores, which measure the number of standard deviations from age-sex standardized height of a healthy (US) reference population.
In order to measure anemia, we collected blood samples by means of digital capillary punctures (i.e., finger pricks). At the time of collection, we placed one drop (10 µl) of blood in a portable photoreflectometer to measure the concen-tration of hemoglobin in the blood. During the fieldwork, the photometers were
7 The parasite count does not include Blastocystis Hominis (BH). The reason for excluding this parasite is that cement floors do not intercept the transmission of this parasite as it is transmitted through other mechanisms (see Kevin S. W. Tan, Mulkit Singh, and Eu Hian Yap 2002). Indeed, there are no statistically significant differences between the prevalence of BH in the treatment and control groups. Under the assumption that the Piso Firme program is not effective in reducing the presence of this intestinal protozoan parasite, this finding also provides suggestive evidence of the comparability of the treatment and control groups.
8 We did not find worms in our sample, only protozoa (amoebas). This is due to the fact that residents of both the treatment and control areas are being regularly dewormed through the distribution of albendazole to the households in these areas.

VoL. 1 no. 1 83cAttAnEo Et AL.: Housing, HEALtH, And HAPPinEss
Table 1—Description of Outcome Variables and Sample Sizes in 2005 Survey
Variable DescriptionObservations
treatmentObservations
control
Share of rooms with cement floors
Share of rooms in house with cement floors 1,362 1,393
Cement floor in kitchen Indicator equal to one if kitchen has cement floor 1,362 1,393Cement floor in dining room Indicator equal to one if dining room has cement floor 1,362 1,393Cement floor in bathroom Indicator equal to one if bathroom has cement floor 1,362 1,393Cement floor in bedroom Indicator equal to one if bedroom has cement floor 1,362 1,393Parasite count Parasite count present in child’s stool sample 1,528 1,566Diarrhea Indicator equal to one if the mother reports that the
child had diarrhea in the last four weeks1,930 2,105
Anemia Indicator equal to one if the child’s hemoglobin level is less than 11g/dL, adjusted for altitude
1,768 1,951
MacArthur Communicative Development Test score
MacArthur Communicative Development Test for children aged 12–30 months
291 302
Picture Peabody Vocabulary Test percentile score
Picture Peabody Vocabulary Test results in terms of the percentile of the distribution of Latin American outcomes for children aged 36–71 months
757 817
Height-for-age z-score Child’s height-for-age z-score 1,865 2,053Weight-for-height z-score Child’s weight-for-height z-score 1,881 2,058Satisfaction with floor quality Indicator equal to one if respondent reports being
satisfied or very satisfied with quality of house’s floors1,362 1,393
Satisfaction with house quality Indicator equal to one if respondent reports being satisfied or very satisfied with overall quality of house
1,362 1,393
Satisfaction with quality of life
Indicator equal to one if the respondent reports being satisfied or very satisfied with their overall quality of life
1,362 1,393
Depression Scale (CES-D Scale)
Radloff (1977) index of self-reported depressive symptomatology. Range: 0 (low) to 60 (high)
1,354 1,388
Perceived Stress Scale (PSS) Cohen, Kamarck, and Mermelstein (1983) index of self-reported perceived stress symptoms. Range: 0 (low) to 40 (high)
1,359 1,387
Respiratory diseases Indicator equal to one if the mother reports that the child had a respiratory disease in the last four weeks
1,930 2,107
Skin diseases Indicator equal to one if the mother reports that the child had a skin disease in the last four weeks
1,926 2,106
Other diseases Indicator equal to one if the mother reports that the child had another disease in the last four weeks
1,930 2,106
Installation of cement floor Indicator equal to one if the household reports having installed a cement floor since 2000
1,362 1,392
Construction of sanitation facilities
Indicator equal to one if the household reports having constructed new sanitation facilities since 2000
1,362 1,390
Restoration of sanitation facilities
Indicator equal to one if the household reports having improved sanitation facilities since 2000
1,362 1,391
Construction of ceiling Indicator equal to one if the household reports having installed new ceilings since 2000
1,361 1,392
Restoration of walls Indicator equal to one if the household reports having improved house walls since 2000
1,362 1,392
Any improvement Indicator equal to one if the household reports having any of the house improvements reported above, excluding installation of cement floor, since 2000
1,362 1,393
Log of self-reported rental value of house
Logarithm of self-reported rental value of the house 1,284 1,285
Log of self-reported sale value of house
Logarithm of self-reported sale value of the house 1,239 1,223
Log total income of mothers of children 0–5 yrs
Logarithm of total income of mothers of children from 0 to 5 years of age
247 301
Log total income of fathers of children 0–5 yrs
Logarithm of total income of fathers of children from 0 to 5 years of age
1,026 1,000
Total consumption per capita Total consumption per capita reported by the household
1,360 1,391

84 AMEricAn EconoMic JournAL: EconoMic PoLicy fEBruAry 2009
calibrated twice weekly, and the measurements of the control tray were recorded at the beginning and end of each day. The hemoglobin results were immediately available in the household and enabled the survey team to inform the family whether the child was at risk of anemia. In addition, we provided children with hemoglobin values of less than 9 g/dL with a ferrous sulfate treatment. For the purpose of our analysis, according to international standards, we define a child to be anemic if his or her hemoglobin level is less than 11g/dL, adjusted for the altitude of his or her area of residence using standard adjustments (Centers for Disease Control and Prevention 1998).
We measured child cognitive development using two different indicators. First, for children aged 12 to 30 months, we applied the Spanish version of the MacArthur Communicative Development Inventory (CDI, Cognitive Development Laboratory at San Diego State University). This instrument appraises language and communi-cation skills in infants and young children through parental reporting. In the field, we used the short infant form (“Versión Breve del Inventario del Desarrollo de Habilidades Comunicativas-Inventario I”), which includes a 105-word vocabulary checklist with separate columns to report comprehension and verbalization of each word. This short form is recommended when parental literacy is low, as is the case in our study.
Second, for children aged 36 to 71 months, we applied the Spanish version of the Picture Peabody Vocabulary Test (PPVT) (“Test de Vocabulario en Imágenes Peabody (TVIP)”) (Lloyd M. Dunn 1965). Based on the PPVT, the TVIP contains 125 translated items to assess the vocabulary of Spanish-speaking and bilingual children. Items have been carefully selected based on a rigorous item analysis for their universality and appropriateness for Spanish-speaking communities. The TVIP is frequently used to evaluate the language development of Spanish-speaking preschool children, as well as older students (F. Muñoz et al. 1989, and Vivian M. Umbel et al. 1992). We report the results in terms of the percentile distribution of Latin American outcomes.
Finally, we measured happiness of the mother using a rich set of indicators. First, we asked about the mother’s satisfaction with floor quality, overall housing quality, and quality of life. The possible answers were: (a) very satisfied, (b) satisfied, (c) fair, and (d) unsatisfied. In the empirical analysis reported in this paper, we convert these responses into a binary variable that equals one if the answer is in categories (a) or (b) and zero otherwise.
Second, we collected measures of depression and perceived stress for mothers of children younger than six years old. In order to measure stress, we implemented the Perceived Stress Scale (PSS) developed by Sheldon Cohen, Tom Kamarck, and Robin Mermelstein (1983). We used a ten-item version of the PSS designed to cap-ture the degree to which mothers found their lives to be unpredictable, uncontrol-lable, and overloaded during the month prior to the interview. Answers were given on a scale of 0 to 5. Four of the questions were positively worded while the other six were negatively worded. We obtained the PSS score by reversing the scores for the answers to the positively worded items and then summing up the scores across the answers of the ten items. Therefore, a higher score signifies a higher level of per-ceived stress on a scale of 0 to 40.
VoL. 1 no. 1 85cAttAnEo Et AL.: Housing, HEALtH, And HAPPinEss
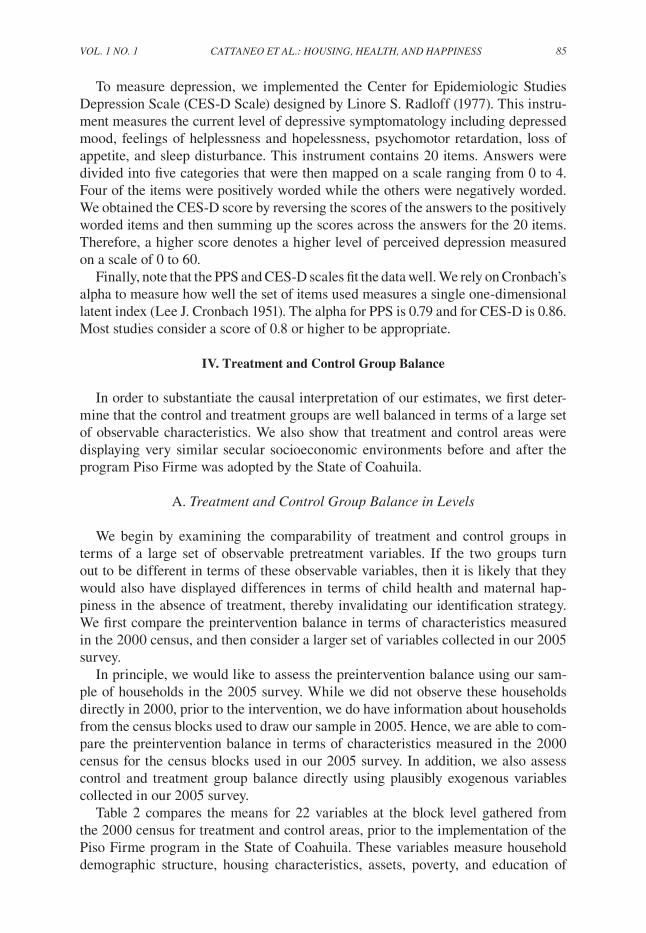
To measure depression, we implemented the Center for Epidemiologic Studies Depression Scale (CES-D Scale) designed by Linore S. Radloff (1977). This instru-ment measures the current level of depressive symptomatology including depressed mood, feelings of helplessness and hopelessness, psychomotor retardation, loss of appetite, and sleep disturbance. This instrument contains 20 items. Answers were divided into five categories that were then mapped on a scale ranging from 0 to 4. Four of the items were positively worded while the others were negatively worded. We obtained the CES-D score by reversing the scores of the answers to the positively worded items and then summing up the scores across the answers for the 20 items. Therefore, a higher score denotes a higher level of perceived depression measured on a scale of 0 to 60.
Finally, note that the PPS and CES-D scales fit the data well. We rely on Cronbach’s alpha to measure how well the set of items used measures a single one-dimensional latent index (Lee J. Cronbach 1951). The alpha for PPS is 0.79 and for CES-D is 0.86. Most studies consider a score of 0.8 or higher to be appropriate.
IV. Treatment and Control Group Balance
In order to substantiate the causal interpretation of our estimates, we first deter-mine that the control and treatment groups are well balanced in terms of a large set of observable characteristics. We also show that treatment and control areas were displaying very similar secular socioeconomic environments before and after the program Piso Firme was adopted by the State of Coahuila.
A. treatment and control group Balance in Levels
We begin by examining the comparability of treatment and control groups in terms of a large set of observable pretreatment variables. If the two groups turn out to be different in terms of these observable variables, then it is likely that they would also have displayed differences in terms of child health and maternal hap-piness in the absence of treatment, thereby invalidating our identification strategy. We first compare the preintervention balance in terms of characteristics measured in the 2000 census, and then consider a larger set of variables collected in our 2005 survey.
In principle, we would like to assess the preintervention balance using our sam-ple of households in the 2005 survey. While we did not observe these households directly in 2000, prior to the intervention, we do have information about households from the census blocks used to draw our sample in 2005. Hence, we are able to com-pare the preintervention balance in terms of characteristics measured in the 2000 census for the census blocks used in our 2005 survey. In addition, we also assess control and treatment group balance directly using plausibly exogenous variables collected in our 2005 survey.
Table 2 compares the means for 22 variables at the block level gathered from the 2000 census for treatment and control areas, prior to the implementation of the Piso Firme program in the State of Coahuila. These variables measure household demographic structure, housing characteristics, assets, poverty, and education of

86 AMEricAn EconoMic JournAL: EconoMic PoLicy fEBruAry 2009
household members. For each of these variables, we present the means and stan-dard errors for both treatment and control groups as well as their mean differences and respective standard errors. All standard errors in this paper are clustered at the census-block level.
The first four variables in Table 2 were used to match the sampling of treated and control census blocks, and they are, therefore, balanced in our sample. One of these variables is the proportion of households that report having dirt floors in 2000, which is particularly important since reducing the presence of dirt floors is the direct objec-tive of the intervention. In addition, there are no significant differences in the other 18 pretreatment variables presented in Table 2. Thus, we conclude that the treatment and control areas from which we drew our samples were well balanced prior to the intervention and this increases our confidence that the treatment and control groups were comparable prior to the implementation of the program.9
Next, we investigate whether the actual treated and control households in our 2005 sample are well balanced in terms of variables that can reasonably be consid-ered exogenous to the intervention studied. This provides further evidence in favor of our identification strategy. Ideally, we would like to compare treatment and con-trol households in our survey prior to the intervention. However, this information is not available, and we are forced to rely on the variables in our 2005 survey under the working assumption that these variables were not affected by Piso Firme. In particular, we focus on variables that are either retrospective or reasonable arguably exogenous to the intervention.
Table 3 compares the balance between treatment and control households with respect to 27 variables that were collected in our 2005 survey.10 These variables are grouped into six different categories: household demographics, children’s characteris-tics, housing characteristics, hygienic environment, economic variables, and benefits from public social programs. In our view, except for the economic characteristics,11 the variables included in this table are likely to be unrelated to the treatment studied and, as such, are reasonably good instruments for testing balance between treatment and control groups. As in Table 2, we also present the means and standard errors of these variables for both the treatment and control groups, as well as their mean dif-ferences and respective standard errors.
Turning to the results reported in Table 3, notably almost all of the variables presented in this table are statistically balanced. No variables present statistically significant mean differences at the 5 percent level and only 2 of these 27 variables present significant differences at the 10 percent level, something that is likely to occur even when the true mean values of these variables are the same between both groups.
We start by noting that there are no differences in the household’s retrospective recall of the share of rooms with cement floors in 2000, prior to program inter-vention. This is important because it implies that treatment and control groups are
9 Computing these mean differences at the household level by assigning each household the value of the vari-ables corresponding to its census block does not change the results. All mean differences remain insignificant.
10 All variables in this table are contemporaneous with the time of the survey with only the exception of share of rooms with cement floors in 2000, which is a self-reported retrospective variable that refers to the year 2000.
11 We discuss the reasons for the potential endogeneity of the economic variables in Section VI.

VoL. 1 no. 1 87cAttAnEo Et AL.: Housing, HEALtH, And HAPPinEss
Table 2—Difference of Means for Pre-intervention 2000 Census Variables
VariableMean
treatmentMean
controlMean
difference
Proportion of blocks of houses with at least one house that has dirt floors 0.573 0.612 −0.040(0.030) (0.042) (0.051)
Proportion of households with dirt floors 0.173 0.189 −0.016(0.026) (0.026) (0.037)
Average number of children between 0 and 5 yrs of age 0.710 0.721 −0.011(0.014) (0.014) (0.020)
Number of households 511.292 488.989 22.303(60.381) (38.105) (71.399)
Number of people 2,241.586 2,170.597 70.989(280.400) (172.460) (329.191)
Average number of rooms per household 2.352 2.353 −0.002(0.069) (0.075) (0.102)
Average number of people per household 4.326 4.448 −0.122(0.033) (0.109) (0.114)
Proportion of households with no water connection outside the house 0.076 0.043 0.033(0.018) (0.014) (0.023)
Proportion of households with no water connection inside the house 0.392 0.316 0.076(0.038) (0.036) (0.052)
Proportion of households with no water connection in the bathroom 0.507 0.451 0.056(0.040) (0.032) (0.052)
Proportion of households with no gas heater 0.028 0.029 −0.001(0.004) (0.004) (0.006)
Proportion of households with no refrigerator 0.204 0.212 −0.007(0.018) (0.013) (0.022)
Proportion of households with no washing machine 0.379 0.359 0.020(0.018) (0.018) (0.026)
Proportion of households with no telephone 0.804 0.786 0.018(0.014) (0.020) (0.025)
Proportion of households with no vehicle 0.735 0.734 0.000(0.014) (0.018) (0.023)
Average overcrowding index 2.302 2.314 −0.012(0.063) (0.069) (0.094)
Proportion of households below the poverty line 0.140 0.148 −0.009(0.015) (0.012) (0.019)
Proportion of households with illiterate members 0.063 0.059 0.004(0.003) (0.004) (0.005)
Average years of schooling of head of household 6.386 6.514 −0.128(0.097) (0.166) (0.192)
Average number of school dropouts among children aged 5–15 yrs 0.180 0.172 0.007(0.008) (0.009) (0.012)
Average number of household members who work 1.508 1.592 −0.084(0.026) (0.064) (0.069)
Average number of family members who earn an income 1.422 1.495 −0.072(0.025) (0.060) (0.065)
Observations 599 370
notes: Table computed at block level using census-block information. Standard errors clustered at census-block level shown in parentheses (136 clusters). Data source: 2000 Mexican census. *** Significantly different from 0 at the 1 percent level. ** Significantly different from 0 at the 5 percent level. * Significantly different from 0 at the 10 percent level.

88 AMEricAn EconoMic JournAL: EconoMic PoLicy fEBruAry 2009
Table 3—Difference of Means for Independent Variables in 2005 Survey
VariableObservations
treatmentMean
treatmentObservations
controlMean
controlMean
difference
Household demographics
Number of household members 1,362 5.320 1,393 5.374 −0.054(0.070) (0.071) (0.100)
Head of household’s age 1,362 37.537 1,393 37.120 0.418(0.413) (0.490) (0.641)
Head of household’s years of schooling 1,360 6.128 1,391 6.408 −0.280(0.134) (0.115) (0.177)
Spouse’s age 1,362 29.645 1,393 28.772 0.874(0.475) (0.406) (0.625)
Spouse’s years of schooling 1,207 6.338 1,211 6.479 −0.141(0.150) (0.108) (0.185)
characteristics of children aged 0–5
Age 1,940 2.643 2,112 2.579 0.064(0.032) (0.032) (0.046)
Male (=1) 1,940 0.492 2,112 0.517 −0.024*(0.011) (0.007) (0.013)
Mother of at least one child in household present (=1)
1,940 0.968 2,112 0.964 0.004
(0.005) (0.005) (0.007)
Mother’s age (if present) 1,861 27.383 1,992 27.465 −0.082(0.187) (0.169) (0.252)
Mother’s years of schooling (if present) 1,859 7.059 1,992 6.910 0.149(0.135) (0.133) (0.189)
Father of at least one child in household present (=1)
1,940 0.797(0.011)
2,112 0.763(0.013)
0.034*(0.017)
Father’s age (if present) 1,480 30.368 1,525 30.632 −0.265(0.303) (0.271) (0.407)
Father’s years of schooling (if present) 1,476 6.839 1,519 7.153 −0.313(0.155) (0.117) (0.194)
Housing characteristics
Number of rooms 1,362 2.080 1,393 1.981 0.099(0.054) (0.053) (0.076)
Water connection (=1) 1,362 0.970 1,393 0.977 −0.007(0.005) (0.005) (0.007)
Water connection inside the house (=1) 1,362 0.511 1,393 0.546 −0.035(0.029) (0.022) (0.036)
Electricity (=1) 1,362 0.985 1,393 0.993 −0.008(0.005) (0.002) (0.005)
Share of rooms with cement floors in 2000 1,362 0.330 1,393 0.327 0.003(0.020) (0.021) (0.029)
Hygienic environment
Household has animals on land (=1) 1,362 0.517 1,393 0.480 0.037(0.014) (0.018) (0.023)
Animals allowed to enter the house (=1) 1,362 0.192 1,393 0.190 0.002(0.014) (0.013) (0.020)
Uses garbage collection service (=1) 1,362 0.799 1,393 0.845 −0.046(0.030) (0.033) (0.045)
Number of times respondent washed hands the day before
1,362 3.754(0.057)
1,393 3.716(0.060)
0.038(0.083)

VoL. 1 no. 1 89cAttAnEo Et AL.: Housing, HEALtH, And HAPPinEss
comparable in terms of the key measure of Piso Firme’s objective, replacing dirt floors, at baseline. We also note that households are well balanced in terms of other current housing characteristics, such as number of rooms, water, and electricity connections.
Households are also well balanced in terms of current household demographics and the characteristics of young children, number of household members, and char-acteristics of the head-of-household and spouse of the head-of-household. The char-acteristics of young children are, on average, the same in terms of own age, mother and father age, and education, as well as the probability that the mother is present. Of note, however, is that the proportion of male children in the control group is 0.517 compared to 0.492 in the treatment group and that this difference is statistically sig-nificant at the 10 percent level. Additionally, the proportion of children whose father is present in the household is 0.763 in the control group versus 0.797 in the treatment group, and this difference is also statistically significant at the 10 percent level. We control for these characteristics in the analysis to test the robustness of the estimates to these deviations.
The current health and hygienic environments of the control and treatment households are also well balanced. Households in both groups have the same share of municipal water connections on their land plot and inside their houses, as well as a similar access to electricity services. They also have similar hygiene habits as mea-sured by the presence of animals in and around the house, hand-washing behavior, and garbage disposal behavior.
Table 3— Difference of Means for Independent Variables in 2005 Survey (continued)
VariableObservations
treatmentMean
treatmentObservations
controlMean
controlMean
difference
Economic characteristics
Total household income per capita 1,361 1024.703 1,391 1051.676 −26.973(71.168) (102.976) (125.176)
Total value of household assets per 1,361 22393.733 1,393 22032.320 361.414 capita (254.334) (308.994) (400.204)
Public social programs
Cash transfers per capita from 1,361 16.187 1,392 12.604 3.583 government programs (2.094) (1.222) (2.425)
Household beneficiary of government 1,362 0.060 1,393 0.082 −0.022 milk supplement program (=1) (0.009) (0.011) (0.015)
Household beneficiary of government 1,362 0.037 1,393 0.022 0.015 food program (=1) (0.007) (0.007) (0.009)
notes: Table computed at household and individual levels using survey information. total household income per capita excludes 3 observations with values greater than $450,000 (approximately $45,000). All the results in the paper remain unchanged if these observations are included in the analysis. share of rooms with cement floors in 2000 is a self-declared retrospective variable that refers to the year 2000, while all the other variables are con-temporaneous with the time of the survey. Standard errors clustered at census-block level shown in parentheses (136 clusters). *** Significantly different from 0 at the 1 percent level. ** Significantly different from 0 at the 5 percent level. * Significantly different from 0 at the 10 percent level.
source: 2005 Survey.

90 AMEricAn EconoMic JournAL: EconoMic PoLicy fEBruAry 2009
Furthermore, the two economic variables included in this table (total household income per capita and total assets per capita) are statistically indistinguishable between treatment and control groups. This result shows that the current socioeco-nomic status is similar between both groups and likely unaffected by Piso Firme.12
Finally, the same proportion of treated and control households benefit from public programs likely to affect nutritional outcomes. We consider two types of programs: nutrition specific programs and any program that provides cash transfers. Both treatment and control households receive similar amounts of monetary transfers per capita. Note, also, that, on average, these households receive between 60 and 80 pesos per month in transfers from public social programs, which represents a very small share (approximately 1 percent) of the households’ average income. Overall, we conclude these findings imply that treated and control groups are well balanced and provide credibility to our identification strategy.
B. treatment and control group Balance in secular trends
In the previous section, we showed that the treatment and control groups are balanced in terms of a large set of observable variables. Despite the fact that these households reside in a fundamentally homogenous environment, it is still possible that there may have been different secular trends between the states of Durango and Coahuila, and that these differences could have affected the outcomes of interest considered in this paper. In order to address this concern, we investigate the secular behavior of a large set of variables from publicly available datasets.
First, in Figure 1, we present the annual time series of both the total mortal-ity rate and the child mortality rate for the municipality of Torreón in the State of Coahuila (treatment) and the municipalities of Gómez Palacio and Lerdo in the State of Durango (control) for the period 1994–2001.13 In both cases, these variables pres-ent very similar secular trends during the period previous to the adoption of Piso Firme by the State of Coahuila. Not only do the treatment and control series have the same trends, but they have the same levels of total mortality rates. Note that with respect to child mortality, the treatment area exhibits somewhat higher levels sug-gesting that, if anything, the control group may have been relatively healthier before the adoption of Piso Firme.
Second, in Figures 2A and 2B, we present biannual time series for the period 1994–2000 for the following aggregate variables: Number of children 0–5 years old per household; number of rooms per household; real household income per capita; real total consumption per capita; and real expenditures in health services per capita. These series were constructed using state level data from the Income and Expenditure National Household Survey (Encuesta Nacional de Ingresos y Gastos de los Hogares, ENIGH). We report the mean level for each variable and its corresponding 95 percent confidence interval. As can be seen from this figure, all
12 Households in our sample are not extremely poor. On average, their monthly income is approximately equal to the value of the poverty line.
13 The mortality data are available from vital statistics records in the Mexican Department of Health. Mortality rates are computed as the number of annual deaths over the relevant population × 100.

VoL. 1 no. 1 91cAttAnEo Et AL.: Housing, HEALtH, And HAPPinEss
variables present the same levels and trends for the states of Coahuila and Durango. This suggests that both before and after Piso Firme was implemented, both states exhibited very similar health and socioeconomic environments.14
V. Program Impacts
We subsequently study the effect of Piso Firme on several outcome variables of interest including child health and maternal happiness indicators. We begin by demonstrating that offering the benefits provided by Piso Firme had an impact in terms of the presence of cement floors in the corresponding households. This is a necessary condition for Piso Firme to have an impact on child health and maternal happiness through the pathways discussed in Section I. We first present evidence on
14 Using the data from ENIGH, we constructed a much larger and rich set of variables for the analysis. In all cases, these variables displayed the same levels and trends for both states. The list of variables includes: (a) demographic variables (average education of the head of the household, average education of spouse, children’s gender composition); (b) access to utilities and services variables (average access to public water, the electricity system, and garbage collection service); and (c) socioeconomic variables (average proportion of working house-hold members, average hours worked per capita, and income and expenditure disaggregated by different sources). These results are available upon request.
1994 1995 1996 1997 1998 1999 2000 2001
0.45
0.50
0.55
0.60Total mortality rate
Year
Rat
e
CoahuilaDurango
1994 1995 1996 1997 1998 1999 2000 2001
0.1
0.2
0.3
0.4
Child mortality rate (0 to 5 yrs)
Year
Rat
e
Figure 1. Evolution of Total and Child Mortality Rates
source: Mexican Department of Health 1994−2001.

92 AMEricAn EconoMic JournAL: EconoMic PoLicy fEBruAry 2009
the differences in state level trends in cement floors and then estimate the impact of Piso Firme on the installation of cement floors using our sample.
We report the results of an intention-to-treat analysis for the Piso Firme program on the outcomes of interest. We estimate this parameter by regressing the depen-dent variable on a variable indicating whether or not the household was offered this benefit and a large set of control variables. The intention-to-treat dummy variable is equivalent to a dummy variable that indicates whether or not the household resides in the treatment area since all of the households in our sample residing in treatment areas were offered this benefit. The same benefit was not offered to any of the house-holds residing in the control areas.
For each dependent variable, we estimate three different linear regression speci-fications.15 Model 1 estimates the treatment effect on the response variables studied
15 When the outcome variable was dichotomous, we also estimated the average treatment effects by comput-ing the marginal effects of the intention-to-treat dummy variable on the outcomes after estimating probit models. The estimated effects are similar, and all of them are statistically significant at conventional levels. These results are available upon request.
1994 1996 1998 2000
1994 1996 1998 2000
1994 1996 1998 2000
3.5
4.0
4.5
5.0
5.5Number of household members
Year
Aver
age
2.0
2.5
3.0
3.5
4.0Number of rooms in household
Year
Aver
age
1,000
2,000
3,000
4,000Real total consumption per capita
Year
Peso
s
CoahuilaDurango
Figure 2A. Evolution of Socioeconomic Variables
source: ENIGH 1994−2000.
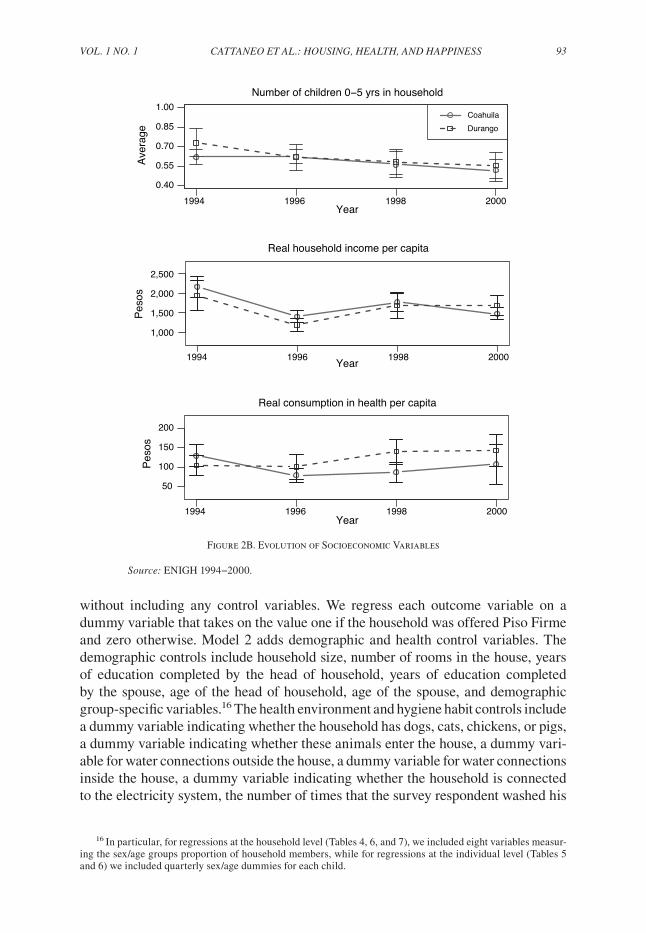
VoL. 1 no. 1 93cAttAnEo Et AL.: Housing, HEALtH, And HAPPinEss
without including any control variables. We regress each outcome variable on a dummy variable that takes on the value one if the household was offered Piso Firme and zero otherwise. Model 2 adds demographic and health control variables. The demographic controls include household size, number of rooms in the house, years of education completed by the head of household, years of education completed by the spouse, age of the head of household, age of the spouse, and demographic group-specific variables.16 The health environment and hygiene habit controls include a dummy variable indicating whether the household has dogs, cats, chickens, or pigs, a dummy variable indicating whether these animals enter the house, a dummy vari-able for water connections outside the house, a dummy variable for water connections inside the house, a dummy variable indicating whether the household is connected to the electricity system, the number of times that the survey respondent washed his
16 In particular, for regressions at the household level (Tables 4, 6, and 7), we included eight variables measur-ing the sex/age groups proportion of household members, while for regressions at the individual level (Tables 5 and 6) we included quarterly sex/age dummies for each child.
1994 1996 1998 2000
1994 1996 1998 2000
1994 1996 1998 2000
0.40
0.55
0.70
0.85
1.00Number of children 0−5 yrs in household
Year
Aver
age
CoahuilaDurango
1,000
1,500
2,000
2,500
Real household income per capita
Year
Peso
s
50
100
150
200
Real consumption in health per capita
Year
Peso
s
Figure 2B. Evolution of Socioeconomic Variables
source: ENIGH 1994−2000.

94 AMEricAn EconoMic JournAL: EconoMic PoLicy fEBruAry 2009
or her hands the day before the interview, and a dummy variable indicating whether the household uses a garbage collection service.17 Finally, Model 3 adds controls for the benefits from other social programs including total monetary transfers per capita from all social programs received by the household, a dummy variable indicating whether the household benefited from a government milk supplement program, a dummy variable indicating whether the household benefited from any other govern-ment food program, and a dummy variable indicating whether the household was enrolled in Seguro Popular, a government health insurance program.
In the first column of each table, we report the mean value of the outcome vari-able for the control group in order to be able to gauge the size of the estimated coef-ficient. In all cases, we report the point estimate, its clustered standard error, and the average program effect as a percentage of the mean of the dependent variable for the untreated households.18 All models are estimated clustering the errors at the census block level. The number of clusters in our sample is 136, a number large enough for using asymptotic inference (see Colin Cameron, Jonah B. Gelbach, and Douglas L. Miller 2008). All of the findings in this section remain valid if robust standard errors are computed instead of clustered standard errors.
A. state Level cement floors, secular trends
Before turning to the regression analysis of the effect of Piso Firme on the adop-tion of cement floors, we examine the evolution of the prevalence of cement floors at the state level. Using data from ENIGH for the period 1994–2006, we show, in Figure 3, that the proportion of households in which floors are predominantly made of cement were similar in both states in terms of levels and secular trends, before Piso Firme was implemented in Coahuila. As expected, once the program is in place, both series start to diverge, with the share of households in which floors are predom-inantly made of cement becoming very close to the one in the treatment area.
B. Estimated Program impact on cement floors
Now, we turn to analyze the impact of offering Piso Firme’s benefits on the pres-ence of cement floors in treatment houses in our sample. This tests the effect of the program in terms of its primary objective (i.e., the coverage of cement floors in the household), as families not offered the program might have replaced their dirt floors on their own, over time.19 We examine a number of alternative outcome indicators: share of rooms that have cement floors, a dummy variable indicating whether the kitchen has a cement floor, a dummy variable indicating whether the dining room has cement floor, a dummy variable indicating whether the bathroom has a cement
17 All the results in this paper are unaltered if we add total income per capita and total assets value per capita as control variables in the models. These results are available upon request.
18 To preserve parsimoniousness, we do not report the estimated coefficients of the control variables, but those are available upon request.
19 This might occur because of the existence of an aggregate secular upward trend, but also because of idio-syncratic motives. In particular, it seems to be the case that poor households replace their dirt floors with cement floors last in the construction of their houses. Investment in walls, ceilings, sanitation facilities, and kitchens generally precede investment in cement floors in self-constructed houses in poor areas.

VoL. 1 no. 1 95cAttAnEo Et AL.: Housing, HEALtH, And HAPPinEss
floor, and a dummy variable indicating whether all household members sleep in rooms with cement floors.
The results are displayed in Table 4. Control households report that 73 percent of their rooms had cement floors in 2005, up from 33 percent in 2000. This implies that in control areas there was a 40-percentage point increase in cement floors without Piso Firme. This is not surprising as this was a period of strong economic growth in Mexico and an expansion of Mexico’s generous cash transfer program, Oportunidades, to urban areas. Sergio A. Bautista and Gertler (2008) show that Oportunidades beneficiaries invested some of the cash transfers in housing improve-ments including replacing dirt floors with cement floors.
Despite this large secular increase in cement floors, we find that Piso Firme had large positive effects on the installation of cement floors across all the indicators studied. Piso Firme brought about an average increment in cement flooring of about 28 percent in the share of rooms with cement floors. We find stronger effects in the kitchen (38 percent) and sleeping areas (36 percent) of these households.20 In sum, Piso Firme succeeded in prompting households to install cement floors for almost all
20 Indeed, there is a convergence in the percentage of total floor space represented by cement floors in untreated households, since the households with a larger proportion of dirt floors in 2000 are among those that increased the share of cement flooring the most during the period considered.
1994 1996 1998 2000 2002 2004 2006
0.80
0.85
0.90
0.95
1.00
Proportion of households with cement floor
Year
Pro
port
ion
Coahuila
Durango
Figure 3. Evolution of Presence of Cement Floors in Houses
source: ENIGH 1994–2006.

96 AMEricAn EconoMic JournAL: EconoMic PoLicy fEBruAry 2009
their household floor space. These findings are extremely robust to all specifications presented in Table 4, confirming that the control and treatment groups are indeed well balanced.
C. Estimated Program impact on child Health
Table 5 presents the intention-to-treat analysis of the impact of Piso Firme on the health outcomes of children less than six years old. The outcome indicators include parasitic infestations, diarrhea, anemia, height, weight, and cognitive development. We find that the program is associated with the presence of fewer parasites, a lower incidence of diarrhea and anemia, and better cognitive development of young chil-dren. Moreover, these results are extremely robust to the inclusion of all sets of covariates.
Specifically, offering the program is associated with a 19.6 percent reduction in the presence of parasites. The program is also associated with a 1.8 percentage-point decrease in episodes of diarrhea, which represents a 12.8 percent reduction in the prevalence of diarrhea with respect to the control group. Piso Firme is also associated with an 8.5 percentage-point reduction in the incidence of anemia, which translates into a 20.1 percent decline in the prevalence of anemia with respect to the control group. We do not find any significant difference, however, in the usual height and weight anthropometric indicators.
Table 4—Regressions of Cement Floor Coverage Measures on Program Dummy
Dependent variableControl group
mean (std. dev.) Model 1 Model 2 Model 3
Share of rooms with cement floors 0.728 (0.363) 0.202 0.208 0.210[0.021]*** [0.019]*** [0.019]***
27.746 28.512 28.876
Cement floor in kitchen 0.671 (0.470) 0.255 0.260 0.265[0.025]*** [0.023]*** [0.023]***
37.936 38.708 39.440
Cement floor in dining room 0.709 (0.455) 0.21 0.217 0.221[0.026]*** [0.025]*** [0.025]***
29.633 30.588 31.189
Cement floor in bathroom 0.803 (0.398) 0.105 0.113 0.117[0.022]*** [0.018]*** [0.018]***
13.071 14.043 14.536
Cement floor in bedroom 0.668 (0.471) 0.238 0.245 0.245[0.020]*** [0.021]*** [0.020]***
35.598 36.735 36.695
notes: Regressions computed using survey information (sample sizes reported in Table 1). Missing values in covariates were imputed with zero, and a corresponding dummy variable was then added to the regressions. Model 1: no controls; Model 2: age, demographic, and health-habits controls; Model 3: age, demographic, health-habits, and public social programs controls. Reported results: estimated coefficient, clustered standard error at census-block level in brackets (136 clusters), and 100 × coefficient/control mean. *** Significantly different from 0 at 1 percent level. ** Significantly different from 0 at 5 percent level. * Significantly different from 0 at 10 percent level.
source: 2005 Survey.

VoL. 1 no. 1 97cAttAnEo Et AL.: Housing, HEALtH, And HAPPinEss
Finally, the program is also associated with notable improvements in child cognitive development. We find that treated children have a 30.2 percent higher score on the MacArthur test and show an improvement in the PPVT test equivalent to an increase with respect to the control group of about 9 percent.
These child health results are consistent with the hypothesis that replacing dirt floors with cement floors interrupts the transmission of parasitic infestations and should therefore reduce the incidence of both diarrhea and anemia. The reduction in anemia is expected to have positive effects on cognitive development.21
21 Alternatively, one can try to identify the effect of actually replacing dirt floors with cement floors, ceteris paribus, by regressing any of the dependent variables of interest on the share of cement floors and instrumenting this potentially endogenous variable by the exogenous intention-to-treat dummy variable (i.e., a dummy variable that indicates whether or not the household was offered the program treatment). Doing this procedure, we find that a complete substitution of dirt floors by cement floors would lead to a 78 percent reduction in parasitic infesta-tions, a 49 percent reduction in diarrhea, an 81 percent reduction in anemia, and a 36 to 96 percent improvement in cognitive development among young children.
Table 5—Regressions of Children’s Health Measures on Program Dummy
Dependent variableControl group
mean (std. dev.) Model 1 Model 2 Model 3
Parasite count 0.333 (0.673) −0.065 −0.064 −0.064[0.032]** [0.031]** [0.032]**
−19.545 −19.345 −19.198
Diarrhea 0.142 (0.349) −0.018 −0.020 −0.018[0.009]* [0.009]** [0.009]*
−12.819 −13.834 −12.803
Anemia 0.426 (0.495) −0.085 −0.081 −0.083[0.028]*** [0.027]*** [0.027]***
−20.059 −18.908 −19.388
MacArthur Communicative Development 13.354 (18.952) 4.031 5.652 5.557 Test score [1.650]** [1.642]*** [1.641]*** 30.182 42.325 41.609
Picture Peabody Vocabulary Test percentile 30.656 (24.864) 2.668 3.206 3.083 score [1.689] [1.430]** [1.410]** 8.702 10.460 10.058
Height-for-age z-score −0.605 (1.104) 0.007 −0.002 0.002[0.043] [0.038] [0.039]
−1.161 0.279 −0.323
Weight-for-height z-score 0.125 (1.133) 0.002 −0.005 −0.011[0.034] [0.036] [0.037]
1.790 −4.119 −8.727
notes: Regressions computed using survey information (sample sizes reported in Table 1). Missing values in covariates were imputed with zero, and a corresponding dummy variable was then added to the regressions. Model 1: no controls; Model 2: age, demographic, and health-habits controls; Model 3: age, demographic, health-habits, and public social programs controls. Reported results: estimated coefficient, clustered standard error at census-block level in brackets (136 clusters), and 100 × coefficient/control mean. *** Significantly different from 0 at 1 percent level. ** Significantly different from 0 at 5 percent level. * Significantly different from 0 at 10 percent level.
source: 2005 Survey.

98 AMEricAn EconoMic JournAL: EconoMic PoLicy fEBruAry 2009
D. Estimated Program impact on Maternal Happiness
Table 6 presents the results of the intent to treat analysis for maternal satisfaction and mental health. Again, the program effects are positive, significant, and robust to all specifications. The degree of satisfaction with the quality of the floors is 22 percentage points higher in the treatment group, which is 42.8 percent greater than the control mean.22 Similarly, the level of satisfaction in the treatment group with the overall quality of the house is 15.1 percent higher than the control group’s mean, while satisfaction with quality of life is 18.7 percent higher than the control mean.23 The last two rows of the table show the effects of the program on maternal mental health. We find that the depression and perceived stress scales are significantly lower in the treatment group with an estimated effect that represents a 12.5 percent and 10.6 percent difference from the control mean, respectively.
22 Rafael Di Tella and Robert MacCulloch (2006) and Daniel Kahneman and Alan B. Krueger (2006) have advocated the use of happiness indicators in assessing economic outcomes.
23 To check the robustness of these results as to the way we classify the more ambiguous answer “fair,” we also estimated the same set of regressions for an alternative measure of satisfaction, where the response “fair” was assigned a one instead of a zero. All the results remain unchanged when this alternative classification is used. These additional results are available upon request.
Table 6—Regressions of Satisfaction and Maternal Mental Health Measures on Program Dummy
Dependent variableControl group
mean (std. dev.) Model 1 Model 2 Model 3
Satisfaction with floor quality 0.511 (0.500) 0.219 0.223 0.222[0.023]*** [0.024]*** [0.026]***
42.784 43.635 43.421
Satisfaction with house quality 0.605 (0.489) 0.092 0.087 0.084[0.021]*** [0.021]*** [0.022]***
15.136 14.369 13.892
Satisfaction with quality of life 0.601 (0.490) 0.112 0.112 0.112[0.022]*** [0.021]*** [0.022]***
18.650 18.557 18.701
Depression scale (CES-D scale) 18.532 (9.402) −2.315 −2.417 −2.372[0.616]*** [0.570]*** [0.562]***
−12.493 −13.043 −12.797
Perceived stress scale (PSS) 16.514 (6.914) −1.751 −1.769 −1.742[0.428]*** [0.396]*** [0.396]***
−10.603 −10.710 −10.551
notes: Regressions computed using survey information (sample sizes reported in Table 1). Missing values in cova-riates were imputed with zero, and a corresponding dummy variable was then added to the regressions. Model 1: no controls; Model 2: age, demographic, and health-habits controls; Model 3: age, demographic, health-habits and public social programs controls. Reported results: estimated coefficient, clustered standard error at census-block level in brackets (136 clusters), and 100 × coefficient/control mean. *** Significantly different from 0 at 1 percent level. ** Significantly different from 0 at 5 percent level. * Significantly different from 0 at 10 percent level.
source: 2005 Survey.

VoL. 1 no. 1 99cAttAnEo Et AL.: Housing, HEALtH, And HAPPinEss
VI. Robustness Checks
In this section, we address three important concerns related to our empirical work. First, we examine the possibility that there were other public programs that could explain our results and carry on a series of falsification tests that provide further support for our identification strategy. Second, we examine whether the pathway by which Piso Firme affected child health is interruption of the transmission of para-sitic infections or economic benefit. Finally, we provide evidence that the specifica-tion of the clustering structure used in our regression models is consistent with the hypothesis of no spatial serial correlation between clusters.
A. Potential Bias from other state and Local Programs
We hypothesized that replacing dirt floors interrupted the transmission of parasitic infestations and that this led to the improvements observed in the other child health outcome indicators. However, there could have been other state specific changes that coincided with the implementation of Piso Firme in Coahuila that may have been at least partially responsible for the outcomes observed. For example, improvements could have been made in the health care system in the State of Coahuila but not in Durango.
We have already tried to rule out the influence of other state specific programs in a number of ways. First, we have shown that the sample is balanced across a large number of demographic, health, and socioeconomic characteristics prior to the program (Table 2). Second, we have shown that trends in health and socioeconomic variables prior to the introduction of Piso Firme were the same for both control and treatment groups (Figures 1 and 2). These facts are consistent with the hypoth-esis that there were no programmatic or policy differences that affected health and socioeconomic outcomes prior to the introduction of Piso Firme. Third, we showed that all of the socioeconomic characteristics of the household were balanced across treatment and control groups in 2005 (Table 3) and that there were no differences in the time trends over this period (Figure 2). This suggests that there were no differ-ences in programs of policies that affected socioeconomic outcomes over the period. Fourth, we explicitly controlled for participation in a number of social programs in the analysis including nutrition programs, cash transfer programs, and Seguro Popular (a public health insurance program for the poor). Finally, based on inter-views with national and local officials, we verified that over the period under study, there were no other state or local programs targeting health, nutrition, or parasites.
In this section, we present further evidence that rules out the possibility that the results presented in the previous section are the consequence of confounding causes. First, we consider other diseases that could presumably not have been affected by the replacement of dirt floors with cement floors such as respiratory diseases and skin lesions. Then, we explore whether there are differences among all other dis-eases between treated and control households using the same methods as were used in the impact analysis section above. This is a falsification test to investigate whether other interventions correlated with the implementation of Piso Firme could account for the above results. As can be seen from Table 7, the treatment dummy variable is not significantly associated with any of these illness measures.

100 AMEricAn EconoMic JournAL: EconoMic PoLicy fEBruAry 2009
Table 7—Robustness Checks
Dependent variableControl group
mean (std. dev.) Model 1 Model 2 Model 3
Respiratory diseases 0.355 (0.479) 0.021 0.019 0.017[0.019] [0.018] [0.019]
5.819 5.286 4.762
Skin diseases 0.101 (0.302) 0.001 0.003 0.002[0.012] [0.012] [0.012]
1.132 2.762 2.470
Other diseases 0.041 (0.198) 0.006 0.007 0.007[0.009] [0.009] [0.009]
14.194 16.554 16.074
Installation of cement floor 0.530 (0.499) 0.375 0.373 0.376[0.028]*** [0.028]*** [0.028]***
70.753 70.374 70.860
Construction of sanitation facilities 0.101 (0.302) −0.016 −0.016 −0.015[0.015] [0.015] [0.015]
−15.315 −16.094 −15.071
Restoration of sanitation facilities 0.045 (0.206) −0.001 −0.001 −0.002[0.013] [0.013] [0.012]
−2.813 −2.109 −3.811
Construction of ceiling 0.160 (0.366) 0.026 0.019 0.016[0.024] [0.024] [0.023]
16.099 11.659 10.287
Restoration of walls 0.111 (0.314) 0.012 0.012 0.014[0.017] [0.016] [0.016]
10.830 10.802 12.953
Any house expansion (excluding 0.277 (0.448) 0.043 0.035 0.037 installation of cement floors) [0.031] [0.031] [0.030] 15.524 12.787 13.272
Log of self-reported rental value 5.918 (0.740) 0.033 0.050 0.053 of house [0.040] [0.032] [0.031] 0.555 0.853 0.899
Log of self-reported sale value 10.491 (1.168) −0.044 −0.015 −0.014 of house [0.100] [0.081] [0.078] −0.418 −0.147 −0.132
Log total income of mothers of children 7.792 (0.665) −0.037 −0.034 −0.029 0–5 years [0.064] [0.065] [0.066] −0.480 −0.436 −0.374
Log total income of fathers of children 8.121 (0.592) −0.016 −0.005 0.001 0–5 years [0.028] [0.027] [0.026] −0.194 −0.064 0.016
Total consumption per capita 753.733 (1,219.488) 5.217 10.682 14.012[44.368] [43.686] [43.099]
0.692 1.417 1.859
notes: Regressions computed using survey information (sample sizes reported in Table 1). Missing values in covariates were imputed with zero, and a corresponding dummy variable was then added to the regressions. Model 1: no controls; Model 2: age, demographic, and health-habits controls; Model 3: age, demographic, health-habits, and public social programs controls. Reported results: estimated coefficient, clustered standard error at census-block level in brackets (136 clusters), and 100 × coefficient/control mean. *** Significantly different from 0 at 1 percent level. ** Significantly different from 0 at 5 percent level. * Significantly different from 0 at 10 percent level.
source: 2005 Survey.

VoL. 1 no. 1 101cAttAnEo Et AL.: Housing, HEALtH, And HAPPinEss
B. Pathways
We hypothesized that the pathway by which Piso Firme affected child health is through interrupting the transmission of parasitic infestations. However, an alterna-tive pathway could have been through the program’s effect on economic resources. Piso Firme provides a benefit amounting to approximately $150, which is equivalent to about half of one month’s income. If a beneficiary household had already decided to save and invest in cement floors, it could have used the resources freed up by this in-kind transfer to increase consumption or to make other kinds of investments, such as additional housing investments that could affect health outcomes or in microen-terprises that might increase household income.
Table 7 presents evidence that rules out this alternative economic resource chan-nel as an explanation for the effects of the program on child health. Using the same methods as were used in the program impact section, we find that the program is not associated with the value of houses. The variables reported in these columns are self-reported. Household members were asked for how much they thought they could rent and sell their houses. These results show that treatment households did not consider their houses to be more valuable than control households did. Also, differ-ent measures of household income and total consumption are not associated with the treatment dummy,24 which shows that there are no systematic differences in income or consumption levels between treatment and control households.
In addition, Table 7 shows that, except for their floors, treatment households did not improve their houses more than control households did. The variables considered are the construction and expansion of sanitation facilities, the restoration of sanita-tion facilities, the construction and expansion of rooms not containing sanitation facilities, the construction of ceilings, and the restoration of the electricity system and the walls. All estimated coefficients are small and none of them are statistically significant. We also study whether offering Piso Firme affected the likelihood of making any improvement in the treatment houses. In particular, we constructed an indicator variable that takes a value equal to one if the household reports making any improvement since 2000 (excluding the installation of cement floors), and we find no effects here either. In sum, these results suggest that the program did not have the effect of encouraging households to improve their houses further.
C. specification test for clustered standard Errors
Even though the original sampling procedure designed in our survey naturally motivated our clustering structure, this structure might be inappropriate if the error terms of the models were correlated across clusters. Using standard methods from the literature on spatial autocorrelation, we address this concern by testing the null
24 This result is consistent with Table 3, where, in addition, the value of household assets per capita and total income per capita do not significantly differ between treatment and control households. Moreover, similar results are obtained when analyzing proportion of household members who work, whether the household operates a microenterprise, and hours worked by household members per capita. These results, not presented in the paper, are available upon request.

102 AMEricAn EconoMic JournAL: EconoMic PoLicy fEBruAry 2009
hypothesis of no-spatial serial correlation for each regression estimated in this paper.
In particular, we implement this test by computing a between-cluster Moran’s I test statistic based on the distance between clusters following the procedure dis-cussed in Harry H. Kelejian and Ingmar R. Prucha (2001).25 In order to test the null hypothesis of no-spatial serial correlation while allowing for within cluster correla-tion of the residuals, we implemented the test as follows. First, we estimated the residuals for the individual level regressions. Second, we averaged these residuals at the cluster level, leading to 136 (average) residual estimates per regression. Finally, using the between-cluster estimated average residuals obtained in the second step, we carried on the Moran’s I test as discussed in Kelejian and Prucha (2001) using the Euclidean distance among clusters as weights. In all cases, we fail to reject the null hypothesis of zero spatial between-cluster autocorrelation, suggesting that our choice of clustering structure was appropriate. To conserve space, we do not report the test statistics here, but they are available upon request.
VII. Discussion
The Piso Firme housing program in Mexico grants cement floors to poor house-holds with dirt floors, at an average one-time cost of $150 per household. In this paper, we show that Piso Firme improves child health and cognitive development, mainly by reducing the incidence of intestinal parasites that are not treatable with albendazole or other common deworming drugs employed in developing countries. We also show that Piso Firme improves adult welfare as measured by mental health and satisfaction with housing.
Our results have a number of important policy implications. First, housing improvement appears to be an important component of antipoverty interventions, and our results show that major improvements in child health and cognitive develop-ment can be achieved by this particular kind of intervention.
Second, replacing dirt floors with cement floors appears to be, in this case, a cost-effective policy for improving child cognitive development. The cost of replacing dirt floors is a one-time $150 expenditure and yields an increase of about 9 percent in the Picture Peabody Language Development Test score. This compares favorably to the effect of Mexico’s Oportunidades conditional cash transfer program (formerly called PROGRESA) which yields a 12 percent increase in the Picture Peabody Language Development Test score after two years on the program at a cost of between $210 and $750. This also compares favorably to Ecuador’s cash transfer program at a cost of $210 for two years of benefits (Fernald, Gertler, and Neufeld 2008, and Christina Paxson and Norbert Schady 2007). The effect sizes of Piso Firme are also compa-rable to those from early childhood development and nutrition programs assessed in a recent review by Engle (2007).
Third, deworming drugs, such as Albendazole, are only partial substitutes for cement floors. In our sample, Albendazole was regularly administered to almost
25 See Kelejian and Prucha (2001, equations 2.4 and 4.1) for the test statistic and asymptotic distribution, respectively.

VoL. 1 no. 1 103cAttAnEo Et AL.: Housing, HEALtH, And HAPPinEss
all children, as Mexico has had a large and active deworming program with nearly universal coverage at the national level for many years. The program provides Albendazole to all children in the country several times a year through health clin-ics, door-to-door campaigns, and in schools. The chemotherapy appears to have worked, as we found almost no infestations of parasitic worms in the analysis of the fecal samples we collected. However, we found a large prevalence of parasitic pro-tozoa infestations that are not sensitive to Albendazole, and an associated large inci-dence of diarrhea and anemia. In fact, parasitic protozoa infestations accounted for 98 percent of the parasites found in the fecal samples in our survey. At the moment, there are no cost-effective pharmacological interventions to prevent or treat parasitic protozoa infestations on a mass scale, and we know of no such programs designed to reduce parasitic protozoa infestations in the world. Interviews with members of the government of Mexico and the state governments in Mexico confirmed there are no programs to treat these types of parasites. Chemotherapies for protozoa are much more expensive, and they need to be administered more frequently.
While the estimated effect for both child health and development and maternal happiness are large, one should be cautious in using these estimates to forecast what would happen in other settings. Both treatment and control groups in our study live in urban areas where a large percentage of the population already had cement floors. In addition, both groups have access to safe municipal water supplies, and their chil-dren are well nourished. Our results would probably not apply to rural areas, where the share of total floor space covered by cement floors in a given house is less likely to have an effect on how often children come into contact with parasites. Similarly, replacing dirt floors with cement floors may be less effective when households do not have access to safe water supplies, since this would remain a major pathway for para-sitic infestations, or when children are undernourished and are consequently more susceptible to infestation. In conclusion, replacing dirt floors with cement floors is likely to improve the health of children in low-income, urban households where chil-dren have been dewormed and families have access to a safe water supply.
REFERENCES
Anderson, Roy M., and Robert M. May. 1992. infectious diseases of Humans: dynamics and con-trol. Oxford, UK: Oxford University Press.
Bautista, Sergio A., and Paul J. Gertler. 2008. “Investing Cash Transfers in Housing: Evidence from Mexico’s Conditional Cash Transfer Program.” Unpublished.
Becker, Gary S. 1964. Human capital: A theoretical and Empirical Analysis with special reference to Education. Cambridge, MA: National Bureau of Economic Research.
Behrman, Jere R. 1996. “The Impact of Health and Nutrition on Education.” World Bank research observer, 11(1): 23–37.
Bransford, John D. 1979. Human cognition: Learning, understanding, and remembering. Belmont, CA: Wadsworth Publishing Co.
Cameron, A. Colin, Jonah B. Gelbach, and Douglas L. Miller. 2008. “Bootstrap-Based Improvements for Inference with Clustered Errors.” review of Economics and statistics, 90(3): 414–27.
Carneiro, Pedro, and James J. Heckman. 2004. “Human Capital Policy.” In inequality in America: What role for Human capital Policies? ed. James J. Heckman and Alan Krueger, 77–240. Bos-ton, MA: MIT Press.
Cebu Study Team. 1991. “Underlying and Proximate Determinants of Child Health: The Cebu Longi-tudinal Health and Nutrition Study.” American Journal of Epidemiology, 133(2): 185–201.

104 AMEricAn EconoMic JournAL: EconoMic PoLicy fEBruAry 2009
Centers for Disease Control and Prevention. 1998. “Recommendations to Prevent and Control Iron Deficiency in the United States.” Morbidity and Mortality Weekly report 47(RR-3); 1–36. http://www.cdc.gov/mmwr/preview/mmwrhtml/00051880.htm.
Chay, Kenneth Y., and Michael Greenstone. 2005. “Does Air Quality Matter? Evidence from the Housing Market.” Journal of Political Economy, 113(2): 376–424.
Cohen, Sheldon, Tom Kamarck, and Robin Mermelstein. 1983. “A Global Measure of Perceived Stress.” Journal of Health and social Behavior, 24(4): 385–96.
Crane, Randall, Amrita Daniere, and Stacy Harwood. 1997. “The Contribution of Environmental Amenities to Low-Income Housing: A Comparative Study of Bangkok and Jakarta.” urban stud-ies, 34(9): 1495–1512.
Cronbach, Lee J. 1951. “Coefficient Alpha and the Internal Structure of Tests.” Psychometrika, 16(3): 297–334.
Di Tella, Rafael, and Robert MacCulloch. 2006. “Some Uses of Happiness Data in Economics.” Jour-nal of Economic Perspectives, 20(1): 25–46.
Dunn, Lloyd M. 1965. Peabody Picture Vocabulary test. Circle Pines, MN: American Guidance Ser-vice, Inc.
Engle, Patrice L., Maureen M. Black, Jere R. Behrman, Meena Cabral de Mello, Paul J. Gertler, Lydia Kapiriri, Reynaldo Martorell, and Mary Eming Young. 2007. “Strategies to Avoid the Loss of Developmental Potential among 200 Million Children in the Developing World.” Lancet, 369(9557): 229–42.
Esrey, S. A., J. B. Potash, L. Roberts, and C. Shiff. 1991. “Effects of Improved Water Supply and San-itation on Ascariasis, Diarrhoea, Dracunculiasis, Hookworm Infection, Schistosomiasis and Tra-choma.” Bulletin of the World Health organization, 69(5): 609–21.
Fernald, Lia C. H., Paul J. Gertler, and Lynnette M. Neufeld. 2008. “Role of Cash in Conditional Cash Transfer Programmes for Child Health, Growth, and Development: An Analysis of Mexico’s Oportunidades” Lancet, 371(9615): 828–37.
Galiani, Sebastian, Paul J. Gertler, and Ernesto Schargrodsky. 2005. “Water for Life: The Impact of the Privatization of Water Services on Child Mortality.” Journal of Political Economy, 113(1): 83–120.
Gamboa, M. I., J. A. Basualdo, L. Kozubsky, E. Costas, E. Cueto Rua, and H. B. Lahitte. 1998. “Prevalence of Intestinal Parasitosis within Three Population Groups in La Plata, Argentina.” European Journal of Epidemiology, 14(1): 55–61.
Gertler, Paul J. 2004. “Do Conditional Cash Transfers Improve Child Health? Evidence from PRO-GRESA’s Control Randomized Experiment.” American Economic review, 94(2): 336–41.
Heckman, James J., and Dimitriy V. Masterov. 2007. “The Productivity Argument for Investing in Young Children.” review of Agricultural Economics, 29(3): 446–93.
Hesham, M. S., A. B. Edariah, and M. Norhayati. 2004. “Intestinal Parasitic Infections and Micronu-trient Deficiency: A Review.” Medical Journal of Malaysia, 59(2): 284–93.
Jacobsen, Kathryn H., Priscila S. Ribeiro, Bradley K. Quist, and Bruce V. Rydbeck. 2007. “Preva-lence of Intestinal Parasites in Young Quichua Children in the Highlands of Rural Ecuador.” Jour-nal of Health, Population and nutrition, 25(4): 399–405.
Jiménez, Emmanuel. 1983. “The Magnitude and Determinants of Home Improvement in Self-Help Housing: Manila’s Tondo Project.” Land Economics, 59(1): 70–83.
Kahneman, Daniel, and Alan B. Krueger. 2006. “Developments in the Measurement of Subjective Well-Being.” Journal of Economic Perspectives, 20(1): 3–24.
Katz, Lawrence F., Jeffrey R. Kling, and Jeffrey B. Liebman. 2001. “Moving to Opportunity in Bos-ton: Early Results of a Randomized Mobility Experiment.” Quarterly Journal of Economics, 116(2): 607–54.
Kaufmann, Daniel, and John M. Quigley. 1987. “The Consumption Benefits of Investment in Infra-structure: The Evaluation of Sites-and-Services Programs in Underdeveloped Countries.” Journal of development Economics, 25(2): 263–84.
Kelejian, Harry H., and Ingmar R. Prucha. 2001. “On the Asymptotic Distribution of the Moran I Test Statistic with Applications.” Journal of Econometrics, 104(2): 219–57.
Lopez, Adriana S., Jean M. Bendik, Jean Y. Alliance, Jacquelin M. Roberts, Alexandre J. da Silva, Iaci N. S. Moura, Michael J. Arrowood, Mark L. Eberhard, and Barbara L. Herwaldt. 2003. “Epidemiology of Cyclospora cayetanensis and Other Intestinal Parasites in a Community in Haiti.” Journal of clinical Microbiology, 41(5): 2047–54.
Melvin, D. M., and M. M. Brooke. 1982. Laboratory Procedures for the diagnosis of intestinal Para-sites. 3rd ed. United States Department of Health and Human Services. (CDC) 82–8282. Atlanta, GA: Centers for Disease Control and Prevention.

VoL. 1 no. 1 105cAttAnEo Et AL.: Housing, HEALtH, And HAPPinEss
Miguel, Edward, and Michael Kremer. 2004. “Worms: Identifying Impacts on Education and Health in the Presence of Treatment Externalities.” Econometrica, 72(1): 159–217.
Morales-Espinoza, Emma Marianela, Héctor Javier Sánchez-Pérez, María del Mar García-Gil, Gua-dalupe Vargas-Morales, José Domingo Méndez-Sánchez, and Margarita Pérez-Ramírez. 2003. “Intestinal Parasites in Children, in Highly Deprived Areas in the Border Region of Chiapas, Mex-ico.” salud Pública de México, 45(5): 379–88.
Muñoz, F., C. Quilodrán, P. Velásquez, C. Niedmann, A. Baeza, G. Silva, and M. Osorio. 1989. “Acquirement of the Spanish Vocabulary among Rural and Urban Students of the 9th Region.” revista chilena de Pediatria, 60(6): 354–58.
Nokes, C., S. Grantham-McGregor, A. W. Sawyer, E. S. Cooper, and D. A. P. Bundy. 1992. “Parasitic Helminth Infection and Cognitive Function in School Children.” Proceedings of the royal society B: Biological sciences, 247(1319): 77–81.
Olsen, Edgar O. 2003. “Housing Programs for Low-Income Households.” In Means-tested transfer Programs in the united states. National Bureau of Economic Research Conference Report, ed. Robert A. Moffitt, 365–441. Chicago, IL: The University of Chicago Press.
Paxson, Christina, and Norbert Schady. 2007. “Cognitive Development among Young Children in Ecuador: The Roles of Wealth, Health and Parenting.” Journal of Human resources, 42(1): 49–84.
Pollit, Ernesto. 1990. Malnutrition and infection in the classroom. Paris, France: United Nations Educational, Scientific and Cultural Organization.
Radloff, Linore S. 1977. “The CES-D Scale: A Self-Report Depression Scale for Research in the Gen-eral Population.” Applied Psychological Measurement, 1(3): 385–401.
Rivera, Juan A., Daniela Sotres-Alvarez, Jean-Pierre Habicht, Teresa Shamah, and Salvador Villal-pando. 2004. “Impact of the Mexican Program for Education, Health, and Nutrition (Progresa) on Rates of Growth and Anemia in Infants and Young Children: a Randomized Effectiveness Study.” Journal of the American Medical Association, 291(21): 2563–70.
Secretaría de Desarrollo Social de Coahuila. 2004. Program operations Manual “inv. 2004 sEdEsoL.” Mexico: SEDESOL.
Secretaría de Desarrollo Social de Coahuila. 2005. Piso firme—un Beneficio Muy concreto. Mex-ico: SEDESOL.
Shonkoff, Jack P., and Deborah A. Phillips, eds. 2000. from neurons to neighborhoods: the science of Early childhood development. Washington, DC: National Academies Press.
Shore, Rima. 1997. rethinking the Brain: new insights into Early development. New York, NY: Families and Work Institute.
Sternberg, Robert J. 1985. Beyond iQ: A triarchic theory of Human intelligence. Cambridge, UK: Cambridge University Press.
Takeuchi, Akie, Maureen Cropper, and Antonio Bento. 2006. “The Welfare Effects of Slum Improve-ment Programs: The Case of Mumbai.” World Bank Policy Research Working Paper 3852.
Tan, Kevin S. W., Mulkit Singh, and Eu Hian Yap. 2002. “Recent Advances in Blastocystis hominis Research: Hot Spots in Terra Incognita.” international Journal of Parasitology, 32(7): 789–804.
Thomson, Hilary, Mark Petticrew, and David Morrison. 2001. “Health Effects of Housing Improve-ment: Systematic Review of Intervention Studies.” British Medical Journal, 323(7306): 187–90.
Umbel, Vivian M., Barbara Z. Pearson, María C. Fernández, and D. K. Oller. 1992. “Measuring Bilingual Children’s Receptive Vocabularies.” child development, 63(4): 1012–20.
World Bank. 2002. World development indicators 2002. Washington, DC: The World Bank. World Bank. 2005. World development indicators 2005. Washington, DC: The World Bank.