Embed Size (px)
Citation preview

Census 2000 counted35.7 million renter-occupied housing units,or about one-third of thenation’s 105.5 millionoccupied housing units.Renter-occupied unitsconsisted of those rent-ed for cash paymentsplus those occupied bysomeone other than theowner without paymentof cash rent; the latterusually were rent-freehouses or apartmentsprovided by friends orrelatives, or for compen-sation for services toresident managers, min-isters, and tenant farm-ers. Almost all rentalunits (95 percent) wererented for cash rent.
This report, part of aseries that presentspopulation and housingdata collected fromCensus 2000, examinesgross rent and grossrent as a percentage ofhousehold income in1999 for specifiedrenter-occupied housingunits. It shows howthese measures varygeographically (byregions, states, andlarge cities), by age ofthe householder, by raceand Hispanic origin of
U S C E N S U S B U R E A UHelping You Make Informed Decisions
U.S.Department of CommerceEconomics and Statistics Administration
U.S. CENSUS BUREAU
Issued May 2003
C2KBR-21
Housing Costs of Renters: 2000Census 2000 Brief
By Robert Bonnette
What are the annual costs of utilities and fuels forthis house, apartment, or mobile home? If you havelived here less than 1 year, estimate the annual cost.
a. Electricity
Annual cost — Dollars
$ , .00OR
Included in rent or in condominium feeNo charge or electricity not used
b. Gas
Annual cost — Dollars
Included in rent or in condominium feeNo charge or gas not used
c. Water and sewer
Annual cost — Dollars
Included in rent or in condominium feeNo charge
d. Oil, coal, kerosene, wood, etc.
Annual cost — Dollars
Included in rent or in condominium feeNo charge or these fuels not used
, .00
, .00
, .00
OR
OR
OR
$
$
$
Figure 1.
Reproduction of the Question on Housing Utilities and Fuels From Census 2000
Source: U.S. Census Bureau, Census 2000 questionnaire.
45
2 U.S. Census Bureau
the householder, and by somehousing characteristics. This briefalso examines “meals included inrent,” which is intended to gaugethe extent of congregate housing.Congregate housing is generallyconsidered to be housing unitswhere the rent includes meals andother services, such as transporta-tion to shopping and recreation.
Gross rent is the monthly amountof rent plus the estimated averagemonthly cost of utilities (electricity,gas, water, and sewer) and fuels(oil, coal, kerosene, wood, etc.).Figures 1 and 2 reproduce theCensus 2000 questions about thecomponents of gross rent.Medians in this report are comput-ed for specified renter-occupiedunits paying cash rent, whichexclude one-family houses on tenor more acres.
The Census Bureau initially collect-ed gross rent data for renter-occu-pied housing units in 1940, the firstCensus of Housing. Beginning in1950, the Census Bureau tabulatedgross rent as a percentage ofincome to create a measure ofaffordability. From 1950 to 1970,income was defined as that of fami-lies and primary individuals; since1980, the Census Bureau has usedhousehold income. The question ofwhether meals were included inrent was first asked in 1990.
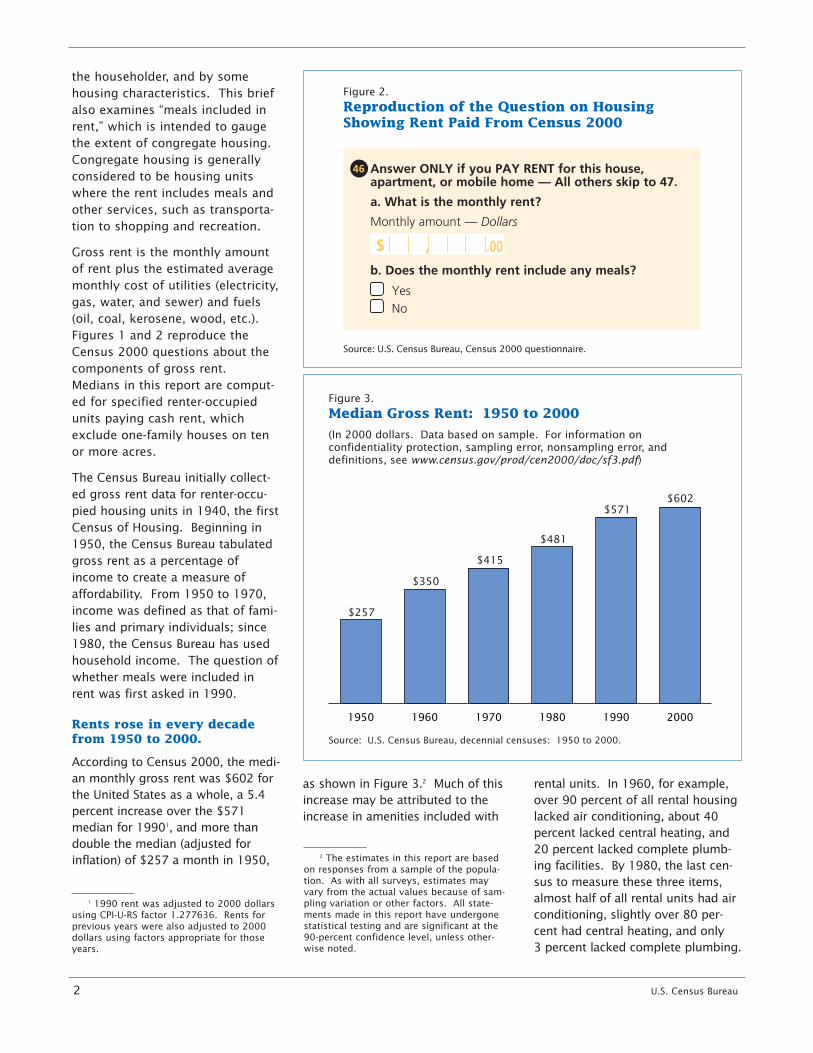
Rents rose in every decadefrom 1950 to 2000.
According to Census 2000, the medi-an monthly gross rent was $602 forthe United States as a whole, a 5.4percent increase over the $571median for 19901, and more thandouble the median (adjusted forinflation) of $257 a month in 1950,
as shown in Figure 3.2 Much of thisincrease may be attributed to theincrease in amenities included with
rental units. In 1960, for example,over 90 percent of all rental housinglacked air conditioning, about 40percent lacked central heating, and20 percent lacked complete plumb-ing facilities. By 1980, the last cen-sus to measure these three items,almost half of all rental units had airconditioning, slightly over 80 per-cent had central heating, and only 3 percent lacked complete plumbing.
Figure 2.
Reproduction of the Question on Housing Showing Rent Paid From Census 2000
Source: U.S. Census Bureau, Census 2000 questionnaire.
Yes
Answer ONLY if you PAY RENT for this house,apartment, or mobile home — All others skip to 47.
No
,Monthly amount — Dollars
a. What is the monthly rent?
$ .00b. Does the monthly rent include any meals?
46
1 1990 rent was adjusted to 2000 dollarsusing CPI-U-RS factor 1.277636. Rents forprevious years were also adjusted to 2000dollars using factors appropriate for thoseyears.
Figure 3.
Median Gross Rent: 1950 to 2000
Source: U.S. Census Bureau, decennial censuses: 1950 to 2000.
(In 2000 dollars. Data based on sample. For information on confidentiality protection, sampling error, nonsampling error, and definitions, see www.census.gov/prod/cen2000/doc/sf3.pdf)
200019901980197019601950
$602
$257
$350
$415
$481
$571
2 The estimates in this report are basedon responses from a sample of the popula-tion. As with all surveys, estimates mayvary from the actual values because of sam-pling variation or other factors. All state-ments made in this report have undergonestatistical testing and are significant at the90-percent confidence level, unless other-wise noted.

Rents varied by race andHispanic origin.
Census 2000 allowed respondentsto choose more than one race.With the exception of the Two ormore races group, all race groups
discussed in this report refer topeople who indicated only oneracial identity among the six majorcategories: White, Black or AfricanAmerican, American Indian andAlaska Native, Asian, Native
Hawaiian and Other PacificIslander, and Some other race.3 Theuse of the single-race population inthis report does not imply that it isthe preferred method of presentingor analyzing data. The CensusBureau uses a variety of approach-es.4
Median gross rent was highest forhouseholders who classified them-selves as Asian ($734), second-highest for Pacific Islander renters($690), and third-highest for thoseof Two or more races ($637).5
Rents were high for the Asian andNative Hawaiian and PacificIslander households because thesetwo groups were concentrated inHawaii and California, which regis-tered median monthly rents farabove the U.S. median. In fact, 5of the 7 racial groups shown inTable 1 reported rents at or abovethe U.S. median of $602; onlyAmerican Indian and Alaska Nativeand Black households reportedrents below the national median.
U.S. Census Bureau 3
Table 1.Median Gross Rent by Race and Hispanic Origin ofHouseholder: 2000(Data based on sample. For information on confidentiality protection, nonsampling error,and definitions, see www.census.gov/prod/cen2000/doc/sf3.pdf)
Race and Hispanic origin of householderSpecified renter-
occupied unitspaying cash rent
Mediangross rent
Total, all households . . . . . . . . . . . . . . . . . . . . . . . . . . 33,386,326 $602
White alone. . . . . . . . . . . . . . . . . . . . . . . . . . . . . . . . . . . . . . . . 22,239,892 $612Black or African American alone. . . . . . . . . . . . . . . . . . . . . . 6,156,870 $541American Indian and Alaska Native alone . . . . . . . . . . . . . 309,034 $518Asian alone. . . . . . . . . . . . . . . . . . . . . . . . . . . . . . . . . . . . . . . . 1,415,812 $734Native Hawaiian and Other Pacific Islander alone . . . . . . 50,694 $690Some other race alone. . . . . . . . . . . . . . . . . . . . . . . . . . . . . . 2,206,431 $602Two or more races . . . . . . . . . . . . . . . . . . . . . . . . . . . . . . . . . 1,007,593 $637
Hispanic or Latino (of any race) . . . . . . . . . . . . . . . . . . . . . . 4,810,020 $604
White alone, not Hispanic or Latino. . . . . . . . . . . . . . . . . . . 20,068,338 $613
Source: U.S. Census Bureau, Census 2000 Summary File 3.
3 For further information on each of the six major race groups and the Two or moreraces population, see reports from the Census2000 Brief series (C2KBR/01), available on theCensus 2000 Web site at www.census.gov/population/www/cen2000/briefs.html.
4 This report draws heavily on SummaryFile 3, a Census 2000 product that can beaccessed through American FactFinder, avail-able from the Census Bureau’s Web site,www.census.gov. Information on people whoreported more than one race, such as “Whiteand American Indian and Alaska Native” or“Asian and Black or African American,” isforthcoming in Summary File 4, which willalso be available through American FactFinderin 2003. About 2.6 percent of people report-ed more than one race.
5 Hereafter this report uses the term Blackto refer to people who are Black or AfricanAmerican, the term Pacific Islander to refer topeople who are Native Hawaiian and OtherPacific Islander, and the term Hispanic to referto people who are Hispanic or Latino.
Because Hispanics may be of any race,data in this report for Hispanics overlap withdata for racial groups. Based on Census 2000sample data, the proportion Hispanic was 8.0 percent for Whites, 1.9 percent for Blacks,14.6 percent for American Indians and AlaskaNatives, 1.0 percent for Asians, 9.5 percentfor Pacific Islanders, 97.1 percent for thosereporting Some other race, and 31.1 percentfor those reporting Two or more races.
Figure 4.
Median Gross Rent by Age of Householder: 2000
Source: U.S. Census Bureau, Census 2000 Summary File 3.
(Data based on sample. For information on confidentiality protection, sampling error, nonsampling error, and definitions, see www.census.gov/prod/cen2000/doc/sf3.pdf)
75 andover
65 to 7455 to 6445 to 5435 to 4425 to 34Under 25
$491
$567
$641 $637$613
$560
$479

Median gross rent paid byHispanics (who can be of any race)was slightly above the nationalaverage. Rents paid by non-Hispanic Whites were also abovethe national median.
Householders aged 25 to 34paid the highest rents.
Monthly rents were relatively low($567) for householders 15 to 24,peaked among householders 25 to34 ($641), and then declinedsteadily to $479 for householders65 to 74. For older householders,aged 75 and over, rents rose slight-ly to $491 (see Figure 4).
The number of bedrooms wasa major factor in determiningrent.
Median gross rent was $522 forunits with no bedroom (generallyefficiencies) and then rose to $542for one-bedroom units, $620 fortwo bedrooms, $698 for three bed-rooms, and $786 for units with fouror more bedrooms, which werealmost always one-family homes.
Gross rent as a percentage ofhousehold income in 1999 is ameasure of the affordabilityof rental housing.
Nationally, renter households spenta little over one-quarter of their pre-tax income on rent (median 25.5 percent). This value was downalmost a full percentage point fromthe median of 26.4 percent in 1990.
When gross rent equals or exceeds30 percent of household income,renters are often considered to befinancially burdened. In all states,fewer than half of rental householdspaid this percentage; but certainsubgroups of renter households hadmedians at or above the 30-percentlevel. These included renters wherethe householder was under 25 (forwhom the median was 30.8 per-cent) and the oldest renters, those
4 U.S. Census Bureau
Table 2.Median Gross Rent and Median Gross Rent as Percentageof Household Income for the United States, Regions, andStates, and for Puerto Rico: 1990 and 2000(Data based on sample. For information on confidentiality protection, sampling error,nonsampling error, and definitions, see www.census.gov/prod/cen2000/doc/sf3.pdf)
Area
1990 2000
Mediangross rent
Mediangross rent as
percentageof household
income in 1989Median
gross rent
Mediangross rent as
percentageof household
income in 1999
United States . . . . . . . . . . . $571 26.4 $602 25.5
Region
Northeast . . . . . . . . . . . . . . . . . . . $638 26.4 $651 25.9Midwest . . . . . . . . . . . . . . . . . . . $506 25.4 $533 24.0South . . . . . . . . . . . . . . . . . . . . . $517 25.7 $559 25.0West . . . . . . . . . . . . . . . . . . . . . . $684 27.9 $694 27.1
State
Alabama . . . . . . . . . . . . . . . . . . . $415 24.8 $447 24.8Alaska . . . . . . . . . . . . . . . . . . . . . $714 23.8 $720 24.8Arizona . . . . . . . . . . . . . . . . . . . . $560 27.5 $619 26.6Arkansas . . . . . . . . . . . . . . . . . . . $418 26.5 $453 24.4California . . . . . . . . . . . . . . . . . . . $792 29.1 $747 27.7Colorado . . . . . . . . . . . . . . . . . . . $533 26.1 $671 26.4Connecticut . . . . . . . . . . . . . . . . . $764 26.6 $681 25.4Delaware . . . . . . . . . . . . . . . . . . . $634 24.7 $639 24.3District of Columbia . . . . . . . . . . . $612 25.4 $618 24.8Florida . . . . . . . . . . . . . . . . . . . . . $613 28.0 $641 27.5
Georgia . . . . . . . . . . . . . . . . . . . . $553 25.8 $613 24.9Hawaii . . . . . . . . . . . . . . . . . . . . . $830 27.4 $779 27.2Idaho . . . . . . . . . . . . . . . . . . . . . . $422 23.8 $515 25.3Illinois . . . . . . . . . . . . . . . . . . . . . $569 25.9 $605 24.4Indiana. . . . . . . . . . . . . . . . . . . . . $477 24.3 $521 23.9Iowa. . . . . . . . . . . . . . . . . . . . . . . $429 24.1 $470 23.2Kansas . . . . . . . . . . . . . . . . . . . . $474 24.5 $498 23.4Kentucky . . . . . . . . . . . . . . . . . . . $408 24.9 $445 24.0Louisiana . . . . . . . . . . . . . . . . . . . $450 27.9 $466 25.8Maine. . . . . . . . . . . . . . . . . . . . . . $535 26.8 $497 25.3
Maryland . . . . . . . . . . . . . . . . . . . $700 25.4 $689 24.7Massachusetts. . . . . . . . . . . . . . . $741 26.8 $684 25.5Michigan . . . . . . . . . . . . . . . . . . . $540 27.2 $546 24.4Minnesota . . . . . . . . . . . . . . . . . . $539 26.7 $566 24.7Mississippi . . . . . . . . . . . . . . . . . . $394 27.1 $439 25.0Missouri . . . . . . . . . . . . . . . . . . . . $470 25.2 $484 24.0Montana . . . . . . . . . . . . . . . . . . . $396 25.0 $447 25.3Nebraska . . . . . . . . . . . . . . . . . . . $445 23.7 $491 23.0Nevada . . . . . . . . . . . . . . . . . . . . $650 26.8 $699 26.5New Hampshire . . . . . . . . . . . . . . $701 26.4 $646 24.2
New Jersey . . . . . . . . . . . . . . . . . $756 26.3 $751 25.5New Mexico. . . . . . . . . . . . . . . . . $473 26.5 $503 26.6New York . . . . . . . . . . . . . . . . . . . $620 26.3 $672 26.8North Carolina . . . . . . . . . . . . . . . $488 24.4 $548 24.3North Dakota . . . . . . . . . . . . . . . . $400 23.9 $412 22.3Ohio. . . . . . . . . . . . . . . . . . . . . . . $483 25.3 $515 24.2Oklahoma . . . . . . . . . . . . . . . . . . $434 25.4 $456 24.3Oregon . . . . . . . . . . . . . . . . . . . . $521 25.5 $620 26.9Pennsylvania . . . . . . . . . . . . . . . . $516 26.1 $531 25.0Rhode Island . . . . . . . . . . . . . . . . $625 27.5 $553 25.7
South Carolina. . . . . . . . . . . . . . . $482 24.4 $510 24.4South Dakota. . . . . . . . . . . . . . . . $391 24.6 $426 22.9Tennessee . . . . . . . . . . . . . . . . . . $456 25.0 $505 24.8Texas. . . . . . . . . . . . . . . . . . . . . . $505 24.6 $574 24.4Utah. . . . . . . . . . . . . . . . . . . . . . . $471 23.8 $597 24.9Vermont . . . . . . . . . . . . . . . . . . . . $570 27.1 $553 26.2Virginia . . . . . . . . . . . . . . . . . . . . $632 25.8 $650 24.5Washington . . . . . . . . . . . . . . . . . $569 25.7 $663 26.5West Virginia . . . . . . . . . . . . . . . . $387 26.8 $401 25.8Wisconsin . . . . . . . . . . . . . . . . . . $510 24.9 $540 23.4Wyoming . . . . . . . . . . . . . . . . . . . $425 23.7 $437 22.5
Puerto Rico . . . . . . . . . . . . . . . . . $261 29.4 $297 27.0
Note: Adjusted to 2000 dollars, using CPI-U-RS factor 1.277636.
Source: U.S. Census Bureau, 1990 census and Census 2000 Summary File 3.

U.S. Census Bureau 5
75 or over (33.7 percent). Twoother financially burdened groups,with over half paying 30 percent ormore of their household income onrent, were female householders liv-ing alone, and female householders,with no husband present, who livedwith their own children under 18.
GEOGRAPHIC DISTRIBUTIONOF RENTAL COSTS
Median gross rents wereabove the national level in theWest and the Northeast, whilebelow it in the South and theMidwest.6
Median monthly gross rent washighest in the West at $694, farabove the national median of $602(see Table 2). The Northeast regis-tered the second highest mediangross rent at $651, while the South($559) and the Midwest ($533)were below the national median.
Rents rose fastest in theSouth and the Midwest from1990 to 2000.
In this report, 1990 median grossrents have been adjusted to con-stant 2000 dollars. Interestingly,the two regions with the lowestmedian gross rents in 2000 hadhigher increases than the othertwo regions from 1990 to 2000.Median rent increases were highestin the South (8.1 percent) and theMidwest (5.3 percent), and lowestin the Northeast (2.0 percent) andthe West (1.5 percent).
Hawaii continued to have thehighest median gross rentamong all states.
Median gross rent in Hawaii, at$779, surpassed that in all otherstates, just as it did in 1990. NewJersey ($751) edged out California($747) for second place; Californiahad been second-highest in 1990.In 2000, half of the ten states withthe highest rents were located inthe West: Alaska, Colorado, andNevada joined California andHawaii in this group. In theNortheast, Connecticut,Massachusetts, New York, and New Jersey, were among the tenhighest-rent states nationally.Maryland was the only southernstate among the national top ten.
Median monthly rents were lowestin West Virginia ($401). NorthDakota and South Dakota featuredthe next lowest rents ($412 and$426 respectively). Six of the tenstates with the lowest rents werein the South: West Virginia,Alabama, Arkansas, Kentucky,Mississippi, and Oklahoma. Theother two states with the lowestmonthly rents were in the West:Montana and Wyoming ($447 and$437, respectively).
From 1990 to 2000, rents rosethe most in three RockyMountain states anddecreased the most in twoNew England states.
In three states — Colorado, Idaho,and Utah — median gross rentincreased over 20 percent between1990 and 2000. In another fourstates — Arizona, Montana,Oregon, and Washington — rentsincreased 10 percent or more. Bigincreases in rents in these sevenwestern states were offset to somedegree by a 5.7-percent decline inmedian rents in California’s hugerental inventory, so that the Westas a whole registered only a smallincrease (1.5 percent) in median
rents between 1990 and 2000.Georgia, Mississippi, NorthCarolina, Tennessee, and Texasalso recorded double-digit rentincreases from 1990 to 2000.7
Ten states posted rent decreases.Seven of the nine states in theNortheast, including every one inNew England, registered rentdecreases, with Connecticut andRhode Island the only states in theUnited States posting double-digitrent decreases. However, thesheer size of the rental inventoriesin New York and Pennsylvania, thetwo states where rents increased inthe Northeast, prevented theregion as a whole from decreasing.California, Hawaii, and Marylandwere the three states outside theNortheast posting rent decreasesfrom 1990 to 2000.8
The proportion of householdincome spent on rentdecreased in almost everystate between 1990 and 2000.
The few states registering increas-es were generally in the West —for example, Alaska, Idaho,Oregon, and Utah. States withlarge decreases in median grossrent as a percentage of householdincome were more widely scat-tered, such as Michigan in theMidwest; Arkansas, Louisiana, andMississippi in the South; and NewHampshire in the Northeast.
Renters in California devoted thelargest share of their income torent (median 27.7 percent).Renters in Iowa, Kansas, Nebraska,
6 The Northeast region includes the statesof Connecticut, Maine, Massachusetts, NewHampshire, New Jersey, New York,Pennsylvania, Rhode Island, and Vermont.The Midwest region includes the states ofIllinois, Indiana, Iowa, Kansas, Michigan,Minnesota, Missouri, Nebraska, North Dakota,Ohio, South Dakota, and Wisconsin. TheSouth region includes the states of Alabama,Arkansas, Delaware, Florida, Georgia,Kentucky, Louisiana, Maryland, Mississippi,North Carolina, Oklahoma, South Carolina,Tennessee, Texas, Virginia, West Virginia, andthe District of Columbia, a state equivalent.The West region includes the states of Alaska,Arizona, California, Colorado, Hawaii, Idaho,Montana, Nevada, New Mexico, Oregon, Utah,Washington, and Wyoming.
7 At the 90-percent confidence level, Iowashowed an increase between 8.7 and 10.3 percent, Nebraska between 9.4 and 11.2 percent, and South Dakota between 7.7 and 10.2 percent, so these three statesmay also have experienced double-digitincreases.
8 At the 90-percent confidence level,Alaska showed a 1990-2000 change of -0.5to 2.1 percent, Delaware -0.2 to 2.1 percent,and the District of Columbia -0.3 to 2.3 per-cent, so these states may also have experi-enced median rent decreases.

6 U.S. Census Bureau
$6
85
or
more
$6
02
to $
68
4
$4
85
to $
60
1
Less
than
$4
85
Med
ian
Gro
ss R
ents
: 2
00
0
Sourc
e: U
.S.
Cen
sus
Bure
au,
Cen
sus
20
00
Sum
mar
yFi
le 3
. A
mer
ican
Fac
tfin
der
at
fact
finder
.cen
sus.
gov
pro
vides
cen
sus
dat
a an
d m
appin
g t
ools
.
Med
ian
gro
ss r
ent
by s
tate
$6
02
or
more
$4
35
to $
60
1
$3
55
to $
43
4
Less
than
$3
55
U.S
. m
edia
n $
60
2
U.S
. med
ian $
602
Figure
5.
01
00
Mile
s0
10
0 M
iles
01
00
Mile
s
01
00
Mile
s
Med
ian
gro
ssre
nt
by c
ou
nty
Few
er t
han
30
0ca
sh r
ente
rs(D
ata
not
show
n)
(Dat
a bas
ed o
n s
ample
. F
or
info
rmat
ion o
n c
onfi
den
tial
ity
pro
tect
ion,
sam
plin
g e
rror, n
onsa
mplin
g e
rror, a
nd d
efin
itio
ns,
see
ww
w.c
ensu
s.gov
/pro
d/c
en2
00
0/d
oc/s
f3.p
df)

North Dakota, South Dakota,Wisconsin, and Wyoming spent thelowest share of their income onrent (23.4 percent or less).
High rents show distinctclusters.
Rental units at or above the nation-al median of $602 cluster in a fewareas, such as the Boston-Washington corridor, the Pacificcoast of California, the southern
coasts of Florida, Puget Sound,central Colorado, and around vari-ous large metropolitan areas likeChicago, Atlanta, Detroit, andDallas. In about 10 percent of allcounties the median was at orabove the U.S. median. County-level data are mapped in Figure 5.
If the rental inventory were dividedinto four equal groupings calledquartiles, the lowest group wouldhave rents below $436 (the lower
quartile), another one-quarterbetween $436 and the median($602), another quarter betweenthe median and the upper quartileof $804, and the highest quarterabove $804. However, countieswere not equally divided into thesequartiles; in fact, in about 60 per-cent of all counties, median rentswere below the lower quartile of$436. Higher rents, those at orabove the U.S. median, were con-centrated in a few counties whichgenerally had a large number ofrenters and relatively expensiverental housing. Only about 60 counties had median rentsabove the upper quartile.
Nine of the ten places of100,000 or more people withthe highest rents were inCalifornia.
The only one of these ten high rentplaces not in California wasStamford, Connecticut (see Table 3).
The ten places with the lowestmedian gross rent are shown inTable 4. Unlike the top ten, thesebottom ten were scattered acrossthe nation, in every region exceptthe West. Among places of100,000 or more people in 2000,Brownsville, Texas, and Erie,Pennsylvania, had the lowest rents($405 and $424, respectively).
ADDITIONAL FINDINGS
How did rents vary by typeand age of structure?
Median gross rent for one-family,detached houses was $648, wellabove the $602 for all specifiedrenter units. Rent was even higherfor one-family, attached units($688), which were generally town-houses and rowhouses. For unitsin apartment buildings of two tofour units, the median gross rentwas $573 and it rose to $608 forthose units in buildings with fiveor more apartments.
U.S. Census Bureau 7
Table 4.Places of 100,000 or More With the Lowest Median GrossRent: 2000(Data based on sample. For information on confidentiality protection, sampling error, non-sampling error, and definitions, see www.census.gov/prod/cen2000/doc/sf3.pdf)
PlaceSpecified renter-
occupied unitspaying cash rent
Mediangross rent
90-percentconfidence
interval
Brownsville, TX . . . . . . . . . . . . . . . . . . 13,633 $405 $400 - $410Erie, PA . . . . . . . . . . . . . . . . . . . . . . . . . 17,153 $424 $416 - $432St. Louis, MO . . . . . . . . . . . . . . . . . . . . 75,581 $442 $439 - $445Louisville, KY . . . . . . . . . . . . . . . . . . . . 51,102 $443 $438 - $448Cincinnati, OH . . . . . . . . . . . . . . . . . . . 88,512 $444 $441 - $447Birmingham, AL . . . . . . . . . . . . . . . . . . 43,681 $446 $441 - $451Dayton, OH. . . . . . . . . . . . . . . . . . . . . . 30,787 $448 $442 - $454Springfield, MO . . . . . . . . . . . . . . . . . . 28,916 $452 $446 - $458Evansville, IN . . . . . . . . . . . . . . . . . . . . 20,079 $454 $448 - $460Laredo, TX . . . . . . . . . . . . . . . . . . . . . . 15,425 $454 $446 - $462
Note: Because of sampling error, the estimates in this table may not be significantly different fromone another or from rates for geographic areas not listed in this table.
Source: U.S. Census Bureau, Census 2000 Summary File 3.
Table 3.Places of 100,000 or More With the Highest Median GrossRent: 2000(The data are for specified renter-occupied housing units. Data based on sample. For infor-mation on confidentiality protection, sampling error, nonsampling error, and definitions, seewww.census.gov/prod/cen2000/doc/sf3.pdf)
PlaceSpecified renter-
occupied unitspaying cash rent
Mediangross rent
90-percentconfidence
interval
Irvine, CA . . . . . . . . . . . . . . . . . . . . . . . 20,147 $1,272 $1,257 - $1,287Sunnyvale, CA . . . . . . . . . . . . . . . . . . . 27,158 $1,270 $1,256 - $1,284Santa Clara, CA. . . . . . . . . . . . . . . . . . 20,337 $1,238 $1,219 - $1,257Fremont, CA. . . . . . . . . . . . . . . . . . . . . 23,782 $1,196 $1,183 - $1,209Thousand Oaks, CA . . . . . . . . . . . . . . 10,007 $1,131 $1,109 - $1,153San Jose, CA. . . . . . . . . . . . . . . . . . . . 103,317 $1,123 $1,115 - $1,131Daly City, CA . . . . . . . . . . . . . . . . . . . . 11,964 $1,074 $1,062 - $1,086Simi Valley, CA . . . . . . . . . . . . . . . . . . 7,932 $1,058 $1,037 - $1,079Stamford, CT . . . . . . . . . . . . . . . . . . . . 19,283 $1,007 $986 - $1,028Huntington Beach, CA . . . . . . . . . . . . 28,514 $985 $980 - $990
Note: Because of sampling error, the estimates in this table may not be significantly different fromone another or from rates for geographic areas not listed in this table.
Source: U.S. Census Bureau, Census 2000 Summary File 3.

Median gross rent for new housingunits — those built 1995 or later— was $718. Older homes, thosebuilt before 1940, commandedmuch lower rents of $565.
Was rental housing more orless affordable in 2000 than itwas 50 years earlier?
Median gross rent as a percentageof income from 1950 to 2000 isshown in Figure 6. The percentagerose steadily until 1990, but thendeclined a bit by 2000. Thus, in2000, rental housing was lessaffordable than in 1950 but moreaffordable than in 1990. Theincome measure used in1980,1990, and 2000 was householdincome. Income of families andprimary individuals was used from1950 through 1970. The maineffect of the change was to includeincome of all members of thehousehold. For example, only theincome of the person designatedas the householder would havebeen used in the earlier censuses iftwo or more unrelated people livedin the same apartment.
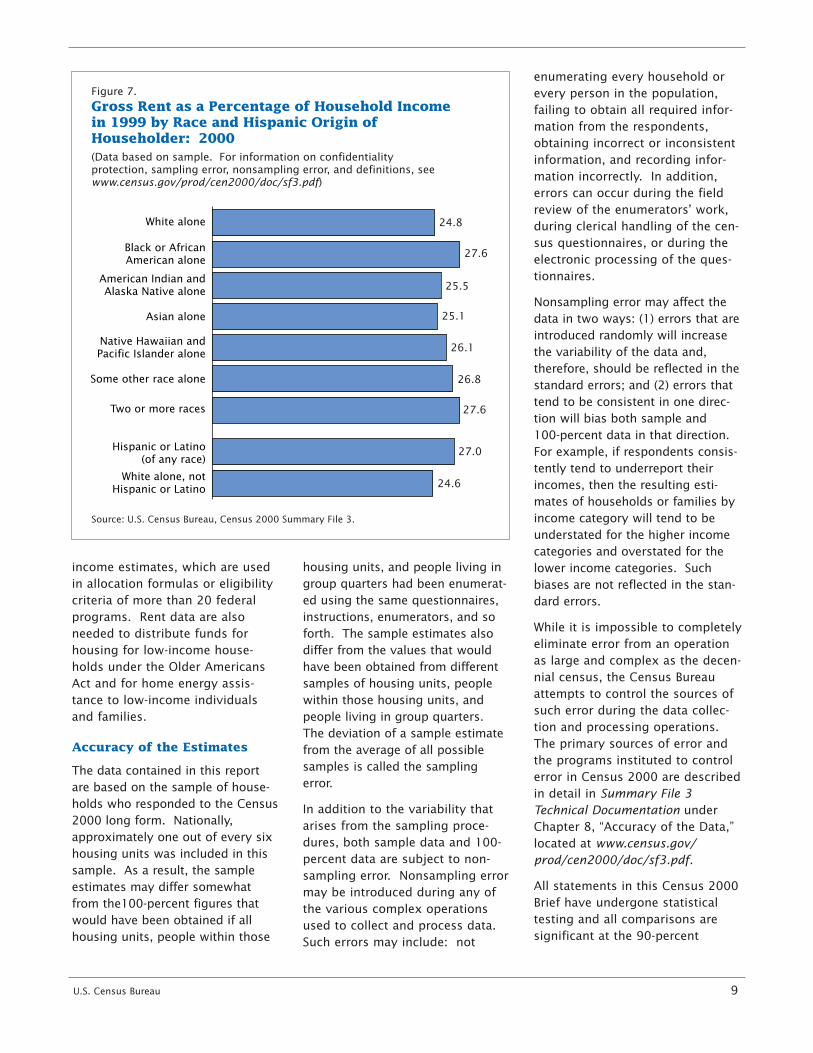
Among householders ofdifferent races and Hispanicorigin, were there significantdifferences in the proportionsof household income spent onrent and utilities?
Data on gross rent as a percentageof household income by race andHispanic origin are presented inFigure 7. Single-race Black house-holders and those with a house-holder classified as two or moreraces paid the highest proportion oftheir income (27.6 percent) for rent.Single-race White householders, irre-spective of Hispanic origin, paid thelowest ( 24.8 percent). Hispanic orLatino households spent a higherpercentage of their householdincome for rent (27.0 percent) thanall specified renter householdsnationally (25.5 percent).
Did the percentage of unitswith meals included increaseduring the 1990s?
The 1990 census introduced aquestion on whether meals wereincluded in the rent (see Figure 2).This question was intended tomeasure congregate housing, gen-erally for older households. In1990, 3.8 percent of householders65 and over reported meals includ-ed with the rent, and for house-holders 75 and over, the figurewas 6.3 percent. By 2000, thesepercentages had increased to 8 percent for all householders 65 and over and to 13 percent forthose 75 and over.
The largest number of elderlyhouseholds reporting meals includ-ed in the rent in 2000 were foundin California and Florida, but thatwas not unexpected given the sizeof the elderly population in thosetwo states. The highest percent-
age of elderly reporting mealsincluded in rent were found inOregon and Washington.
ABOUT CENSUS 2000
Why the Census Bureau collectsand tabulates rent data.
The U.S. Census Bureau collectsdata on gross rent, which is thesum of rent contracted for plusamounts paid for utilities (electrici-ty, gas, water, and sewer) and fuels(oil, coal, kerosene, wood, etc.).Federal uses include establishmentof Section 8 fair market rents bythe Department of Housing andUrban Development and allocationof funds by the Departments ofHealth and Human Services andAgriculture to help low- and mod-erate-income families whose rentsexceed 30 percent of their house-hold income. Rent data are alsoused by the Bureau of EconomicAnalysis in its state per-capita
8 U.S. Census Bureau
Figure 6.
Gross Rent as a Percentage of Income: 1950 to 2000
Note: Income of families and primary individuals for 1950-1970; and household income for 1980-2000.Source: U.S. Census Bureau, Census of Population and Housing, decennial volumes.
(Data based on sample. For information on confidentiality protection, sampling error, nonsampling error, and definitions, see www.census.gov/prod/cen2000/doc/sf3.pdf)
200019901980197019601950
25.5
17.919.7
21.0
25.026.4
income estimates, which are usedin allocation formulas or eligibilitycriteria of more than 20 federalprograms. Rent data are alsoneeded to distribute funds forhousing for low-income house-holds under the Older AmericansAct and for home energy assis-tance to low-income individualsand families.
Accuracy of the Estimates
The data contained in this reportare based on the sample of house-holds who responded to the Census2000 long form. Nationally,approximately one out of every sixhousing units was included in thissample. As a result, the sampleestimates may differ somewhatfrom the100-percent figures thatwould have been obtained if allhousing units, people within those
housing units, and people living ingroup quarters had been enumerat-ed using the same questionnaires,instructions, enumerators, and soforth. The sample estimates alsodiffer from the values that wouldhave been obtained from differentsamples of housing units, peoplewithin those housing units, andpeople living in group quarters.The deviation of a sample estimatefrom the average of all possiblesamples is called the samplingerror.
In addition to the variability thatarises from the sampling proce-dures, both sample data and 100-percent data are subject to non-sampling error. Nonsampling errormay be introduced during any ofthe various complex operationsused to collect and process data.Such errors may include: not
enumerating every household orevery person in the population,failing to obtain all required infor-mation from the respondents,obtaining incorrect or inconsistentinformation, and recording infor-mation incorrectly. In addition,errors can occur during the fieldreview of the enumerators’ work,during clerical handling of the cen-sus questionnaires, or during theelectronic processing of the ques-tionnaires.
Nonsampling error may affect thedata in two ways: (1) errors that areintroduced randomly will increasethe variability of the data and,therefore, should be reflected in thestandard errors; and (2) errors thattend to be consistent in one direc-tion will bias both sample and 100-percent data in that direction.For example, if respondents consis-tently tend to underreport theirincomes, then the resulting esti-mates of households or families byincome category will tend to beunderstated for the higher incomecategories and overstated for thelower income categories. Suchbiases are not reflected in the stan-dard errors.
While it is impossible to completelyeliminate error from an operationas large and complex as the decen-nial census, the Census Bureauattempts to control the sources ofsuch error during the data collec-tion and processing operations.The primary sources of error andthe programs instituted to controlerror in Census 2000 are describedin detail in Summary File 3Technical Documentation underChapter 8, “Accuracy of the Data,”located at www.census.gov/prod/cen2000/doc/sf3.pdf.
All statements in this Census 2000Brief have undergone statisticaltesting and all comparisons aresignificant at the 90-percent
U.S. Census Bureau 9
Figure 7.
Gross Rent as a Percentage of Household Income in 1999 by Race and Hispanic Origin of Householder: 2000
Source: U.S. Census Bureau, Census 2000 Summary File 3.
(Data based on sample. For information on confidentiality protection, sampling error, nonsampling error, and definitions, see www.census.gov/prod/cen2000/doc/sf3.pdf)
White alone, notHispanic or Latino
Hispanic or Latino(of any race)
Two or more races
Some other race alone
Native Hawaiian andPacific Islander alone
Asian alone
American Indian andAlaska Native alone
Black or AfricanAmerican alone
White alone
24.6
24.8
27.6
25.5
25.1
26.1
26.8
27.6
27.0

confidence level, unless otherwisenoted. The estimates in tables,maps, and other figures may varyfrom actual values due to samplingand nonsampling errors. As aresult, estimates in one categorymay not be significantly differentfrom estimates assigned to a dif-ferent category. Further informa-tion on the accuracy of the data islocated at www.census.gov/prod/cen2000/doc/sf3.pdf. Forfurther information on the compu-tation and use of standard errors,contact the Decennial StatisticalStudies Division at 301-763-4242.
For More Information
The Census 2000 Summary File 3data are available from theAmerican Factfinder on the Internet(factfinder.census.gov). They werereleased on a state-by-state basisduring 2002. For information onconfidentiality protection, nonsam-pling error, sampling error, anddefinitions, also seewww.census.gov/prod/cen2000/doc/sf3.pdf or contact theCustomer Services Center at 301-763-INFO (4636).
Information on population andhousing topics is presented in theCensus 2000 Brief series, locatedon the Census Bureau’s Web site atwww.census.gov/population/www/
cen2000/briefs.html. This series,which will be completed in 2003,presents information on race,Hispanic origin, age, sex, house-hold type, housing tenure, andsocial, economic, and housingcharacteristics, such as ancestry,income, and housing costs.
For additional information on hous-ing, including reports and surveydata, visit the Census Bureau’sInternet site on at www.census.gov/hhes/www/housing.html. To findinformation about the availability ofdata products, including reports,CD-ROMs, and DVDs, call theCustomer Services Center at 301-763-INFO (4636), or e-mail [email protected].
10 U.S. Census Bureau


U.S. Department of CommerceEconomics and Statistics AdministrationU.S. CENSUS BUREAU
Washington, DC 20233
OFFICIAL BUSINESS
Penalty for Private Use $300
FIRST-CLASS MAILPOSTAGE & FEES PAIDU.S. Census Bureau
Permit No. G-58