Embed Size (px)
Citation preview

1
Housing Correlates of Under-Five1 Mortality in Urban Ethiopia:
A Paper Presented at the XXVII IUSSP International Conference,
Busan , Korea, 26-31 August 2013
By: Hadgu Bariagaber (Ph.D/Associate Professor), University of Botswana ,
Faculty of social Sciences, Department of Population Studies, P/Bag UB
00705, Block 240, Office 241 : e-mail: [email protected]
Tel:(267) 355-2713, Mobile: 771-63-693
Abstract:
Little studies have been done to investigate the housing determinants of under-five mortality,
despite the fact that Ethiopia has collected abundant empirical housing data from the previous
national population and housing censuses (1984,1994 and 2007) and DHS studies (2000, 2005
and 2011 surveys).This is, therefore, to explore the extent of impacts of urban housing variables(
housing situations and facilities) on under-five mortality rates in consonance with MDG2
objectives and prepare some recommendations for awareness of the urban health planners of the
country in line with the perspectives of 2015 worldwide MDG.
The SPSS file of the 2005 Ethiopian Demographic and Health Survey covered a sample of
about 4420 households/housing units of urban Ethiopia, The number of children ever born and
living were collected based on the questionnaire “birth histories ” of the women in the age group
15-49. The number of under-five deaths is compiled by the author by subtracting the number of
children living from the everborn children and established the proportion dead by dividing deaths
by children everborn. The rationale and motivation of the Author is, therefore, to know how
housing components determine the quality of urban life through the health status of under-five
children.
The analytical techniques of the study are proposed to included simple descriptive frequency
distributions of univariate and bivariate cross tabulations as well as multivariate data analysis of
the proportional variations of childhood mortality patterns with respect to housing situations (
types of wall, roofing, floor, ceiling etc) and housing facilities ( toilet, water, bathing etc) as well
as household durables, namely communication media such as radio, telephone and TV.
Key Words: urbanization, primate city, urbanstructure/services, correlates, under-five
mortality, housing situation, housing facilities, household durables, frequency descriptive
statistics (univariate and bivariate) and proportions of multivariate data analysis.
1 Under-five: It is a summation consisting of Neonatal,(NN), Post-neonatal (PNN), Infant
and child mortality lrvel. 2 MDG: Goals 4 and 7( child mortality and environmental/urbanization) .

2
I. Introduction
1.1 Demographic Background of Ethiopia:
Ethiopia has so far undertaken three modern National Population and Housing Censuses. The
first census ever taken was in 1984, followed by 1994 and 2007, respectively. In terms
population size, the country stands second to Nigeria in the African continent. Summary of some
salient demographic features of the country are presented in Table 1.1.1
Table-1.1.1:Summary of Basic Demographic Indicators of Ethiopia:
Variables Basic demographic indicators corresponding to
Census Dates
1984 1994 2007
Population (million) 42.6 53.5 73.8
Level of urbanization (%) 11.4 13.7 16.1
Pop Growth Rate(%) 3.1 2.9 2.6
Total Fertility Rate (TFR) 6.5 6.0 5.5
Sex Ratio at Birth 104.0 103.0 103.0
Child mortality parameters
Demographic and Health Surveys (DHS)
2000 2005 2011
Infant Mortality Rate 97 77 59
Under-Five Mortality 166 123 88
Childhood Mortality 77 50 31
Life Expectancy: Male
Female
51.1
53.4
50.9
53.5
56.3
58.5
Source: (1) Compiled from 1984, 1994 and 2007 Population and Housing Census Reports
(2) Compiled from the 2000,2005 and 2011 Ethiopian Demographic and Health
Surveys (EDHS)
With the future prospective decline in mortality, particularly infant and childhood mortality
levels, patterns and trends (refer to Table 1.1.1), accompanied by probably persistent still high
fertility, the high population growth rate of Ethiopia would still remain to be worrisome to
planners of all development sectors and politicians of the country in the years to come.
For example, taking an average growth rate of 2.6 percent, the population is estimated to reach
about 86.3 million in 2013. Furthermore, if we assume a growth rate of 2.6% to persist for the
years to come, the population of the country could double itself in a matter of about every 27
years. This means that the population of Ethiopia would be about 147.6 million by the year 2031,
calling for all environmental, social and economic developmental efforts and relevant policy
actions to decrease the population growth and accelerate the socio-economic conditions in order
at least keep pace with the rapid population growth.
3
1.2 Preview of Urbanization and its problems in Sub-Saharan Africa
with Reference to Ethiopia:
Rural/urban distinction in many sub-Saharan African Countries has always been ambiguous. The
definition and delineation of urban from rural environment vary from country to country and
even from census to census of the same country.
In the majority of sub-Saharan countries, a minimum concentration of non-agricultural
population with 2000 and over inhabitants has generally been accepted as an urban locality.
Exceptions are Nigeria (with 20,000 and over), Ghana (with 5000 and over), Gabon and Tunisia
(with 1000 and over), Egypt (all administrative governorate centres regardless of population
size) and South Africa (with 500 and over non-agricultural settlements).
At International level, there are five main definitional and conceptual criteria, as follows:
Proper “urban population”, with 20,000 and over inhabitants;
“Metropolis”, with 50,000 and over ;
“City population”, with 100,000 and over ;
“Big city population”, with 500,000 and over; and
“Megalopolis”, with 10 million and over population.
The rationale of the minimum definition of 20,000 and over population is that in such
agglomeration of population, it is believed that there could be minimum agricultural activities,
more heterogeneous in ethnic composition, cultural diversity and multi-urban functional
variations such as demographic structure, social, economic, and political organizations,
lifestyles, values, perceptions and expectations, which all have been different from rural
hinterlands.
Even taking the minimum of 2000 and over, the size of urban population out of the national
population in each Sub-Saharan African country has been extremely low, ranging from as low as
10-22 percent for East and 25-33 percent for Middle Africa, with Ethiopia having had recorded
ranging from about 9 percent in 1970’s to about 16 percent as of the 2007 population and
housing census results out of the Total National Population(UN 1994, UNECA 1995, Ethiopia
1994 and 2007).
Contrary to the low level of urbanization , particularly for Ethiopia, the urban population growth
rate has been the highest in the world, ranging from 4.7 percent for Southern Africa to 5.6
percent for Eastern Sub-Region, giving about 5.3 percent for Sub-Saharan Africa, about 5
percent and 4 percent for Ethiopia urban sector and Addis Abeba city annual growth rate ,
respectively (UNECA 1995; Ethiopia 1984/1994//2007 population and housing censuses).
Besides being a low level of urbanization, the concentration of urbanization in one or two urban
area(s) in the African Continent has been worrisome. As observed by Sokona (1985) and
Sovani,N.V.(1964), the concentration of the urban population in a capital city, like Dakar in

4
Senegal, Bamako in Mali, Nairobi in Kenya etc., has been common characteristics in many other
Sub-Saharan African countries. As rightly stated by Hamden (1964), these concentration and
centralization of power and resources in a few urban settlements have been true since the
colonial and postcolonial era of the continent of Africa where the political capitals were emerged
by either being historical native significance or due to the colonial and postcolonial
administrative and economic phenomena, growing rapidly with all concomitant urbanization
problems, including housing situations and facilities.
Accordingly, UN(1976; ,1985,1986,1988) noted that adequate shelter, potable water and decent
sanitary facilities have been deplorably lacking and unhealthy overcrowding of accommodation
were apparently large cities emerged in many developing countries. For example, a study by
the UN in the late 1970’s showed that 50 percent of households in Calcutta, 33 percent in
Mexico city, 60 percent in Accra (Ghana) and about 50 percent in Monrovia (Liberia) of the
urban population were living in slum/squatter settlements and 35 percent of all urban localities
in Sub-Saharan Africa were living in overcrowded single–room houses (UN,!974, 1975).
The case of Ethiopia has not been an exception where Addis Abeba has already become a
primate city, having similar urban primacy characteristics of many developing countries. It is
the National Capital, has become the leading primate city with all the privileges of
concentration of national investments, allocation of skilled human resources and being given
the national and international political attention, but still been experiencing all urban problems,
including housing (Ethiopian urbanization issues by different Authors, 1980-2000).
1.3 Source of Data:
In order to keep abreast with timely data requirements for short and long term development
planning, the Central Statistical Agency (CSA) of Ethiopia has been conducting series of
Demographic Sample Surveys in order to fill the intercensal gaps in population composition and
population dynamics. Among the demographic sample surveys include conducting series of
demographic and health surveys (DHS) with special reference to the incidence and prevalence of
HIV/AIDS pandemic and other opportunistic diseases such as Sexually Transmitted Infections
(STI’s) ,TB’s, and other non-HIV infectious diseases (EDHS: 2000,2005 and 2011).
However, the source of data of the study is the SPSS Data File of the 2005EDHS. The output of
this survey is found to be unique from other EDHS in that it covered about 14,000 women in the
productive and reproductive age segment of 15-49, for all classifications of urban setting in the
country with corresponding data on children everborn and surviving for each woman in the age
group 15-49. From the retrospective data of children evereborn (CEB) and surviving, the author
was able to construct the corresponding number of children dead, forming proportion of dead by
dividing number of children dead by corresponding CEB’s, covering 4420 households/housing
units (housing situation/structure: types of wall, floor, roof etc), housing facilities ( water, toilet,
kitchen etc) and housing communication (durables such as radio, telephone and TV).

5
1.4 Problem Statement:
There had been persistent high mortality condition in Sub-Saharan Africa in general and
Ethiopia in particular and this trend could be conjectured to continue for some decades before
coming down to acceptable levels. The main reasons could be noted to be largely due to the
widespread poverty conditions and low level of health services in urban/rural Sub-Saharan
Africa. In particular, it had been apparent that persistently high infant mortality induces high
fertility level, for women tend to increase their fertility performance in order to compensate the
loss of high infant mortality, which is termed as “ replacement effects”.
The reciprocal relationship between high infant mortality and high fertility levels has been such
that fertility tends to be superior to the level of infant mortality and follows by relatively high
survivors which results again having a youthful population, leading to high dependency ratio
(burden) on the productive. Eventually, the increase in the reproductive segments of the
population as well as producing high growth potentials, would subsequently result in significant
detrimental effects on developmental endeavours, aggravating poverty with concomitant effect
on health service provisions.
1.5 The Setting up of the Study:
1.5.1 Rationale of the Study: Little analysis has been done on the housing determinants of infant and childhood mortality,
despite the fact that Ethiopia has collected abundant empirical housing data from the previous
national population and housing censuses (1984,1994 and 2007) and EDHS studies (2000, 2005
and 2011 surveys).
1.5.2 Objective of the Study:
The focus of this paper is unique in the sense that examination of the variations of childhood
mortality are going to be explored in the urban structure of Ethiopia with respect to housing
characteristics, namely, housing situation, facilities and household durables using the SPSS Data
files of 2005 EDHS, which covered, among other data of interest, a sample of about 4400
households/ housing units.
1.5.3 Organization of the Study:
The study is organized under three main analytical levels , namely, frequency distribution of
housing situation and housing facilities along their respective categorical variables and
examination of the impact of housing categorical variables on under-five child mortality.
1.5.4 The Study Areas: With respect to area coverage, the study considers all urban areas of Ethiopia, being designed
and classified in the 2005EDHS questionnaire by the Central Statistical Agency of Ethiopia, as
follows:
Addis Abeba, the capital city of the country, with over 4 million population;
Large cities with population size of 100,000 and above;

6
Medium cities with population size between 50,000 to 100,000.
Small Town with population size between2000 to 49,999.
Sub city which meets the administrative function or sub-division of an urban locality/
Kebele administration or Urban district/ Wereda with population size between 1000 to
1999.
1.6. Methodological Issues:
1.6.1 General Conceptual Framework:
Housing conditions are covariates of the level of living conditions which influence the status of
mortality in general and infant and childhood mortality in particular. A simplified web is hereby
presented in Figure-1, demonstrating the complex reciprocal interaction among Socio-economic,
housing, demographic variables and general mortality conditions. In-built in the general
mortality box, we conceptualize the levels and patterns of infant and childhood mortality in
relation to the housing variables.
Fig-1: Conceptual framework manifesting the antecedent and proximate
determinant of Infant and Childhood mortality
The housing conditions, therefore, can reflect the levels of the living conditions and also
indirectly influence the status of mortality in general and infant and childhood mortality in
particular.
1.6.2)Analytical Methods of the Study: The analytical methods would be done at three stages:
(i) univariate; (ii) bivariate and (iii) multivariate data analysis. Simple descriptive and
proportionality of variation among the categories of each housing characteristic (for example,
type of floor, toilet facility etc.) with respect to relative infant and childhood mortality level be
applied where the univariate and bivariate analysis would deal with the types, levels and
characteristics of urban services whereas the latter would focus on the housing determinants of
infant and childhood mortality levels and patterns. From the analysis, we would be able to
identify the most critical categorical variables of the housing situations, housing facilities and
household service durables which would likely appear influence childhood mortality.
Socio-economic
variables
Housing Variables
:Proximate Variables
Childhood
Mortality
Demographic
Variables

7
II. Housing Situation and Housing Facilities in Urban Ethiopia:
2.1 General Housing Situation and Facility of Addis Abeba:
As presented in Table-2.1.1, despite the fact that Addis Abeba has been receiving the lion’s
share of the national human and material resources, the city has been characterized by a number
unhealthy conditions,:
Table-2.1.1:Summary indicators of housing facilities and situations, Addis Abeba
Housing Facility: Percent out
of total
Housing situation: Percent out
of total
Kitchen facility:
Traditional
modern
Rooms used as kitchen
No kitchen
67.8
6.0
46.9
26.2
Wood/mud /thatched walls
Floor of earth/mud
Cooking: fire wood/ dung
using kerosene for lighting
Renting households
84.4
53-56
53.4
10.3
60.6
Water supply:
Private tap
No bathing
Using well/river/spring
27-29
85.8
19-22
Overcrowding Indicators:
3+ persons per room
Doubled up households
41.7
19.3
Toilet facility:
Flush toilet:
Dry pits
No toilets
12.0
73-77
24-30
Source: Compiled from different data sources: (i) 1990 HFF; 1994 Population and Housing
Census (ii) 1998 and 2000 EDHS
In order to upgrade and renew the existing situation of the city to acceptable standard, it calls for
huge human and material resources. On top of that, the city’s population has been growing
rapidly due to rural and other urban migration which would compound the city’s problems.
2.2 Frequency Distribution of Housing Structure of Urban Ethiopia:
The housing situations of urban Ethiopia, expressed in terms of the quality of types of wall ,
floor and roofing, are summarized in Tables 2.2.1, -2.2.2 and 2.2.3, respectively
As shown in Table-2,2,1, more than 60 percent of the walls of the houses in urban Ethiopia are
made of bamboo trees or woods with mud. With respect to types of flooring, Table 2.2,2
manifests that exhibits that about 32 percent and 24 percent are made of Vinyl (plastic tiles) and
either cements or bricks. Regarding roofing materials, more than 90 percent of the houses are
covered by corrugated iron sheets.

8
Table-2.2.1: Summary of Housing situations by Urban Classifications:
Housing Structure
Classification of urban areas
Capital,
large city
Medium
city
Small
Town Column
Total (%)
Types of
Wall
Modern 22.8 46.2 15.6 30.2
Bamboo /wood/ mud 69.8 45.3 74.6 61.5
Others 7.4 8.5 9.8 8.3
Total 100.0(1812) 100.0(1663) 100.0(948) 4423
Row total (%) 41.0 37.6 21.4 100.0
Types of
Floor
Vinyl/ cement bricks 67.9 66.2 26.3 58.4
Carpet/earth/dung 27.3 30.3 71.0 37.7
Others 4.8 3.5 2.7 3.9
Total 100.0(1812) 100.0(1663) 100.0(948) 4423
Row total (%) 41.0 37.6 21.4 100.0
Types of
Roof
Corrugated iron sheets 94.3 92.5 75.7 88.8
Thatch / leaf/reed/ 0.4 2.5 15.9 5.1
Others 5.3 4.9 8.4 6.1
Total 100.0(1812) 100.0(1660) 100.0(948) 4420
Row total (%) 41.0 37.6 21.4 100.0
2.3 Frequency Distribution of Housing Facilities:
The percentage distributions of availability of water , toilets, cooking facilities and types of
lightning are presented in Tables 2.3.1 to 2.3.5. From these Tables, we can observe that urban
Ethiopia has generally been facilitated by poor water supply, unhealthy toilet facility,
environmentally unacceptable cooking materials and very traditional household lightnings.

9
Table-2.3.1 Summary of frequency distribution of Housing Facilities
Housing facilities
Classification of urban areas
Capital,
large city
Medium
city
Small
Town
Column
Total %
Types
of
Water
Supply
Pipe in dwelling /compound 71.0 49.0 25.3 51.1
Pipe outside compound 24.0 43.6 42.8 36.9
Unprotected well / spring 5.0 7.4 31.9 12.0
Total 100.0(1812) 100.0(1663) 100.0(948) 4423
Row Total (%) 41.0 37.6 21.4 100.0
Type of
toilet
facility
Pit latrine with open pit 69.3 75.0 69.3 71.5
Flush to sewer / septic tank 19.7 8.5 6.5 12.8
Others ( bucket, bush etc) 11.0 3.5 24.2 15.7
Total 100.0(1812) 100.0(1663) 100.0(948) 4423
Row total (%) 41.0 37.6 21.4 100.0
Toilet
facilities
shared
No 34.1 42.9 53.3 43.0
Yes 60.7 53.3 43.5 57.5
Not de jure 5.1 3.8 3.2 4.5
Total 100.0 (1755) 100.0(1531) 100.0(758) 100.0(4044)
Row total (%) 43.4 37.9 18.7 100.0
Cooking
Fuel
Kerosene 69.0 29.9 4.2 40.5
Firewood/straw/Charcoal 21.2 60.7 92.1 51.3
Other (elect+ natural gas..) 9.8 9.4 3.7 8.2
Total 100.0(1812) 100.0(1663) 100.0(944) 4419
Row Total (%) 41.0 37.6 21.4 100.0
Has
electrici
ty
No 2.6 1.9 31.8 8.7
Yes 92.4 94.6 65.7 87.2
Other 5.0 3.5 2.5 4.1
Total 100.0(1812) 100.0(1663) 100.0(948) 100.0(4423)
Row Total (%) 41.0 37.6 21.4 100.0
3.4 Communication facilities-durables:
The types of household communication durables are summarized in Table 3.4.1. While about 83
percent of the total urban household own radios, the case of small urban localities has been still
low where about 68 percent of the household own radios.
10
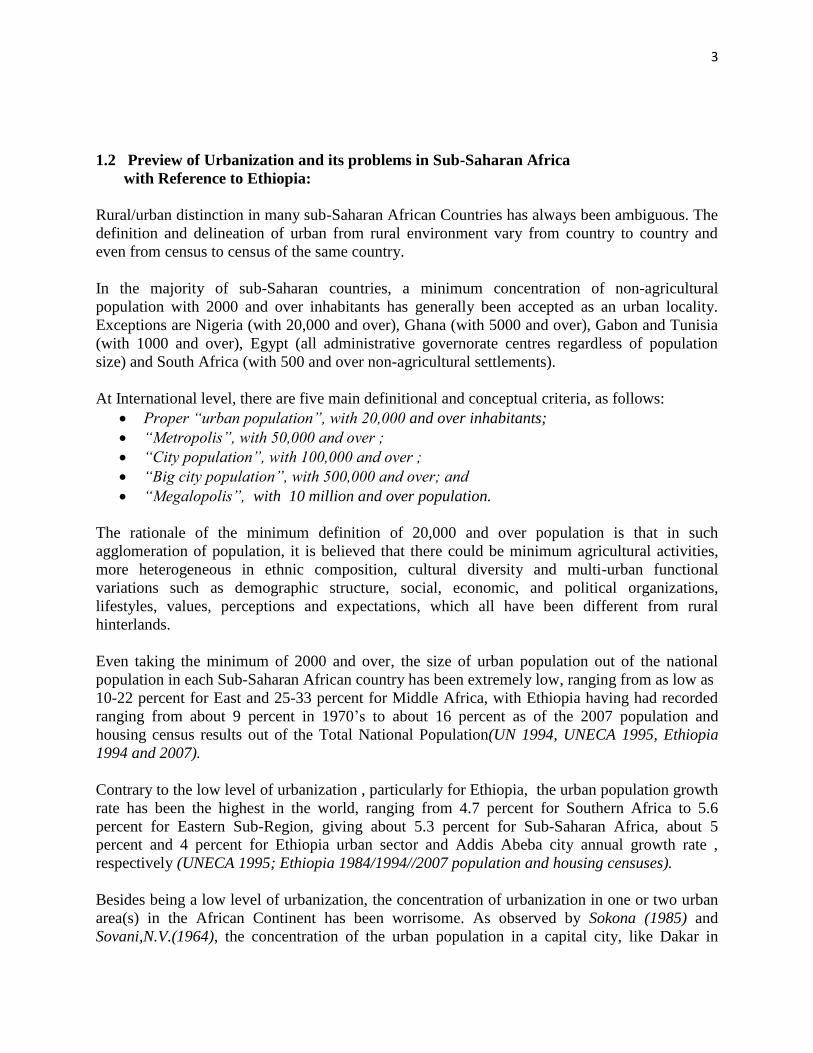
Regarding the availability of household TV, although about 51 percent of the total own TV, it is
only about 17 percent of the households in small towns appear to have access to national TV
media. The households’ access to Telephone ownership is also deplorably low where about
only 41 percent of urban Ethiopia could own individual household telephone apparatus.
Table-3.4.1: Availability of Radio, Telephone and TV in the Households ::
Household Durables
Classification of urban areas
Capital, large
city
Medium
city
Small
Town Column
Total (%)
Has Radio
No 6.5 12.1 29.7 13.6
Yes 88.5 84.4 67.7 82.5
Not de jure 5.0 3.5 2.5 3.9
Total 100.0(1812) 100.0(1663) 100.0(948) 4423
Row Total %) 41.0 37.6 21.4 100.0
Has
Television
No 28.0 43.3 80.2 44.9
Yes 67.0 53.2 17.3 51.2
Not de jure 5.0 3.5 2.5 3.9
Total 100.0(1812) 100.0(1663) 100.0(948) 4423
Row total (%) 41.0 37.6 21.4 100.0
Has
Telephone
No 38.1 58.9 83.0 55.5
Yes 57.0 37.7 14.5 40.6
Not de jure nt 5.0 3.5 2.5 3.9
Total 100.0(1812) 100.0(1660) 100.0(948) 4420
Row total (%) 41.0 37.6 21.4 100.0
III. Impact of Housing Variables on Under-Five Mortality
Mortality is one of the components of the demographic dynamics. It plays important role in the
determination of population growth and demographic transition concept3, for it is the outcome
of the interplay among various biological , environmental, economic and socio-cultural factors.
This section, therefore, deals with the influence of housing conditions on the mortality levels of
under-five children of urban Ethiopia. From the SPSS data file of 2005 EDHS, the proportions
of children dead are computed from the difference between children everborn and children
living, controlled for urban areas, housing conditions and establish proportion of dead against
the categorical variables of housing situation, facilities and household durables under sections-
3.1, 3.2 and 3.4 , respectively . The details are shown in tabular forms in the subsequent different
tables.
3 The demographic Transition Theory :

11
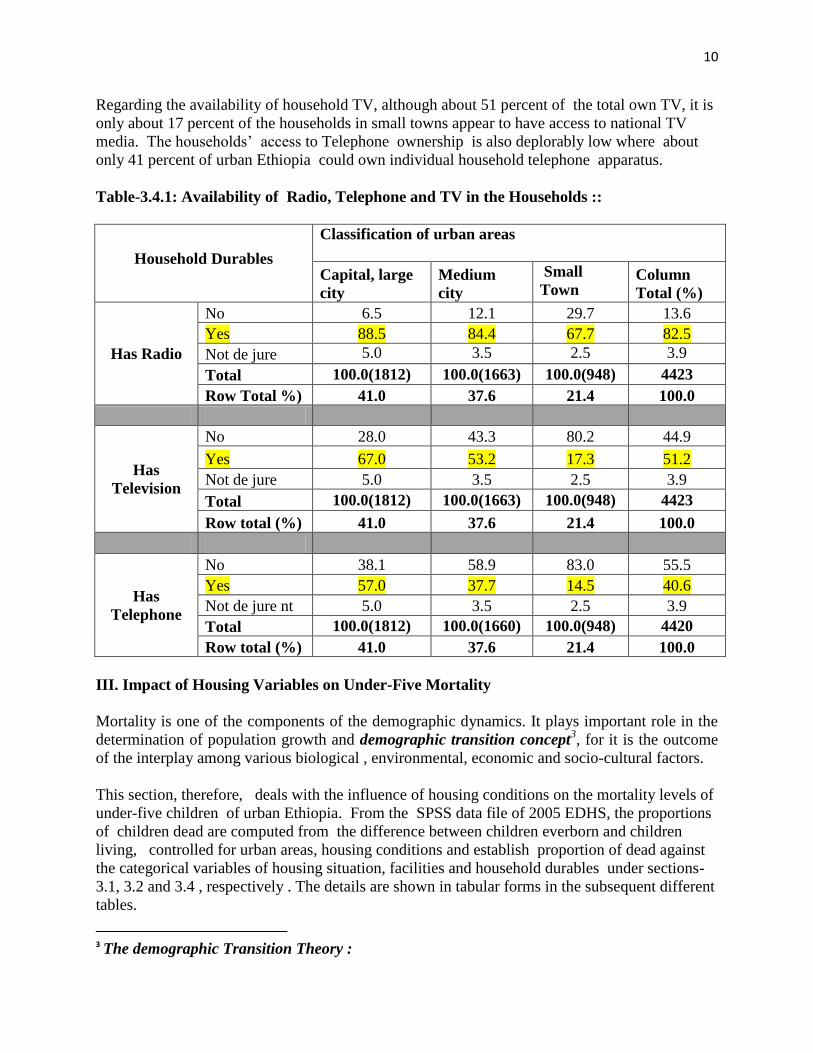
3.1 Impact of Housing Structure on Under-Five Mortality Level:
This sub-section examines the correlates of the housing situation, comprising mainly the material
of construction of walls, floor and roofing of under-five childhood mortality of urban Ethiopia.
The results are summarized in the following Tables and with their respective graphical
representations.
Table-3.1.1: construction material of floors
Types of Floor
CEB
Total Alive
Deaths
(absolute)
Proportion
dead
Earth / sand 1977 1684 293 0.1482
Animal Dung 494 409 85 0.1721
Wood planks/reed 90 85 7 0.0778
polished wood 204 193 11 0.0539
Vinyl 1998 1773 225 0.1126
Ceramic tiles 124 118 6 0.0484
Cement / bricks 1457 1324 133 0.0913
Carpet 252 225 27 0.1071
Not dejure resident 158 137 21 0.1329
Total 6754 5948 808 0.1196
0.1482
0.1721
0.0778
0.0539
0.1126
0.0484
0.0913 0.1071
0.1329
0.0000 0.0200 0.0400 0.0600 0.0800 0.1000 0.1200 0.1400 0.1600 0.1800 0.2000
Pro
po
rtio
n d
ead
Type of floor
Proportion Dead By Type Of Floor
12
Table-3.1.2 construction material of wall:
Wall Material
CEB
Alive
Dead
(absolute)
Proportion
dead
Unconventional walls 433 293 140 0.3233
Bamboo / wood with mud 4404 3853 551 0.1251
Stone with mud 630 552 78 0.1238
Cement 177 159 18 0.1017
Stone with lime / cement 435 395 40 0.0920
Cement blocks 622 568 54 0.0868
Not dejure resident 158 137 21 0.1329
Total 6859 5957 902 0.1315
0.3233
0.1251 0.1238 0.1017 0.0920 0.0868
0.1329
0.0000
0.0500
0.1000
0.1500
0.2000
0.2500
0.3000
0.3500
Pro
port
ion
dea
d
Type of wall
Proportion Dead By Type Of Wall

13
Table-3.1.3 construction material of roofing
3.2. Impact of Housing Facilities on Under-Five Mortality:
The housing facilities under this sub-section include water supply, toilets, Cooking Fuel
and power.
0.1902
0.2461
0.1266 0.1146
0.0000
0.1329
0.0000
0.0500
0.1000
0.1500
0.2000
0.2500
0.3000
Pro
port
ion
Dea
d
Type of Roof
Proportion Dead By Type Of Roof
Roofing material
CEB
Alive
Dead
(absolute)
Proportion
dead
Unconventional roofing 184 149 35 0.1902
Thatch / leaf / reed 447 337 110 0.2461
Wood planks 79 69 10 0.1266
Corrugated iron 5915 5237 678 0.1146
Cement / concrete 21 21 0 0.0000
Not dejure resident 158 137 21 0.1329
Total 6804 5950 854 0.1255
14
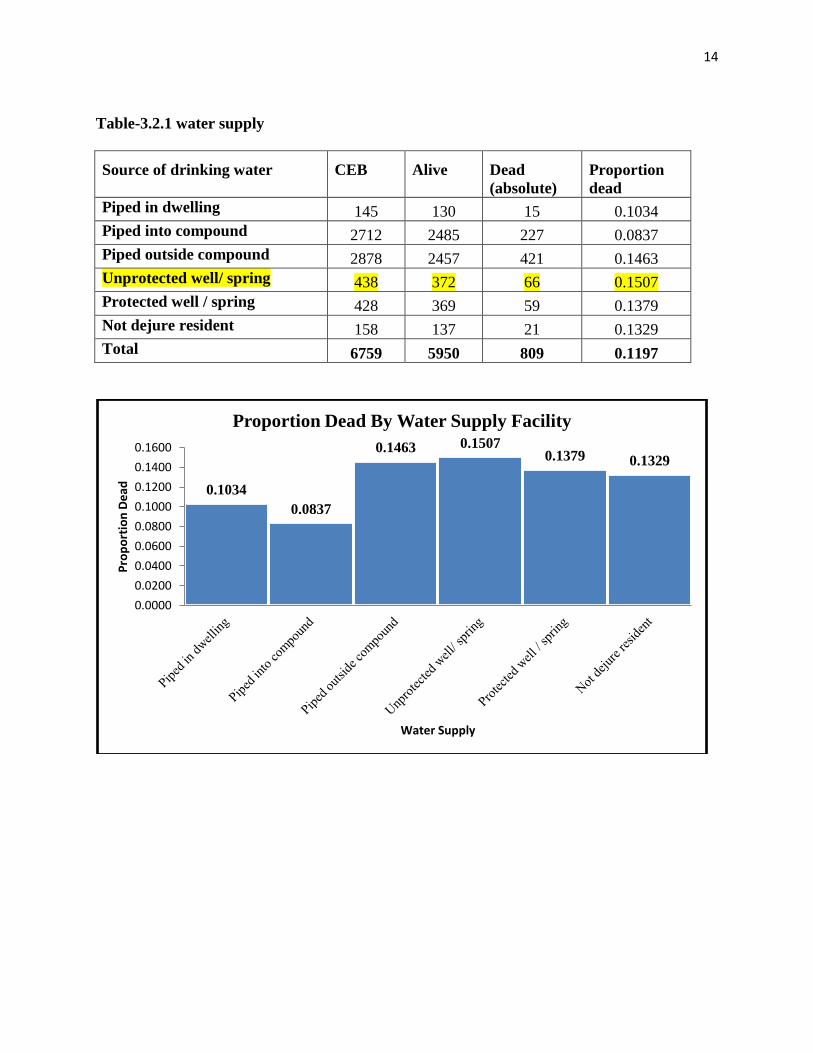
Table-3.2.1 water supply
Source of drinking water
CEB
Alive
Dead
(absolute)
Proportion
dead
Piped in dwelling 145 130 15 0.1034
Piped into compound 2712 2485 227 0.0837
Piped outside compound 2878 2457 421 0.1463
Unprotected well/ spring 438 372 66 0.1507
Protected well / spring 428 369 59 0.1379
Not dejure resident 158 137 21 0.1329
Total 6759 5950 809 0.1197
0.1034
0.0837
0.1463 0.1507 0.1379 0.1329
0.0000
0.0200
0.0400
0.0600
0.0800
0.1000
0.1200
0.1400
0.1600
Pro
po
rtio
n D
ead
Water Supply
Proportion Dead By Water Supply Facility
15
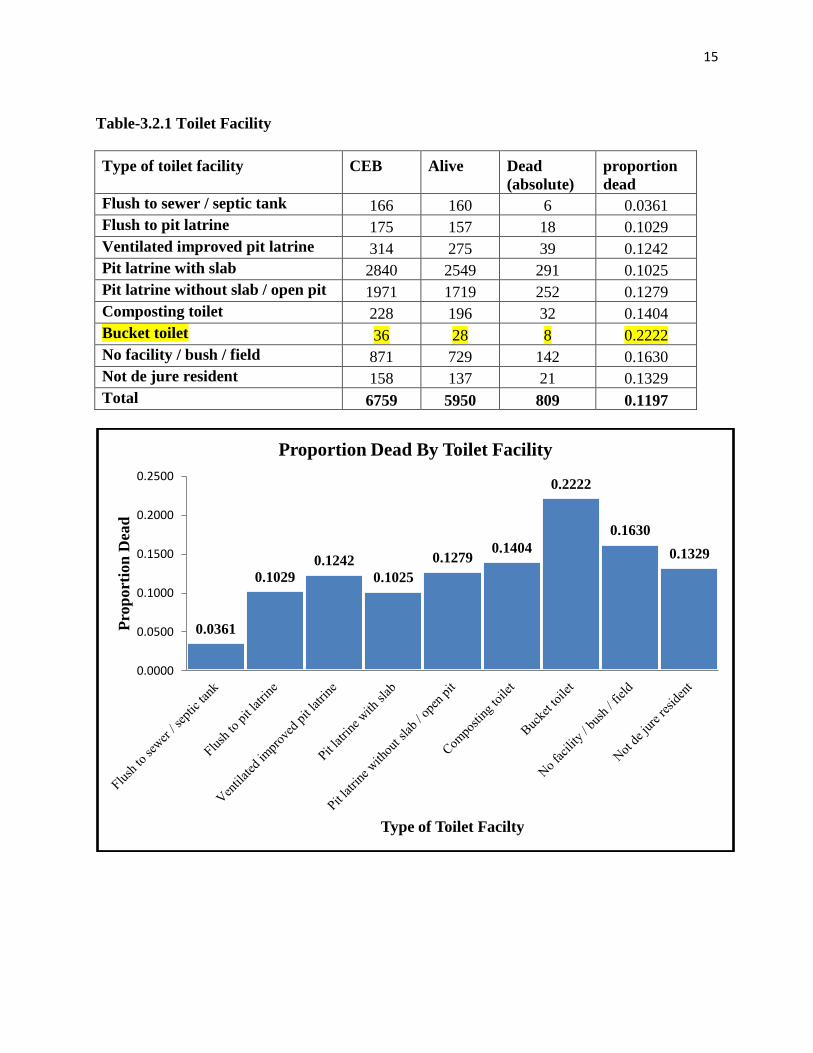
Table-3.2.1 Toilet Facility
Type of toilet facility
CEB
Alive
Dead
(absolute)
proportion
dead
Flush to sewer / septic tank 166 160 6 0.0361
Flush to pit latrine 175 157 18 0.1029
Ventilated improved pit latrine 314 275 39 0.1242
Pit latrine with slab 2840 2549 291 0.1025
Pit latrine without slab / open pit 1971 1719 252 0.1279
Composting toilet 228 196 32 0.1404
Bucket toilet 36 28 8 0.2222
No facility / bush / field 871 729 142 0.1630
Not de jure resident 158 137 21 0.1329
Total 6759 5950 809 0.1197
0.0361
0.1029
0.1242
0.1025
0.1279 0.1404
0.2222
0.1630
0.1329
0.0000
0.0500
0.1000
0.1500
0.2000
0.2500
Pro
port
ion
Dea
d
Type of Toilet Facilty
Proportion Dead By Toilet Facility

16
Table- 3.2.2 Toilet sharing facility
Toilet facility shared CEB Alive dead (absolute) proportion dead
No 2682 2408 274 0.1022
Yes 3052 2679 373 0.1222
Not dejure resident 158 137 21 0.1329
Total 5892 5224 668 0.1134
Table 3.2.3 Cooking Fuel
Type of cooking fuel
CEB
Alive
Dead
(absolute)
proportion
dead
Electricity 82 77 5 0.0610
LPG, natural gas 84 81 3 0.0357
Kerosene 2083 1891 192 0.0922
Charcoal 1191 1065 126 0.1058
Firewood, straw 3102 2651 451 0.1454
Animal Dung 57 47 10 0.1754
Not dejure member 158 137 21 0.1329
Total 6757 5949 808 0.1196
0.1022
0.1222
0.1329
0.0000
0.0200
0.0400
0.0600
0.0800
0.1000
0.1200
0.1400
No Yes Not dejure resident
Pro
port
ion
Dea
d
Shared Toilet
Proportion Dead y Toilet Facility Sharing

17
Table- 3.2.4 Type of lighting
Has electricity
CEB
Alive
Dead
(absolute)
Proportion
dead
No 1058 878 180 0.1701
Yes 5543 4935 608 0.1097
Not dejure resident 158 137 21 0.1329
Total 6759 5950 809 0.1197
0.0610
0.0357
0.0922 0.1058
0.1454
0.1754
0.1329
0.0000
0.0200
0.0400
0.0600
0.0800
0.1000
0.1200
0.1400
0.1600
0.1800
0.2000
Pro
port
ion
Dea
d
Cooking Fuel
Proportion Dead By Type Of Cooking Fuel

18
3.3 Impact of Housing Durables on Under-Five Mortality:
Table-3.3.1 Under-five mortality variations with respect to radio availability in a
household:
Has Radio
CEB
Alive
Dead
(absolute)
Proportion
dead
No 1382 1144 238 0.1722
Yes 5219 4669 550 0.1054
Not dejure resident 158 137 21 0.1329
Total 6759 5950 809 0.1197
0.1701
0.1097
0.1329
0.0000
0.0200
0.0400
0.0600
0.0800
0.1000
0.1200
0.1400
0.1600
0.1800
No Yes Not dejure resident
Pro
port
ion
Dea
d
Availability of Electricity
Proportion Dead By Availability of Electric Lighting

19
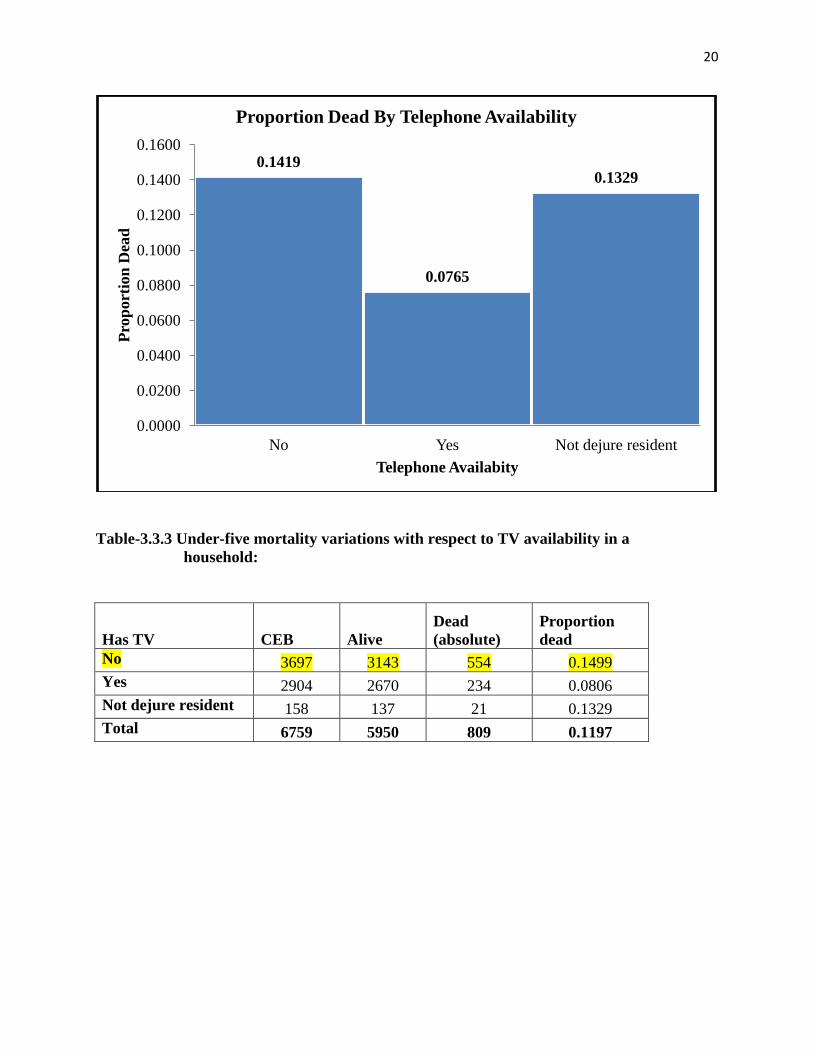
Table-3.3.2 Under-five mortality variations with respect to telephone availability in a
household:
Has telephone
CEB
Alive
Dead
(absolute)
Proportion
dead
No 4321 3708 613 0.1419
Yes 2274 2100 174 0.0765
Not dejure resident 158 137 21 0.1329
Total 6753 5945 808 0.1197
0.1722
0.1054
0.1329
0.0000
0.0500
0.1000
0.1500
0.2000
No Yes Not dejure resident
Pro
port
ion
Dea
d
Radio Availability
Proportion Dead By Radio Availability
20
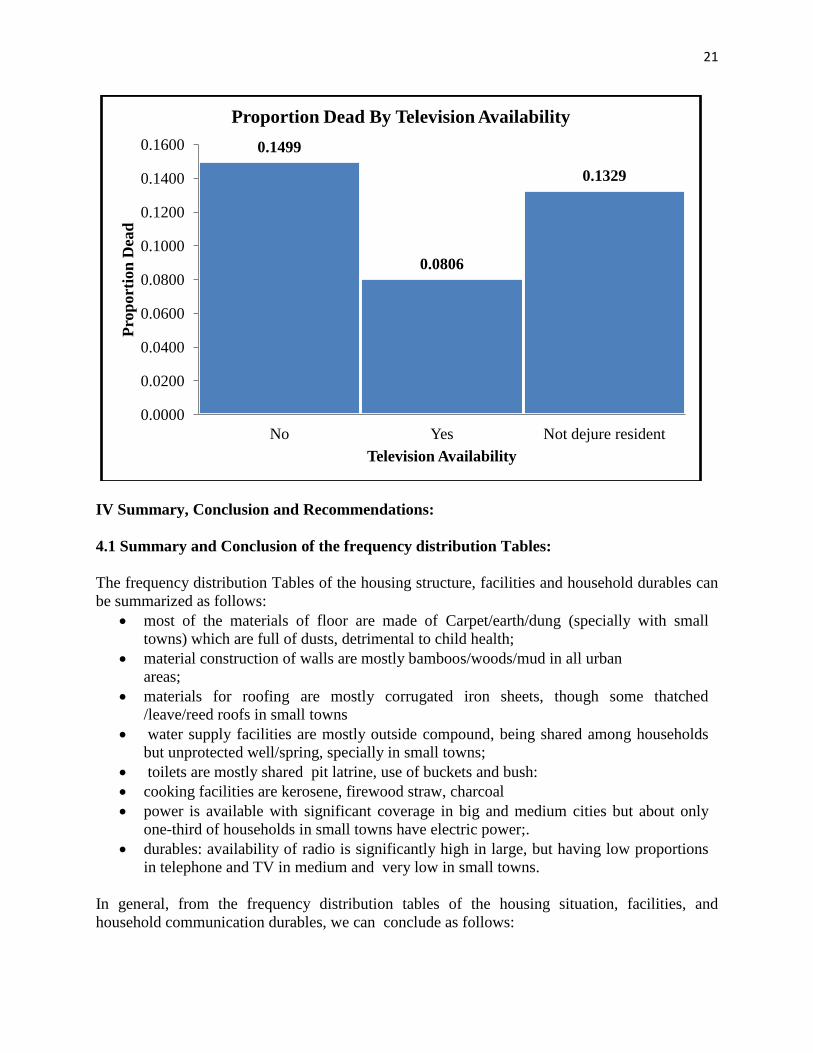
Table-3.3.3 Under-five mortality variations with respect to TV availability in a
household:
Has TV CEB Alive
Dead
(absolute)
Proportion
dead
No 3697 3143 554 0.1499
Yes 2904 2670 234 0.0806
Not dejure resident 158 137 21 0.1329
Total 6759 5950 809 0.1197
0.1419
0.0765
0.1329
0.0000
0.0200
0.0400
0.0600
0.0800
0.1000
0.1200
0.1400
0.1600
No Yes Not dejure resident
Pro
port
ion
Dea
d
Telephone Availabity
Proportion Dead By Telephone Availability
21
IV Summary, Conclusion and Recommendations:
4.1 Summary and Conclusion of the frequency distribution Tables:
The frequency distribution Tables of the housing structure, facilities and household durables can
be summarized as follows:
most of the materials of floor are made of Carpet/earth/dung (specially with small
towns) which are full of dusts, detrimental to child health;
material construction of walls are mostly bamboos/woods/mud in all urban
areas;
materials for roofing are mostly corrugated iron sheets, though some thatched
/leave/reed roofs in small towns
water supply facilities are mostly outside compound, being shared among households
but unprotected well/spring, specially in small towns;
toilets are mostly shared pit latrine, use of buckets and bush:
cooking facilities are kerosene, firewood straw, charcoal
power is available with significant coverage in big and medium cities but about only
one-third of households in small towns have electric power;.
durables: availability of radio is significantly high in large, but having low proportions
in telephone and TV in medium and very low in small towns.
In general, from the frequency distribution tables of the housing situation, facilities, and
household communication durables, we can conclude as follows:
0.1499
0.0806
0.1329
0.0000
0.0200
0.0400
0.0600
0.0800
0.1000
0.1200
0.1400
0.1600
No Yes Not dejure resident
Pro
port
ion
Dea
d
Television Availability
Proportion Dead By Television Availability
22
Prevalence of deplorable housing shortages, poor environmental sanitation, unhealthy
overcrowding in terms of person/room ratios;
Congestion with high rate of household tenancy and unacceptable waste disposal
practices
, unhealthy housing conditions with doubled up households, sharing the same facilities;
inadequate and qualitatively inefficient water supply system;
sub-standard unacceptable toilet facilities; and
serious lack of modern kitchen facilities associated with poor cooking fuel facilities.
4.2 Summary of the analysis of housing correlation of proportion of infant and
childhood mortality levels:
Among the categorical variables of the housing structures, facilities and household
durables, which manifested highest proportions of the prevalence of proportion of under-five
mortality levels, are summarized in the following Table:
Housing Characteristics Highest proportion
Dead
Housing Structure:
Floor: animal dung---------------------------
Wall: unconventional material------------ l
Roofing: thatched leave/reed--------------
0.1721
0.3233
0.2461
Housing Facilities:
Water: Unprotected well/spring--------------
Toilet: shared pit latrine, use of bucket/ bush
Lightning: no electric power: ---------------
Cooking: kerosene, fire wood/straw, charcoal
0.1507
0.2222
0.17o1
0.1754
Household Durables:
No household radio----------------------------
No household telephone----------------------
No household TV-----------------------------
0.1722
0.1419
0.1499
4.3 Recommendation:
It is believed that this study provides basic inputs for urban planners and policy makers to be
engaged in ameliorating the current urban housing conditions ,which could contribute to the
evaluation of the attainment for the 2015 MDG4 expected target and also for future
improvements of urban quality of life.
The remaining task is further to undertake analysis by cross-tabulating among the housing
characteristics, being controlled for proportion of under-five mortality levels. For example, types
of floor cross-tabulating by types of wall, controlled for proportion dead, could help focus in
upgrading existing housing conditions and also for future urban and housing planning,
monitoring and evaluation programmes.
23
General References:
1. Sokoma O.( 1985): Urban Primacy in Developing countries: The Case of Mali
www.pubmed.gov,
2. Sovani N.V.(1964): The analysis of Over-urbanization: Economic Development and Cultural
Change , Vol.12, No.2
3. Hamdan G.(1964): Capitals of the New Africa, Economic Geography, Vol.40,No.3
4. UN (1976): Housing Policy Guidelines for Developing Countries, Sales No.E.76, New York,
5. UN (1986): Living conditions in Developing countries in the mid-1980’s: Supplement to the
1985 Report on the World social situation, New York,1986.
6. UN( 1988): Housing and Economic Adjustment: Department of International social and
economic Affairs, New York, 1988.
7. UN(1976): World Housing Survey1975: An overview of the state of housing, building and
planning within human settlement, , New York, 1976.
8. UN (1975): World Housing Conditions and Estimated Housing Requirements, New York,
9. UN (1994): National Perspectives on Population and Development, ICPD, 1994.
10. UN (!998): Population Distribution and Migration : International conference on Population
and Development, September, 1994
11. UNDP (2001): Human Development Report 2001, New York
12. UNECA(1995): Population and Sustainable Development with reference to Linkages Among
Environment, Urbanization, and Migration in ECA Member States, November, 1995.
13. AAMPPO (1985) Assessment of Available Water Resources for the Growth of Addis
Abeba Addis Abeba Master Plan Project Office (AAMPPO),Addis Abeab , January , 1985.
14. Assefa Hagos (1997): The Impact of Migration on Primate City Growth in Ethiopia,
Proceedings on the Urban Regional Develppment Planning and Implementation in
Ethiopia, Awassa/Nazareth, February 1996.
15. CSA ( 1984); The 1984 National Population and Housing Census, of Ethiopia: Analytical
Report, Addis Abebab, December, 1991.
16. CSA ( 1994): 1994 National Population and Housing Census of Ethiopia, Analytical report,
Addis Abeba, June 1999 ( incudes Population Projections ).
17. CSA (2000): Ethiopian Demographic and Health Survey2000 Report, Addis Abeba, May
2001.
18. CSA (1999): Report of the 1998 welfare monitoring Survey, Statistical Bulletin 224, Addis
Abeba, November 1999.
19. CSA(1993): The 1990 National Family and Fertility Survey Report, Addis Abeba, June
1993.
20. Gebre Solomon ( 1995): The conditions of the Poor in Addis Abeba: A Social Problem not
Yet Addressed, Addis Abeba University, March, 1995.
21. Ghebre-Amanuel ( 1977): Introduction to Environmental health Practices: Water Supply,
Ethiopia Graphic Printers , Addis Abeba , 1997
22. Hadgu Bariagaber (1988): The role of Demographic Information in Planning for Urban
Growth and Development in Ethiopia, Proceedings on Planning and Demographic
Analysis, IDR/DTRC, Addis Abeba University, 1988.
23. Hadgu Bariagaber (1995): Poverty Assessment in Ethiopia with reference to Addis Abeba
and Institutional efforts and coordination for Poverty Alleviation in the City, Commissioned

24
Paper Presented at the workshop on “Urban Poverty in Southern and Eastern Africa”,
Nairobi, Kenya, 14-16 March, 1995, UNCHS/Urban Management Programme
24. Hadgu Bariagaber (1997): Urbanization Process and Urban Planning, A key Note Address
delivered at the workshop on “Urban and Regional Development Planning and
Implementation” , Organized by the National Urban Planning Institute in Collaboration
with the World Bank, Awassa/Nazareth , Addis Abeba , January 1997.
25. MPEd(1995): Report on Household Food Security Study of Four Major Towns , Ministry of
Planning and Economic Development (MPED), February, 1999.
26 .MUDH ( 1980): Data On Housing Survey Conditions , Ministry of Urban Development
and Housing (MUDH), Addis Abeba, 1979


![1. Introduction - IUSSP · National Statistics Office [Philippines] and ICF Macro. 2009. Philippines National Demographic and Health ... Expanded Program of Immunization (EPI](https://img.pdfslide.us/doc/110x75/5af664787f8b9a9271902eec/1-introduction-iussp-statistics-office-philippines-and-icf-macro-2009-philippines.jpg)