Embed Size (px)
DESCRIPTION
Housing Associations and Welfare Reform. October 2013 Mary Taylor Chief Executive SFHA. Overview. HAs in Scotland Current challenges – welfare What is needed. Sector profile. 280,000 homes for rent, plus shared homes, part ownership and factoring - PowerPoint PPT Presentation
Citation preview

Housing Associations and Welfare Reform
October 2013
Mary Taylor Chief Executive
SFHA

Overview
• HAs in Scotland • Current
challenges – welfare
• What is needed

Sector profile
• 280,000 homes for rent, – plus shared homes, part ownership and factoring – plus mid market and intermediate rents
• 11% of all housing in Scotland – 46% of all affordable rented housing
• 150 HAs and co-ops– Range of sizes: 400, 4000, 40,000. Typical around 1800. – Roles vary – All regulated social landlords (RSLs) by the Scottish Housing Regulator
• More than just housing– Support, care, regeneration, employment training, social enterprise,
garden schemes and more


Social Housing in ScotlandSocial Rented sector Private Rented sector
Mobility 40% in their home for more than 10 years
A third in their home for less than a year
Size 576,000 (24%) 325,000 (14%)
Property size ~80% one or two bedroom ~60% one or two bedroom
Turnover 12% 1br available (69,000) At least a third? (107,000)
Demand ~350,000 ?
Housing Benefit 65% claim HB, equates to 55% of rent received
30% claim LHA
Housing need ~45% ‘vulnerable’ Job movers, students
Age of tenants 54% are 45 or older 52% under 35
Economically inactive 52% (older tenants) 36% (student renters)Cost (rent per week) £62 ~£160
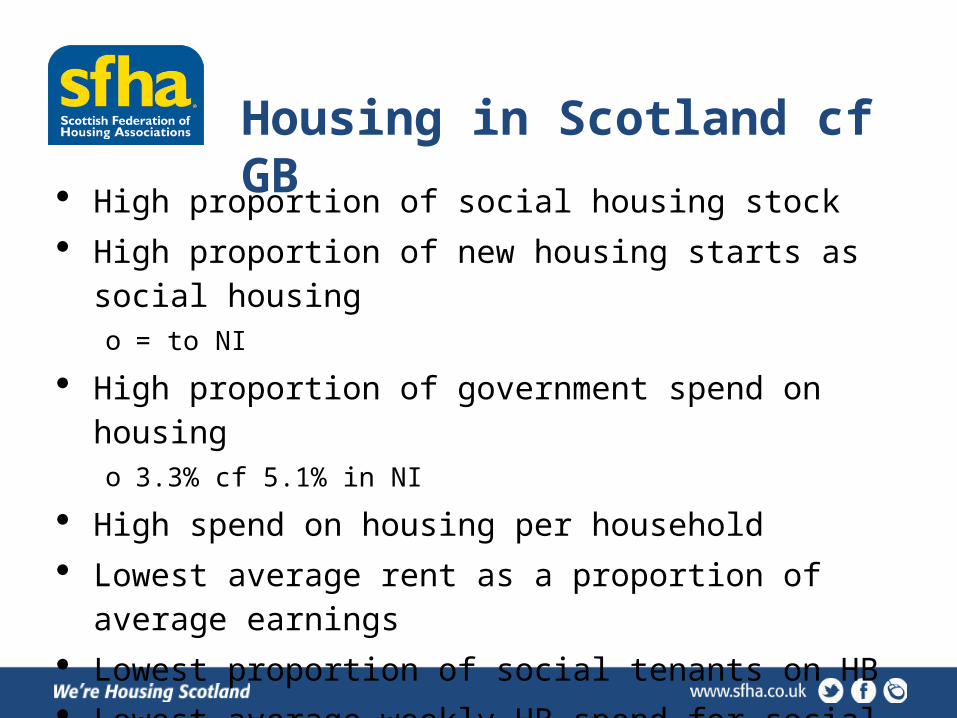
Housing in Scotland cf GB
High proportion of social housing stock High proportion of new housing starts as social housing
o = to NI
High proportion of government spend on housingo 3.3% cf 5.1% in NI
High spend on housing per household Lowest average rent as a proportion of average earnings Lowest proportion of social tenants on HB Lowest average weekly HB spend for social renters

Current challenges in ScotlandHigh demand
Highest proportion of new HA lets going to homeless households Higher proportion of social housing as temporary accommodation Higher than average unemployment rate Rising demand for intermediate rent property in some locations
Supply constraints Highest RTB sales as a proportion of social housing stock – RTB to be abolished Greatest loss of social housing over past 20 years Lower than average RSL spend per unit when including private finance Falling subsidy per unit drives rents up when changes to HB makes harder to afford

Welfare Cuts in Scotland
£499m
£302m£290m
£225m
£165m
£81m
£50m£32m £13m
Incapacity benefitsTax Credits1 per cent upratingChild BenefitDisability Living AllowanceHousing Benefit: Local Housing Al-lowanceHousing Benefit: Under-occupation ('bedroom tax')Non-dependant deductionsHousehold benefit cap
£1.66bn (24%)
Annual impact in 2014/15

Est’d Impact of welfare cuts on Housing Associations in Scotland
2013-14 2014-15 2015-16 2016-17 £-
£25
£50
£75
£100
£125
£8.4 £16.7 £25.1 £33.5 £9.9
£19.7
£29.6
£39.5
£19.9
£30.0
£40.1
£50.3
Housing Benefit Other Welfare Benefits CPI/RPI wedge
Annu
al Im
pact
(£m
)
£38m
£66m
£95m
£123m

Distribution of HAs’ arrears

Bedroom Tax Share of LA Arrears
0%
20%
40%
60%
80%
100%
24%
13%
30%
25%
28%
32%
36%
44%
29%
36%
32%
35%
42%
46%
45%
47%
45%
49%
67%
49% 53
%
56%
58%
61%
62%
63%
65%
65%
68%
68%
70%
71%
72%
72%
73%
73% 83
%
97%
Bedroom Tax arrears Any arrears


…three wishes?
1. Time to organise downsizing 2. Recognition that social housing requires
investment 3. Housing Benefit is a subsidy for housing

1. Time to help tenants to downsize
Then
ue
Glen O
aks
Anonymous
Pineview
Cunningham
eLin
k
Wish
aw Dist
rict
Kingdom
Barrhea
d
Yorkh
ill
Elderp
ark
White
inch an
d Scotst
oun
Port of L
eith
0
100
200
300
400
500
0%
5%
10%
15%
20%
436
199245
87
350 365
69
300
88
30
103 113
192
1% 2% 2% 3%3%
5%6%
7%9%
10%
13%15%
16%
# Under occupying% Downsizing
Und
er o
ccup
ying
tena
nts
Dow
nsizi
ng te
nant
s

2. Recognition that social housing requires investment
Housing is not like other commodities
• Imperfections• Supply• Info• Location• Finance
• Equity • Fair access
Hence intervention and public investment

2. Investment 19
20
1922
19
24
1926
19
28
1930
19
32
1934
19
36
1938
19
40
1942
19
44
1946
19
48
1950
19
52
1954
19
56
1958
19
60
1962
19
64
1966
19
68
1970
19
72
1974
19
76
1978
19
80
1982
19
84
1986
19
88
1990
19
92
1994
19
96
1998
20
00
2002
20
04
2006
20
08
2010
-
5,000
10,000
15,000
20,000
25,000
30,000
35,000
40,000
Private and Social Housing Completions in Scotland PrivateSector
Public Sector &Housing Association
Co
mp
leti
on
s
1919
Add
ison
A
ct19
24 W
heat
ley
Act
1930
Gre
en-
woo
d A
ct
1949 Housing Act
1964 Housing Act
1974 Housing ActW
W2
Cred
it Cr
unch
Thatcher Era

2. Investment
0
5,000
10,000
15,000
20,000
25,000
30,000
3,919
1,096
Social Housing Completions in ScotlandHousing Associa-tionLocal AuthorityOther Public
Com
pleti
ons

2. Investment
1986/87
1990/91
1995/96
1996/97
1997/98
1998/99
1999/00
2000/01
2001/02
2002/03
2003/04
2004/05
2005/06
2006/07
2007/08
2008/09
2009/10
2010/11
2011/12
£-
£100
£200
£300
£400
£500
£600
£700
£800
£900
£1,000
0%
5%
10%
15%
20%
25%
30%
35%
40%
45%
50%
HAG Private finance % Private
£ m
illio
n
% P
rivat
e

3. Housing Benefit is a Subsidy for Housing
£-
£5
£10
£15
£20
£25
£6.5
£23.1
Housing Subsidy Spending in Great Britain
Public investment in social housingPublic expenditure on Hous-ing Benefit
£ bi
llion
(cas
h)

3. Housing Benefit is a Subsidy for Housing
Housing Subsidy Spending in Scotland
Devolved
Reserved

If I had just one wish?

What challenges lie ahead People – governing bodies, employees , customers
• Demands and expectations of customers • Values of providers • Intellectual demands of future strategy • Emotional demands - morale and resilience • Attitude to risk • Leadership

Doing things differently?
• Diversify e.g. into mid-market rent? • New forms of finance – bonds, securitisation • Different relationships with other bodies
– Contracting, partnerships, subsidiaries
• Services to people – older, poorer, more vulnerable – relationship to health and social care agenda
• Any change could mean greater risks– all sorts, everywhere … – governance implications of assessing and treating risk

Prospects?

Prospects?
Shift from capital to revenue subsidy
Greater risk with reduced Housing Benefits
Greater dependence on private finance Cuts to Housing
Benefit to control welfare spending
1% cap undermines ability to inflate rents
Direct payments undermine ability to collect rents
Enough additional cash to support borrowing?
Depressed value of the homes used as loan security
Downward pressure on credit ratings
Increased risk of alternative funding sources relative to inflation
Risks no new homes for social rent

Worst that could happen?
• Drop in demand, higher turnover • Repossessions and abandonments• Less funding (rent and borrowing)• Costlier procurement• Job losses and less contractor capacity • Reputational damage from getting it wrong • Sharing, partnering, merging

Best that could happen?
• New rented markets & business opportunities – Eg selling services to others
• Opportunity to get closer to customer – better customer relations
• Challenges provide imperative to – greater efficiency– focus on asset management
• Sharing, partnering, merging