Embed Size (px)
Citation preview
Household food security what health professionalsshould know 'N P Steyn, H-L Robertson, M Mekuria,
o Labadarios
Objectives. To determine national food security
(availability) from national food production and
consumption data and to compare 'available' consumption
data with actual consumption data obtained from dietary
surveys in order to predict household food security.
Design. Survey of the literature and calculations from
South African food balance sheets.
Methods. Data were obtained from reports and food
balance sheets published by the Department of
Agriculture's Directorate of AgricUltural Economic Trends,
the Development Bank of Southern Africa and the World
Bank. Food available for individual consumption was
calculated (production minus animal feed minus export
and import) and compared with actual consumption data
derived from dietary surveys published locally.
Results. Findings indicate that the growth rates of staple
foods and livestock over the last 23 years are lower than
the population growth rate. The average available daily
energy is 9 772 kJ and the protein content is 66.8 g as
calculated from food balance sheets. However, dietary
surveys indicate that urban and rural blacks have
considerably lower energy intakes, indicating poor
household food security. Mean daily energy intakes were
found to be 7 345 kJ for urban, and 7 130 kJ for rural
black South Africans.Conclusion. We recommend that research focus on
causes of food insecurity in order to implement effective
intervention programmes. It is essential that such research
be multidisciplinary and include agriculturalists, health
professionals and social scientists.
s Atr Med J 1998; 88: 75-79,
'A food-secure world would be one in which food as ahuman right would be the form of social behaviour, anexpectation upheld and enforced by all and for all."
Departments of Human Nutrition and Agricultural Economics,University of the North, Sovenga, Northern Province
N P Steyn, PhD
M Mekuria, PhD
Vitamin Information Centre, Roche Products, Chloorkop, Gauteng
H-L Robertson, BSc (Diet)
Department of Human Nutrition, University of Stellenbosch,Tygerberg, W Cape
o Labadarios, MS ChB, PhD, FACN
SAMJClinical Nutrition
During the last 25 years, hunger and malnutrition havebecome increasingly rife in Africa. This has been particularlyevident in countries such as Ethiopia, Sudan and Somalia,which have experienced famine since the 1980s.2 The WorldBank's 1990 report estimated that in 1985, over 180 millionpeople in sub-Saharan Africa were living in poverty (percapita income below US$370). They also projected that bythe year 2000 the number of poor in Africa would increaseto 265 million.' The Food and Agricultural Organisation (FAO)has classified 88 countries of the world as low income fooddeficit countries (L1FDC) and of these, 42 are in sub-SaharanAfrica.·
Today, the real crisis in Africa is the steady decline in foodproduction per capita. 2 Major food crops in sub-SaharanAfrica have increased by 1.6%, whereas the population hasincreased by 2.8%.5 Since the 1960s food production hasconsistently lagged behind population growth and a foodshortfall of 40% has resulted. On the basis of past trends,the FAO has predicted that cereal deficits in Africa willincrease from 9 million tons in 1984 to 58 million tons by2010.2 In Asia on the other hand, food production since1960 has consistently exceeded population growth. Indiawas the biggest poverty region in the world in 1960, but as aresult of yields per hectare increasing by 2.4% per annum,the need for food aid had Virtually been eliminated by the1980s. Africa, on the other hand, has only increased itsyields by 0.1 % per annum since 1960'
Many reasons have contributed to famine in Africa: war,persistent low economic growth, poor agriculturalperformance, drought, environmental degradation and rapidpopulation increase have been described as the majorcontributing factors.6-B Those factors contributing todecreased food production and their contribution tomalnutrition need to be addressed in the short and the longterm by policy-makers. Food security has been identified asone of the underlying causes of malnutrition and death.9 Alack of information on food security and the nutritionalsituation of households can be a major constraint inplanning and policy formulation. '°
Prior to 1983, food security was conceptualised as anational food self-sufficiency or food availability. However, in1983 the FAO redefined food security by adding three keyconcepts: (I) quantity and quality; (il) accessibility to all; and(iil) sustainability of the supply. In 1986, the World Bankadded another concept and the definition of food securitybecame: 'Access by all people at all times to enough foodfor a healthy active Iifestyle.'" The most recent definitioncomes from the 1996 World Food Summit: 'Food security iswhen all people, at all times, have physical and economicaccess to sufficient, safe and nutritious food to meet theirdietary needs cnd food preferences for an active lifestyle'(World Food Plan of Action, World Food Summit, Rome,1996).
Food security can therefore be conceptualised at threelevels. Global food security requires there to be sufficientfood available to feed the world population. ·National foodsecurity requires there to be sufficient food available in thecountry to meet the needs of the whole populationthroughout the year. Individual food security requiressufficient food to be available at household level to meet therequirements of each household member. '2
SAMJ Volume 88 No, 1 January 1998 _
South Africa is not classified as a L1FDC by the FAObecause it is a country that produces a food surplus. It isgenerally accepted that South Africa produces sufficientfood for the total population, yet a large proportion of thepopulation faces undernutrition and hunger.'3
At household level, nutritional status is used as anindicator for measuring household food security. A nationalstudy of nutritional status of preschool children in SouthAfrica found that 1 in 3 children had a marginal vitamin Astatus and 1 in 5 children was anaemic. Almost 1 in 4children was stunted and 1 in 10 underweight. 14 Accordingto international criteria, stunting is a major problem in SouthAfrica, particularly in rural areas. Stunting is a consequenceof a chronic food (energy) shortage over a long period oftime.'5 The high prevalence of stunting in this country istherefore a reflection of poor household food security.
The objective of this study was to examine data availablein order to establish food security at national level. Thesedata were then compared with dietary data from individuals(summarised from various studies in South Africa) in order toobtain information on household food security.
MethodsThe authors obtained data from reports and food balancesheets published by the Department of Agriculture'sDirectorate of Agricultural Economic Trends (Food BalanceSheets 1993 - 1994 and unpublished data), theDevelopment Bank of South Africa and the World Bank, allof which annually publish data on food production and foodconsumption in South Africa.'6.17 Consumption data werederived by taking total production of a specific food item inthe country and by subtracting the total amount used foranimal feed and the total amount imported and exported;the remainder reflected net human consumption of thatspecific food item. This amount was then divided by thenumber of the population assumed to represent theindividual (per capita) 'consumption' of a given food. Thelatter represents 'available' consumption of a food item,which is a very crude estimate as it does not take intoconsideration waste or losses due to storage. By addingtogether all the various foods consumed, it was possible tocalculate the average energy, protein, fat and carbohydrateavailable per person by using local South African foodtables;'6 this gave an indication of national food security. Theavailable consumption data were then compared with actualconsumption, as derived from a meta-analysis of dietarysurveys;19 this gave an indication of individual food security.
To date, there has never been a national nutritional surveyin South Africa; consequently data from a meta-analysiscomprising 55 studies and reports were used." All of thesestudies met certain inclusion criteria, such as randomisationand number of subjects per group, and used the 24-hourrecall method of dietary assessment."
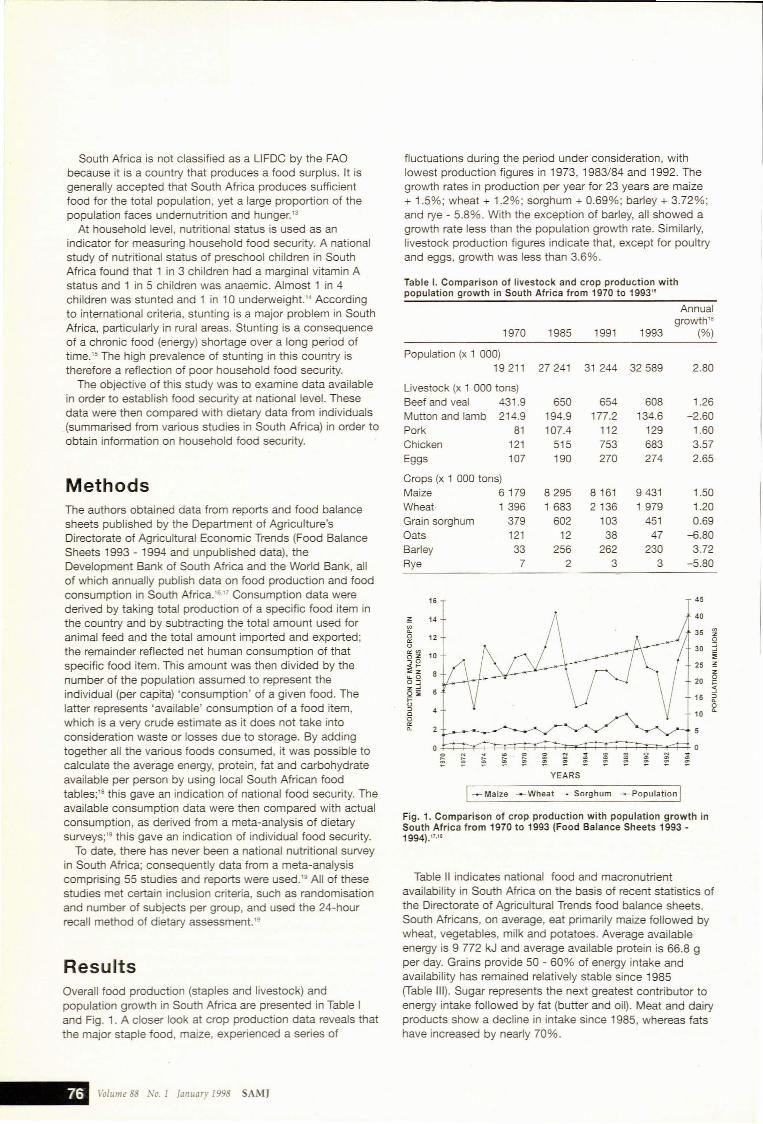
ResultsOverall food production (staples and livestock) andpopulation growth in South Africa are presented in Table Iand Fig. 1. A closer look at crop production data reveals thatthe major staple food, maize, experienced a series of
fluctuations during the period under consideration, withlowest production figures in 1973, 1983/84 and 1992. Thegrowth rates in production per year for 23 years are maize+ 1.5%; wheat + 1.2%; sorghum + 0.69%; barley + 3.72%;and rye - 5.8%. With the exception of barley, all showed agrowth rate less than the population growth rate. Similarly,livestock production figures indicate that, except for poultryand eggs, growth was less than 3.6%.
Table I. Comparison of livestock and crop production withpopulation growth in South Africa from 1970 to 1993"
Annualgrowth"
1970 1985 1991 1993 (%)
Population (x 1 000)19211 27241 31 244 32589 2.80
Livestock (x 1 000 tons)Beef and veal 431.9 650 654 608 1.26Mutton and lamb 214.9 194.9 177.2 134.6 -2.60Pork 81 107.4 112 129 1.60Chicken 121 515 753 683 3.57Eggs 107 190 270 274 2.65
Crops (x 1 000 tons)Maize 6179 8295 8161 9431 1.50Wheat· 1 396 1 683 2136 1979 1.20Grain sorghum 379 602 103 451 0.69Oats 121 12 38 47 -6.80Barley 33 256 262 230 3.72Rye 7 2 3 3 -5.80
16 45
;!: 14 40
'"a. 350 12'"<> 30"''''oz 10,0<I- 25;';z.... 0
200:::;z: 60;';;::<>=> 400
'"a.
00 N ~ ~ 0 N ~ ~ ~ 0 ~
~ ~ ~ ~ ~ ~ ~ 0 00 0 0 0 0 0 0 0 0 0
YEARS
I~ Maize ~Wheat ~ Sorghum ~ Population IFig. 1. Comparison of crop production with population growth inSouth Africa from 1970 to 1993 (Food Balance Sheets 1993 1994)."'"
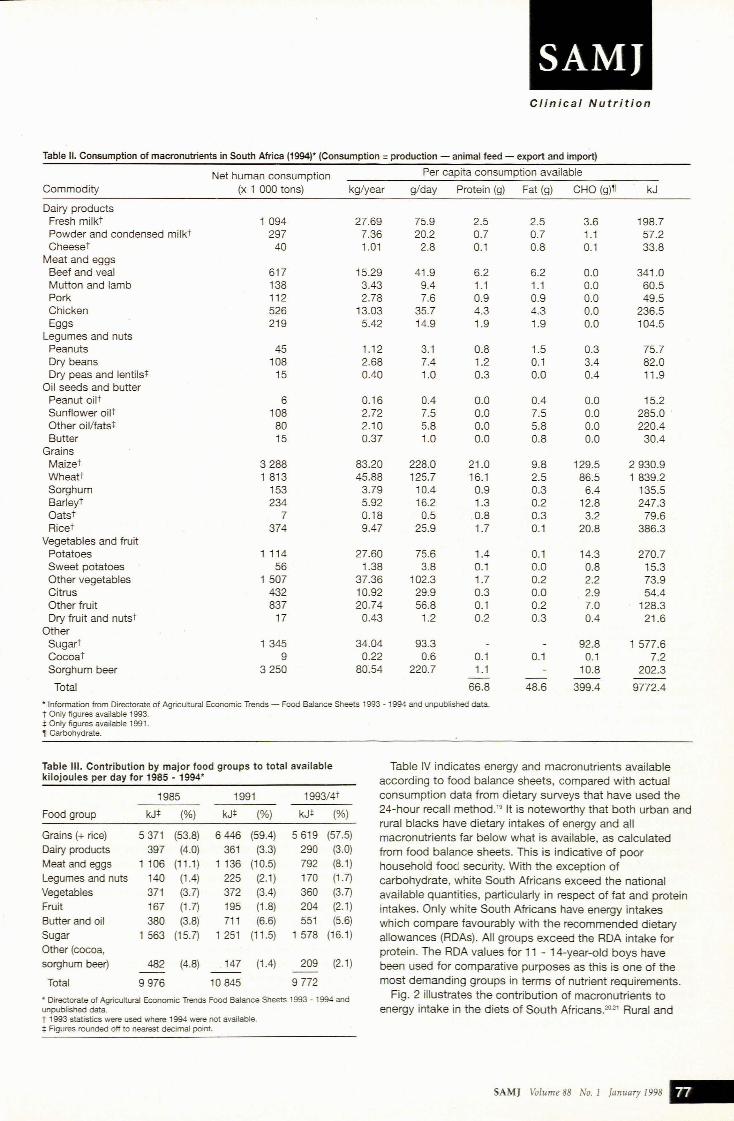
Table 11 indicates national food and macronutrientavailability in South Africa on the basis of recent statistics ofthe Directorate of Agricultural Trends food balance sheets.South Africans, on average, eat primarily maize followed bywheat, vegetables, milk and potatoes. Average availableenergy is 9 772 kJ and average available protein is 66.8 gper day. Grains provide 50 - 60% of energy intake andavailability has remained relatively stable since 1985(Table Ill). Sugar represents the next greatest contributor toenergy intake followed by fat (butter and oil). Meat and dairyproducts show a decline in intake since 1985, whereas fatshave increased by nearly 70%.
\'o[ume 88 No. 1 January 1998 SAMJ
Clinical Nutrition
Table 11. Consumption of macronutrients in South Africa (1994)* (Consumption = production - animal feed - export and import)
Net human consumption Per capita consumption available
Commodity (x 1 000 tons) kg/year g/day Protein (g) Fat (g) GHO (g)~ kJ
Dairy productsFresh milkt 1 094 27.69 75.9 2.5 2.5 3.6 198.7Powder and condensed milkt 297 7.36 20.2 0.7 0.7 1.1 57.2Cheeset 40 1.01 2.8 0.1 0.8 0.1 33.8
Meat and eggsBeef and veal 617 15.29 41.9 6.2 6.2 0.0 341.0Mutton and lamb 138 3.43 9.4 1.1 1.1 0.0 60.5Pork 112 2.78 7.6 0.9 0.9 0.0 49.5Chicken 526 13.03 35.7 4.3 4.3 0.0 236.5Eggs 219 5.42 14.9 1.9 1.9 0.0 104.5
Legumes and nutsPeanuts 45 1.12 3.1 0.8 1.5 0.3 75.7Dry beans 108 2.68 7.4 1.2 0.1 3.4 82.0Dry peas and lentilst 15 0.40 1.0 0.3 0.0 0.4 11.9
Oil seeds and butterPeanut oilt 6 0.16 0.4 0.0 0.4 0.0 15.2Sunflower oilt 108 2.72 7.5 0.0 7.5 0.0 285.0Other oil/fatst 80 2.10 5.8 0.0 5.8 0.0 220.4Butter 15 0.37 1.0 0.0 0.8 0.0 30.4
GrainsMaizet 3288 83.20 228.0 21.0 9.8 129.5 2930.9Wheatt 1 813 45.88 125.7 16.1 2.5 86.5 1 839.2Sorghum 153 3.79 10.4 0.9 0.3 6.4 135.5Barleyt 234 5.92 16.2 1.3 0.2 12.8 247.3Oatst 7 0.18 0.5 0.8 0.3 3.2 79.6Ricet 374 9.47 25.9 1.7 0.1 20.8 386.3
Vegetables and fruitPotatoes 1 114 27.60 75.6 1.4 0.1 14.3 270.7Sweet potatoes 56 1.38 3.8 0.1 0.0 0.8 15.3Other vegetables 1507 37.36 102.3 1.7 0.2 2.2 73.9Citrus 432 10.92 29.9 0.3 0.0 2.9 54.4Other fruit 837 20.74 56.8 0.1 0.2 7.0 128.3Dry fruit and nutst 17 0.43 1.2 0.2 0.3 0.4 21.6
OtherSugart 1 345 34.04 93.3 92.8 1 577.6Cocoat 9 0.22 0.6 0.1 0.1 0.1 7.2Sorghum beer 3250 80.54 220.7 1.1 10.8 202.3
-- -- --Total 66.8 48.6 399.4 9772.4
* Information from Directorate of Agricu~ural Economic Trends - Food Balance Sheets 1993 - 1994 and unpublished data.t Only figures available 1993.t Only figures available 1991.~ Carbohydrate.
Table Ill. Contribution by major food groups to total availablekilojoules per day for 1985 - 1994*
1985 1991 1993/4t
Food group kJt (%) kJt (%) kJt (%)
Grains (+ rice) 5371 (53.8) 6446 (59.4) 5619 (57.5)Dairy products 397 (4.0) 361 (3.3) 290 (3.0)Meat and eggs 1 106 (11.1) 1 136 (10.5) 792 (8.1)Legumes and nuts 140 (1.4) 225 (2.1) 170 (1.7)Vegetables 371 (3.7) 372 (3.4) 360 (3.7)
Fruit 167 (1.7) 195 (1.8) 204 (2.1)Butter and oil 380 (3.8) 711 (6.6) 551 (5.6)Sugar 1563 (15.7) 1 251 (11.5) 1578 (16.1)
Other (cocoa,sorghum beer) 482 (4.8) 147 (1.4) 209 (2.1)
-- --Total 9976 10845 9772
• Directorate of Agricu~ural Economic Trends Food Balance Sheets 1993 - 1994 andunpublished data.t 1993 statistics were used where 1994 were not available.t Figures rounded off to nearest decimal point.
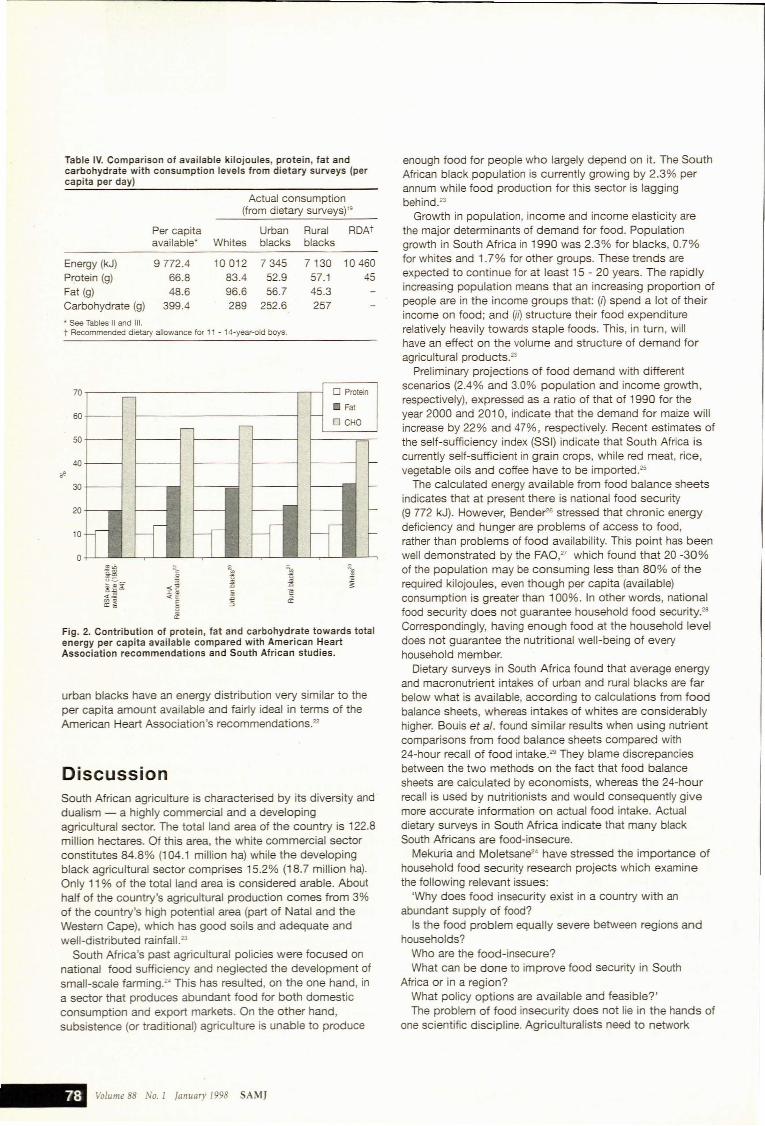
Table IV indicates energy and macronutrients availableaccording to food balance sheets, compared with actualconsumption data from dietary surveys that have used the24-hour recall method." It is noteworthy that both urban andrural blacks have dietary intakes of energy and allmacronutrients far below what is available, as calculatedfrom food balance sheets. This is indicative of poorhousehold food security. With the exception ofcarbohydrate, white South Africans exceed the nationalavailable quantities, particularly in respect of fat and proteinintakes. Only white South Africans have energy intakeswhich compare favourably with the recommended dietaryallowances (RDAs). All groups exceed the RDA intake forprotein. The RDA values for 11 - 14-year-old boys havebeen used for comparative purposes as this is one of themost demanding groups in terms of nutrient requirements.
Fig. 2 illustrates the contribution of macronutrients toenergy intake in the diets of South Africans.20':!1 Rural and
SAMJ Volume 88 No. 1 January 1998 _
Discussion
Actual consumption(from dietary surveys)"
Fig. 2. Contribution of protein, fat and carbohydrate towards totalenergy per capita available compared with American HeartAssociation recommendations and South African studies.
Table IV. Comparison of available kilojoules, protein, fat andcarbohydrate with consumption levels from dietary surveys (percapita per day)
enough food for people who largely depend on it. The SouthAfrican black population is currently growing by 2.3% perannum while food production for this sector is laggingbehind.23
Growth in population, income and income elasticity arethe major determinants of demand for food. Populationgrowth in South Africa in 1990 was 2.3% for blacks, 0.7%for whites and 1.7% for other groups. These trends areexpected to continue for at least 15 - 20 years. The rapidlyincreasing population means that an increasing proportion ofpeople are in the income groups that: (I) spend a lot of theirincome on food; and (if) structure their food expenditurerelatively heavily towards staple foods. This, in turn, willhave an effect on the volume and structure of demand foragricultural products.23
Preliminary projections of food demand with differentscenarios (2.4% and 3.0% population and income growth,respectively), expressed as a ratio of that of 1990 for theyear 2000 and 2010, indicate that the demand for maize willincrease by 22% and 47%, respectively. Recent estimates ofthe self-sufficiency index (SSI) indicate that South Africa iscurrently self-sufficient in grain crops, while red meat, rice,vegetable oils and coffee have to be imported.25
The calculated energy available from food balance sheetsindicates that at present there is national food security(9 772 kJ). However, Sende!""" stressed that chronic energydeficiency and hunger are problems of access to food,rather than problems of food availability. This point has beenwell demonstrated by the FAO," which found that 20 -30%of the population may be consuming less than 80% of therequired kilojoules, even though per capita (available)consumption is greater than 100%. In other words, nationalfood security does not guarantee household food security:6Correspondingly, having enough food at the household leveldoes not guarantee the nutritional well-being of everyhousehold member.
Dietary surveys in South Africa found that average energyand macronutrient intakes of urban and rural blacks are farbelow what is available, according to calculations from foodbalance sheets, whereas intakes of whites are considerablyhigher. Souis et al. found similar results when using nutrientcomparisons from food balance sheets compared with24-hour recall of food intake.29 They blame discrepanciesbetween the two methods on the fact that food balancesheets are calculated by economists, whereas the 24-hourrecall is used by nutritionists and would consequently givemore accurate information on actual food intake. Actualdietary surveys in South Africa indicate that many blackSouth Africans are food-insecure.
Mekuria and Moletsane24 have stressed the importance ofhousehold food security research projects which examinethe following relevant issues:
'Why does food insecurity exist in a country with anabundant supply of food?
Is the food problem equally severe between regions andhouseholds?
Who are the food-insecure?What can be done to improve food security in South
Africa or in a region?What policy options are available and feasible?'The problem of food insecurity does not lie in the hands of
one scientific discipline. Agriculturalists need to network
ft ~ ~"0 1;-lI
;;; :a ~8..:0 O'J ~~:0c
~<~ <E €<n'l' E => 0:0:",
J
D Proteinr-
Fatf--- ~
r-r- D CHO
-
- f-
r--- f--
r~-
I·,c.~r
r;-.;f-.C; .""
,ri' 11~ n~~J , ~1.i f--
t:: k" h'
Per capita Urban Rural RDAtavailable' Whites blacks blacks
Energy (kJ) 9772.4 10012 7345 7130 10460Protein (g) 66.8 83.4 52.9 57.1 45Fat (g) 48.6 96.6 56.7 45.3Carbohydrate (g) 399.4 289 252.6 257
* See Tables 11 and Ill.t Recommended dietary allowance for 11 - 14-year·old boys.
o
urban blacks have an energy distribution very similar to theper capita amount available and fairly ideal in terms of theAmerican Heart Association's recommendations."
20
30
10
40
50
60
70
South African agriculture is characterised by its diversity and'dualism - a highly commercial and a developingagricultural sector. The total land area of the country is 122.8million hectares. Of this area, the white commercial sectorconstitutes 84.8% (104.1 million ha) while the developingblack agricultural sector comprises 15.2% (18.7 million ha).Only 11 % of the total land area is considered arable. Abouthalf of the country's agricultural production comes from 3%of the country's high potential area (part of Natal and theWestern Cape), which has good soils and adequate andwell-distributed rainfall.23
South Africa's past agricultural policies were focused onnational food SUfficiency and neglected the development ofsmall-scale farming:' This has resulted, on the one hand, ina sector that produces abundant food for both domesticconsumption and export markets. On the other hand,subsistence (or traditional) agriculture is unable to produce
Volume 88 No.l January /998 SAMJ
with health professionals and social scientists in order toaddress the problem effectively. Only when we have foundanswers to the above questions can appropriatemultidisciplinary intervention programmes be implemented.
REFERENCES
1. Chen RS, Kates RW. World food security: prospects and trends. Food Policy1994; 19(2): 192-205.
2. Jennings A, Street P. Introduction. Food Policy 1989; 14(3): 194.3. World Bank. World Development Report. Washington DC: World Bank, 1990.4. Food and Agricultural Organisation. Contribution of the 19th FAO Regional
Conference for Africa to the Drafting of Food Summit Documents. Ouagadougou,Burkina Faso: FAO, 1996.
5. Singer HW. The African food crisis and the role of food aid. Food Policy 1989;14(3): 196-206.
6. Food Security Unit. Understanding Famine in Africa. Sussex Insitute ofDevelopment Studies, University of Sussex, 1990.
7. Downing TE, Parry ML. Climate change and food security. Food Policy 7994;19(2): 99-104.
8. Magadza CHQ. Climate change: some likely multiple impacts in Southern Africa.Food Policy 1994; 19(2): 165-191.
9. CSIR. Nutritional status. Household Food Security 1997; 1(2): 5.10. Pinstrup-Andersen P. Government policy, food security and nutrition in Africa.
(PEW Cornell Lecture Series on Food and Nutrition Policy, Camel! Food andNutrition Policy Programme.) New York: Ithaca, 1989.
11. Kinabo JL, Ashimogo GC. Concepts, dimensions and assessment of foodsecurity. Household Food Security 1997; 1(2): 1.
12. Ballenger N, Mabbs-Zeno C. Treating food security and food aid issues at theGATT. Food Policy 1992; 17(4): 264-276.
13. Steyn NP. Nutrition. In: South African Health Review 1996. Durban: HealthSystems Trust, 1996.
14. Labadarios D, van Middelkoop A, Coutsoudis A, et al. South African Vitamin AConsultative Group (SAVACG). Anthropometric, vitamin A. iron and immunisationcoverage status in children aged 6 - 71 months in South Africa, 1994. S Afr MedJ 1996; 86: 354-357.
15. Hansen J. Food and nutritional policy with relation to poverty: The childmalnutrition problem in South Africa (Conference Paper No. 205), 1984.
16. World Bank. Social Development Indicators 7994 - 95. Washington DC: WorldBank, 1995.
17. Development Bank of Southern Africa. South African Population Projections 7995- 2005. Johannesburg: Development Bank Centre for Information Analysis, 1996.
18. Langehoven M, Kruger M, Gouws E, Faber M. MRC Food Compositon Tables. 3rded. Cape Town: Research Insitute for Nutritional Diseases, South African MedicalResearch Council, 1991.
19. Vorster HH, JerJing JC, Oosthuizen W. Becker P, Wolmarans P. Nutrient Intakes ofSouth Africans: An Analysis of the Literature. Isando: Roche Products (Pty) Ltd,1996.
20. Steyn NP, Wicht CR, Rossouw JE, van Wyk Kotze TJ, Van Eck M. Nutritionalstatus of 11-year·old children in the Western Cape. I. Dietary Intake. S Afr J FoodSci Nutr 1989; 4(2): 24-28.
21. Badenhorst CJ, Steyn NP, Jooste PL, Nel JH. Kruger M. Oelofse A, Barnard C.Nutritional status of Pedi school-children aged 6 - 14 years in two rural areas ofLebowa: a comprehensive nutritional survey of dietary intake, anthropometric,biochemical, haematological and clinical measurements. S Afr J Food Sci Nutr'993; 5(4): 112-119.
22. American Heart Association. Nutrition Committee. Dietary guidelines for healthyAmerican adults: a statement for physicians and health professionals. Circulation, 988; 77: 721 A-724A.
23. Corbett D, Lipton M, Vaughan A, Coulter J, Nhlapo A. Restructuring AgriculturalResearch in South Africa. Brighton: Insitute of Development Studies, 1994.
24. Mekuria M, Moletsane NP. Initial findings of rural household food security inselected districts of the Northern Province. Agrekon 1996; 35(4): 309-313.
25. Anon. Possible consumption and production trends. Agrifutura Bulletin 1994;1(2): 15-30.
26. Bender WHo The end use analysis of global food requirements. Food Policy 1994;19(4): 381-396.
27. Food and Agricultural Organisation. The Fifth World Food Survey. Rome: FAO,1987.
28. Babu SC, Quinn V. Food security and nutrition monitoring in Africa introduction and historical background. Food Policy 1994; 19(3): 211-217.
29. Bouis H, Haddad L. Kennedy E. Does it matter how we survey demand for food?Food Policy 1992; 17: 349-360.
Clinical Nutrition
Congress Proceedings
Hospital malnutritionworldwideSimon P Allison
In 1793, describing a case of paralysis of the muscles ofswallowing, John Hunter wrote: 'It becomes our duty toadopt some artificial mode of conveying food into thestomach by which the patient may be kept alive while thedisease continues." In 1843, Robert Graves of Dublin, bestknown for his description of thyrotoxicosis, decided that theusual treatment of typhus fever by bleeding, starving andpurging, might be partly responsible for the high mortality inthis condition and instead gave his patients food and drink,with a resulting drop in death rate. Addressing visitingcolleagues, he said: 'You are not to permit your patient toencounter the terrible consequences of starvation becausehe does not ask for nutriment. Gentlemen, these results aredue to good feeding. When I am gone, you may be at a lossfor an epitaph for me: I give it to you in these words: He fedfever.' From her experiences in nursing the wounded in theCrimean War, Florence Nightingale wrote in 1859: 'Everycareful observer of the sick will agree in this: that thousandsof patients are annually starved in the midst of plenty fromwant of attention to the ways which alone make it possiblefor them to take food. I would say to the nurse: have a ruleof thought about your patient's diet. Consider; rememberhow much he has had and how much he ought to havetoday.'
PrevalenceHave things improved? In 1994, McWhirter and Pennington'carried out a survey of 500 sequential admissions to fivedifferent departments in a UK teaching hospital. Using bodymass index (BMI) and simple anthropometric measures, theyfound that 13% had a BMI of 18-20 (normal 20-25), in 14%it was 16-18, and in 9% < 16_ Twenty-eight per cent had atriceps skinfold thickness between the 5th and 15th centile,and 18% had a triceps skinfold thickness below the 5thcentile. Forty per cent had a mid-arm muscle circumferencebetween the 5th and 15th centile, and 35% had a mid-armmuscle circumference below the 5th centile. Their findingsconfirmed previous reports from the USA3-7 showing thatapproximately 40% of hospital admissions had some degreeof malnutrition and that in half of these it was severe.Colleagues from as far apart as the Philippines and Brazilhave also reported similar findings (personalcommunication). Disturbingly, they also found that only 25%of patients had ever been weighed and in only 48% wasthere any information of nutritional relevance in the notes.
Department of Diabetes, Endocrinology and Nutrition, Queen'sMedical Centre, Nottingham, UK
Simon P AJlison. MD. FRCP
SAMJ Volume 88 No. 1 January 1998 _