Embed Size (px)
Citation preview
University of Connecticut University of Connecticut
OpenCommons@UConn OpenCommons@UConn
Master's Theses University of Connecticut Graduate School
5-10-2020
Household Food Security Status, Dietary Patterns and Diabetes Household Food Security Status, Dietary Patterns and Diabetes
Risk (Hemoglobin A1c) among Cambodian Refugees with Risk (Hemoglobin A1c) among Cambodian Refugees with
Depression Depression
Shanjida Jui [email protected]
Follow this and additional works at: https://opencommons.uconn.edu/gs_theses
Recommended Citation Recommended Citation Jui, Shanjida, "Household Food Security Status, Dietary Patterns and Diabetes Risk (Hemoglobin A1c) among Cambodian Refugees with Depression" (2020). Master's Theses. 1482. https://opencommons.uconn.edu/gs_theses/1482
This work is brought to you for free and open access by the University of Connecticut Graduate School at OpenCommons@UConn. It has been accepted for inclusion in Master's Theses by an authorized administrator of OpenCommons@UConn. For more information, please contact [email protected].
Household Food Security Status, Dietary Patterns and
Diabetes Risk (Hemoglobin A1c) among Cambodian
Refugees with Depression
Shanjida Arbie Jui
B.S., B.A., University of Connecticut, 2020
A Thesis
Submitted in Partial Fulfillment of the
Requirements for the Degree of
Master of Public Health
at the
University of Connecticut
2020
ii
Copyright by
Shanjida Arbie Jui
2020
iii
APPROVAL PAGE
Masters of Public Health Thesis
Household Food Security Status, Dietary Patterns and Diabetes
Risk (Hemoglobin A1c) among Cambodian Refugees with
depression
Presented by
Shanjida Arbie Jui, B.S., B.A.
Major Advisor
Stacey L. Brown, Ph.D.
Associate Advisor
Angela Bermúdez-Millán, Ph.D., MPH
Associate Advisor
Julie Wagner, Ph.D.
University of Connecticut
2020
iv
Acknowledgements
I couldn’t believe a girl from a small country like Bangladesh would be able to finish
graduate school during the worst public health crisis, COVID-19 Pandemic. Amidst home
quarantining and social distancing, as I reflect upon my higher education journey, I can’t help
but think what a privilege it is to be able to complete a milestone of my academic endeavors in
this global trying time. None of this would have been possible without my parents. Not only
they made it possible to protect myself during the virus spread, they supported me both
financially and emotionally through the entire graduate school. Growing up in a culture that
didn’t value a girl’s education, my father, Khalilur Rahman, not only went against the society to
advocate for me and provide me a quality education, he left his entire life behind migrating to a
total new country with nothing for the sake of my better education. My mother, Mahmuda
Rahman who is visibly Muslim and never worked in her life before, worked incredibly hard in a
new country with her broken English despite countless hate attacks, bullying and discrimination,
just so I don’t quit pursuing higher education. I can thank them all my life, and it still won’t be
enough. Every success I had, have and will have, I owe all of it to them. I would also like to give
a special thanks to my sister, Sadia Arbie for being my best friend. She stood by me during every
struggle and all my successes. I wouldn’t have thought of finishing graduate school without the
love and support of her. Shout- out to the rest of the extended family- my uncles, aunts,
grandparents, cousins, especially little Noorvi.
I would like to express my sincere gratitude to my thesis advisor, Dr. Angela Bermúdez-
Millán, for having faith in me and taking me under her wings for this thesis. I can’t express in
words how much I appreciated your knowledge, understanding and compassion for the
importance of food and nutrition in the field of public health. I genuinely would like to thank you
for the time you have given to teach and guide me in this project. Additionally, I thank Dr. Julie
Wagner for allowing me to join one of her passion projects and providing her direction and
support. Last but not least, my sincere thanks to my major advisor, Dr. Stacey Brown who I
greatly admire for going above and beyond for me- whether it was advocating for me, guiding
me or just simply checking in on me. This journey would have been much harder without you.
Lastly, thanks to UCONN and the Public Health Student Association for giving me the
opportunity to make new friends and second family. Thanks to all my MPH family for
friendship, love and support. I learned, laughed, and created many wonderful memories with you
guys, and I am eternally grateful for that. Additionally, a special shout-out to my other amazing
outside-of-school friends – Sorna, Tahmin, Nazmun, Mou, Arup, Esha, Ruba, Rabeya - (too
many to list) for always inspiring and supporting me. I’m thankful to have you guys in my life.
v
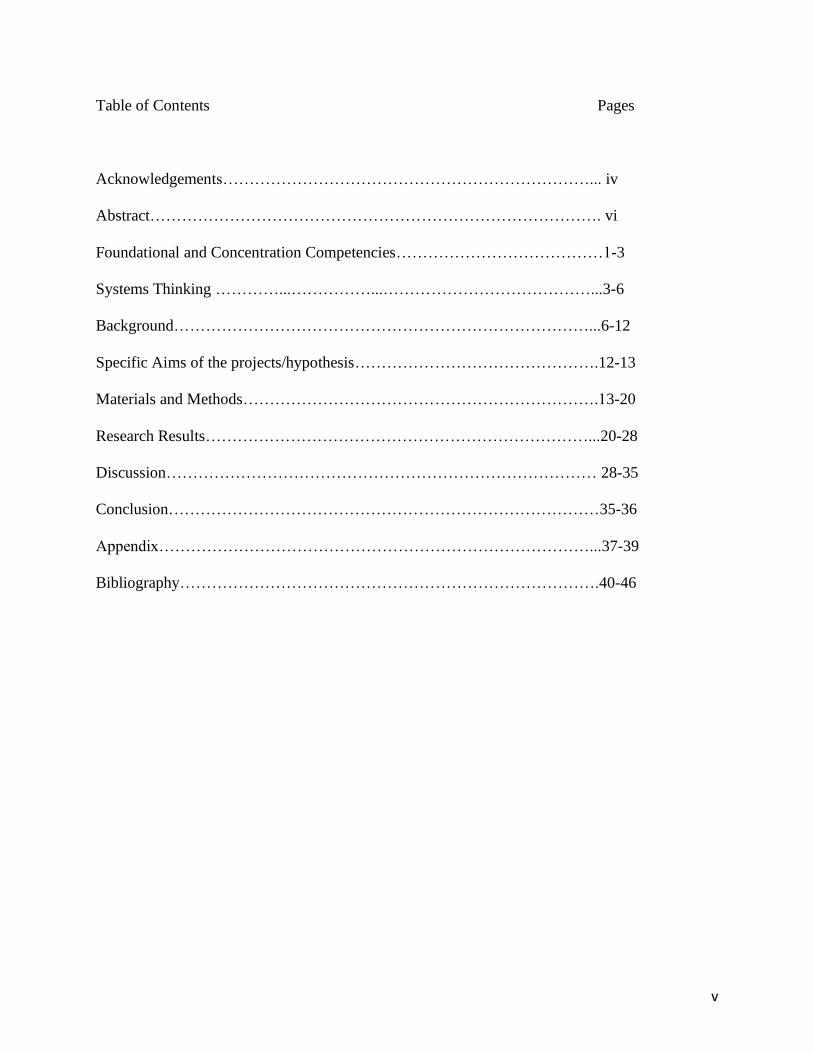
Table of Contents Pages
Acknowledgements……………………………………………………………... iv
Abstract…………………………………………………………………………. vi
Foundational and Concentration Competencies…………………………………1-3
Systems Thinking …………...……………...…………………………………...3-6
Background……………………………………………………………………...6-12
Specific Aims of the projects/hypothesis……………………………………….12-13
Materials and Methods………………………………………………………….13-20
Research Results………………………………………………………………...20-28
Discussion……………………………………………………………………… 28-35
Conclusion………………………………………………………………………35-36
Appendix………………………………………………………………………...37-39
Bibliography…………………………………………………………………….40-46
vi
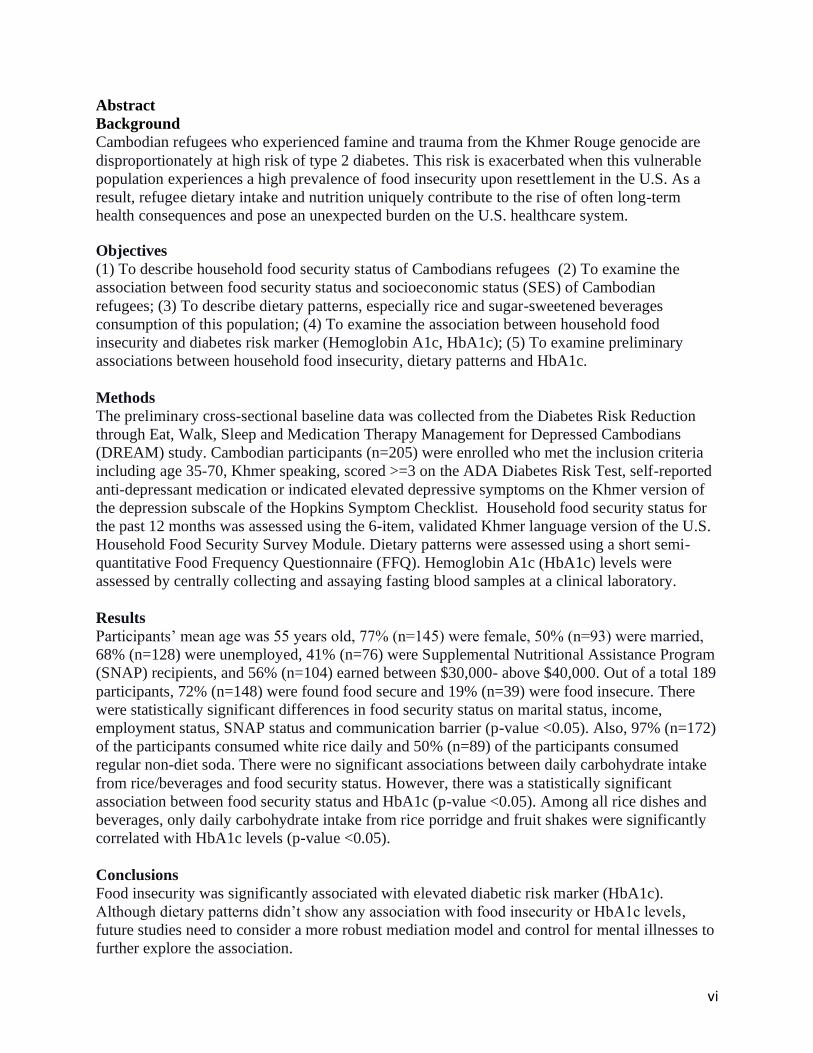
Abstract
Background
Cambodian refugees who experienced famine and trauma from the Khmer Rouge genocide are
disproportionately at high risk of type 2 diabetes. This risk is exacerbated when this vulnerable
population experiences a high prevalence of food insecurity upon resettlement in the U.S. As a
result, refugee dietary intake and nutrition uniquely contribute to the rise of often long-term
health consequences and pose an unexpected burden on the U.S. healthcare system.
Objectives
(1) To describe household food security status of Cambodians refugees (2) To examine the
association between food security status and socioeconomic status (SES) of Cambodian
refugees; (3) To describe dietary patterns, especially rice and sugar-sweetened beverages
consumption of this population; (4) To examine the association between household food
insecurity and diabetes risk marker (Hemoglobin A1c, HbA1c); (5) To examine preliminary
associations between household food insecurity, dietary patterns and HbA1c.
Methods
The preliminary cross-sectional baseline data was collected from the Diabetes Risk Reduction
through Eat, Walk, Sleep and Medication Therapy Management for Depressed Cambodians
(DREAM) study. Cambodian participants (n=205) were enrolled who met the inclusion criteria
including age 35-70, Khmer speaking, scored >=3 on the ADA Diabetes Risk Test, self-reported
anti-depressant medication or indicated elevated depressive symptoms on the Khmer version of
the depression subscale of the Hopkins Symptom Checklist. Household food security status for
the past 12 months was assessed using the 6-item, validated Khmer language version of the U.S.
Household Food Security Survey Module. Dietary patterns were assessed using a short semi-
quantitative Food Frequency Questionnaire (FFQ). Hemoglobin A1c (HbA1c) levels were
assessed by centrally collecting and assaying fasting blood samples at a clinical laboratory.
Results
Participants’ mean age was 55 years old, 77% (n=145) were female, 50% (n=93) were married,
68% (n=128) were unemployed, 41% (n=76) were Supplemental Nutritional Assistance Program
(SNAP) recipients, and 56% (n=104) earned between $30,000- above $40,000. Out of a total 189
participants, 72% (n=148) were found food secure and 19% (n=39) were food insecure. There
were statistically significant differences in food security status on marital status, income,
employment status, SNAP status and communication barrier (p-value <0.05). Also, 97% (n=172)
of the participants consumed white rice daily and 50% (n=89) of the participants consumed
regular non-diet soda. There were no significant associations between daily carbohydrate intake
from rice/beverages and food security status. However, there was a statistically significant
association between food security status and HbA1c (p-value <0.05). Among all rice dishes and
beverages, only daily carbohydrate intake from rice porridge and fruit shakes were significantly
correlated with HbA1c levels (p-value <0.05).
Conclusions
Food insecurity was significantly associated with elevated diabetic risk marker (HbA1c).
Although dietary patterns didn’t show any association with food insecurity or HbA1c levels,
future studies need to consider a more robust mediation model and control for mental illnesses to
further explore the association.
1
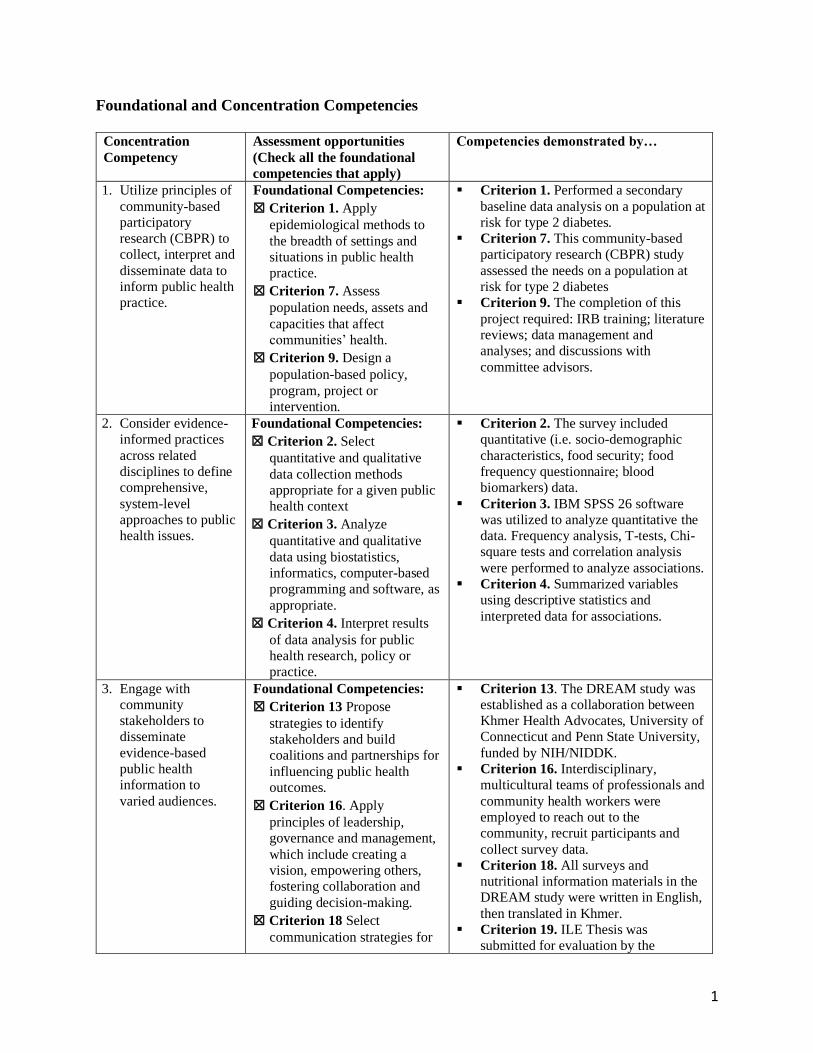
Foundational and Concentration Competencies
Concentration
Competency
Assessment opportunities
(Check all the foundational
competencies that apply)
Competencies demonstrated by…
1. Utilize principles of
community-based
participatory
research (CBPR) to
collect, interpret and
disseminate data to
inform public health
practice.
Foundational Competencies:
☒ Criterion 1. Apply
epidemiological methods to
the breadth of settings and
situations in public health
practice.
☒ Criterion 7. Assess
population needs, assets and
capacities that affect
communities’ health.
☒ Criterion 9. Design a
population-based policy,
program, project or
intervention.
▪ Criterion 1. Performed a secondary
baseline data analysis on a population at
risk for type 2 diabetes.
▪ Criterion 7. This community-based
participatory research (CBPR) study
assessed the needs on a population at
risk for type 2 diabetes
▪ Criterion 9. The completion of this
project required: IRB training; literature
reviews; data management and
analyses; and discussions with
committee advisors.
2. Consider evidence-
informed practices
across related
disciplines to define
comprehensive,
system-level
approaches to public
health issues.
Foundational Competencies:
☒ Criterion 2. Select
quantitative and qualitative
data collection methods
appropriate for a given public
health context
☒ Criterion 3. Analyze
quantitative and qualitative
data using biostatistics,
informatics, computer-based
programming and software, as
appropriate.
☒ Criterion 4. Interpret results
of data analysis for public
health research, policy or
practice.
▪ Criterion 2. The survey included
quantitative (i.e. socio-demographic
characteristics, food security; food
frequency questionnaire; blood
biomarkers) data.
▪ Criterion 3. IBM SPSS 26 software
was utilized to analyze quantitative the
data. Frequency analysis, T-tests, Chi-
square tests and correlation analysis
were performed to analyze associations.
▪ Criterion 4. Summarized variables
using descriptive statistics and
interpreted data for associations.
3. Engage with
community
stakeholders to
disseminate
evidence-based
public health
information to
varied audiences.
Foundational Competencies:
☒ Criterion 13 Propose
strategies to identify
stakeholders and build
coalitions and partnerships for
influencing public health
outcomes.
☒ Criterion 16. Apply
principles of leadership,
governance and management,
which include creating a
vision, empowering others,
fostering collaboration and
guiding decision-making.
☒ Criterion 18 Select
communication strategies for
▪ Criterion 13. The DREAM study was
established as a collaboration between
Khmer Health Advocates, University of
Connecticut and Penn State University,
funded by NIH/NIDDK.
▪ Criterion 16. Interdisciplinary,
multicultural teams of professionals and
community health workers were
employed to reach out to the
community, recruit participants and
collect survey data.
▪ Criterion 18. All surveys and
nutritional information materials in the
DREAM study were written in English,
then translated in Khmer.
▪ Criterion 19. ILE Thesis was
submitted for evaluation by the
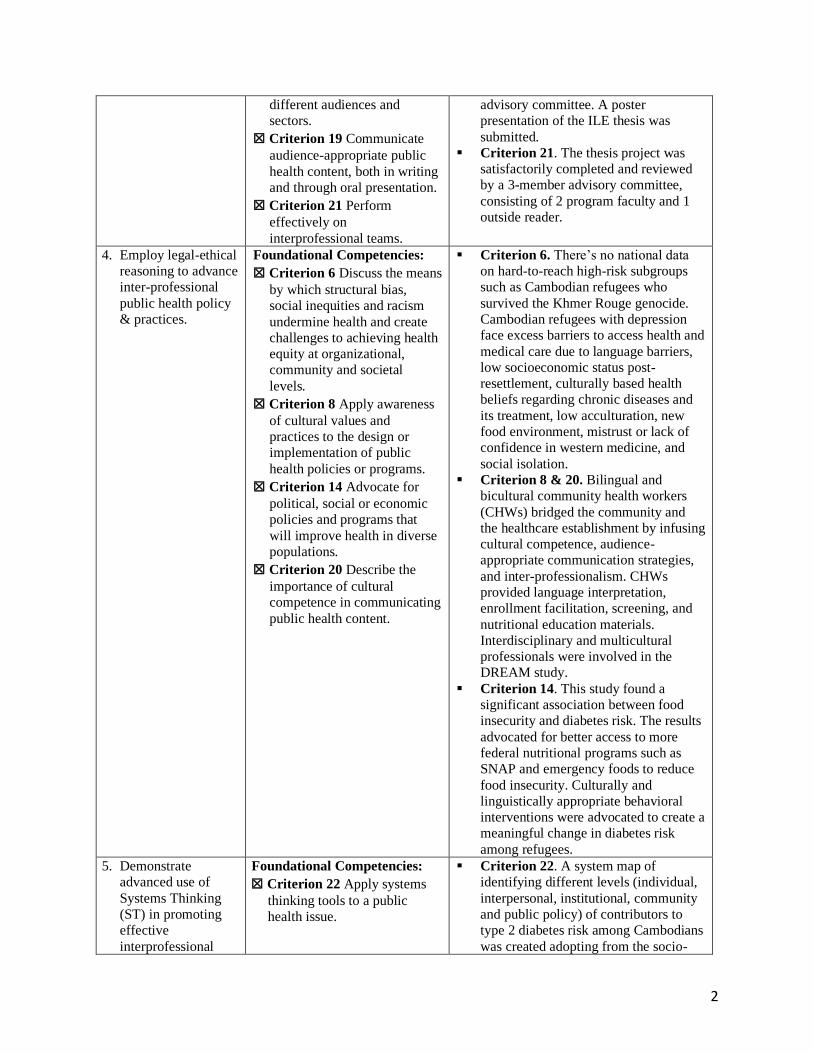
2
different audiences and
sectors.
☒ Criterion 19 Communicate
audience-appropriate public
health content, both in writing
and through oral presentation.
☒ Criterion 21 Perform
effectively on
interprofessional teams.
advisory committee. A poster
presentation of the ILE thesis was
submitted.
▪ Criterion 21. The thesis project was
satisfactorily completed and reviewed
by a 3-member advisory committee,
consisting of 2 program faculty and 1
outside reader.
4. Employ legal-ethical
reasoning to advance
inter-professional
public health policy
& practices.
Foundational Competencies:
☒ Criterion 6 Discuss the means
by which structural bias,
social inequities and racism
undermine health and create
challenges to achieving health
equity at organizational,
community and societal
levels.
☒ Criterion 8 Apply awareness
of cultural values and
practices to the design or
implementation of public
health policies or programs.
☒ Criterion 14 Advocate for
political, social or economic
policies and programs that
will improve health in diverse
populations.
☒ Criterion 20 Describe the
importance of cultural
competence in communicating
public health content.
▪ Criterion 6. There’s no national data
on hard-to-reach high-risk subgroups
such as Cambodian refugees who
survived the Khmer Rouge genocide.
Cambodian refugees with depression
face excess barriers to access health and
medical care due to language barriers,
low socioeconomic status post-
resettlement, culturally based health
beliefs regarding chronic diseases and
its treatment, low acculturation, new
food environment, mistrust or lack of
confidence in western medicine, and
social isolation.
▪ Criterion 8 & 20. Bilingual and
bicultural community health workers
(CHWs) bridged the community and
the healthcare establishment by infusing
cultural competence, audience-
appropriate communication strategies,
and inter-professionalism. CHWs
provided language interpretation,
enrollment facilitation, screening, and
nutritional education materials.
Interdisciplinary and multicultural
professionals were involved in the
DREAM study.
▪ Criterion 14. This study found a
significant association between food
insecurity and diabetes risk. The results
advocated for better access to more
federal nutritional programs such as
SNAP and emergency foods to reduce
food insecurity. Culturally and
linguistically appropriate behavioral
interventions were advocated to create a
meaningful change in diabetes risk
among refugees.
5. Demonstrate
advanced use of
Systems Thinking
(ST) in promoting
effective
interprofessional
Foundational Competencies:
☒ Criterion 22 Apply systems
thinking tools to a public
health issue.
▪ Criterion 22. A system map of
identifying different levels (individual,
interpersonal, institutional, community
and public policy) of contributors to
type 2 diabetes risk among Cambodians
was created adopting from the socio-
3
public health
programs and
policies.
ecological model. That concept map
illustrates different factors relevant to
prevent the future incidence of type 2
diabetes.
Systems Thinking
Although genetics, ethnicity, and an individual’s lifestyle can contribute to the
development of type 2 diabetes, it is a complex, multifaceted health issue that is influenced by
the social, cultural, and environmental factors as well. The ultimate goal is to prevent type 2
diabetes before it begins, especially among high-risk groups such as Cambodian refugees.
Prevention requires understanding the range of inter-related factors that put people at risk for
type 2 diabetes or protect them from developing type 2 diabetes. A general diabetes prevention
approach that only focuses on individualized strategies often fails in reaching high-risk
racial/ethnic minority groups. That is because most often, racial/ethnic minority groups such as
refugees cope with food insecurity that shapes their dietary intake, health-related behaviors and
ultimately contribute to diabetes. Therefore, a comprehensive approach using the socio-
ecological model is essential for examining interlinked influences at multiple levels.
The socio-ecological approach emphasizes the complexities and interdependencies
between socioeconomic, intrapersonal, behavioral, political, environmental, physiological, and
organizational determinants that influence the specific health outcome.46 The model thus offers
an integration of multiple levels of influence, which are defined as individual, interpersonal,
institutional, community, and public policy (societal) levels.46 This study uses the CDC’s
iteration of the socio-ecological model as a framework.12 It helps to identify various factors
across multiple levels that need to be acted upon simultaneously to prevent food insecurity and,
consequently, prevent type 2 diabetes among depressed Cambodian refugees. How factors at one
level influence factors at another level are illustrated in overlapping rings in the model below.
4
Figure: A socio-ecological model, applied to address food insecurity and type 2 diabetes risk
among Cambodian refugees with depression46
The first individual level identifies demographic and socioeconomic factors that increase
the likelihood of becoming food insecure and diabetic. Some of these factors include age,
gender, socioeconomic status (education, income), language barrier, mental illnesses such as
depression, trauma, the experience of past-starvation, diabetes risk (HbA1c), food nutrition
knowledge and skills and dietary patterns. Prevention at this level promotes strategies at the
individual level that prevent food insecurity. Specific approaches may include accessing
nutritional assistance and food programs, foods, nutrition and health programs, adult education
programs, job placement services, and low-cost healthy cooking recipes.

5
The second level examines intrapersonal relationships that may increase the risk of
experiencing food insecurity and type 2 diabetes. Household size and poverty level, household
food practices based on cultural traditions, friends, and social networks influence how refugees
cope with food insecurity and contribute to their health outcomes. Prevention strategies at this
level may include household-focused prevention programs such as adequate food assistance
programs for families, automatic eligibility to food assistance programs if enrolled in TANF or
SSI or general assistance, lending programs, low-budget healthy family meals recipes/cooking
classes, gardening tips and mentoring or peer programs to facilitate finding other communities.
The third level explores the institutions such as community organizations/centers,
temples, and food stores, which influence the degree to which people have access to healthy food
or influence cultural food traditions, norms, and values. Preventive strategies at this level involve
social and physical environments. Strategies can include more cultural food stores with fresh
produce and seasonal fruits, available transportation to supermarkets/farmer markets, fostering
formal and informal support/network organizations such as Khmer Health Advocate,
immigration/refugee alliances and temples, job training and job placement services, and
multilingual programs to help align their preferences with dietary guidelines.
The fourth level assesses social settings at the community level, such as workplaces and
neighborhoods. For example, having food desserts or more convenient stores/junk food stores
per area influences food choices among refugees coping with food insecurity. Strategies such as
reducing social isolation, increasing nutritious food retail options in low-income neighborhoods,
fostering public awareness programs, child and adult food program, summer food service
program, and community-based food nutritional assistance, and providing linguistically
appropriate nutrition information have the potential for broader community-level impact.
6
The fifth level looks at broader public policy at the societal level, including local, state,
and federal laws, policies, and programs. Substantial societal factors include the health,
economic, educational, and social policies that create food insecurity via economic inequalities.
In order to prevent food insecurity, making changes at this level is essential. Government and
policymakers need to reassess measures of poverty, ensure minimum wage, revise zoning laws to
include nutritious food retailers/supermarkets, establish national monitoring on nutrition, fund
research in food insecurity and diabetes interventions employing community health workers,
hold government agencies accountable for actively addressing disparities in food insecurity.
Additionally, prevention strategies can incorporate better access to the health care system for
immigrants and refugees, including more Medicaid coverage, food insecurity screening along
with diabetes screening, culturally competent provider/nutritionist, and health psychologists for
behavioral interventions. The Emergency Food Assistant Program (TEFAP) by the USDA, such
as food banks, food pantries, soup kitchens, and nutritional assistance programs such as SNAP,
WIC needs to be expanded. Lastly, more inclusive policies and programs for refugees are
necessary to reduce food insecurity in order to alleviate the burden of rising type 2 diabetes.
Background
Diabetes, a non-communicable multi-factorial chronic disease, has become a pandemic
with one of the most increased incidence rates in the U.S. The Centers for Disease Control and
Prevention (CDC) reported that diabetes affected about 30.3 million people of all ages or 9.4%
of the U.S. population in 2015 at the cost of more than $245 billion.12 Another 7.2 million people
or 23.8% of people with diabetes remain undiagnosed, while another 84.1 million adults 18 years
and older have prediabetes.12 This diabetes incidence rate is estimated to increase to 21-33% by
2050, which predicts an unsustainable burden on the economy, health expenditure, and quality of
7
life among the U.S. population.11 Diabetes also increases the risk of developing many other
diseases such as coronary heart disease, stroke, hypertension, depression, functional disability,
blindness, end-stage renal failure, and non-traumatic limb amputations.12
The increased prevalence of diabetes in recent years has been highly influenced by the
social determinants of health, especially food insecurity. Previous research on the relationship
between food insecurity and dietary patterns links food insecurity with a lower consumption of
healthy food groups and poor diet quality. Poor diet quality place an individual at risk for worst
health consequences.59 U.S. Department of Agriculture (USDA) defines food insecurity as a
“household-level economic and social condition of limited or uncertain access to adequate food”.
80 Food insecurity is often experienced by the low-income population as they struggle to buy
food amidst other necessary needs, such as medical care.8 In 2018, 11.1 percent or 14.3 million
U.S. households reported being food insecure.81 A study of Cambodian refugee women residing
in Lowell, MA found that 24% of Cambodian refugees experienced some levels of food
insecurity.52. In 2014, 43% of Cambodians in Connecticut reported running out of food “often”
or “sometimes in the past year.3 Limited financial resources steer these people to buy cheaper,
high-calorie foods with reduced intake of micronutrients, fruits, and vegetables and increased
consumption of simple carbohydrates. 38 It is well-demonstrated that higher carbohydrate diets
are linked to higher prevalence and incidence of type 2 diabetes.35 As a result, food insecurity is
increasing the risk of many food-related chronic diseases, including diabetes. A study in Canada
found that the risk of developing type 2 diabetes increased more than twice for individuals living
in a food-insecure household compared to an individual in a food secure household.74 Another
study from the National Health Examination and Nutrition Examination Survey (NHANES)
8
1999–2002 reported that food insecurity acted as a risk factor since food insecure people were
more likely to have diabetes than those without food insecurity.64
As the prevalence of diabetes and food insecurity problematically grows, almost all social
groups in the United States have been affected. However, low-income racial and ethnic minority
groups, especially resettled refugees, often endure a disproportionately higher rate of many
chronic diseases, including diabetes, compared to the US-born residents or first-generation
immigrants.32,51,88 Cambodian refugees were identified to have more than twice the rate of
diabetes (28%) relative to the age- and gender-adjusted U.S. population (12%).49
Refugees in America:
Refugees refer to "individuals who reside outside of their home country and are unable to
return home because of suffering, feared persecution, violence, or war”. 86 The United States
accounts for the largest refugee resettlement, admitting about 3,042,413 refugees and
permanently resettling nearly three-quarters of them from 1980 to 2018.17 Many refugees
resettled in the U.S. come from refugee camps and places where they experienced extreme
starvation or food deprivation due to war or genocide. The experience of hunger, starvation,
violence, stress, and war might have caused physiological damage, trauma, and chronic mental
health sequelae including depression, post-traumatic stress disorder, and social isolation for the
majority of these refugees.48 Many people with mental illness already have difficulty accessing
medical and mental healthcare in the U.S. Refugees with mental illness who are from
racial/ethnic minority groups face even more access challenges, including language barriers,
post-settlement socioeconomic status, culturally based health beliefs regarding mental illness and
its treatment, mistrust or lack of confidence in western medicine, and social isolation.90 In
conjunction to access challenges, acculturating to a new culture and food environment creates an
9
additional challenge for them to maintain a healthy lifestyle. As a result, refugees face
disproportionately higher rates of health-related problems such as obesity, hypertension, and
diabetes than other immigrant groups and native-born Americans.25,41 These challenges make
refugee post-settlement dietary intake and food adaption an under-investigated complex
phenomenon that uniquely contributes to the rise of often long-term health consequences and
pose an unexpected burden on the U.S. healthcare system. Limited research exists on the full
spectrum of refugee dietary intake and health outcomes post-resettlement in subsequent years,
especially those who previously experienced food deprivation, starvation, and malnutrition.
The Khmer Rouge Regime and Cambodian refugees in the U.S.:
Many studies suggest that experiences of trauma from past food deprivation or starvation
due to war/genocide impacted post-resettlement dietary intake among many refugee groups as
they also tend to financially for years in the new country.58,63 One of the prominent examples of
such refugees is Cambodians who survived genocide during the Khmer Rouge. The majority of
refugees from Cambodia suffered severe famine from 1975-1979 during the period of
Democratic Kampuchea (D.K.). The Khmer Rouge was the Communist Party in Kampuchea in
Cambodia. The Communist Party of Kampuchea (CPK) of Cambodia came into power by
defeating the Khmer Republic and established "Democratic Kampuchea" (D.K.), the official
government of Cambodia during the Cambodian civil war.16 This regime, led by Pol Pot from
1975-1979, sought to create a pure agrarian socialist nation that would be financially and
economically independent from the outside world by relying on agriculture, especially rice
production.16 Through enforcement of flawed agricultural policies, forced overwork in the rice
field, state expropriation of rice, and other policies such as the abolishment of private ownership
and communal eating to achieve absolute socialism, the CPK led the country to severe famine
10
and mass starvation.16 The Khmer Rouge regime created mass famine not only through extreme
policies but also through extreme violence and terror. The regime carried out mass
imprisonments, tortures, and killings of groups who were distrusted, and those who survived
were translocated, enslaved, and forced to work or starve to death on farms, making famine
especially dire to specific minority groups.26 Even acknowledging the existence of famine was
considered a crime, and anyone who opposed was arrested, tortured, and executed.26 The food
situation improved during the Vietnamese occupation of Cambodia, and for those who escaped
to the refugee camps in Thailand.26 However, eating patterns and dietary intake were disrupted
even in the refugee camps due to inadequate access and insufficient foods before some who
resettled as refugees in other countries.58 A large number of Cambodian refugees who were
survivors of the Khmer Rouge regime were resettled in the U.S. in the early 1980s.58 The
majority of them settled in California.63
As a result, food insecurity in the host countries, including the United States, can pose a
particular threat to such refugees who experienced high levels of trauma and starvation in their
home countries. Several studies demonstrate that people with a long-term experience of trauma,
starvation, or both developed harmful binge-eating habits and obsession with foods in abundant
access to the food environment, increasing the rates of risk factors of diabetes.58,61,71 History of
starvation and current high rates of food insecurity may trigger survival techniques such as food
hoarding or unsafe dietary intake habits among refugees, including Cambodian Americans. It
was reported that the Khmer Rouge regime forbade Cambodians to even consume their own rice
they produced, forcing them to survive on foods such tadpoles, small fish, or, bugs and nonfood
items including roots and grasses and punished them to death if they were caught stealing
foods.58 This experience of long food deprivation and trauma shaped dietary practices among
11
Cambodians long after their resettlement in a new country. Further, rice is a staple food and a
primary source of carbohydrate for Asian populations, especially for Cambodians.16 Due to years
of rice consumption practice long before and during the Khmer Rouge, Cambodians acquired a
preference for white rice over brown rice.58,59 It has been documented that brown rice was fed to
prisoners during the Khmer Rouge regime.16 Unfortunately, compared to brown rice, white rice
has a higher glycemic index, which is associated with an increased risk of type 2 diabetes.72,83
Mental illness such as depression is demonstrated to be a risk factor of diabetes by
worsening many lifestyle factors such as a healthy dietary pattern that include less consumption
of simple carbohydrates and lower levels of physical activity.62,70,87 Similar to other refugees,
Cambodian refugees who experienced trauma or starvation also developed many mental health
illnesses such as depression and post-traumatic stress disorder (PTSD) and thereby, are at high
risk of developing diabetes.42,53,87 A cross-sectional survey study of 136 Cambodian Americans
from Connecticut and Massachusetts in 2014 showed that 73% of Cambodian adults have
depression, post-traumatic stress disorder (PTSD) or both.9 A study comparing a probability
sample of US-residing Cambodian refugees (N=331) to a probability sample of the U.S.
population (N=6360) from the 2009-2010 National Health and Nutrition Examination Survey
revealed that the prevalence of diabetes among Cambodians was 28% significantly exceeding
other high-risk groups, including non-Hispanic blacks (12.7%) and Hispanics (12.1%).12,49
Rationale:
This paper aims to assess the association between food insecurity and diabetes risk
marker (HbA1c) among Cambodian refugees suffering from depression who survived the Khmer
Rouge genocide and are at risk of type 2 diabetes mellitus. The study also intends to explore the
socioeconomic status and dietary patterns and its association with household food security status
12
among this hard-to-reach, generally ignored, high-risk Cambodian communities. Generally, there
is no national data on subgroups. Several studies on the risk of diabetes among the Asian
population or refugees that exist are aggregated and, as a result, mask the burden of type 2
diabetes among high-risk non-Hispanic Asian subgroups. Knowledge and data on household
food insecurity, dietary patterns, and diabetes risk among Cambodians either as an Asian sub-
group or as a refugee subgroup are equally far understudied. More comprehensive data on the
burden of diabetes risk among Cambodian refugees can help prepare both clinicians and
community-based organizations to address the health concern impacting this population better.
This study can also enlighten refugee agencies, health programs, or policy approaches on how to
devote resources and implement culturally appropriate intervention programs strategically. Thus,
it can ensure successful acculturation to the U.S. food environment, long-term food security, and
better health outcomes of Cambodian refugees. The results can be applied to other refugees with
collective trauma histories and associated mental illnesses who face similar barriers to care. This
study explores whether a health disparity exists and addresses this critical gap in the literature.
Specific aims/hypotheses
The primary aims of the study are to (1) describe household food security status of
Cambodians refugees who suffered trauma and starvation during the Khmer Rouge genocide,
suffering from depression and elevated risk of diabetes; (2) examine the association between
household food security status and socioeconomic status (SES) of Cambodian refugees; (3)
describe dietary patterns, especially different rice dishes and sugar-sweetened beverages
consumption of this population; (4) examine the association between household food insecurity
and diabetes risk marker (HbA1c); and (5) assess preliminary associations between household
food insecurity, dietary patterns and diabetes risk marker (HbA1c) within the population.

13
Hypotheses:
H1: Food insecure group will have a different pattern of socioeconomic and demographic
characteristics compared to food secure group.
H2: Daily consumption patterns of carbohydrate-rich foods such as rice and sugar-
sweetened beverages in food insecure group will be different than food secure counterparts.
H3: Food insecure group will have higher HbA1c levels than food secure group.
H4: Daily carbohydrate intake from rice and beverages will exhibit an impact on HbA1c.
The study aims to analyze the preliminary cross-sectional baseline data results and explore these
specific aims to better understand many factors influencing the high risk of diabetes among
Cambodian refugees with depression.
Materials and Methods:
Sample and Setting:
For this study, the preliminary cross-sectional baseline data analyzed from a National
Institute of Diabetes and Digestive and Kidney Diseases (NIDDK) funded R01 study (PI: Julie
Wagner): Diabetes Risk Reduction through Eat, Walk, Sleep and Medication Therapy
Management for Depressed Cambodians (DREAM) study, listed at ClinicalTrials.gov as
NCT02502929. The DREAM study was established as a collaboration between the Khmer
Health Advocates (KHA), The University of Connecticut, and Penn State University. The Khmer
Health Advocates (KHA) is the national Cambodian health organization that assesses,
intervenes, and provides care for this hard-to-reach Cambodian refugee population from the
Khmer Rouge regime in Connecticut and Massachusetts. A sample of 205 Cambodian American
participants was recruited from Connecticut, Massachusetts, and Rhode Island. Participants were
enrolled by Community Health Workers (CHW) at three community agency sites of KHA’s
14
national network of community-based organizations including two community agency sites –
KHA in West Hartford CT, and the Center for Southeast Asians of Providence, RI.
DREAM Study’s Baseline Inclusion and Exclusion Criteria:
Participants were screened using a 3-Stage screening process that employed the screening
inclusion and exclusion criteria for each stage. Each stage was created to develop standardized
criteria for recruiting participants and screen out participants who did not meet the criteria.
Stage 1:
In stage 1 screening, community health workers (CHW) identified recruits through direct
outreach at community centers. Participants were screened for basic demographic and health
information. The inclusion criteria for stage 1 included someone who self-identified as
Cambodian or Cambodian American, age between 35-70, Khmer speaking, had no prior
diagnosis of diabetes at that time, had the ability to walk unassisted for at least 30 minutes
without stopping, could consume meals by mouth and could provide consent for themselves.
Participants who had a diagnosis of diabetes per self-report were excluded. When participants
screened out at stage 1, they were not enrolled in the study, but were given diabetes prevention
educational materials written in Khmer language from the National Diabetes Education Program.
Stage 2:
The participants who screened in stage 1 were recruited in stage 2 screening, where they
were interviewed at a place of their choices in a private room-either their homes or community
centers. Participants were assessed for diabetes risk using the ADA diabetes Risk Test and
assessed for depression eligibility using the Khmer version of the depression subscale of the
Hopkins Symptom Checklist and/or self-reported anti-depressant medication for the treatment of
depression. Those who scored >=3 that indicated elevated risk per ADA guidelines on the ADA

15
Diabetes Risk Test. To meet eligibility for depression, a recruit could either score =>26 (standard
cut off mean=1.75) on the 25 items Hopkins symptom Checklist met inclusion criteria for the
DREAM study and/or respond affirmatively that they were taking a prescription medication for
the treatment of depression.
Stage 2 screening exclusion criteria included: having thinking or memory problems (e.g.,
schizophrenia, dementia); had vision or hearing problems that would prevent participation in
group sessions; had been followed by a physician for any significant medical problems (e.g.,
heart attack in past 12 months, active cancer, HIV/AIDS, hepatitis); was enrollment in another
research study; had spent three consecutive days in a psychiatric hospital, or history of self-harm
in the past two years; and if a women, were pregnant or plans to become pregnant in the next 15
months at the time of data collection.
Stage 3:
Participants who satisfied the depression criteria in stage 2 by demonstrating elevated
depressive symptoms received Stage 3 screening, were assessed again using the Hopkins
Symptom Checklist one week later to confirm their evaluated depressive symptoms and screened
out those who had only temporary elevated symptoms. Those who scored =>26 (standard cut off
mean=1.75) again met eligibility and were included in the study. Participants without depression
were not eligible for the study. Then the approved recruits were socialized to the study by
CHWs, given time to consider participation, had their questions answered, showed a willingness,
and then invited to complete an informed consent form and the HIPAA authorization form in
English and Khmer according to IRB procedures.
Measures:
16
For this proposed sub-study, participants completed baseline survey assessments
regarding food insecurity, dietary patterns, and blood biomarkers.
The baseline survey questionnaire was developed in English, translated into Khmer by
the bilingual Study Coordinator, and then field tested in Connecticut with 5 individuals. Several
small changes were made to the translation, as slight rural variations on dialect existed.
However, no changes were made to the meaning/composition of any of the questions.
All assessment data were collected by bilingual, bicultural, community health workers at
home visits using REDCap.
Descriptive demographic, socioeconomic characteristics. Demographic information
including age, gender (male or female), marital status, language spoken (Khmer or English) was
obtained. Socioeconomic information included income, education, employment status, health
insurance (yes or no), transportation (can drive-yes/no and access to a car-yes/no), participants of
the Supplemental Nutrition Assistance Program (SNAP) benefits (yes or no) and difficulty
speaking or understanding a healthcare provider due to language barrier (yes or no).
Independent variable:
Food insecurity. Food insecurity was assessed for the past 12 months using the 6-item,
validated Khmer language, version of the U.S. Household Food Security Survey Module.60 The
short version of the food security scale surveys was used to save time since the individual
interview session already lasted approximately 2 hours. The six-item short form of the survey
was developed by the National Center for Health Statistics and found to have an overall 92%
sensitivity and 99.4% specificity in identifying food insecurity.10,82 According to the USDA, this
six-items short survey identified “food-insecure households and households with very low food
17
security with reasonably high specificity and sensitivity and minimal bias compared with the 18-
item measure”.82 A sample food security survey is provided in Appendix A.
The sum of affirmative responses to the six questions ranged from a score of (0-6). The
study dichotomized household food security status to two categories-food secure and food
insecure.7 Participants who scored equal to zero were considered as food secure (high food
security) and those who scored ≥1 were considered as food insecure (including marginal, low,
and very low food security).7
Dependent variable:
Hemoglobin A1c biological marker. The hemoglobin A1c (HbA1c) or glycated
hemoglobin is a form of a protein found in red blood cells that carries oxygen linked to
glucose.69 The HbA1c test is used to measure the average blood glucose level for the past two to
three months. The HbA1c is a reliable biomarker for blood glucose concentration, and thereby,
the HbA1c test is recommended to diagnose and monitor diabetes. 69 The HbA1c was measured
in the local Quest laboratory using High Pressure Liquid Chromatography (HPLC) and reported
according to National Glycemia Standardization Program (NGSP) guidelines. A HbA1c level of
higher than 6.4% was considered as diabetes, between 5.7% and 6.4% were considered
prediabetes and below 5.7% was considered normal.69 A sample HbA1c data collection form is
provided in Appendix B.
Dietary Patterns. Dietary consumption was assessed using a translated Khmer short
semi-quantitative Food Frequency Questionnaire (FFQ). The rice items were pilot-tested with the
study coordinator, community health workers, and the first 5 participants. The items on the food
frequency questionnaire food list were selected to include the principal sources of energy and
selected vitamins and minerals in the typical Cambodian diet, special attention to rice food items
18
frequency. The frequency of consumption and portion size of the food items was assessed over
the past 3 months’ timeframe. Culturally appropriate food models, a ruler and kitchen utensils
(measuring spoons, cups, and plates, bowls) were used to estimate portion sizes. A sample first
page of FFQ is provided in Appendix C.
Subject Compensation
Participants were compensated with a $20 worth of gift cards to a local pharmacy upon
completion of the baseline assessment.
Statistical Analyses
All statistical analyses and survey database management were done using IBM SPSS
(Version 23) software. For all tests, P < 0.05 was considered statistically significant. First,
descriptive statistics including mean, median, mode, standard deviation, sum, percentiles,
skewness, kurtosis, homoscedasticity were used to characterize the participants’ socioeconomic
characteristics. Characteristics with multiple categories including language spoken at home,
marital status, employment status, and income were dichotomized. T-tests were conducted to
determine the differences in means between continuous demographic/socioeconomic status
categories and categorical household food security status. Similarly, bivariate chi-square tests
were conducted to determine the difference between categorical demographic/socioeconomic
status categories and categorical household food security status.
Descriptive statistics were run to examine the frequency of different dietary patterns,
including various rice and beverages consumed in the past three months. Participants reported
consuming some form of rice and beverage daily; therefore, all rice consumption (white, brown,
mixed, sticky and rice porridge) and beverages consumption (regular non-diet soda, 100% fruit
juice, fruit shake, and other fruit drinks) were converted and reported as daily intake to examine
19
differences of consumption between food secure and food insecure individuals. Bivariate chi-
square tests were conducted to determine differences between categorical rice/ beverage
categories and categorical household food security status.
Daily total carbohydrates from rice (grams) and beverages (grams) were calculated using
the ESHA’s Food Processor® Nutrition Analysis software. Culturally appropriate portion sizes
were used to calculate carbohydrates from rice and beverages consumption. For example, one
small bowl of rice (white, brown, mixed, sticky, and rice porridge) was equal to one standard cup
of cooked rice, one medium bowl of rice was equal to three standard cups of cooked rice, and
one large bowl was equal to five standard cups of cooked rice. For the beverages, one small cup
of beverages (regular non-diet soda, 100% fruit blend, fruit shake, and other fruit drinks) was
equal to 12 oz, one medium cup of beverages was equal to 16 oz., and one large cup was equal to
26 oz. Grams of carbohydrates from one small, medium, and large bowls of rice (white, brown,
mixed, sticky, and rice porridge) were calculated using the ESHA software and multiplied by the
number of times the participants consumed them daily to get total daily carbohydrates from rice.
For the beverages, grams of carbohydrates from portion sizes (one small, medium, and large cup)
were calculated and multiplied by the number of times the participants consumed them daily to
get total daily grams of carbohydrates from beverage consumption. T-tests were conducted to
determine the differences in continuous total daily grams of carbohydrates from rice
dish/beverages consumption between food secure and food insecure individuals.
T-test was used to compare food-secure with food-insecure groups on the A1c biological
marker. A test for normality, Q-Q plot and histograms showed that HbA1c levels were normally
distributed but daily carbohydrate intake from rice and beverages was not normally distributed.
Therefore, Spearman’s Correlations were conducted to determine an association between total
20
grams of carbohydrates from different rice and beverages and hemoglobin A1c (HbA1c). In this
sub-study, “dietary intakes/grams of carbohydrates” were compared to both household food
security status and hemoglobin A1c levels to explore the preliminary association between food
insecurity, dietary patterns/behaviors, and HbA1c levels.
Results
Although the baseline sub-study initially had 205 participants, data from four participants
were excluded due to their updated diabetic status, two participants did not answer/refused to
answer, and about 16 participant’s data were missing dietary data, leaving 189 participants for
the final analysis. Based on the cross-sectional baseline data, 187 participants (91%) out of a
total number of 189 participants were born in Cambodia and reported living in the Khmer Rouge
regime for 3.23±1.14 years. All participants except one reported living in a refugee camp for 3.0
±5.12 years.
1) Household food security status and demographic characteristics of Cambodian refugees:
Table 1 describes the demographic and socioeconomic characteristics of the studied
sample. The table shows that the mean age of the participants was 55 years and had a mean of 7
years of education. 77% (n= 145) were female, 50% (n= 93) were married, 87% (n=162) spoke
Khmer at home and 44% (n= 82) expressed difficulty speaking or understanding a health care
provider due to language barrier. Among socioeconomic characteristics, 68% (n=128) were
unemployed and 44% (n=59) earned less than $20000 to $30000 annually, 41% (n=76) reported
receiving SNAP benefits and 75% (n=140) had access to a car. Surprisingly, 95% (n=178) of the
participants reported having health insurance.
(2) Sample characteristics by household food security status:
21
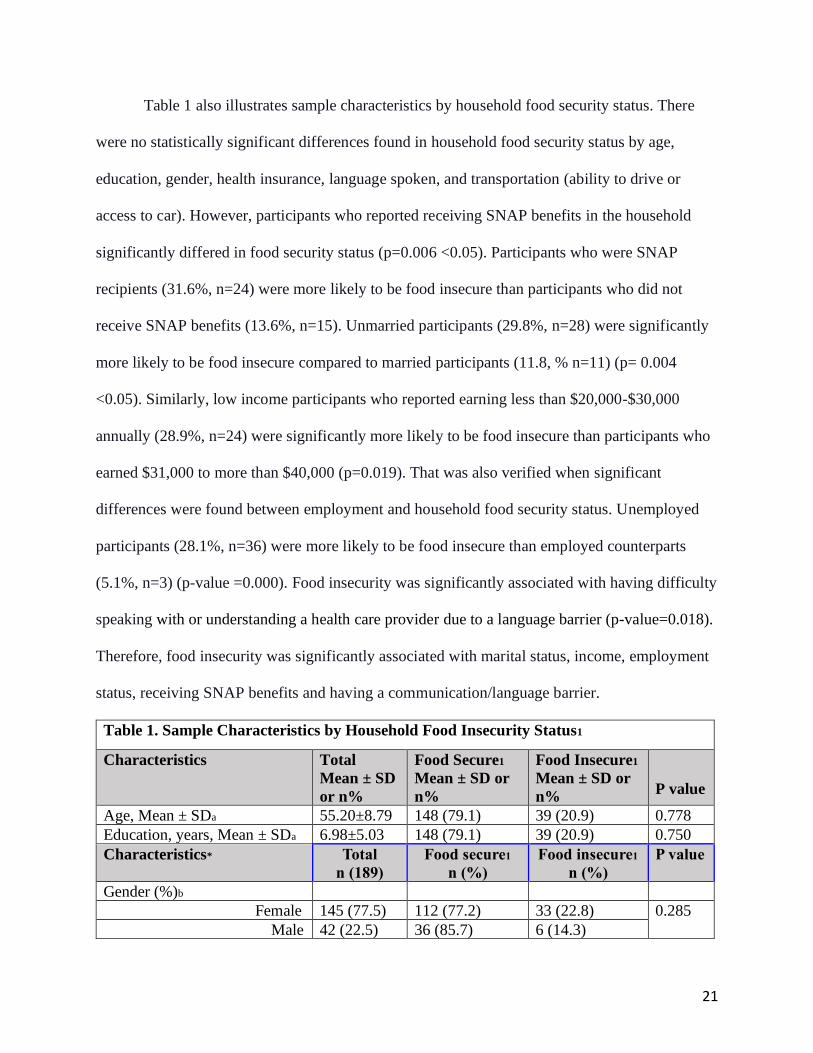
Table 1 also illustrates sample characteristics by household food security status. There
were no statistically significant differences found in household food security status by age,
education, gender, health insurance, language spoken, and transportation (ability to drive or
access to car). However, participants who reported receiving SNAP benefits in the household
significantly differed in food security status (p=0.006 <0.05). Participants who were SNAP
recipients (31.6%, n=24) were more likely to be food insecure than participants who did not
receive SNAP benefits (13.6%, n=15). Unmarried participants (29.8%, n=28) were significantly
more likely to be food insecure compared to married participants (11.8, % n=11) (p= 0.004
<0.05). Similarly, low income participants who reported earning less than $20,000-$30,000
annually (28.9%, n=24) were significantly more likely to be food insecure than participants who
earned $31,000 to more than $40,000 (p=0.019). That was also verified when significant
differences were found between employment and household food security status. Unemployed
participants (28.1%, n=36) were more likely to be food insecure than employed counterparts
(5.1%, n=3) (p-value =0.000). Food insecurity was significantly associated with having difficulty
speaking with or understanding a health care provider due to a language barrier (p-value=0.018).
Therefore, food insecurity was significantly associated with marital status, income, employment
status, receiving SNAP benefits and having a communication/language barrier.
Table 1. Sample Characteristics by Household Food Insecurity Status1
Characteristics Total
Mean ± SD
or n%
Food Secure1
Mean ± SD or
n%
Food Insecure1
Mean ± SD or
n%
P value
Age, Mean ± SDa 55.20±8.79 148 (79.1) 39 (20.9) 0.778
Education, years, Mean ± SDa 6.98±5.03 148 (79.1) 39 (20.9) 0.750
Characteristics* Total
n (189)
Food secure1
n (%)
Food insecure1
n (%)
P value
Gender (%)b
Female 145 (77.5) 112 (77.2) 33 (22.8) 0.285
Male 42 (22.5) 36 (85.7) 6 (14.3)
22
Marital Status (%)b
Yes 93 (49.7) 82 (88.2) 11 (11.8) 0.004
No 94 9 (50.3) 66 (70.2) 28 (29.8)
Income (%)b
Less than $20,000-$30,000 83 (44.4) 59 (71.1) 24 (28.9)
0.019 $31,000-above $40,000 104 (55.6) 89 (85.6) 15 (14.4)
Employment Status (%)b
Employed 59 (31.6) 56 (94.9) 3 (5.1) 0.000
Unemployed 128 (68.4) 92 (71.9) 36 (28.1)
Health Insurance
Yes 178 (95.2) 142 (79.8) 36 (20.2) 0.398
No 9 (4.8) 6 (66.7) 3 (33.3)
SNAP Recipient (%)b
Yes 76 (40.9) 52 (68.4) 24 (31.6) 0.006
No 110 (59.1) 95 (86.4) 15 (13.6)
Language spoken at home (%)b
Khmer 162 (86.6) 127 (78.4) 35 (21.6) 0.608
English 25 (13.4) 21 (84) 4 (16)
Communication: difficulty
speaking with or understanding
a health care provider due to
language barrier? (%)b
Yes 82 (43.9) 58 (70.7) 24 (29.3) 0.018
No 105 (56.1) 90 (85.7) 15 (14.3)
Transportation (%)b
Can you drive?
Yes 144 (77) 114 (79.2) 30 (20.8) 0.989
No 43 (23) 34 (79.1) 9 (20.9)
Access to a car?
Yes 140 (74.9) 114 (81.4) 26 (18.6) 0.214
No 47 (25.1) 34 (72.3) 13 (27.7)
Values are presented either in means ± SDs or n (%). Percentages for Total Participants in each
socioeconomic status category, Food Secure and Food Insecure are calculated horizontally
within each row.
1Three people answered “didn’t know” or refused to answer to several of the Food Security
Survey Module items, therefore, were excluded from final analyses, totals, horizontally, may be
off by n=1, n=2, n=3a,b
*Data only available for categorical demographic/socioeconomic status characteristics, n=189
aT-tests were conducted to determine the differences in means between continuous
demographic/socioeconomic status categories and categorical household food security status.
b Chi-square tests were conducted to determine difference between categorical
demographic/socioeconomic status categories and categorical household food security status
23
(3) Dietary patterns of Cambodian refugees:
Table 2 and Table 3 show daily dietary (rice and beverages) consumption patterns of the
participants. As demonstrated in Table 2, 97.2% (n=172) of the participants consumed white
rice, 76% (n=133) of the participants consumed rice porridge, and 46.3% (n=82) of the
participants consumed sticky rice daily as compared to only 24.9% (n=44) consumed brown rice,
and 13% (n=23) consumed mixed rice. There were no statistically significant differences in food
security status by consumption of all rice dishes (all p-values >0.05).
1Two people answered “didn’t know” or refused to answer to several of the Food Security
Survey Module items, therefore, were excluded from final analyses, totals, horizontally, may be
off by n=1, n=2a
*Data only available for: White rice, n=177; Brown rice, n=177; Mixed rice, n=177, Rice
Porridge, n=175; Sticky rice, n=177
a Chi-square tests were conducted to determine differences between categorical rice categories
and categorical household food security status.
Table 3 shows that about 50% of the participants consumed regular non-diet soda
(50.3%, n=89) and 100% fruit blend juice (54%, n=95). Fruit shakes (Taro Bubble Tea) and
other fruit drinks (Grass Jelly Drink) were not as popular as 24.9% (n=50) of the participants
Table 2. Daily Rice Consumption Patterns by Household Food Insecurity Status1
Rice Dish* Total
n (%)
Food secure1
n (%)
Food insecure1
n (%)
P value
White Rice a
Yes 172 (97.2) 136 (79.1) 36 (20.9) 0.156
No 4 (2.3) 3 (75.0) 1 (25.0)
Brown Rice a
Yes 44 (24.9) 36 (81.8) 8 (18.2) 0.510
No 131 (74.4) 101 (77.1) 30 (22.9)
Mixed Rice a
Yes 23 (13.0) 19 (82.6) 4 (17.4) 0.147
No 153 (86.4) 119 (77.8) 34 (22.2)
Rice Porridge a
Yes 133 (76.0) 103 (77.4) 30 (22.6) 0.159
No 41 (23.4) 33 (80.5) 8 (19.5)
Sticky Rice a
Yes 82 (46.3) 65 (79.3) 17 (20.7) 0.163
No 94 (53.1) 73 (77.7) 21 (22.3)
24
consumed fruit shakes, and 35.2% (n=62) consumed other fruit drinks. Also, there were no
statistically significant differences in food security status by consumption of different sugar-
sweetened beverages (all p-values >0.05).
Table 3. Sugar-Sweetened Beverages Consumption Patterns by Household Food Security
Status1
Beverage* Total
n (178)
Food Secure1
n (%)
Food Insecure1
n (%)
P value
Regular Non-Diet Soda a
Yes 89 (50.3) 68 (76.4) 21 (23.6) 0.374
No 88 (49.7) 70 (79.5) 18 (20.5)
100% Fruit Blend Juice a
Yes 95 (54.0) 76 (80.0) 19 (20.0) 0.354
No 81 (46.0) 62 (76.5) 19 (23.5)
Fruit Shakes (Taro Bubble
Tea) a
Yes 50 (24.9) 37 (74.0) 13 (26.0) 0.272
No 127 (62.0) 101 (79.5) 26 (20.5)
Other Fruit Drinks (Grass
Jelly Drink) a
Yes 62 (35.2) 48 (77.4) 14 (22.6) 0.532
No 114 (64.8) 89 (78.1) 25 (21.9)
1Two people answered “didn’t know” or refused to answer to several of the Food Security
Survey Module items, therefore, were excluded from final analyses, totals, horizontally, may be
off by n=1, n=2a
*Data only available for: Regular non-diet soda, n=178; 100% Fruit Blend Juice, n=178; Fruit
Shakes (Taro Bubble Tea), n=178; Other Fruit Drinks (Grass Jelly Drink), n=177
a Chi-square tests were conducted to determine difference between categorical sugar-sweetened
beverages categories and categorical household food security status.
(4) Diabetes risk marker (HbA1c) by household food security status:
Table 4 displays the association between hemoglobin A1c and household food security
status. The normal HbA1c level was <5.7, prediabetes was 5.7 to 6.4, and diabetes was >6.4.
Food insecure participants had an average HbA1c that approached the pre-diabetic range (5.67 ±
0.49) compared to food secure participants who had an average HbA1c that was normal (5.46 ±
0.41) (p = 0.006). Thus, the result reveal that household food security status was significantly
associated with HbA1c.
25
Table 4. Hemoglobin A1c by Household Food Security Status Association1
Total
(Mean ±
SD)
Food Secure
(Mean ± SD)
Food Insecure
(Mean ± SD)
P value
Hemoglobin A1ca 5.5± 0.44 5.46 ± 0.41 5.67 ± 0.49 0.006
aT-tests were conducted to determine the differences in means between continuous Hemoglobin
A1c and categorical household food security status.
(5) Daily carbohydrate intake from diet, household food security status, and hemoglobin A1c:
Table 5, 6 and 7 present daily carbohydrate intakes from rich dishes and sugar-sweetened
beverages by household food security status. Table 5 includes daily carbohydrate intake from
rice dishes. The mean daily carbohydrate intakes were 131.4 grams (SD =73.4) for white rice,
119.3 grams (SD =64.4) for brown rice, 130.7 grams (SD = 67.4) for mixed rice, 94.4 grams
(SD= 40.1) for rice porridge, and 57.6 grams (SD= 75.1) for sticky rice. There were no
statistically significant differences in food security status by daily carbohydrate intake from
individual rice dishes or combined rice dishes (all p-values >0.05).
Table 5. Daily Carbohydrate Intake from Rice by Household Food Insecurity Status1
Rice Dish Total (Mean ± SD) a Food Secure1
(Mean ± SD)
Food Insecure1
(Mean ± SD)
P
value
White Ricea 131.4 ± 73.4 128.2 ± 70.2 143.4 ± 84.3 0.277
Brown Ricea 119.3 ± 64.4 124.8 ± 65.9 94.2 ± 56.9 0.265
Mixed Ricea 130.7 ± 67.4 139.4 ± 68.6 93.0 ± 54.2 0.233
Rice Porridgea 94.4 ± 40.1 96.0 ± 39.9 86.0 ± 40.4 0.197
Sticky Ricea 57.6 ± 75.1 62.1 ± 82.6 41.8 ± 35.7 0.314
Combined Rice Dishesa
(White, Brown, Mixed,
Sticky and Rice
Porridge)
270.9 ± 161.5 274.8 ± 165.8 256.7 ± 145.5 0.547
Values are presented in means ± SDs. Four people were found diabetes, therefore, were
excluded from final analyses.
1Two people answered “didn’t know” or refused to answer to several of the Food Security
Survey Module items, therefore, were excluded from final analyses, totals, horizontally, may be
off by n=1, n=2a
aT-tests were conducted to determine the differences in means between continuous total daily
grams of carbohydrates from rice dish and categorical household food security status.
26
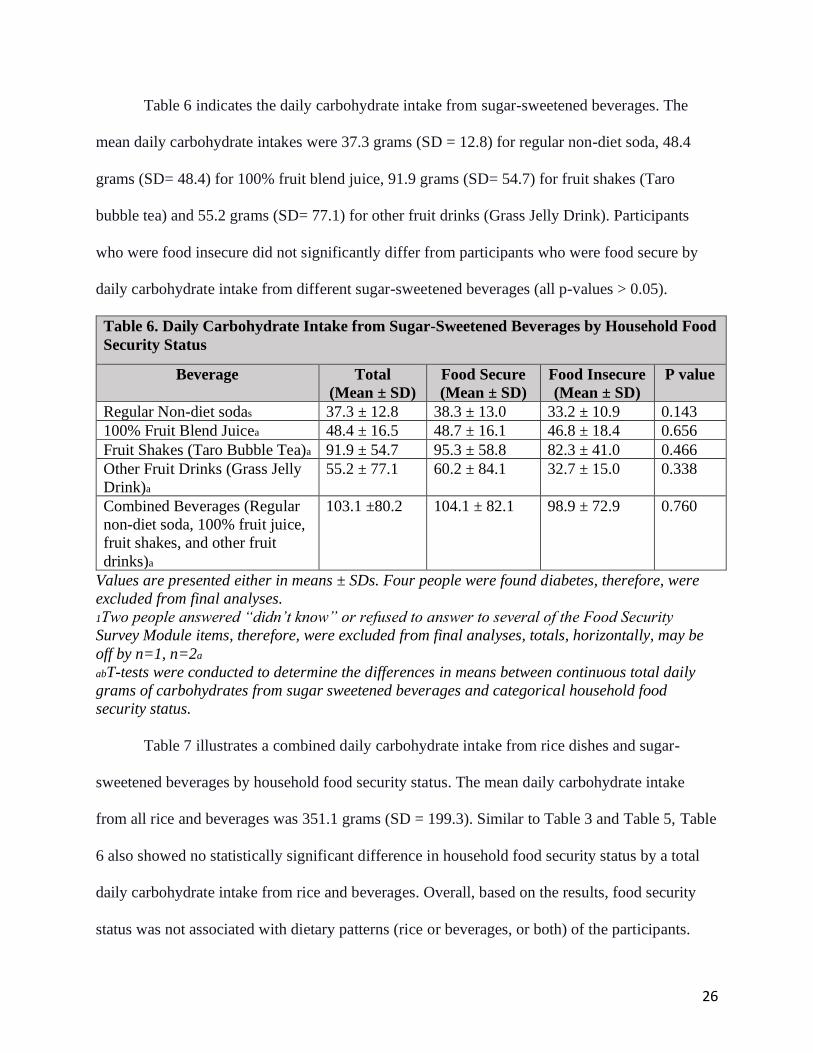
Table 6 indicates the daily carbohydrate intake from sugar-sweetened beverages. The
mean daily carbohydrate intakes were 37.3 grams (SD = 12.8) for regular non-diet soda, 48.4
grams (SD= 48.4) for 100% fruit blend juice, 91.9 grams (SD= 54.7) for fruit shakes (Taro
bubble tea) and 55.2 grams (SD= 77.1) for other fruit drinks (Grass Jelly Drink). Participants
who were food insecure did not significantly differ from participants who were food secure by
daily carbohydrate intake from different sugar-sweetened beverages (all p-values > 0.05).
Table 6. Daily Carbohydrate Intake from Sugar-Sweetened Beverages by Household Food
Security Status
Beverage Total
(Mean ± SD)
Food Secure
(Mean ± SD)
Food Insecure
(Mean ± SD)
P value
Regular Non-diet sodas 37.3 ± 12.8 38.3 ± 13.0 33.2 ± 10.9 0.143
100% Fruit Blend Juicea 48.4 ± 16.5 48.7 ± 16.1 46.8 ± 18.4 0.656
Fruit Shakes (Taro Bubble Tea)a 91.9 ± 54.7 95.3 ± 58.8 82.3 ± 41.0 0.466
Other Fruit Drinks (Grass Jelly
Drink)a
55.2 ± 77.1 60.2 ± 84.1 32.7 ± 15.0 0.338
Combined Beverages (Regular
non-diet soda, 100% fruit juice,
fruit shakes, and other fruit
drinks)a
103.1 ±80.2 104.1 ± 82.1 98.9 ± 72.9 0.760
Values are presented either in means ± SDs. Four people were found diabetes, therefore, were
excluded from final analyses.
1Two people answered “didn’t know” or refused to answer to several of the Food Security
Survey Module items, therefore, were excluded from final analyses, totals, horizontally, may be
off by n=1, n=2a
abT-tests were conducted to determine the differences in means between continuous total daily
grams of carbohydrates from sugar sweetened beverages and categorical household food
security status.
Table 7 illustrates a combined daily carbohydrate intake from rice dishes and sugar-
sweetened beverages by household food security status. The mean daily carbohydrate intake
from all rice and beverages was 351.1 grams (SD = 199.3). Similar to Table 3 and Table 5, Table
6 also showed no statistically significant difference in household food security status by a total
daily carbohydrate intake from rice and beverages. Overall, based on the results, food security
status was not associated with dietary patterns (rice or beverages, or both) of the participants.

27
Table 7. Daily Carbohydrate Intake from Rice and Sugar-Sweetened Beverages by
Household Food Security Status1
Total
(Mean ± SD)
Food Secure
(Mean ± SD)
Food Insecure
(Mean ± SD)
P value
Combined ricea
-White Rice
- Brown Rice
- Mixed Rice
-Sticky Rice
-Rice Porridge and
Combined Beverages
-100% Fruit Juice
-Regular Non-diet Soda
-Fruit Shakes
-Other Fruit Drinks
351.1 ±199.3 356.3± 202.0 331.6±190.4 0.503
1Four people were found diabetes, therefore, were excluded from final analyses, totals,
horizontally
aT-tests were conducted to determine the differences in means between continuous total daily
carbohydrates from dietary (all rice and sugar-sweetened beverages/items) characteristics and
categorical household food security statu
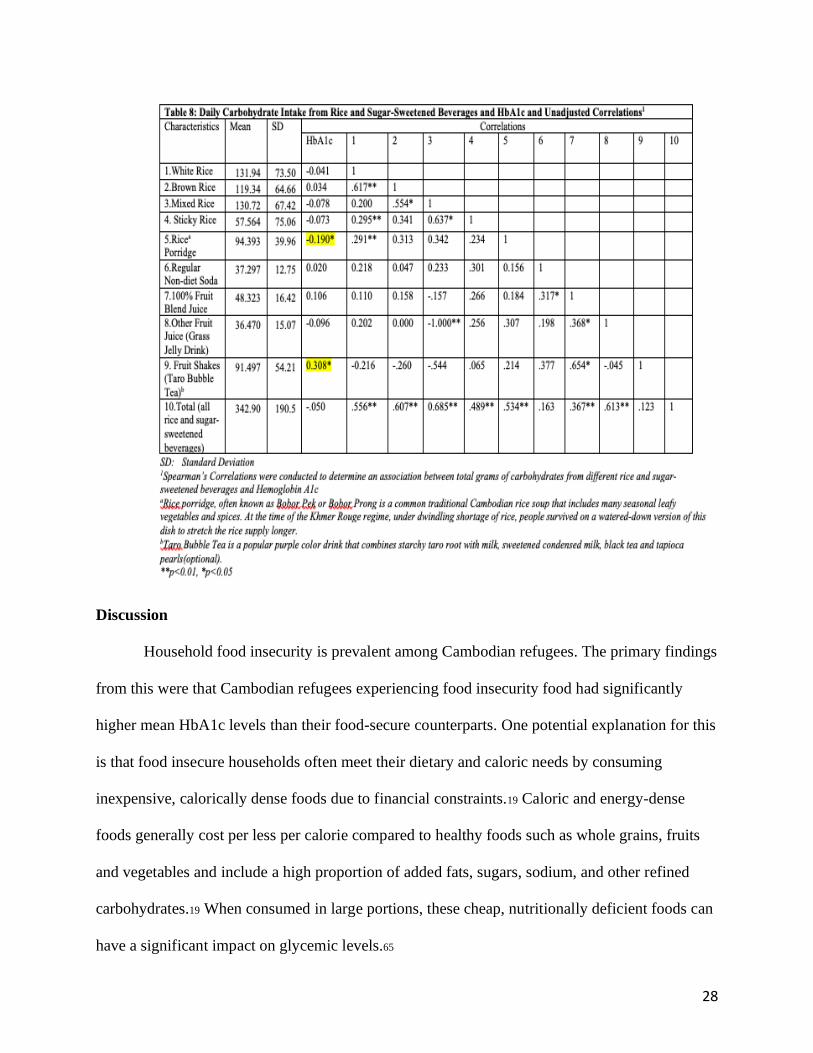
Table 8 analyzes unadjusted correlations between daily carbohydrate intake from rice
and sugar-sweetened beverages and HbA1c. Out of all food items, only daily carbohydrate intake
from rice porridge and fruit shakes (taro bubble tea) were significantly correlated with HbA1c
levels (p <0.05). Daily carbohydrate intake from rice porridge was negatively correlated with
HbA1c levels (-0.19) and daily carbohydrate intake from fruit shakes (Taro bubble tea) was
positively correlated with HbA1c levels (0.31). All other rice dishes, including white, brown,
mixed, and sticky, had a non-significant weak correlation with HbA1c level (-0.04, 0.03, -0.08,
and -0.07 respectively, all p-values >0.05). Similarly, all sugar-sweetened beverages including
regular non-diet soda, 100% fruit blend juice, and other fruit drinks (Grass Jelly Drink) also had
a weak non-statistically significant correlation with HbA1c (0.02, 0.11, and -0.1) respectively, all
p-values >0.05).
28
Discussion
Household food insecurity is prevalent among Cambodian refugees. The primary findings
from this were that Cambodian refugees experiencing food insecurity food had significantly
higher mean HbA1c levels than their food-secure counterparts. One potential explanation for this
is that food insecure households often meet their dietary and caloric needs by consuming
inexpensive, calorically dense foods due to financial constraints.19 Caloric and energy-dense
foods generally cost per less per calorie compared to healthy foods such as whole grains, fruits
and vegetables and include a high proportion of added fats, sugars, sodium, and other refined
carbohydrates.19 When consumed in large portions, these cheap, nutritionally deficient foods can
have a significant impact on glycemic levels.65
29
Food insecurity also tends to be a cyclic phenomenon with recurrent periods of food
scarcity before having adequate food for a few weeks.66 This anticipation of cyclic food scarcity
is stressful, accompanied with mental distress may trigger refugees who experienced past-
starvation and lead to overconsume when plenty of foods is available.66 Binge-eating can
contribute to the accumulation of excess abdominal fat and insulin resistance, consequently
result in increased HbA1c levels.66 This study is one of the few studies to assess the difference in
HbA1c level by household food security status among Cambodian refugees who had mental
illnesses such as depression, had a high risk of developing diabetes and had experiences of
trauma and starvation from the Khmer Rouge regime. The results are consistent with other
literature on other minority groups who face similar barriers as well.
Household food security status demonstrated to have associations with several other
demographic and socioeconomic characteristics of Cambodian refugees, including marital status,
income, employment status, SNAP recipient, and communication barrier. The sample in this sub-
study was mostly women, and many of them were single or widowed due to the deliberate killing
of men during the Khmer Rouge genocide.14 Cambodian refugees who were unmarried or single,
especially women, were significantly likely to be food insecure compared to those who were
married. Women have more difficulty in accessing financial sources such as jobs, fair wages,
equal pay, credits, lands, and services.36 It is especially difficult for single women or a single
mother or widowed woman since they tend to suffer much greater financial and economic
instability as their role of solo earners, caregivers, and preparers of food of the family.36
Socioeconomic hardships place single women at a heightened risk of experiencing food
insecurity and negatively affect dietary outcomes, including high intakes of carbohydrates and a
lower intake of fruits, vegetables, and macro and micronutrients.37,75 A mother’s entrance into
30
marriage or cohabitation was found to reduce food insecurity in Hispanic households due to
improved economic and familial stability.34 The experience of food insecurity increases the risk
of being overweight or obese in women, which is a risk factor of type 2 diabetes.40
Among other socioeconomic (SES) characteristics, the study found an association
between household food insecurity and income, employment as well as receiving SNAP benefits.
One of the critical components of these SES is income, which is a strong predictor of food
insecurity.29 In this study, low-income, unemployed, and SNAP recipients were more likely to be
food insecure compared to their high-income, employed, and non-SNAP recipient counterparts.
Income in these households often falls below the federal official poverty line was found to be
significantly associated with household food insecurity.15 More than half of the participants
stated being unemployed that most likely explained almost half of the participants’ household
was earning a low income (most cases below the federal poverty line) and receiving SNAP
benefits. Employment often provides improved access to credit, prescription drug, and dental
insurance, reducing household expenses, which can allow allocating more money for food.45
Food insecurity results from these inadequate economic or financial resources that limit the
access to purchase sufficient, nutritious foods. As potential coping strategies, food-insecure
households may overconsume low-cost, high-energy, nutritionally deficient foods to avoid
hunger or develop binge eating habits when food is plentiful during the SNAP (Food Stamp)
cycle.19,20 They generally consume fewer fruits, vegetables, and protein.36 These dietary practices
can contribute to weight gain and obesity and eventually increase susceptibility to type 2
diabetes.4,56,84 Other studies also identified low socioeconomic status (SES) as a risk factor of
type 2 diabetes.23,39,75 Many low-income neighborhoods only have access to convenience stores
with energy-dense foods (e.g., canned, pre-cooked) or fast food options.65 Many low-income
31
households with food insecurity also rely on free food available at food banks, soup kitchens, or
drop-in meals where they have limited control over foods.65 Hence, accessing nutritious foods
and maintaining a healthy dietary regimen necessary to diabetes prevention is extremely
challenging while coping with food insecurity. The episodical food restriction, along with the
replacement of a healthy diet with a high carbohydrate and empty calorie-rich diet, can severely
impair an individual’s capacity to manage blood sugar levels and increase the risk of developing
type 2 diabetes in food-insecure low-income individuals.19,3378
This study presented a strong association between difficulty speaking with or
understanding the healthcare provider and household food security status. Cambodian
participants who had difficulty speaking with or understanding the healthcare provider (almost
all spoke Khmer at home) were more likely to be food insecure than participants who spoke
English. Difficulty speaking with or understanding the healthcare provider is quite prevalent
among immigrants/refugees. It is indicative of a language barrier or limited English proficiency,
or low acculturation.67 One of the possible explanations for this result may be difficulties
navigating the American food environment and lack of nutrition information due to a language
barrier. Despite the abundance of foods, many refugees feel uncomfortable with the American
pasteurized, packaged foods, and unfamiliarity/lack of vegetables and seasonal fruits.5 Therefore,
they tend to adhere to familiar foods in cultural food stores, which are likely more expensive due
to limited food items, making households more food insecure.5 A language barrier can also
impede income, job opportunities, access to care, and nutritional knowledge. Unfamiliarity with
American foods coupled with low socioeconomic status, language barrier, and food insecurity
perhaps influence post-settlement dietary patterns for refugees with higher past food-deprivation.
As a result, they face an increased risk of obesity, leading to diabetes.83
32
The preliminary findings from this study found no significant associations between daily
rice and beverage consumption patterns and household food insecurity status. Although daily
carbohydrate intake from rice among food insecure households remained high despite small
sample, the difference in daily carbohydrates intake was not statistically significant. One of the
possible explanations of this result maybe is the secondary nature of data analyses and the low
sample size in the food insecure group. Descriptive results indicated a strong tie to native
Cambodian foods and traditional diet. In Southeast Asia, especially in Cambodia, rice is an
everyday staple food in the diet, and other rice dishes such as rice porridge, sticky rice is
consumed frequently.21,58 Almost all of the participants in the study reported eating white rice
daily, while more than half of them consumed rice porridge and sticky rice daily. One qualitative
study exploring lower dietary quality among immigrants and refugees in the U.S. quoted a
Cambodian participant, “Some [of us] prefer Asian food just because [we] are used to eating it
and feel like it stays in the stomach longer. Whereas, if you eat American food, you eat for a
little bit, and you feel hungry again.” on the barrier to healthy eating.77 The transmission of
cultural eating practices such as higher refined grain consumption such as white rice may be
related to an increased risk of type 2 diabetes.35 A higher intake of rich in high-fiber whole grains
such as brown rice has shown an association with favorable glycemic control and lower risk of
type 2 diabetes, but not with a refined grain such as white rice.44 This finding is a concern for the
Cambodian refugees as whole-grain consumption was low among the participants. Since rice is
very culturally important in Cambodian culture and something that most people would eat daily
due to familial traditional eating practices, the study did not seem to find any significant
difference in daily carbohydrate intake from rice consumption by household food security
status.59,77The risk of food insecurity among Cambodians is shown to increase with higher

33
acculturation of foods.59,60 Since participants were older and showed lower acculturation of
foods; daily carbohydrate intake did not make a significant difference between food secure and
insecure groups.
The non-significant difference between household food security status and the patterns of
sugar-sweetened beverages or daily carbohydrate intake from beverages might be a result of no
change in consumption of high-status and frequently consumed foods in Cambodia such as fruits,
meats, and soft drinks after U.S. resettlement because of a preference for traditional diets.73
Participants who consumed regular non-diet soda were likely to be food insecure than those who
did not consume regular non-diet soda; however, the result was not significant. Due to low
acculturation to the U.S. food environment among the participants, Cambodians arriving in the
1990s and 2000s might mostly have stuck to the familiar foods and beverages from the
Cambodian stores in the U.S. rather than consuming general sweet-sweetened beverages
available in the U.S. supermarkets.60 Many Cambodian refugees used to own rice paddy lots and
vegetable gardens in Cambodia, they might have preferred drinking fresh fruit juices and shakes
made from seasonal fresh fruits and vegetables rather than consuming unfamiliar packaged
beverages found at American supermarkets.73
The study also investigated the relationship between daily carbohydrate intake from rice
and sugar-sweetened beverages and HbA1c levels. Daily carbohydrate intake from all food items
yielded a negligible association with hemoglobin A1c levels, except rice porridge and bubble tea.
Higher consumption of rice porridge was significantly associated with the lower mean of HbA1c.
Rice porridge, often known as “Bobor Pek” or “Bobor Prong,” is mainly linked to the Khmer
Rouge regime when almost every Cambodians were only given rations of thin, watery rice soup
with a few grains and very little to no meat.16 Hence, it may be less carbohydrate-dense and

34
reduced in calorie compared to regular white rice for an equivalent volume of food. Low
carbohydrate food has a low glycemic index, which can improve glycemic control and, thus, can
show a beneficial effect on diabetes.89 However, the result must be interpreted with caution as it
may only be applicable to watered-down version of rice porridge with no protein eaten at the
time of Khmer Rouge, not to rice porridge found in America. As all of the participants of this
study lived through the Khmer Rouge, and practice habitual traditional diets, it is not surprising
that rice porridge still is commonly eaten as a breakfast food among Cambodians and more
participants experiencing food insecurity reported eating it.58,77 White rice is most commonly
eaten among almost all Cambodians regardless of all socioeconomic status and household food
security status.58,60 Therefore, the possibility of increased HbA1c levels due to daily consumption
of white rice may be approximately equal for both food-secure and insecure participants,
resulting in a non-significant association. However, high consumption of rice porridge among
participants may be a result of developing eating habits due to forced food restrictions and
starvation during the Khmer Rouge, and hence, found to have a significant association with
HbA1c levels. It is most likely specific to Cambodians who survived the Khmer Rouge genocide,
not to all Cambodians or Cambodian Americans.
Higher consumption of fruit shakes, especially taro bubble tea, was associated with
higher HbA1c. It is possibly attributed to the excess of sugar used in bubble teas. Taro bubble tea
is a calorically-dense purple drink that contains starchy taro root with milk, sweetened condensed
milk, black tea, and tapioca pearls.68 Tapioca pearls are not high in calories but they typically
soaked in a sugar mixture for bubble teas.68 Bubble tea also contains sweetened condensed milk,
which is loaded with sugar as well. When milk tea combined with sweetened condensed milk
and tapioca pearls in bubble teas, it becomes one of the primary sources of rapidly absorbable
35
carbohydrates such as various forms of sugar.47 When consumed in large quantities, bubble tea
can contribute to dietary glycemic index load, leading to inflammation and insulin resistance and
eventually type 2 diabetes, independently of obesity.47
Study Limitations and Next Steps
Small Sample Size. Although the baseline sub-study initially had 205 participants, only
189 participants were available for data analyses. With decreasing sample size, the power of the
study decreased too, which might have contributed to Type II errors. Further, the sample size for
food secure and food insecure groups was vastly disproportional, which might have enhanced the
inability to find significant associations between household food security status and dietary
patterns of Cambodian refugees.
Cross-Sectional Study. We employed a secondary analysis of cross-sectional data, and
thus, we cannot establish temporal precedence or causality. Prospective studies would better
describe the temporal sequencing of household food insecurity and diabetes risk.
Selection Criteria. This sub-study is part of a larger intervention study. One of the
inclusion criteria for the larger study was screening positive for depressive symptoms.
Depressive symptoms are known to have associations with food insecurity, hemoglobin A1c
levels, dietary patterns, and thus, poor health outcomes. 42,53,85,87 Multivariate logistic regression
analysis needs to be performed to control for mental illnesses such as depressive and trauma in
the future to establish real associations between variables. Besides, the results may not be
generalizable to Cambodians who do not have depressive or trauma symptoms.
Conclusion
The experience of genocide and starvation creates a unique set of long-term health effects
for survivors. The experience of food deprivation coupled with high rates of mental illness and
36
post-settlement food insecurity with low acculturation in the host country lead refugees to adopt
harmful eating behaviors that contribute to increasing their risk of developing chronic health
conditions such as weight, obesity, and diabetes. To date, relatively little research attention has
been paid to the extent of chronic disease risk, such as diabetes-related to food insecurity among
this population. Food insecurity is associated with clinical indicators of diabetes, including
higher mean HbA1c levels, and a dramatic increase in the prevalence of both has become a
public health crisis in the United States. Given the national priority of eliminating health
disparities, uncovering the burden of food insecurity and chronic diseases related to unhealthy
dietary patterns of post-resettlement refugees in the United States is necessary. The results of
Cambodian refugees’ studies may also apply to other refugees.
The rise of the prevalence of type 2 diabetes of refugees also poses a significant burden
on the health care system. More attention needs to be devoted to documenting the mental and
chronic health needs of Cambodians and other minority refugee groups. Physicians who treat
chronic diseases such as diabetes need to be aware of the patient’s history of food deprivation,
trauma, and cultural diet aspects while proposing dietary changes as an intervention. If possible,
dietary interventions for refugees who experienced starvation or trauma due to war needs to be
culturally appropriate, empathetic, and relevant to improving their quality of life. Policies to
improve access to consistent, safe, nutritious, and culturally appropriate healthy foods through
financial empowerment, education, and resources need to be considered as a priority in the
healthcare system to improve the health outcome of high diabetes risk communities. More
systematic measures need to be employed to identify food-insecure households in the healthcare
system and assess effective strategies for low income high-risk racial/ethnic communities to
achieve culturally appropriate, healthier diets.
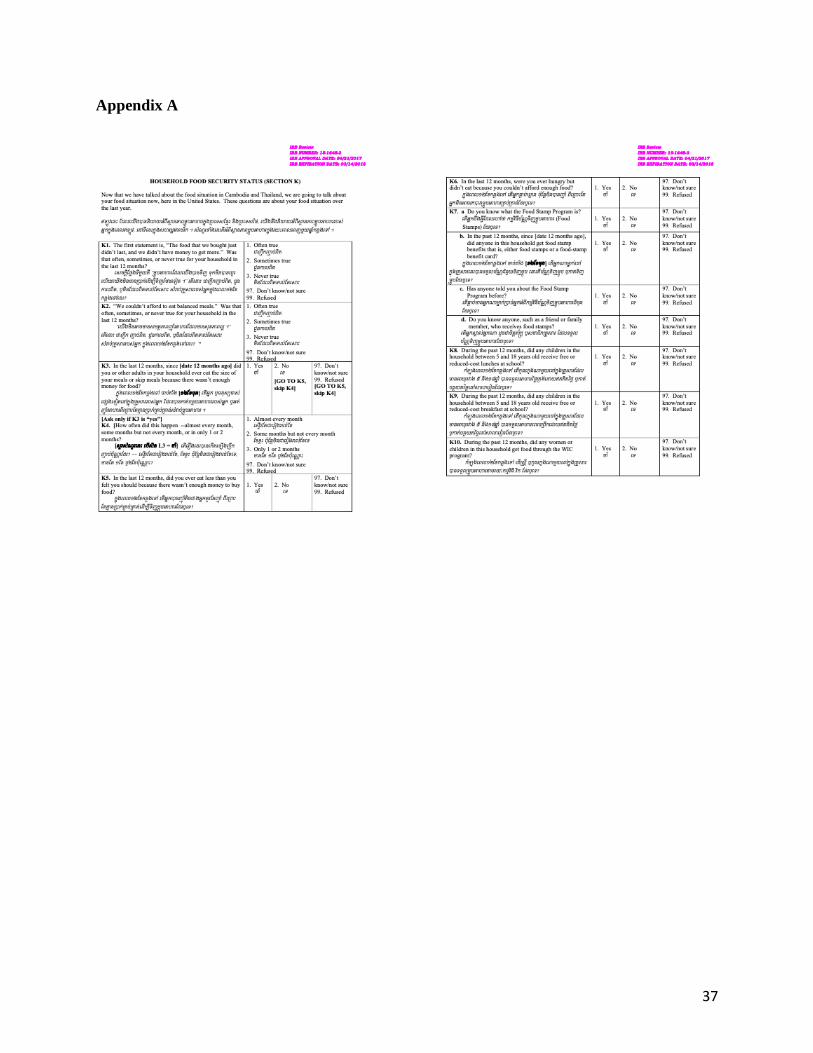
37
Appendix A
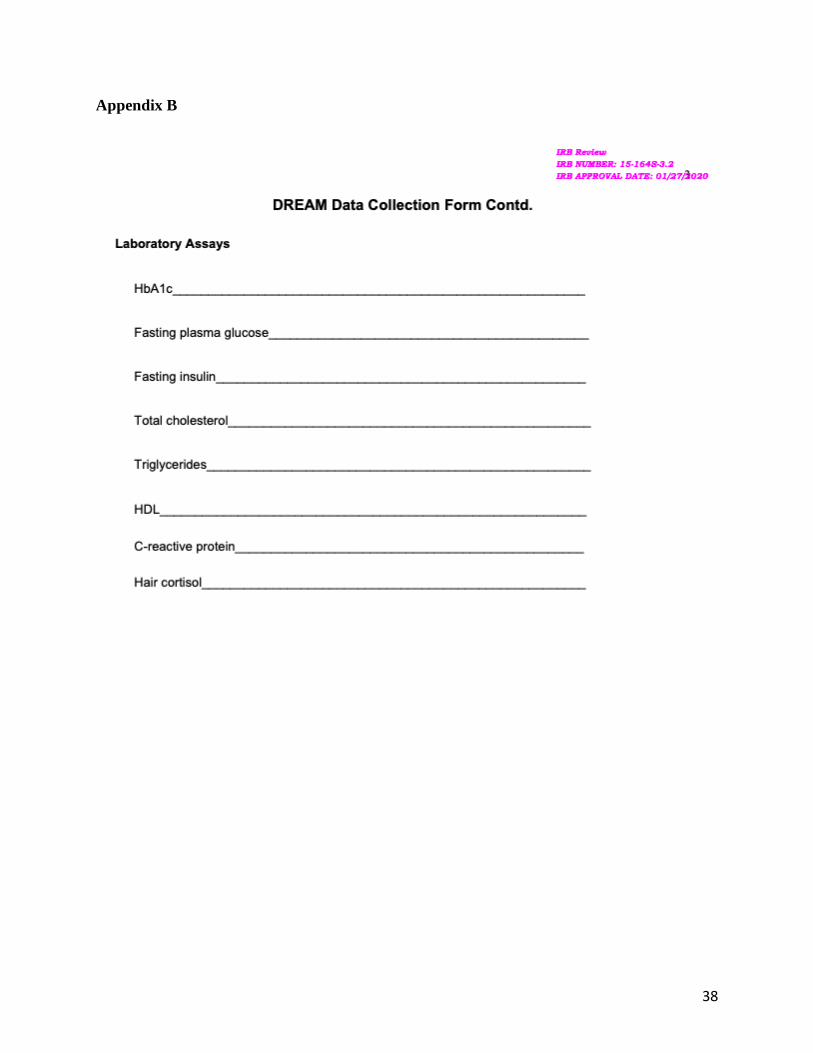
38
Appendix B

39
Appendix C
40
Bibliography
1) Alfawaz, H. N.-D. (2019). Improvements in Glycemic, Micronutrient, and Mineral Indices in
Arab Adults with Pre-Diabetes Post-Lifestyle Modification Program. Nutrients. 11(11),
2775. doi: 10.3390/nu11112775.
2) Alhazmi, A., Stojanovski, E., McEvoy, M., & Garg, M. (2012, August). Macronutrient
intakes and development of type 2 diabetes: a systematic review and meta-analysis of cohort
studies. Journal of the American College of Nutrition, 31(4), 243-258.
3) Asian Pacific American Affairs Commission. (2014). CT Asian Pacific American Community
Needs Assessment. Retrieved from asianamerican.uconn.edu:
https://asianamerican.uconn.edu/faculty/courtesy-faculty/ego/ct-asian-pacific-american-
community-needs-assessment/
4) Bawadi, H.A., Ammari, F., Abu-Jamous, D., Khader, Y.S., Bataineh, S., &Tayyem, R.F.
(2012). Food insecurity is related to glycemic control deterioration in patients with type 2
diabetes. Clinical Nutrition, 31(2), 250-254. doi: 10.1016/j.clnu.2011.09.014.
5) Beatriz, C. B., Sherry, S., & Alexandra, M. (2011). 'You get the quickest and the cheapest
stuff you can': Food security issues among low-income earners living with diabetes. The
Australasian medical journal, 4(12), 683–691. doi: 10.4066/AMJ.20111104.
6) Becerra, M. B., Mshigeni, S. K., & Becerra, B. J. (2018). The Overlooked Burden of Food
Insecurity among Asian Americans: Results from the California Health Interview Survey.
International journal of environmental research and public health, 15(8), 1684. doi:
10.3390/ijerph15081684
7) Bermúdez-Millán, A., Pérez-Escamilla, R., Segura-Pérez, S., Damio, G., Chhabra, J.,
Osborn, C. Y., & Wagner, J. (2016). Psychological Distress Mediates the Association
between Food Insecurity and Suboptimal Sleep Quality in Latinos with Type 2 Diabetes
Mellitus. The Journal of nutrition, 146(10), 2051–2057. doi:10.3945/jn.116.231365.
8) Berkowitz , S., Seligman , H., & Choudhry , N. (2014). Treat or Eat: Food Insecurity, Cost-
related Medication Underuse, and Unmet Needs. The American Journal of Medicine, 127(4),
303–310. doi: 10.1016/j.amjmed.2014.01.002 .
9) Berthold, S., Mollica, R., Kuoch, T., Scully, M., & Franke, T. (2014). Comorbid Mental and
Physical Health and Health Access in Cambodian Refugees in the US. Journal of Community
Health, 39(6), 1045-1052. doi: 10.1007/s10900-014-9861-7.
10) Blumberg, S. J., Bialostosky, K., Hamilton, W. L., & Briefel, R. R. (1999). The effectiveness
of a short form of the Household Food Security Scale. American journal of public health,
89(8), 1231–1234. https://doi.org/10.2105/ajph.89.8.1231.
11) Boyle, J. P., Thompson, T. J., Gregg, E. W., Barker, L. E., & Williamson, D. F. (2010).
Projection of the year 2050 burden of diabetes in the US adult population: dynamic modeling
of incidence, mortality, and prediabetes prevalence. Population health metrics, 8, 29.
https://doi.org/10.1186/1478-7954-8-29
12) Centers for Disease Control and Prevention, U.S. Department of Health and Human Services,
National Center for Health Statistic. (2017). Prevalence of Obesity Among Adults and Youth:
United States, 2015–2016. Retrieved from NCHS Data Brief| No. 288:
https://www.cdc.gov/nchs/data/databriefs/db288.pdf
13) Centers for Disease Control and Prevention, National Center for Injury Prevention and
Control, Division of Violence Prevention. (2020). The Social-Ecological Model: A
41
Framework for Prevention. Retrieved from cdc.gov:
https://www.cdc.gov/violenceprevention/publichealthissue/social-ecologicalmodel.html
14) Chen, S. (2004). Survivors Cambodian refugees in the United States. Chicago: University of
Illinois Press.
15) Coleman-Jensen, A., Nord, M., & Singh, A. (2013). Household Food Security in the United
States in 2012. Washington, DC: Economic Research Service, U.S. Department of
Agriculture
16) Defalco, R. (2013-2014). Justice and Starvation in Cambodia: The Khmer Rouge Famine.
Retrieved from The Cambodia Law and Policy Journal: http://cambodialpj.org/article/justice-
and-starvation-in-cambodia-the-khmer-rouge-famine/
17) Department of Homeland Security, Office of Immigration Statistics. (2018). Yearbook of
Immigration Statistics 2018. Retrieved January 2020, from dhv.gov:
https://www.dhs.gov/immigration-statistics/yearbook/2018
18) Dharod, J., Croom, J., & Sady, C. (2011). Dietary Intake, Food Security, and Acculturation
Among Somali Refugees in the United States: Results of a Pilot Study. Journal of Immigrant
& Refugee Studies, 9(1), 82-97. doi: 10.1080/15562948.2011.547827.
19) Dinour, L., Bergen, D., & Yeh, M.-C. (2007). The Food Insecurity–Obesity Paradox: A
Review of the Literature and the Role Food Stamps May Play. Journal of the Academy of
Nutrition and Dietetics, 107(11), 1952–1961. doi: 10.1016/j.jada.2007.08.006.
20) Drewnowski, A., & Specter, S. (2005). Poverty and obesity: the role of energy density and
energy costs. The American Journal of Clinical Nutrition, 79(1), 6–16, doi:
10.1093/ajcn/79.1.6.
21) Edelstein, S. (2010). Food, Cuisine, And Cultural Competency For Culinary, Hospitality,
And Nutrition Professionals. Jones and Bartlett Learning.
22) Fitzgerald, N., Hromi-Fiedler, A., Segura-Pérez, S., & Pérez-Escamilla, R. (2011). Food
insecurity is related to increased risk of type 2 diabetes among Latinas. Ethnicity & disease,
21(3), 328–334.
23) Furness, B., Simon, P., Wold, C., & Asarian-Anderson, J. (2004). Prevalence and predictors
of food insecurity among low-income households in Los Angeles County. Public Health
Nutrition, 7(6), 791-794. doi:10.1079/PHN2004608
24) Gibson, R. (2005). Principles of Nutrition Assessment. New York: Oxford University Press. 25) Grigg-Saito, D., Och, S., Liang, S., Toof, R., & Silka, L. (2008). Building on the strengths of
a Cambodian refugee community through community-based outreach. Health Promotion
Practice. 9(4), 415–425. doi: 10.1177/1524839906292176
26) Gruspier, K. & Pollanen, M. S. (2017). Forensic Legacy of the Khmer Rouge: The
Cambodian Genocide. Academic forensic pathology, 7(3), 415–433. doi:10.23907/2017.035.
27) Gucciardi, E., Vogt, J., DeMelo, M., & Stewart, D. (2009). Exploration of the relationship
between household food insecurity and diabetes in Canada. Diabetes Care, 32(12), 2218-
2224. doi: 10.2337/dc09-0823. 28) Gucciardi, E., Vahabi, M., Norris, N., Del Monte, J. P., & Farnum, C. (2014). The
Intersection between Food Insecurity and Diabetes: A Review. Current nutrition reports,
3(4), 324–332. doi: 10.1007/s13668-014-0104-4.
29) Gundersen, C., Kreider, B., & Pepper, J. (2011). The Economics of Food Insecurity in the
United States. Applied Economic Perspectives and Policy, 33(3), 281–303, doi:
10.1093/aepp/ppr022.
42
30) Hadley, C., Zodhiates, A., & Sellen, D. (2007). Acculturation, economics and food insecurity
among refugees resettled in the USA: A case study of West African refugees. Public Health
Nutrition, 10(4), 405-412. doi:10.1017/S1368980007222943
31) Hanson, K., Sobal, J., & Frongillo, E. (2007). Gender and Marital Status Clarify Associations
between Food Insecurity and Body Weight. The Journal of Nutrition, 137(6), 1460–1465,
doi: 10.1093/jn/137.6.1460.
32) Hebrank , K., Graber, L., Sullivan, M.-C., Chen, I., & Gupta, J. (2012). High Prevalence of
Chronic Non-Communicable Conditions Among Adult Refugees: Implications for Practice
and Policy. Journal of Community Health, 37(5), 1110-1118. doi:10.1007/s10900-012-9552-
1.
33) Heflin, C., Siefert, K., & Williams, D. (2005). Food insufficiency and women's mental
health: findings from a 3-year panel of welfare recipients. Social Science & Medicine, 61(9),
1971-1982. doi: 10.1016/j.socscimed.2005.04.014.
34) Hernandez, D., & Pressler, E. (2012). Maternal Union Transitions and Household Food
Insecurity: Differences by Race and Ethnicity. SAGE Journals, 34(3), 373-393. doi:
10.1177/0192513X12449134.
35) Hu,E.A., Pan,A., Malik,V., &Sun, Q. (2012). White rice consumption and risk of type 2
diabetes: meta-analysis and systematic review. BMJ, 344, e1454. doi: 10.1136/bmj.e1454.
36) Ivers, L. C., & Cullen, K. A. (2011). Food insecurity: special considerations for women. The
American journal of clinical nutrition, 94(6), 1740S–1744S. doi:10.3945/ajcn.111.012617.
37) Johnson, C. M., Sharkey, J. R., Lackey, M. J., Adair, L. S., Aiello, A. E., Bowen, S. K.,
Fang, W., Flax, V. L., & Ammerman, A. S. (2018). Relationship of food insecurity to
women's dietary outcomes: a systematic review. Nutrition reviews, 76(12), 910–928.
doi:10.1093/nutrit/nuy042.
38) Kaiser, L., Lamp, C., Johns, M., Sutherlin, J., Harwood, J., & Melgar-Quinonez, H. (2002).
Food Security and Nutritional Outcomes of Preschool-Age Mexican-American Children.
Journal of the American Dietetic Association, 102(7), 924-929. doi: 10.1016/S0002-
8223(02)90210-5.
39) Kalil, A., & Chen, J.-H. (2009). Mothers' citizenship status and household food insecurity
among low‐income children of immigrants. New Directions for Child and Adolescent
Development, 2008(121), 43-62. doi:10.1002/cd.222.
40) Kautzky-Willer, A., Harreiter, J., & Pacini, G. (2016). Sex and Gender Differences in Risk,
Pathophysiology and Complications of Type 2 Diabetes Mellitus. Endocrine reviews, 37(3),
278–316. doi: 10.1210/er.2015-1137.
41) Kinzie, J., Riley, C., McFarland, B., Hayes, M., Boehnlein, J., Leung, P., & Adams, G.
(2008). High Prevalence Rates of Diabetes and Hypertension Among Refugee Psychiatric
Patients. The Journal of Nervous and Mental Disease, 196(2), 108-112. doi:
10.1097/NMD.0b013e318162aa51.
42) Knol, M., Twisk, J., Heine, R., Beekman, A., Snoek, F., & Pouwer, F. (2006). Depression as
a risk factor for the onset of type 2 diabetes mellitus. A meta-analysis. Diabetologia, 49(837),
doi:10.1007/s00125-006-0159-x.
43) Leischow, S. J., & Milstein, B. (2006). Systems thinking and modeling for public health
practice. American journal of Public Health, 96(3), 403–405. doi:
10.2105/AJPH.2005.082842.
43
44) Liu, S. (2002). Intake of refined carbohydrates and whole grain foods in relation to risk of
type 2 diabetes mellitus and coronary heart disease. Journal of the American College of
Nutrition, 21(4), 298-306. doi: 10.1080/07315724.2002.10719227.
45) Loopstra, R., & Tarasuk, V. (2013). Severity of Household Food Insecurity Is Sensitive to
Change in Household Income and Employment Status among Low-Income Families. The
Journal of Nutrition, 143(8), 1316–1323, doi: 10.3945/jn.113.175414.
46) McLeroy, K.R., Bibeau, D., Steckler, A., & Glanz, K. (1988 ). An ecological perspective on
health promotion programs. Health Education Quarterly, 15(4), 351-77. doi:
10.1177/109019818801500401.
47) Malik, V., Popkin, B., Bray, G., Despres, J., & Hu, F. (2010). Sugar-Sweetened Beverages,
Obesity, Type 2 Diabetes Mellitus, and Cardiovascular Disease Risk. Circulation, 121(11),
1356–1364. doi: 10.1161/CIRCULATIONAHA.109.876185.
48) Marshall, G.N., Schell, T.L., Elliott, M.N., Berthold, S.M., & Chun, C. (2005). Mental
Health of Cambodian Refugees 2 Decades After Resettlement in the United States. JAMA,
294(5), 571–579. doi:10.1001/jama.294.5.571. 49) Marshall, G. N., Schell, T. L., Wong, E. C., Berthold, S. M., Hambarsoomian, K., Elliott, M.
N., Bardenheier, B. H., & Gregg, E. W. (2016). Diabetes and Cardiovascular Disease Risk in
Cambodian Refugees. Journal of immigrant and minority health, 18(1), 110–117. doi:
10.1007/s10903-014-0142-4.
50) Martin, K., Rogers, B., Cook, J., & Joseph, H. (2004). Social capital is associated with
decreased risk of hunger. Social Science & Medicine, 58(12), 2645-2654. doi:
10.1016/j.socscimed.2003.09.026.
51) Matheson, J., & Mclntyre, L. (2014). Women respondents report higher household food
insecurity than do men in similar Canadian households. Public Health Nutrition, 17(1), 40-
48. doi: 10.1017/S126898001300116X. 52) McLeroy, K.R., Bibeau, D., Steckler, A., & Glanz, K.(1988). An ecological perspective on
health promotion programs. Health Education Quaterly, 15(4),351-377. doi:
10.1177/109019818801500401
53) Mezuk, B., Eaton, W., Albrecht, S., & Golden, S. (2008). Depression and Type 2 Diabetes
Over the Lifespan. Diabetes Care, 31(12), 23830-2390. doi: 10.2337/dc08-0985.
54) Mezuk, B., Eaton, W., Albrecht, S., & Golden, S. (2008). Depression and Type 2 Diabetes
Over the Lifespan. Diabetes Care, 31(12), 2383-2390. doi: 10.2337/dc08-0985.
55) Mohan, V., Unnikrishnan, R., Shobana, S., Malavika, M., Anjana, R., & Sudha, V. (2018).
Are excess carbohydrates the main link to diabetes & its complications in Asians? Indian
Journal of Medical Research, 148(5), 531-538. doi: 10.4103/ijmr.IJMR-1698-18.
56) Morales, M. E., & Berkowitz, S. A. (2016). The Relationship between Food Insecurity,
Dietary Patterns, and Obesity. Current nutrition reports, 5(1), 54–60. doi:10.1007/s13668-
016-0153-y
57) Muthén, L. a. (1998-2017). Mplus User’s Guide. Eighth Edition. Los Angeles, CA: Muthén
& Muthén.
58) Peterman, J. N., Wilde, P. E., Liang, S., Bermudez, O. I., Silka, L., & Rogers, B. L.
(2010).Relationship between past food deprivation and current dietary practices and weight
status among Cambodian refugee women in Lowell, MA. American Journal of Public
Health, 100(10), 1930-1937. doi: 10.2105/AJPH.2009.175869.
59) Peterman, J., Silka, L., Bermudez, O., Wilde, P., & Rogers, B. (2011). Acculturation,
education, nutrition education, and household composition are related to dietary practices

44
among Cambodian refugee women in Lowell, MA. The Journal of American Dietetic
Association, 111(9), 1369-74. doi: 10.1016/j.jada.2011.06.005.
60) Peterman, J. N., Wilde, P. E., Liang, S., Bermudez, O. I., Silka, L., & Rogers, B. L. (2013).
Food insecurity among Cambodian refugee women two decades post resettlement. Journal of
Immigrant and Minority Health, 15(2), 372-80. doi: 10.1007/s10903-012-9704-5.
61) Polivy, J., Zeitlin, S., Herman, C., & Beal, A. (1994). Food restriction and binge eating: a
study of former prisoners of war. Journal of Abnormal Psychology, 103(2), 409–411. doi:
10.1037/0021-843X.103.2.409.
62) Rashidkhani, B., Gargari, P.B., Ranjbar, F., Zareiy, S., & Kargarnovin, Z. (2013). Dietary
patterns and anthropometric indices among Iranian women with major depressive disorder.
Psychiatry Research, 210(1), 115-120. doi: 10.1016/j.psychres.2013.05.022.
63) Rondinelli, A. J. (2011). Under- and over-nutrition among refugees in San Diego County,
California. Journal of immigrant and minority health, 13(1), 161-168. doi: 10.1007/s10903-
010-9353-5.
64) Seligman, H., Bindman, A., Vittinghoff, E., Kanaya, A., & Kushel, M. (2007). Food
Insecurity is Associated with Diabetes Mellitus: Results from the National Health
Examination and Nutrition Examination Survey (NHANES) 1999–2002. Journal of General
Internal Medicine, 22, 1018–1023. doi: : 10.1007/s11606-007-0192-6.
65) Seligman, H. K., Jacobs, E. A., López, A., Tschann, J., & Fernandez, A. (2012). Food
insecurity and glycemic control among low-income patients with type 2 diabetes. Diabetes
care, 35(2), 233–238. doi: 10.2337/dc11-1627 .
66) Seligman, H.K., & Schillinger, D.(2010). Hunger and socioeconomic disparities in chronic
disease. New England Journal of Medicine, 363, 6–9. doi: 10.1056/NEJMp1000072.
67) Sentell, T., & Braun, K. L. (2012). Low health literacy, limited English proficiency, and
health status in Asians, Latinos, and other racial/ethnic groups in California. Journal of health
communication, 17 Suppl 3(Suppl 3), 82–99. doi: 10.1080/10810730.2012.712621
68) Shah, K. (2016). So, what is bubble tea, exactly? Everything you need to know about the
drink and boba balls. Retrieved from mic.com: https://www.mic.com/articles/152810/so-
what-is-bubble-tea-exactly-everything-you-need-to-know-about-the-drink-and-boba-balls
69) Sherwani, S. I., Khan, H. A., Ekhzaimy, A., Masood, A., & Sakharkar, M. K. (2016).
Significance of HbA1c Test in Diagnosis and Prognosis of Diabetic Patients. Biomarker
Insights, 11, 95–104. doi:10.4137/BMI.S38440.
70) Silveira, H., Silveira, H., Moraes, H., Oliveira, N., Coutinho, E.S., Laks, J., & Deslandes, A.
(2013). Physical Exercise and Clinically Depressed Patients: A Systematic Review and Meta-
Analysis. Neuropsychobiology, 67(2), 61-68. doi: 10.1159/000345160
71) Sindler, A., Wellman, N., & Stier, O. (2004). Holocaust Survivors Report Long-Term Effects
on Attitudes toward Food. Journal of Nutrition Education and Behavior, 36(4), 189-196. doi:
10.1016/S1499-4046(06)60233-9 .
72) Sun, Q. S. (2010). White rice, brown rice, and risk of type 2 diabetes in US men and women.
Archives of Internal medicine, 170(11), 961–969. doi:10.1001/archinternmed.2010.109.
73) Story, M., & Harris, L. (1989). Food habits and dietary change of Southeast Asian refugee
families living in the United States. The Journal of American Dietetic Association, 89(6),
800-3.
74) Tait, C., L'Abbe, M., Smith, P., & Rosella, L. (2018). The association between food
insecurity and incident type 2 diabetes in Canada: A population-based cohort study. PLOS
ONE, 13(5), e0195962. doi: 10.1371/journal.pone.0195962.
45
75) Tarasuk, V. (2001). Household Food Insecurity with Hunger Is Associated with Women's
Food Intakes, Health and Household Circumstances. The Journal of Nutrition, 131(10),
2670–2676, doi: 10.1093/jn/131.10.2670.
76) Terrell, A. (2009). Is food insecurity associated with chronic disease and chronic disease
control? Ethnicity & Disease, 19(2), S3-6.
77) Tiedje, K., Wieland, M. L., Meiers, S. J., Mohamed, A. A., Formea, C. M., Ridgeway, J. L.,
Asiedu, G. B., Boyum, G., Weis, J. A., Nigon, J. A., Patten, C. A., & Sia, I. G. (2014). A
focus group study of healthy eating knowledge, practices, and barriers among adult and
adolescent immigrants and refugees in the United States. The international journal of
behavioral nutrition and physical activity, 11, 63. doi: 10.1186/1479-5868-11-63
78) Townsend, M., Peerson, J., Love, B., Achterberg, C., & Murphy, S. (2001). Food Insecurity
Is Positively Related to Overweight in Women. The Journal of Nutrition, 131(6), 1738–1745,
doi: 10.1093/jn/131.6.1738.
79) Tuomi, T., Santoro, N., Caprio, S., Cai, M., Weng, J., & Groop, L. (2014, March 22). The
many faces of diabetes: a disease with increasing heterogeneity. The Lancet, 383(9922),
1084-1094. doi: 10.1016/S0140-6736(13)62219-9.
80) USDA. (2019). Definitions of Food Security. Retrieved from usda.gov:
https://www.ers.usda.gov/topics/food-nutrition-assistance/food-security-in-the-us/definitions-
of-food-security.aspx
81) USDA. (2019). Household Food Security in the United States in 2018. United States
Department of Agriculture. 82) USDA. (2012). U.S. Household Food Security Survey Module: Six-Item Short Form.
Retrieved from usda.gov: https://www.ers.usda.gov/media/8282/short2012.pdf
83) Villegas, R. L. (2007). Prospective study of dietary carbohydrates, glycemic index, glycemic
load, and incidence of type 2 diabetes mellitus in middle-aged Chinese women. Archives of
Internal Medicine, 167(21), 2310–2316. doi:10.1001/archinte.167.21.2310.
84) Vozoris, N., & Tarasuk , V. (2003). Household food insufficiency is associated with poorer
health. The Journal of Nutrition, 133(1), 120–126, doi: 10.1093/jn/133.1.120.
85) Wagner, J., Berthold, S. M., Buckley, T., Kong, S., Kuoch, T., & Scully, M. (2015). Diabetes
Among Refugee Populations: What Newly Arriving Refugees Can Learn from Resettled
Cambodians. Current Diabetes Report, 15 (56). doi: 10.1007/s11892-015-0618-1.
86) Wang, Y., Min, J., Harris, K., Khuri, J., & Anderson, L. (2016). A Systematic Examination
of Food Intake and Adaptation to the Food Environment by Refugees Settled in the United
States. Advances in Nutrition, 7, 1066–79; doi:10.3945/an.115.011452.
87) Webb, M., Davies, M., Ashra, N., Bodicoat, D., Brady, E., Webb, D., . . . Khunti, K. (2017).
The association between depressive symptoms and insulin resistance, inflammation and
adiposity in men and women. PLOS ONE, 12(11), e0187448. doi:
10.1371/journal.pone.0187448.
88) Weigel, M., Armijos, R., Hall, Y., Ramirez, Y., & Orozco, R. (2007). The Household Food
Insecurity and Health Outcomes of U.S.–Mexico Border Migrant and Seasonal Farmworkers.
Journal of Immigrant and Minority Health, 9, 157–169. doi:10.1007/s10903-006-9026-6.
89) Westman, E. C., Yancy, W. S., Jr, Mavropoulos, J. C., Marquart, M., & McDuffie, J. R.
(2008). The effect of a low-carbohydrate, ketogenic diet versus a low-glycemic index diet on
glycemic control in type 2 diabetes mellitus. Nutrition & metabolism, 5, 36.
doi:10.1186/1743-7075-5-36.
46
90) Wong, E. C., Marshall, G. N., Schell, T. L., Elliott, M. N., Hambarsoomians, K., Chun, C.-
A., & Berthold, S. M. (2006). Barriers to mental health care utilization for U.S. Cambodian
refugees. Journal of Consulting and Clinical Psychology, 74(6), 1116–1120. doi:
10.1037/0022-006X.74.6.1116