Embed Size (px)
Citation preview
Company number: 10250295.
Registered address: UK Finance Limited, 1 Angel Court, London, EC2R 7HJ
Household Finance Review – Q1 2021 This review explores trends in household financial activity through a quarter that began with
a national lockdown in response to a spike in Covid-19 infections and ended with optimism
from the early successes of the vaccination programme. Although many households have
seen their finances come under pressure, the financial services industry has worked with
government to support those who have found themselves in difficulty. Here we look in detail
at how the mortgage and unsecured lending markets have fared as the country starts to
emerge, cautiously, from the seismic upheavals of the past year.
Eric Leenders, Managing Director,
Personal Finance comments:
“Since the housing market emerged from
its shutdown last spring, we have seen a
remarkable recovery in demand, which
continued through Q1 2021.
“Existing homeowners have taken
advantage of the stamp duty concessions,
with changing working and living patterns
encouraging more to use their existing
equity, either to move further afield or to
fund further housing purchases for
themselves or family.
“Towards the end of the quarter, cautious
optimism was also evident through modest
increases in card spending and in
unsecured borrowing.
“The continuing support network for
household incomes and credit payments
has prevented significant increases in
arrears. As the country emerges from
lockdown and these schemes come to a
close most will be able to resume normal
payments. However, for those unable to do
this, the industry stands ready to help with
tailored support to best suit individual
customers’ needs.”
• House purchase lending surged in Q1 following the rush of applications submitted ahead of the original Stamp Duty Land Tax (SDLT) holiday deadline
• Homemover activity was particularly strong, with anecdotal evidence of many homeowners using their substantial existing equity stakes to move to larger properties away from city centres in response to changing working and living patterns
• Refinancing remains dominated by internal Product Transfers. However, we continue to see a trend of significant and growing amounts of equity withdrawn with other remortgages, in large part to fund additional property purchases
• Payment deferrals and government support for jobs and incomes kept arrears increases in check in Q1 2021, while the ban on court actions meant there were no enforced possessions for the fourth consecutive quarter
• From Q2, as support schemes wind down and possessions resume, we are likely to see arrears rise above their current level and, after a lag, possessions rise as well
• Credit card borrowing fell due to additional national lockdowns and post-Christmas seasonality but showed signs of recovery towards the end of the quarter
HIGHLIGHTS

2
UK economic context and outlook
The economic backdrop to this quarter’s
Household Finance Review (HFR) continues
to be shaped by the impact of, and policy
response to, the Covid-19 pandemic. A
continuation of the national lockdown,
particularly affecting hospitality, leisure, non-
essential retail and other contact-intensive
services weighed on growth at the start of this
year. In the first three months of 2021 UK GDP
contracted by 1.5 per cent, leaving the
economy 8.7 per cent smaller compared with
pre-pandemic levels.
Unsurprisingly, household consumption was a
particular drag on the economy at the start of
the year, falling nearly four per cent in the first
quarter, following a 1.7 per cent decline in the
final three months of 2020. Household
consumption is now 12.8 per cent down on
pre-pandemic levels. Trends in the first quarter
were driven by weakness in retail sales, a
further slump in spending in hospitality and
hotels and declining spend on transport – all
predictable consequences of the lockdowns
imposed.
Nevertheless, the overall decline in output was
less than expected as parts of the
manufacturing, construction and health and
social care sectors contributed positively to
GDP and some businesses adjusted to public
health restrictions with new business models.
Moreover, there were some positive indicators
emerging at the end of the quarter, with the
economy expanding by 2.1 per cent month-on-
month in March, supported by production
sectors and the reopening of education.
As noted in last quarter’s Household Finance
Review (HFR), despite the UK economy
experiencing the biggest contraction in
modern times last year the labour market has
shown more resilience than expected. The
government’s furlough scheme (or Job
Retention Scheme), extended again in the
March budget, has played a significant part in
underpinning this resilience. At the start of
2021, labour market indicators were a little
firmer than expected. The most recent data
from the Office for National Statistics (ONS)
pointed to an increase in the employment rate
and a decrease in both the unemployment and
inactivity rates in the three months to March.
That said, total hours worked declined, again
in response to continued restrictions on
activity. Further positive signs can be found in
the reduction in numbers away from work,
both those receiving pay and unpaid, while
those on partial pay remained stable.
In response to the planned reopening of parts
of the economy, there has been a notable
uptick in job vacancies, reaching the highest
level since the start of the pandemic although
still below levels seen previously. The return of
hiring intentions is consistent with improving
business activity indications, such as the
purchasing managers’ indices across all major
segments of the economy.
With the economy reopening in line with the
government’s roadmap, together with the
rapid pace of vaccine roll-out in the UK,
forecasters have made successive upgrades
to the growth outlook in recent months.
Looking in more detail at the potential path for
growth in the remainder of this year set out in
the UK Economic Outlook from the National
Institute of Economic and Social Research
(NIESR), GDP is expected to expand by 5.7
per cent, a stronger outlook than the 3.4 per
cent growth forecast in February.
In addition to monetary and fiscal policy
remaining supportive of growth, a key
contributor to this brighter outlook is a
recovery in household spending, expected to
rise by nearly six per cent this year. The
government’s furlough scheme has provided
some insulation for household incomes
through the pandemic and there has also been
a rapid increase in the savings rate over the
past year, a result of reduced opportunities for
spending. With a fall in savings, together with
expectations of some wage growth this year
and assuming spending patterns return to pre-
pandemic norms, growth should see some
support from household spending during 2021.

3
The latest retail sales data for April from the
ONS indicate that consumers are getting back
to normal with the reopening of non-essential
retail. Particularly strong growth in sales
volumes were seen in clothing and other
specialist stores.
It is equally important to note that the
pandemic has impacted unequally across
households in different income brackets.
While many households have experienced
limited financial detriment from the pandemic,
others have been less fortunate, and are likely
to experience further stress in the coming
quarters.
The NIESR continues to expect further
increases in unemployment over the course of
this year. The unemployment rate is forecast
to peak at 6.5 per cent at the start of next year,
which assumes around 450,000 of those on
furlough will not be taken back on when it ends
later this year. Caution around optimism
related to short-term labour market trends is
warranted as businesses may wait until
lockdowns end and the various job retention
schemes close before being able to better
assess future plans.
While the improving growth outlook is to be
welcomed, the UK is making up lost ground
rather than paving the way for an economic
boom. Risks to the outlook are also balanced.
There are potential upsides if the unlocking of
the economy remains on track and
accumulated savings are spent more quickly
than forecast. Continued concerns about new
Covid-19 variants means that the next stage of
unlocking is not yet certain which could lead to
a more cautious approach to spending and
investment by households and businesses.
Housing market resurgence: reasons to be
cheerful?
After a year of seismic disruptions – to social
interactions, the physical and economic health
of the nation and to the operation of the
housing market – some signs of optimism in
the first quarter pave the way for a brighter
outlook in 2021.
Throughout the pandemic the continuing
government and industry support programmes
have minimised negative impacts on existing
mortgage borrowers, while the Stamp Duty
Land Tax (SDLT) holiday helped boost
demand amongst those with the means to
transact.
The collapse in house purchase volumes in
Q2 last year was inevitable, given the closure
of the housing market for most of that quarter.
However, the strength of the subsequent
bounce back has surpassed expectations in
terms of both its magnitude and longevity.
With the stamp duty holiday originally set to
end on 31 March 2021, the industry had
anticipated a surge of activity in the months
leading up to this date. The strength of
demand since the reopening of UK housing
markets last summer, further fuelled by the
temporary tax break, presented a potential test
of the industry’s resources.
Recognising this, many advisers, anticipating
a potential bottleneck towards the end date,
counselled prospective borrowers to submit
mortgage applications early to maximise the
chances of completion before that date.
These factors led to an unprecedented flood of
applications beginning at the start of Q3 2020
and accelerating rapidly. This then fed through
to commensurate growth in loan completions,
which had returned to annual growth by the
end of Q3 2020, and then accelerated through
to the end of Q1 2021 (Chart 1).

4
Chart 1: Mortgage applications and completions,
three-month moving average, year-on-year change
Source: UK Finance
Recognising the potential for a logjam towards
the end of Q1 2021 mortgage lenders
responded and, since late 2020, put significant
additional resource into processing these
increased volumes by the original 31 March
2021 end date.
The flow of applications moderated through
Q4 2020, in part due to the increased social
restrictions as the Covid-19 infection rate rose
again. However, in Q1 2021 – despite the
second national lockdown – consumer
confidence was buoyed by the early
successes of the vaccination programme and
the prospective (albeit gradual) easing of
social restrictions.
This confidence, together with the announced
extension of the end date for the stamp duty
holiday, led to a second wave of demand,
shown in applications numbers in late Q1. This
second wave came even as completions –
those from applications submitted early so as
to beat the original deadline – were already
showing high double-digit annual percentage
growth.
Homemovers emerge from the shadows
As Chart 1 shows clearly, the strength in the
housing market since last summer has been
seen for all buyers, but most significantly
amongst homemovers.
This revival in homemover activity follows a
long period of muted transaction volumes
dating back to the late 2000s. Since then, first
time buyer (FTB) numbers – boosted by a
range of successive government initiatives
designed to stimulate demand – had
recovered to 2007 purchase levels by 2018.
However, in that downturn homemover
numbers fell to around half the level seen in
the years immediately preceding and have
remained around those levels ever since.
The help for new buyers over the past decade
or so is both welcome and important, with
FTBs providing important liquidity at the entry
level of the market, thus helping chains to form.
However, the absence of such targeted
support for existing owners, together with
some of the support for FTBs focused
specifically in the new build sector (and
therefore not part of a larger housing chain),
has seen a shift in market dynamics such that
fewer existing owners have been able to move
up the housing ladder than previously.
A peculiar consequence of the pandemic has
been this rebalancing of the market, in a way
that market intervention has not previously
achieved. One of the reasons is that the
marginal benefit of the current stamp duty
holiday accrues mostly to homemovers and
landlords, because the majority of FTBs
across most of the UK were already exempt,
through the FTB-specific holiday which had
been in place since 2017.
However, another, more fundamental, driver
of the strength in homemover activity can be
seen in the regional picture (Chart 2).
Chart 2: Number of new house purchase loans,
annual percentage change, Q1 2021
Source: UK Finance
-50%
-40%
-30%
-20%
-10%
0%
10%
20%
30%
40%
50%
60%
70%
80%
90%
Sep 18 Dec 18 Mar 19 Jun 19 Sep 19 Dec 19 Mar 20 Jun 20 Sep 20 Dec 20 Mar 21
Applications First time buyer completions Homemover completions
-10%
0%
10%
20%
30%
40%
50%
60%
70%
80%
90%
100%
110%
120%
FTBs
Movers
5
Although each region of the UK saw strong
double-digit annual growth in FTB numbers in
Q1, homemover growth vastly outpaced this in
every region. While exceptionally strong
everywhere, the strongest growth rates were
in the south east, where volumes rose 110 per
cent compared with a year ago, and the other
southern regions of England.
To unpick this further, we need to look at the
role of existing equity and house prices. Chart
3 shows the amounts of equity held by current
mortgage borrowers, based on their current
property value and remaining mortgage
balance.
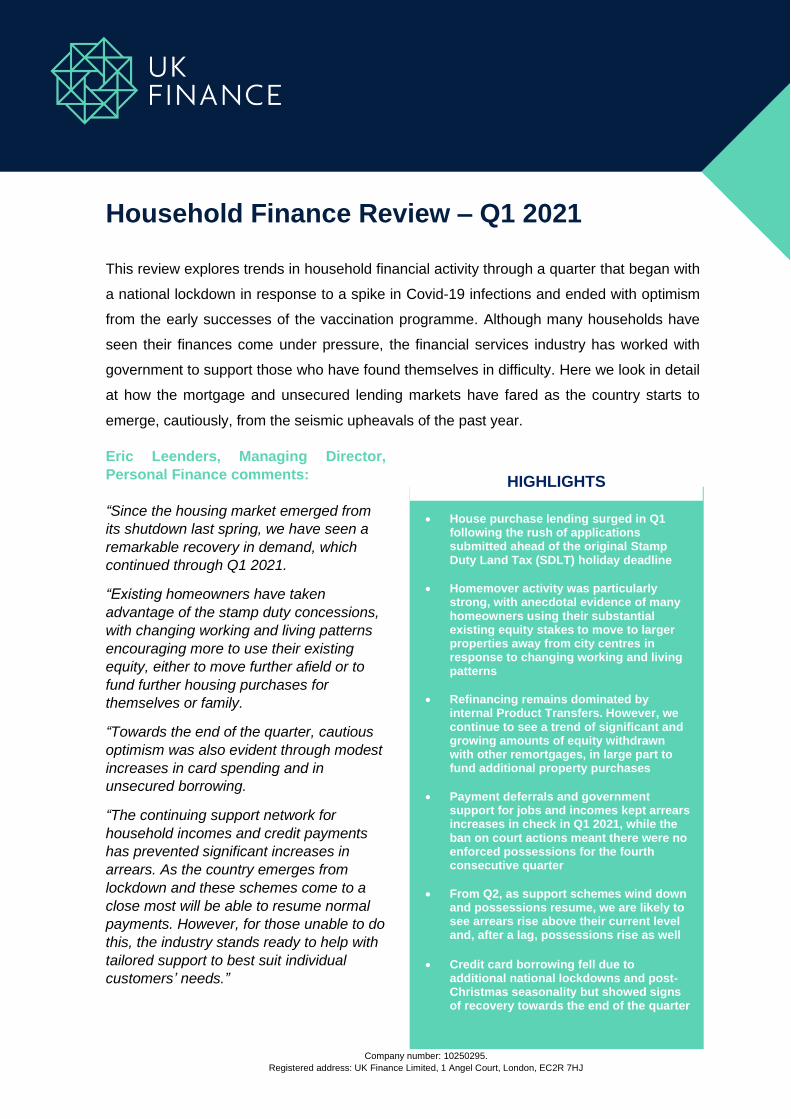
Chart 3: Equity stakes of residential mortgage
borrowers, December 2020.
Source: UK Finance
Overall, UK borrowers’ equity positions (as a
proportion of the current property value) are
strong. Following around nine years of
uninterrupted price growth, half of all
mortgaged homeowners have at least 50 per
cent equity in their home, and a further third
have between 25 and 50 per cent.
There is substantial regional variation; this is
particularly important in the current
environment and a key contributor to the
strength in homemover activity. Equity stakes
are strongest in London and the southern
regions, where up to 60 per cent of borrowers
own at least half of their home’s equity outright.
This translates to sizeable amounts of housing
wealth: nationally, one in five borrowers have
more than £250,000 of equity, approximately
the average house price in the UK (according
to HM Land Registry data).
In the south east, with both higher proportional
equity stakes and property values, this rises to
more than half of borrowers. In London, one in
five borrowers have more than half a million
pounds of free equity in their property, more
than enough to buy an average priced
property in every other region of the UK.
In normal times, the greater amount of equity
in these southern regions is no more or less
“useful” than in areas with lower prices, as
most people move within their own broad
region. However, the pandemic, bringing with
it increased homeworking as well as
significantly increasing the importance of both
outside and inside space, is changing this
dynamic.
It has always been the case that many
homeowners in London, unable to afford
larger property locally to accommodate an
expanding household, move to the outer
suburbs and the commuter belt where space
is more affordable. The difference this time is
the magnitude.
As we observed above, homemover numbers
had been running at around half of their typical
levels in 2005-2007 ever since the Global
Financial Crisis (GFC). However, in Q1 2021
activity leaped by 82 per cent compared to Q1
2020, bringing volumes to a level not seen
since 2007.
The pattern of transactions – exceptionally
strong in London but even stronger in the
regions surrounding, including those not
previously thought of as commuter belt –
suggests a mini-exodus, albeit one which has
been accentuated by the original stamp duty
holiday end date in March. Increased numbers
of homemovers are moving out, not only of
their immediate locality but to regions further
afield than would have been the case in
previous years.
0%
10%
20%
30%
40%
50%
60%
70%
80%
90%
100%
>50% 25%-50% 10%-25% <10%
6
Data from HM Land Registry suggests at least
some are cashing in their equity and buying
outright, as the latest figures (to December
2020) indicate significant increases in the
proportion buying without a mortgage in every
region of the UK. Our own data show many
more are using their equity plus mortgage
borrowing to achieve space, location and other
desirable attributes in a new area.
The pandemic has brought with it a need for
space during lockdowns. However, the
strength of this housing market response,
coupled with a steady trickle of newsfeeds as
to employers adapting their homeworking
policies for the long term (and, more recently,
greater flexibility around part-time rail season
tickets), points to at least the potential for a
more fundamental shift in the patterns of
homebuying.
While London and other cities will always
remain important commercial centres, the
ability of many to work from home in perpetuity,
whether for all or part of each working week,
has allowed more UK households to re-
evaluate not only what they most need from
their home but where that home is located.
It remains to be seen whether this is a
temporary shift which will revert, once the
pandemic and its aftershocks have subsided,
to the pre-existing preference for London and
other large cities.
However, should it prove more permanent and
pervasive, this has the potential to lead to
other economic phenomena including some
rebalancing of property prices more evenly
across the country, as well as revitalisation of
local high streets and wider economies.
Buy-to-let activity matches homemovers
At the same time as this unprecedented surge
in homemover numbers, the buy-to-let (BTL)
sector has also seen significant growth, with
mortgages for BTL house purchase increasing
by 59 per cent in Q1 2021, compared to a year
previously.
The stamp duty holiday has been a significant
demand stimulus in the BTL sector, where
new purchases attract a three per cent
second-home stamp duty surcharge on top of
the prevailing rate for residential homebuyers.
However, the surge in purchase activity
followed a broadly similar regional pattern as
for homemovers, with London and the other
southern regions showing the strongest
growth. This is likely to reflect landlords
responding to increased demand from
households seeking to move for the same
reasons as detailed above for homemovers,
but who at this stage are looking to rent
properties rather than buy.
Looking ahead, demand from both
homemovers and BTL landlords is likely to
start to moderate as the stamp duty holiday
comes to a staged conclusion through to the
end of Q3. Beyond this point, the outlook is
less clear. To the extent that the societal
changes to where people want to live persist,
the regional demand patterns we have seen
recently may continue.
Internal product transfers saw a New Year
lockdown boom
Refinancing saw a large spike in January 2021.
This is fairly typical behaviour; remortgaging
sees a boost as each year begins and
consumers put their finances in order after the
festive season.
This January, the spike came almost entirely
from Product Transfers (PTs). Nearly 150,000
PTs were completed in January 2021, 27 per
cent up on a year previously and the highest
monthly number on record (Chart 4).

7
Chart 4: Number of residential remortgages and
internal product transfers
Source: UK Finance
This is likely due to the second lockdown that
was in place; for the first time this January’s
normal refinancing surge took place under
conditions that hindered access to mortgage
advisers and further heightened the attraction
of PTs, which can be transacted without
advice and via remote channels, including
online.
In fact, the increase in January was seen
almost entirely for execution-only, online
transactions. Although there remains a thriving
external remortgage market, the ease with
which PTs can be carried out when unable to
physically visit an adviser, as well as the
industry agreement to allow customers on a
payment deferral to take out a PT, has helped
1.1 million customers manage the cost of their
housing finance through the pandemic.
In addition to the January surge in simple
refinancing, Q1 saw a continuation of another
remortgaging trend which we observed in our
Q4 2020 Review. Although the strength in
refinancing numbers has been concentrated in
the internal PT sector, the external remortgage
market remains robust. Within this market, the
proportion of remortgages where extra money
is taken out has seen a steady increase
through the past 12 months, reaching 57 per
cent of all internal remortgages by March
(Chart 5).
Chart 5: Number of residential remortgages by type
of remortgage
Source: UK Finance
This trend has been fairly steady, if
unspectacular compared with the surge in
purchase activity. What is more noteworthy is
the amounts withdrawn, which have increased
very significantly since mid-2020 (Chart 6).
Chart 6: Average value of equity withdrawal through
residential remortgages by reason for
withdrawing equity
Source: UK Finance
These increases have been more pronounced
amongst those remortgages where the money
is withdrawn for home improvements and,
even more so where the equity is for “other
reasons”. Both contextual and anecdotal
evidence suggest one of the most common
“other” reasons for withdrawing such a
sizeable sum is to fund, either in part or in full,
further property purchases. This could be for
BTL, second homes or gifted deposits for
family members.
Although the shift to greater amounts
withdrawn is seen in all regions, the absolute
60%
65%
70%
75%
80%
85%
-
20,000
40,000
60,000
80,000
100,000
120,000
140,000
160,000
180,000
200,000
Jan 18 May 18 Sep 18 Jan 19 May 19 Sep 19 Jan 20 May 20 Sep 20 Jan 21
Nu
mb
er
Remortgage with money withdrawn
Simple external refinance (no extra money withdrawn)
Product Transfers
% PTs (RHS)
30%
35%
40%
45%
50%
55%
60%
-
10,000
20,000
30,000
40,000
50,000
60,000
Jan 17 Jul 17 Jan 18 Jul 18 Jan 19 Jul 19 Jan 20 Jul 20 Jan 21
Simple refinance (no money withdrawn)
Remortgage with equity wthdrawn
% of remortgages that have money withdrawn (RHS)
£0
£10,000
£20,000
£30,000
£40,000
£50,000
£60,000
£70,000
£80,000
£90,000
£100,000
Ja
n 1
7
Ma
r 1
7
Ma
y 1
7
Ju
l 1
7
Se
p 1
7
No
v 1
7
Ja
n 1
8
Ma
r 1
8
Ma
y 1
8
Jul 18
Se
p 1
8
No
v 1
8
Jan 1
9
Ma
r 1
9
Ma
y 1
9
Ju
l 1
9
Se
p 1
9
No
v 1
9
Ja
n 2
0
Ma
r 2
0
Ma
y 2
0
Ju
l 2
0
Se
p 2
0
No
v 2
0
Ja
n 2
1
Ma
r 2
1
for debt consolidation for home improvements for other reasons
8
amounts withdrawn – again linked to regional
property values – are important. The amounts
withdrawn in London rose more rapidly than in
other geographies to £189,000 by March 2021
on average. This is enough to buy an
average-priced property in any UK region
outside the south of England, and a sizeable
majority equity share in any of the southern
English regions.
As with the current boom in homemover
activity, a mixture of the stamp duty holiday
and changing patterns of living and working
are likely to have fuelled these trends, whether
this is for owner-occupied, holiday or rental
property.
There will ultimately be a limit on the extent to
which those more property-rich homeowners
are able to leverage their existing property
assets to expand further afield. We can see
further ways in which existing borrowers
appear to be accessing accumulated equity to
help respond to the challenges and
opportunities presented by the ongoing
situation.
Covid-19 related payment deferrals
On 31 March 2021, just over a year after it
began, the Covid-19 payment deferral (PD)
scheme closed to new applications. Given the
country was still in lockdown throughout the
first quarter, and well over four million
employees were still on furlough, we might
have expected some increase in applications
as the scheme drew to a close.
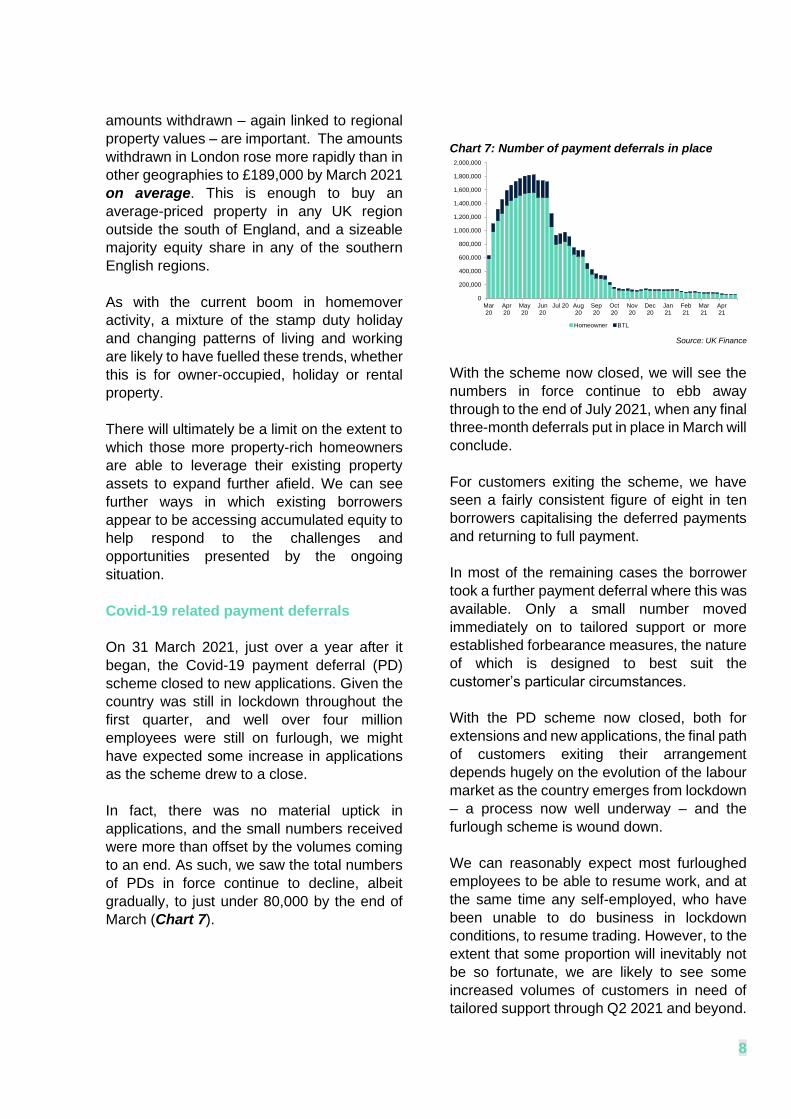
In fact, there was no material uptick in
applications, and the small numbers received
were more than offset by the volumes coming
to an end. As such, we saw the total numbers
of PDs in force continue to decline, albeit
gradually, to just under 80,000 by the end of
March (Chart 7).
Chart 7: Number of payment deferrals in place
Source: UK Finance
With the scheme now closed, we will see the
numbers in force continue to ebb away
through to the end of July 2021, when any final
three-month deferrals put in place in March will
conclude.
For customers exiting the scheme, we have
seen a fairly consistent figure of eight in ten
borrowers capitalising the deferred payments
and returning to full payment.
In most of the remaining cases the borrower
took a further payment deferral where this was
available. Only a small number moved
immediately on to tailored support or more
established forbearance measures, the nature
of which is designed to best suit the
customer’s particular circumstances.
With the PD scheme now closed, both for
extensions and new applications, the final path
of customers exiting their arrangement
depends hugely on the evolution of the labour
market as the country emerges from lockdown
– a process now well underway – and the
furlough scheme is wound down.
We can reasonably expect most furloughed
employees to be able to resume work, and at
the same time any self-employed, who have
been unable to do business in lockdown
conditions, to resume trading. However, to the
extent that some proportion will inevitably not
be so fortunate, we are likely to see some
increased volumes of customers in need of
tailored support through Q2 2021 and beyond.
0
200,000
400,000
600,000
800,000
1,000,000
1,200,000
1,400,000
1,600,000
1,800,000
2,000,000
Mar20
Apr20
May20
Jun20
Jul 20 Aug20
Sep20
Oct20
Nov20
Dec20
Jan21
Feb21
Mar21
Apr21
Homeowner BTL

9
While this tailored support will provide
invaluable help for customers it is important to
note that, in contrast to the PD scheme,
arrears are reported while the customer is in
receipt of BAU forbearance. While the PD
scheme did not add to arrears numbers,
customers in a reduced payment arrangement
will have arrears accruing, albeit at a slower
rate than if making no payment at all.
Support schemes keep arrears at bay,
despite second lockdown
Since the country first went into lockdown in
March 2020 we have seen continual, but
modest, increases in overall arrears numbers.
In Q1 2021 this continued, with an increase of
just 360 arrears cases to 83,600 (Chart 8)
Chart 8: 1st charge homeowner and buy-to-let mortgages in arrears1
Source: UK Finance
Notes: 1. Arrears measured as those representing more than 2.5 per cent of outstanding mortgage balance
Within the total, however, there are some
important trends. Early arrears – those where
the shortfall represents 2.5 and five per cent of
the balance outstanding – have fallen as some
customers have been able use the time on a
PD to pay down modest arrears and return the
account to performing status.
However, at the other end of the spectrum
those in the higher arrears bands, in particular
cases representing more than ten per cent of
the balance, increased by a slightly higher
number than the reductions at the lighter end.
These heavier arrears take some time to
accrue, particularly with the historically low
interest rates that have been in place since the
last market downturn in the late 2000s. These
customers’ payment issues may potentially
have been exacerbated by the pandemic, but
this was not the initial cause of their financial
difficulty.
While these longer-term arrears cases are an
ongoing concern, they are likely to be
receiving BAU forbearance or be under active
arrears management.
However, over the past few years very few
customers have newly experienced arrears,
either personally or potentially even second-
hand from the experience of family or friends.
This is due in part to the more stringent
underwriting requirements which have been
part of Financial Conduct Authority (FCA)
responsible lending rules since 2014. These
rules ensure that all homeowner mortgages
are affordable and have a buffer to ensure that
they remain affordable in the event of a degree
of adverse payment or income shock.
The evidence is that these rules appear to be
working as intended and that this has
continued through the pandemic. However, as
the furlough and PD schemes end, some
customers whose incomes are disrupted for a
longer period will find themselves in this
position, many for the first time.
For this reason, it is more important than ever
that borrowers who find themselves in
financial difficulty speak to their lender, as the
industry stands ready to help its customers.
Many BTL landlords able to absorb
increases in rental arrears
Although we have seen only modest rises in
total arrears numbers, the picture is different
when we look across sectors: homeowner
arrears have increased only modestly, with
those increases concentrated in the heavier
bands. In the BTL sector, however, increases
0.00%
0.50%
1.00%
1.50%
2.00%
2.50%
-
50,000
100,000
150,000
200,000
250,000
Number (LHS) Arrears rate (per cent of mortgages outstanding, RHS)

10
have been seen across all bands, and by a
greater degree.
In total there were 5,970 BTL mortgages in
arrears in Q1 2021, eight per cent up on Q4
2020. Although this is a larger percentage
increase than in the homeowner sector, it is
important to bear in mind that the increase is
from a very low base and, therefore, small in
absolute size; in total, the cumulative increase
in BTL arrears cases since March 2020
translates to only 1,550 landlord mortgages.
As with most trends over the past year, the
disproportionate growth in BTL arrears
appears linked to the pandemic. The labour
market impacts, while widespread, have
disproportionately impacted on young people
and lower-paid workers, two groups who are
significantly more likely to be renters than
homeowners.
Growth in BTL arrears looks to be
concentrated amongst landlords with small
portfolios – one or two properties. Those with
larger portfolios have been able to defray the
lost income from tenants who have suffered
through the pandemic and are unable to make
their rental payments.
Although there are considerably more small-
portfolio landlords (by number) than larger-
scale ones, the majority of the BTL mortgage
stock is held by the larger ones (a
mathematical result of those larger portfolio
sizes). Therefore, if this pattern continues,
increases in BTL arrears are likely to be limited.
However, the industry will continue to monitor
the sector for any changes and respond to
developments as accordingly.
Looking ahead, despite well-founded optimism
arising from the success of the vaccination
programme and easing of lockdown, we do
nonetheless expect arrears cases to rise, both
in the homeowner and residential sectors,
once income and payment support schemes
come to a close.
As before, the industry stands ready to help
with tailored support that best suits each
customer’s circumstances and help them get
back on track. Our message remains clear:
customers experiencing financial difficulty
should talk to their lender at an early stage –
they are ready to help.
Possessions activity remained minimal in
Q1, but gradual increases now expected
The moratorium on involuntary possessions ended in November. However, a temporary ban on bailiff enforcements, supported by a voluntary industry agreement not to enforce possessions during mid-winter, meant that both Q4 2020 and Q1 2021 saw only minimal possession activity. There were just 360 possessions in Q1, again confined to only those which have taken place at the customer’s request or of vacant properties (Chart 9). Chart 9: Number and proportion of 1st charge mortgages taken into possession in period
Source: UK Finance
As of 31 May 2021, the ban on bailiff enforcement of evictions also ended in England (and is expected to end on 30 June 2021 in Wales), and normal possession activity can resume. Given the length of the moratorium there is now a material backlog of possession cases that, under normal conditions, would have taken place. These cases, which we estimate to number around 5,000-6,000, need to take place in the customers’ best interests, to prevent further accumulation of debt and any erosion of remaining equity. However, we do not anticipate a flood of activity in Q2 2021, rather a more measured increase each month as
0.00%
0.02%
0.04%
0.06%
0.08%
0.10%
0.12%
0.14%
-
2,000
4,000
6,000
8,000
10,000
12,000
14,000
Number (LHS) Possessions rate (per cent of mortgages outstanding, RHS)

11
both courts and lenders deal with this backlog in a manageable and sensitive fashion. Looking beyond Q1, the ban on rental evictions ended on 31 May. However, the courts will deal with these cases in a similarly sensitive fashion and the additional protections which apply to residential homeowners also apply to BTL landlords with respect to their tenants. Because the PD scheme has greatly mitigated increases in arrears, we do not expect to see any material increase in “new” possession activity (that is, cases arising from Covid-19-related payment issues), until the end of this year at the earliest. Lenders will work with customers in arrears and explore all other viable options to get back on track. Possession, as always, remains the last resort once all other options have been explored.
Unsecured Borrowing – Credit Cards
Credit card borrowing accounts for around half
of all unsecured credit provided by banks and
building societies. As reported in our previous
review, lockdown restrictions at the start of the
pandemic in Q2 2020 saw spending on credit
cards contract by 25 per cent compared with
the previous year as spending dropped in
sectors such as hospitality, entertainment and
travel. This then started to recover during Q3
as lockdowns began to be lifted and more
sectors of the economy opened up over the
summer, with this recovery slowing during Q4
as parts of the country saw subsequent
lockdowns.
At the start of Q1 2021, further national
lockdowns as well as lower seasonal spend
post the Christmas period saw total spending
in the quarter decline by 17 per cent from the
previous quarter, and fall by 24 per cent
compared with Q1 2020, with decreases
concentrated in the same lockdown-sensitive
sectors.
Borrowing did increase at the end of the
quarter, reaching £14.2 billion. This compares
with a total of £10.7 billion at the start of the
quarter in January 2021 and £8.7 billion at the
peak of the first lockdown in April 2020 (Chart
10). This may be a reflection of consumers
starting to become more confident of their
future economic outlook following the rollout of
the vaccine program and the announcement of
a timetable for gradual easing of restrictions.
Chart 10: Credit card spending and net changes in
balances outstanding
Source: UK Finance
While still at low levels, credit card spending
during the lockdown in Q1 2021 is 17 per cent
higher when compared to that seen during the
first lockdown in Q2 2020. This suggests this
lockdown has not had as severe an effect as
the initial one in April 2020.
Chart 11 illustrates the changes in borrowing
on cards – with the initial drop in April 2020
mirroring the fall in spending, and also the
proportion of interest-bearing credit cards.
Over the past decade, the proportion of card
balances bearing interest has reduced to 54.6
per cent (down from 66.1 per cent in
December 2011) as more credit card
customers pay off balances in full when they
receive their monthly statements.
At the start of quarter there was a small
increase in the percentage of credit cards
bearing interest, likely due to the effect of
spending over the Christmas period at the end
of the previous quarter, however this metric
has now fallen and sits at 54.6 per cent as at
the end of March. Since the start of the

12
pandemic the borrowing growth rate has
continued to fall and now sits at negative 18
per cent. This decline indicates that consumer
repayments are continuing to outstrip new
lending, with many customers opting, because
they had significantly reduced outgoings, to
pay down debt in the current environment.
Chart 11: Annual growth in card borrowing and
proportion of balances bearing interest
Source: UK Finance
As highlighted in the previous review the credit
card Payment Deferral (PD) scheme ended on
31 March 2021, with a long stop date of 31 July.
Since the start of the scheme, over 1.18 million
credit card PDs have been granted. Similar to
the trend seen in mortgage PDs, the number
currently in place has fallen since last summer.
Unsecured borrowing – Overdrafts
Borrowing through personal current account
overdrafts with banks and building societies
fluctuated around a peak level of around £10
billion between late 2005 and 2009. Since then,
the level of overdraft borrowing gradually
decreased to just over £6 billion by the end of
2015 and remained at similar levels until early
2020 (Chart 12).
However, in Q2 2020 overdraft borrowing fell
sharply to £5.2 billion, and is now slightly
below this level at £5.0 billion at the end of Q1
2021. The initial fall in overdraft borrowing in
Q2 can be attributed to some customers
flexing their household budgets in the face of
an uncertain Covid-19-dominated backdrop, to
repay borrowing in conjunction with the lower
spending we have observed.
Chart 12: Overdraft borrowing
Source: UK Finance
Some customers are likely to have had lower
expenses during periods of lockdown,
including reduced travel costs, as well as less
opportunity to spend on non-essential retail or
social events. This may have resulted in some
opting to use these additional savings to pay
off any outstanding debts. As expenses have
declined, customers may also have looked to
put these savings into easy access accounts,
evidenced by increases in deposits since the
start of the pandemic. While other forms of
borrowing such as credit cards have slowly
increased from their initial drop at the start of
the pandemic, overdrafts have remained
relatively stable since the initial drop in April
2020. This suggests that overdraft borrowing
is often seen as a final option when compared
with that on credit cards and loans.
As mentioned in the previous review, in
addition to credit card payment deferrals,
many organisations provided customers with
personal current account fee-free, interest-
free overdraft buffers up to £500. Just over 27
million personal current account holders had
this borrowing relief applied to their account in
2020.
Unsecured borrowing – Personal Loans
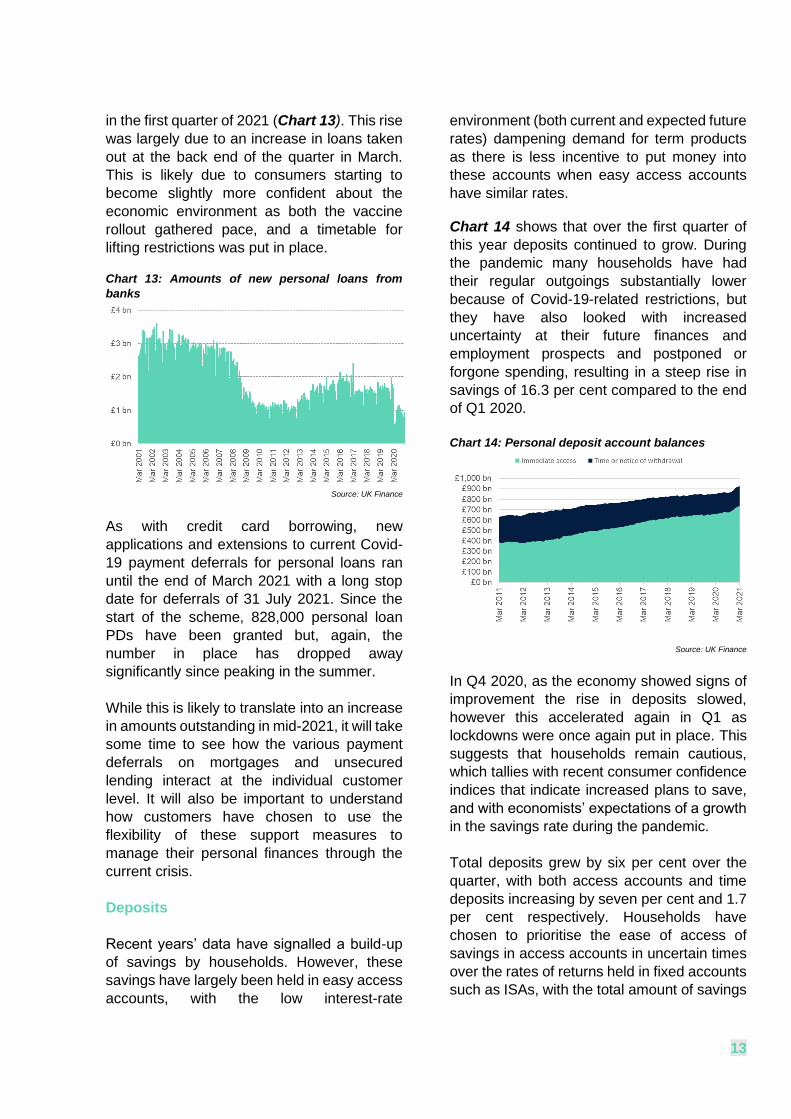
After falling in Q4 2020, the total amount of
new personal loans increased by 21 per cent
13
in the first quarter of 2021 (Chart 13). This rise
was largely due to an increase in loans taken
out at the back end of the quarter in March.
This is likely due to consumers starting to
become slightly more confident about the
economic environment as both the vaccine
rollout gathered pace, and a timetable for
lifting restrictions was put in place.
Chart 13: Amounts of new personal loans from
banks
Source: UK Finance
As with credit card borrowing, new
applications and extensions to current Covid-
19 payment deferrals for personal loans ran
until the end of March 2021 with a long stop
date for deferrals of 31 July 2021. Since the
start of the scheme, 828,000 personal loan
PDs have been granted but, again, the
number in place has dropped away
significantly since peaking in the summer.
While this is likely to translate into an increase
in amounts outstanding in mid-2021, it will take
some time to see how the various payment
deferrals on mortgages and unsecured
lending interact at the individual customer
level. It will also be important to understand
how customers have chosen to use the
flexibility of these support measures to
manage their personal finances through the
current crisis.
Deposits
Recent years’ data have signalled a build-up
of savings by households. However, these
savings have largely been held in easy access
accounts, with the low interest-rate
environment (both current and expected future
rates) dampening demand for term products
as there is less incentive to put money into
these accounts when easy access accounts
have similar rates.
Chart 14 shows that over the first quarter of
this year deposits continued to grow. During
the pandemic many households have had
their regular outgoings substantially lower
because of Covid-19-related restrictions, but
they have also looked with increased
uncertainty at their future finances and
employment prospects and postponed or
forgone spending, resulting in a steep rise in
savings of 16.3 per cent compared to the end
of Q1 2020.
Chart 14: Personal deposit account balances
Source: UK Finance
In Q4 2020, as the economy showed signs of
improvement the rise in deposits slowed,
however this accelerated again in Q1 as
lockdowns were once again put in place. This
suggests that households remain cautious,
which tallies with recent consumer confidence
indices that indicate increased plans to save,
and with economists’ expectations of a growth
in the savings rate during the pandemic.
Total deposits grew by six per cent over the
quarter, with both access accounts and time
deposits increasing by seven per cent and 1.7
per cent respectively. Households have
chosen to prioritise the ease of access of
savings in access accounts in uncertain times
over the rates of returns held in fixed accounts
such as ISAs, with the total amount of savings

14
held in in ISAs declining by £10 billion between
Q1 2020 and Q1 2021.
Disclaimer This report is intended to provide information only
and is not intended to provide financial or other
advice to any person. While all reasonable efforts
have been made to ensure the information
contained above was correct at the time of
publication, no representation or undertaking is
made as to the accuracy, completeness or
reliability of this report or the information or views
contained in this report. None of UK Finance or
its officers, employees or agents shall have any
liability to any person for decisions or actions
taken based on the content of this document.