Embed Size (px)
Citation preview
Household Determinants and Respiratory Health Impacts of Fuel Switching in Indonesia
Prepared by: Jesse Lamarre-Vincent
Master of Public Policy Candidate
The Sanford School of Public Policy
Duke University
Faculty Advisor: Subhrendu Pattanayak
May 2, 2011
TABLE OF CONTENTS
Executive Summary……………………...…………………………...……..i-iii
Policy Question…………………………...…………………………...………..1
Background and Problems…………………………………………..………..1-6
Study Design………………………………………………………...………..7-9
Data & Methods………...……………………………………...…………10-16
Results and Interpretation…………………………..……………..…...…..17-37
Discussion and Policy Implications……………………………………..…38-40
Bibliography…………………………………………………………..……41-42
Appendices…………………………………………………...…………….44-47

i
EXECUTIVE SUMMARY
Research Questions:
Examining the data from the Indonesian Family Life Survey, what are the determinants of a household’s decision to switch from biomass to cleaner alternatives?
Based on a household’s decision to switch to cleaner cooking fuels, do we see improved respiratory health outcomes as a result of this behavior?
Introduction
This paper examines two factors involved in the environmental health risk of indoor air pollution for households in Indonesia. First, I examine the determinants of a household’s decision to switch to cleaner burning fuels. Based on the decision of a household to switch to cleaner burning fuels, I test if the decision of a household to switch to cleaner fuels impacts respiratory health outcomes.
There are real and immediate policy implications for this type of analysis. Indoor air pollution has serious health impacts on individuals in developing nations, especially women and children. Understanding the factors that contribute to a household’s decision to adopt cleaner burning fuels has implications for the design of improved stove intervention programs. The ability to quantify the health benefits of stove switching will assist policy makers in allocating scarce resources for interventions, and justifying these interventions to funders.
With renewed interest in improved stove projects and funding dollars being spent to scale up successful initiatives there is a need for a better understanding of the characteristics of the targeted population. To justify additional funding for improved stove efforts there is a need for more rigorous impact evaluations, linking them to improved health and increased productivity.
Data and Methods
The data used to answer my research questions comes from the Indonesian Family Life Survey, a longitudinal dataset that has been conducted in four waves over a span of fourteen years. For the purposes of this research project the first IFLS wave, conducted in 1993, is not used, as they did not collect information on the household cooking fuel type.
To examine determinants of household fuel use and fuel switching decisions I examine data from IFLS-2 (1997) to IFLS-3 (2000), the first two waves that have data on
ii
household cooking fuel choice. I have coded variables at the household level for this part of my analysis, with a sample size of 4,793 households.
To examine health effects I examine data at the individual level. The sample size grows from 33,938 individuals in IFLS-2 (1997), to 42,650 in IFLS-3 (2000), and finally to 44,109 in IFLS-4 (2007).
Results and Interpretation
Having electricity, living in an urban area, having indoor water, higher household member levels of education, and the log of per capita household income are all negatively correlated with the dirty fuel indicator, and positively correlated with the clean fuel indicator. All these variables are highly statistically significant. This conclusion is based on eight models (Tables 3a – 8) on a sample of approximately 4700 households.
In terms of respiratory health effects the relationships are much more difficult to interpret based on a households fuel switching behavior. Young children are much more likely to experience respiratory problems, but households with biomass fuels are negatively correlated with these indicators. This same trend generally exists across models looking at individual respiratory indicators (cough, dry cough, cough with phlegm etc.). A more highly specified model may be necessary to make sense of these seemingly counter-intuitive results.
Results for lung capacity measures are also frustrating in their difficulty to interpret. In the model included in this analysis using a biomass fuel is correlated with an increase in lung function.
The indicator for switching to a cleaner burning fuel and continuing to use it is significant in the pooled respiratory indicator and cough models. This is the hypothesized effect, but is only significant at the five percent level. Again, a more narrowly focused model may be able to shed more light on the nuance of the fuel switching effect.
Conclusions and Policy Recommendations
The evidence from the determinants of household fuel switching echoes previous studies showing that greater education and incomes lead to an increase in fuel switching behaviors. Conducting this analysis in a new country context and replicating previous research strengthens the literature regarding fuel-switching characteristics of households.
Urban households are much more likely to use clean burning fuels, which lends some credence to arguments that fuel switching may largely be market driven, with rural household lacking access to easily accessible markets to buy cleaner burning fossil fuels.
The main recommendation from this project is that more work needs to be done to properly analyze available information on stoves and their health effects. More rigorous analysis will wield evidence to strengthen interventions and provide support for those that have already taken place. With only a gross indicator of fuel type in the IFLS it is difficult to
iii
understand the duration and intensity of exposure, making accurate modeling of health effects difficult. Despite these limitations, there are certainly many more insights waiting to be uncovered in publicly available data.
A corollary recommendation is to collect more detailed information on the exposure patterns of stove use. This study, like many others, relies on available data that was not collected with the question of stoves specifically in mind. To make more accurate causal claims, better data is needed. With an increased interest in stove interventions, policy makers must push for well thought out data collection and rigorous evaluations. In this way every intervention can contribute to improving the next.
1
HOUSEHOLD DETERMINANTS AND RESPIRATORY HEALTH IMPACTS OF FUEL SWITCHING IN INDONESIA
POLICY QUESTION
What are the determinants of a household’s decision to switch from biomass to cleaner alternatives in Indonesia?
Based on a household’s decision to switch to cleaner cooking fuels, do we see improved respiratory health outcomes as a result of this behavior?
BACKGROUND AND PROBLEMS
After diarrheal diseases the WHO estimates that acute lower respiratory infections (ALRI) are the diseases with the greatest share of environmental contribution to mortality and morbidity worldwide [8]. These diseases include pneumonia, which is a particular risk for young children and the elderly. For children under the age of five the WHO states that ALRI’s are the single most significant cause of death, leading to over 2 million deaths annually. In the developing world this is largely due to indoor air pollution from biomass-stove use.
The WHO estimates of the burden of disease due to indoor air pollution conducted in 2007 paint a grim picture. In Indonesia they estimate that 72% of the population uses solid fuels, with 15,300 deaths and 320,800 disability adjusted life years (DALY’s) every year attributable to indoor air pollution [9]. The WHO issued an updated report on air quality guidelines for particulate matter, ozone, nitrogen dioxide and sulfur dioxide in 2005 in which they give detailed descriptions of target levels and interim goals [10]. Exposure to these pollutants in the developing world comes primarily from cooking and heating with biomass fuels.
There have been many improved stove interventions in the past several decades. They largely consist of interventions to improve the efficiency of biomass stoves or to improve ventilation so that smoke does not stay within the household. The second major intervention is to move people off of biomass fuels to fossil fuels or electricity. This is discussed in the literature as moving up the ‘energy ladder’. The first step in this ladder involves moving from biomass fuels to coal, then on to kerosene, and finally towards liquid petroleum gas (LPG).
Biomass fuels, which include wood, dung and agricultural waste products, are used by a large portion of the developing world for the basic energy needs. Over three billion people in the world using solid fuels for some portion of their energy use, heating their home, boiling water, or cooking food [10]. Burning biomass fuels releases a large number of harmful pollutants including carbon monoxide, benzoapryrene, nitrogen dioxide, formaldehyde and others, in addition to harmful particulate matter [11]. The WHO has estimated that indoor air pollution is partially responsible for over 1.5 million annual deaths,
2
mainly from acute lower respiratory infections (ALRI) in children, and from lung cancer and chronic obstructive lung disease (COPD) in adults [3]. The negative effects of burning biomass fuels fall mainly on mothers, who have primary responsibility for cooking in developing countries, and on young children that are in the house with their mother.
The link between burning biomass cooking fuels and other health effects is in need of further research. There have been a limited number of studies that suggesting links between indoor air pollution and tuberculosis, low birth weight, asthma, cataracts, and cardiovascular disease. Observational studies and randomized trials that are focused on these negative health outcomes should be a priority for further research. Most important is the need to examine negative perinatal outcomes, particularly with the strong evidence for the high risk of ALRI and pneumonia for children under five.[1]
There is a small body of literature that looking at the health effects of stove switching behavior, but that literature is not robust. The studies that exist are largely limited to a handful of developing countries (Malawi, Mexico, Philippines, China, Zimbabwe, Bangladesh, India, Costa Rica, Bolivia, and Kenya). From the literature review conducted I could find no studies of indoor air quality for Indonesia. The literature regarding biomass fuels in Indonesia found for the literature review relates only to the potential effects on deforestation rates due to fuel subsidies [5].
By conducting analysis in a country that has not yet been examined I will be adding to the currently available knowledge on both the health effects of biomass fuel use and what drives households to adopt cleaner burning fuels (or to regress back to dirty ones). The U.S. State Department has recently pledged $50 million dollars to promote cleaner burning stoves in the developing world, and it is important to have causal evidence for the positive effects of these interventions.
In this paper I use regression analysis to examine aspects of biomass fuel use by households in Indonesia using longitudinal data from the Indonesian Family Life Survey (IFLS). First, I identify the characteristics driving fuel-switching behavior among households. Second, I examine if biomass fuel use impacts individual health, conditional on fuel choice (derived from answering the first question).
Both questions have important policy implications for the field of global environmental health [1-5]. As donors ramp up funding for improved stove projects or fuel switching initiatives, there is a continuing need to understand the characteristics of the population that drive higher rates of adoption so that more effective targeting can occur [6, 7]. It is equally important to examine whether adoption of improved stove technologies or fuels has a positive health impact on the population. With this information we can justify spending money on interventions.

3
Biomass Fuel Use and Indoor Pollution
Biomass fuels, primarily wood, dung, and coal, are burned by billions of people worldwide as their primary source of cooking, heating and lighting. These fuels are the primary cause of indoor air pollution (IAP) in these developing countries. The WHO estimates that burning biomass fuels in homes in the developing world is responsible for much of the indoor air pollution. This in turn is a major contributor to the burden of disease and premature deaths [2]. In Indonesia the WHO estimates that cardiovascular disease account for a mortality rate of 34 out over 100,000 people.
Previous study has linked IAP to a diverse range of disease, including pneumonia, acute respiratory infections, tuberculosis, asthma, cardiovascular disease, cataracts, and recently to complications with pregnancy [3]. Of particular importance is the effect of IAP on young children under the age of five, as a leading cause of pneumonia and acute lower respiratory infections (ALRI) [4]. Evidence from these same studies has linked IAP to increased rates of chronic pulmonary disease (COPD) in adults, particularly women whom may be spending more time cooking.
IAP has also suspected of being linked with cancer due to long-term exposure, but lacks an evidence base to conclusively prove this connection. While further study is necessary, it is known that there are carcinogenic emissions being emitted from burning biomass fuels and it is expected that prolonged exposure will lead to increased rates of cancer. Studies that have examined fuel switching or improved stove interventions focus mainly on their short-term health impacts. Studying the longer-term impacts of stove use on health is a major knowledge gap in our understanding and a neglected area of global health research.
Specific Health Risks from Biomass Fuels
There are a number of harmful substances that are released during the combustion of biomass fuels detrimental to respiratory health, which include fine particulate matter, carbon monoxide, sulfur oxides, nitrogen oxides, formaldehyde, and carcinogens such as benzopyrene [5] [6] [7].
• Particulates are harmful to respiratory health, especially those that are smaller than 2.5 micrometers. These tiny particles, referred to in the literature at PM2.5, cause a number of respiratory issues as they are inhaled into the lungs. They irate and inflame lungs, increasing the likelihood of respiratory infections. In addition these particles can serve to reduce the bodies systems that protect the respiratory system, including mucocillary clearance and macrophage response. In addition to increased infections PM2.5 is linked with wheezing and asthma.
• Carbon Monoxide (CO) in high concentrations can be deadly, but even in lower concentrations can be harmful, particularly to children in the womb.
• Nitrogen dioxide in high levels has a detrimental effect on bronchial reactivity. This increases wheezing and can the severity of asthma. Exposure in the long term will increase an individual’s likelihood of contracting respiratory infections.
4
• Sulfur dioxide, as with nitrogen dioxide, causes increased bronchial reactivity in acute levels, which is linked with wheezing and asthma. In addition it is linked with increased incidence of COPD and cardiovascular disease.
• Formaldehyde has the ability to cause irritation of the nasal passages and airways, which leads to increased susceptibility to asthma and respiratory infections.
• Benzopyrene is a carcinogen that has been linked with a number of cancers. • Toxins in biomass smoke have been linked to cataracts in the eyes through absorption.
Benefits of Improved Fuels/Stoves
There are multiple benefits when households move from biomass fuels to cleaner burning stoves and/or fuels. The first, and the focus of this paper, is the health benefits gained from reduced exposure to IAP. The second major benefit of reduced biomass fuel use is the lowered pressure on forests for biomass resources. The third and final major benefit it the reduction in black carbon emissions, which has been increasingly studied as a factor in global warming.
• Improved Health – Reduced exposure to IAP from biomass fuels should result in a corresponding reduction in both acute and long-term respiratory illnesses. There is significant literature to support the connection between biomass fuels and pneumonia in children under five in the developing world, as well as chronic obstructive pulmonary disease in middle age women[8]. In addition there is substantial evidence to support links between IAP and increased rates of cancer and tuberculosis, though there is more study is needed to make these links conclusive. According to the WHO close to 40% of all ALRI and 20% of COPD are caused by IAP, which accounts for approximately 3% of the global burden of disease [9].
• Forests/Biodiversity – The decreased pressure on forests, as a source of fuel, is one of the benefits that drove improved stove interventions as early as the 1970’s. Protecting forests also ensures that the biodiversity within those forests is protected. There has been some scholarly argument in recent years as to whether communities that predominantly use firewood as their primary cooking fuel have a negative effect on the forests in their area. [10, 11]
• Emissions reductions/Black carbon – With increasing global focus on climate change a reduction in the particulate emissions, or black carbon, from biomass stoves is a significant benefit that is being evaluated. While greenhouse gases can stay in the atmosphere for long periods of time, the effects of black carbon reduction can be seen almost immediately. A reduction in biomass cookstove use may be an effective short-term mitigation strategy for global warming.[12, 13]
• Time – The time that a family saves from adopting cleaner burning fuels may be the greatest benefit of all based on a recent study. Women and children who may be required to collect firewood or tend inefficient cooking fires can gain significant amounts of time for education or income generating activities. In addition the heath benefits from cleaner burning fuels reduce the amount of time that individuals in a
5
household may be sick with respiratory illnesses, and likely will extend the lives of these individuals. In a study estimating the benefits from a hypothetical improved stove intervention implemented at a global scale the authors found that 84% of benefits would accrue in the form of time and/or fuel savings[14].
Indoor Air Pollution in Indonesia: A Major Environmental Health Risk
Mortality and morbidity are a major risk from the IAP caused by biomass fuels. The risk posed by IAP has not been adequately studied to identify the context specific risk factors and relative magnitudes of various negative health outcomes. For both government policy makers and NGOs implementing improved stove projects these insights will be critical to successful and sustainable interventions. Having insight into these issues will be increasingly important as awareness about the risks of IAP become better understood. This study provides a first coarse examination of biomass stove use in Indonesia, characterizing the extent of its use, what may drive a household to adopt cleaner burning fuels, and the potential respiratory health benefits from adopting cleaner burning fuels.
Health Impacts from Indoor Air Pollution in Indonesia
• Children – Young children are the most adversely effected population by IAP around the world. This is due to the fact that their lungs are still developing and are at a greater risk for infections. Young children under the age of five are more closely watched and are with their mothers during cook times, when exposure to IAP is at its highest. Studies have shown that exposure to IAP puts young children at significantly higher risk for ALRI, with pneumonia being a main cause of death in young children.
• Women – Studies have also shown that women who do the cooking in households with biomass cooking fuels suffer the most significant negative health impacts. Chronic obstructive pulmonary disorder is the most conclusively documented outcome, with a number of observational studies and one randomized trial linking COPD in middle age women in Guatemala to cooking with biomass fuels.
• Pregnancy and neonatal effects – While there is less evidence, studies have linked IAP exposure in pregnant women to negative neonatal outcomes. While this is not a focus of this study, further examination of the specific effects on pregnant women is recommended.
Public Policy Implications
• Indoor Air Pollution research in the Indonesian context – There has been no study to date that specifically examines the effects of indoor air pollution on the health of individuals in Indonesia. A recent study attempted to quantify the health costs from indoor air pollution in Indonesia using three separate approaches; Cost of Illness (COI), the Human Capital Approach (HCA), and Value of a Statistical Life (VSL) analysis. The COI was used to calculate the costs associated with diseases that have been know to be linked with IAP, including ALRI and COPD. Their analysis found a central estimate of total health costs, between their upper and lower bounds, of $1.4 billion per year[15]. These are the costs associated only with the health effects of IAP.

6
The additional benefits in terms of time savings and environmental gains would make this estimate much greater.
• Improving interventions - There is a general consensus in the academic community that there are negative respiratory health effects from indoor air pollution. This analysis strengthens the evidence. Knowing that indoor air pollution is causing significant negative health effects should drive further interest in targeted interventions to mitigate these negative health effects.
7
STUDY DESIGN
Hypotheses
Hypothesis 1: Households will be more likely to switch to cleaner burning stoves with higher education levels and higher household incomes.
Hypothesis 2: Households switching from biomass to cleaner burning fuels will have improved health outcomes compared with households continuing to burn biomass fuels.
These hypotheses are interesting because there continues to be uncertainty regarding these two facets of stove adoption. Answering these questions will contribute to the narrow literature base for both the research and the policy community.
The first hypothesis comes from an improved stove adoption meta-analysis I conducted (see appendix for tables). There were no definitive findings across all studies, and so I would like to validate whether these determinates of stove switching are influential in the Indonesian context.
The second hypothesis is derived from the recent literature on health effects of biomass fuels, and again will be interesting to examine in a specific country context [4, 16, 17]. The longitudinal data from IFLS will allow for the tracking of general health trends across waves for those who use biomass fuels, those who use cleaner fuels, and those who have switched.
Methodology for Determinants of Fuel Switching
A meta-analysis on the determinants of adoption of improved cook stoves was conducted, which includes the use of improved fuels. This analysis gives me an initial idea of the variables that may be influential in a household’s decision to adopt cleaner burning household fuels. The tables from this meta-analysis can be found in the Appendix. The tables suggest that important determinants in a households decision to switch to a cleaner burning stove are number of people living in a household, household income, education levels, and the age of the head of household.
I use a logistic regression model for my analysis of the determinants of household fuel switching. Looking at fuel type in IFLS-2 provides the baseline fuel observations for a household in 1997, with IFLS-3 providing an indicator of fuel use in 2000. Based on these two observations an indicator variable for fuel switching (from dirty to clean fuels) was created.
To examine the determinants on a households fuel-switching I utilize the following logistic regression models:

8
Yh= B0 + BA Aih + BS Sh + εih
Ys is the fuel switching outcome (e.g., coded as a dummy variable if the household has switched fuels between IFLS waves) in household h; Aih are a set of variables specific to individuals within the household, (including head of household age, spouse age, maternal education level, paternal education level, highest education within the household; Sh is a set of household level variables, including a measure of household income/expenditures (log of per capita household income), number of rooms in the household, total number of household members, whether the household has electricity, whether the household is located in an urban area, if the household has indoor water, if there is an outdoor kitchen, and finally if cooking and sleeping take place in the same room; and εih is the idiosyncratic error.
I look at fuel switching both from biomass fuels (wood/charcoal) to cleaner burning fuels (kerosene/LPG/electricity), but also cases where the reverse is true. In addition an examination of households that do not switch fuels from wave to wave is analyzed. From the three IFLS waves with cooking fuel type data there is enough information to determine two separate points where households may have switched their fuel type. This ends up creating eight categories of fuel switching households for use in the following health effects analysis.
Methodology for Health Effects of Biomass Stove Use
The foundation of this section of my quantitative analysis is the notion that use of biomass fuels has a negative impact on an individual’s respiratory health1. There is abundant research that points to these negative health impacts, but there is some ambiguity and limitations in the current literature, such as accounting for the endogeneity of the choice of fuel/stove technology choice. I will seek to use the data available to me to verify that these negative health effects exist in Indonesia.
To estimate the effect on an individual’s respiratory health I will be utilizing the following model:
Yih= B0 + BA Aih + BS Sh + µh + εih
Where Yih is the health outcome (e.g., self-reported respiratory health morbidity measures/lung capacity) for individual i in household h; Aih are a set of variables specific to the individual, including age, height, gender, highest education level achieved; Sh is a set of household level variables, including income/expenditures, size of the home, whether the kitchen has ventilation, fuel used; and εih is the idiosyncratic error. Specifically, I will be examining how the fuel choice and kitchen ventilation impacts health outcomes, ceteris paribus. I anticipate applying a two-stage approach that uses the predictions on household fuel choice (stage 1) in the model of household respiratory health (stage 2).
1 The evidence is strong for negative health effects from biomass fuels related to acute respiratory infections and chronic obstructive pulmonary disorder. Other negative health effects have been indicated, but there is a paucity of studies.
9
Within IFLS there is a wealth of health information for individuals, including height, weight, hip/waist circumference, general health measures (1-9 scale), lung capacity, chest pains, smoking, self assessed health, blood pressure measurements, chronic conditions, and acute morbidity. In many cases these variables come from the household health portion of IFLS, which includes information for each adult member of a household. There are different modules for these sections, and the relevant variables were merged and in some cases transformed to best approximate variables that have been significant in past studies.
The individual level surveys in IFLS have a number of health related questions at indicate respiratory health outcomes. In past studies variables such as sneezing, sore throat, various cough indicators and other have been used as measures of respiratory health outcomes [18]. Other studies focused specifically on pneumonia using measures of lung function to determine negative health effects of exposure to indoor air pollution [19]. In the Health Measurements module of the IFLS there are three lung capacity measurements taken for all adult household members, which may serve as the best possible lung function indicators.
To measure the health outcomes of children in the household there is a separate module of questions regarding health status and symptoms for children in the house in the past 4 weeks. The question, “did your child ever experience […] in the last 4 weeks?” has measures for cough, dry cough, cough with phlegm, and bloody cough. This is the most promising indicator of child respiratory health I could find within IFLS.
10
DATA AND METHODS
Data Overview and Sources
In order to examine the health effects of biomass fuels I will be utilizing the Indonesian Family Life Survey (IFLS) datasets. The RAND CORPORATION has made the data publicly available and I have downloaded all the available data from the four waves in which the study was conducted. (http://www.rand.org/labor/family/software_and_data/FLS/IFLS/datanotes.html)
Household level data has been extracted from IFLS to understand the determinants of fuel switching behavior.
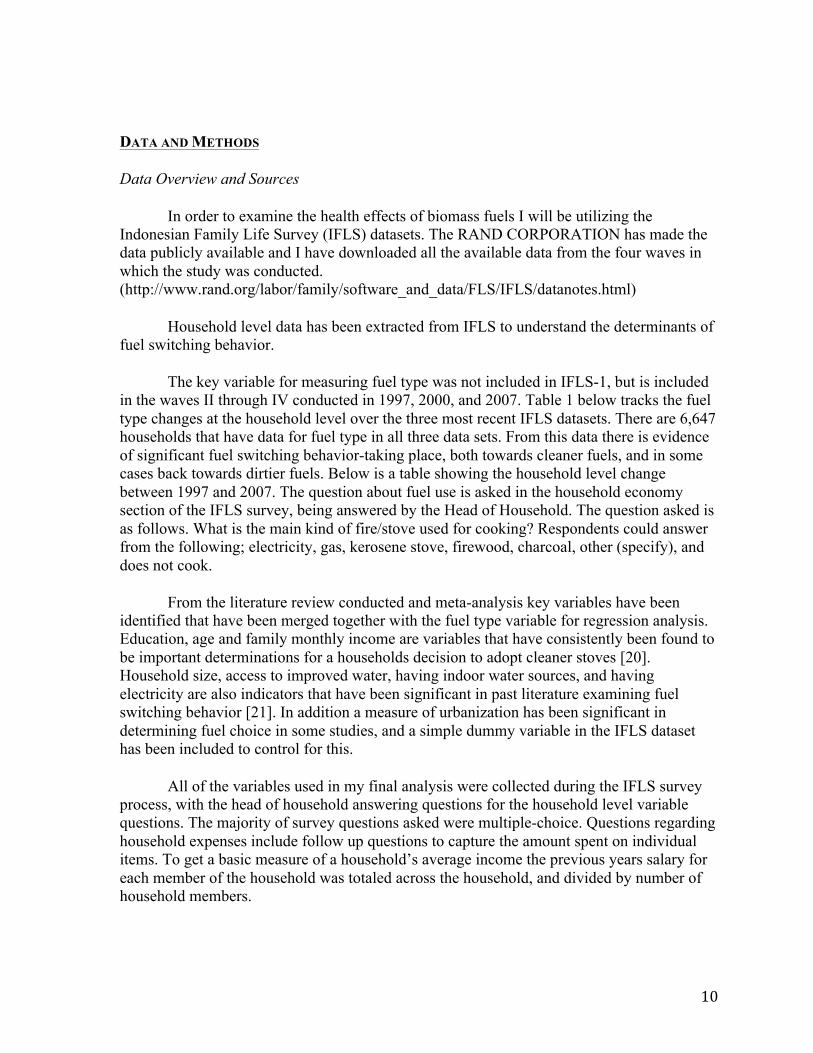
The key variable for measuring fuel type was not included in IFLS-1, but is included in the waves II through IV conducted in 1997, 2000, and 2007. Table 1 below tracks the fuel type changes at the household level over the three most recent IFLS datasets. There are 6,647 households that have data for fuel type in all three data sets. From this data there is evidence of significant fuel switching behavior-taking place, both towards cleaner fuels, and in some cases back towards dirtier fuels. Below is a table showing the household level change between 1997 and 2007. The question about fuel use is asked in the household economy section of the IFLS survey, being answered by the Head of Household. The question asked is as follows. What is the main kind of fire/stove used for cooking? Respondents could answer from the following; electricity, gas, kerosene stove, firewood, charcoal, other (specify), and does not cook.
From the literature review conducted and meta-analysis key variables have been identified that have been merged together with the fuel type variable for regression analysis. Education, age and family monthly income are variables that have consistently been found to be important determinations for a households decision to adopt cleaner stoves [20]. Household size, access to improved water, having indoor water sources, and having electricity are also indicators that have been significant in past literature examining fuel switching behavior [21]. In addition a measure of urbanization has been significant in determining fuel choice in some studies, and a simple dummy variable in the IFLS dataset has been included to control for this.
All of the variables used in my final analysis were collected during the IFLS survey process, with the head of household answering questions for the household level variable questions. The majority of survey questions asked were multiple-choice. Questions regarding household expenses include follow up questions to capture the amount spent on individual items. To get a basic measure of a household’s average income the previous years salary for each member of the household was totaled across the household, and divided by number of household members.
11
A number of questions provide useful indicator variables relating to a household’s level of development, such as the question, does this household utilize electricity. While there is no information on the specific type of stove that is used in each household, there is information on whether the household has an outdoor kitchen, improved ventilation, a separate kitchen, and the number of rooms in the house. These variables may effect the concentration of IAP pollution that household members are exposed to during the cooking process.
Table 1 – Cooking Fuel Type Change 1997-2007
Source: IFLS Data – RAND
While the data has been largely de-identified, the Province that the household comes from is available, as well as a code for the district (kabupaten) and sub-district (kecamatan). These provide a means to control for fixed effects at various spatial levels.
The fuel use and fuel switching outcomes are coded as dummy variables, so I have utilized logistic regression models, clustering standard errors at the household level. Afterwards I run three sets of fixed effects models to filter out characteristics that are uniform across Provinces, Sub-Provinces, and Regencies. For respiratory health effects models OLS regression models with and without fixed effects were used for lung capacity outcomes, again utilizing clustered standard errors at the household level. For self reported respiratory health outcomes, which are coded as dummy variables, logistic regression models were utilized.
Data Characteristics
To get a sense of what the data look like across waves the relevant descriptive statistics have been arranged in the following tables with some commentary on what is shown. Examining these variables it is most useful to look at the changes in terms of
12
percentages, as the total number of households (and individuals) increased across the four IFLS waves.
!"## $%&'()%*'&(*'&(&+&,-".,.-/01"&23 4&",&5- 1"&23 4&",&5- 1"&23 4&",&5-
67+.8 9 93(:% ;<9; #;3;= ><?; @3<< #=#? >3;># #3(A&' ?@<9B @=3#@ ><9BB @<3=? ;9BC; <?3;?@ @3($D ?C 939@
E%-7+ >>@>B <<3B ;>99# <@3=# ;??BC <=3@;F.''.5G 3 #9# 93> C;< #3;< #@>> ;3#CE%-7+ >><>@ #99 ;>C=9 #99 ;;#9< #99
!"#$%&'%'())* !"#$%+'%'&,,, !"#$%-'%'&,,*
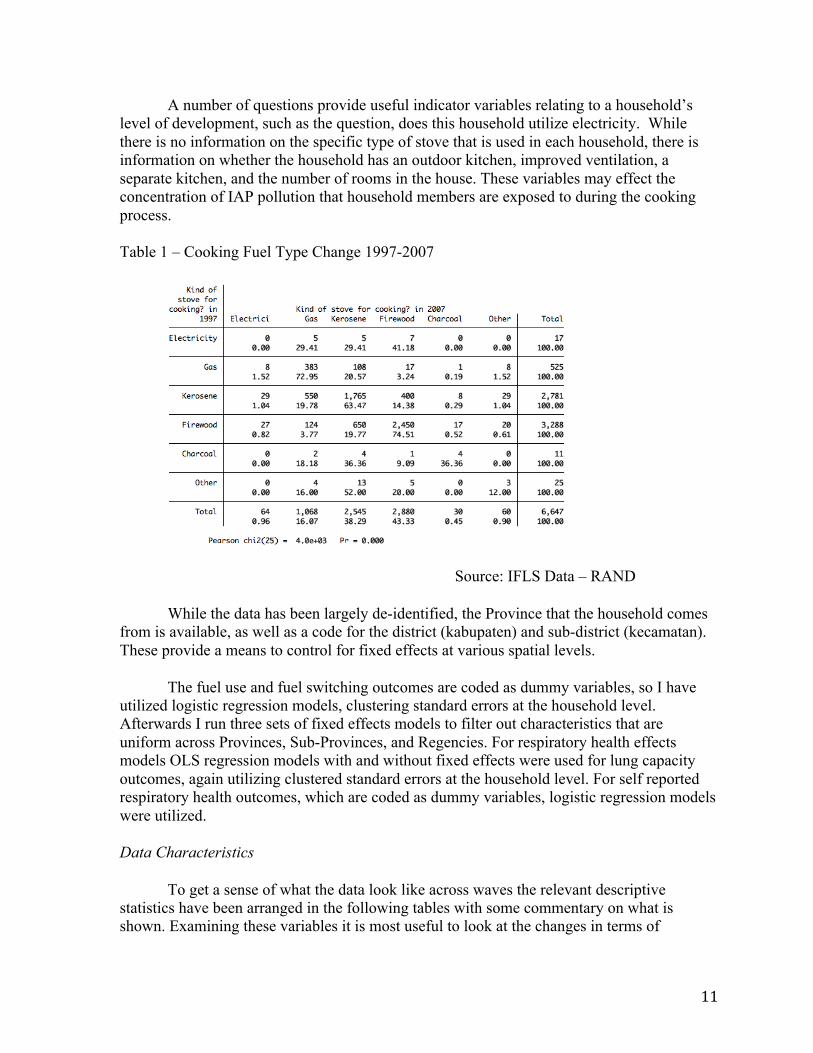
Having electricity has been correlated with improved health outcomes in previous study. Below is the breakdown of individuals living in household with electricity. By the fourth wave of IFLS in 2007 fewer than four percent of individuals were living in household without electricity, as opposed to more than ten percent just ten years earlier.
!"#$ %&'()*+),-*./)+*")0**!&'12"/34 5/"0/'- 2"/34 5/"0/'- 2"/34 5/"0/'-
678&( 9 :94);8/0-"&0&-< 9:= :4>9 9>= :4>9 $9= :4?$# :#4)@7, >==> 9:4$A B:#: 9>4A? C:#$ 9C49?> :>4)%/"),-*./ 9$=># $#4C# #9A?# $?4?# 9A=B: >?4C9$ :$4)2&"/D**( 9==:A $=4B? 9$B$$ >>4== 9=CC> >B4:9= :=4)EF7"0*78 == :49B =B :49> 9AC :4$B :B4)G-F/" C= :4#= >=$ :4C9 #9 :4:=A H*'I-)E**! 9?C :4$=
J*-78 >>C>A ??4A $>::9 ?C4=9 $##A? ?=4C=K&,,&'1 4 9:9 :4> B$? 94$? 9C>: $49=J*-78 >>?>C 9:: $>B=: 9:: $$9:? 9::
!"#$%&'%'())* !"#$%+'%'&,,, !"#$%-'%'&,,*
The type of stove used for cooking is the key input for our independent variable for the first stage regression for determinants of fuel switching, and a key independent variable for the second stage regression for health outcomes. Overall there is a decrease in the use of firewood for cooking across the three waves examined here, though we see a slight increase from 2000 to 2007. In addition it is important to note the increase in kerosene use from 1997 to 2000, as well as the gas increase from 2000 to 2007. The Indonesian government was promoting the use of kerosene as an alternative for wood prior to the year 2000, and later began moving towards a policy of subsidizing the switch to LPG fuels. The general trend we see here may be influenced by this policy.
13
sc05 (1) Urban area (2) Rural (From IFLS-2 - 1997 IFLS-3 - 2000 IFLS-4 - 2007
Freq. Percent Freq. Percent Freq. Percent
Valid 1 1. Urban 16100 47.44 21280 48.75 23544 53.38 2 2. Rural 17828 52.53 22370 51.25 20565 46.62 Total
33928 99.97
44109 100
Missing .
10 0.03
Total 33938 100 43650 100 44109 100
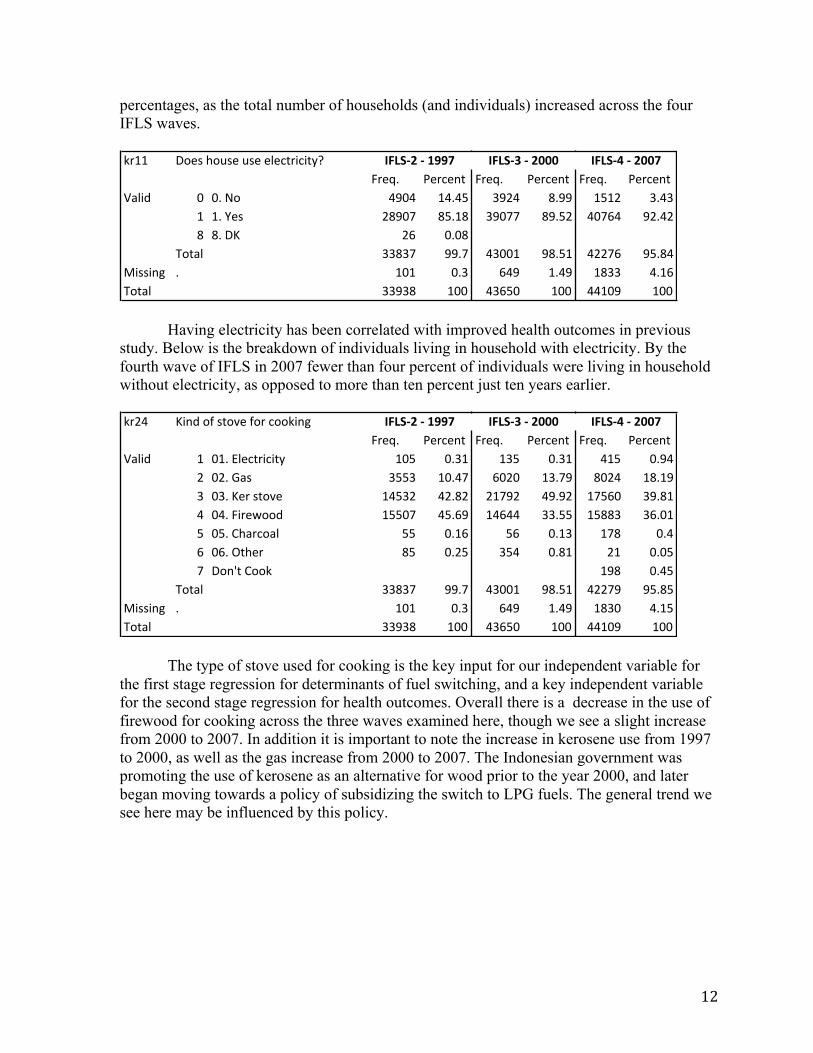
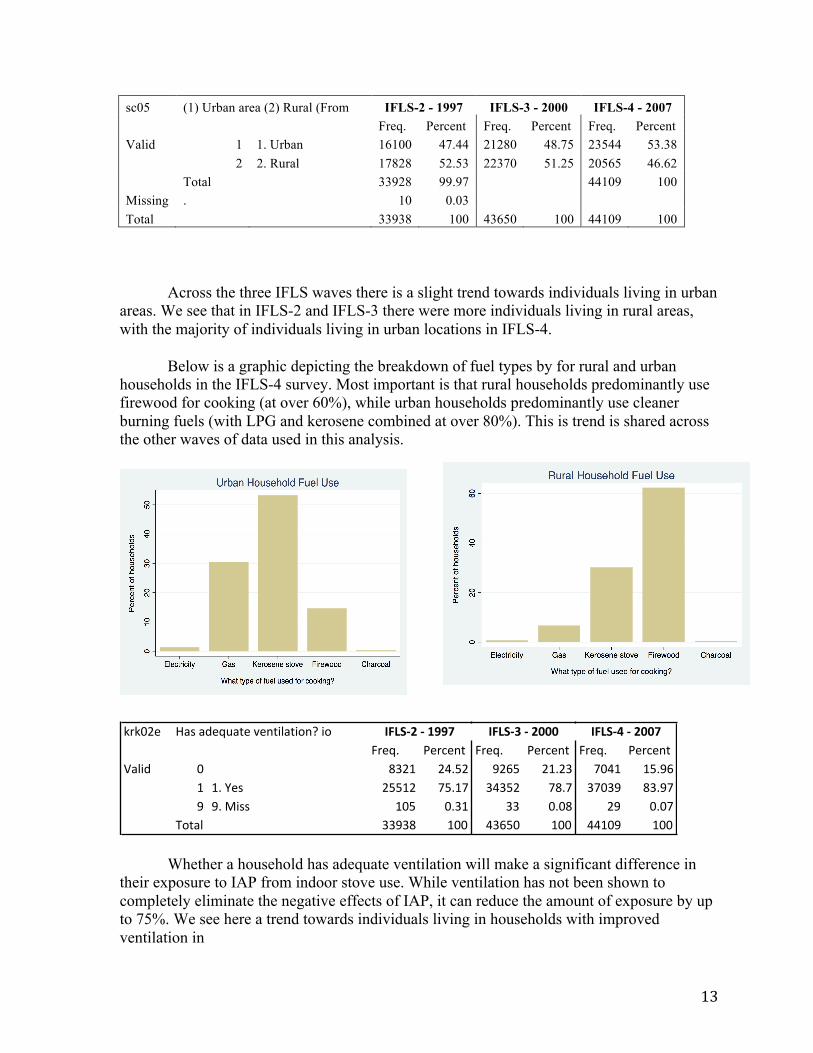
Across the three IFLS waves there is a slight trend towards individuals living in urban areas. We see that in IFLS-2 and IFLS-3 there were more individuals living in rural areas, with the majority of individuals living in urban locations in IFLS-4.
Below is a graphic depicting the breakdown of fuel types by for rural and urban households in the IFLS-4 survey. Most important is that rural households predominantly use firewood for cooking (at over 60%), while urban households predominantly use cleaner burning fuels (with LPG and kerosene combined at over 80%). This is trend is shared across the other waves of data used in this analysis.
!"!#$% &'()'*%+,'-%).%/-01'-02/3)024"%+5 6%"7%/- 4"%+5 6%"7%/- 4"%+5 6%"7%/-
8'10* # 9:$; $<5=$ >$?= $;5$: @#<; ;=5>?; ;5)A%( $==;$ @=5;@ :<:=$ @95@ :@#:> 9:5>@> >5)B0(( ;#= #5:; :: #5#9 $> #5#@
C2-'1 ::>:9 ;## <:?=# ;## <<;#> ;##
!"#$%&'%'())* !"#$%+'%'&,,, !"#$%-'%'&,,*
Whether a household has adequate ventilation will make a significant difference in their exposure to IAP from indoor stove use. While ventilation has not been shown to completely eliminate the negative effects of IAP, it can reduce the amount of exposure by up to 75%. We see here a trend towards individuals living in households with improved ventilation in
14
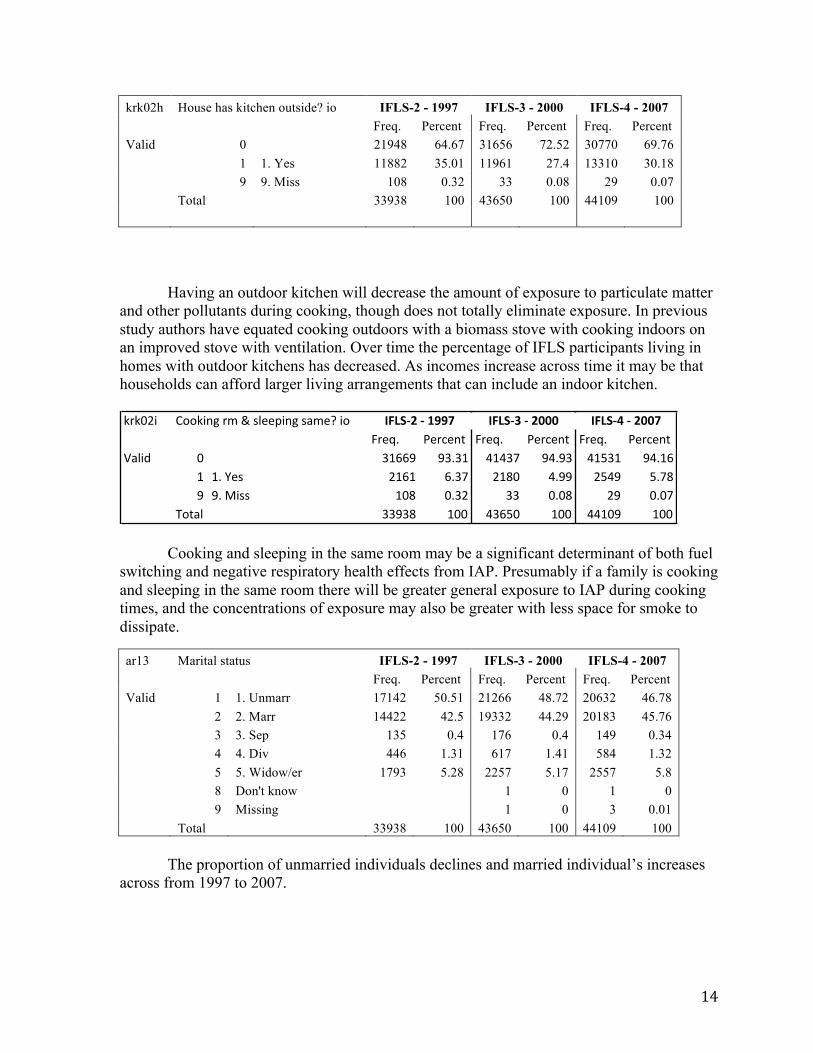
krk02h House has kitchen outside? io IFLS-2 - 1997 IFLS-3 - 2000 IFLS-4 - 2007
Freq. Percent Freq. Percent Freq. Percent
Valid 0
21948 64.67 31656 72.52 30770 69.76 1 1. Yes 11882 35.01 11961 27.4 13310 30.18 9 9. Miss 108 0.32 33 0.08 29 0.07 Total 33938 100 43650 100 44109 100
Having an outdoor kitchen will decrease the amount of exposure to particulate matter and other pollutants during cooking, though does not totally eliminate exposure. In previous study authors have equated cooking outdoors with a biomass stove with cooking indoors on an improved stove with ventilation. Over time the percentage of IFLS participants living in homes with outdoor kitchens has decreased. As incomes increase across time it may be that households can afford larger living arrangements that can include an indoor kitchen.
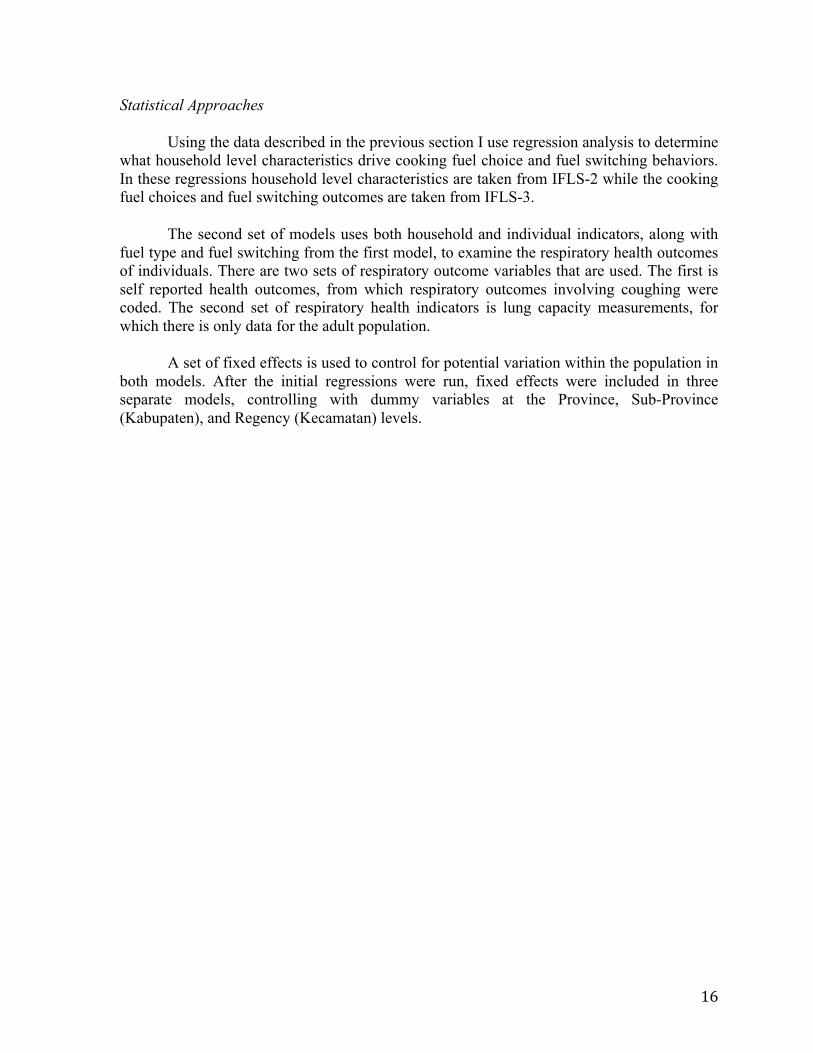
!"!#$% &''!%()*"+*,*-.//0%()*-1+/2*%'3"/45 6/"7/(8 3"/45 6/"7/(8 3"/45 6/"7/(8
91.%: # ;<==> >;5;< ?<?;@ >?5>; ?<A;< >?5<=< <5*B/- $<=< =5;@ $<C# ?5>> $A?> A5@C> >5*D%-- <#C #5;$ ;; #5#C $> #5#@
E'81. ;;>;C <## ?;=A# <## ??<#> <##
!"#$%&'%'())* !"#$%+'%'&,,, !"#$%-'%'&,,*
Cooking and sleeping in the same room may be a significant determinant of both fuel switching and negative respiratory health effects from IAP. Presumably if a family is cooking and sleeping in the same room there will be greater general exposure to IAP during cooking times, and the concentrations of exposure may also be greater with less space for smoke to dissipate.
ar13 Marital status IFLS-2 - 1997 IFLS-3 - 2000 IFLS-4 - 2007
Freq. Percent Freq. Percent Freq. Percent
Valid 1 1. Unmarr 17142 50.51 21266 48.72 20632 46.78 2 2. Marr 14422 42.5 19332 44.29 20183 45.76 3 3. Sep 135 0.4 176 0.4 149 0.34 4 4. Div 446 1.31 617 1.41 584 1.32 5 5. Widow/er 1793 5.28 2257 5.17 2557 5.8 8 Don't know
1 0 1 0
9 Missing
1 0 3 0.01 Total 33938 100 43650 100 44109 100
The proportion of unmarried individuals declines and married individual’s increases across from 1997 to 2007.

15
ar17 Highest grade completed IFLS-2 - 1997 IFLS-3 - 2000 IFLS-4 - 2007
Freq. Percent Freq. Percent Freq. Percent
Valid 0 00. Gr1 incomplete 2187 6.44 3411 7.81 3258 7.39 1 01. Grade 1 2911 8.58 3830 8.77 3823 8.67 2 02. Grade 2 3496 10.3 4354 9.97 3889 8.82 3 03. Grade 3 2352 6.93 2386 5.47 2135 4.84 4 04. Grade 4 1804 5.32 2089 4.79 1832 4.15 5 05. Grade 5 1392 4.1 1584 3.63 1545 3.5 6 06. Grade 6 322 0.95 192 0.44 113 0.26 7 07. Graduated 11542 34.01 17036 39.03 18146 41.14 96 96. N/A 7606 22.41 8287 18.99 9019 20.45 98 98. DK 326 0.96 470 1.08 342 0.78 99 Missing
11 0.03 7 0.02
Total 33938 100 43650 100 44109 100
In terms of education we expect that higher education will be correlated with a greater degree of positive fuel switching. Across the IFLS waves there is an increasing percentage of individuals graduating.
!!"# $%&%'())*+,-.+/0+*-1'+,%()2,34'%56 7%'8%&2 4'%56 7%'8%&2 4'%56 7%'8%&2
9()/: # #6+9%'*+,%()2,* #;<= >6<< ?""@ <6@ ?<A; >6@@? ?6+BC.,(2+,%()2,* #>=@< <@6<> ?"#D# <@6#? #=;#D <"6D;D D6+BC.,(2+1&,%()2,* ???" @6>< D?D# =6< DD>< =6@< <6+E&,%()2,* >@ "6#= >? "6#? A" "6?A A6+F/00 > "6"# ? "
G-2() #A;A? >;6@# ?><?? >;6?< ?D=>> >D6;@F/00/&H 6 #<"<@ <#6DA #;??; <#6=@ ?"D>< <@6#<G-2() DDAD; #"" <D@>" #"" <<#"A #""
!"#$%&'%'())* !"#$%+'%'&,,, !"#$%-'%'&,,*
As a measure of general health we see a decrease in individuals describing themselves as ‘very healthy’ between 1997 to 2000, with an increase between 2000 and 2007.
!"#$ %&'(()*+,-)*+.'&)/0)*+,-)12'&30-14 5-06-7& 30-14 5-06-7& 30-14 5-06-7&
8+('9 # :;$ <4:$ =<: <4>$ >>? <4:<< <4)@-A >$?B <C4< ?:B> <C4:> =>C> <=4$:
D/&+( =##= ;#4>: C;:< ;<4<C ?B>$ <?4C>E'AA'7F 4 ;>CB< =C4B: B$BCC =?4?< B:=$: ?<4#$D/&+( BBCB? <## $B>:# <## $$<#C <##
!"#$%&'%'())* !"#$%+'%'&,,, !"#$%-'%'&,,*
Smoking tobacco products is a potential confounder for determining the health effects of IAP. Across the three IFLS waves used in this analysis the percentage of participants that currently smoke has stayed relatively constant at around twenty percent. This variable was incorporated into the respiratory health outcomes regressions in order to control for this potential confounder.
16
Statistical Approaches
Using the data described in the previous section I use regression analysis to determine what household level characteristics drive cooking fuel choice and fuel switching behaviors. In these regressions household level characteristics are taken from IFLS-2 while the cooking fuel choices and fuel switching outcomes are taken from IFLS-3.
The second set of models uses both household and individual indicators, along with fuel type and fuel switching from the first model, to examine the respiratory health outcomes of individuals. There are two sets of respiratory outcome variables that are used. The first is self reported health outcomes, from which respiratory outcomes involving coughing were coded. The second set of respiratory health indicators is lung capacity measurements, for which there is only data for the adult population.
A set of fixed effects is used to control for potential variation within the population in both models. After the initial regressions were run, fixed effects were included in three separate models, controlling with dummy variables at the Province, Sub-Province (Kabupaten), and Regency (Kecamatan) levels.

17
RESULTS AND INTERPRETATION
Regression for Firewood as Main Household Cooking Fuel
Below in Figure 1 is the percentage of households in each Province with IFLS data that used firewood as their primary fuel in 2000. During this wave 2878 households identified firewood as their main cooking fuel, approximately thirty-seven percent of the overall sample. You can see that there is a significant range of values, with Lampung Province at over fifty percent of households using firewood as their primary fuel, and West Java Province with as little as twenty percent of households using firewood. For Jakarta only 1.23 percent of households used firewood as their main cooking fuel.
Figure 1 – Percentage of Households Using Firewood Cooking Fuel in IFLS-3 (2000)
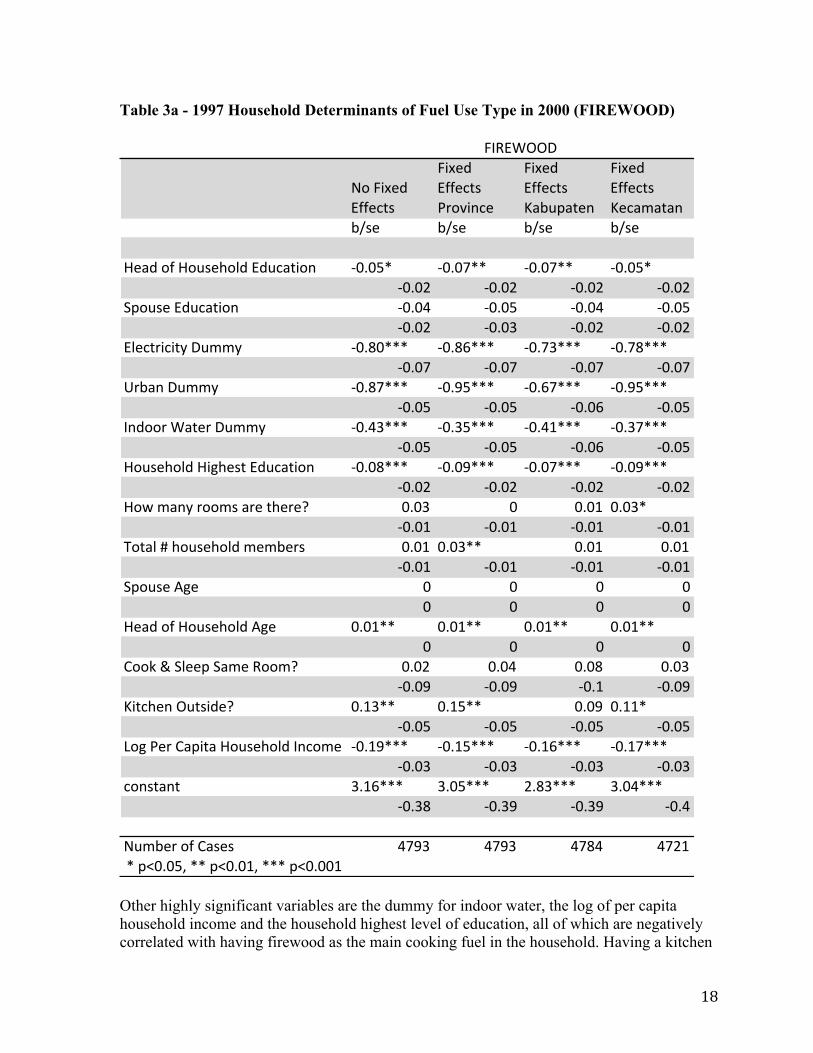
Table 3a contains regression results for Firewood as the dependent fuel use variable with IFLS-2 household characteristics as the independent variables. For the most part independent variables maintain their significance across the fixed effects models. The exception is the dummy variable for having a kitchen outside, which becomes insignificant in the Kabupaten fixed effects model.
The independent variable with the largest effect in this model is the urban dummy, with a coefficient of -.87 in the model without fixed effects. The urban dummy increases in the Province and Kecamatan fixed effects models, increasing the coefficient to -.95, and decreases in the Kabupaten fixed effects model to -.67 but is highly significant across the models. Across the models the dummy variable for having electricity is highly significant and negatively correlated with having firewood as the households cooking fuel.
18
Table 3a - 1997 Household Determinants of Fuel Use Type in 2000 (FIREWOOD)
!"#$%&'(#)**'+,-
$%&'(#)**'+,-#./"0%1+'
$%&'(#)**'+,-#234563,'1
$%&'(#)**'+,-#2'+373,31
48-' 48-' 48-' 48-'
9'3(#"*#9"5-':";(#)(5+3,%"1 <=>=?@ <=>=A@@ <=>=A@@ <=>=?@<=>=B <=>=B <=>=B <=>=B
C6"5-'#)(5+3,%"1 <=>=D <=>=? <=>=D <=>=?<=>=B <=>=E <=>=B <=>=B
);'+,/%+%,F#G577F <=>H=@@@ <=>HI@@@ <=>AE@@@ <=>AH@@@<=>=A <=>=A <=>=A <=>=A
J/431#G577F <=>HA@@@ <=>K?@@@ <=>IA@@@ <=>K?@@@<=>=? <=>=? <=>=I <=>=?
L1(""/#M3,'/#G577F <=>DE@@@ <=>E?@@@ <=>DN@@@ <=>EA@@@<=>=? <=>=? <=>=I <=>=?
9"5-':";(#9%O:'-,#)(5+3,%"1 <=>=H@@@ <=>=K@@@ <=>=A@@@ <=>=K@@@<=>=B <=>=B <=>=B <=>=B
9"P#731F#/""7-#3/'#,:'/'Q =>=E = =>=N =>=E@<=>=N <=>=N <=>=N <=>=N
R",3;#S#:"5-':";(#7'74'/- =>=N =>=E@@ =>=N =>=N<=>=N <=>=N <=>=N <=>=N
C6"5-'#TO' = = = == = = =
9'3(#"*#9"5-':";(#TO' =>=N@@ =>=N@@ =>=N@@ =>=N@@= = = =
U""V#W#C;''6#C37'#X""7Q =>=B =>=D =>=H =>=E<=>=K <=>=K <=>N <=>=K
2%,+:'1#Y5,-%('Q =>NE@@ =>N?@@ =>=K =>NN@<=>=? <=>=? <=>=? <=>=?
Z"O#.'/#U36%,3#9"5-':";(#L1+"7' <=>NK@@@ <=>N?@@@ <=>NI@@@ <=>NA@@@<=>=E <=>=E <=>=E <=>=E
+"1-,31, E>NI@@@ E>=?@@@ B>HE@@@ E>=D@@@<=>EH <=>EK <=>EK <=>D
!574'/#"*#U3-'- DAKE DAKE DAHD DABN@#6[=>=?\#@@#6[=>=N\#@@@#6[=>==N
$LX)MYYG
Other highly significant variables are the dummy for indoor water, the log of per capita household income and the household highest level of education, all of which are negatively correlated with having firewood as the main cooking fuel in the household. Having a kitchen
19
outside is positive correlated with using firewood, significant at the one percent level. The head of household age is also positively correlated with firewood use, but the coefficient is only 0.01.
Regression for Kerosene as Main Household Cooking Fuel
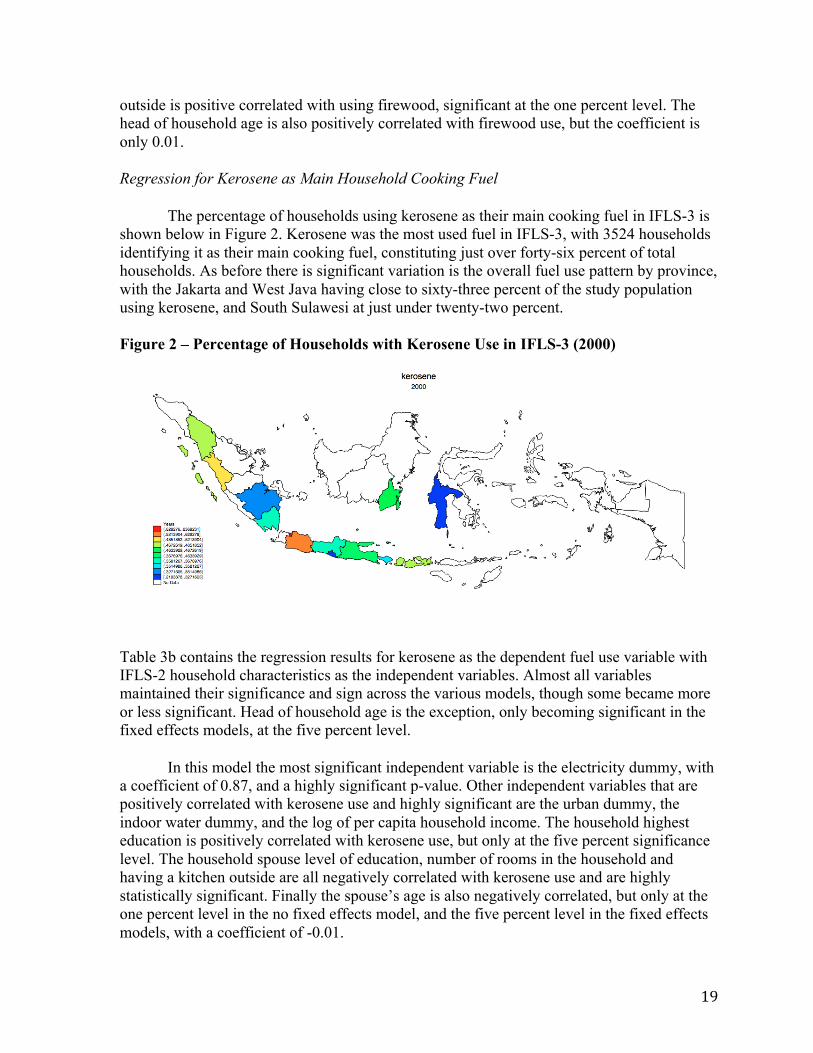
The percentage of households using kerosene as their main cooking fuel in IFLS-3 is shown below in Figure 2. Kerosene was the most used fuel in IFLS-3, with 3524 households identifying it as their main cooking fuel, constituting just over forty-six percent of total households. As before there is significant variation is the overall fuel use pattern by province, with the Jakarta and West Java having close to sixty-three percent of the study population using kerosene, and South Sulawesi at just under twenty-two percent.
Figure 2 – Percentage of Households with Kerosene Use in IFLS-3 (2000)
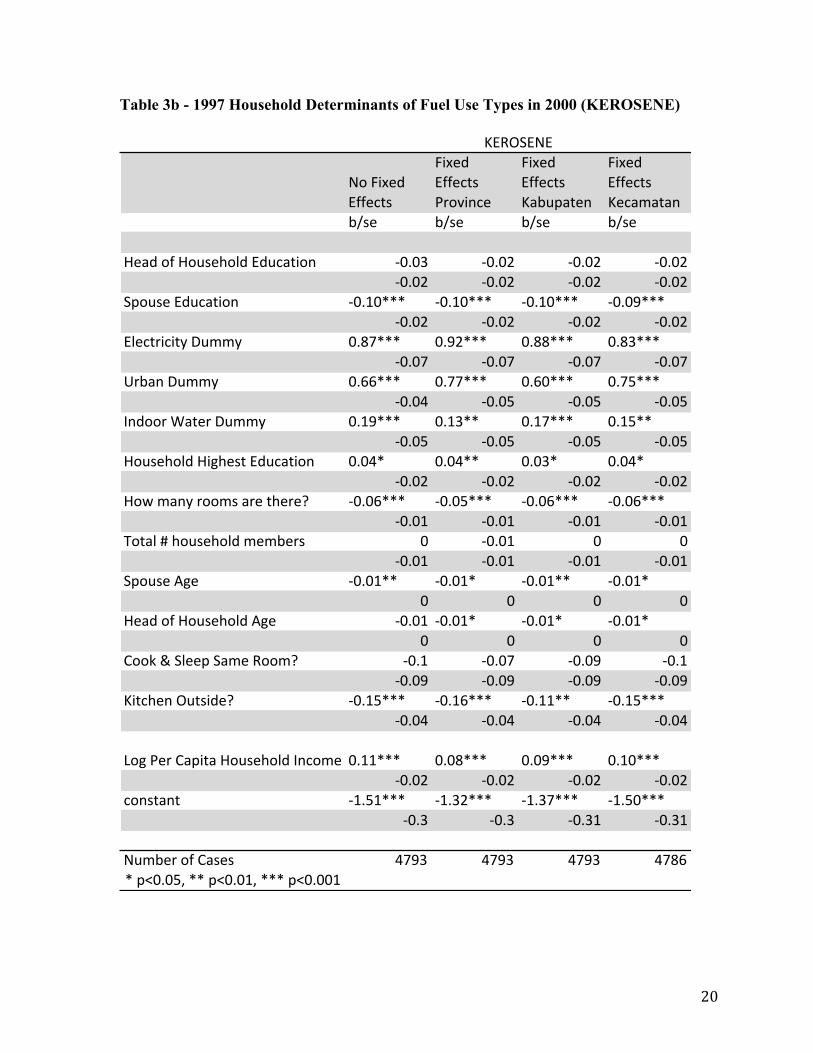
Table 3b contains the regression results for kerosene as the dependent fuel use variable with IFLS-2 household characteristics as the independent variables. Almost all variables maintained their significance and sign across the various models, though some became more or less significant. Head of household age is the exception, only becoming significant in the fixed effects models, at the five percent level.
In this model the most significant independent variable is the electricity dummy, with a coefficient of 0.87, and a highly significant p-value. Other independent variables that are positively correlated with kerosene use and highly significant are the urban dummy, the indoor water dummy, and the log of per capita household income. The household highest education is positively correlated with kerosene use, but only at the five percent significance level. The household spouse level of education, number of rooms in the household and having a kitchen outside are all negatively correlated with kerosene use and are highly statistically significant. Finally the spouse’s age is also negatively correlated, but only at the one percent level in the no fixed effects model, and the five percent level in the fixed effects models, with a coefficient of -0.01.
20
Table 3b - 1997 Household Determinants of Fuel Use Types in 2000 (KEROSENE)
!"#$%&'(#)**'+,-
$%&'(#)**'+,-#./"0%1+'
$%&'(#)**'+,-#234563,'1
$%&'(#)**'+,-#2'+373,31
48-' 48-' 48-' 48-'
9'3(#"*#9"5-':";(#)(5+3,%"1 <=>=? <=>=@ <=>=@ <=>=@<=>=@ <=>=@ <=>=@ <=>=@
A6"5-'#)(5+3,%"1 <=>B=CCC <=>B=CCC <=>B=CCC <=>=DCCC<=>=@ <=>=@ <=>=@ <=>=@
);'+,/%+%,E#F577E =>GHCCC =>D@CCC =>GGCCC =>G?CCC<=>=H <=>=H <=>=H <=>=H
I/431#F577E =>JJCCC =>HHCCC =>J=CCC =>HKCCC<=>=L <=>=K <=>=K <=>=K
M1(""/#N3,'/#F577E =>BDCCC =>B?CC =>BHCCC =>BKCC<=>=K <=>=K <=>=K <=>=K
9"5-':";(#9%O:'-,#)(5+3,%"1 =>=LC =>=LCC =>=?C =>=LC<=>=@ <=>=@ <=>=@ <=>=@
9"P#731E#/""7-#3/'#,:'/'Q <=>=JCCC <=>=KCCC <=>=JCCC <=>=JCCC<=>=B <=>=B <=>=B <=>=B
R",3;#S#:"5-':";(#7'74'/- = <=>=B = =<=>=B <=>=B <=>=B <=>=B
A6"5-'#TO' <=>=BCC <=>=BC <=>=BCC <=>=BC= = = =
9'3(#"*#9"5-':";(#TO' <=>=B <=>=BC <=>=BC <=>=BC= = = =
U""V#W#A;''6#A37'#X""7Q <=>B <=>=H <=>=D <=>B<=>=D <=>=D <=>=D <=>=D
2%,+:'1#Y5,-%('Q <=>BKCCC <=>BJCCC <=>BBCC <=>BKCCC<=>=L <=>=L <=>=L <=>=L
Z"O#.'/#U36%,3#9"5-':";(#M1+"7' =>BBCCC =>=GCCC =>=DCCC =>B=CCC<=>=@ <=>=@ <=>=@ <=>=@
+"1-,31, <B>KBCCC <B>?@CCC <B>?HCCC <B>K=CCC<=>? <=>? <=>?B <=>?B
!574'/#"*#U3-'- LHD? LHD? LHD? LHGJC#6[=>=K\#CC#6[=>=B\#CCC#6[=>==B
2)XYA)!)
21
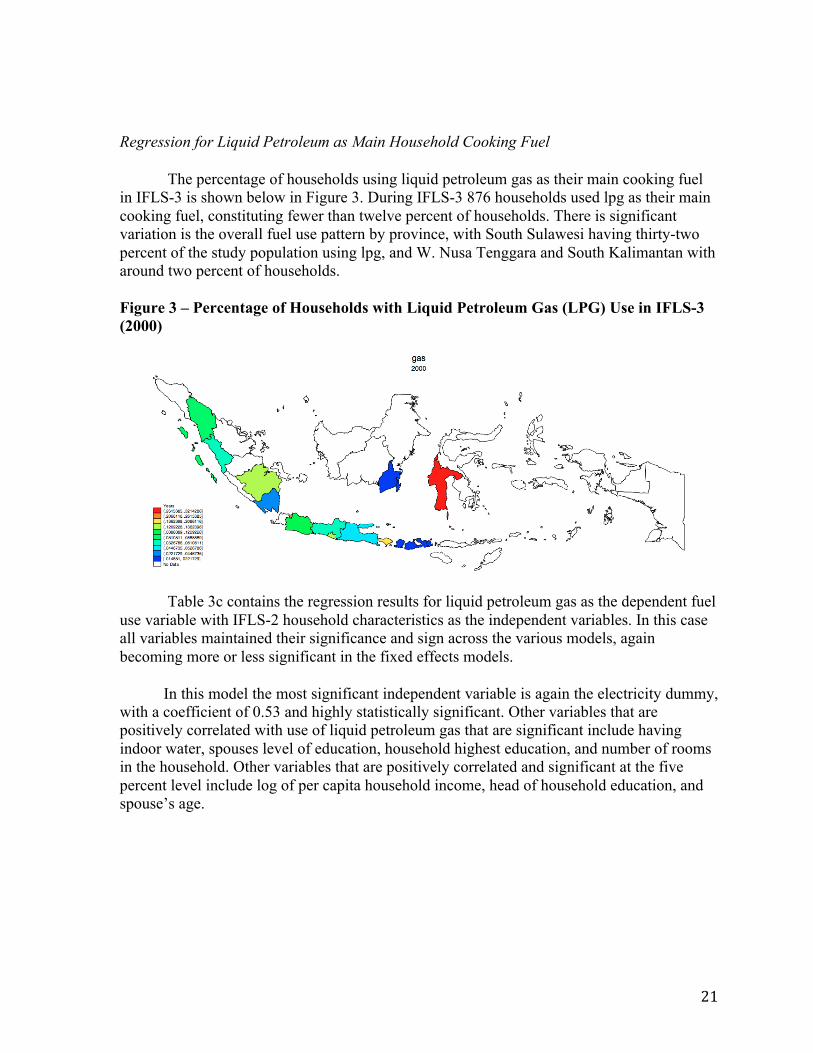
Regression for Liquid Petroleum as Main Household Cooking Fuel
The percentage of households using liquid petroleum gas as their main cooking fuel in IFLS-3 is shown below in Figure 3. During IFLS-3 876 households used lpg as their main cooking fuel, constituting fewer than twelve percent of households. There is significant variation is the overall fuel use pattern by province, with South Sulawesi having thirty-two percent of the study population using lpg, and W. Nusa Tenggara and South Kalimantan with around two percent of households.
Figure 3 – Percentage of Households with Liquid Petroleum Gas (LPG) Use in IFLS-3 (2000)
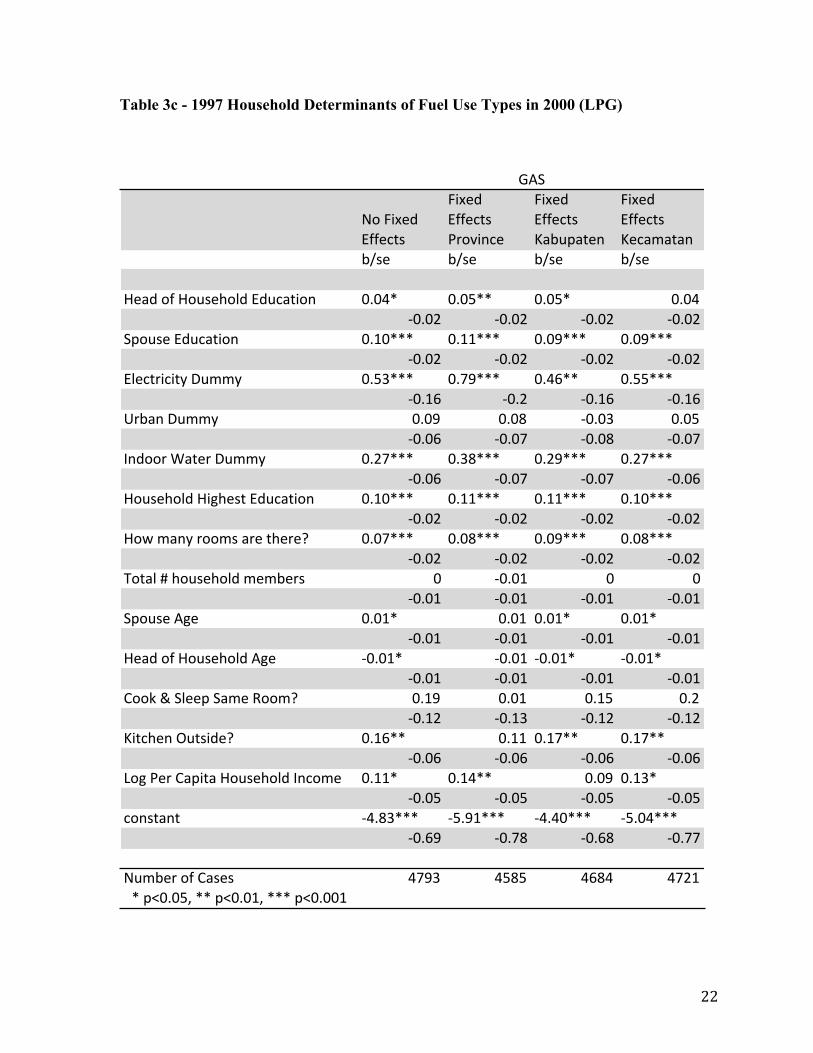
Table 3c contains the regression results for liquid petroleum gas as the dependent fuel use variable with IFLS-2 household characteristics as the independent variables. In this case all variables maintained their significance and sign across the various models, again becoming more or less significant in the fixed effects models.
In this model the most significant independent variable is again the electricity dummy, with a coefficient of 0.53 and highly statistically significant. Other variables that are positively correlated with use of liquid petroleum gas that are significant include having indoor water, spouses level of education, household highest education, and number of rooms in the household. Other variables that are positively correlated and significant at the five percent level include log of per capita household income, head of household education, and spouse’s age.
22
Table 3c - 1997 Household Determinants of Fuel Use Types in 2000 (LPG)
!"#$%&'(#)**'+,-
$%&'(#)**'+,-#./"0%1+'
$%&'(#)**'+,-#234563,'1
$%&'(#)**'+,-#2'+373,31
48-' 48-' 48-' 48-'
9'3(#"*#9"5-':";(#)(5+3,%"1 <=<>? <=<@?? <=<@? <=<>A<=<B A<=<B A<=<B A<=<B
C6"5-'#)(5+3,%"1 <=D<??? <=DD??? <=<E??? <=<E???A<=<B A<=<B A<=<B A<=<B
);'+,/%+%,F#G577F <=@H??? <=IE??? <=>J?? <=@@???A<=DJ A<=B A<=DJ A<=DJ
K/431#G577F <=<E <=<L A<=<H <=<@A<=<J A<=<I A<=<L A<=<I
M1(""/#N3,'/#G577F <=BI??? <=HL??? <=BE??? <=BI???A<=<J A<=<I A<=<I A<=<J
9"5-':";(#9%O:'-,#)(5+3,%"1 <=D<??? <=DD??? <=DD??? <=D<???A<=<B A<=<B A<=<B A<=<B
9"P#731F#/""7-#3/'#,:'/'Q <=<I??? <=<L??? <=<E??? <=<L???A<=<B A<=<B A<=<B A<=<B
R",3;#S#:"5-':";(#7'74'/- < A<=<D < <A<=<D A<=<D A<=<D A<=<D
C6"5-'#TO' <=<D? <=<D <=<D? <=<D?A<=<D A<=<D A<=<D A<=<D
9'3(#"*#9"5-':";(#TO' A<=<D? A<=<D A<=<D? A<=<D?A<=<D A<=<D A<=<D A<=<D
U""V#W#C;''6#C37'#X""7Q <=DE <=<D <=D@ <=BA<=DB A<=DH A<=DB A<=DB
2%,+:'1#Y5,-%('Q <=DJ?? <=DD <=DI?? <=DI??A<=<J A<=<J A<=<J A<=<J
Z"O#.'/#U36%,3#9"5-':";(#M1+"7' <=DD? <=D>?? <=<E <=DH?A<=<@ A<=<@ A<=<@ A<=<@
+"1-,31, A>=LH??? A@=ED??? A>=><??? A@=<>???A<=JE A<=IL A<=JL A<=II
!574'/#"*#U3-'- >IEH >@L@ >JL> >IBD?#6[<=<@\#??#6[<=<D\#???#6[<=<<D
]TC
23
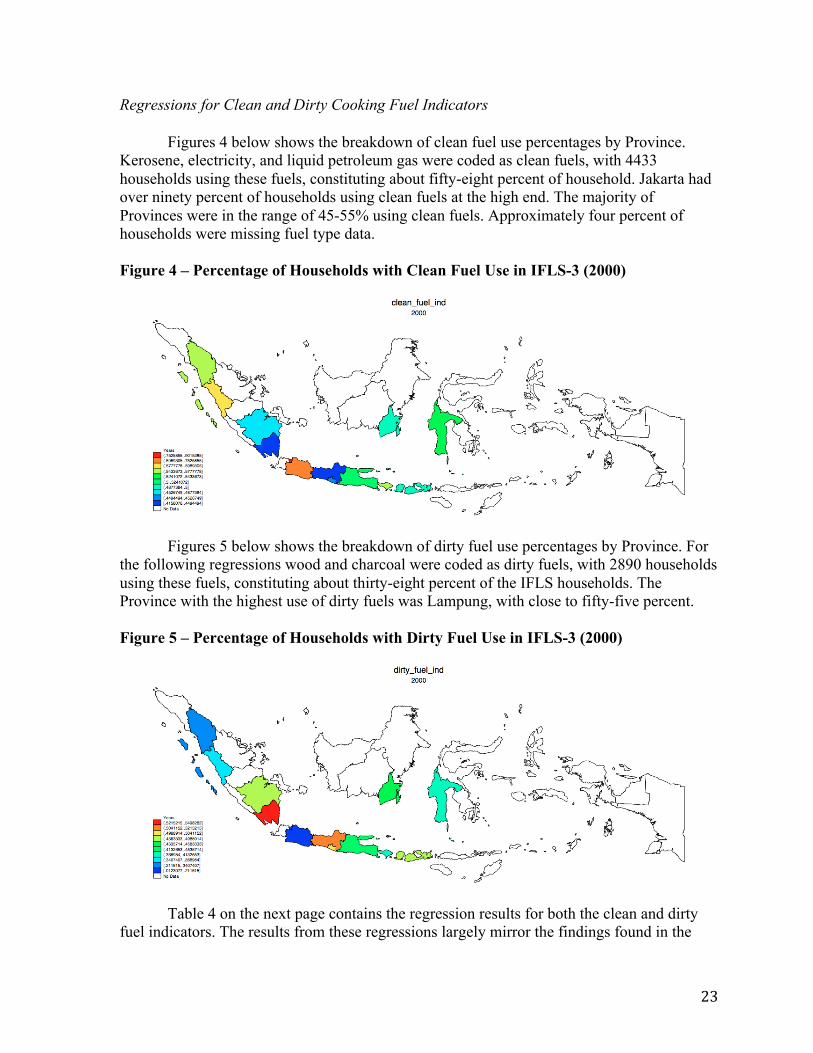
Regressions for Clean and Dirty Cooking Fuel Indicators
Figures 4 below shows the breakdown of clean fuel use percentages by Province. Kerosene, electricity, and liquid petroleum gas were coded as clean fuels, with 4433 households using these fuels, constituting about fifty-eight percent of household. Jakarta had over ninety percent of households using clean fuels at the high end. The majority of Provinces were in the range of 45-55% using clean fuels. Approximately four percent of households were missing fuel type data.
Figure 4 – Percentage of Households with Clean Fuel Use in IFLS-3 (2000)
Figures 5 below shows the breakdown of dirty fuel use percentages by Province. For the following regressions wood and charcoal were coded as dirty fuels, with 2890 households using these fuels, constituting about thirty-eight percent of the IFLS households. The Province with the highest use of dirty fuels was Lampung, with close to fifty-five percent.
Figure 5 – Percentage of Households with Dirty Fuel Use in IFLS-3 (2000)
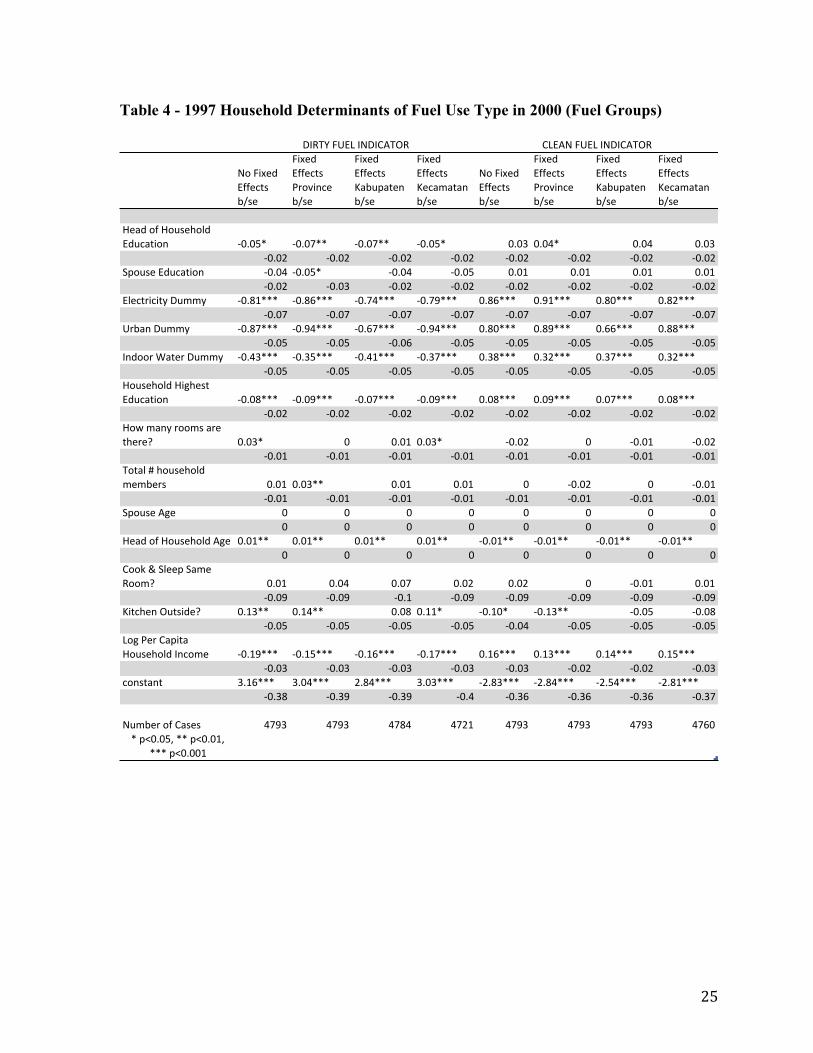
Table 4 on the next page contains the regression results for both the clean and dirty fuel indicators. The results from these regressions largely mirror the findings found in the
24
earlier separate models. Having electricity, living in an urban area, having indoor water, higher household member levels of education, and the log of per capita household income are all negatively correlated with the dirty fuel indicator, and positively correlated with the clean fuel indicator. All these variables are highly statistically significant.
Higher levels of head of household education are negatively correlated with the dirty fuel indicator at the five percent significance level. Head of household age is positively correlated with the dirty fuel indicator and negatively correlated with the clean fuel indicator at the five percent significance level, thought the coefficient is small in both cases in comparison with other significant independent variables.
25
Table 4 - 1997 Household Determinants of Fuel Use Type in 2000 (Fuel Groups)
!"#$%&'(#)**'+,-
$%&'(#)**'+,-#./"0%1+'
$%&'(#)**'+,-#234563,'1
$%&'(#)**'+,-#2'+373,31
!"#$%&'(#)**'+,-
$%&'(#)**'+,-#./"0%1+'
$%&'(#)**'+,-#234563,'1
$%&'(#)**'+,-#2'+373,31
48-' 48-' 48-' 48-' 48-' 48-' 48-' 48-'
9'3(#"*#9"5-':";(#)(5+3,%"1 <=>=?@ <=>=A@@ <=>=A@@ <=>=?@ =>=B =>=C@ =>=C =>=B
<=>=D <=>=D <=>=D <=>=D <=>=D <=>=D <=>=D <=>=DE6"5-'#)(5+3,%"1 <=>=C <=>=?@ <=>=C <=>=? =>=F =>=F =>=F =>=F
<=>=D <=>=B <=>=D <=>=D <=>=D <=>=D <=>=D <=>=D);'+,/%+%,G#H577G <=>IF@@@ <=>IJ@@@ <=>AC@@@ <=>AK@@@ =>IJ@@@ =>KF@@@ =>I=@@@ =>ID@@@
<=>=A <=>=A <=>=A <=>=A <=>=A <=>=A <=>=A <=>=AL/431#H577G <=>IA@@@ <=>KC@@@ <=>JA@@@ <=>KC@@@ =>I=@@@ =>IK@@@ =>JJ@@@ =>II@@@
<=>=? <=>=? <=>=J <=>=? <=>=? <=>=? <=>=? <=>=?M1(""/#N3,'/#H577G <=>CB@@@ <=>B?@@@ <=>CF@@@ <=>BA@@@ =>BI@@@ =>BD@@@ =>BA@@@ =>BD@@@
<=>=? <=>=? <=>=? <=>=? <=>=? <=>=? <=>=? <=>=?9"5-':";(#9%O:'-,#)(5+3,%"1 <=>=I@@@ <=>=K@@@ <=>=A@@@ <=>=K@@@ =>=I@@@ =>=K@@@ =>=A@@@ =>=I@@@
<=>=D <=>=D <=>=D <=>=D <=>=D <=>=D <=>=D <=>=D9"P#731G#/""7-#3/'#,:'/'Q =>=B@ = =>=F =>=B@ <=>=D = <=>=F <=>=D
<=>=F <=>=F <=>=F <=>=F <=>=F <=>=F <=>=F <=>=FR",3;#S#:"5-':";(#7'74'/- =>=F =>=B@@ =>=F =>=F = <=>=D = <=>=F
<=>=F <=>=F <=>=F <=>=F <=>=F <=>=F <=>=F <=>=FE6"5-'#TO' = = = = = = = =
= = = = = = = =9'3(#"*#9"5-':";(#TO' =>=F@@ =>=F@@ =>=F@@ =>=F@@ <=>=F@@ <=>=F@@ <=>=F@@ <=>=F@@
= = = = = = = =U""V#W#E;''6#E37'#X""7Q =>=F =>=C =>=A =>=D =>=D = <=>=F =>=F
<=>=K <=>=K <=>F <=>=K <=>=K <=>=K <=>=K <=>=K2%,+:'1#Y5,-%('Q =>FB@@ =>FC@@ =>=I =>FF@ <=>F=@ <=>FB@@ <=>=? <=>=I
<=>=? <=>=? <=>=? <=>=? <=>=C <=>=? <=>=? <=>=?Z"O#.'/#U36%,3#9"5-':";(#M1+"7' <=>FK@@@ <=>F?@@@ <=>FJ@@@ <=>FA@@@ =>FJ@@@ =>FB@@@ =>FC@@@ =>F?@@@
<=>=B <=>=B <=>=B <=>=B <=>=B <=>=D <=>=D <=>=B+"1-,31, B>FJ@@@ B>=C@@@ D>IC@@@ B>=B@@@ <D>IB@@@ <D>IC@@@ <D>?C@@@ <D>IF@@@
<=>BI <=>BK <=>BK <=>C <=>BJ <=>BJ <=>BJ <=>BA#!574'/#"*#U3-'- CAKB CAKB CAIC CADF CAKB CAKB CAKB CAJ=@#6[=>=?\#@@#6[=>=F\#
@@@#6[=>==F
HMXR]#$L)Z#M!HMUTRYX UZ)T!#$L)Z#M!HMUTRYX
26
Regression for Households Staying with a Dirty Fuel between 1997-2000
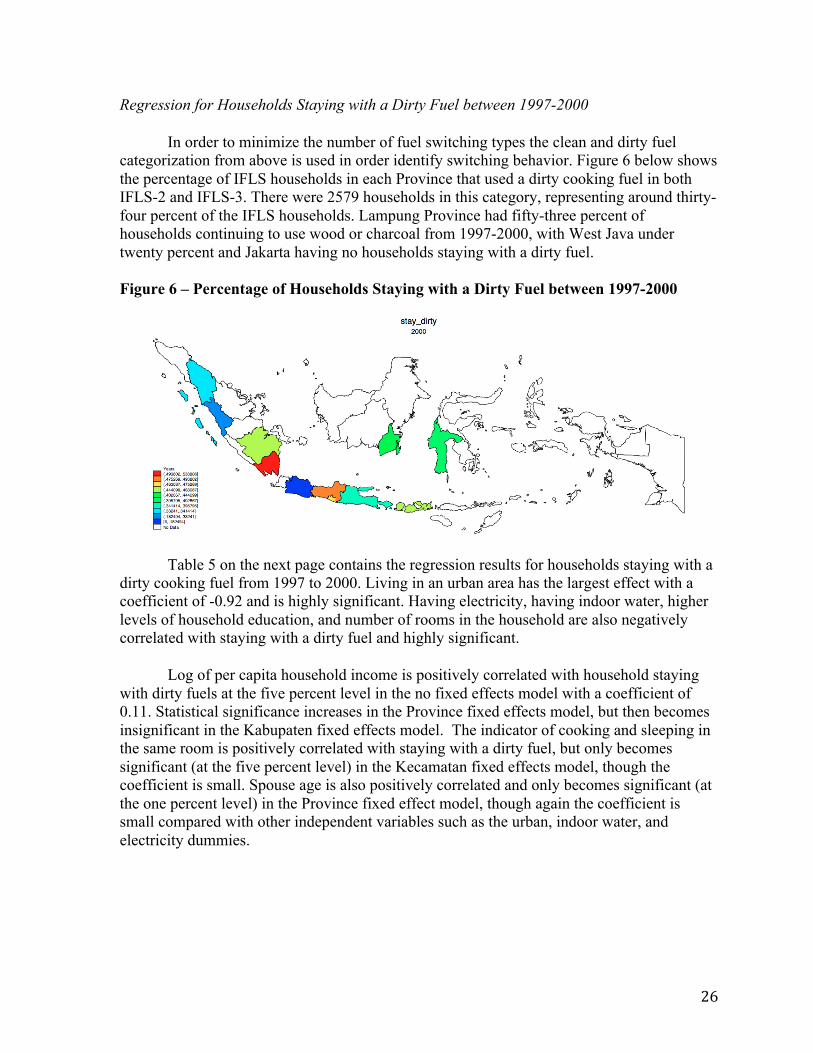
In order to minimize the number of fuel switching types the clean and dirty fuel categorization from above is used in order identify switching behavior. Figure 6 below shows the percentage of IFLS households in each Province that used a dirty cooking fuel in both IFLS-2 and IFLS-3. There were 2579 households in this category, representing around thirty-four percent of the IFLS households. Lampung Province had fifty-three percent of households continuing to use wood or charcoal from 1997-2000, with West Java under twenty percent and Jakarta having no households staying with a dirty fuel.
Figure 6 – Percentage of Households Staying with a Dirty Fuel between 1997-2000
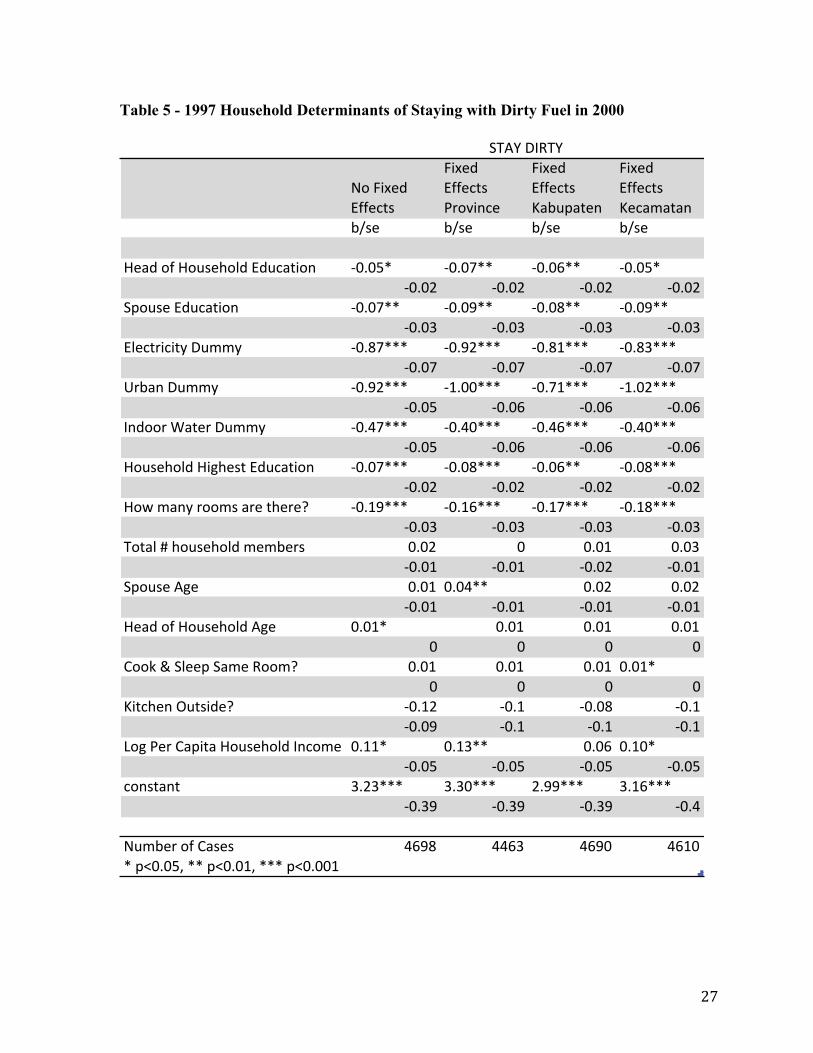
Table 5 on the next page contains the regression results for households staying with a dirty cooking fuel from 1997 to 2000. Living in an urban area has the largest effect with a coefficient of -0.92 and is highly significant. Having electricity, having indoor water, higher levels of household education, and number of rooms in the household are also negatively correlated with staying with a dirty fuel and highly significant.
Log of per capita household income is positively correlated with household staying with dirty fuels at the five percent level in the no fixed effects model with a coefficient of 0.11. Statistical significance increases in the Province fixed effects model, but then becomes insignificant in the Kabupaten fixed effects model. The indicator of cooking and sleeping in the same room is positively correlated with staying with a dirty fuel, but only becomes significant (at the five percent level) in the Kecamatan fixed effects model, though the coefficient is small. Spouse age is also positively correlated and only becomes significant (at the one percent level) in the Province fixed effect model, though again the coefficient is small compared with other independent variables such as the urban, indoor water, and electricity dummies.
27
Table 5 - 1997 Household Determinants of Staying with Dirty Fuel in 2000
!"#$%&'(#)**'+,-
$%&'(#)**'+,-#./"0%1+'
$%&'(#)**'+,-#234563,'1
$%&'(#)**'+,-#2'+373,31
48-' 48-' 48-' 48-'
9'3(#"*#9"5-':";(#)(5+3,%"1 <=>=?@ <=>=A@@ <=>=B@@ <=>=?@<=>=C <=>=C <=>=C <=>=C
D6"5-'#)(5+3,%"1 <=>=A@@ <=>=E@@ <=>=F@@ <=>=E@@<=>=G <=>=G <=>=G <=>=G
);'+,/%+%,H#I577H <=>FA@@@ <=>EC@@@ <=>FJ@@@ <=>FG@@@<=>=A <=>=A <=>=A <=>=A
K/431#I577H <=>EC@@@ <J>==@@@ <=>AJ@@@ <J>=C@@@<=>=? <=>=B <=>=B <=>=B
L1(""/#M3,'/#I577H <=>NA@@@ <=>N=@@@ <=>NB@@@ <=>N=@@@<=>=? <=>=B <=>=B <=>=B
9"5-':";(#9%O:'-,#)(5+3,%"1 <=>=A@@@ <=>=F@@@ <=>=B@@ <=>=F@@@<=>=C <=>=C <=>=C <=>=C
9"P#731H#/""7-#3/'#,:'/'Q <=>JE@@@ <=>JB@@@ <=>JA@@@ <=>JF@@@<=>=G <=>=G <=>=G <=>=G
R",3;#S#:"5-':";(#7'74'/- =>=C = =>=J =>=G<=>=J <=>=J <=>=C <=>=J
D6"5-'#TO' =>=J =>=N@@ =>=C =>=C<=>=J <=>=J <=>=J <=>=J
9'3(#"*#9"5-':";(#TO' =>=J@ =>=J =>=J =>=J= = = =
U""V#W#D;''6#D37'#X""7Q =>=J =>=J =>=J =>=J@= = = =
2%,+:'1#Y5,-%('Q <=>JC <=>J <=>=F <=>J<=>=E <=>J <=>J <=>J
Z"O#.'/#U36%,3#9"5-':";(#L1+"7' =>JJ@ =>JG@@ =>=B =>J=@<=>=? <=>=? <=>=? <=>=?
+"1-,31, G>CG@@@ G>G=@@@ C>EE@@@ G>JB@@@<=>GE <=>GE <=>GE <=>N
!574'/#"*#U3-'- NBEF NNBG NBE= NBJ=@#6[=>=?\#@@#6[=>=J\#@@@#6[=>==J
DRT]#ILXR]
28
Regression for Households Switching to a Dirty Fuel between 1997-2000
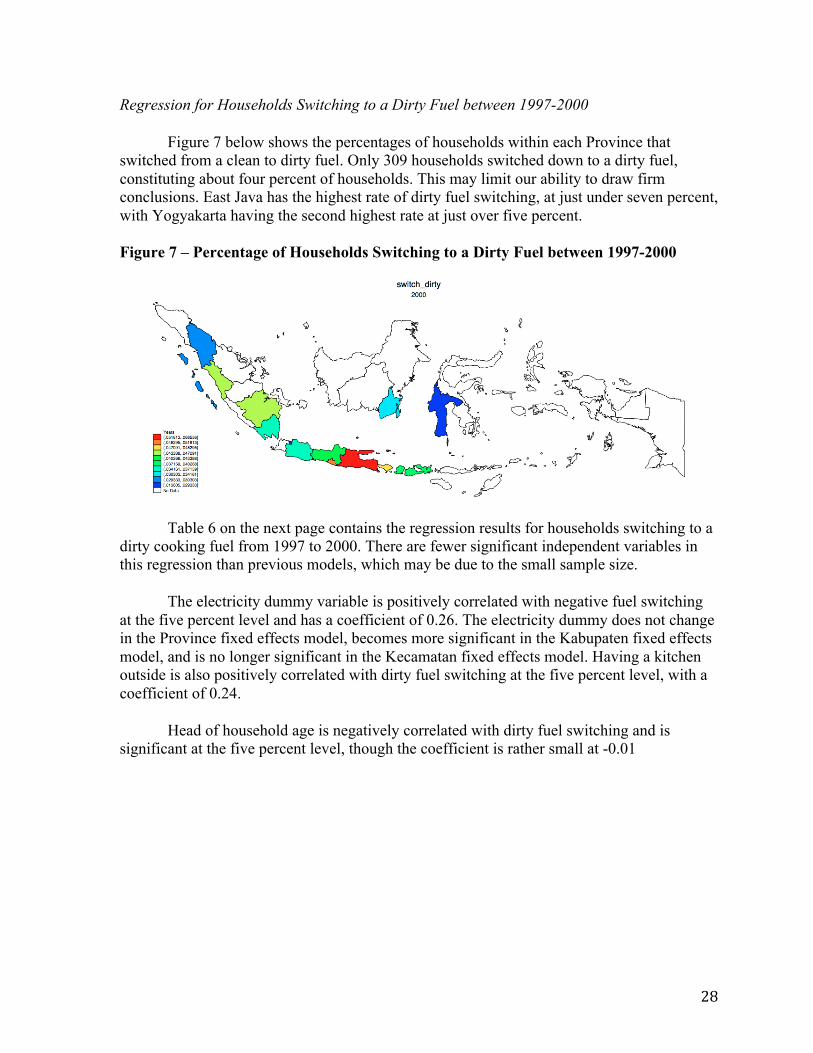
Figure 7 below shows the percentages of households within each Province that switched from a clean to dirty fuel. Only 309 households switched down to a dirty fuel, constituting about four percent of households. This may limit our ability to draw firm conclusions. East Java has the highest rate of dirty fuel switching, at just under seven percent, with Yogyakarta having the second highest rate at just over five percent.
Figure 7 – Percentage of Households Switching to a Dirty Fuel between 1997-2000
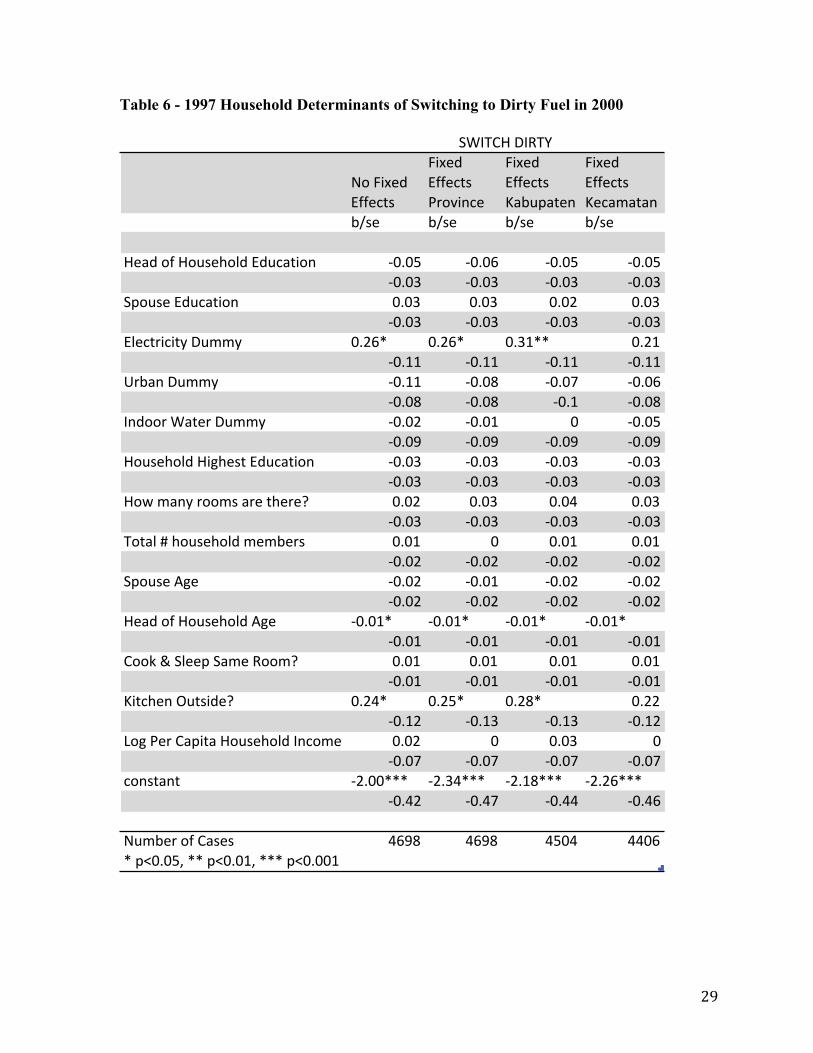
Table 6 on the next page contains the regression results for households switching to a dirty cooking fuel from 1997 to 2000. There are fewer significant independent variables in this regression than previous models, which may be due to the small sample size.
The electricity dummy variable is positively correlated with negative fuel switching at the five percent level and has a coefficient of 0.26. The electricity dummy does not change in the Province fixed effects model, becomes more significant in the Kabupaten fixed effects model, and is no longer significant in the Kecamatan fixed effects model. Having a kitchen outside is also positively correlated with dirty fuel switching at the five percent level, with a coefficient of 0.24.
Head of household age is negatively correlated with dirty fuel switching and is significant at the five percent level, though the coefficient is rather small at -0.01
29
Table 6 - 1997 Household Determinants of Switching to Dirty Fuel in 2000
!"#$%&'(#)**'+,-
$%&'(#)**'+,-#./"0%1+'
$%&'(#)**'+,-#234563,'1
$%&'(#)**'+,-#2'+373,31
48-' 48-' 48-' 48-'
9'3(#"*#9"5-':";(#)(5+3,%"1 <=>=? <=>=@ <=>=? <=>=?<=>=A <=>=A <=>=A <=>=A
B6"5-'#)(5+3,%"1 =>=A =>=A =>=C =>=A<=>=A <=>=A <=>=A <=>=A
);'+,/%+%,D#E577D =>C@F =>C@F =>AGFF =>CG<=>GG <=>GG <=>GG <=>GG
H/431#E577D <=>GG <=>=I <=>=J <=>=@<=>=I <=>=I <=>G <=>=I
K1(""/#L3,'/#E577D <=>=C <=>=G = <=>=?<=>=M <=>=M <=>=M <=>=M
9"5-':";(#9%N:'-,#)(5+3,%"1 <=>=A <=>=A <=>=A <=>=A<=>=A <=>=A <=>=A <=>=A
9"O#731D#/""7-#3/'#,:'/'P =>=C =>=A =>=Q =>=A<=>=A <=>=A <=>=A <=>=A
R",3;#S#:"5-':";(#7'74'/- =>=G = =>=G =>=G<=>=C <=>=C <=>=C <=>=C
B6"5-'#TN' <=>=C <=>=G <=>=C <=>=C<=>=C <=>=C <=>=C <=>=C
9'3(#"*#9"5-':";(#TN' <=>=GF <=>=GF <=>=GF <=>=GF<=>=G <=>=G <=>=G <=>=G
U""V#W#B;''6#B37'#X""7P =>=G =>=G =>=G =>=G<=>=G <=>=G <=>=G <=>=G
2%,+:'1#Y5,-%('P =>CQF =>C?F =>CIF =>CC<=>GC <=>GA <=>GA <=>GC
Z"N#.'/#U36%,3#9"5-':";(#K1+"7' =>=C = =>=A =<=>=J <=>=J <=>=J <=>=J
+"1-,31, <C>==FFF <C>AQFFF <C>GIFFF <C>C@FFF<=>QC <=>QJ <=>QQ <=>Q@
!574'/#"*#U3-'- Q@MI Q@MI Q?=Q QQ=@F#6[=>=?\#FF#6[=>=G\#FFF#6[=>==G
BLKRU9#EKXR]

30
Regression for Households Switching to a Clean Fuel between 1997-2000
Figure 8 below shows the percentages of households within each Province that switched from a dirty to a clean fuel. 922 households, constituting close to thirteen percent of the IFLS sample, made the switch from dirty to clean fuels between IFLS-2 and IFLS-3. Two Provinces, West Nusa Tenggara and South Sulawesi, had over twenty percent of their households make the switch to cleaner burning cooking fuels.
Figure 8 – Percentage of Households Switching to a Clean Fuel between 1997-2000
Table 7 on the next page contains the regression results for households switching to a clean cooking fuel from 1997 to 2000. Having electricity has the strongest positive correlation with a coefficient of 0.34, and is highly significant. Household highest level of education is also positively correlated with switching to a cleaner burning cooking fuel, with a coefficient of 0.04, significant at the five percent level.
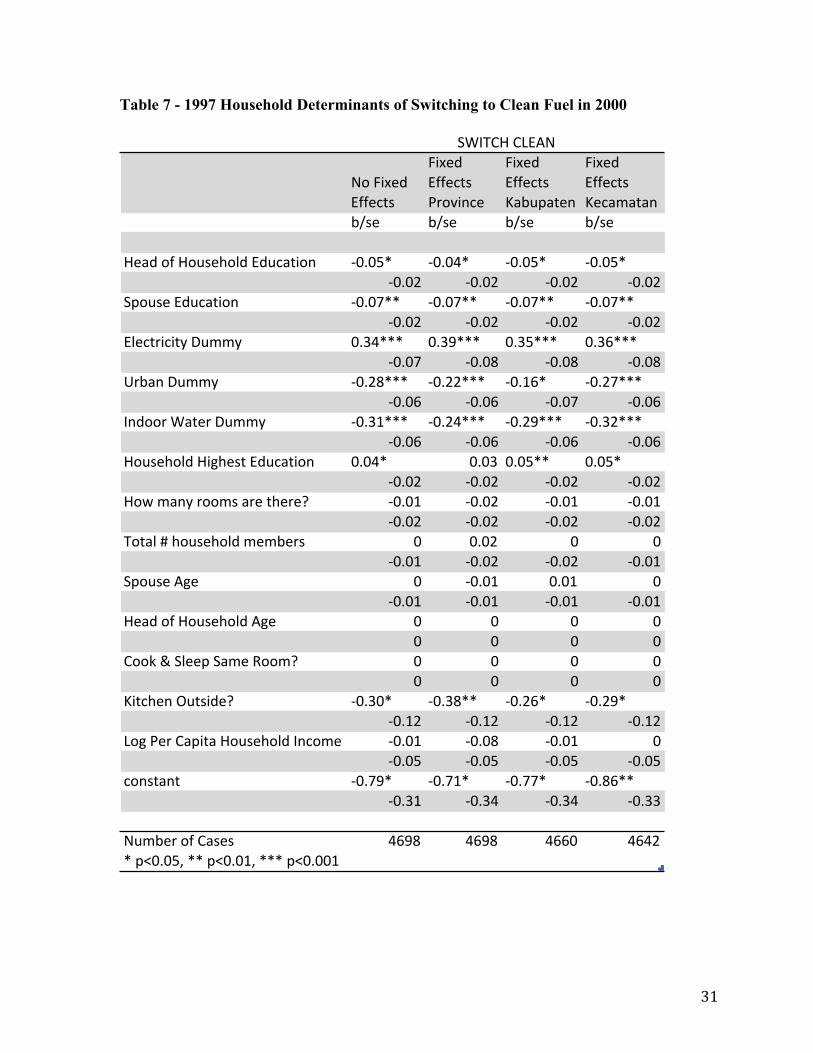
31
Table 7 - 1997 Household Determinants of Switching to Clean Fuel in 2000
!"#$%&'(#)**'+,-
$%&'(#)**'+,-#./"0%1+'
$%&'(#)**'+,-#234563,'1
$%&'(#)**'+,-#2'+373,31
48-' 48-' 48-' 48-'
9'3(#"*#9"5-':";(#)(5+3,%"1 <=>=?@ <=>=A@ <=>=?@ <=>=?@<=>=B <=>=B <=>=B <=>=B
C6"5-'#)(5+3,%"1 <=>=D@@ <=>=D@@ <=>=D@@ <=>=D@@<=>=B <=>=B <=>=B <=>=B
);'+,/%+%,E#F577E =>GA@@@ =>GH@@@ =>G?@@@ =>GI@@@<=>=D <=>=J <=>=J <=>=J
K/431#F577E <=>BJ@@@ <=>BB@@@ <=>LI@ <=>BD@@@<=>=I <=>=I <=>=D <=>=I
M1(""/#N3,'/#F577E <=>GL@@@ <=>BA@@@ <=>BH@@@ <=>GB@@@<=>=I <=>=I <=>=I <=>=I
9"5-':";(#9%O:'-,#)(5+3,%"1 =>=A@ =>=G =>=?@@ =>=?@<=>=B <=>=B <=>=B <=>=B
9"P#731E#/""7-#3/'#,:'/'Q <=>=L <=>=B <=>=L <=>=L<=>=B <=>=B <=>=B <=>=B
R",3;#S#:"5-':";(#7'74'/- = =>=B = =<=>=L <=>=B <=>=B <=>=L
C6"5-'#TO' = <=>=L =>=L =<=>=L <=>=L <=>=L <=>=L
9'3(#"*#9"5-':";(#TO' = = = == = = =
U""V#W#C;''6#C37'#X""7Q = = = == = = =
2%,+:'1#Y5,-%('Q <=>G=@ <=>GJ@@ <=>BI@ <=>BH@<=>LB <=>LB <=>LB <=>LB
Z"O#.'/#U36%,3#9"5-':";(#M1+"7' <=>=L <=>=J <=>=L =<=>=? <=>=? <=>=? <=>=?
+"1-,31, <=>DH@ <=>DL@ <=>DD@ <=>JI@@<=>GL <=>GA <=>GA <=>GG
!574'/#"*#U3-'- AIHJ AIHJ AII= AIAB@#6[=>=?\#@@#6[=>=L\#@@@#6[=>==L
CNMRU9#UZ)T!

32
Regression for Households Staying with a Clean Fuel between 1997-2000
Figure 9 below shows the percentages of households within each Province that used a clean cooking fuel in both 1997 and 2000. 3,501 households, constituting close to forty-eight percent of the IFLS sample, continued using clean fuels from IFLS-2 and IFLS-3. There was significant variation in the rates at which different Provinces continued using clean fuels, with Jakarta having almost 98% of their sample households in this group at the high end, and Lampung at the low end with around 25% of households.
Figure 9 – Percentage of Households Staying with a Clean Fuel between 1997-2000
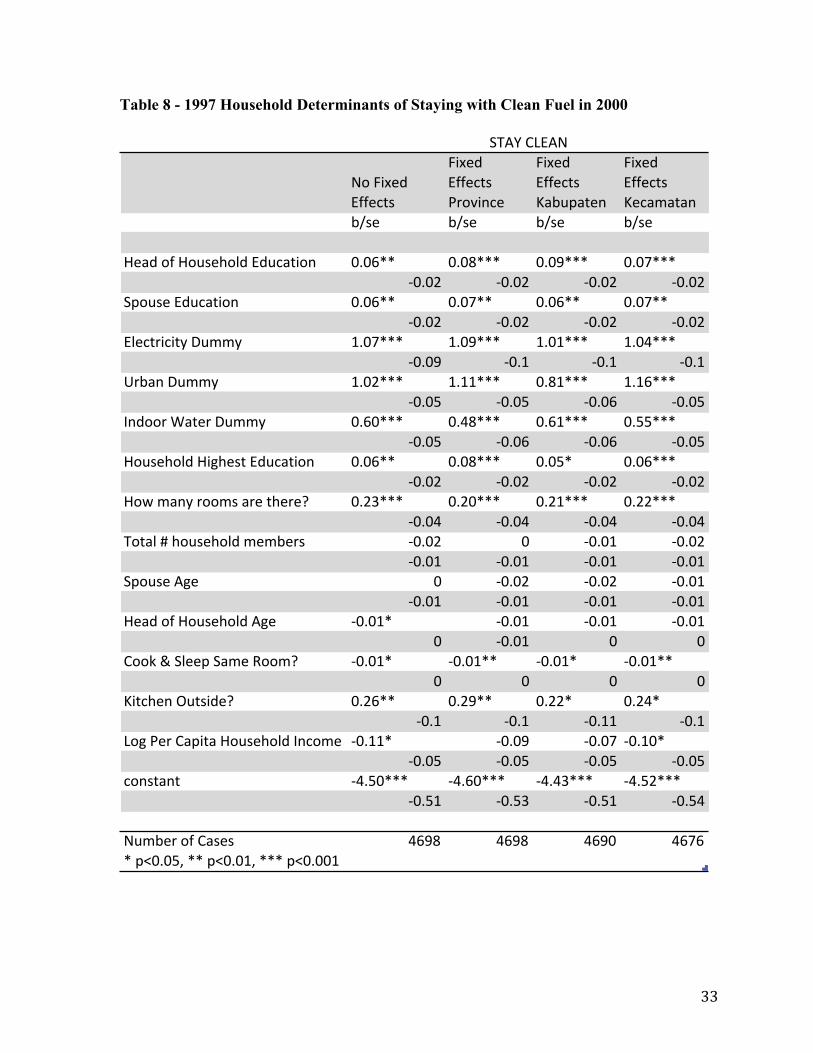
Table 8 on the next page contains the regression results for households continuing to use a clean cooking fuel from 1997 to 2000. Having electricity has the strongest positive correlation with a coefficient of 1.07, and is highly significant. A close second in having a highly significant positive correlation is being an urban household, with a coefficient of 1.02. In the various fixed effects models the coefficients change, but remain highly significant for both of these independent variables. Having indoor water is also highly significant and positively correlated with households that stay with a clean fuel from IFLS-2 to IFLS-3.
Head of household age and cooking/sleeping in the same room are both negatively correlated with being a household that stays with a clean fuel, though both are only significant at the five percent level in the non-fixed effects model. Head of household age is no longer significant in any of the fixed effects models.
33
Table 8 - 1997 Household Determinants of Staying with Clean Fuel in 2000
!"#$%&'(#)**'+,-
$%&'(#)**'+,-#./"0%1+'
$%&'(#)**'+,-#234563,'1
$%&'(#)**'+,-#2'+373,31
48-' 48-' 48-' 48-'
9'3(#"*#9"5-':";(#)(5+3,%"1 <=<>?? <=<@??? <=<A??? <=<B???C<=<D C<=<D C<=<D C<=<D
E6"5-'#)(5+3,%"1 <=<>?? <=<B?? <=<>?? <=<B??C<=<D C<=<D C<=<D C<=<D
);'+,/%+%,F#G577F H=<B??? H=<A??? H=<H??? H=<I???C<=<A C<=H C<=H C<=H
J/431#G577F H=<D??? H=HH??? <=@H??? H=H>???C<=<K C<=<K C<=<> C<=<K
L1(""/#M3,'/#G577F <=><??? <=I@??? <=>H??? <=KK???C<=<K C<=<> C<=<> C<=<K
9"5-':";(#9%N:'-,#)(5+3,%"1 <=<>?? <=<@??? <=<K? <=<>???C<=<D C<=<D C<=<D C<=<D
9"O#731F#/""7-#3/'#,:'/'P <=DQ??? <=D<??? <=DH??? <=DD???C<=<I C<=<I C<=<I C<=<I
R",3;#S#:"5-':";(#7'74'/- C<=<D < C<=<H C<=<DC<=<H C<=<H C<=<H C<=<H
E6"5-'#TN' < C<=<D C<=<D C<=<HC<=<H C<=<H C<=<H C<=<H
9'3(#"*#9"5-':";(#TN' C<=<H? C<=<H C<=<H C<=<H< C<=<H < <
U""V#W#E;''6#E37'#X""7P C<=<H? C<=<H?? C<=<H? C<=<H??< < < <
2%,+:'1#Y5,-%('P <=D>?? <=DA?? <=DD? <=DI?C<=H C<=H C<=HH C<=H
Z"N#.'/#U36%,3#9"5-':";(#L1+"7' C<=HH? C<=<A C<=<B C<=H<?C<=<K C<=<K C<=<K C<=<K
+"1-,31, CI=K<??? CI=><??? CI=IQ??? CI=KD???C<=KH C<=KQ C<=KH C<=KI
!574'/#"*#U3-'- I>A@ I>A@ I>A< I>B>?#6[<=<K\#??#6[<=<H\#???#6[<=<<H
ERT]#UZ)T!
34
Regression for Self-Reported Health Outcomes in 2007
In the following tables I examine determinants of respiratory health, contingent on switching to a clean burning fuel in IFLS-2 in the year 2000, and continuing to burn a clean cooking fuel in 2007. The models included look at a pooled-indicators model, each of the respiratory health indicators separately, and a lung capacity measurement model for adults. All models include only individuals that used a biomass fuel in IFLS-2 in the year 1997. This allows us to determine if those individuals that switched to a cleaner fuel are better off than those that continued to burn dirty fuels.
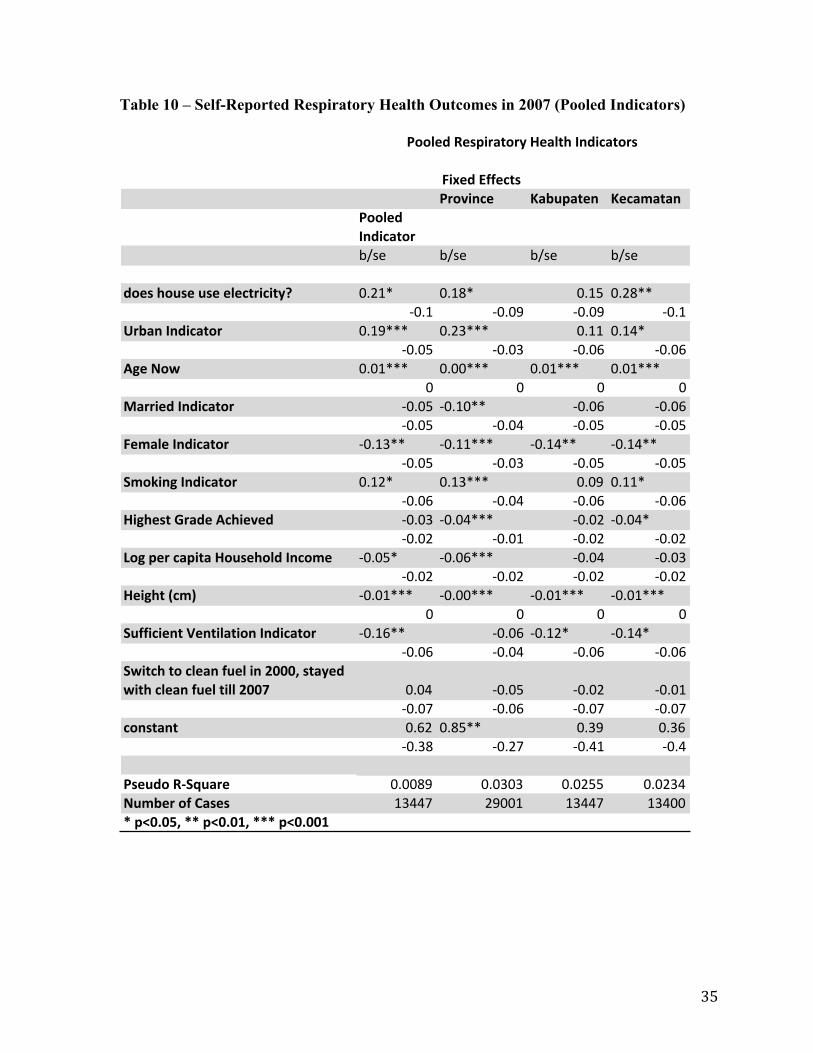
Table 10 below shows the regression results for a pooled indicator of self-reported respiratory health outcomes in 2007 based on individual and household determinants. Self-reported outcomes included in this pooled indicator include cough, dry cough, dry cough with phlegm, bloody cough, difficulty breathing, wheezing, and short, rapid breath. The indicator was coded as 1 if the individual had any of these symptoms and a logistic regression was run using clustered standard errors at the household level. Four separate models were run, first without fixed effects, and then with fixed effects at the Province, Kabupaten, and Kecamatan levels. Results from the regression models are shown below. For the most part results are stable across the models, with slight changes in coefficients.
The variable for fuel switching represents households that were using a biomass fuel (wood or charcoal) in IFLS-2, switched to a clean fuel in IFLS-3, and continued using a clean fuel until IFLS-4.
Counter to the hypothesized effect we see that the switching variable is positively correlated with respiratory health problems with a coefficient of 0.04 in the non-fixed effects model, but is not statistically significant. In the various fixed effects models the switching variable becomes negatively correlated with the respiratory health outcome indicator, but is still not significant.
The variable for having electricity is positively correlated with a coefficient of 0.21 and is significant at the five percent level. Living in an urban area has the strongest relationship, with a coefficient of 0.19, and is highly significant. Age is also highly significant, and positively correlated with a coefficient of 0.01. Being female is negatively correlated with a coefficient of -0.13, and is highly significant. An individuals height is negatively correlated, with a coefficient of -0.01, and highly significant.
35
Table 10 – Self-Reported Respiratory Health Outcomes in 2007 (Pooled Indicators)
!"#$%&'(($)*+
,-./"0)$ 123452*$0 1$)262*20
,..7$%&
80%")2*.-
!"#$ !"#$ !"#$ !"#$
%.$+&9.4+$&4+$&$7$)*-")"*:; %&'() %&(*) %&(+ %&'*)),%&( ,%&%- ,%&%- ,%&(
<-320&80%")2*.- %&(-))) %&'.))) %&(( %&(/),%&%+ ,%&%. ,%&%0 ,%&%0
=>$&?.@ %&%())) %&%%))) %&%())) %&%()))% % % %
A2--"$%&80%")2*.- ,%&%+ ,%&(%)) ,%&%0 ,%&%0,%&%+ ,%&%/ ,%&%+ ,%&%+
!$627$&80%")2*.- ,%&(.)) ,%&(())) ,%&(/)) ,%&(/)),%&%+ ,%&%. ,%&%+ ,%&%+
B6.C"0>&80%")2*.- %&(') %&(.))) %&%- %&((),%&%0 ,%&%/ ,%&%0 ,%&%0
D">9$+*&E-2%$&=)9"$/$% ,%&%. ,%&%/))) ,%&%' ,%&%/),%&%' ,%&%( ,%&%' ,%&%'
F.>&5$-&)25"*2&D.4+$9.7%&80).6$ ,%&%+) ,%&%0))) ,%&%/ ,%&%.,%&%' ,%&%' ,%&%' ,%&%'
D$">9*&G)6H ,%&%())) ,%&%%))) ,%&%())) ,%&%()))% % % %
B4((")"$0*&I$0*"72*".0&80%")2*.- ,%&(0)) ,%&%0 ,%&(') ,%&(/),%&%0 ,%&%/ ,%&%0 ,%&%0
B@"*)9&*.&)7$20&(4$7&"0&JKKKL&+*2:$%&
@"*9&)7$20&(4$7&*"77&JKKM %&%/ ,%&%+ ,%&%' ,%&%(,%&%1 ,%&%0 ,%&%1 ,%&%1
).0+*20* %&0' %&*+)) %&.- %&.0,%&.* ,%&'1 ,%&/( ,%&/
,+$4%.&NOBP42-$ %&%%*- %&%.%. %&%'++ %&%'./?463$-&.(&Q2+$+ (.//1 '-%%( (.//1 (./%%R&5SKTKUL&RR&5SKTKVL&RRR&5SKTKKV
,..7$%&N$+5"-2*.-:&D$27*9&80%")2*.-+
36
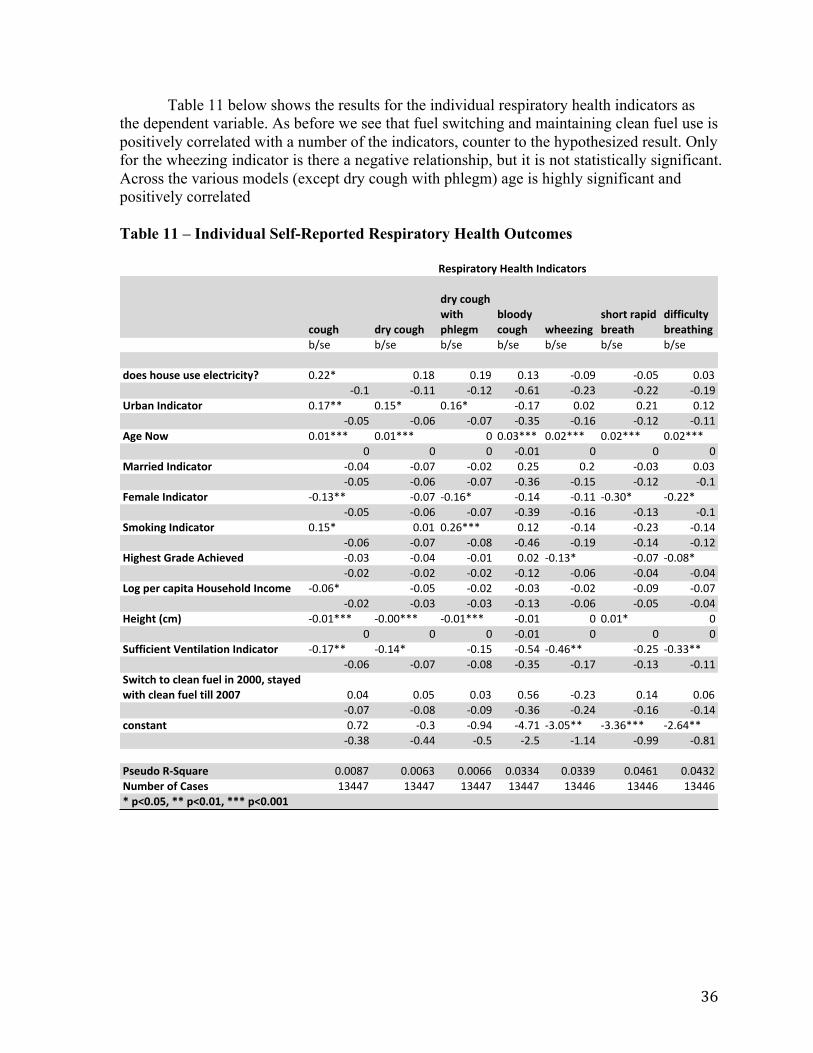
Table 11 below shows the results for the individual respiratory health indicators as the dependent variable. As before we see that fuel switching and maintaining clean fuel use is positively correlated with a number of the indicators, counter to the hypothesized result. Only for the wheezing indicator is there a negative relationship, but it is not statistically significant. Across the various models (except dry cough with phlegm) age is highly significant and positively correlated
Table 11 – Individual Self-Reported Respiratory Health Outcomes
!"#$% &'()!"#$%
&'()!"#$%)*+,%)-%./$0
1.""&()!"#$% *%//2+3$
4%"',)'5-+&)1'/5,%
&+66+!#.,()1'/5,%+3$
!"#$ !"#$ !"#$ !"#$ !"#$ !"#$ !"#$
&"/4)%"#4/)#4/)/./!,'+!+,(7 %&''( %&)* %&)+ %&), -%&%+ -%&%. %&%,-%&) -%&)) -%&)' -%&/) -%&', -%&'' -%&)+
8'153)93&+!5,"' %&)0(( %&).( %&)/( -%&)0 %&%' %&') %&)'-%&%. -%&%/ -%&%0 -%&,. -%&)/ -%&)' -%&))
:$/);"* %&%)((( %&%)((( % %&%,((( %&%'((( %&%'((( %&%'(((% % % -%&%) % % %
<5''+/&)93&+!5,"' -%&%1 -%&%0 -%&%' %&'. %&' -%&%, %&%,-%&%. -%&%/ -%&%0 -%&,/ -%&). -%&)' -%&)
=/05./)93&+!5,"' -%&),(( -%&%0 -%&)/( -%&)1 -%&)) -%&,%( -%&''(-%&%. -%&%/ -%&%0 -%&,+ -%&)/ -%&), -%&)
>0"?+3$)93&+!5,"' %&).( %&%) %&'/((( %&)' -%&)1 -%&', -%&)1-%&%/ -%&%0 -%&%* -%&1/ -%&)+ -%&)1 -%&)'
@+$%/4,)A'5&/):!%+/B/& -%&%, -%&%1 -%&%) %&%' -%&),( -%&%0 -%&%*(-%&%' -%&%' -%&%' -%&)' -%&%/ -%&%1 -%&%1
C"$)-/')!5-+,5)@"#4/%".&)93!"0/ -%&%/( -%&%. -%&%' -%&%, -%&%' -%&%+ -%&%0-%&%' -%&%, -%&%, -%&), -%&%/ -%&%. -%&%1
@/+$%,)D!0E -%&%)((( -%&%%((( -%&%)((( -%&%) % %&%)( %% % % -%&%) % % %
>#66+!+/3,)F/3,+.5,+"3)93&+!5,"' -%&)0(( -%&)1( -%&). -%&.1 -%&1/(( -%&'. -%&,,((-%&%/ -%&%0 -%&%* -%&,. -%&)0 -%&), -%&))
>*+,!%),")!./53)6#/.)+3)GHHHI)4,5(/&)*+,%)!./53)6#/.),+..)GHHJ %&%1 %&%. %&%, %&./ -%&', %&)1 %&%/
-%&%0 -%&%* -%&%+ -%&,/ -%&'1 -%&)/ -%&)1!"34,53, %&0' -%&, -%&+1 -1&0) -,&%.(( -,&,/((( -'&/1((
-%&,* -%&11 -%&. -'&. -)&)1 -%&++ -%&*)
K4/#&")LM>N#5'/ %&%%*0 %&%%/, %&%%// %&%,,1 %&%,,+ %&%1/) %&%1,';#01/')"6)O54/4 ),110 ),110 ),110 ),110 ),11/ ),11/ ),11/P)-QHRHSI)PP)-QHRHTI)PPP)-QHRHHT
L/4-+'5,"'()@/5.,%)93&+!5,"'4

37
Table 12 below shows the results for the adult lung capacity measures as the dependent variable. In this model we see that switching does improve lung capacity, but in an extremely minor way that is not statistically significant. To add to the confusion smoking appears to increase lung capacity, and is statistically significant.
Table 12 - Determinants of Lung Capacity Measures for Adults in 2007
!"#$%&'(($)*+,-./"0)$ 123452*$0 1$)262*20
7/$-28$&9408&:252)"*;!"#$ !"#$ !"#$ !"#$
%.$+&<.4+$&4+$&$=$)*-")"*;> %&' (&'' )'&(* %&'+),&-' ),&'. ),&+/ ),&(
?-320&@0%")2*.- )'&*' )*&-, '&+( *&0)*&,- )*&*/ )*&(/ )*&/0
78$&A.B )'&'-111 )'&'+111 )'&'.111 )'&'0111)%&%( )%&%( )%&%( )%&%(
C2--"$%&@0%")2*.- ,.&'+111 ,.&/%111 ,0&0%111 ,.&.+111)'&., )'&00 )'&0. )'&.*
!$62=$&@0%")2*.- )(0&.%111 )(0&,0111 )(0&*0111 )(.&,+111)*&*+ )*&'. )*&*, )*&*/
D6.E"08&@0%")2*.- ,-&((111 ,0&/*111 ,0&%0111 ,+&(0111)*&- )*&+* )*&+/ )*&+.
F"8<$+*&G-2%$&7)<"$/$% '%&*+111 '%&-%111 .&-(111 '%&',111)%&+0 )%&+( )%&+- )%&+-
9.8&5$-&)25"*2&F.4+$<.=%&@0).6$ /&-/111 ,&-%111 /&+*111 /&%0111)%&.* )%&00 )%&. )%&.,
F$"8<*&H)6I *&*0111 *&*/111 *&*-111 *&*0111)%&'( )%&'( )%&'( )%&'(
D4((")"$0*&J$0*"=2*".0&@0%")2*.- ,&-/ )%&,* *&.- ,)*&/. )*&*. )*&/' )*&/+
DB"*)<&*.&)=$20&(4$=&"0&KLLLM&+*2;$%&B"*<&)=$20&(4$=&*"==&KLLN %&+, %&-, '&(. %&,+
)*&./ )*&-+ )*&.' )*&.0).0+*20* )''-&*-111 )'**&%.111 )'%(&.+111 )..&'/111
)*+&%/ )*(&-/ )*(&. )*+&'+7%OP&QRDS42-$ %&/( %&/. %&/- %&/+A463$-&.(&:2+$+ '%-'% '%-'% '%-'% '%-'%T&5ULPLVM&TT&5ULPLWM&TTT&5ULPLLW
9408&:252)"*;&C$2+4-$6$0*+
38
DISCUSSION AND POLICY IMPLICATIONS
Potential Confounders
Fuel Prices
Fuel prices have often been cited as important determinants, but it remains to be seen if the information on household purchases contains adequate representation for expenditures on fuel. During the period of time I will be studying (1997-2007) the Indonesian government had several fuel subsidy policies in place, first in the form of subsidies for kerosene fuel and later incentives for moving from kerosene to Liquid Petroleum Gas. In order to fully understand the motivations that drive households to adopt fuel switching these policies and dummy variables for whether they are in place may be necessary.
Access to Credit
The cost of switching to cleaner fuels is a concern, as access to credit may significantly effect a household’s decision to adopt cleaner burning stoves that require up front investment. An article that deals directly with this topic found a significant link between access to credit and the decrease in use of firewood by allowing a household to have the ability to purchase a stove that would otherwise to unavailable [22].
Energy Subsidization
In Indonesia there has been in place a system of significant energy subsidization. Concerned about the potential distortions this policy may cause in demand/use of differing fuel types I researched the effects of subsidization in Indonesia. The country has a long history of subsidizing fuel, but ran into serious trouble in 2005. With prices for oil rising Indonesia found itself spending nearly 25% of the governments budget on fuel price supports. Since this time there has been a push to adopt natural gas [23]. A recent analysis on efforts to phase out these subsidies notes that the benefits of these programs have accrued mostly to wealthier citizens, with more than 90% of the subsidies benefiting the richest 50% of the population [24]. An older study concludes that wealthy and urban households will disproportionally benefit from the subsidy. In addition he debunks the idea that a kerosene subsidy will have a positive externality from reduced deforestation due to wood gathering [25]. As kerosene subsidies are removed it is predominantly urban households that are affected [26]. Households in Indonesia may also receive a de-facto fuel subsidy in the form of biomass fuels that rural peoples collect for no cost.
Multiple Fuel Use
A further distinction that is made is the use of one or more fuels in a household. Many studies may oversimplify the use patterns at the household level when in reality households in developing nations often use a mixture of fuels for both heating and cooking. A study conducted in India takes this concern and looks at the fuel use patterns with wood, kerosene and liquid petroleum gas, which are the fuels that are also seen in the data I will be analyzing

39
in Indonesia [27]. As before the authors find that both the price of fuels and the high initial cost of cleaner burning stoves is a significant barrier to adopting cleaner fuel use. In addition the authors find that level of education and sex of the head of household are significant determinants of a household’s choice of fuels.
Availability of Improved Fuels
Recently, a paper examined the choice of a household to switch to cleaner burning fuels using data from three African countries [28]. This paper uses a number of different models to examine the significance of various household level factors influencing fuel use choices. The unique feature of this paper is its conclusion that a significant determinant of fuel use choices is supply driven, whereas most previous studies have only looked at the demand side of the equation.
Conclusion and Policy Recommendations
Overall I found that the determinants of household fuel switching echoed previous studies showing that greater education and incomes lead to an increase in fuel switching behaviors. Conducting this analysis in a new country context and replicating previous research strengthens the literature regarding fuel-switching characteristics of households.
Urban households are much more likely to use clean burning fuels, which lends some credence to arguments that fuel switching may largely be market driven, with rural household lacking access to easily accessible markets to buy cleaner burning fossil fuels.
I also found that fuel switching in Indonesia is dependent on location. The knowledge of fuel switching determinants in the Indonesian context overall can now be further evaluated at the Province or sub-Province level to provide more detailed targeting of future interventions. Further analysis should focus on the differences between the switching rates of Provinces, or do more detailed analysis.
Conclusions from the health effects due to fuel switching are much less clear. From this analysis it is clear that more work needs to be done to refine the analysis. It may be that households with prior health problems switched to cleaner fuels, making the switching households appear to have worse health. The self reported nature of the respiratory health indicators is another potential problem. With such a coarse indicator we can’t be sure that individuals were properly categorizing themselves.
The main recommendation Policy Recommendation from this project is that much more work needs to be done to properly analyze available information on stoves and their health effects. More rigorous analysis will wield evidence to strengthen interventions and provide support for those that have already taken place. The types analyses possible are limited by the availability of data. With only a gross indicator of fuel type in the IFLS it is difficult to understand the duration and intensity of exposure, making accurate modeling of health effects difficult. Despite these limitations, there are certainly many more insights waiting to be uncovered in publicly available data.

40
A corollary recommendation is to collect more detailed information on the exposure patterns of stove use. This study, like many others, relies on available data that was not collected with the question of stoves specifically in mind. To make more accurate causal claims, better data is needed. With an increased interest in stove interventions, policy makers must push for well thought out data collection and rigorous evaluations. In this way every intervention can contribute to improving the next.

41
Bibliography
1. Wilkinson, P., et al., Public health benefits of strategies to reduce
greenhouse-‐gas emissions: household energy. Lancet, 2009. 374(9705): p. 1917-‐29.
2. WHO, World Health Statistics 2010, 2010. 3. Smith, K.R., Indoor air pollution in developing countries:
recommendations for research. Indoor Air, 2002. 12(3): p. 198-‐207. 4. Smith-‐Sivertsen, T., et al., Effect of reducing indoor air pollution on
women's respiratory symptoms and lung function: the RESPIRE Randomized Trial, Guatemala. Am J Epidemiol, 2009. 170(2): p. 211-‐20.
5. Ezzati, M. and D.M. Kammen, The health impacts of exposure to indoor air pollution from solid fuels in developing countries: Knowledge, gaps, and data needs. Environmental Health Perspectives, 2002. 110(11): p. 1057-‐1068.
6. Bruce, N., R. Perez-‐Padilla, and R. Albalak, Indoor air pollution in developing countries: a major environmental and public health challenge. Bulletin of the World Health Organization, 2000. 78(9): p. 1078-‐92.
7. Dherani, M., et al., Indoor air pollution from unprocessed solid fuel use and pneumonia risk in children aged under five years: a systematic review and meta-‐analysis. Bull World Health Organ, 2008. 86(5): p. 390-‐398C.
8. M. Desai, S.M., K. Smith, Indoor Smoke from Solid Fuels: Assessing the Environmental Burden of Disease at National and Local Levels. Environmental Burden of Disease Series, 2004. 4.
9. WHO, The World Health Report 2002: Reducing Risks, Promoting Healthy Life. 2002.
10. Nautiyal, S. and H. Kaechele, Fuel switching from wood to LPG can benefit the environment. Environmental Impact Assessment Review, 2008. 28(8): p. 523-‐532.
11. Pant, K.P., S. Pattanayak, and M.B.M. Thakuri, Climate Change, cook stoves, and coughs and colds: Thinking global and acting local in rural Nepal, in Annual Bank Conference on Development Economics2010.
12. Pereira, A.M. and R.M.M. Pereira, Is fuel-‐switching a no-‐regrets environmental policy? VAR evidence on carbon dioxide emissions, energy consumption and economic performance in Portugal. Energy Economics, 2010. 32(1): p. 227-‐242.
13. Kaplan, C., Indoor air pollution from unprocessed solid fuels in developing countries. Reviews on environmental health, 2010. 25(3): p. 221-‐42.
14. Hutton, G., Rehfuess, E., Tediosi, F. & Weiss, S., Evaluation of the costs and benefits of household energy and health interventions at global and regional levels. 2006.
42
15. Agustin Arcenas, J.B., Bjorn Larsen, Fernanda Ruiz Nunez, The Economic Costs of Indoor Air Pollution: New Results for Indonesia, the Philippines, and Timor-‐Leste. Journal of Natural Resources Policy Research, 2010. 2(1): p. 75-‐93.
16. Smith KR, M.S., Maeusezahl-‐Feuz M., Indoor air pollution from household use of solid fuels, in Comparative Quantification of Health Risks: Global and Regional Burden of Disease Attributable to Selected Major Risk Factors2004, World Health Organization: Geneva. p. 1435–1493.
17. Smith, K.R. and S. Mehta, The burden of disease from indoor air pollution in developing countries: comparison of estimates. International Journal of Hygiene and Environmental Health, 2003. 206(4-‐5): p. 279-‐289.
18. Khushk, W.A., et al., Health and social impacts of improved stoves on rural women: a pilot intervention in Sindh, Pakistan. Indoor Air, 2005. 15(5): p. 311-‐316.
19. Diaz, E., et al., Lung function and symptoms among indigenous Mayan women exposed to high levels of indoor air pollution. Int J Tuberc Lung Dis, 2007. 11(12): p. 1372-‐9.
20. Muneer, S. and E.W. Mohamed, Adoption of biomass improved cookstoves in a patriarchal society: an example from Sudan. The Science of the Total Environment, 2002. 3(7): p. 259-‐266
. 21. Heltberg, R., Fuel switching: evidence from eight developing countries.
Energy Economics, 2004. 26(5): p. 869-‐887. 22. Edwards, J.H.Y. and C. Langpap, Startup costs and the decision to switch
from firewood to gas fuel. Land Economics, 2005. 81(4): p. 570-‐586. 23. Statistics from the World Health Organization and the Centers for
Disease Control. AIDS, 1990. 4(10): p. 1045-‐9. 24. de Onis, M., et al., Comparison of the World Health Organization (WHO)
Child Growth Standards and the National Center for Health Statistics/WHO international growth reference: implications for child health programmes. Public health nutrition, 2006. 9(7): p. 942-‐7.
25. Dale, N.M., et al., Comparison of the new World Health Organization growth standards and the National Center for Health Statistics growth reference regarding mortality of malnourished children treated in a 2006 nutrition program in Niger. Archives of pediatrics & adolescent medicine, 2009. 163(2): p. 126-‐30.
26. Kiley, R., Health statistics on the World Wide Web. Journal of the Royal Society of Medicine, 1998. 91(5): p. 264-‐5.
27. Farsi, M., M. Filippini, and S. Pachauri, Fuel choices in urban Indian households. Environment and Development Economics, 2007. 12: p. 757-‐774.
28. Rehfuess, E.A., et al., Bayesian modelling of household solid fuel use: Insights towards designing effective interventions to promote fuel switching in Africa. Environmental Research, 2010. 110(7): p. 8p.
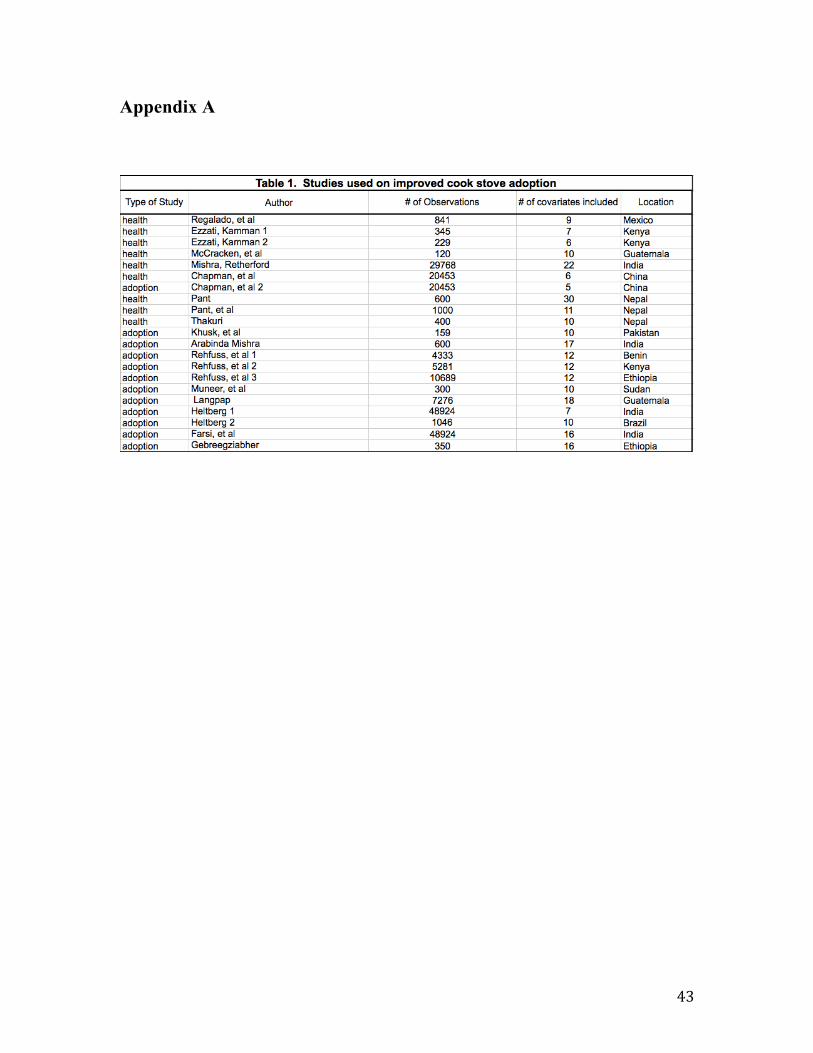
43
Appendix A

44
Appendix B
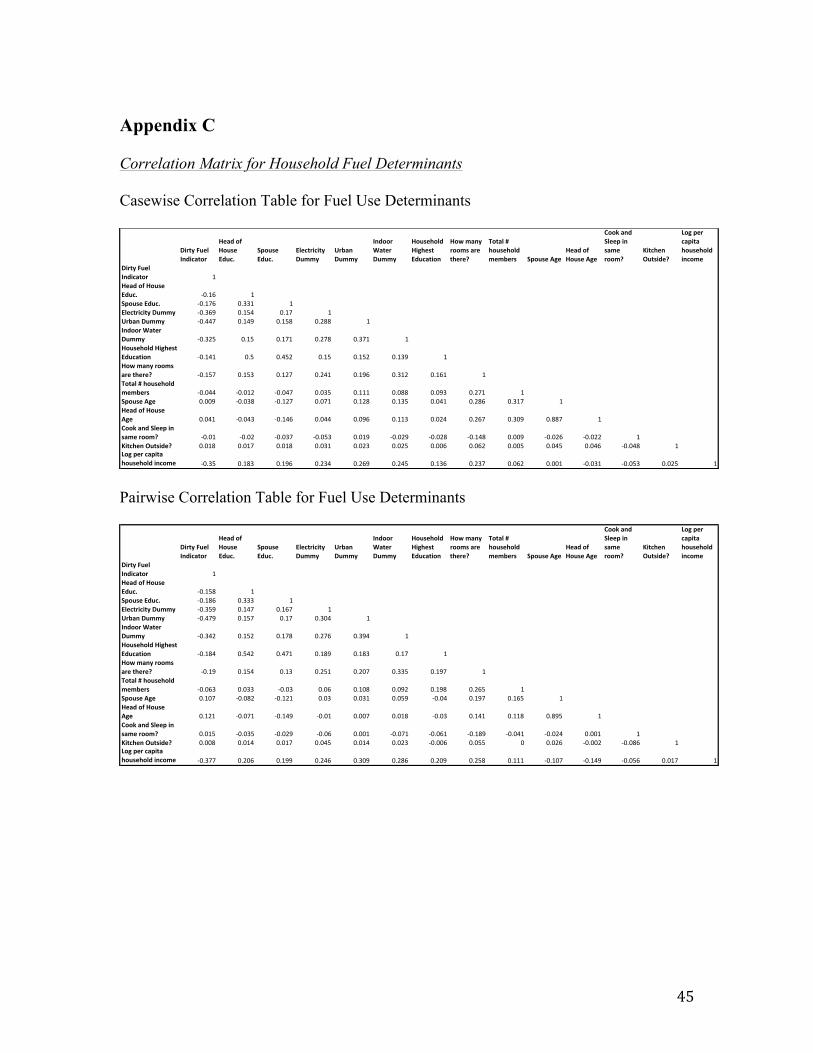
45
Appendix C
Correlation Matrix for Household Fuel Determinants
Casewise Correlation Table for Fuel Use Determinants
!"#$%&'()*&+,-"./$0#
1)/-&02&10(3)&4-(.5
670(3)&4-(.5
4*).$#"."$%&!(88%
9#:/,&!(88%
+,-00#&;/$)#&!(88%
10(3)<0*-&1"=<)3$&4-(./$"0,
10>&8/,%S&/#)&$<)#)?
@0$/*&A&<0(3)<0*-&8)8:)#3 670(3)&B=)
1)/-&02&10(3)&B=)
C00D&/,-&6*))7&",&3/8)?
E"$.<),&F($3"-)?
G0=&7)#&./7"$/&<0(3)<0*-&",.08)
!"#$%&'()*&+,-"./$0# !1)/-&02&10(3)&4-(.5 "#$!% !670(3)&4-(.5 "#$!&% #$''! !4*).$#"."$%&!(88% "#$'%( #$!)* #$!& !9#:/,&!(88% "#$**& #$!*( #$!)+ #$,++ !+,-00#&;/$)#&!(88% "#$',) #$!) #$!&! #$,&+ #$'&! !10(3)<0*-&1"=<)3$&4-(./$"0, "#$!*! #$) #$*), #$!) #$!), #$!'( !10>&8/,%S&/#)&$<)#)? "#$!)& #$!)' #$!,& #$,*! #$!(% #$'!, #$!%! !@0$/*&A&<0(3)<0*-&8)8:)#3 "#$#** "#$#!, "#$#*& #$#') #$!!! #$#++ #$#(' #$,&! !670(3)&B=) #$##( "#$#'+ "#$!,& #$#&! #$!,+ #$!') #$#*! #$,+% #$'!& !1)/-&02&10(3)&B=) #$#*! "#$#*' "#$!*% #$#** #$#(% #$!!' #$#,* #$,%& #$'#( #$++& !C00D&/,-&6*))7&",&3/8)? "#$#! "#$#, "#$#'& "#$#)' #$#!( "#$#,( "#$#,+ "#$!*+ #$##( "#$#,% "#$#,, !E"$.<),&F($3"-)? #$#!+ #$#!& #$#!+ #$#'! #$#,' #$#,) #$##% #$#%, #$##) #$#*) #$#*% "#$#*+ !G0=&7)#&./7"$/&<0(3)<0*-&",.08) "#$') #$!+' #$!(% #$,'* #$,%( #$,*) #$!'% #$,'& #$#%, #$##! "#$#'! "#$#)' #$#,) !
Pairwise Correlation Table for Fuel Use Determinants
!"#$%&'()*&+,-"./$0#
1)/-&02&10(3)&4-(.5
670(3)&4-(.5
4*).$#"."$%&!(88%
9#:/,&!(88%
+,-00#&;/$)#&!(88%
10(3)<0*-&1"=<)3$&4-(./$"0,
10>&8/,%S&/#)&$<)#)?
@0$/*&A&<0(3)<0*-&8)8:)#3 670(3)&B=)
1)/-&02&10(3)&B=)
C00D&/,-&6*))7&",&3/8)?
E"$.<),&F($3"-)?
G0=&7)#&./7"$/&<0(3)<0*-&",.08)
!"#$%&'()*&+,-"./$0# !1)/-&02&10(3)&4-(.5 "#$!%& !670(3)&4-(.5 "#$!&' #$((( !4*).$#"."$%&!(88% "#$(%) #$!*+ #$!'+ !9#:/,&!(88% "#$*+) #$!%+ #$!+ #$(#* !+,-00#&;/$)#&!(88% "#$(*, #$!%, #$!+& #$,+' #$()* !10(3)<0*-&1"=<)3$&4-(./$"0, "#$!&* #$%*, #$*+! #$!&) #$!&( #$!+ !10>&8/,%S&/#)&$<)#)? "#$!) #$!%* #$!( #$,%! #$,#+ #$((% #$!)+ !@0$/*&A&<0(3)<0*-&8)8:)#3 "#$#'( #$#(( "#$#( #$#' #$!#& #$#), #$!)& #$,'% !670(3)&B=) #$!#+ "#$#&, "#$!,! #$#( #$#(! #$#%) "#$#* #$!)+ #$!'% !1)/-&02&10(3)&B=) #$!,! "#$#+! "#$!*) "#$#! #$##+ #$#!& "#$#( #$!*! #$!!& #$&)% !C00D&/,-&6*))7&",&3/8)? #$#!% "#$#(% "#$#,) "#$#' #$##! "#$#+! "#$#'! "#$!&) "#$#*! "#$#,* #$##! !E"$.<),&F($3"-)? #$##& #$#!* #$#!+ #$#*% #$#!* #$#,( "#$##' #$#%% # #$#,' "#$##, "#$#&' !G0=&7)#&./7"$/&<0(3)<0*-&",.08) "#$(++ #$,#' #$!)) #$,*' #$(#) #$,&' #$,#) #$,%& #$!!! "#$!#+ "#$!*) "#$#%' #$#!+ !