Embed Size (px)
Citation preview
House Research Department . 600 State Office Building . St. Paul, MN 55155 . (651) 296-6753
House Research Simulation Report: Property Tax
Simulation #15A6 Date 11/20/2015
Steve Hinze, Legislative Analyst ([email protected])
DESCRIPTION
BASELINE: Final Pay 2014 (including supplemental agricultural credit)
ALTERNATIVE: Final Pay 2015 (Revised)
KEY POINTS
• Statewide, property taxes increased by $247 million, or 2.9%. Approximately $104 million of the
$247 million increase was borne by new construction - property appearing on the tax rolls for the first
time in 2015. The overall tax increases are 4.2% in Greater Minnesota and 2.1% in the Metro area.
• On a statewide average basis, property tax changes on existing properties vary from -2.5% (on
commercial-industrial property) to +6.7% (on public utility property). Changes on the largest
property types are +3.3% on residential homesteads, +2.1% on residential non-homestead property,
+0.4% on apartments, +6.4% on agricultural property, and +4.4% on seasonal-recreational property.
The simulations are estimates only. House Research strives to make property tax simulations
accurate, but simulations are only approximations of reality. Generally the results are most
accurate on a statewide level, and tend to be less accurate as the jurisdiction under scrutiny gets
smaller.
This report compares property taxes payable in 2015 to property taxes payable
in 2014. Both the payable 2014 and the payable 2015 simulations are based
on final data as reported by the counties to the Dept. of Revenue, including
the distribution of the supplemental agricultural credit in 2014 under Laws
2014, Chapter 308, Article 1, section 14. The net tax amounts presented here
do not reflect the impact of the homestead credit refund and the property tax
refund programs. This report incorporates a minor correction over report
#15A5.
House Research Simulation Report: Property Tax Page ii
House Research Department . 600 State Office Building . St. Paul, MN 55155 . (651) 296-6753
BASELINE: Final Pay 2014 (including supplemental agricultural credit)
• Property values (taxable market values) are actual values reported by county assessors on the
abstracts of assessment.
• Local government levies are levies reported by county auditors on the abstracts of tax lists.
• Property tax credits are as reported by county auditors on the abstracts of tax lists, except for the
supplemental agricultural credit amounts, which were obtained from a separate file provided by the
Dept. of Revenue.
ALTERNATIVE: Final Pay 2015 (Revised)
• Market values are actual values reported by county assessors on the abstracts of assessment.
• Local government levies are the levies reported by the county auditors on the abstracts of tax lists.
• Property tax credits are as reported by county auditors on the abstracts of tax lists.
House Research Simulation Report: Property Tax Page iii
House Research Department . 600 State Office Building . St. Paul, MN 55155 . (651) 296-6753
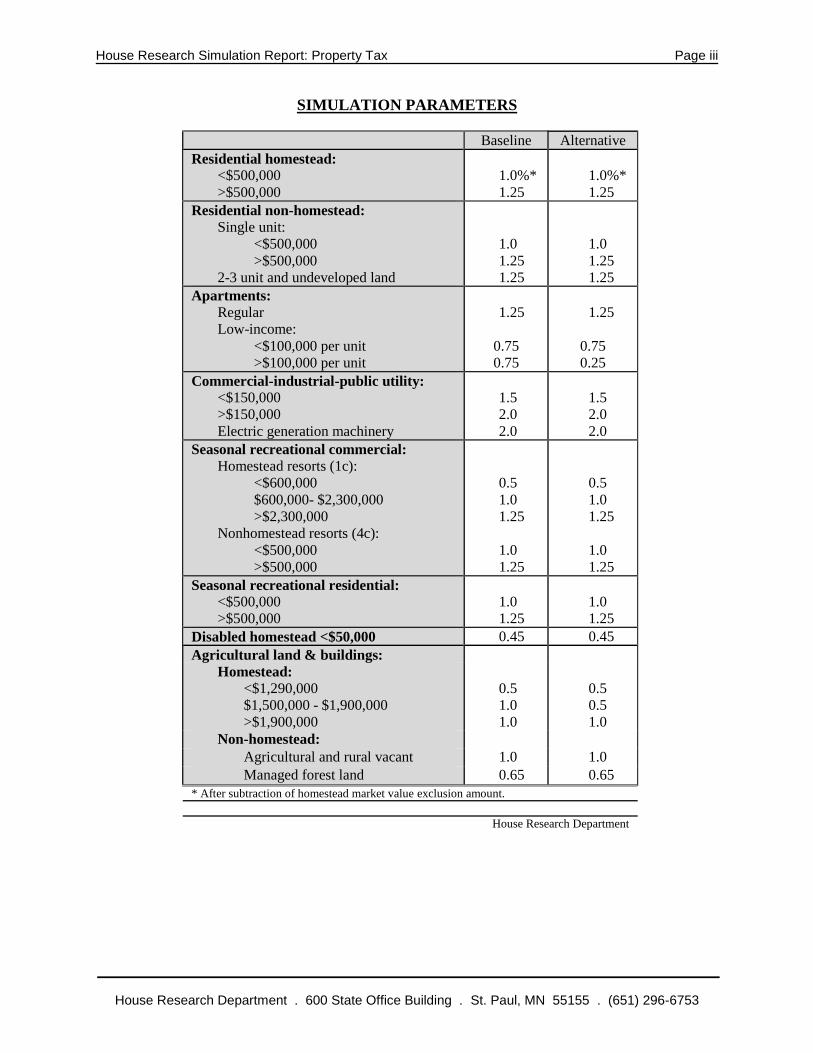
SIMULATION PARAMETERS
Baseline Alternative
Residential homestead: <$500,000
>$500,000
1.0%*
1.25
1.0%*
1.25
Residential non-homestead:
Single unit:
<$500,000
>$500,000
2-3 unit and undeveloped land
1.0
1.25
1.25
1.0
1.25
1.25
Apartments:
Regular
Low-income:
<$100,000 per unit
>$100,000 per unit
1.25
0.75
0.75
1.25
0.75
0.25
Commercial-industrial-public utility: <$150,000
>$150,000
Electric generation machinery
1.5
2.0
2.0
1.5
2.0
2.0
Seasonal recreational commercial: Homestead resorts (1c):
<$600,000
$600,000- $2,300,000
>$2,300,000
Nonhomestead resorts (4c):
<$500,000
>$500,000
0.5
1.0
1.25
1.0
1.25
0.5
1.0
1.25
1.0
1.25
Seasonal recreational residential: <$500,000
>$500,000
1.0
1.25
1.0
1.25
Disabled homestead <$50,000 0.45 0.45
Agricultural land & buildings:
Homestead: <$1,290,000
$1,500,000 - $1,900,000
>$1,900,000
0.5
1.0
1.0
0.5
0.5
1.0
Non-homestead:
Agricultural and rural vacant 1.0 1.0
Managed forest land 0.65 0.65
* After subtraction of homestead market value exclusion amount.
House Research Department
House Research Simulation Report: Property Tax Page iv
House Research Department . 600 State Office Building . St. Paul, MN 55155 . (651) 296-6753
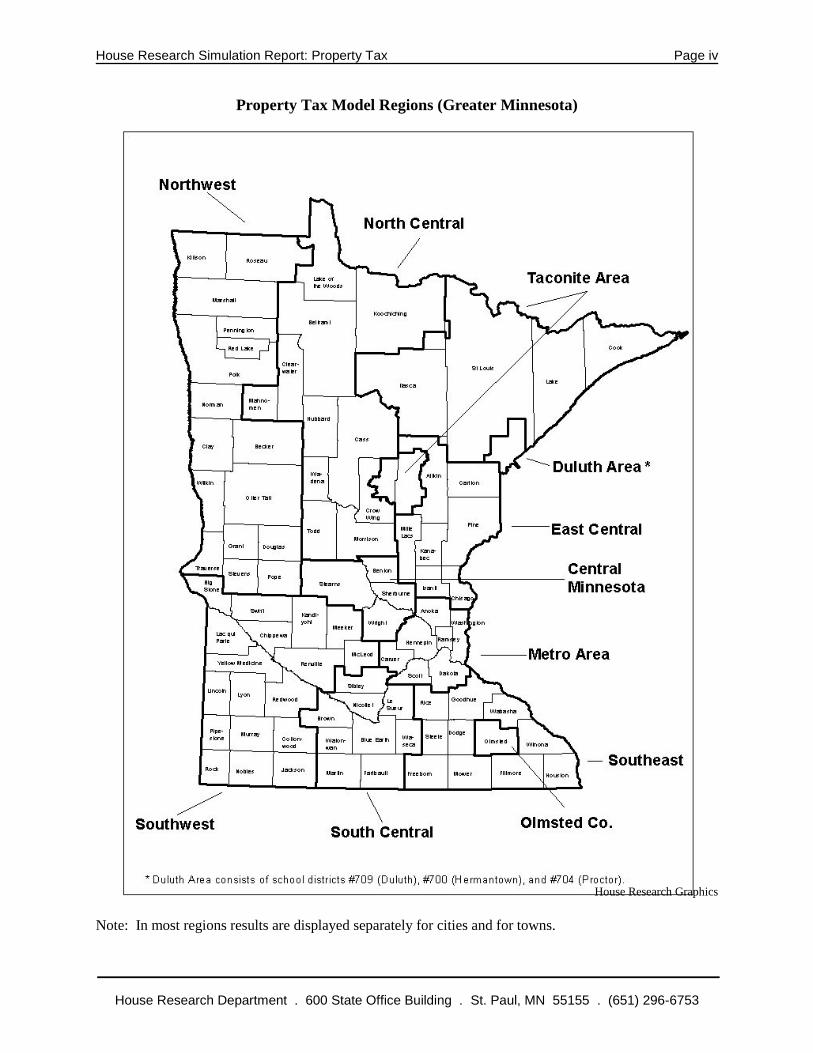
Property Tax Model Regions (Greater Minnesota)
House Research Graphics
Note: In most regions results are displayed separately for cities and for towns.
House Research Simulation Report: Property Tax Page v
House Research Department . 600 State Office Building . St. Paul, MN 55155 . (651) 296-6753
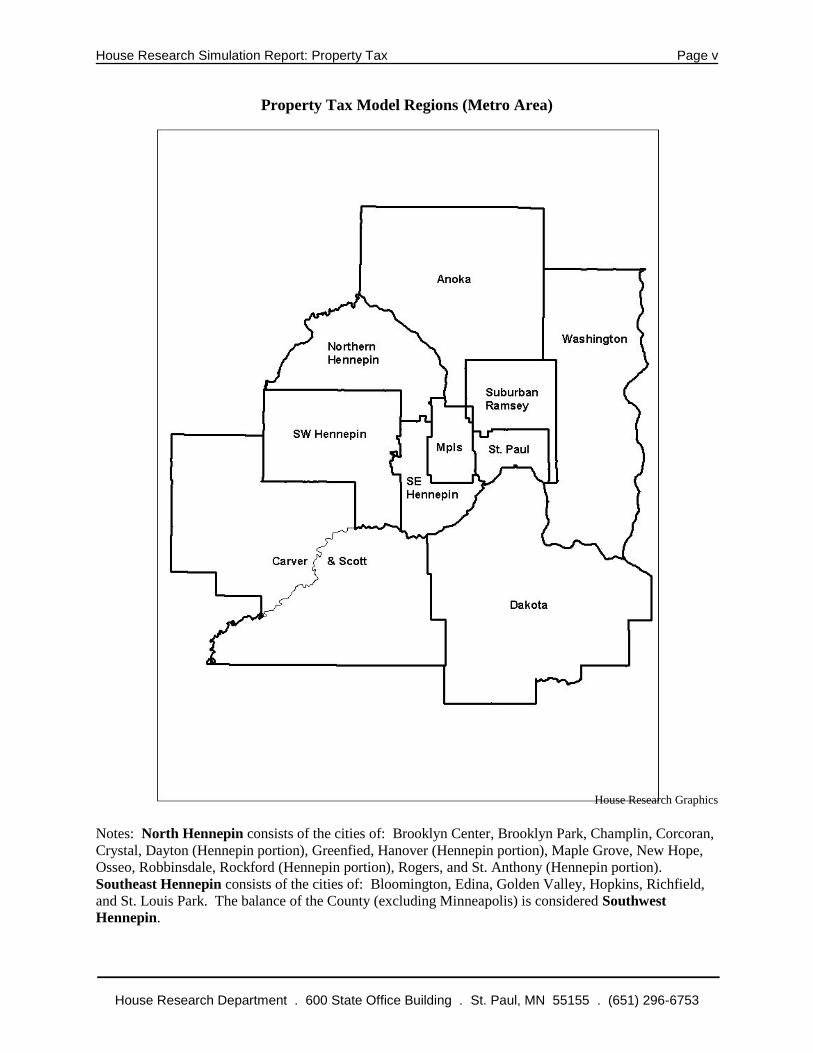
Property Tax Model Regions (Metro Area)
House Research Graphics
Notes: North Hennepin consists of the cities of: Brooklyn Center, Brooklyn Park, Champlin, Corcoran,
Crystal, Dayton (Hennepin portion), Greenfied, Hanover (Hennepin portion), Maple Grove, New Hope,
Osseo, Robbinsdale, Rockford (Hennepin portion), Rogers, and St. Anthony (Hennepin portion).
Southeast Hennepin consists of the cities of: Bloomington, Edina, Golden Valley, Hopkins, Richfield,
and St. Louis Park. The balance of the County (excluding Minneapolis) is considered Southwest
Hennepin.
Page 1
(all figures in $000s)
House Research Dept.
11/20/2015 3:51 PM
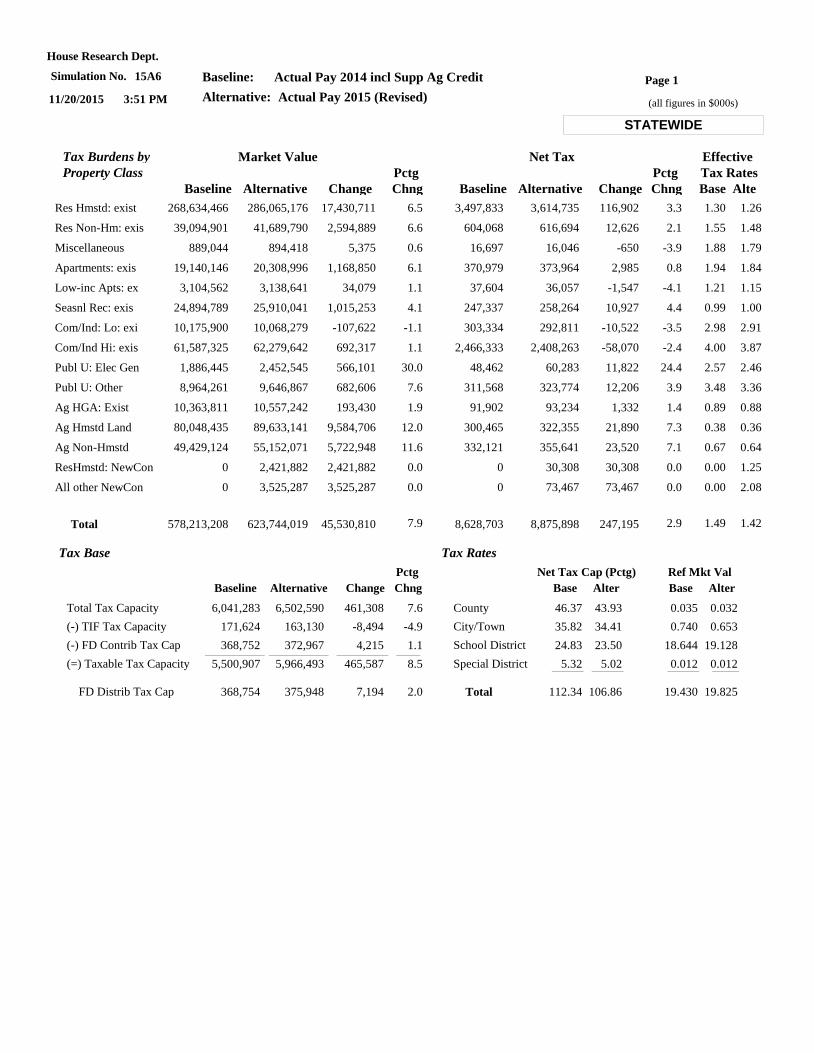
Simulation No. 15A6 Baseline: Actual Pay 2014 incl Supp Ag Credit
Alternative: Actual Pay 2015 (Revised)
STATEWIDE
Tax Base
Total Tax Capacity
(-) TIF Tax Capacity
(-) FD Contrib Tax Cap
(=) Taxable Tax Capacity
171,624
368,752
5,500,907
6,041,283
163,130
372,967
5,966,493
6,502,590
-8,494
4,215
465,587
461,308
FD Distrib Tax Cap 368,754 375,948 7,194
7.6
-4.9
1.1
8.5
2.0
Baseline Alternative Change Chng
Pctg
Tax Rates
County
City/Town
School District
Special District
46.37
35.82
24.83
5.32
Total 112.34
43.93
34.41
23.50
5.02
106.86
0.035
0.740
18.644
0.012
19.430
0.032
0.653
19.128
0.012
19.825
Base Alter Base Alter
Net Tax Cap (Pctg) Ref Mkt Val
Baseline Alternative Change Chng Base
Effective
Tax Rates
AlteChngBaseline Alternative Change
Market Value Net TaxTax Burdens by
Pctg PctgProperty Class
Res Hmstd: exist 268,634,466 286,065,176 17,430,711 6.5 3,497,833 3,614,735 116,902 3.3 1.30 1.26
Res Non-Hm: exis 39,094,901 41,689,790 2,594,889 6.6 604,068 616,694 12,626 2.1 1.55 1.48
Miscellaneous 889,044 894,418 5,375 0.6 16,697 16,046 -650 -3.9 1.88 1.79
Apartments: exis 19,140,146 20,308,996 1,168,850 6.1 370,979 373,964 2,985 0.8 1.94 1.84
Low-inc Apts: ex 3,104,562 3,138,641 34,079 1.1 37,604 36,057 -1,547 -4.1 1.21 1.15
Seasnl Rec: exis 24,894,789 25,910,041 1,015,253 4.1 247,337 258,264 10,927 4.4 0.99 1.00
Com/Ind: Lo: exi 10,175,900 10,068,279 -107,622 -1.1 303,334 292,811 -10,522 -3.5 2.98 2.91
Com/Ind Hi: exis 61,587,325 62,279,642 692,317 1.1 2,466,333 2,408,263 -58,070 -2.4 4.00 3.87
Publ U: Elec Gen 1,886,445 2,452,545 566,101 30.0 48,462 60,283 11,822 24.4 2.57 2.46
Publ U: Other 8,964,261 9,646,867 682,606 7.6 311,568 323,774 12,206 3.9 3.48 3.36
Ag HGA: Exist 10,363,811 10,557,242 193,430 1.9 91,902 93,234 1,332 1.4 0.89 0.88
Ag Hmstd Land 80,048,435 89,633,141 9,584,706 12.0 300,465 322,355 21,890 7.3 0.38 0.36
Ag Non-Hmstd 49,429,124 55,152,071 5,722,948 11.6 332,121 355,641 23,520 7.1 0.67 0.64
ResHmstd: NewCon 0 2,421,882 2,421,882 0.0 0 30,308 30,308 0.0 0.00 1.25
All other NewCon 0 3,525,287 3,525,287 0.0 0 73,467 73,467 0.0 0.00 2.08
Total 578,213,208 623,744,019 45,530,810 8,628,703 8,875,898 247,1957.9 2.9 1.49 1.42
Page 2
(all figures in $000s)
House Research Dept.
11/20/2015 3:51 PM
Simulation No. 15A6 Baseline: Actual Pay 2014 incl Supp Ag Credit
Alternative: Actual Pay 2015 (Revised)
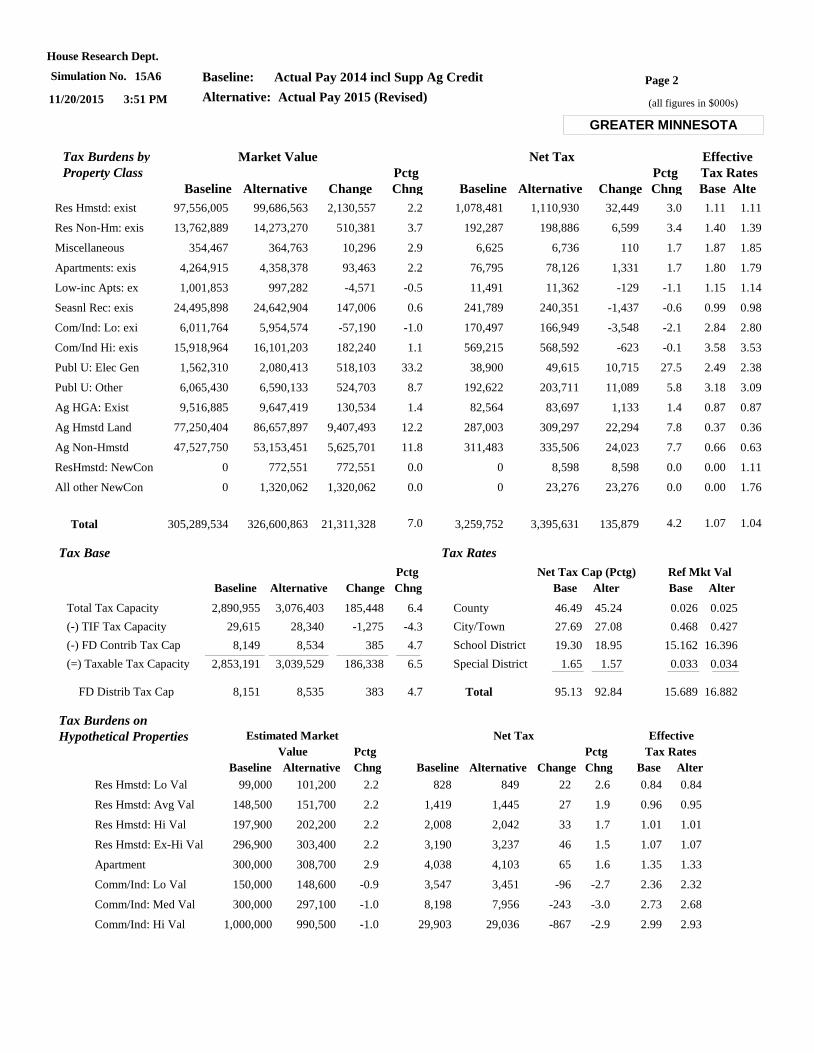
GREATER MINNESOTA
Tax Base
Total Tax Capacity
(-) TIF Tax Capacity
(-) FD Contrib Tax Cap
(=) Taxable Tax Capacity
29,615
8,149
2,853,191
2,890,955
28,340
8,534
3,039,529
3,076,403
-1,275
385
186,338
185,448
FD Distrib Tax Cap 8,151 8,535 383
6.4
-4.3
4.7
6.5
4.7
Baseline Alternative Change Chng
Pctg
Tax Rates
County
City/Town
School District
Special District
46.49
27.69
19.30
1.65
Total 95.13
45.24
27.08
18.95
1.57
92.84
0.026
0.468
15.162
0.033
15.689
0.025
0.427
16.396
0.034
16.882
Base Alter Base Alter
Net Tax Cap (Pctg) Ref Mkt Val
Baseline Alternative Change Chng Base
Effective
Tax Rates
AlteChngBaseline Alternative Change
Market Value Net TaxTax Burdens by
Pctg PctgProperty Class
Res Hmstd: exist 97,556,005 99,686,563 2,130,557 2.2 1,078,481 1,110,930 32,449 3.0 1.11 1.11
Res Non-Hm: exis 13,762,889 14,273,270 510,381 3.7 192,287 198,886 6,599 3.4 1.40 1.39
Miscellaneous 354,467 364,763 10,296 2.9 6,625 6,736 110 1.7 1.87 1.85
Apartments: exis 4,264,915 4,358,378 93,463 2.2 76,795 78,126 1,331 1.7 1.80 1.79
Low-inc Apts: ex 1,001,853 997,282 -4,571 -0.5 11,491 11,362 -129 -1.1 1.15 1.14
Seasnl Rec: exis 24,495,898 24,642,904 147,006 0.6 241,789 240,351 -1,437 -0.6 0.99 0.98
Com/Ind: Lo: exi 6,011,764 5,954,574 -57,190 -1.0 170,497 166,949 -3,548 -2.1 2.84 2.80
Com/Ind Hi: exis 15,918,964 16,101,203 182,240 1.1 569,215 568,592 -623 -0.1 3.58 3.53
Publ U: Elec Gen 1,562,310 2,080,413 518,103 33.2 38,900 49,615 10,715 27.5 2.49 2.38
Publ U: Other 6,065,430 6,590,133 524,703 8.7 192,622 203,711 11,089 5.8 3.18 3.09
Ag HGA: Exist 9,516,885 9,647,419 130,534 1.4 82,564 83,697 1,133 1.4 0.87 0.87
Ag Hmstd Land 77,250,404 86,657,897 9,407,493 12.2 287,003 309,297 22,294 7.8 0.37 0.36
Ag Non-Hmstd 47,527,750 53,153,451 5,625,701 11.8 311,483 335,506 24,023 7.7 0.66 0.63
ResHmstd: NewCon 0 772,551 772,551 0.0 0 8,598 8,598 0.0 0.00 1.11
All other NewCon 0 1,320,062 1,320,062 0.0 0 23,276 23,276 0.0 0.00 1.76
Total 305,289,534 326,600,863 21,311,328 3,259,752 3,395,631 135,8797.0 4.2 1.07 1.04
Baseline Alternative Baseline Alternative
Tax Burdens on
Chng Chng
Pctg Pctg
Change Base Alter
Tax Rates
Effective
Value
Estimated Market Net TaxHypothetical Properties
Res Hmstd: Lo Val 99,000 101,200 828 8492.2 22 2.6 0.84 0.84
Res Hmstd: Avg Val 148,500 151,700 1,419 1,4452.2 27 1.9 0.96 0.95
Res Hmstd: Hi Val 197,900 202,200 2,008 2,0422.2 33 1.7 1.01 1.01
Res Hmstd: Ex-Hi Val 296,900 303,400 3,190 3,2372.2 46 1.5 1.07 1.07
Apartment 300,000 308,700 4,038 4,1032.9 65 1.6 1.35 1.33
Comm/Ind: Lo Val 150,000 148,600 3,547 3,451-0.9 -96 -2.7 2.36 2.32
Comm/Ind: Med Val 300,000 297,100 8,198 7,956-1.0 -243 -3.0 2.73 2.68
Comm/Ind: Hi Val 1,000,000 990,500 29,903 29,036-1.0 -867 -2.9 2.99 2.93
Page 3
(all figures in $000s)
House Research Dept.
11/20/2015 3:51 PM
Simulation No. 15A6 Baseline: Actual Pay 2014 incl Supp Ag Credit
Alternative: Actual Pay 2015 (Revised)
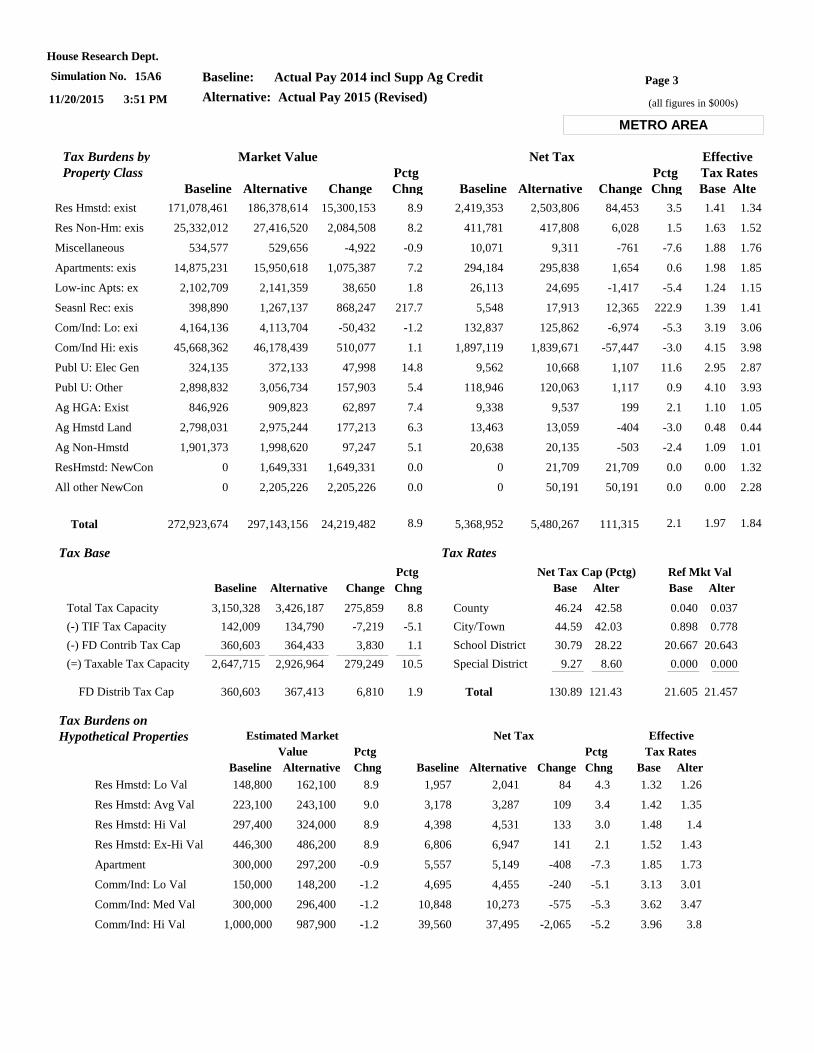
METRO AREA
Tax Base
Total Tax Capacity
(-) TIF Tax Capacity
(-) FD Contrib Tax Cap
(=) Taxable Tax Capacity
142,009
360,603
2,647,715
3,150,328
134,790
364,433
2,926,964
3,426,187
-7,219
3,830
279,249
275,859
FD Distrib Tax Cap 360,603 367,413 6,810
8.8
-5.1
1.1
10.5
1.9
Baseline Alternative Change Chng
Pctg
Tax Rates
County
City/Town
School District
Special District
46.24
44.59
30.79
9.27
Total 130.89
42.58
42.03
28.22
8.60
121.43
0.040
0.898
20.667
0.000
21.605
0.037
0.778
20.643
0.000
21.457
Base Alter Base Alter
Net Tax Cap (Pctg) Ref Mkt Val
Baseline Alternative Change Chng Base
Effective
Tax Rates
AlteChngBaseline Alternative Change
Market Value Net TaxTax Burdens by
Pctg PctgProperty Class
Res Hmstd: exist 171,078,461 186,378,614 15,300,153 8.9 2,419,353 2,503,806 84,453 3.5 1.41 1.34
Res Non-Hm: exis 25,332,012 27,416,520 2,084,508 8.2 411,781 417,808 6,028 1.5 1.63 1.52
Miscellaneous 534,577 529,656 -4,922 -0.9 10,071 9,311 -761 -7.6 1.88 1.76
Apartments: exis 14,875,231 15,950,618 1,075,387 7.2 294,184 295,838 1,654 0.6 1.98 1.85
Low-inc Apts: ex 2,102,709 2,141,359 38,650 1.8 26,113 24,695 -1,417 -5.4 1.24 1.15
Seasnl Rec: exis 398,890 1,267,137 868,247 217.7 5,548 17,913 12,365 222.9 1.39 1.41
Com/Ind: Lo: exi 4,164,136 4,113,704 -50,432 -1.2 132,837 125,862 -6,974 -5.3 3.19 3.06
Com/Ind Hi: exis 45,668,362 46,178,439 510,077 1.1 1,897,119 1,839,671 -57,447 -3.0 4.15 3.98
Publ U: Elec Gen 324,135 372,133 47,998 14.8 9,562 10,668 1,107 11.6 2.95 2.87
Publ U: Other 2,898,832 3,056,734 157,903 5.4 118,946 120,063 1,117 0.9 4.10 3.93
Ag HGA: Exist 846,926 909,823 62,897 7.4 9,338 9,537 199 2.1 1.10 1.05
Ag Hmstd Land 2,798,031 2,975,244 177,213 6.3 13,463 13,059 -404 -3.0 0.48 0.44
Ag Non-Hmstd 1,901,373 1,998,620 97,247 5.1 20,638 20,135 -503 -2.4 1.09 1.01
ResHmstd: NewCon 0 1,649,331 1,649,331 0.0 0 21,709 21,709 0.0 0.00 1.32
All other NewCon 0 2,205,226 2,205,226 0.0 0 50,191 50,191 0.0 0.00 2.28
Total 272,923,674 297,143,156 24,219,482 5,368,952 5,480,267 111,3158.9 2.1 1.97 1.84
Baseline Alternative Baseline Alternative
Tax Burdens on
Chng Chng
Pctg Pctg
Change Base Alter
Tax Rates
Effective
Value
Estimated Market Net TaxHypothetical Properties
Res Hmstd: Lo Val 148,800 162,100 1,957 2,0418.9 84 4.3 1.32 1.26
Res Hmstd: Avg Val 223,100 243,100 3,178 3,2879.0 109 3.4 1.42 1.35
Res Hmstd: Hi Val 297,400 324,000 4,398 4,5318.9 133 3.0 1.48 1.4
Res Hmstd: Ex-Hi Val 446,300 486,200 6,806 6,9478.9 141 2.1 1.52 1.43
Apartment 300,000 297,200 5,557 5,149-0.9 -408 -7.3 1.85 1.73
Comm/Ind: Lo Val 150,000 148,200 4,695 4,455-1.2 -240 -5.1 3.13 3.01
Comm/Ind: Med Val 300,000 296,400 10,848 10,273-1.2 -575 -5.3 3.62 3.47
Comm/Ind: Hi Val 1,000,000 987,900 39,560 37,495-1.2 -2,065 -5.2 3.96 3.8
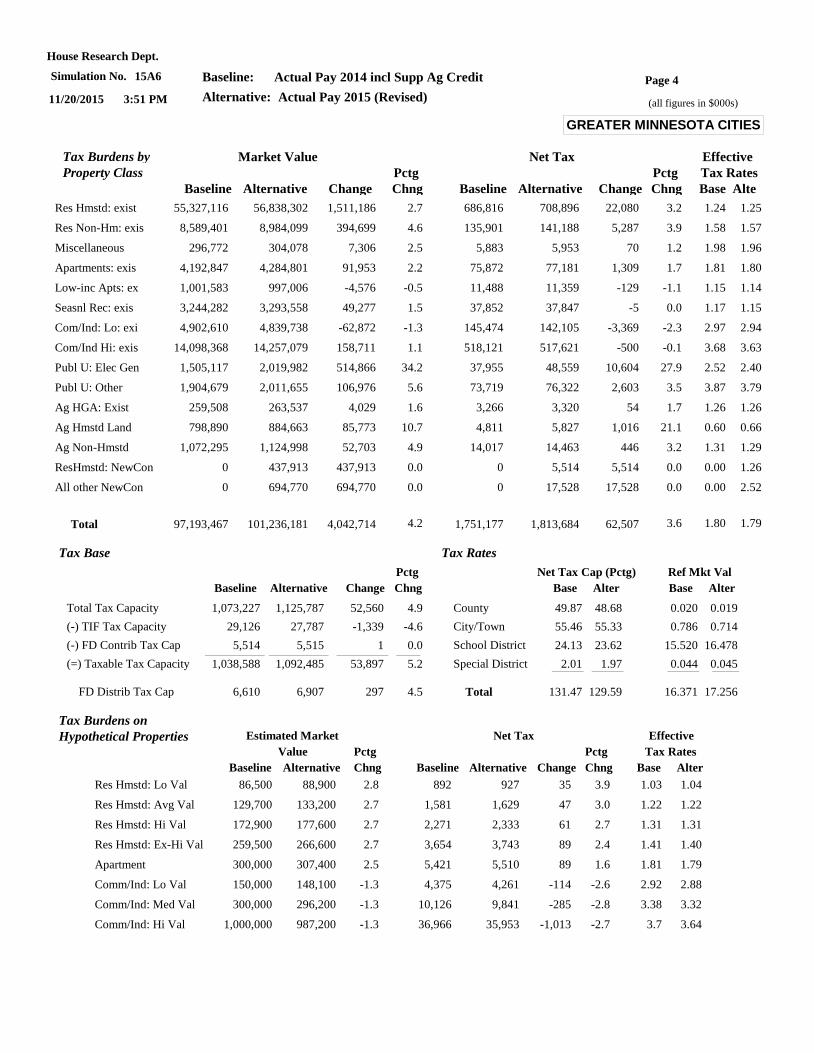
Page 4
(all figures in $000s)
House Research Dept.
11/20/2015 3:51 PM
Simulation No. 15A6 Baseline: Actual Pay 2014 incl Supp Ag Credit
Alternative: Actual Pay 2015 (Revised)
GREATER MINNESOTA CITIES
Tax Base
Total Tax Capacity
(-) TIF Tax Capacity
(-) FD Contrib Tax Cap
(=) Taxable Tax Capacity
29,126
5,514
1,038,588
1,073,227
27,787
5,515
1,092,485
1,125,787
-1,339
1
53,897
52,560
FD Distrib Tax Cap 6,610 6,907 297
4.9
-4.6
0.0
5.2
4.5
Baseline Alternative Change Chng
Pctg
Tax Rates
County
City/Town
School District
Special District
49.87
55.46
24.13
2.01
Total 131.47
48.68
55.33
23.62
1.97
129.59
0.020
0.786
15.520
0.044
16.371
0.019
0.714
16.478
0.045
17.256
Base Alter Base Alter
Net Tax Cap (Pctg) Ref Mkt Val
Baseline Alternative Change Chng Base
Effective
Tax Rates
AlteChngBaseline Alternative Change
Market Value Net TaxTax Burdens by
Pctg PctgProperty Class
Res Hmstd: exist 55,327,116 56,838,302 1,511,186 2.7 686,816 708,896 22,080 3.2 1.24 1.25
Res Non-Hm: exis 8,589,401 8,984,099 394,699 4.6 135,901 141,188 5,287 3.9 1.58 1.57
Miscellaneous 296,772 304,078 7,306 2.5 5,883 5,953 70 1.2 1.98 1.96
Apartments: exis 4,192,847 4,284,801 91,953 2.2 75,872 77,181 1,309 1.7 1.81 1.80
Low-inc Apts: ex 1,001,583 997,006 -4,576 -0.5 11,488 11,359 -129 -1.1 1.15 1.14
Seasnl Rec: exis 3,244,282 3,293,558 49,277 1.5 37,852 37,847 -5 0.0 1.17 1.15
Com/Ind: Lo: exi 4,902,610 4,839,738 -62,872 -1.3 145,474 142,105 -3,369 -2.3 2.97 2.94
Com/Ind Hi: exis 14,098,368 14,257,079 158,711 1.1 518,121 517,621 -500 -0.1 3.68 3.63
Publ U: Elec Gen 1,505,117 2,019,982 514,866 34.2 37,955 48,559 10,604 27.9 2.52 2.40
Publ U: Other 1,904,679 2,011,655 106,976 5.6 73,719 76,322 2,603 3.5 3.87 3.79
Ag HGA: Exist 259,508 263,537 4,029 1.6 3,266 3,320 54 1.7 1.26 1.26
Ag Hmstd Land 798,890 884,663 85,773 10.7 4,811 5,827 1,016 21.1 0.60 0.66
Ag Non-Hmstd 1,072,295 1,124,998 52,703 4.9 14,017 14,463 446 3.2 1.31 1.29
ResHmstd: NewCon 0 437,913 437,913 0.0 0 5,514 5,514 0.0 0.00 1.26
All other NewCon 0 694,770 694,770 0.0 0 17,528 17,528 0.0 0.00 2.52
Total 97,193,467 101,236,181 4,042,714 1,751,177 1,813,684 62,5074.2 3.6 1.80 1.79
Baseline Alternative Baseline Alternative
Tax Burdens on
Chng Chng
Pctg Pctg
Change Base Alter
Tax Rates
Effective
Value
Estimated Market Net TaxHypothetical Properties
Res Hmstd: Lo Val 86,500 88,900 892 9272.8 35 3.9 1.03 1.04
Res Hmstd: Avg Val 129,700 133,200 1,581 1,6292.7 47 3.0 1.22 1.22
Res Hmstd: Hi Val 172,900 177,600 2,271 2,3332.7 61 2.7 1.31 1.31
Res Hmstd: Ex-Hi Val 259,500 266,600 3,654 3,7432.7 89 2.4 1.41 1.40
Apartment 300,000 307,400 5,421 5,5102.5 89 1.6 1.81 1.79
Comm/Ind: Lo Val 150,000 148,100 4,375 4,261-1.3 -114 -2.6 2.92 2.88
Comm/Ind: Med Val 300,000 296,200 10,126 9,841-1.3 -285 -2.8 3.38 3.32
Comm/Ind: Hi Val 1,000,000 987,200 36,966 35,953-1.3 -1,013 -2.7 3.7 3.64
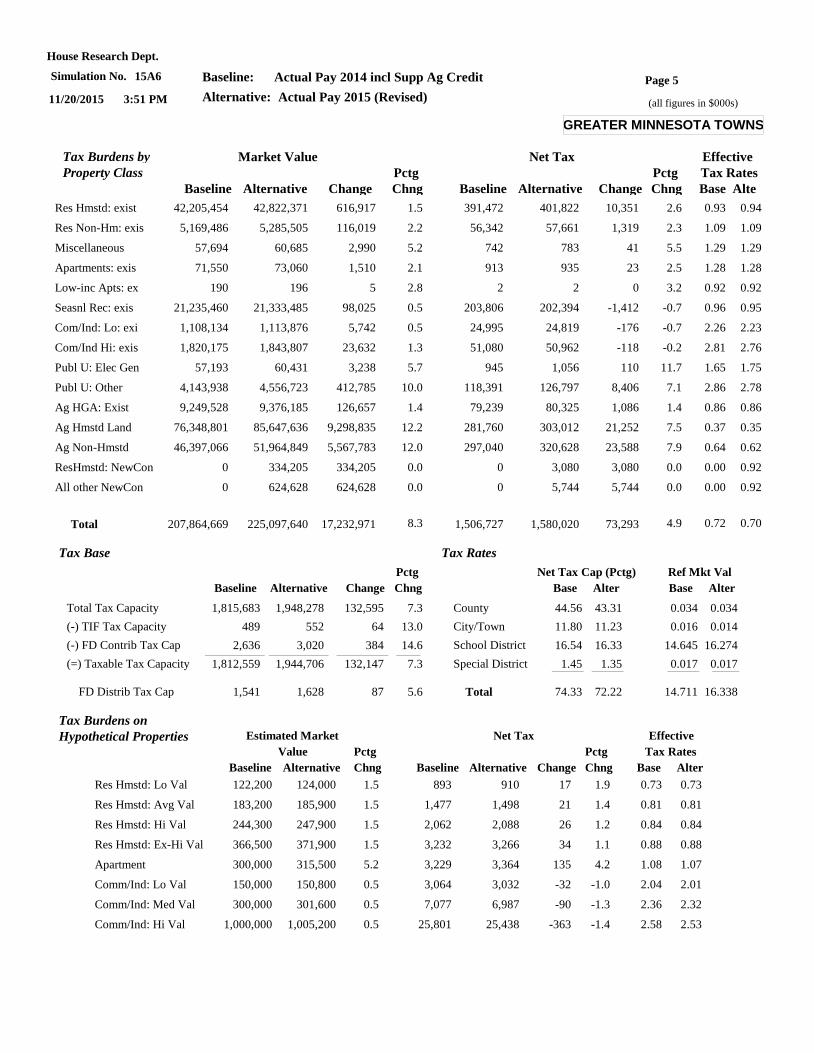
Page 5
(all figures in $000s)
House Research Dept.
11/20/2015 3:51 PM
Simulation No. 15A6 Baseline: Actual Pay 2014 incl Supp Ag Credit
Alternative: Actual Pay 2015 (Revised)
GREATER MINNESOTA TOWNS
Tax Base
Total Tax Capacity
(-) TIF Tax Capacity
(-) FD Contrib Tax Cap
(=) Taxable Tax Capacity
489
2,636
1,812,559
1,815,683
552
3,020
1,944,706
1,948,278
64
384
132,147
132,595
FD Distrib Tax Cap 1,541 1,628 87
7.3
13.0
14.6
7.3
5.6
Baseline Alternative Change Chng
Pctg
Tax Rates
County
City/Town
School District
Special District
44.56
11.80
16.54
1.45
Total 74.33
43.31
11.23
16.33
1.35
72.22
0.034
0.016
14.645
0.017
14.711
0.034
0.014
16.274
0.017
16.338
Base Alter Base Alter
Net Tax Cap (Pctg) Ref Mkt Val
Baseline Alternative Change Chng Base
Effective
Tax Rates
AlteChngBaseline Alternative Change
Market Value Net TaxTax Burdens by
Pctg PctgProperty Class
Res Hmstd: exist 42,205,454 42,822,371 616,917 1.5 391,472 401,822 10,351 2.6 0.93 0.94
Res Non-Hm: exis 5,169,486 5,285,505 116,019 2.2 56,342 57,661 1,319 2.3 1.09 1.09
Miscellaneous 57,694 60,685 2,990 5.2 742 783 41 5.5 1.29 1.29
Apartments: exis 71,550 73,060 1,510 2.1 913 935 23 2.5 1.28 1.28
Low-inc Apts: ex 190 196 5 2.8 2 2 0 3.2 0.92 0.92
Seasnl Rec: exis 21,235,460 21,333,485 98,025 0.5 203,806 202,394 -1,412 -0.7 0.96 0.95
Com/Ind: Lo: exi 1,108,134 1,113,876 5,742 0.5 24,995 24,819 -176 -0.7 2.26 2.23
Com/Ind Hi: exis 1,820,175 1,843,807 23,632 1.3 51,080 50,962 -118 -0.2 2.81 2.76
Publ U: Elec Gen 57,193 60,431 3,238 5.7 945 1,056 110 11.7 1.65 1.75
Publ U: Other 4,143,938 4,556,723 412,785 10.0 118,391 126,797 8,406 7.1 2.86 2.78
Ag HGA: Exist 9,249,528 9,376,185 126,657 1.4 79,239 80,325 1,086 1.4 0.86 0.86
Ag Hmstd Land 76,348,801 85,647,636 9,298,835 12.2 281,760 303,012 21,252 7.5 0.37 0.35
Ag Non-Hmstd 46,397,066 51,964,849 5,567,783 12.0 297,040 320,628 23,588 7.9 0.64 0.62
ResHmstd: NewCon 0 334,205 334,205 0.0 0 3,080 3,080 0.0 0.00 0.92
All other NewCon 0 624,628 624,628 0.0 0 5,744 5,744 0.0 0.00 0.92
Total 207,864,669 225,097,640 17,232,971 1,506,727 1,580,020 73,2938.3 4.9 0.72 0.70
Baseline Alternative Baseline Alternative
Tax Burdens on
Chng Chng
Pctg Pctg
Change Base Alter
Tax Rates
Effective
Value
Estimated Market Net TaxHypothetical Properties
Res Hmstd: Lo Val 122,200 124,000 893 9101.5 17 1.9 0.73 0.73
Res Hmstd: Avg Val 183,200 185,900 1,477 1,4981.5 21 1.4 0.81 0.81
Res Hmstd: Hi Val 244,300 247,900 2,062 2,0881.5 26 1.2 0.84 0.84
Res Hmstd: Ex-Hi Val 366,500 371,900 3,232 3,2661.5 34 1.1 0.88 0.88
Apartment 300,000 315,500 3,229 3,3645.2 135 4.2 1.08 1.07
Comm/Ind: Lo Val 150,000 150,800 3,064 3,0320.5 -32 -1.0 2.04 2.01
Comm/Ind: Med Val 300,000 301,600 7,077 6,9870.5 -90 -1.3 2.36 2.32
Comm/Ind: Hi Val 1,000,000 1,005,200 25,801 25,4380.5 -363 -1.4 2.58 2.53
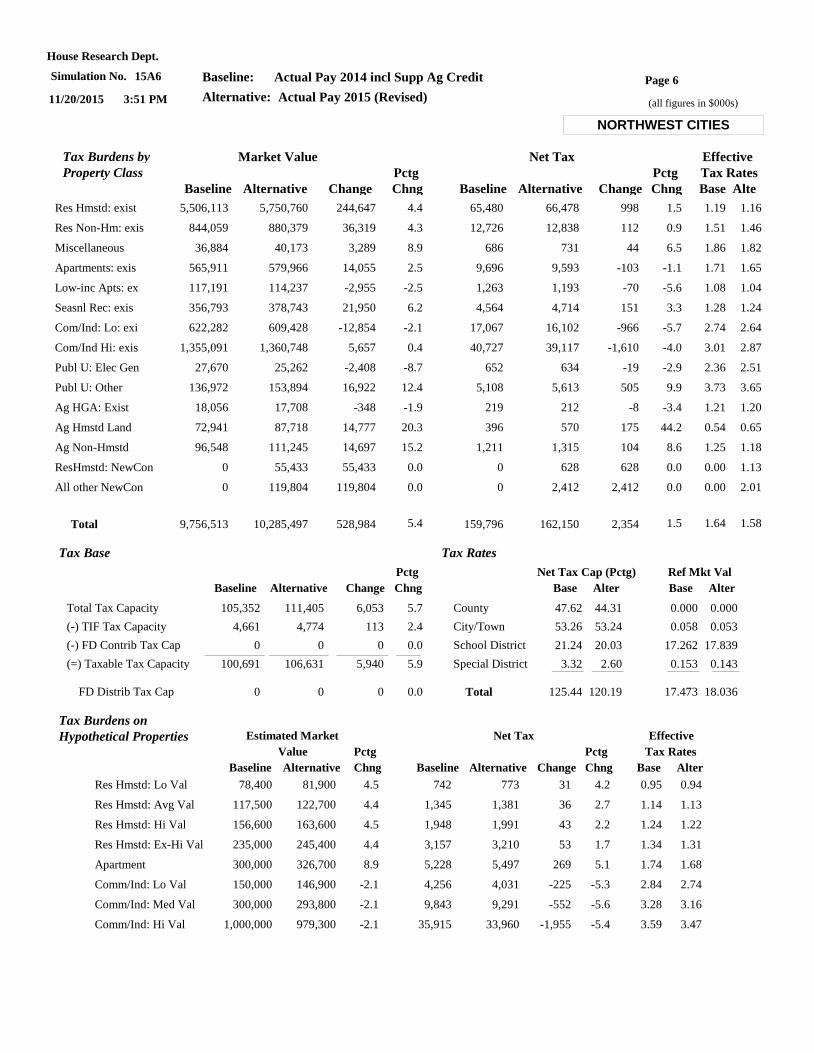
Page 6
(all figures in $000s)
House Research Dept.
11/20/2015 3:51 PM
Simulation No. 15A6 Baseline: Actual Pay 2014 incl Supp Ag Credit
Alternative: Actual Pay 2015 (Revised)
NORTHWEST CITIES
Tax Base
Total Tax Capacity
(-) TIF Tax Capacity
(-) FD Contrib Tax Cap
(=) Taxable Tax Capacity
4,661
0
100,691
105,352
4,774
0
106,631
111,405
113
0
5,940
6,053
FD Distrib Tax Cap 0 0 0
5.7
2.4
0.0
5.9
0.0
Baseline Alternative Change Chng
Pctg
Tax Rates
County
City/Town
School District
Special District
47.62
53.26
21.24
3.32
Total 125.44
44.31
53.24
20.03
2.60
120.19
0.000
0.058
17.262
0.153
17.473
0.000
0.053
17.839
0.143
18.036
Base Alter Base Alter
Net Tax Cap (Pctg) Ref Mkt Val
Baseline Alternative Change Chng Base
Effective
Tax Rates
AlteChngBaseline Alternative Change
Market Value Net TaxTax Burdens by
Pctg PctgProperty Class
Res Hmstd: exist 5,506,113 5,750,760 244,647 4.4 65,480 66,478 998 1.5 1.19 1.16
Res Non-Hm: exis 844,059 880,379 36,319 4.3 12,726 12,838 112 0.9 1.51 1.46
Miscellaneous 36,884 40,173 3,289 8.9 686 731 44 6.5 1.86 1.82
Apartments: exis 565,911 579,966 14,055 2.5 9,696 9,593 -103 -1.1 1.71 1.65
Low-inc Apts: ex 117,191 114,237 -2,955 -2.5 1,263 1,193 -70 -5.6 1.08 1.04
Seasnl Rec: exis 356,793 378,743 21,950 6.2 4,564 4,714 151 3.3 1.28 1.24
Com/Ind: Lo: exi 622,282 609,428 -12,854 -2.1 17,067 16,102 -966 -5.7 2.74 2.64
Com/Ind Hi: exis 1,355,091 1,360,748 5,657 0.4 40,727 39,117 -1,610 -4.0 3.01 2.87
Publ U: Elec Gen 27,670 25,262 -2,408 -8.7 652 634 -19 -2.9 2.36 2.51
Publ U: Other 136,972 153,894 16,922 12.4 5,108 5,613 505 9.9 3.73 3.65
Ag HGA: Exist 18,056 17,708 -348 -1.9 219 212 -8 -3.4 1.21 1.20
Ag Hmstd Land 72,941 87,718 14,777 20.3 396 570 175 44.2 0.54 0.65
Ag Non-Hmstd 96,548 111,245 14,697 15.2 1,211 1,315 104 8.6 1.25 1.18
ResHmstd: NewCon 0 55,433 55,433 0.0 0 628 628 0.0 0.00 1.13
All other NewCon 0 119,804 119,804 0.0 0 2,412 2,412 0.0 0.00 2.01
Total 9,756,513 10,285,497 528,984 159,796 162,150 2,3545.4 1.5 1.64 1.58
Baseline Alternative Baseline Alternative
Tax Burdens on
Chng Chng
Pctg Pctg
Change Base Alter
Tax Rates
Effective
Value
Estimated Market Net TaxHypothetical Properties
Res Hmstd: Lo Val 78,400 81,900 742 7734.5 31 4.2 0.95 0.94
Res Hmstd: Avg Val 117,500 122,700 1,345 1,3814.4 36 2.7 1.14 1.13
Res Hmstd: Hi Val 156,600 163,600 1,948 1,9914.5 43 2.2 1.24 1.22
Res Hmstd: Ex-Hi Val 235,000 245,400 3,157 3,2104.4 53 1.7 1.34 1.31
Apartment 300,000 326,700 5,228 5,4978.9 269 5.1 1.74 1.68
Comm/Ind: Lo Val 150,000 146,900 4,256 4,031-2.1 -225 -5.3 2.84 2.74
Comm/Ind: Med Val 300,000 293,800 9,843 9,291-2.1 -552 -5.6 3.28 3.16
Comm/Ind: Hi Val 1,000,000 979,300 35,915 33,960-2.1 -1,955 -5.4 3.59 3.47
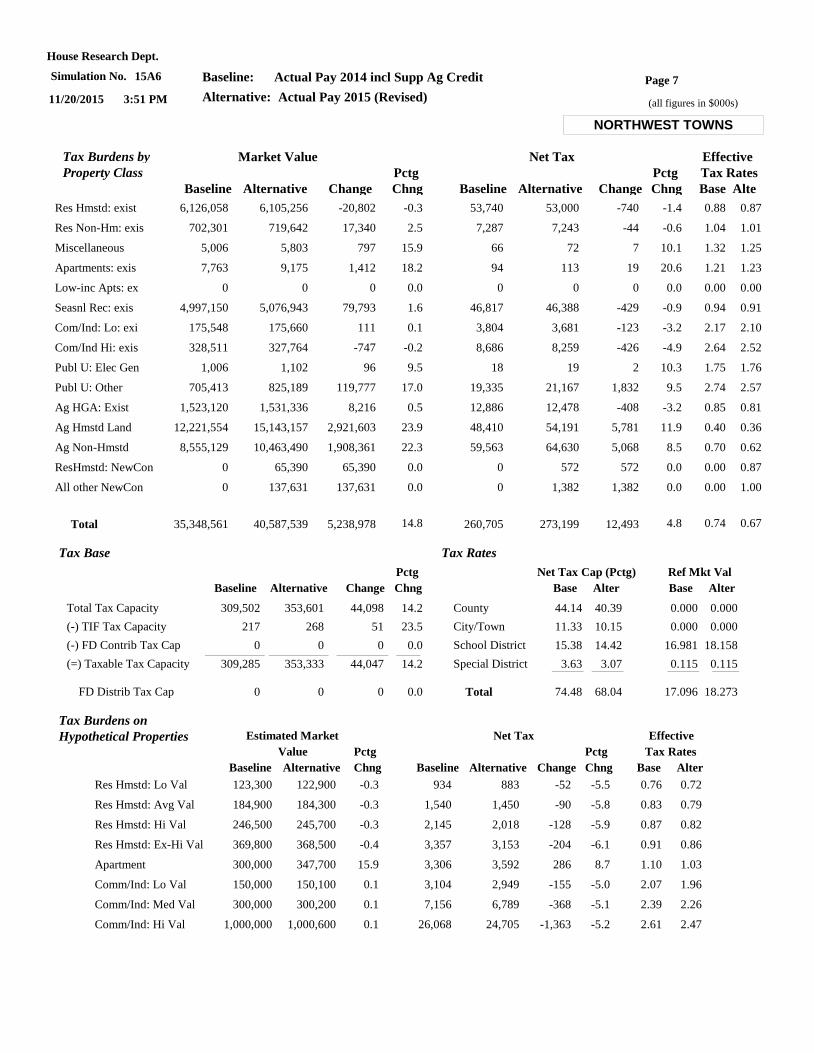
Page 7
(all figures in $000s)
House Research Dept.
11/20/2015 3:51 PM
Simulation No. 15A6 Baseline: Actual Pay 2014 incl Supp Ag Credit
Alternative: Actual Pay 2015 (Revised)
NORTHWEST TOWNS
Tax Base
Total Tax Capacity
(-) TIF Tax Capacity
(-) FD Contrib Tax Cap
(=) Taxable Tax Capacity
217
0
309,285
309,502
268
0
353,333
353,601
51
0
44,047
44,098
FD Distrib Tax Cap 0 0 0
14.2
23.5
0.0
14.2
0.0
Baseline Alternative Change Chng
Pctg
Tax Rates
County
City/Town
School District
Special District
44.14
11.33
15.38
3.63
Total 74.48
40.39
10.15
14.42
3.07
68.04
0.000
0.000
16.981
0.115
17.096
0.000
0.000
18.158
0.115
18.273
Base Alter Base Alter
Net Tax Cap (Pctg) Ref Mkt Val
Baseline Alternative Change Chng Base
Effective
Tax Rates
AlteChngBaseline Alternative Change
Market Value Net TaxTax Burdens by
Pctg PctgProperty Class
Res Hmstd: exist 6,126,058 6,105,256 -20,802 -0.3 53,740 53,000 -740 -1.4 0.88 0.87
Res Non-Hm: exis 702,301 719,642 17,340 2.5 7,287 7,243 -44 -0.6 1.04 1.01
Miscellaneous 5,006 5,803 797 15.9 66 72 7 10.1 1.32 1.25
Apartments: exis 7,763 9,175 1,412 18.2 94 113 19 20.6 1.21 1.23
Low-inc Apts: ex 0 0 0 0.0 0 0 0 0.0 0.00 0.00
Seasnl Rec: exis 4,997,150 5,076,943 79,793 1.6 46,817 46,388 -429 -0.9 0.94 0.91
Com/Ind: Lo: exi 175,548 175,660 111 0.1 3,804 3,681 -123 -3.2 2.17 2.10
Com/Ind Hi: exis 328,511 327,764 -747 -0.2 8,686 8,259 -426 -4.9 2.64 2.52
Publ U: Elec Gen 1,006 1,102 96 9.5 18 19 2 10.3 1.75 1.76
Publ U: Other 705,413 825,189 119,777 17.0 19,335 21,167 1,832 9.5 2.74 2.57
Ag HGA: Exist 1,523,120 1,531,336 8,216 0.5 12,886 12,478 -408 -3.2 0.85 0.81
Ag Hmstd Land 12,221,554 15,143,157 2,921,603 23.9 48,410 54,191 5,781 11.9 0.40 0.36
Ag Non-Hmstd 8,555,129 10,463,490 1,908,361 22.3 59,563 64,630 5,068 8.5 0.70 0.62
ResHmstd: NewCon 0 65,390 65,390 0.0 0 572 572 0.0 0.00 0.87
All other NewCon 0 137,631 137,631 0.0 0 1,382 1,382 0.0 0.00 1.00
Total 35,348,561 40,587,539 5,238,978 260,705 273,199 12,49314.8 4.8 0.74 0.67
Baseline Alternative Baseline Alternative
Tax Burdens on
Chng Chng
Pctg Pctg
Change Base Alter
Tax Rates
Effective
Value
Estimated Market Net TaxHypothetical Properties
Res Hmstd: Lo Val 123,300 122,900 934 883-0.3 -52 -5.5 0.76 0.72
Res Hmstd: Avg Val 184,900 184,300 1,540 1,450-0.3 -90 -5.8 0.83 0.79
Res Hmstd: Hi Val 246,500 245,700 2,145 2,018-0.3 -128 -5.9 0.87 0.82
Res Hmstd: Ex-Hi Val 369,800 368,500 3,357 3,153-0.4 -204 -6.1 0.91 0.86
Apartment 300,000 347,700 3,306 3,59215.9 286 8.7 1.10 1.03
Comm/Ind: Lo Val 150,000 150,100 3,104 2,9490.1 -155 -5.0 2.07 1.96
Comm/Ind: Med Val 300,000 300,200 7,156 6,7890.1 -368 -5.1 2.39 2.26
Comm/Ind: Hi Val 1,000,000 1,000,600 26,068 24,7050.1 -1,363 -5.2 2.61 2.47
Page 8
(all figures in $000s)
House Research Dept.
11/20/2015 3:51 PM
Simulation No. 15A6 Baseline: Actual Pay 2014 incl Supp Ag Credit
Alternative: Actual Pay 2015 (Revised)
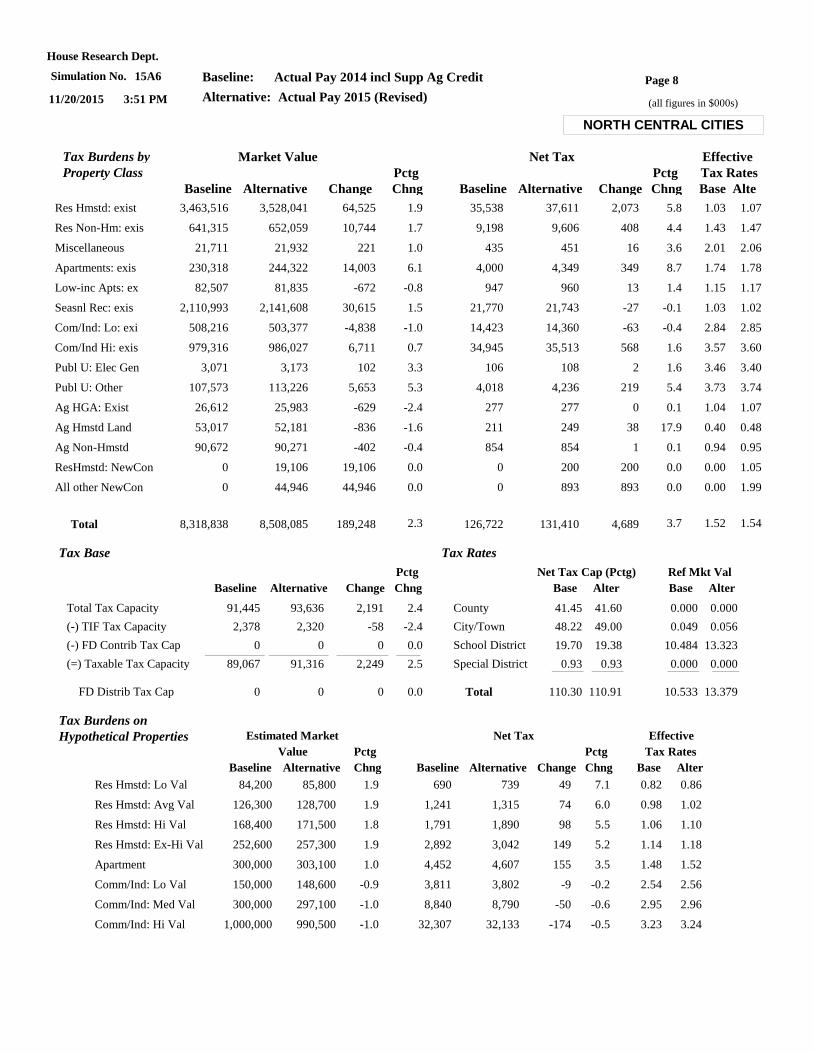
NORTH CENTRAL CITIES
Tax Base
Total Tax Capacity
(-) TIF Tax Capacity
(-) FD Contrib Tax Cap
(=) Taxable Tax Capacity
2,378
0
89,067
91,445
2,320
0
91,316
93,636
-58
0
2,249
2,191
FD Distrib Tax Cap 0 0 0
2.4
-2.4
0.0
2.5
0.0
Baseline Alternative Change Chng
Pctg
Tax Rates
County
City/Town
School District
Special District
41.45
48.22
19.70
0.93
Total 110.30
41.60
49.00
19.38
0.93
110.91
0.000
0.049
10.484
0.000
10.533
0.000
0.056
13.323
0.000
13.379
Base Alter Base Alter
Net Tax Cap (Pctg) Ref Mkt Val
Baseline Alternative Change Chng Base
Effective
Tax Rates
AlteChngBaseline Alternative Change
Market Value Net TaxTax Burdens by
Pctg PctgProperty Class
Res Hmstd: exist 3,463,516 3,528,041 64,525 1.9 35,538 37,611 2,073 5.8 1.03 1.07
Res Non-Hm: exis 641,315 652,059 10,744 1.7 9,198 9,606 408 4.4 1.43 1.47
Miscellaneous 21,711 21,932 221 1.0 435 451 16 3.6 2.01 2.06
Apartments: exis 230,318 244,322 14,003 6.1 4,000 4,349 349 8.7 1.74 1.78
Low-inc Apts: ex 82,507 81,835 -672 -0.8 947 960 13 1.4 1.15 1.17
Seasnl Rec: exis 2,110,993 2,141,608 30,615 1.5 21,770 21,743 -27 -0.1 1.03 1.02
Com/Ind: Lo: exi 508,216 503,377 -4,838 -1.0 14,423 14,360 -63 -0.4 2.84 2.85
Com/Ind Hi: exis 979,316 986,027 6,711 0.7 34,945 35,513 568 1.6 3.57 3.60
Publ U: Elec Gen 3,071 3,173 102 3.3 106 108 2 1.6 3.46 3.40
Publ U: Other 107,573 113,226 5,653 5.3 4,018 4,236 219 5.4 3.73 3.74
Ag HGA: Exist 26,612 25,983 -629 -2.4 277 277 0 0.1 1.04 1.07
Ag Hmstd Land 53,017 52,181 -836 -1.6 211 249 38 17.9 0.40 0.48
Ag Non-Hmstd 90,672 90,271 -402 -0.4 854 854 1 0.1 0.94 0.95
ResHmstd: NewCon 0 19,106 19,106 0.0 0 200 200 0.0 0.00 1.05
All other NewCon 0 44,946 44,946 0.0 0 893 893 0.0 0.00 1.99
Total 8,318,838 8,508,085 189,248 126,722 131,410 4,6892.3 3.7 1.52 1.54
Baseline Alternative Baseline Alternative
Tax Burdens on
Chng Chng
Pctg Pctg
Change Base Alter
Tax Rates
Effective
Value
Estimated Market Net TaxHypothetical Properties
Res Hmstd: Lo Val 84,200 85,800 690 7391.9 49 7.1 0.82 0.86
Res Hmstd: Avg Val 126,300 128,700 1,241 1,3151.9 74 6.0 0.98 1.02
Res Hmstd: Hi Val 168,400 171,500 1,791 1,8901.8 98 5.5 1.06 1.10
Res Hmstd: Ex-Hi Val 252,600 257,300 2,892 3,0421.9 149 5.2 1.14 1.18
Apartment 300,000 303,100 4,452 4,6071.0 155 3.5 1.48 1.52
Comm/Ind: Lo Val 150,000 148,600 3,811 3,802-0.9 -9 -0.2 2.54 2.56
Comm/Ind: Med Val 300,000 297,100 8,840 8,790-1.0 -50 -0.6 2.95 2.96
Comm/Ind: Hi Val 1,000,000 990,500 32,307 32,133-1.0 -174 -0.5 3.23 3.24
Page 9
(all figures in $000s)
House Research Dept.
11/20/2015 3:51 PM
Simulation No. 15A6 Baseline: Actual Pay 2014 incl Supp Ag Credit
Alternative: Actual Pay 2015 (Revised)
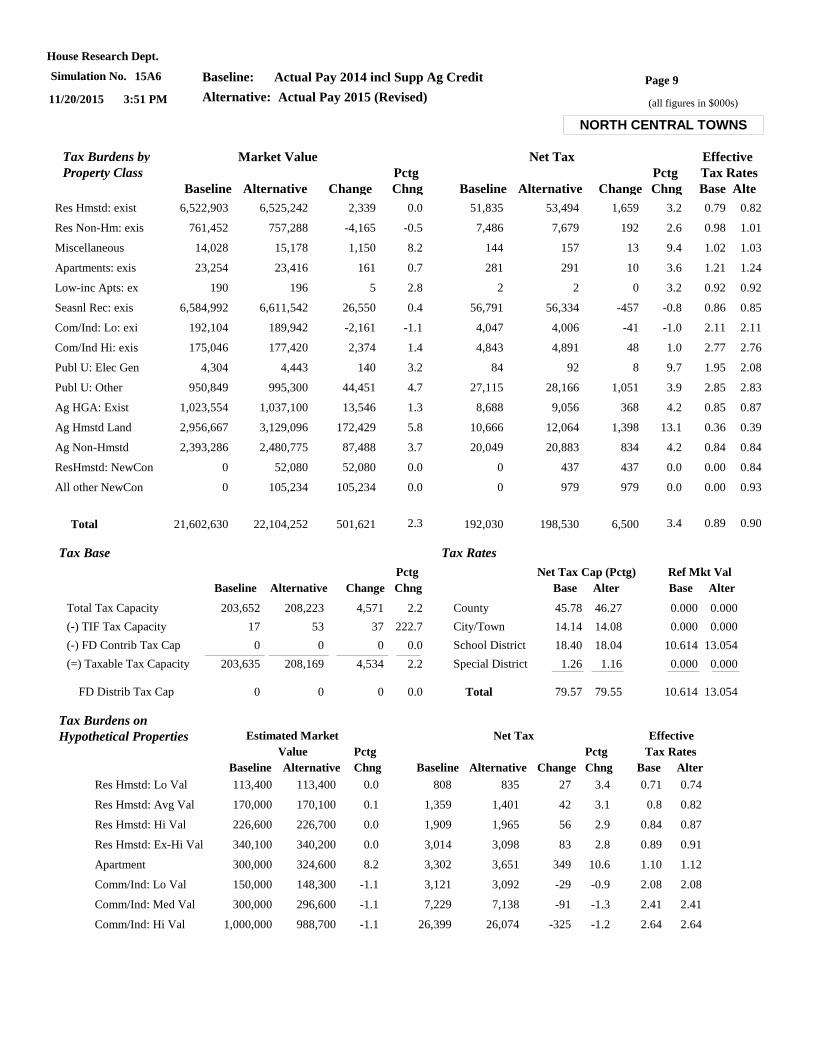
NORTH CENTRAL TOWNS
Tax Base
Total Tax Capacity
(-) TIF Tax Capacity
(-) FD Contrib Tax Cap
(=) Taxable Tax Capacity
17
0
203,635
203,652
53
0
208,169
208,223
37
0
4,534
4,571
FD Distrib Tax Cap 0 0 0
2.2
222.7
0.0
2.2
0.0
Baseline Alternative Change Chng
Pctg
Tax Rates
County
City/Town
School District
Special District
45.78
14.14
18.40
1.26
Total 79.57
46.27
14.08
18.04
1.16
79.55
0.000
0.000
10.614
0.000
10.614
0.000
0.000
13.054
0.000
13.054
Base Alter Base Alter
Net Tax Cap (Pctg) Ref Mkt Val
Baseline Alternative Change Chng Base
Effective
Tax Rates
AlteChngBaseline Alternative Change
Market Value Net TaxTax Burdens by
Pctg PctgProperty Class
Res Hmstd: exist 6,522,903 6,525,242 2,339 0.0 51,835 53,494 1,659 3.2 0.79 0.82
Res Non-Hm: exis 761,452 757,288 -4,165 -0.5 7,486 7,679 192 2.6 0.98 1.01
Miscellaneous 14,028 15,178 1,150 8.2 144 157 13 9.4 1.02 1.03
Apartments: exis 23,254 23,416 161 0.7 281 291 10 3.6 1.21 1.24
Low-inc Apts: ex 190 196 5 2.8 2 2 0 3.2 0.92 0.92
Seasnl Rec: exis 6,584,992 6,611,542 26,550 0.4 56,791 56,334 -457 -0.8 0.86 0.85
Com/Ind: Lo: exi 192,104 189,942 -2,161 -1.1 4,047 4,006 -41 -1.0 2.11 2.11
Com/Ind Hi: exis 175,046 177,420 2,374 1.4 4,843 4,891 48 1.0 2.77 2.76
Publ U: Elec Gen 4,304 4,443 140 3.2 84 92 8 9.7 1.95 2.08
Publ U: Other 950,849 995,300 44,451 4.7 27,115 28,166 1,051 3.9 2.85 2.83
Ag HGA: Exist 1,023,554 1,037,100 13,546 1.3 8,688 9,056 368 4.2 0.85 0.87
Ag Hmstd Land 2,956,667 3,129,096 172,429 5.8 10,666 12,064 1,398 13.1 0.36 0.39
Ag Non-Hmstd 2,393,286 2,480,775 87,488 3.7 20,049 20,883 834 4.2 0.84 0.84
ResHmstd: NewCon 0 52,080 52,080 0.0 0 437 437 0.0 0.00 0.84
All other NewCon 0 105,234 105,234 0.0 0 979 979 0.0 0.00 0.93
Total 21,602,630 22,104,252 501,621 192,030 198,530 6,5002.3 3.4 0.89 0.90
Baseline Alternative Baseline Alternative
Tax Burdens on
Chng Chng
Pctg Pctg
Change Base Alter
Tax Rates
Effective
Value
Estimated Market Net TaxHypothetical Properties
Res Hmstd: Lo Val 113,400 113,400 808 8350.0 27 3.4 0.71 0.74
Res Hmstd: Avg Val 170,000 170,100 1,359 1,4010.1 42 3.1 0.8 0.82
Res Hmstd: Hi Val 226,600 226,700 1,909 1,9650.0 56 2.9 0.84 0.87
Res Hmstd: Ex-Hi Val 340,100 340,200 3,014 3,0980.0 83 2.8 0.89 0.91
Apartment 300,000 324,600 3,302 3,6518.2 349 10.6 1.10 1.12
Comm/Ind: Lo Val 150,000 148,300 3,121 3,092-1.1 -29 -0.9 2.08 2.08
Comm/Ind: Med Val 300,000 296,600 7,229 7,138-1.1 -91 -1.3 2.41 2.41
Comm/Ind: Hi Val 1,000,000 988,700 26,399 26,074-1.1 -325 -1.2 2.64 2.64
Page 10
(all figures in $000s)
House Research Dept.
11/20/2015 3:51 PM
Simulation No. 15A6 Baseline: Actual Pay 2014 incl Supp Ag Credit
Alternative: Actual Pay 2015 (Revised)
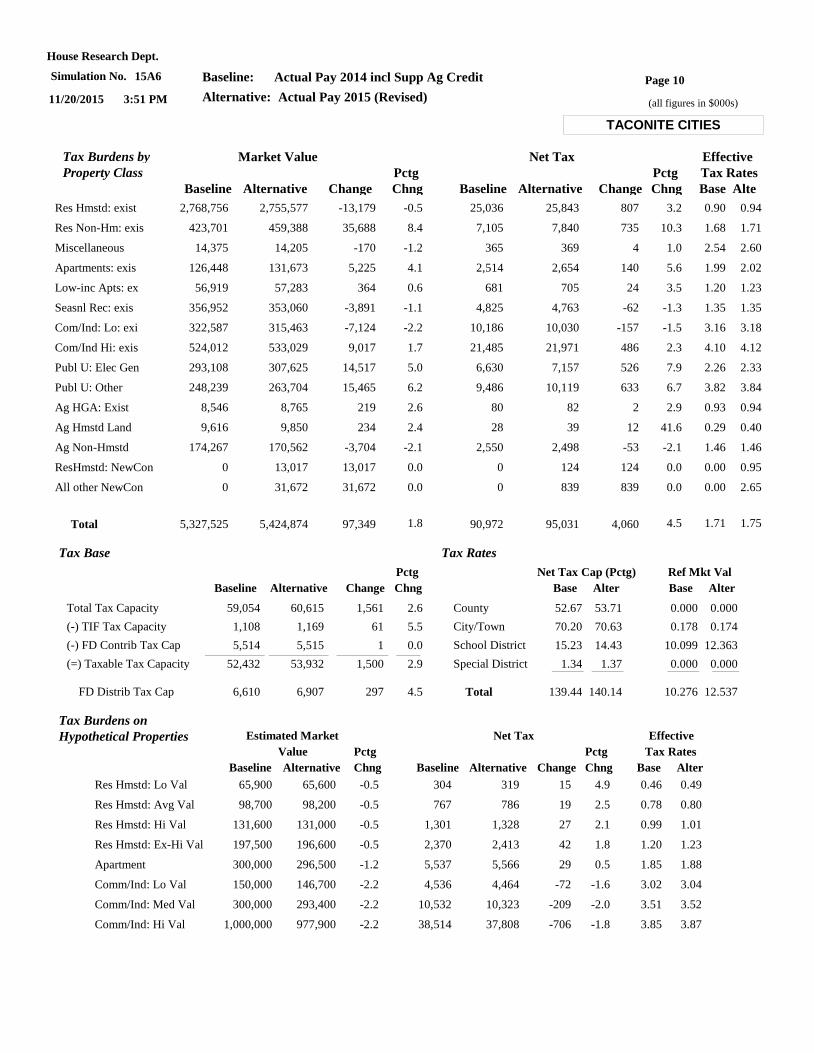
TACONITE CITIES
Tax Base
Total Tax Capacity
(-) TIF Tax Capacity
(-) FD Contrib Tax Cap
(=) Taxable Tax Capacity
1,108
5,514
52,432
59,054
1,169
5,515
53,932
60,615
61
1
1,500
1,561
FD Distrib Tax Cap 6,610 6,907 297
2.6
5.5
0.0
2.9
4.5
Baseline Alternative Change Chng
Pctg
Tax Rates
County
City/Town
School District
Special District
52.67
70.20
15.23
1.34
Total 139.44
53.71
70.63
14.43
1.37
140.14
0.000
0.178
10.099
0.000
10.276
0.000
0.174
12.363
0.000
12.537
Base Alter Base Alter
Net Tax Cap (Pctg) Ref Mkt Val
Baseline Alternative Change Chng Base
Effective
Tax Rates
AlteChngBaseline Alternative Change
Market Value Net TaxTax Burdens by
Pctg PctgProperty Class
Res Hmstd: exist 2,768,756 2,755,577 -13,179 -0.5 25,036 25,843 807 3.2 0.90 0.94
Res Non-Hm: exis 423,701 459,388 35,688 8.4 7,105 7,840 735 10.3 1.68 1.71
Miscellaneous 14,375 14,205 -170 -1.2 365 369 4 1.0 2.54 2.60
Apartments: exis 126,448 131,673 5,225 4.1 2,514 2,654 140 5.6 1.99 2.02
Low-inc Apts: ex 56,919 57,283 364 0.6 681 705 24 3.5 1.20 1.23
Seasnl Rec: exis 356,952 353,060 -3,891 -1.1 4,825 4,763 -62 -1.3 1.35 1.35
Com/Ind: Lo: exi 322,587 315,463 -7,124 -2.2 10,186 10,030 -157 -1.5 3.16 3.18
Com/Ind Hi: exis 524,012 533,029 9,017 1.7 21,485 21,971 486 2.3 4.10 4.12
Publ U: Elec Gen 293,108 307,625 14,517 5.0 6,630 7,157 526 7.9 2.26 2.33
Publ U: Other 248,239 263,704 15,465 6.2 9,486 10,119 633 6.7 3.82 3.84
Ag HGA: Exist 8,546 8,765 219 2.6 80 82 2 2.9 0.93 0.94
Ag Hmstd Land 9,616 9,850 234 2.4 28 39 12 41.6 0.29 0.40
Ag Non-Hmstd 174,267 170,562 -3,704 -2.1 2,550 2,498 -53 -2.1 1.46 1.46
ResHmstd: NewCon 0 13,017 13,017 0.0 0 124 124 0.0 0.00 0.95
All other NewCon 0 31,672 31,672 0.0 0 839 839 0.0 0.00 2.65
Total 5,327,525 5,424,874 97,349 90,972 95,031 4,0601.8 4.5 1.71 1.75
Baseline Alternative Baseline Alternative
Tax Burdens on
Chng Chng
Pctg Pctg
Change Base Alter
Tax Rates
Effective
Value
Estimated Market Net TaxHypothetical Properties
Res Hmstd: Lo Val 65,900 65,600 304 319-0.5 15 4.9 0.46 0.49
Res Hmstd: Avg Val 98,700 98,200 767 786-0.5 19 2.5 0.78 0.80
Res Hmstd: Hi Val 131,600 131,000 1,301 1,328-0.5 27 2.1 0.99 1.01
Res Hmstd: Ex-Hi Val 197,500 196,600 2,370 2,413-0.5 42 1.8 1.20 1.23
Apartment 300,000 296,500 5,537 5,566-1.2 29 0.5 1.85 1.88
Comm/Ind: Lo Val 150,000 146,700 4,536 4,464-2.2 -72 -1.6 3.02 3.04
Comm/Ind: Med Val 300,000 293,400 10,532 10,323-2.2 -209 -2.0 3.51 3.52
Comm/Ind: Hi Val 1,000,000 977,900 38,514 37,808-2.2 -706 -1.8 3.85 3.87
Page 11
(all figures in $000s)
House Research Dept.
11/20/2015 3:51 PM
Simulation No. 15A6 Baseline: Actual Pay 2014 incl Supp Ag Credit
Alternative: Actual Pay 2015 (Revised)
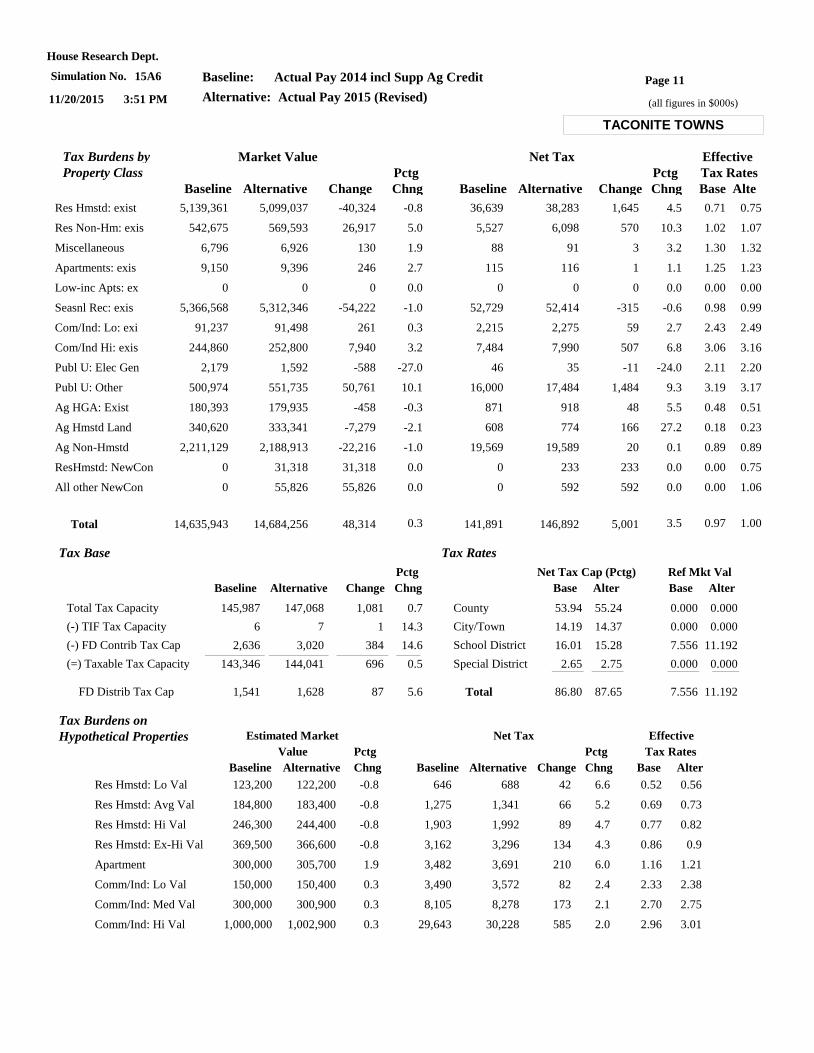
TACONITE TOWNS
Tax Base
Total Tax Capacity
(-) TIF Tax Capacity
(-) FD Contrib Tax Cap
(=) Taxable Tax Capacity
6
2,636
143,346
145,987
7
3,020
144,041
147,068
1
384
696
1,081
FD Distrib Tax Cap 1,541 1,628 87
0.7
14.3
14.6
0.5
5.6
Baseline Alternative Change Chng
Pctg
Tax Rates
County
City/Town
School District
Special District
53.94
14.19
16.01
2.65
Total 86.80
55.24
14.37
15.28
2.75
87.65
0.000
0.000
7.556
0.000
7.556
0.000
0.000
11.192
0.000
11.192
Base Alter Base Alter
Net Tax Cap (Pctg) Ref Mkt Val
Baseline Alternative Change Chng Base
Effective
Tax Rates
AlteChngBaseline Alternative Change
Market Value Net TaxTax Burdens by
Pctg PctgProperty Class
Res Hmstd: exist 5,139,361 5,099,037 -40,324 -0.8 36,639 38,283 1,645 4.5 0.71 0.75
Res Non-Hm: exis 542,675 569,593 26,917 5.0 5,527 6,098 570 10.3 1.02 1.07
Miscellaneous 6,796 6,926 130 1.9 88 91 3 3.2 1.30 1.32
Apartments: exis 9,150 9,396 246 2.7 115 116 1 1.1 1.25 1.23
Low-inc Apts: ex 0 0 0 0.0 0 0 0 0.0 0.00 0.00
Seasnl Rec: exis 5,366,568 5,312,346 -54,222 -1.0 52,729 52,414 -315 -0.6 0.98 0.99
Com/Ind: Lo: exi 91,237 91,498 261 0.3 2,215 2,275 59 2.7 2.43 2.49
Com/Ind Hi: exis 244,860 252,800 7,940 3.2 7,484 7,990 507 6.8 3.06 3.16
Publ U: Elec Gen 2,179 1,592 -588 -27.0 46 35 -11 -24.0 2.11 2.20
Publ U: Other 500,974 551,735 50,761 10.1 16,000 17,484 1,484 9.3 3.19 3.17
Ag HGA: Exist 180,393 179,935 -458 -0.3 871 918 48 5.5 0.48 0.51
Ag Hmstd Land 340,620 333,341 -7,279 -2.1 608 774 166 27.2 0.18 0.23
Ag Non-Hmstd 2,211,129 2,188,913 -22,216 -1.0 19,569 19,589 20 0.1 0.89 0.89
ResHmstd: NewCon 0 31,318 31,318 0.0 0 233 233 0.0 0.00 0.75
All other NewCon 0 55,826 55,826 0.0 0 592 592 0.0 0.00 1.06
Total 14,635,943 14,684,256 48,314 141,891 146,892 5,0010.3 3.5 0.97 1.00
Baseline Alternative Baseline Alternative
Tax Burdens on
Chng Chng
Pctg Pctg
Change Base Alter
Tax Rates
Effective
Value
Estimated Market Net TaxHypothetical Properties
Res Hmstd: Lo Val 123,200 122,200 646 688-0.8 42 6.6 0.52 0.56
Res Hmstd: Avg Val 184,800 183,400 1,275 1,341-0.8 66 5.2 0.69 0.73
Res Hmstd: Hi Val 246,300 244,400 1,903 1,992-0.8 89 4.7 0.77 0.82
Res Hmstd: Ex-Hi Val 369,500 366,600 3,162 3,296-0.8 134 4.3 0.86 0.9
Apartment 300,000 305,700 3,482 3,6911.9 210 6.0 1.16 1.21
Comm/Ind: Lo Val 150,000 150,400 3,490 3,5720.3 82 2.4 2.33 2.38
Comm/Ind: Med Val 300,000 300,900 8,105 8,2780.3 173 2.1 2.70 2.75
Comm/Ind: Hi Val 1,000,000 1,002,900 29,643 30,2280.3 585 2.0 2.96 3.01
Page 12
(all figures in $000s)
House Research Dept.
11/20/2015 3:51 PM
Simulation No. 15A6 Baseline: Actual Pay 2014 incl Supp Ag Credit
Alternative: Actual Pay 2015 (Revised)
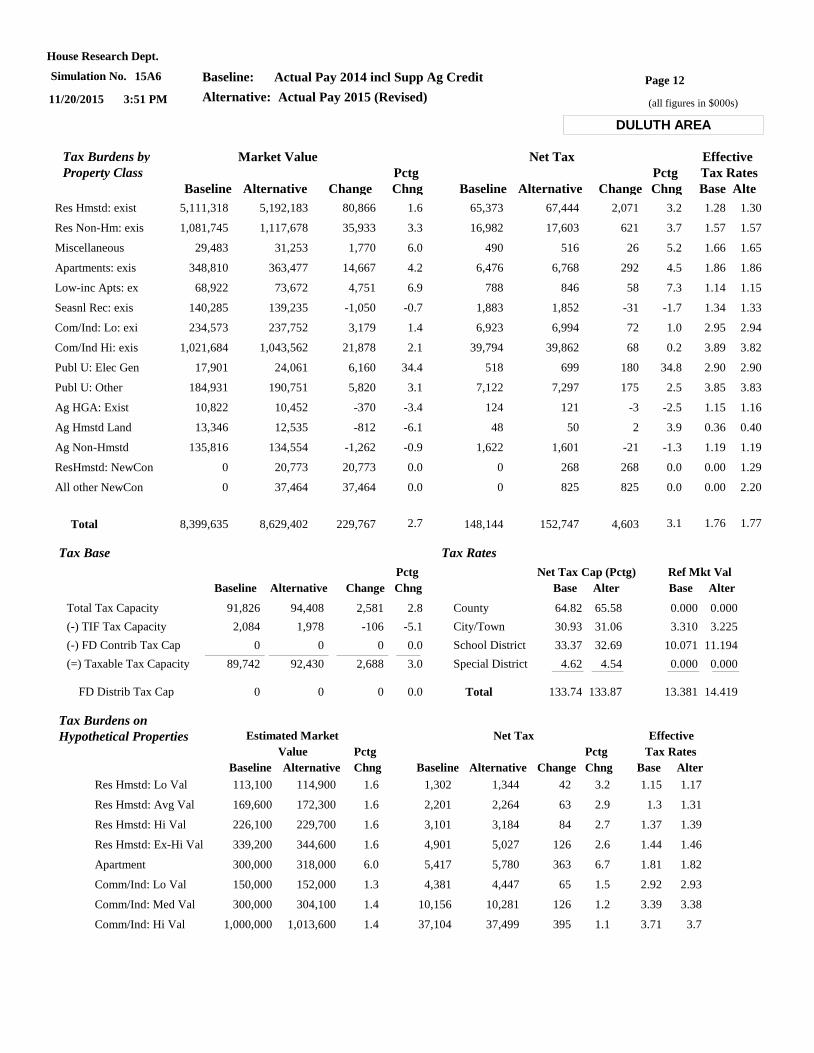
DULUTH AREA
Tax Base
Total Tax Capacity
(-) TIF Tax Capacity
(-) FD Contrib Tax Cap
(=) Taxable Tax Capacity
2,084
0
89,742
91,826
1,978
0
92,430
94,408
-106
0
2,688
2,581
FD Distrib Tax Cap 0 0 0
2.8
-5.1
0.0
3.0
0.0
Baseline Alternative Change Chng
Pctg
Tax Rates
County
City/Town
School District
Special District
64.82
30.93
33.37
4.62
Total 133.74
65.58
31.06
32.69
4.54
133.87
0.000
3.310
10.071
0.000
13.381
0.000
3.225
11.194
0.000
14.419
Base Alter Base Alter
Net Tax Cap (Pctg) Ref Mkt Val
Baseline Alternative Change Chng Base
Effective
Tax Rates
AlteChngBaseline Alternative Change
Market Value Net TaxTax Burdens by
Pctg PctgProperty Class
Res Hmstd: exist 5,111,318 5,192,183 80,866 1.6 65,373 67,444 2,071 3.2 1.28 1.30
Res Non-Hm: exis 1,081,745 1,117,678 35,933 3.3 16,982 17,603 621 3.7 1.57 1.57
Miscellaneous 29,483 31,253 1,770 6.0 490 516 26 5.2 1.66 1.65
Apartments: exis 348,810 363,477 14,667 4.2 6,476 6,768 292 4.5 1.86 1.86
Low-inc Apts: ex 68,922 73,672 4,751 6.9 788 846 58 7.3 1.14 1.15
Seasnl Rec: exis 140,285 139,235 -1,050 -0.7 1,883 1,852 -31 -1.7 1.34 1.33
Com/Ind: Lo: exi 234,573 237,752 3,179 1.4 6,923 6,994 72 1.0 2.95 2.94
Com/Ind Hi: exis 1,021,684 1,043,562 21,878 2.1 39,794 39,862 68 0.2 3.89 3.82
Publ U: Elec Gen 17,901 24,061 6,160 34.4 518 699 180 34.8 2.90 2.90
Publ U: Other 184,931 190,751 5,820 3.1 7,122 7,297 175 2.5 3.85 3.83
Ag HGA: Exist 10,822 10,452 -370 -3.4 124 121 -3 -2.5 1.15 1.16
Ag Hmstd Land 13,346 12,535 -812 -6.1 48 50 2 3.9 0.36 0.40
Ag Non-Hmstd 135,816 134,554 -1,262 -0.9 1,622 1,601 -21 -1.3 1.19 1.19
ResHmstd: NewCon 0 20,773 20,773 0.0 0 268 268 0.0 0.00 1.29
All other NewCon 0 37,464 37,464 0.0 0 825 825 0.0 0.00 2.20
Total 8,399,635 8,629,402 229,767 148,144 152,747 4,6032.7 3.1 1.76 1.77
Baseline Alternative Baseline Alternative
Tax Burdens on
Chng Chng
Pctg Pctg
Change Base Alter
Tax Rates
Effective
Value
Estimated Market Net TaxHypothetical Properties
Res Hmstd: Lo Val 113,100 114,900 1,302 1,3441.6 42 3.2 1.15 1.17
Res Hmstd: Avg Val 169,600 172,300 2,201 2,2641.6 63 2.9 1.3 1.31
Res Hmstd: Hi Val 226,100 229,700 3,101 3,1841.6 84 2.7 1.37 1.39
Res Hmstd: Ex-Hi Val 339,200 344,600 4,901 5,0271.6 126 2.6 1.44 1.46
Apartment 300,000 318,000 5,417 5,7806.0 363 6.7 1.81 1.82
Comm/Ind: Lo Val 150,000 152,000 4,381 4,4471.3 65 1.5 2.92 2.93
Comm/Ind: Med Val 300,000 304,100 10,156 10,2811.4 126 1.2 3.39 3.38
Comm/Ind: Hi Val 1,000,000 1,013,600 37,104 37,4991.4 395 1.1 3.71 3.7
Page 13
(all figures in $000s)
House Research Dept.
11/20/2015 3:51 PM
Simulation No. 15A6 Baseline: Actual Pay 2014 incl Supp Ag Credit
Alternative: Actual Pay 2015 (Revised)
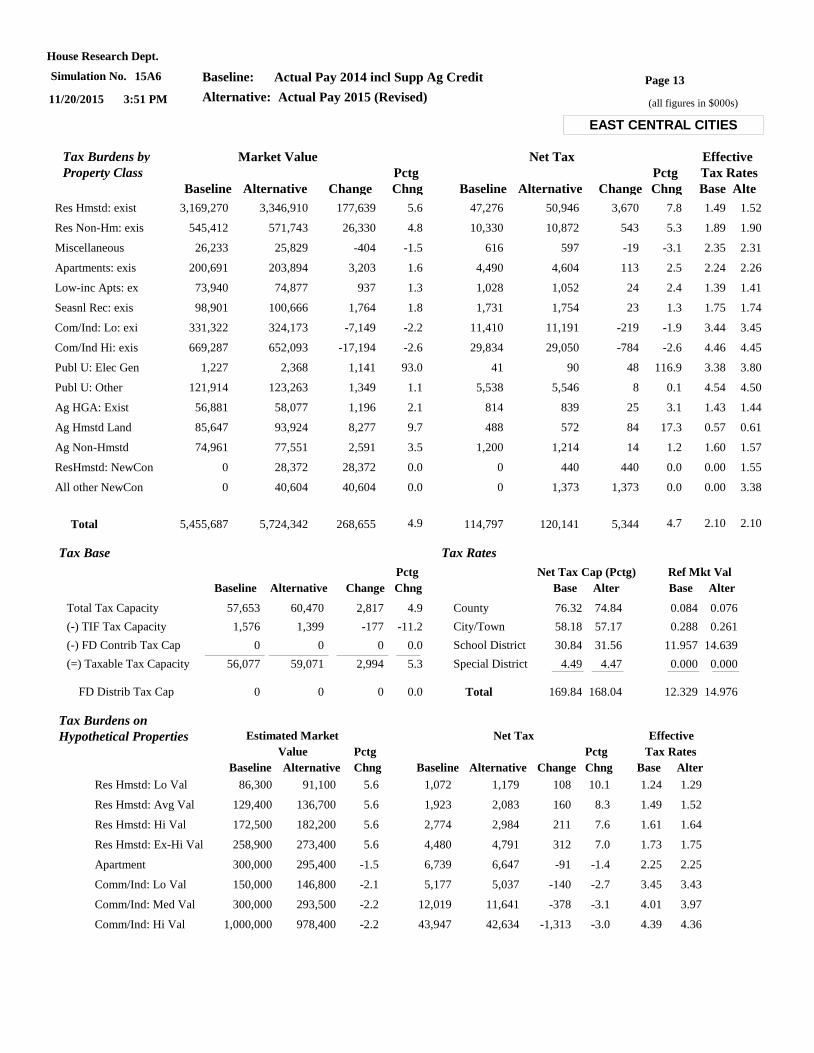
EAST CENTRAL CITIES
Tax Base
Total Tax Capacity
(-) TIF Tax Capacity
(-) FD Contrib Tax Cap
(=) Taxable Tax Capacity
1,576
0
56,077
57,653
1,399
0
59,071
60,470
-177
0
2,994
2,817
FD Distrib Tax Cap 0 0 0
4.9
-11.2
0.0
5.3
0.0
Baseline Alternative Change Chng
Pctg
Tax Rates
County
City/Town
School District
Special District
76.32
58.18
30.84
4.49
Total 169.84
74.84
57.17
31.56
4.47
168.04
0.084
0.288
11.957
0.000
12.329
0.076
0.261
14.639
0.000
14.976
Base Alter Base Alter
Net Tax Cap (Pctg) Ref Mkt Val
Baseline Alternative Change Chng Base
Effective
Tax Rates
AlteChngBaseline Alternative Change
Market Value Net TaxTax Burdens by
Pctg PctgProperty Class
Res Hmstd: exist 3,169,270 3,346,910 177,639 5.6 47,276 50,946 3,670 7.8 1.49 1.52
Res Non-Hm: exis 545,412 571,743 26,330 4.8 10,330 10,872 543 5.3 1.89 1.90
Miscellaneous 26,233 25,829 -404 -1.5 616 597 -19 -3.1 2.35 2.31
Apartments: exis 200,691 203,894 3,203 1.6 4,490 4,604 113 2.5 2.24 2.26
Low-inc Apts: ex 73,940 74,877 937 1.3 1,028 1,052 24 2.4 1.39 1.41
Seasnl Rec: exis 98,901 100,666 1,764 1.8 1,731 1,754 23 1.3 1.75 1.74
Com/Ind: Lo: exi 331,322 324,173 -7,149 -2.2 11,410 11,191 -219 -1.9 3.44 3.45
Com/Ind Hi: exis 669,287 652,093 -17,194 -2.6 29,834 29,050 -784 -2.6 4.46 4.45
Publ U: Elec Gen 1,227 2,368 1,141 93.0 41 90 48 116.9 3.38 3.80
Publ U: Other 121,914 123,263 1,349 1.1 5,538 5,546 8 0.1 4.54 4.50
Ag HGA: Exist 56,881 58,077 1,196 2.1 814 839 25 3.1 1.43 1.44
Ag Hmstd Land 85,647 93,924 8,277 9.7 488 572 84 17.3 0.57 0.61
Ag Non-Hmstd 74,961 77,551 2,591 3.5 1,200 1,214 14 1.2 1.60 1.57
ResHmstd: NewCon 0 28,372 28,372 0.0 0 440 440 0.0 0.00 1.55
All other NewCon 0 40,604 40,604 0.0 0 1,373 1,373 0.0 0.00 3.38
Total 5,455,687 5,724,342 268,655 114,797 120,141 5,3444.9 4.7 2.10 2.10
Baseline Alternative Baseline Alternative
Tax Burdens on
Chng Chng
Pctg Pctg
Change Base Alter
Tax Rates
Effective
Value
Estimated Market Net TaxHypothetical Properties
Res Hmstd: Lo Val 86,300 91,100 1,072 1,1795.6 108 10.1 1.24 1.29
Res Hmstd: Avg Val 129,400 136,700 1,923 2,0835.6 160 8.3 1.49 1.52
Res Hmstd: Hi Val 172,500 182,200 2,774 2,9845.6 211 7.6 1.61 1.64
Res Hmstd: Ex-Hi Val 258,900 273,400 4,480 4,7915.6 312 7.0 1.73 1.75
Apartment 300,000 295,400 6,739 6,647-1.5 -91 -1.4 2.25 2.25
Comm/Ind: Lo Val 150,000 146,800 5,177 5,037-2.1 -140 -2.7 3.45 3.43
Comm/Ind: Med Val 300,000 293,500 12,019 11,641-2.2 -378 -3.1 4.01 3.97
Comm/Ind: Hi Val 1,000,000 978,400 43,947 42,634-2.2 -1,313 -3.0 4.39 4.36
Page 14
(all figures in $000s)
House Research Dept.
11/20/2015 3:51 PM
Simulation No. 15A6 Baseline: Actual Pay 2014 incl Supp Ag Credit
Alternative: Actual Pay 2015 (Revised)
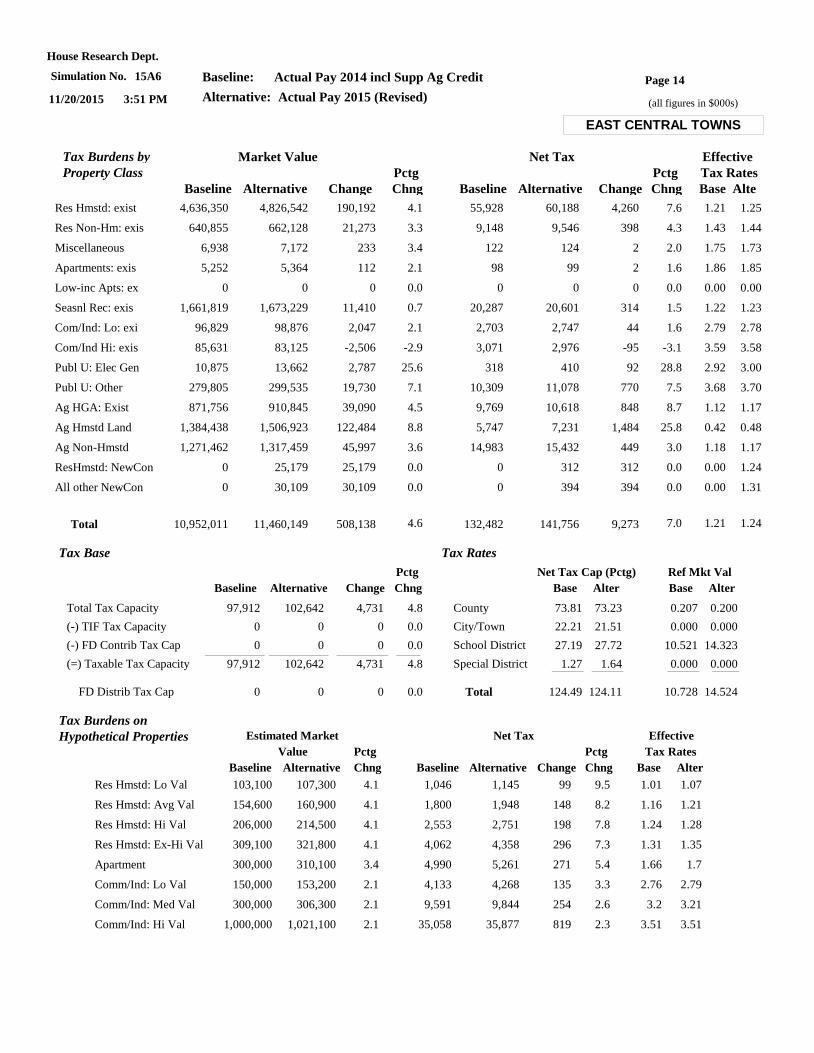
EAST CENTRAL TOWNS
Tax Base
Total Tax Capacity
(-) TIF Tax Capacity
(-) FD Contrib Tax Cap
(=) Taxable Tax Capacity
0
0
97,912
97,912
0
0
102,642
102,642
0
0
4,731
4,731
FD Distrib Tax Cap 0 0 0
4.8
0.0
0.0
4.8
0.0
Baseline Alternative Change Chng
Pctg
Tax Rates
County
City/Town
School District
Special District
73.81
22.21
27.19
1.27
Total 124.49
73.23
21.51
27.72
1.64
124.11
0.207
0.000
10.521
0.000
10.728
0.200
0.000
14.323
0.000
14.524
Base Alter Base Alter
Net Tax Cap (Pctg) Ref Mkt Val
Baseline Alternative Change Chng Base
Effective
Tax Rates
AlteChngBaseline Alternative Change
Market Value Net TaxTax Burdens by
Pctg PctgProperty Class
Res Hmstd: exist 4,636,350 4,826,542 190,192 4.1 55,928 60,188 4,260 7.6 1.21 1.25
Res Non-Hm: exis 640,855 662,128 21,273 3.3 9,148 9,546 398 4.3 1.43 1.44
Miscellaneous 6,938 7,172 233 3.4 122 124 2 2.0 1.75 1.73
Apartments: exis 5,252 5,364 112 2.1 98 99 2 1.6 1.86 1.85
Low-inc Apts: ex 0 0 0 0.0 0 0 0 0.0 0.00 0.00
Seasnl Rec: exis 1,661,819 1,673,229 11,410 0.7 20,287 20,601 314 1.5 1.22 1.23
Com/Ind: Lo: exi 96,829 98,876 2,047 2.1 2,703 2,747 44 1.6 2.79 2.78
Com/Ind Hi: exis 85,631 83,125 -2,506 -2.9 3,071 2,976 -95 -3.1 3.59 3.58
Publ U: Elec Gen 10,875 13,662 2,787 25.6 318 410 92 28.8 2.92 3.00
Publ U: Other 279,805 299,535 19,730 7.1 10,309 11,078 770 7.5 3.68 3.70
Ag HGA: Exist 871,756 910,845 39,090 4.5 9,769 10,618 848 8.7 1.12 1.17
Ag Hmstd Land 1,384,438 1,506,923 122,484 8.8 5,747 7,231 1,484 25.8 0.42 0.48
Ag Non-Hmstd 1,271,462 1,317,459 45,997 3.6 14,983 15,432 449 3.0 1.18 1.17
ResHmstd: NewCon 0 25,179 25,179 0.0 0 312 312 0.0 0.00 1.24
All other NewCon 0 30,109 30,109 0.0 0 394 394 0.0 0.00 1.31
Total 10,952,011 11,460,149 508,138 132,482 141,756 9,2734.6 7.0 1.21 1.24
Baseline Alternative Baseline Alternative
Tax Burdens on
Chng Chng
Pctg Pctg
Change Base Alter
Tax Rates
Effective
Value
Estimated Market Net TaxHypothetical Properties
Res Hmstd: Lo Val 103,100 107,300 1,046 1,1454.1 99 9.5 1.01 1.07
Res Hmstd: Avg Val 154,600 160,900 1,800 1,9484.1 148 8.2 1.16 1.21
Res Hmstd: Hi Val 206,000 214,500 2,553 2,7514.1 198 7.8 1.24 1.28
Res Hmstd: Ex-Hi Val 309,100 321,800 4,062 4,3584.1 296 7.3 1.31 1.35
Apartment 300,000 310,100 4,990 5,2613.4 271 5.4 1.66 1.7
Comm/Ind: Lo Val 150,000 153,200 4,133 4,2682.1 135 3.3 2.76 2.79
Comm/Ind: Med Val 300,000 306,300 9,591 9,8442.1 254 2.6 3.2 3.21
Comm/Ind: Hi Val 1,000,000 1,021,100 35,058 35,8772.1 819 2.3 3.51 3.51
Page 15
(all figures in $000s)
House Research Dept.
11/20/2015 3:51 PM
Simulation No. 15A6 Baseline: Actual Pay 2014 incl Supp Ag Credit
Alternative: Actual Pay 2015 (Revised)
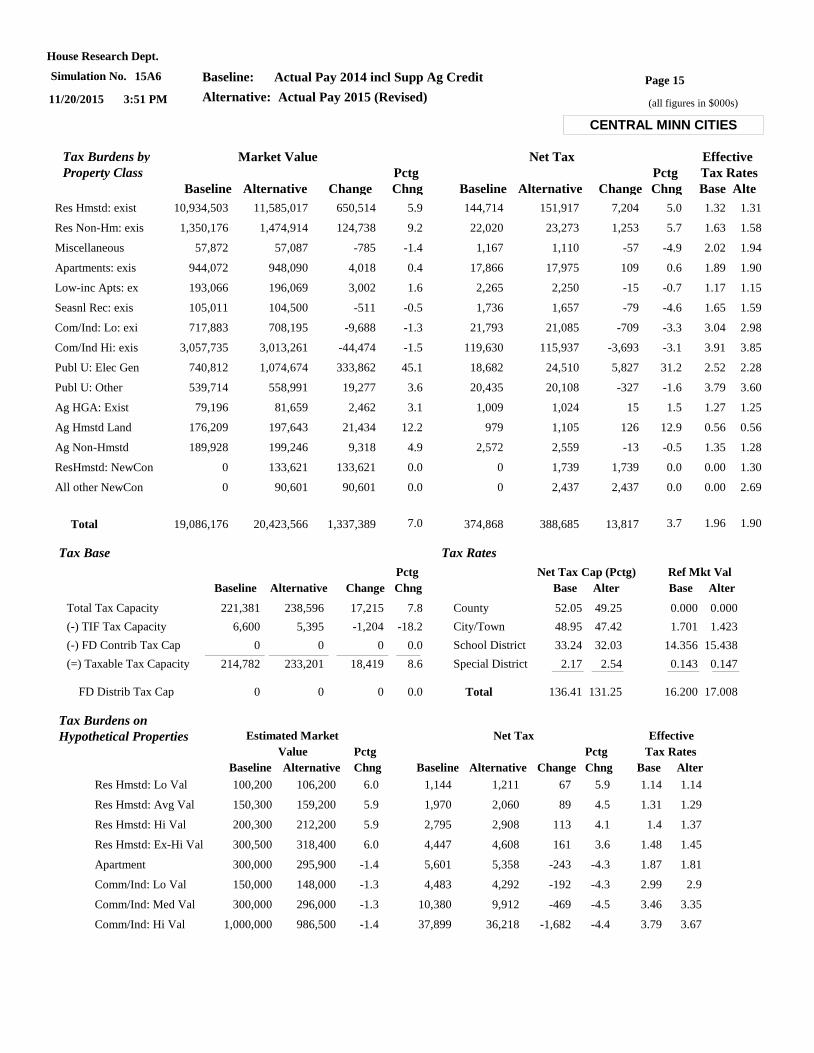
CENTRAL MINN CITIES
Tax Base
Total Tax Capacity
(-) TIF Tax Capacity
(-) FD Contrib Tax Cap
(=) Taxable Tax Capacity
6,600
0
214,782
221,381
5,395
0
233,201
238,596
-1,204
0
18,419
17,215
FD Distrib Tax Cap 0 0 0
7.8
-18.2
0.0
8.6
0.0
Baseline Alternative Change Chng
Pctg
Tax Rates
County
City/Town
School District
Special District
52.05
48.95
33.24
2.17
Total 136.41
49.25
47.42
32.03
2.54
131.25
0.000
1.701
14.356
0.143
16.200
0.000
1.423
15.438
0.147
17.008
Base Alter Base Alter
Net Tax Cap (Pctg) Ref Mkt Val
Baseline Alternative Change Chng Base
Effective
Tax Rates
AlteChngBaseline Alternative Change
Market Value Net TaxTax Burdens by
Pctg PctgProperty Class
Res Hmstd: exist 10,934,503 11,585,017 650,514 5.9 144,714 151,917 7,204 5.0 1.32 1.31
Res Non-Hm: exis 1,350,176 1,474,914 124,738 9.2 22,020 23,273 1,253 5.7 1.63 1.58
Miscellaneous 57,872 57,087 -785 -1.4 1,167 1,110 -57 -4.9 2.02 1.94
Apartments: exis 944,072 948,090 4,018 0.4 17,866 17,975 109 0.6 1.89 1.90
Low-inc Apts: ex 193,066 196,069 3,002 1.6 2,265 2,250 -15 -0.7 1.17 1.15
Seasnl Rec: exis 105,011 104,500 -511 -0.5 1,736 1,657 -79 -4.6 1.65 1.59
Com/Ind: Lo: exi 717,883 708,195 -9,688 -1.3 21,793 21,085 -709 -3.3 3.04 2.98
Com/Ind Hi: exis 3,057,735 3,013,261 -44,474 -1.5 119,630 115,937 -3,693 -3.1 3.91 3.85
Publ U: Elec Gen 740,812 1,074,674 333,862 45.1 18,682 24,510 5,827 31.2 2.52 2.28
Publ U: Other 539,714 558,991 19,277 3.6 20,435 20,108 -327 -1.6 3.79 3.60
Ag HGA: Exist 79,196 81,659 2,462 3.1 1,009 1,024 15 1.5 1.27 1.25
Ag Hmstd Land 176,209 197,643 21,434 12.2 979 1,105 126 12.9 0.56 0.56
Ag Non-Hmstd 189,928 199,246 9,318 4.9 2,572 2,559 -13 -0.5 1.35 1.28
ResHmstd: NewCon 0 133,621 133,621 0.0 0 1,739 1,739 0.0 0.00 1.30
All other NewCon 0 90,601 90,601 0.0 0 2,437 2,437 0.0 0.00 2.69
Total 19,086,176 20,423,566 1,337,389 374,868 388,685 13,8177.0 3.7 1.96 1.90
Baseline Alternative Baseline Alternative
Tax Burdens on
Chng Chng
Pctg Pctg
Change Base Alter
Tax Rates
Effective
Value
Estimated Market Net TaxHypothetical Properties
Res Hmstd: Lo Val 100,200 106,200 1,144 1,2116.0 67 5.9 1.14 1.14
Res Hmstd: Avg Val 150,300 159,200 1,970 2,0605.9 89 4.5 1.31 1.29
Res Hmstd: Hi Val 200,300 212,200 2,795 2,9085.9 113 4.1 1.4 1.37
Res Hmstd: Ex-Hi Val 300,500 318,400 4,447 4,6086.0 161 3.6 1.48 1.45
Apartment 300,000 295,900 5,601 5,358-1.4 -243 -4.3 1.87 1.81
Comm/Ind: Lo Val 150,000 148,000 4,483 4,292-1.3 -192 -4.3 2.99 2.9
Comm/Ind: Med Val 300,000 296,000 10,380 9,912-1.3 -469 -4.5 3.46 3.35
Comm/Ind: Hi Val 1,000,000 986,500 37,899 36,218-1.4 -1,682 -4.4 3.79 3.67
Page 16
(all figures in $000s)
House Research Dept.
11/20/2015 3:51 PM
Simulation No. 15A6 Baseline: Actual Pay 2014 incl Supp Ag Credit
Alternative: Actual Pay 2015 (Revised)
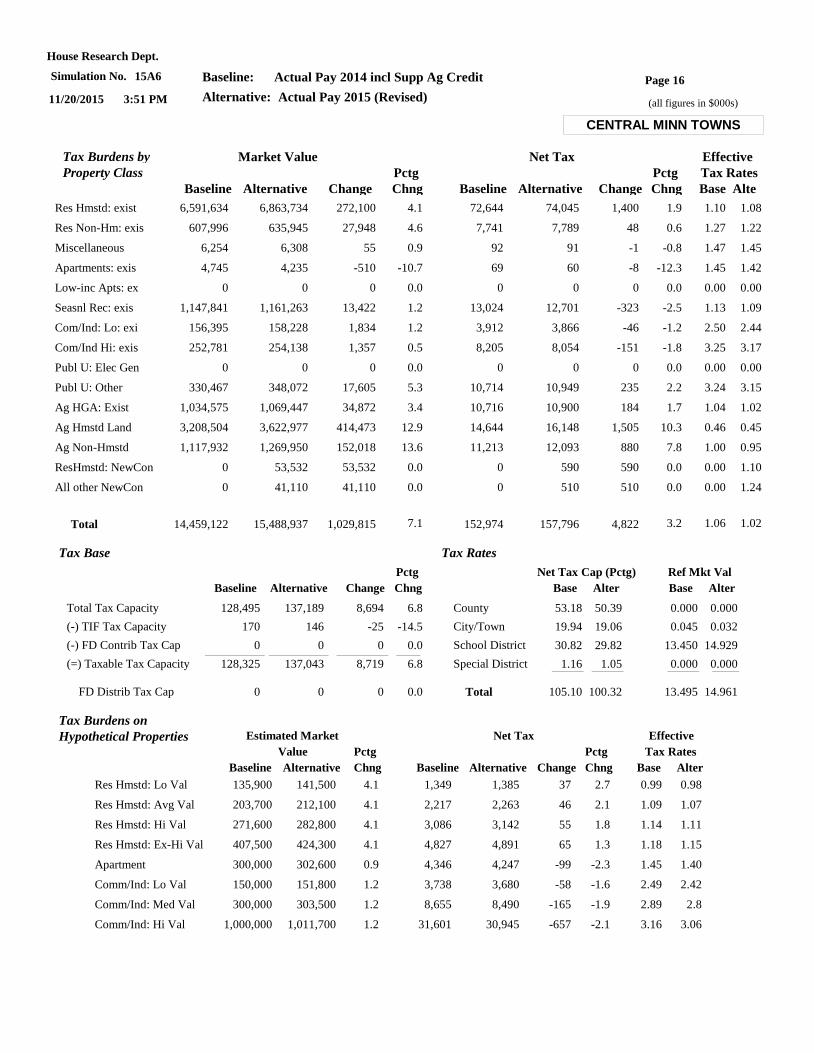
CENTRAL MINN TOWNS
Tax Base
Total Tax Capacity
(-) TIF Tax Capacity
(-) FD Contrib Tax Cap
(=) Taxable Tax Capacity
170
0
128,325
128,495
146
0
137,043
137,189
-25
0
8,719
8,694
FD Distrib Tax Cap 0 0 0
6.8
-14.5
0.0
6.8
0.0
Baseline Alternative Change Chng
Pctg
Tax Rates
County
City/Town
School District
Special District
53.18
19.94
30.82
1.16
Total 105.10
50.39
19.06
29.82
1.05
100.32
0.000
0.045
13.450
0.000
13.495
0.000
0.032
14.929
0.000
14.961
Base Alter Base Alter
Net Tax Cap (Pctg) Ref Mkt Val
Baseline Alternative Change Chng Base
Effective
Tax Rates
AlteChngBaseline Alternative Change
Market Value Net TaxTax Burdens by
Pctg PctgProperty Class
Res Hmstd: exist 6,591,634 6,863,734 272,100 4.1 72,644 74,045 1,400 1.9 1.10 1.08
Res Non-Hm: exis 607,996 635,945 27,948 4.6 7,741 7,789 48 0.6 1.27 1.22
Miscellaneous 6,254 6,308 55 0.9 92 91 -1 -0.8 1.47 1.45
Apartments: exis 4,745 4,235 -510 -10.7 69 60 -8 -12.3 1.45 1.42
Low-inc Apts: ex 0 0 0 0.0 0 0 0 0.0 0.00 0.00
Seasnl Rec: exis 1,147,841 1,161,263 13,422 1.2 13,024 12,701 -323 -2.5 1.13 1.09
Com/Ind: Lo: exi 156,395 158,228 1,834 1.2 3,912 3,866 -46 -1.2 2.50 2.44
Com/Ind Hi: exis 252,781 254,138 1,357 0.5 8,205 8,054 -151 -1.8 3.25 3.17
Publ U: Elec Gen 0 0 0 0.0 0 0 0 0.0 0.00 0.00
Publ U: Other 330,467 348,072 17,605 5.3 10,714 10,949 235 2.2 3.24 3.15
Ag HGA: Exist 1,034,575 1,069,447 34,872 3.4 10,716 10,900 184 1.7 1.04 1.02
Ag Hmstd Land 3,208,504 3,622,977 414,473 12.9 14,644 16,148 1,505 10.3 0.46 0.45
Ag Non-Hmstd 1,117,932 1,269,950 152,018 13.6 11,213 12,093 880 7.8 1.00 0.95
ResHmstd: NewCon 0 53,532 53,532 0.0 0 590 590 0.0 0.00 1.10
All other NewCon 0 41,110 41,110 0.0 0 510 510 0.0 0.00 1.24
Total 14,459,122 15,488,937 1,029,815 152,974 157,796 4,8227.1 3.2 1.06 1.02
Baseline Alternative Baseline Alternative
Tax Burdens on
Chng Chng
Pctg Pctg
Change Base Alter
Tax Rates
Effective
Value
Estimated Market Net TaxHypothetical Properties
Res Hmstd: Lo Val 135,900 141,500 1,349 1,3854.1 37 2.7 0.99 0.98
Res Hmstd: Avg Val 203,700 212,100 2,217 2,2634.1 46 2.1 1.09 1.07
Res Hmstd: Hi Val 271,600 282,800 3,086 3,1424.1 55 1.8 1.14 1.11
Res Hmstd: Ex-Hi Val 407,500 424,300 4,827 4,8914.1 65 1.3 1.18 1.15
Apartment 300,000 302,600 4,346 4,2470.9 -99 -2.3 1.45 1.40
Comm/Ind: Lo Val 150,000 151,800 3,738 3,6801.2 -58 -1.6 2.49 2.42
Comm/Ind: Med Val 300,000 303,500 8,655 8,4901.2 -165 -1.9 2.89 2.8
Comm/Ind: Hi Val 1,000,000 1,011,700 31,601 30,9451.2 -657 -2.1 3.16 3.06

Page 17
(all figures in $000s)
House Research Dept.
11/20/2015 3:51 PM
Simulation No. 15A6 Baseline: Actual Pay 2014 incl Supp Ag Credit
Alternative: Actual Pay 2015 (Revised)
SOUTHWEST CITIES
Tax Base
Total Tax Capacity
(-) TIF Tax Capacity
(-) FD Contrib Tax Cap
(=) Taxable Tax Capacity
2,117
0
88,877
90,994
2,360
0
92,327
94,686
242
0
3,450
3,692
FD Distrib Tax Cap 0 0 0
4.1
11.4
0.0
3.9
0.0
Baseline Alternative Change Chng
Pctg
Tax Rates
County
City/Town
School District
Special District
38.80
76.65
13.59
1.48
Total 130.52
37.24
76.58
13.05
1.40
128.26
0.172
0.352
21.212
0.000
21.736
0.162
0.342
19.871
0.000
20.375
Base Alter Base Alter
Net Tax Cap (Pctg) Ref Mkt Val
Baseline Alternative Change Chng Base
Effective
Tax Rates
AlteChngBaseline Alternative Change
Market Value Net TaxTax Burdens by
Pctg PctgProperty Class
Res Hmstd: exist 5,073,247 5,151,577 78,329 1.5 61,742 61,511 -230 -0.4 1.22 1.19
Res Non-Hm: exis 713,641 737,517 23,876 3.3 11,430 11,531 101 0.9 1.60 1.56
Miscellaneous 22,508 24,163 1,655 7.4 452 471 19 4.1 2.01 1.95
Apartments: exis 321,692 324,443 2,751 0.9 5,829 5,795 -35 -0.6 1.81 1.79
Low-inc Apts: ex 92,694 96,094 3,400 3.7 1,052 1,057 4 0.4 1.14 1.10
Seasnl Rec: exis 38,104 41,619 3,515 9.2 639 676 37 5.8 1.68 1.62
Com/Ind: Lo: exi 632,754 623,303 -9,451 -1.5 18,877 18,226 -651 -3.4 2.98 2.92
Com/Ind Hi: exis 1,372,233 1,393,571 21,338 1.6 47,457 47,585 128 0.3 3.46 3.41
Publ U: Elec Gen 4,506 5,018 511 11.3 150 160 10 7.0 3.32 3.19
Publ U: Other 120,188 133,999 13,811 11.5 4,959 5,424 465 9.4 4.13 4.05
Ag HGA: Exist 20,670 21,358 688 3.3 258 262 3 1.2 1.25 1.22
Ag Hmstd Land 157,726 173,808 16,082 10.2 1,094 1,314 220 20.1 0.69 0.76
Ag Non-Hmstd 138,358 149,100 10,742 7.8 1,802 1,913 110 6.1 1.30 1.28
ResHmstd: NewCon 0 25,643 25,643 0.0 0 302 302 0.0 0.00 1.18
All other NewCon 0 75,920 75,920 0.0 0 2,190 2,190 0.0 0.00 2.89
Total 8,708,320 8,977,132 268,812 155,742 158,416 2,6743.1 1.7 1.79 1.76
Baseline Alternative Baseline Alternative
Tax Burdens on
Chng Chng
Pctg Pctg
Change Base Alter
Tax Rates
Effective
Value
Estimated Market Net TaxHypothetical Properties
Res Hmstd: Lo Val 63,700 64,700 637 6301.6 -8 -1.2 1.00 0.97
Res Hmstd: Avg Val 95,500 97,000 1,080 1,0761.6 -4 -0.4 1.13 1.11
Res Hmstd: Hi Val 127,200 129,200 1,600 1,5921.6 -8 -0.5 1.26 1.23
Res Hmstd: Ex-Hi Val 190,900 193,800 2,645 2,6271.5 -18 -0.7 1.39 1.36
Apartment 300,000 322,100 5,547 5,8207.4 274 4.9 1.85 1.81
Comm/Ind: Lo Val 150,000 147,800 4,434 4,269-1.5 -165 -3.7 2.96 2.89
Comm/Ind: Med Val 300,000 295,500 10,237 9,838-1.5 -399 -3.9 3.41 3.33
Comm/Ind: Hi Val 1,000,000 985,100 37,319 35,930-1.5 -1,389 -3.7 3.73 3.65
Page 18
(all figures in $000s)
House Research Dept.
11/20/2015 3:51 PM
Simulation No. 15A6 Baseline: Actual Pay 2014 incl Supp Ag Credit
Alternative: Actual Pay 2015 (Revised)
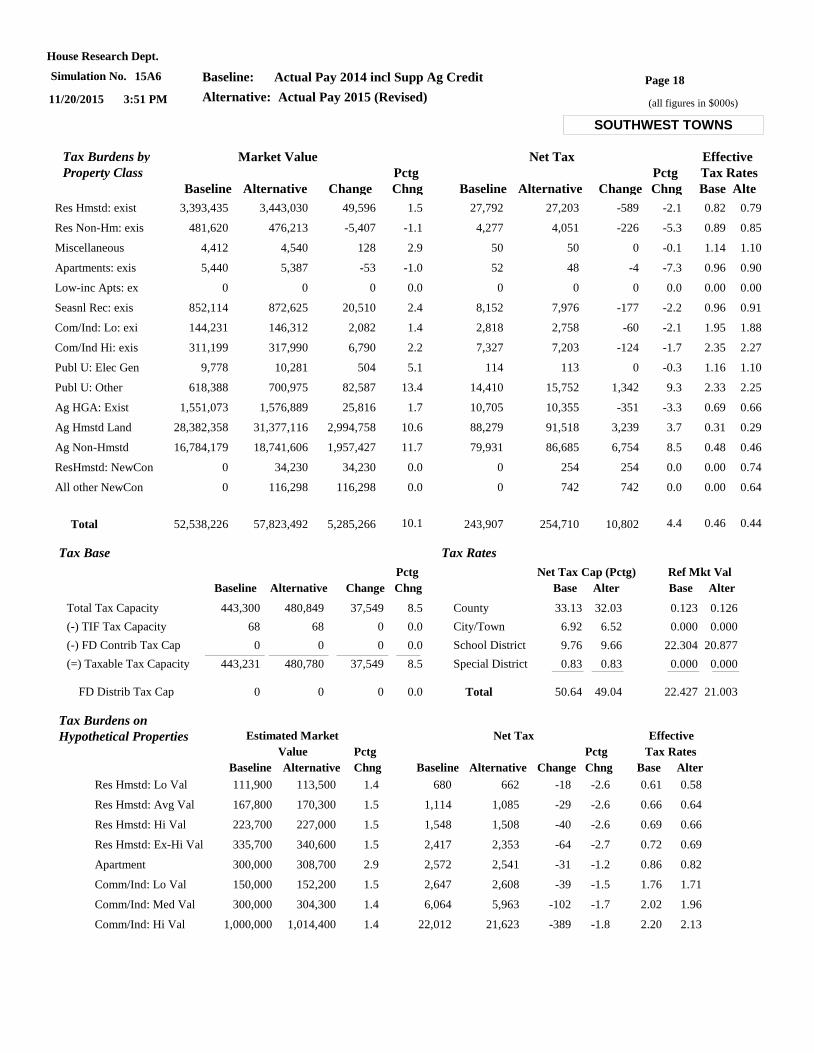
SOUTHWEST TOWNS
Tax Base
Total Tax Capacity
(-) TIF Tax Capacity
(-) FD Contrib Tax Cap
(=) Taxable Tax Capacity
68
0
443,231
443,300
68
0
480,780
480,849
0
0
37,549
37,549
FD Distrib Tax Cap 0 0 0
8.5
0.0
0.0
8.5
0.0
Baseline Alternative Change Chng
Pctg
Tax Rates
County
City/Town
School District
Special District
33.13
6.92
9.76
0.83
Total 50.64
32.03
6.52
9.66
0.83
49.04
0.123
0.000
22.304
0.000
22.427
0.126
0.000
20.877
0.000
21.003
Base Alter Base Alter
Net Tax Cap (Pctg) Ref Mkt Val
Baseline Alternative Change Chng Base
Effective
Tax Rates
AlteChngBaseline Alternative Change
Market Value Net TaxTax Burdens by
Pctg PctgProperty Class
Res Hmstd: exist 3,393,435 3,443,030 49,596 1.5 27,792 27,203 -589 -2.1 0.82 0.79
Res Non-Hm: exis 481,620 476,213 -5,407 -1.1 4,277 4,051 -226 -5.3 0.89 0.85
Miscellaneous 4,412 4,540 128 2.9 50 50 0 -0.1 1.14 1.10
Apartments: exis 5,440 5,387 -53 -1.0 52 48 -4 -7.3 0.96 0.90
Low-inc Apts: ex 0 0 0 0.0 0 0 0 0.0 0.00 0.00
Seasnl Rec: exis 852,114 872,625 20,510 2.4 8,152 7,976 -177 -2.2 0.96 0.91
Com/Ind: Lo: exi 144,231 146,312 2,082 1.4 2,818 2,758 -60 -2.1 1.95 1.88
Com/Ind Hi: exis 311,199 317,990 6,790 2.2 7,327 7,203 -124 -1.7 2.35 2.27
Publ U: Elec Gen 9,778 10,281 504 5.1 114 113 0 -0.3 1.16 1.10
Publ U: Other 618,388 700,975 82,587 13.4 14,410 15,752 1,342 9.3 2.33 2.25
Ag HGA: Exist 1,551,073 1,576,889 25,816 1.7 10,705 10,355 -351 -3.3 0.69 0.66
Ag Hmstd Land 28,382,358 31,377,116 2,994,758 10.6 88,279 91,518 3,239 3.7 0.31 0.29
Ag Non-Hmstd 16,784,179 18,741,606 1,957,427 11.7 79,931 86,685 6,754 8.5 0.48 0.46
ResHmstd: NewCon 0 34,230 34,230 0.0 0 254 254 0.0 0.00 0.74
All other NewCon 0 116,298 116,298 0.0 0 742 742 0.0 0.00 0.64
Total 52,538,226 57,823,492 5,285,266 243,907 254,710 10,80210.1 4.4 0.46 0.44
Baseline Alternative Baseline Alternative
Tax Burdens on
Chng Chng
Pctg Pctg
Change Base Alter
Tax Rates
Effective
Value
Estimated Market Net TaxHypothetical Properties
Res Hmstd: Lo Val 111,900 113,500 680 6621.4 -18 -2.6 0.61 0.58
Res Hmstd: Avg Val 167,800 170,300 1,114 1,0851.5 -29 -2.6 0.66 0.64
Res Hmstd: Hi Val 223,700 227,000 1,548 1,5081.5 -40 -2.6 0.69 0.66
Res Hmstd: Ex-Hi Val 335,700 340,600 2,417 2,3531.5 -64 -2.7 0.72 0.69
Apartment 300,000 308,700 2,572 2,5412.9 -31 -1.2 0.86 0.82
Comm/Ind: Lo Val 150,000 152,200 2,647 2,6081.5 -39 -1.5 1.76 1.71
Comm/Ind: Med Val 300,000 304,300 6,064 5,9631.4 -102 -1.7 2.02 1.96
Comm/Ind: Hi Val 1,000,000 1,014,400 22,012 21,6231.4 -389 -1.8 2.20 2.13
Page 19
(all figures in $000s)
House Research Dept.
11/20/2015 3:51 PM
Simulation No. 15A6 Baseline: Actual Pay 2014 incl Supp Ag Credit
Alternative: Actual Pay 2015 (Revised)
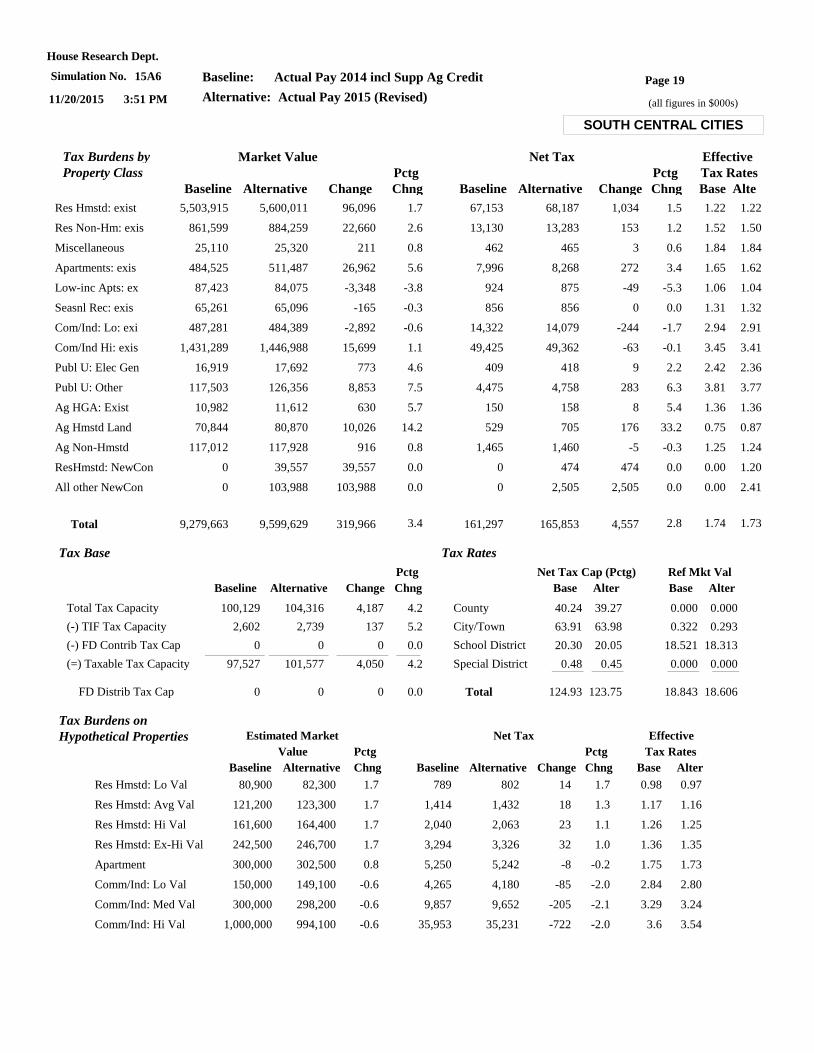
SOUTH CENTRAL CITIES
Tax Base
Total Tax Capacity
(-) TIF Tax Capacity
(-) FD Contrib Tax Cap
(=) Taxable Tax Capacity
2,602
0
97,527
100,129
2,739
0
101,577
104,316
137
0
4,050
4,187
FD Distrib Tax Cap 0 0 0
4.2
5.2
0.0
4.2
0.0
Baseline Alternative Change Chng
Pctg
Tax Rates
County
City/Town
School District
Special District
40.24
63.91
20.30
0.48
Total 124.93
39.27
63.98
20.05
0.45
123.75
0.000
0.322
18.521
0.000
18.843
0.000
0.293
18.313
0.000
18.606
Base Alter Base Alter
Net Tax Cap (Pctg) Ref Mkt Val
Baseline Alternative Change Chng Base
Effective
Tax Rates
AlteChngBaseline Alternative Change
Market Value Net TaxTax Burdens by
Pctg PctgProperty Class
Res Hmstd: exist 5,503,915 5,600,011 96,096 1.7 67,153 68,187 1,034 1.5 1.22 1.22
Res Non-Hm: exis 861,599 884,259 22,660 2.6 13,130 13,283 153 1.2 1.52 1.50
Miscellaneous 25,110 25,320 211 0.8 462 465 3 0.6 1.84 1.84
Apartments: exis 484,525 511,487 26,962 5.6 7,996 8,268 272 3.4 1.65 1.62
Low-inc Apts: ex 87,423 84,075 -3,348 -3.8 924 875 -49 -5.3 1.06 1.04
Seasnl Rec: exis 65,261 65,096 -165 -0.3 856 856 0 0.0 1.31 1.32
Com/Ind: Lo: exi 487,281 484,389 -2,892 -0.6 14,322 14,079 -244 -1.7 2.94 2.91
Com/Ind Hi: exis 1,431,289 1,446,988 15,699 1.1 49,425 49,362 -63 -0.1 3.45 3.41
Publ U: Elec Gen 16,919 17,692 773 4.6 409 418 9 2.2 2.42 2.36
Publ U: Other 117,503 126,356 8,853 7.5 4,475 4,758 283 6.3 3.81 3.77
Ag HGA: Exist 10,982 11,612 630 5.7 150 158 8 5.4 1.36 1.36
Ag Hmstd Land 70,844 80,870 10,026 14.2 529 705 176 33.2 0.75 0.87
Ag Non-Hmstd 117,012 117,928 916 0.8 1,465 1,460 -5 -0.3 1.25 1.24
ResHmstd: NewCon 0 39,557 39,557 0.0 0 474 474 0.0 0.00 1.20
All other NewCon 0 103,988 103,988 0.0 0 2,505 2,505 0.0 0.00 2.41
Total 9,279,663 9,599,629 319,966 161,297 165,853 4,5573.4 2.8 1.74 1.73
Baseline Alternative Baseline Alternative
Tax Burdens on
Chng Chng
Pctg Pctg
Change Base Alter
Tax Rates
Effective
Value
Estimated Market Net TaxHypothetical Properties
Res Hmstd: Lo Val 80,900 82,300 789 8021.7 14 1.7 0.98 0.97
Res Hmstd: Avg Val 121,200 123,300 1,414 1,4321.7 18 1.3 1.17 1.16
Res Hmstd: Hi Val 161,600 164,400 2,040 2,0631.7 23 1.1 1.26 1.25
Res Hmstd: Ex-Hi Val 242,500 246,700 3,294 3,3261.7 32 1.0 1.36 1.35
Apartment 300,000 302,500 5,250 5,2420.8 -8 -0.2 1.75 1.73
Comm/Ind: Lo Val 150,000 149,100 4,265 4,180-0.6 -85 -2.0 2.84 2.80
Comm/Ind: Med Val 300,000 298,200 9,857 9,652-0.6 -205 -2.1 3.29 3.24
Comm/Ind: Hi Val 1,000,000 994,100 35,953 35,231-0.6 -722 -2.0 3.6 3.54
Page 20
(all figures in $000s)
House Research Dept.
11/20/2015 3:51 PM
Simulation No. 15A6 Baseline: Actual Pay 2014 incl Supp Ag Credit
Alternative: Actual Pay 2015 (Revised)
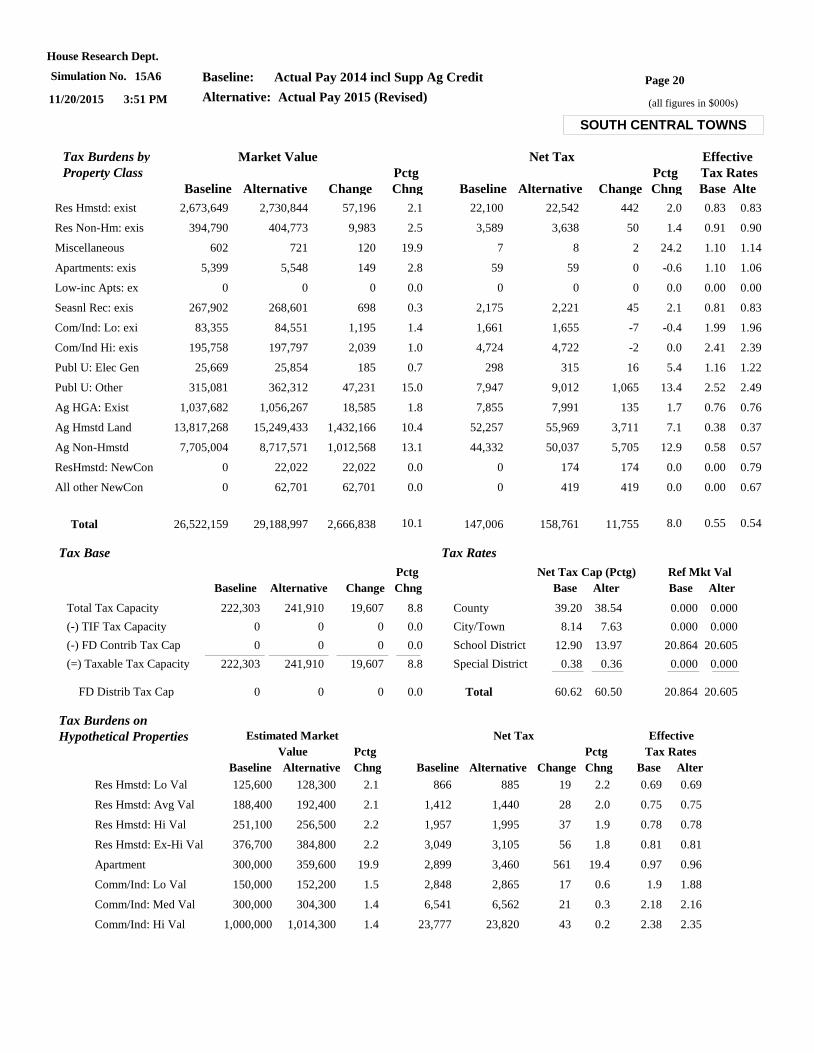
SOUTH CENTRAL TOWNS
Tax Base
Total Tax Capacity
(-) TIF Tax Capacity
(-) FD Contrib Tax Cap
(=) Taxable Tax Capacity
0
0
222,303
222,303
0
0
241,910
241,910
0
0
19,607
19,607
FD Distrib Tax Cap 0 0 0
8.8
0.0
0.0
8.8
0.0
Baseline Alternative Change Chng
Pctg
Tax Rates
County
City/Town
School District
Special District
39.20
8.14
12.90
0.38
Total 60.62
38.54
7.63
13.97
0.36
60.50
0.000
0.000
20.864
0.000
20.864
0.000
0.000
20.605
0.000
20.605
Base Alter Base Alter
Net Tax Cap (Pctg) Ref Mkt Val
Baseline Alternative Change Chng Base
Effective
Tax Rates
AlteChngBaseline Alternative Change
Market Value Net TaxTax Burdens by
Pctg PctgProperty Class
Res Hmstd: exist 2,673,649 2,730,844 57,196 2.1 22,100 22,542 442 2.0 0.83 0.83
Res Non-Hm: exis 394,790 404,773 9,983 2.5 3,589 3,638 50 1.4 0.91 0.90
Miscellaneous 602 721 120 19.9 7 8 2 24.2 1.10 1.14
Apartments: exis 5,399 5,548 149 2.8 59 59 0 -0.6 1.10 1.06
Low-inc Apts: ex 0 0 0 0.0 0 0 0 0.0 0.00 0.00
Seasnl Rec: exis 267,902 268,601 698 0.3 2,175 2,221 45 2.1 0.81 0.83
Com/Ind: Lo: exi 83,355 84,551 1,195 1.4 1,661 1,655 -7 -0.4 1.99 1.96
Com/Ind Hi: exis 195,758 197,797 2,039 1.0 4,724 4,722 -2 0.0 2.41 2.39
Publ U: Elec Gen 25,669 25,854 185 0.7 298 315 16 5.4 1.16 1.22
Publ U: Other 315,081 362,312 47,231 15.0 7,947 9,012 1,065 13.4 2.52 2.49
Ag HGA: Exist 1,037,682 1,056,267 18,585 1.8 7,855 7,991 135 1.7 0.76 0.76
Ag Hmstd Land 13,817,268 15,249,433 1,432,166 10.4 52,257 55,969 3,711 7.1 0.38 0.37
Ag Non-Hmstd 7,705,004 8,717,571 1,012,568 13.1 44,332 50,037 5,705 12.9 0.58 0.57
ResHmstd: NewCon 0 22,022 22,022 0.0 0 174 174 0.0 0.00 0.79
All other NewCon 0 62,701 62,701 0.0 0 419 419 0.0 0.00 0.67
Total 26,522,159 29,188,997 2,666,838 147,006 158,761 11,75510.1 8.0 0.55 0.54
Baseline Alternative Baseline Alternative
Tax Burdens on
Chng Chng
Pctg Pctg
Change Base Alter
Tax Rates
Effective
Value
Estimated Market Net TaxHypothetical Properties
Res Hmstd: Lo Val 125,600 128,300 866 8852.1 19 2.2 0.69 0.69
Res Hmstd: Avg Val 188,400 192,400 1,412 1,4402.1 28 2.0 0.75 0.75
Res Hmstd: Hi Val 251,100 256,500 1,957 1,9952.2 37 1.9 0.78 0.78
Res Hmstd: Ex-Hi Val 376,700 384,800 3,049 3,1052.2 56 1.8 0.81 0.81
Apartment 300,000 359,600 2,899 3,46019.9 561 19.4 0.97 0.96
Comm/Ind: Lo Val 150,000 152,200 2,848 2,8651.5 17 0.6 1.9 1.88
Comm/Ind: Med Val 300,000 304,300 6,541 6,5621.4 21 0.3 2.18 2.16
Comm/Ind: Hi Val 1,000,000 1,014,300 23,777 23,8201.4 43 0.2 2.38 2.35
Page 21
(all figures in $000s)
House Research Dept.
11/20/2015 3:51 PM
Simulation No. 15A6 Baseline: Actual Pay 2014 incl Supp Ag Credit
Alternative: Actual Pay 2015 (Revised)
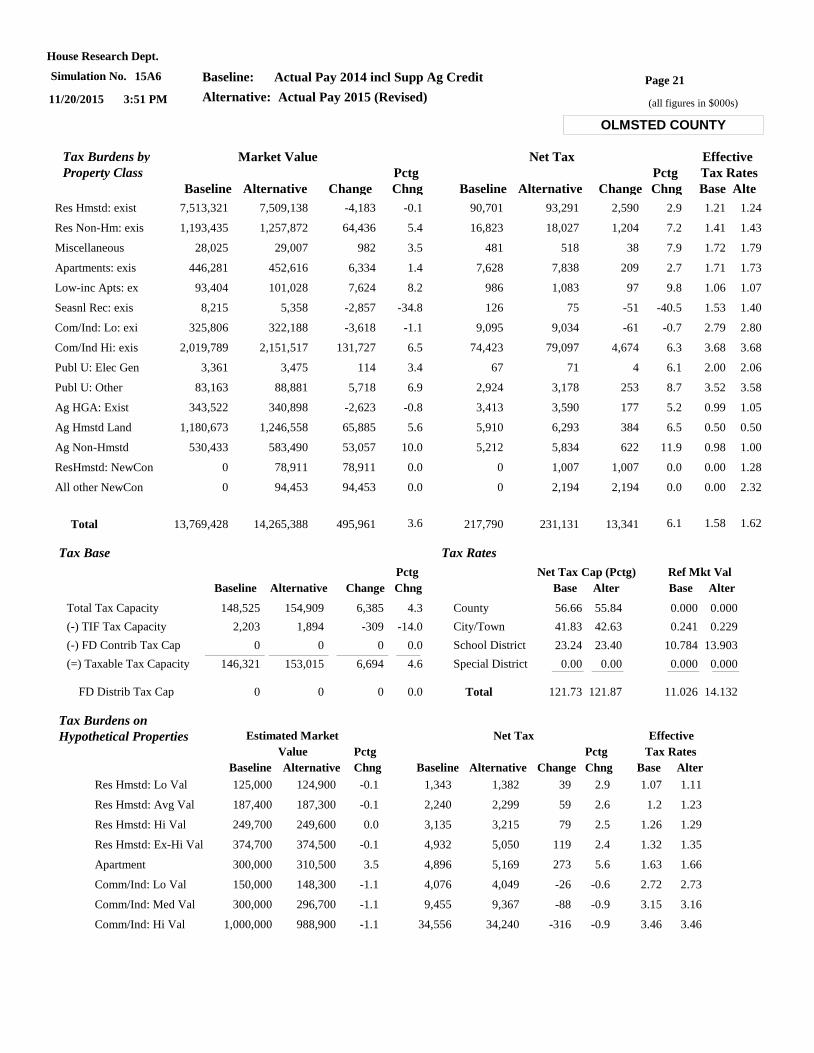
OLMSTED COUNTY
Tax Base
Total Tax Capacity
(-) TIF Tax Capacity
(-) FD Contrib Tax Cap
(=) Taxable Tax Capacity
2,203
0
146,321
148,525
1,894
0
153,015
154,909
-309
0
6,694
6,385
FD Distrib Tax Cap 0 0 0
4.3
-14.0
0.0
4.6
0.0
Baseline Alternative Change Chng
Pctg
Tax Rates
County
City/Town
School District
Special District
56.66
41.83
23.24
0.00
Total 121.73
55.84
42.63
23.40
0.00
121.87
0.000
0.241
10.784
0.000
11.026
0.000
0.229
13.903
0.000
14.132
Base Alter Base Alter
Net Tax Cap (Pctg) Ref Mkt Val
Baseline Alternative Change Chng Base
Effective
Tax Rates
AlteChngBaseline Alternative Change
Market Value Net TaxTax Burdens by
Pctg PctgProperty Class
Res Hmstd: exist 7,513,321 7,509,138 -4,183 -0.1 90,701 93,291 2,590 2.9 1.21 1.24
Res Non-Hm: exis 1,193,435 1,257,872 64,436 5.4 16,823 18,027 1,204 7.2 1.41 1.43
Miscellaneous 28,025 29,007 982 3.5 481 518 38 7.9 1.72 1.79
Apartments: exis 446,281 452,616 6,334 1.4 7,628 7,838 209 2.7 1.71 1.73
Low-inc Apts: ex 93,404 101,028 7,624 8.2 986 1,083 97 9.8 1.06 1.07
Seasnl Rec: exis 8,215 5,358 -2,857 -34.8 126 75 -51 -40.5 1.53 1.40
Com/Ind: Lo: exi 325,806 322,188 -3,618 -1.1 9,095 9,034 -61 -0.7 2.79 2.80
Com/Ind Hi: exis 2,019,789 2,151,517 131,727 6.5 74,423 79,097 4,674 6.3 3.68 3.68
Publ U: Elec Gen 3,361 3,475 114 3.4 67 71 4 6.1 2.00 2.06
Publ U: Other 83,163 88,881 5,718 6.9 2,924 3,178 253 8.7 3.52 3.58
Ag HGA: Exist 343,522 340,898 -2,623 -0.8 3,413 3,590 177 5.2 0.99 1.05
Ag Hmstd Land 1,180,673 1,246,558 65,885 5.6 5,910 6,293 384 6.5 0.50 0.50
Ag Non-Hmstd 530,433 583,490 53,057 10.0 5,212 5,834 622 11.9 0.98 1.00
ResHmstd: NewCon 0 78,911 78,911 0.0 0 1,007 1,007 0.0 0.00 1.28
All other NewCon 0 94,453 94,453 0.0 0 2,194 2,194 0.0 0.00 2.32
Total 13,769,428 14,265,388 495,961 217,790 231,131 13,3413.6 6.1 1.58 1.62
Baseline Alternative Baseline Alternative
Tax Burdens on
Chng Chng
Pctg Pctg
Change Base Alter
Tax Rates
Effective
Value
Estimated Market Net TaxHypothetical Properties
Res Hmstd: Lo Val 125,000 124,900 1,343 1,382-0.1 39 2.9 1.07 1.11
Res Hmstd: Avg Val 187,400 187,300 2,240 2,299-0.1 59 2.6 1.2 1.23
Res Hmstd: Hi Val 249,700 249,600 3,135 3,2150.0 79 2.5 1.26 1.29
Res Hmstd: Ex-Hi Val 374,700 374,500 4,932 5,050-0.1 119 2.4 1.32 1.35
Apartment 300,000 310,500 4,896 5,1693.5 273 5.6 1.63 1.66
Comm/Ind: Lo Val 150,000 148,300 4,076 4,049-1.1 -26 -0.6 2.72 2.73
Comm/Ind: Med Val 300,000 296,700 9,455 9,367-1.1 -88 -0.9 3.15 3.16
Comm/Ind: Hi Val 1,000,000 988,900 34,556 34,240-1.1 -316 -0.9 3.46 3.46
Page 22
(all figures in $000s)
House Research Dept.
11/20/2015 3:51 PM
Simulation No. 15A6 Baseline: Actual Pay 2014 incl Supp Ag Credit
Alternative: Actual Pay 2015 (Revised)
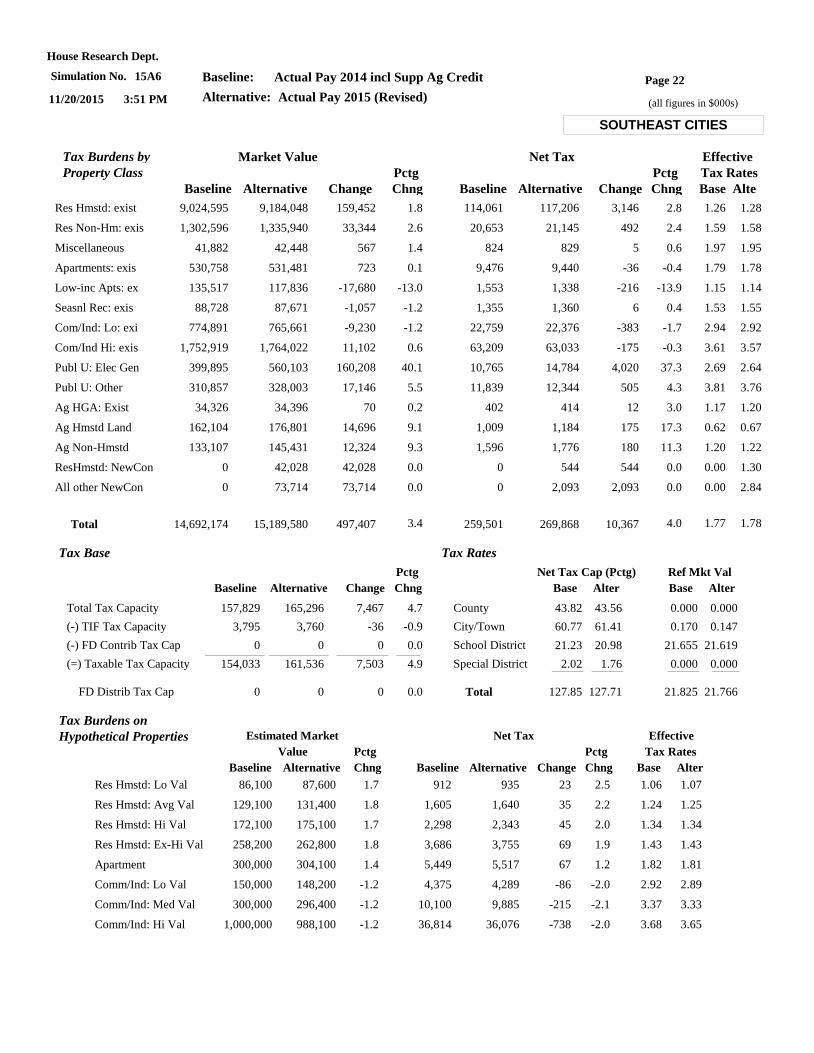
SOUTHEAST CITIES
Tax Base
Total Tax Capacity
(-) TIF Tax Capacity
(-) FD Contrib Tax Cap
(=) Taxable Tax Capacity
3,795
0
154,033
157,829
3,760
0
161,536
165,296
-36
0
7,503
7,467
FD Distrib Tax Cap 0 0 0
4.7
-0.9
0.0
4.9
0.0
Baseline Alternative Change Chng
Pctg
Tax Rates
County
City/Town
School District
Special District
43.82
60.77
21.23
2.02
Total 127.85
43.56
61.41
20.98
1.76
127.71
0.000
0.170
21.655
0.000
21.825
0.000
0.147
21.619
0.000
21.766
Base Alter Base Alter
Net Tax Cap (Pctg) Ref Mkt Val
Baseline Alternative Change Chng Base
Effective
Tax Rates
AlteChngBaseline Alternative Change
Market Value Net TaxTax Burdens by
Pctg PctgProperty Class
Res Hmstd: exist 9,024,595 9,184,048 159,452 1.8 114,061 117,206 3,146 2.8 1.26 1.28
Res Non-Hm: exis 1,302,596 1,335,940 33,344 2.6 20,653 21,145 492 2.4 1.59 1.58
Miscellaneous 41,882 42,448 567 1.4 824 829 5 0.6 1.97 1.95
Apartments: exis 530,758 531,481 723 0.1 9,476 9,440 -36 -0.4 1.79 1.78
Low-inc Apts: ex 135,517 117,836 -17,680 -13.0 1,553 1,338 -216 -13.9 1.15 1.14
Seasnl Rec: exis 88,728 87,671 -1,057 -1.2 1,355 1,360 6 0.4 1.53 1.55
Com/Ind: Lo: exi 774,891 765,661 -9,230 -1.2 22,759 22,376 -383 -1.7 2.94 2.92
Com/Ind Hi: exis 1,752,919 1,764,022 11,102 0.6 63,209 63,033 -175 -0.3 3.61 3.57
Publ U: Elec Gen 399,895 560,103 160,208 40.1 10,765 14,784 4,020 37.3 2.69 2.64
Publ U: Other 310,857 328,003 17,146 5.5 11,839 12,344 505 4.3 3.81 3.76
Ag HGA: Exist 34,326 34,396 70 0.2 402 414 12 3.0 1.17 1.20
Ag Hmstd Land 162,104 176,801 14,696 9.1 1,009 1,184 175 17.3 0.62 0.67
Ag Non-Hmstd 133,107 145,431 12,324 9.3 1,596 1,776 180 11.3 1.20 1.22
ResHmstd: NewCon 0 42,028 42,028 0.0 0 544 544 0.0 0.00 1.30
All other NewCon 0 73,714 73,714 0.0 0 2,093 2,093 0.0 0.00 2.84
Total 14,692,174 15,189,580 497,407 259,501 269,868 10,3673.4 4.0 1.77 1.78
Baseline Alternative Baseline Alternative
Tax Burdens on
Chng Chng
Pctg Pctg
Change Base Alter
Tax Rates
Effective
Value
Estimated Market Net TaxHypothetical Properties
Res Hmstd: Lo Val 86,100 87,600 912 9351.7 23 2.5 1.06 1.07
Res Hmstd: Avg Val 129,100 131,400 1,605 1,6401.8 35 2.2 1.24 1.25
Res Hmstd: Hi Val 172,100 175,100 2,298 2,3431.7 45 2.0 1.34 1.34
Res Hmstd: Ex-Hi Val 258,200 262,800 3,686 3,7551.8 69 1.9 1.43 1.43
Apartment 300,000 304,100 5,449 5,5171.4 67 1.2 1.82 1.81
Comm/Ind: Lo Val 150,000 148,200 4,375 4,289-1.2 -86 -2.0 2.92 2.89
Comm/Ind: Med Val 300,000 296,400 10,100 9,885-1.2 -215 -2.1 3.37 3.33
Comm/Ind: Hi Val 1,000,000 988,100 36,814 36,076-1.2 -738 -2.0 3.68 3.65
Page 23
(all figures in $000s)
House Research Dept.
11/20/2015 3:51 PM
Simulation No. 15A6 Baseline: Actual Pay 2014 incl Supp Ag Credit
Alternative: Actual Pay 2015 (Revised)
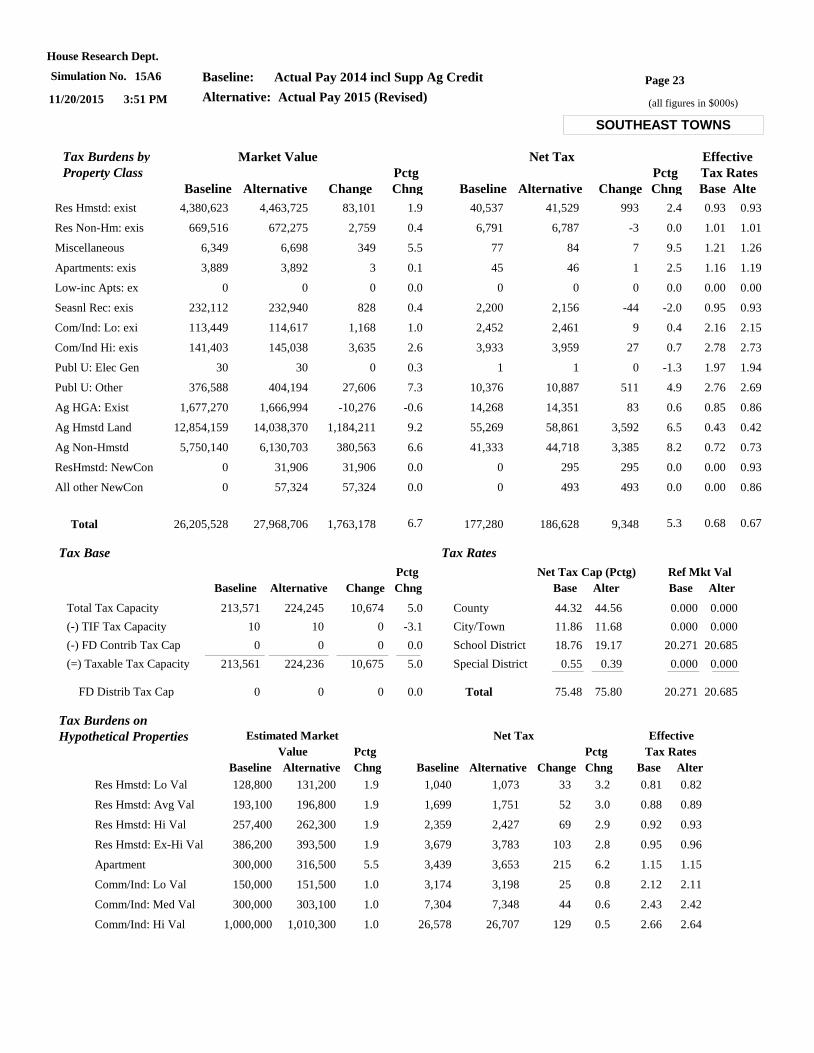
SOUTHEAST TOWNS
Tax Base
Total Tax Capacity
(-) TIF Tax Capacity
(-) FD Contrib Tax Cap
(=) Taxable Tax Capacity
10
0
213,561
213,571
10
0
224,236
224,245
0
0
10,675
10,674
FD Distrib Tax Cap 0 0 0
5.0
-3.1
0.0
5.0
0.0
Baseline Alternative Change Chng
Pctg
Tax Rates
County
City/Town
School District
Special District
44.32
11.86
18.76
0.55
Total 75.48
44.56
11.68
19.17
0.39
75.80
0.000
0.000
20.271
0.000
20.271
0.000
0.000
20.685
0.000
20.685
Base Alter Base Alter
Net Tax Cap (Pctg) Ref Mkt Val
Baseline Alternative Change Chng Base
Effective
Tax Rates
AlteChngBaseline Alternative Change
Market Value Net TaxTax Burdens by
Pctg PctgProperty Class
Res Hmstd: exist 4,380,623 4,463,725 83,101 1.9 40,537 41,529 993 2.4 0.93 0.93
Res Non-Hm: exis 669,516 672,275 2,759 0.4 6,791 6,787 -3 0.0 1.01 1.01
Miscellaneous 6,349 6,698 349 5.5 77 84 7 9.5 1.21 1.26
Apartments: exis 3,889 3,892 3 0.1 45 46 1 2.5 1.16 1.19
Low-inc Apts: ex 0 0 0 0.0 0 0 0 0.0 0.00 0.00
Seasnl Rec: exis 232,112 232,940 828 0.4 2,200 2,156 -44 -2.0 0.95 0.93
Com/Ind: Lo: exi 113,449 114,617 1,168 1.0 2,452 2,461 9 0.4 2.16 2.15
Com/Ind Hi: exis 141,403 145,038 3,635 2.6 3,933 3,959 27 0.7 2.78 2.73
Publ U: Elec Gen 30 30 0 0.3 1 1 0 -1.3 1.97 1.94
Publ U: Other 376,588 404,194 27,606 7.3 10,376 10,887 511 4.9 2.76 2.69
Ag HGA: Exist 1,677,270 1,666,994 -10,276 -0.6 14,268 14,351 83 0.6 0.85 0.86
Ag Hmstd Land 12,854,159 14,038,370 1,184,211 9.2 55,269 58,861 3,592 6.5 0.43 0.42
Ag Non-Hmstd 5,750,140 6,130,703 380,563 6.6 41,333 44,718 3,385 8.2 0.72 0.73
ResHmstd: NewCon 0 31,906 31,906 0.0 0 295 295 0.0 0.00 0.93
All other NewCon 0 57,324 57,324 0.0 0 493 493 0.0 0.00 0.86
Total 26,205,528 27,968,706 1,763,178 177,280 186,628 9,3486.7 5.3 0.68 0.67
Baseline Alternative Baseline Alternative
Tax Burdens on
Chng Chng
Pctg Pctg
Change Base Alter
Tax Rates
Effective
Value
Estimated Market Net TaxHypothetical Properties
Res Hmstd: Lo Val 128,800 131,200 1,040 1,0731.9 33 3.2 0.81 0.82
Res Hmstd: Avg Val 193,100 196,800 1,699 1,7511.9 52 3.0 0.88 0.89
Res Hmstd: Hi Val 257,400 262,300 2,359 2,4271.9 69 2.9 0.92 0.93
Res Hmstd: Ex-Hi Val 386,200 393,500 3,679 3,7831.9 103 2.8 0.95 0.96
Apartment 300,000 316,500 3,439 3,6535.5 215 6.2 1.15 1.15
Comm/Ind: Lo Val 150,000 151,500 3,174 3,1981.0 25 0.8 2.12 2.11
Comm/Ind: Med Val 300,000 303,100 7,304 7,3481.0 44 0.6 2.43 2.42
Comm/Ind: Hi Val 1,000,000 1,010,300 26,578 26,7071.0 129 0.5 2.66 2.64
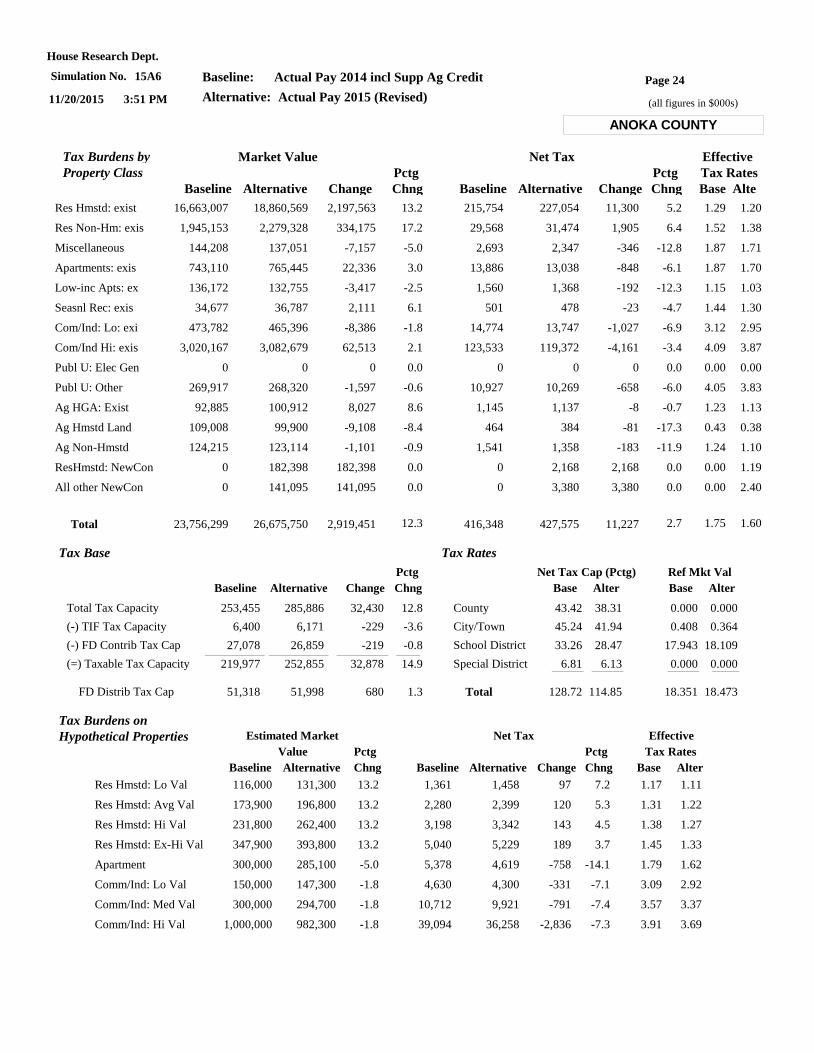
Page 24
(all figures in $000s)
House Research Dept.
11/20/2015 3:51 PM
Simulation No. 15A6 Baseline: Actual Pay 2014 incl Supp Ag Credit
Alternative: Actual Pay 2015 (Revised)
ANOKA COUNTY
Tax Base
Total Tax Capacity
(-) TIF Tax Capacity
(-) FD Contrib Tax Cap
(=) Taxable Tax Capacity
6,400
27,078
219,977
253,455
6,171
26,859
252,855
285,886
-229
-219
32,878
32,430
FD Distrib Tax Cap 51,318 51,998 680
12.8
-3.6
-0.8
14.9
1.3
Baseline Alternative Change Chng
Pctg
Tax Rates
County
City/Town
School District
Special District
43.42
45.24
33.26
6.81
Total 128.72
38.31
41.94
28.47
6.13
114.85
0.000
0.408
17.943
0.000
18.351
0.000
0.364
18.109
0.000
18.473
Base Alter Base Alter
Net Tax Cap (Pctg) Ref Mkt Val
Baseline Alternative Change Chng Base
Effective
Tax Rates
AlteChngBaseline Alternative Change
Market Value Net TaxTax Burdens by
Pctg PctgProperty Class
Res Hmstd: exist 16,663,007 18,860,569 2,197,563 13.2 215,754 227,054 11,300 5.2 1.29 1.20
Res Non-Hm: exis 1,945,153 2,279,328 334,175 17.2 29,568 31,474 1,905 6.4 1.52 1.38
Miscellaneous 144,208 137,051 -7,157 -5.0 2,693 2,347 -346 -12.8 1.87 1.71
Apartments: exis 743,110 765,445 22,336 3.0 13,886 13,038 -848 -6.1 1.87 1.70
Low-inc Apts: ex 136,172 132,755 -3,417 -2.5 1,560 1,368 -192 -12.3 1.15 1.03
Seasnl Rec: exis 34,677 36,787 2,111 6.1 501 478 -23 -4.7 1.44 1.30
Com/Ind: Lo: exi 473,782 465,396 -8,386 -1.8 14,774 13,747 -1,027 -6.9 3.12 2.95
Com/Ind Hi: exis 3,020,167 3,082,679 62,513 2.1 123,533 119,372 -4,161 -3.4 4.09 3.87
Publ U: Elec Gen 0 0 0 0.0 0 0 0 0.0 0.00 0.00
Publ U: Other 269,917 268,320 -1,597 -0.6 10,927 10,269 -658 -6.0 4.05 3.83
Ag HGA: Exist 92,885 100,912 8,027 8.6 1,145 1,137 -8 -0.7 1.23 1.13
Ag Hmstd Land 109,008 99,900 -9,108 -8.4 464 384 -81 -17.3 0.43 0.38
Ag Non-Hmstd 124,215 123,114 -1,101 -0.9 1,541 1,358 -183 -11.9 1.24 1.10
ResHmstd: NewCon 0 182,398 182,398 0.0 0 2,168 2,168 0.0 0.00 1.19
All other NewCon 0 141,095 141,095 0.0 0 3,380 3,380 0.0 0.00 2.40
Total 23,756,299 26,675,750 2,919,451 416,348 427,575 11,22712.3 2.7 1.75 1.60
Baseline Alternative Baseline Alternative
Tax Burdens on
Chng Chng
Pctg Pctg
Change Base Alter
Tax Rates
Effective
Value
Estimated Market Net TaxHypothetical Properties
Res Hmstd: Lo Val 116,000 131,300 1,361 1,45813.2 97 7.2 1.17 1.11
Res Hmstd: Avg Val 173,900 196,800 2,280 2,39913.2 120 5.3 1.31 1.22
Res Hmstd: Hi Val 231,800 262,400 3,198 3,34213.2 143 4.5 1.38 1.27
Res Hmstd: Ex-Hi Val 347,900 393,800 5,040 5,22913.2 189 3.7 1.45 1.33
Apartment 300,000 285,100 5,378 4,619-5.0 -758 -14.1 1.79 1.62
Comm/Ind: Lo Val 150,000 147,300 4,630 4,300-1.8 -331 -7.1 3.09 2.92
Comm/Ind: Med Val 300,000 294,700 10,712 9,921-1.8 -791 -7.4 3.57 3.37
Comm/Ind: Hi Val 1,000,000 982,300 39,094 36,258-1.8 -2,836 -7.3 3.91 3.69
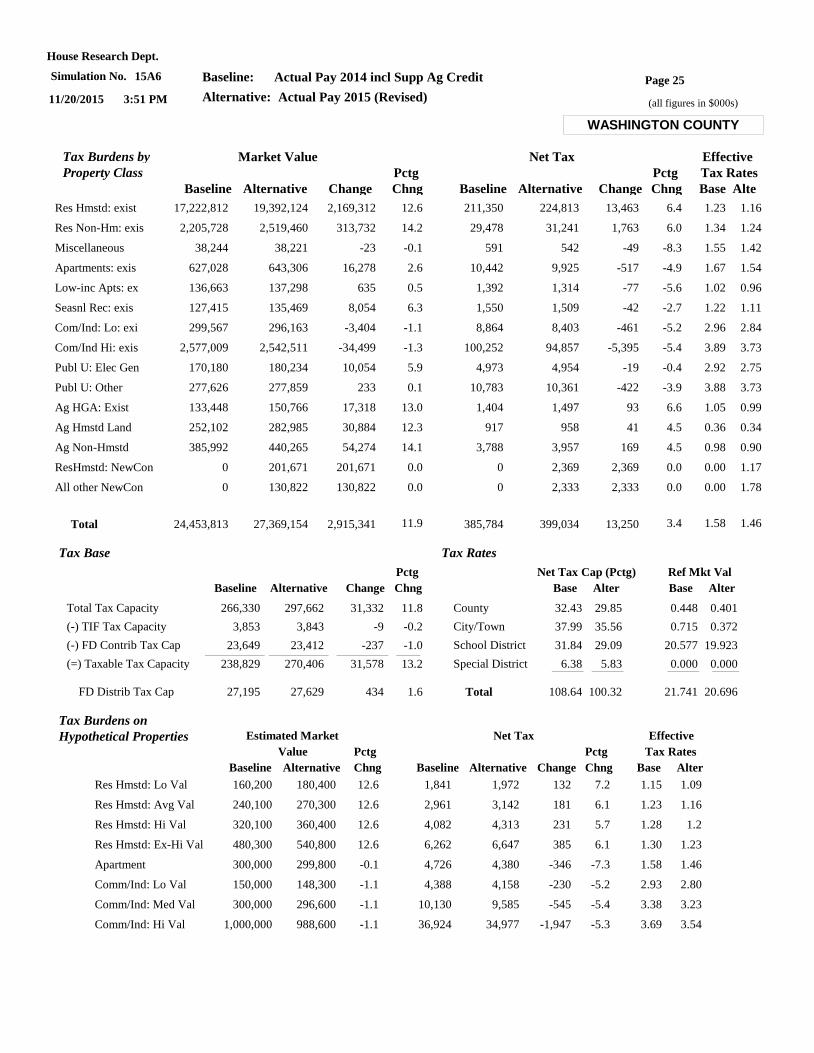
Page 25
(all figures in $000s)
House Research Dept.
11/20/2015 3:51 PM
Simulation No. 15A6 Baseline: Actual Pay 2014 incl Supp Ag Credit
Alternative: Actual Pay 2015 (Revised)
WASHINGTON COUNTY
Tax Base
Total Tax Capacity
(-) TIF Tax Capacity
(-) FD Contrib Tax Cap
(=) Taxable Tax Capacity
3,853
23,649
238,829
266,330
3,843
23,412
270,406
297,662
-9
-237
31,578
31,332
FD Distrib Tax Cap 27,195 27,629 434
11.8
-0.2
-1.0
13.2
1.6
Baseline Alternative Change Chng
Pctg
Tax Rates
County
City/Town
School District
Special District
32.43
37.99
31.84
6.38
Total 108.64
29.85
35.56
29.09
5.83
100.32
0.448
0.715
20.577
0.000
21.741
0.401
0.372
19.923
0.000
20.696
Base Alter Base Alter
Net Tax Cap (Pctg) Ref Mkt Val
Baseline Alternative Change Chng Base
Effective
Tax Rates
AlteChngBaseline Alternative Change
Market Value Net TaxTax Burdens by
Pctg PctgProperty Class
Res Hmstd: exist 17,222,812 19,392,124 2,169,312 12.6 211,350 224,813 13,463 6.4 1.23 1.16
Res Non-Hm: exis 2,205,728 2,519,460 313,732 14.2 29,478 31,241 1,763 6.0 1.34 1.24
Miscellaneous 38,244 38,221 -23 -0.1 591 542 -49 -8.3 1.55 1.42
Apartments: exis 627,028 643,306 16,278 2.6 10,442 9,925 -517 -4.9 1.67 1.54
Low-inc Apts: ex 136,663 137,298 635 0.5 1,392 1,314 -77 -5.6 1.02 0.96
Seasnl Rec: exis 127,415 135,469 8,054 6.3 1,550 1,509 -42 -2.7 1.22 1.11
Com/Ind: Lo: exi 299,567 296,163 -3,404 -1.1 8,864 8,403 -461 -5.2 2.96 2.84
Com/Ind Hi: exis 2,577,009 2,542,511 -34,499 -1.3 100,252 94,857 -5,395 -5.4 3.89 3.73
Publ U: Elec Gen 170,180 180,234 10,054 5.9 4,973 4,954 -19 -0.4 2.92 2.75
Publ U: Other 277,626 277,859 233 0.1 10,783 10,361 -422 -3.9 3.88 3.73
Ag HGA: Exist 133,448 150,766 17,318 13.0 1,404 1,497 93 6.6 1.05 0.99
Ag Hmstd Land 252,102 282,985 30,884 12.3 917 958 41 4.5 0.36 0.34
Ag Non-Hmstd 385,992 440,265 54,274 14.1 3,788 3,957 169 4.5 0.98 0.90
ResHmstd: NewCon 0 201,671 201,671 0.0 0 2,369 2,369 0.0 0.00 1.17
All other NewCon 0 130,822 130,822 0.0 0 2,333 2,333 0.0 0.00 1.78
Total 24,453,813 27,369,154 2,915,341 385,784 399,034 13,25011.9 3.4 1.58 1.46
Baseline Alternative Baseline Alternative
Tax Burdens on
Chng Chng
Pctg Pctg
Change Base Alter
Tax Rates
Effective
Value
Estimated Market Net TaxHypothetical Properties
Res Hmstd: Lo Val 160,200 180,400 1,841 1,97212.6 132 7.2 1.15 1.09
Res Hmstd: Avg Val 240,100 270,300 2,961 3,14212.6 181 6.1 1.23 1.16
Res Hmstd: Hi Val 320,100 360,400 4,082 4,31312.6 231 5.7 1.28 1.2
Res Hmstd: Ex-Hi Val 480,300 540,800 6,262 6,64712.6 385 6.1 1.30 1.23
Apartment 300,000 299,800 4,726 4,380-0.1 -346 -7.3 1.58 1.46
Comm/Ind: Lo Val 150,000 148,300 4,388 4,158-1.1 -230 -5.2 2.93 2.80
Comm/Ind: Med Val 300,000 296,600 10,130 9,585-1.1 -545 -5.4 3.38 3.23
Comm/Ind: Hi Val 1,000,000 988,600 36,924 34,977-1.1 -1,947 -5.3 3.69 3.54
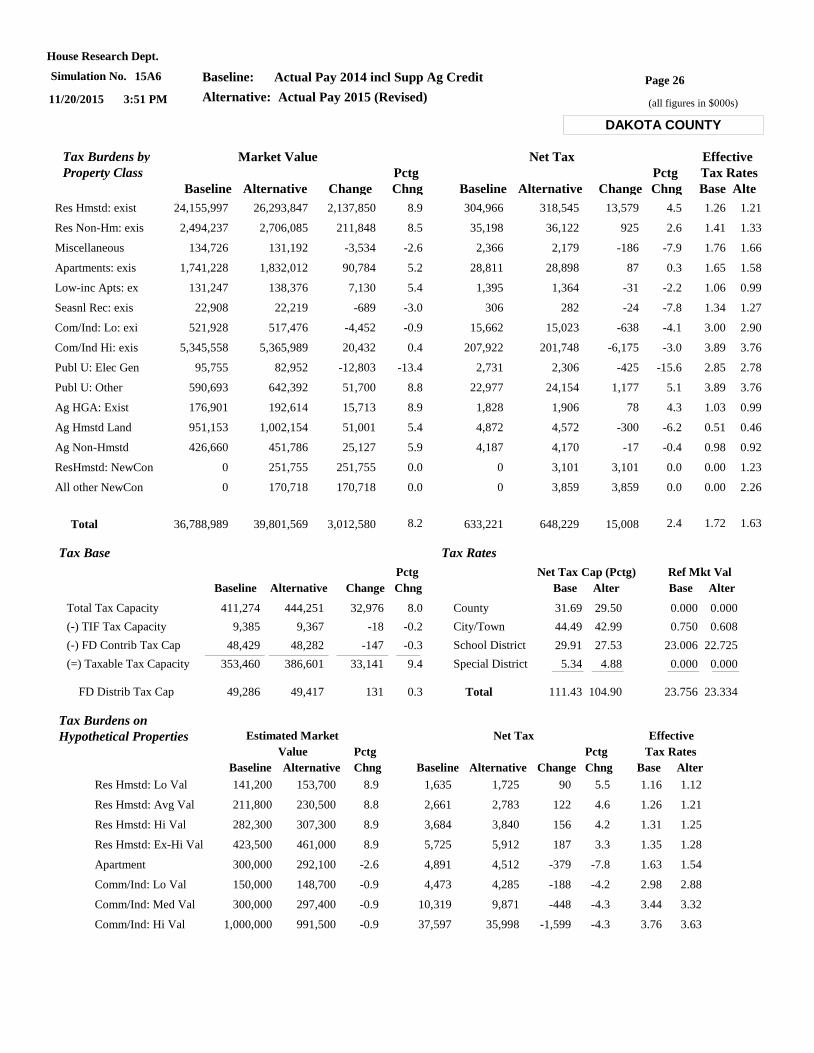
Page 26
(all figures in $000s)
House Research Dept.
11/20/2015 3:51 PM
Simulation No. 15A6 Baseline: Actual Pay 2014 incl Supp Ag Credit
Alternative: Actual Pay 2015 (Revised)
DAKOTA COUNTY
Tax Base
Total Tax Capacity
(-) TIF Tax Capacity
(-) FD Contrib Tax Cap
(=) Taxable Tax Capacity
9,385
48,429
353,460
411,274
9,367
48,282
386,601
444,251
-18
-147
33,141
32,976
FD Distrib Tax Cap 49,286 49,417 131
8.0
-0.2
-0.3
9.4
0.3
Baseline Alternative Change Chng
Pctg
Tax Rates
County
City/Town
School District
Special District
31.69
44.49
29.91
5.34
Total 111.43
29.50
42.99
27.53
4.88
104.90
0.000
0.750
23.006
0.000
23.756
0.000
0.608
22.725
0.000
23.334
Base Alter Base Alter
Net Tax Cap (Pctg) Ref Mkt Val
Baseline Alternative Change Chng Base
Effective
Tax Rates
AlteChngBaseline Alternative Change
Market Value Net TaxTax Burdens by
Pctg PctgProperty Class
Res Hmstd: exist 24,155,997 26,293,847 2,137,850 8.9 304,966 318,545 13,579 4.5 1.26 1.21
Res Non-Hm: exis 2,494,237 2,706,085 211,848 8.5 35,198 36,122 925 2.6 1.41 1.33
Miscellaneous 134,726 131,192 -3,534 -2.6 2,366 2,179 -186 -7.9 1.76 1.66
Apartments: exis 1,741,228 1,832,012 90,784 5.2 28,811 28,898 87 0.3 1.65 1.58
Low-inc Apts: ex 131,247 138,376 7,130 5.4 1,395 1,364 -31 -2.2 1.06 0.99
Seasnl Rec: exis 22,908 22,219 -689 -3.0 306 282 -24 -7.8 1.34 1.27
Com/Ind: Lo: exi 521,928 517,476 -4,452 -0.9 15,662 15,023 -638 -4.1 3.00 2.90
Com/Ind Hi: exis 5,345,558 5,365,989 20,432 0.4 207,922 201,748 -6,175 -3.0 3.89 3.76
Publ U: Elec Gen 95,755 82,952 -12,803 -13.4 2,731 2,306 -425 -15.6 2.85 2.78
Publ U: Other 590,693 642,392 51,700 8.8 22,977 24,154 1,177 5.1 3.89 3.76
Ag HGA: Exist 176,901 192,614 15,713 8.9 1,828 1,906 78 4.3 1.03 0.99
Ag Hmstd Land 951,153 1,002,154 51,001 5.4 4,872 4,572 -300 -6.2 0.51 0.46
Ag Non-Hmstd 426,660 451,786 25,127 5.9 4,187 4,170 -17 -0.4 0.98 0.92
ResHmstd: NewCon 0 251,755 251,755 0.0 0 3,101 3,101 0.0 0.00 1.23
All other NewCon 0 170,718 170,718 0.0 0 3,859 3,859 0.0 0.00 2.26
Total 36,788,989 39,801,569 3,012,580 633,221 648,229 15,0088.2 2.4 1.72 1.63
Baseline Alternative Baseline Alternative
Tax Burdens on
Chng Chng
Pctg Pctg
Change Base Alter
Tax Rates
Effective
Value
Estimated Market Net TaxHypothetical Properties
Res Hmstd: Lo Val 141,200 153,700 1,635 1,7258.9 90 5.5 1.16 1.12
Res Hmstd: Avg Val 211,800 230,500 2,661 2,7838.8 122 4.6 1.26 1.21
Res Hmstd: Hi Val 282,300 307,300 3,684 3,8408.9 156 4.2 1.31 1.25
Res Hmstd: Ex-Hi Val 423,500 461,000 5,725 5,9128.9 187 3.3 1.35 1.28
Apartment 300,000 292,100 4,891 4,512-2.6 -379 -7.8 1.63 1.54
Comm/Ind: Lo Val 150,000 148,700 4,473 4,285-0.9 -188 -4.2 2.98 2.88
Comm/Ind: Med Val 300,000 297,400 10,319 9,871-0.9 -448 -4.3 3.44 3.32
Comm/Ind: Hi Val 1,000,000 991,500 37,597 35,998-0.9 -1,599 -4.3 3.76 3.63
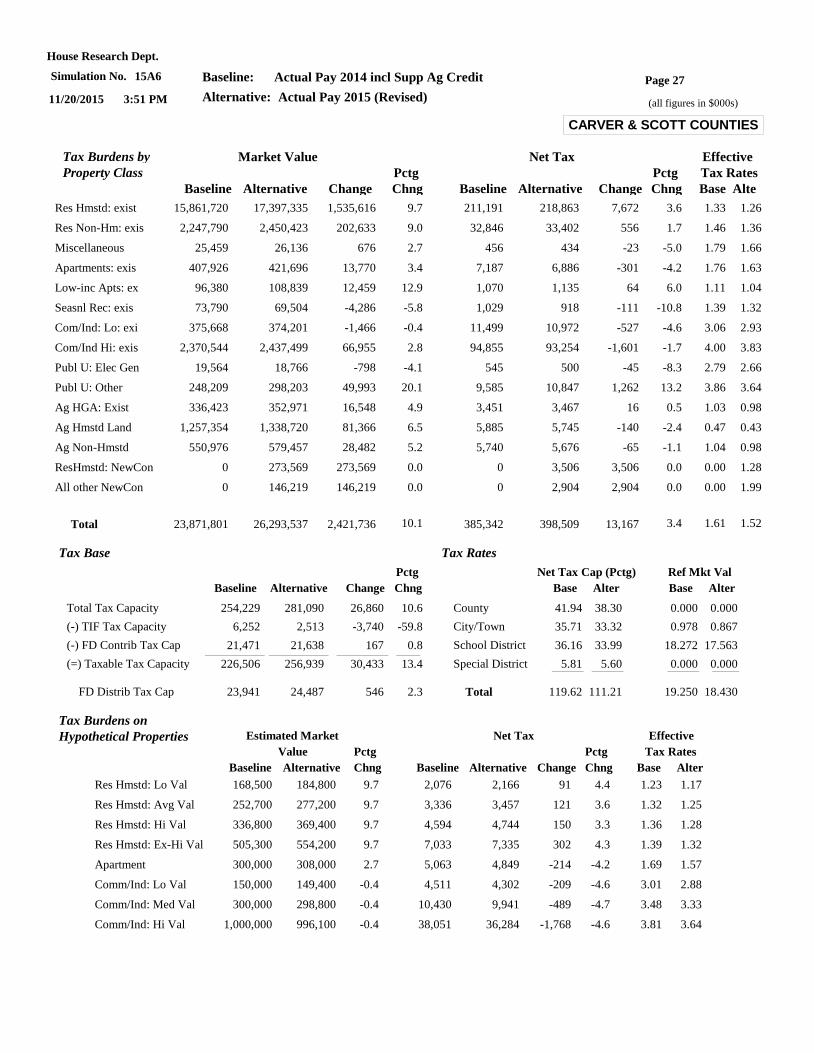
Page 27
(all figures in $000s)
House Research Dept.
11/20/2015 3:51 PM
Simulation No. 15A6 Baseline: Actual Pay 2014 incl Supp Ag Credit
Alternative: Actual Pay 2015 (Revised)
CARVER & SCOTT COUNTIES
Tax Base
Total Tax Capacity
(-) TIF Tax Capacity
(-) FD Contrib Tax Cap
(=) Taxable Tax Capacity
6,252
21,471
226,506
254,229
2,513
21,638
256,939
281,090
-3,740
167
30,433
26,860
FD Distrib Tax Cap 23,941 24,487 546
10.6
-59.8
0.8
13.4
2.3
Baseline Alternative Change Chng
Pctg
Tax Rates
County
City/Town
School District
Special District
41.94
35.71
36.16
5.81
Total 119.62
38.30
33.32
33.99
5.60
111.21
0.000
0.978
18.272
0.000
19.250
0.000
0.867
17.563
0.000
18.430
Base Alter Base Alter
Net Tax Cap (Pctg) Ref Mkt Val
Baseline Alternative Change Chng Base
Effective
Tax Rates
AlteChngBaseline Alternative Change
Market Value Net TaxTax Burdens by
Pctg PctgProperty Class
Res Hmstd: exist 15,861,720 17,397,335 1,535,616 9.7 211,191 218,863 7,672 3.6 1.33 1.26
Res Non-Hm: exis 2,247,790 2,450,423 202,633 9.0 32,846 33,402 556 1.7 1.46 1.36
Miscellaneous 25,459 26,136 676 2.7 456 434 -23 -5.0 1.79 1.66
Apartments: exis 407,926 421,696 13,770 3.4 7,187 6,886 -301 -4.2 1.76 1.63
Low-inc Apts: ex 96,380 108,839 12,459 12.9 1,070 1,135 64 6.0 1.11 1.04
Seasnl Rec: exis 73,790 69,504 -4,286 -5.8 1,029 918 -111 -10.8 1.39 1.32
Com/Ind: Lo: exi 375,668 374,201 -1,466 -0.4 11,499 10,972 -527 -4.6 3.06 2.93
Com/Ind Hi: exis 2,370,544 2,437,499 66,955 2.8 94,855 93,254 -1,601 -1.7 4.00 3.83
Publ U: Elec Gen 19,564 18,766 -798 -4.1 545 500 -45 -8.3 2.79 2.66
Publ U: Other 248,209 298,203 49,993 20.1 9,585 10,847 1,262 13.2 3.86 3.64
Ag HGA: Exist 336,423 352,971 16,548 4.9 3,451 3,467 16 0.5 1.03 0.98
Ag Hmstd Land 1,257,354 1,338,720 81,366 6.5 5,885 5,745 -140 -2.4 0.47 0.43
Ag Non-Hmstd 550,976 579,457 28,482 5.2 5,740 5,676 -65 -1.1 1.04 0.98
ResHmstd: NewCon 0 273,569 273,569 0.0 0 3,506 3,506 0.0 0.00 1.28
All other NewCon 0 146,219 146,219 0.0 0 2,904 2,904 0.0 0.00 1.99
Total 23,871,801 26,293,537 2,421,736 385,342 398,509 13,16710.1 3.4 1.61 1.52
Baseline Alternative Baseline Alternative
Tax Burdens on
Chng Chng
Pctg Pctg
Change Base Alter
Tax Rates
Effective
Value
Estimated Market Net TaxHypothetical Properties
Res Hmstd: Lo Val 168,500 184,800 2,076 2,1669.7 91 4.4 1.23 1.17
Res Hmstd: Avg Val 252,700 277,200 3,336 3,4579.7 121 3.6 1.32 1.25
Res Hmstd: Hi Val 336,800 369,400 4,594 4,7449.7 150 3.3 1.36 1.28
Res Hmstd: Ex-Hi Val 505,300 554,200 7,033 7,3359.7 302 4.3 1.39 1.32
Apartment 300,000 308,000 5,063 4,8492.7 -214 -4.2 1.69 1.57
Comm/Ind: Lo Val 150,000 149,400 4,511 4,302-0.4 -209 -4.6 3.01 2.88
Comm/Ind: Med Val 300,000 298,800 10,430 9,941-0.4 -489 -4.7 3.48 3.33
Comm/Ind: Hi Val 1,000,000 996,100 38,051 36,284-0.4 -1,768 -4.6 3.81 3.64
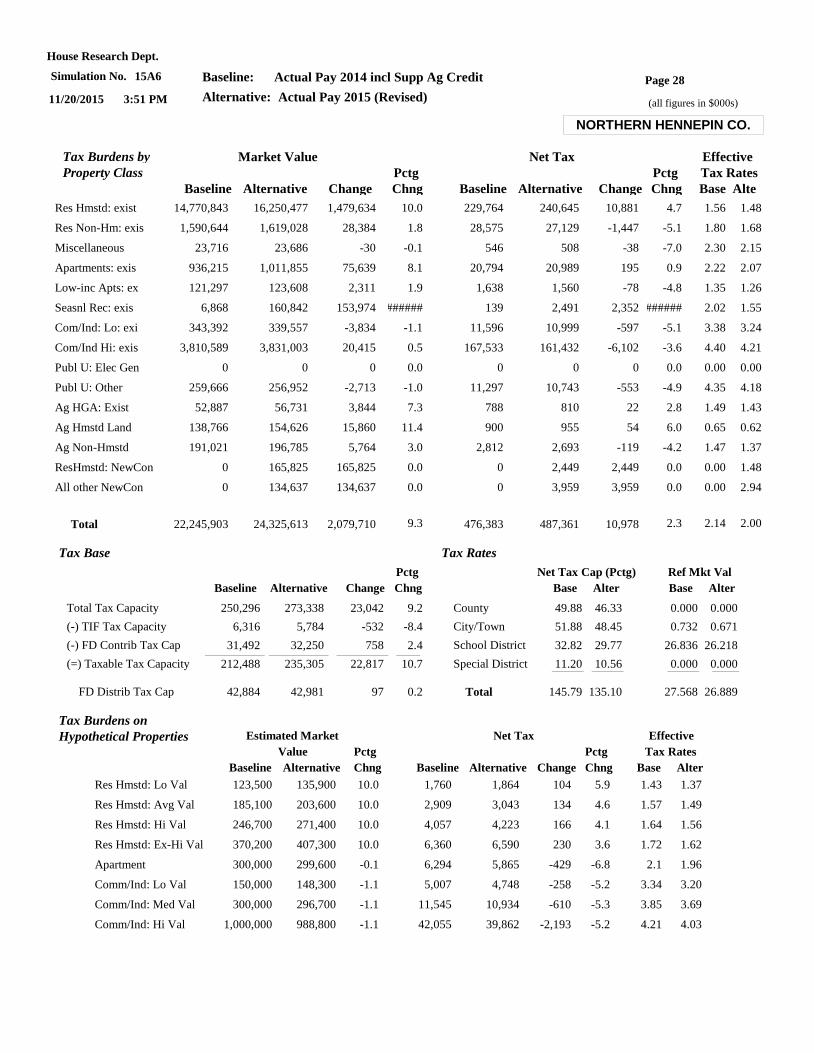
Page 28
(all figures in $000s)
House Research Dept.
11/20/2015 3:51 PM
Simulation No. 15A6 Baseline: Actual Pay 2014 incl Supp Ag Credit
Alternative: Actual Pay 2015 (Revised)
NORTHERN HENNEPIN CO.
Tax Base
Total Tax Capacity
(-) TIF Tax Capacity
(-) FD Contrib Tax Cap
(=) Taxable Tax Capacity
6,316
31,492
212,488
250,296
5,784
32,250
235,305
273,338
-532
758
22,817
23,042
FD Distrib Tax Cap 42,884 42,981 97
9.2
-8.4
2.4
10.7
0.2
Baseline Alternative Change Chng
Pctg
Tax Rates
County
City/Town
School District
Special District
49.88
51.88
32.82
11.20
Total 145.79
46.33
48.45
29.77
10.56
135.10
0.000
0.732
26.836
0.000
27.568
0.000
0.671
26.218
0.000
26.889
Base Alter Base Alter
Net Tax Cap (Pctg) Ref Mkt Val
Baseline Alternative Change Chng Base
Effective
Tax Rates
AlteChngBaseline Alternative Change
Market Value Net TaxTax Burdens by
Pctg PctgProperty Class
Res Hmstd: exist 14,770,843 16,250,477 1,479,634 10.0 229,764 240,645 10,881 4.7 1.56 1.48
Res Non-Hm: exis 1,590,644 1,619,028 28,384 1.8 28,575 27,129 -1,447 -5.1 1.80 1.68
Miscellaneous 23,716 23,686 -30 -0.1 546 508 -38 -7.0 2.30 2.15
Apartments: exis 936,215 1,011,855 75,639 8.1 20,794 20,989 195 0.9 2.22 2.07
Low-inc Apts: ex 121,297 123,608 2,311 1.9 1,638 1,560 -78 -4.8 1.35 1.26
Seasnl Rec: exis 6,868 160,842 153,974 ###### 139 2,491 2,352 ###### 2.02 1.55
Com/Ind: Lo: exi 343,392 339,557 -3,834 -1.1 11,596 10,999 -597 -5.1 3.38 3.24
Com/Ind Hi: exis 3,810,589 3,831,003 20,415 0.5 167,533 161,432 -6,102 -3.6 4.40 4.21
Publ U: Elec Gen 0 0 0 0.0 0 0 0 0.0 0.00 0.00
Publ U: Other 259,666 256,952 -2,713 -1.0 11,297 10,743 -553 -4.9 4.35 4.18
Ag HGA: Exist 52,887 56,731 3,844 7.3 788 810 22 2.8 1.49 1.43
Ag Hmstd Land 138,766 154,626 15,860 11.4 900 955 54 6.0 0.65 0.62
Ag Non-Hmstd 191,021 196,785 5,764 3.0 2,812 2,693 -119 -4.2 1.47 1.37
ResHmstd: NewCon 0 165,825 165,825 0.0 0 2,449 2,449 0.0 0.00 1.48
All other NewCon 0 134,637 134,637 0.0 0 3,959 3,959 0.0 0.00 2.94
Total 22,245,903 24,325,613 2,079,710 476,383 487,361 10,9789.3 2.3 2.14 2.00
Baseline Alternative Baseline Alternative
Tax Burdens on
Chng Chng
Pctg Pctg
Change Base Alter
Tax Rates
Effective
Value
Estimated Market Net TaxHypothetical Properties
Res Hmstd: Lo Val 123,500 135,900 1,760 1,86410.0 104 5.9 1.43 1.37
Res Hmstd: Avg Val 185,100 203,600 2,909 3,04310.0 134 4.6 1.57 1.49
Res Hmstd: Hi Val 246,700 271,400 4,057 4,22310.0 166 4.1 1.64 1.56
Res Hmstd: Ex-Hi Val 370,200 407,300 6,360 6,59010.0 230 3.6 1.72 1.62
Apartment 300,000 299,600 6,294 5,865-0.1 -429 -6.8 2.1 1.96
Comm/Ind: Lo Val 150,000 148,300 5,007 4,748-1.1 -258 -5.2 3.34 3.20
Comm/Ind: Med Val 300,000 296,700 11,545 10,934-1.1 -610 -5.3 3.85 3.69
Comm/Ind: Hi Val 1,000,000 988,800 42,055 39,862-1.1 -2,193 -5.2 4.21 4.03

Page 29
(all figures in $000s)
House Research Dept.
11/20/2015 3:51 PM
Simulation No. 15A6 Baseline: Actual Pay 2014 incl Supp Ag Credit
Alternative: Actual Pay 2015 (Revised)
SOUTHEAST HENNEPIN CO.
Tax Base
Total Tax Capacity
(-) TIF Tax Capacity
(-) FD Contrib Tax Cap
(=) Taxable Tax Capacity
36,127
53,256
297,475
386,858
30,044
51,004
332,003
413,051
-6,084
-2,252
34,529
26,193
FD Distrib Tax Cap 24,432 24,632 200
6.8
-16.8
-4.2
11.6
0.8
Baseline Alternative Change Chng
Pctg
Tax Rates
County
City/Town
School District
Special District
49.87
45.05
28.91
12.97
Total 136.80
46.33
42.47
26.71
11.96
127.46
0.000
0.204
20.981
0.000
21.184
0.000
0.188
20.376
0.000
20.564
Base Alter Base Alter
Net Tax Cap (Pctg) Ref Mkt Val
Baseline Alternative Change Chng Base
Effective
Tax Rates
AlteChngBaseline Alternative Change
Market Value Net TaxTax Burdens by
Pctg PctgProperty Class
Res Hmstd: exist 18,169,527 19,467,184 1,297,658 7.1 271,968 276,860 4,892 1.8 1.50 1.42
Res Non-Hm: exis 2,205,527 2,439,262 233,735 10.6 36,032 37,389 1,357 3.8 1.63 1.53
Miscellaneous 6,906 8,238 1,332 19.3 154 168 14 8.8 2.23 2.03
Apartments: exis 2,215,076 2,346,420 131,344 5.9 43,710 43,308 -403 -0.9 1.97 1.85
Low-inc Apts: ex 170,183 169,514 -669 -0.4 2,076 1,931 -145 -7.0 1.22 1.14
Seasnl Rec: exis 2,488 65,658 63,169 ###### 35 1,074 1,039 ###### 1.40 1.64
Com/Ind: Lo: exi 396,831 392,360 -4,471 -1.1 12,855 12,174 -681 -5.3 3.24 3.10
Com/Ind Hi: exis 7,612,678 7,748,003 135,324 1.8 320,938 311,698 -9,240 -2.9 4.22 4.02
Publ U: Elec Gen 222 221 -1 -0.5 8 7 0 -4.5 3.40 3.26
Publ U: Other 197,830 206,059 8,228 4.2 8,379 8,345 -35 -0.4 4.24 4.05
Ag HGA: Exist 151 296 145 96.0 2 4 2 105.3 1.38 1.45
Ag Hmstd Land 130 0 -130 -100.0 0 0 0 -100.0 0.28 0.00
Ag Non-Hmstd 312 366 54 17.2 4 5 0 8.8 1.40 1.30
ResHmstd: NewCon 0 117,387 117,387 0.0 0 1,657 1,657 0.0 0.00 1.41
All other NewCon 0 200,607 200,607 0.0 0 4,479 4,479 0.0 0.00 2.23
Total 30,977,861 33,161,573 2,183,713 696,161 699,098 2,9377.0 0.4 2.25 2.11
Baseline Alternative Baseline Alternative
Tax Burdens on
Chng Chng
Pctg Pctg
Change Base Alter
Tax Rates
Effective
Value
Estimated Market Net TaxHypothetical Properties
Res Hmstd: Lo Val 165,000 176,800 2,300 2,3457.2 45 1.9 1.39 1.33
Res Hmstd: Avg Val 247,400 265,100 3,704 3,7547.2 50 1.3 1.5 1.42
Res Hmstd: Hi Val 329,800 353,400 5,107 5,1627.2 55 1.1 1.55 1.46
Res Hmstd: Ex-Hi Val 494,800 530,100 7,817 7,9437.1 126 1.6 1.58 1.5
Apartment 300,000 357,900 5,766 6,43819.3 673 11.7 1.92 1.8
Comm/Ind: Lo Val 150,000 148,300 4,782 4,526-1.1 -255 -5.3 3.19 3.05
Comm/Ind: Med Val 300,000 296,600 11,051 10,443-1.1 -608 -5.5 3.68 3.52
Comm/Ind: Hi Val 1,000,000 988,700 40,310 38,133-1.1 -2,176 -5.4 4.03 3.86
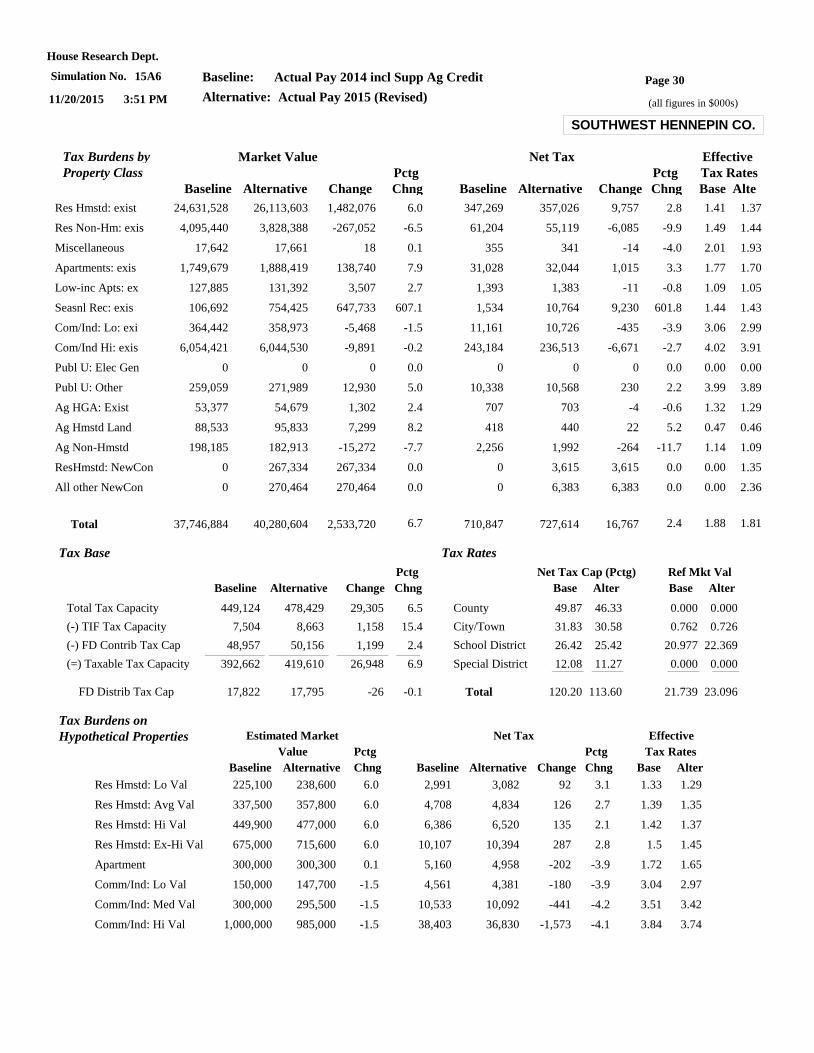
Page 30
(all figures in $000s)
House Research Dept.
11/20/2015 3:51 PM
Simulation No. 15A6 Baseline: Actual Pay 2014 incl Supp Ag Credit
Alternative: Actual Pay 2015 (Revised)
SOUTHWEST HENNEPIN CO.
Tax Base
Total Tax Capacity
(-) TIF Tax Capacity
(-) FD Contrib Tax Cap
(=) Taxable Tax Capacity
7,504
48,957
392,662
449,124
8,663
50,156
419,610
478,429
1,158
1,199
26,948
29,305
FD Distrib Tax Cap 17,822 17,795 -26
6.5
15.4
2.4
6.9
-0.1
Baseline Alternative Change Chng
Pctg
Tax Rates
County
City/Town
School District
Special District
49.87
31.83
26.42
12.08
Total 120.20
46.33
30.58
25.42
11.27
113.60
0.000
0.762
20.977
0.000
21.739
0.000
0.726
22.369
0.000
23.096
Base Alter Base Alter
Net Tax Cap (Pctg) Ref Mkt Val
Baseline Alternative Change Chng Base
Effective
Tax Rates
AlteChngBaseline Alternative Change
Market Value Net TaxTax Burdens by
Pctg PctgProperty Class
Res Hmstd: exist 24,631,528 26,113,603 1,482,076 6.0 347,269 357,026 9,757 2.8 1.41 1.37
Res Non-Hm: exis 4,095,440 3,828,388 -267,052 -6.5 61,204 55,119 -6,085 -9.9 1.49 1.44
Miscellaneous 17,642 17,661 18 0.1 355 341 -14 -4.0 2.01 1.93
Apartments: exis 1,749,679 1,888,419 138,740 7.9 31,028 32,044 1,015 3.3 1.77 1.70
Low-inc Apts: ex 127,885 131,392 3,507 2.7 1,393 1,383 -11 -0.8 1.09 1.05
Seasnl Rec: exis 106,692 754,425 647,733 607.1 1,534 10,764 9,230 601.8 1.44 1.43
Com/Ind: Lo: exi 364,442 358,973 -5,468 -1.5 11,161 10,726 -435 -3.9 3.06 2.99
Com/Ind Hi: exis 6,054,421 6,044,530 -9,891 -0.2 243,184 236,513 -6,671 -2.7 4.02 3.91
Publ U: Elec Gen 0 0 0 0.0 0 0 0 0.0 0.00 0.00
Publ U: Other 259,059 271,989 12,930 5.0 10,338 10,568 230 2.2 3.99 3.89
Ag HGA: Exist 53,377 54,679 1,302 2.4 707 703 -4 -0.6 1.32 1.29
Ag Hmstd Land 88,533 95,833 7,299 8.2 418 440 22 5.2 0.47 0.46
Ag Non-Hmstd 198,185 182,913 -15,272 -7.7 2,256 1,992 -264 -11.7 1.14 1.09
ResHmstd: NewCon 0 267,334 267,334 0.0 0 3,615 3,615 0.0 0.00 1.35
All other NewCon 0 270,464 270,464 0.0 0 6,383 6,383 0.0 0.00 2.36
Total 37,746,884 40,280,604 2,533,720 710,847 727,614 16,7676.7 2.4 1.88 1.81
Baseline Alternative Baseline Alternative
Tax Burdens on
Chng Chng
Pctg Pctg
Change Base Alter
Tax Rates
Effective
Value
Estimated Market Net TaxHypothetical Properties
Res Hmstd: Lo Val 225,100 238,600 2,991 3,0826.0 92 3.1 1.33 1.29
Res Hmstd: Avg Val 337,500 357,800 4,708 4,8346.0 126 2.7 1.39 1.35
Res Hmstd: Hi Val 449,900 477,000 6,386 6,5206.0 135 2.1 1.42 1.37
Res Hmstd: Ex-Hi Val 675,000 715,600 10,107 10,3946.0 287 2.8 1.5 1.45
Apartment 300,000 300,300 5,160 4,9580.1 -202 -3.9 1.72 1.65
Comm/Ind: Lo Val 150,000 147,700 4,561 4,381-1.5 -180 -3.9 3.04 2.97
Comm/Ind: Med Val 300,000 295,500 10,533 10,092-1.5 -441 -4.2 3.51 3.42
Comm/Ind: Hi Val 1,000,000 985,000 38,403 36,830-1.5 -1,573 -4.1 3.84 3.74
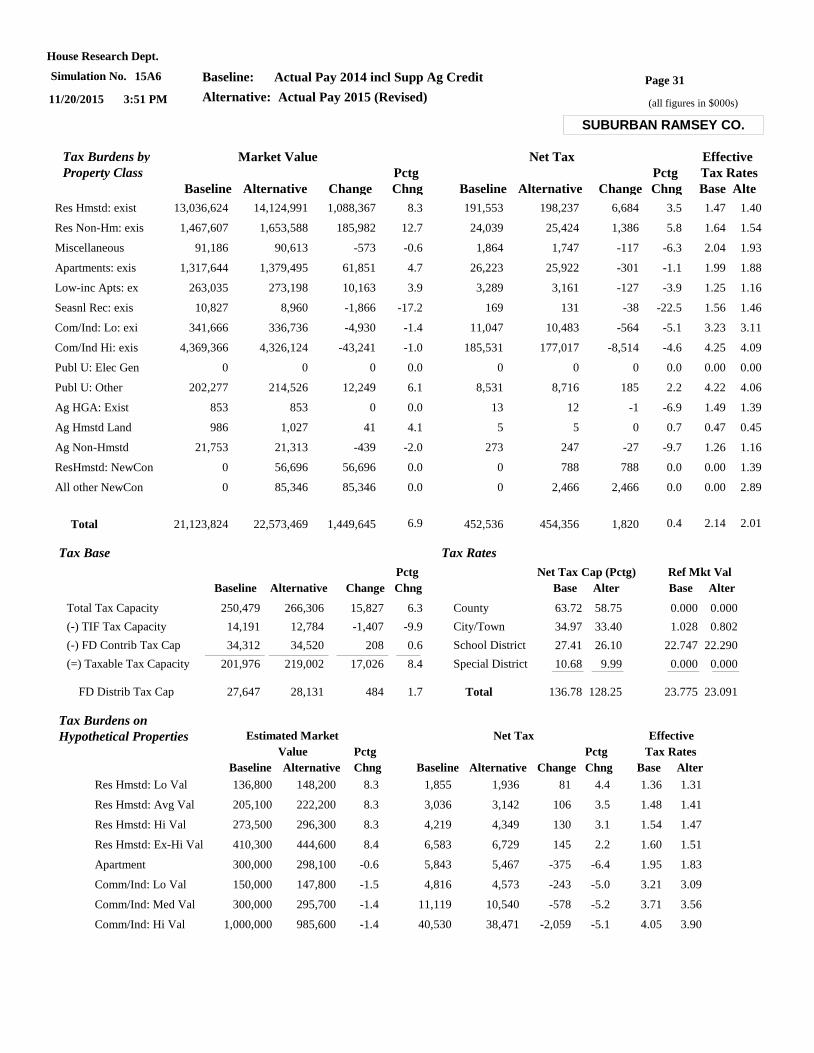
Page 31
(all figures in $000s)
House Research Dept.
11/20/2015 3:51 PM
Simulation No. 15A6 Baseline: Actual Pay 2014 incl Supp Ag Credit
Alternative: Actual Pay 2015 (Revised)
SUBURBAN RAMSEY CO.
Tax Base
Total Tax Capacity
(-) TIF Tax Capacity
(-) FD Contrib Tax Cap
(=) Taxable Tax Capacity
14,191
34,312
201,976
250,479
12,784
34,520
219,002
266,306
-1,407
208
17,026
15,827
FD Distrib Tax Cap 27,647 28,131 484
6.3
-9.9
0.6
8.4
1.7
Baseline Alternative Change Chng
Pctg
Tax Rates
County
City/Town
School District
Special District
63.72
34.97
27.41
10.68
Total 136.78
58.75
33.40
26.10
9.99
128.25
0.000
1.028
22.747
0.000
23.775
0.000
0.802
22.290
0.000
23.091
Base Alter Base Alter
Net Tax Cap (Pctg) Ref Mkt Val
Baseline Alternative Change Chng Base
Effective
Tax Rates
AlteChngBaseline Alternative Change
Market Value Net TaxTax Burdens by
Pctg PctgProperty Class
Res Hmstd: exist 13,036,624 14,124,991 1,088,367 8.3 191,553 198,237 6,684 3.5 1.47 1.40
Res Non-Hm: exis 1,467,607 1,653,588 185,982 12.7 24,039 25,424 1,386 5.8 1.64 1.54
Miscellaneous 91,186 90,613 -573 -0.6 1,864 1,747 -117 -6.3 2.04 1.93
Apartments: exis 1,317,644 1,379,495 61,851 4.7 26,223 25,922 -301 -1.1 1.99 1.88
Low-inc Apts: ex 263,035 273,198 10,163 3.9 3,289 3,161 -127 -3.9 1.25 1.16
Seasnl Rec: exis 10,827 8,960 -1,866 -17.2 169 131 -38 -22.5 1.56 1.46
Com/Ind: Lo: exi 341,666 336,736 -4,930 -1.4 11,047 10,483 -564 -5.1 3.23 3.11
Com/Ind Hi: exis 4,369,366 4,326,124 -43,241 -1.0 185,531 177,017 -8,514 -4.6 4.25 4.09
Publ U: Elec Gen 0 0 0 0.0 0 0 0 0.0 0.00 0.00
Publ U: Other 202,277 214,526 12,249 6.1 8,531 8,716 185 2.2 4.22 4.06
Ag HGA: Exist 853 853 0 0.0 13 12 -1 -6.9 1.49 1.39
Ag Hmstd Land 986 1,027 41 4.1 5 5 0 0.7 0.47 0.45
Ag Non-Hmstd 21,753 21,313 -439 -2.0 273 247 -27 -9.7 1.26 1.16
ResHmstd: NewCon 0 56,696 56,696 0.0 0 788 788 0.0 0.00 1.39
All other NewCon 0 85,346 85,346 0.0 0 2,466 2,466 0.0 0.00 2.89
Total 21,123,824 22,573,469 1,449,645 452,536 454,356 1,8206.9 0.4 2.14 2.01
Baseline Alternative Baseline Alternative
Tax Burdens on
Chng Chng
Pctg Pctg
Change Base Alter
Tax Rates
Effective
Value
Estimated Market Net TaxHypothetical Properties
Res Hmstd: Lo Val 136,800 148,200 1,855 1,9368.3 81 4.4 1.36 1.31
Res Hmstd: Avg Val 205,100 222,200 3,036 3,1428.3 106 3.5 1.48 1.41
Res Hmstd: Hi Val 273,500 296,300 4,219 4,3498.3 130 3.1 1.54 1.47
Res Hmstd: Ex-Hi Val 410,300 444,600 6,583 6,7298.4 145 2.2 1.60 1.51
Apartment 300,000 298,100 5,843 5,467-0.6 -375 -6.4 1.95 1.83
Comm/Ind: Lo Val 150,000 147,800 4,816 4,573-1.5 -243 -5.0 3.21 3.09
Comm/Ind: Med Val 300,000 295,700 11,119 10,540-1.4 -578 -5.2 3.71 3.56
Comm/Ind: Hi Val 1,000,000 985,600 40,530 38,471-1.4 -2,059 -5.1 4.05 3.90
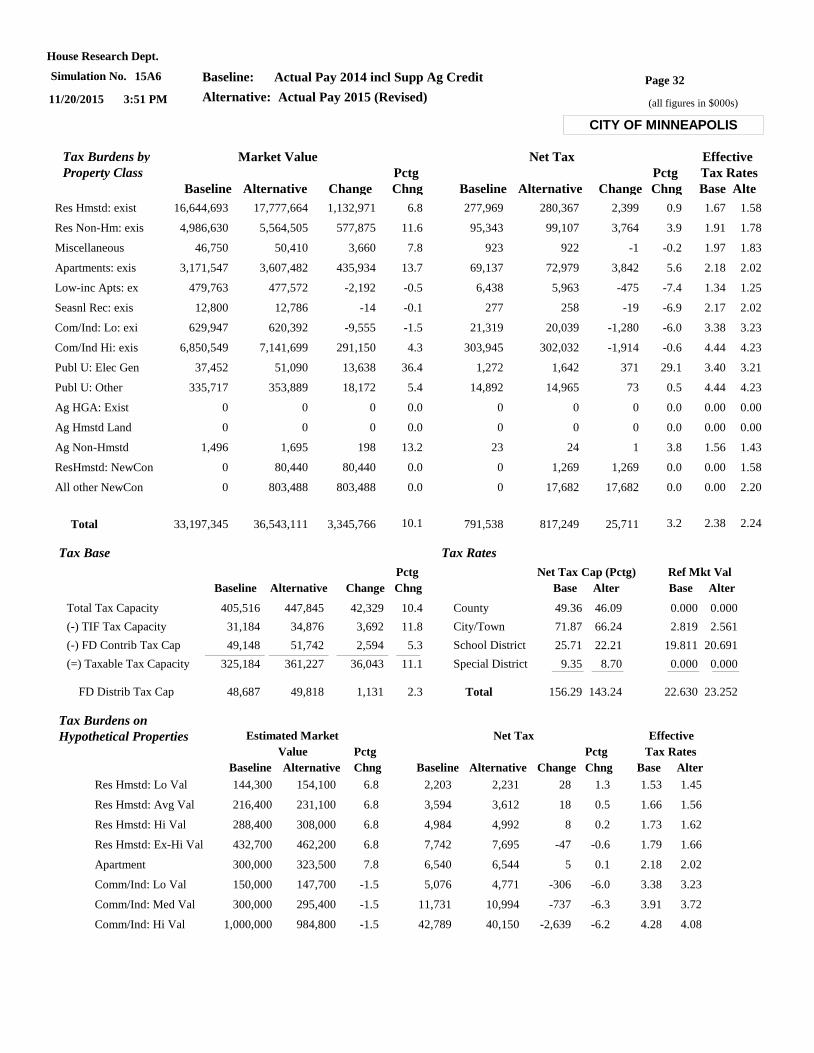
Page 32
(all figures in $000s)
House Research Dept.
11/20/2015 3:51 PM
Simulation No. 15A6 Baseline: Actual Pay 2014 incl Supp Ag Credit
Alternative: Actual Pay 2015 (Revised)
CITY OF MINNEAPOLIS
Tax Base
Total Tax Capacity
(-) TIF Tax Capacity
(-) FD Contrib Tax Cap
(=) Taxable Tax Capacity
31,184
49,148
325,184
405,516
34,876
51,742
361,227
447,845
3,692
2,594
36,043
42,329
FD Distrib Tax Cap 48,687 49,818 1,131
10.4
11.8
5.3
11.1
2.3
Baseline Alternative Change Chng
Pctg
Tax Rates
County
City/Town
School District
Special District
49.36
71.87
25.71
9.35
Total 156.29
46.09
66.24
22.21
8.70
143.24
0.000
2.819
19.811
0.000
22.630
0.000
2.561
20.691
0.000
23.252
Base Alter Base Alter
Net Tax Cap (Pctg) Ref Mkt Val
Baseline Alternative Change Chng Base
Effective
Tax Rates
AlteChngBaseline Alternative Change
Market Value Net TaxTax Burdens by
Pctg PctgProperty Class
Res Hmstd: exist 16,644,693 17,777,664 1,132,971 6.8 277,969 280,367 2,399 0.9 1.67 1.58
Res Non-Hm: exis 4,986,630 5,564,505 577,875 11.6 95,343 99,107 3,764 3.9 1.91 1.78
Miscellaneous 46,750 50,410 3,660 7.8 923 922 -1 -0.2 1.97 1.83
Apartments: exis 3,171,547 3,607,482 435,934 13.7 69,137 72,979 3,842 5.6 2.18 2.02
Low-inc Apts: ex 479,763 477,572 -2,192 -0.5 6,438 5,963 -475 -7.4 1.34 1.25
Seasnl Rec: exis 12,800 12,786 -14 -0.1 277 258 -19 -6.9 2.17 2.02
Com/Ind: Lo: exi 629,947 620,392 -9,555 -1.5 21,319 20,039 -1,280 -6.0 3.38 3.23
Com/Ind Hi: exis 6,850,549 7,141,699 291,150 4.3 303,945 302,032 -1,914 -0.6 4.44 4.23
Publ U: Elec Gen 37,452 51,090 13,638 36.4 1,272 1,642 371 29.1 3.40 3.21
Publ U: Other 335,717 353,889 18,172 5.4 14,892 14,965 73 0.5 4.44 4.23
Ag HGA: Exist 0 0 0 0.0 0 0 0 0.0 0.00 0.00
Ag Hmstd Land 0 0 0 0.0 0 0 0 0.0 0.00 0.00
Ag Non-Hmstd 1,496 1,695 198 13.2 23 24 1 3.8 1.56 1.43
ResHmstd: NewCon 0 80,440 80,440 0.0 0 1,269 1,269 0.0 0.00 1.58
All other NewCon 0 803,488 803,488 0.0 0 17,682 17,682 0.0 0.00 2.20
Total 33,197,345 36,543,111 3,345,766 791,538 817,249 25,71110.1 3.2 2.38 2.24
Baseline Alternative Baseline Alternative
Tax Burdens on
Chng Chng
Pctg Pctg
Change Base Alter
Tax Rates
Effective
Value
Estimated Market Net TaxHypothetical Properties
Res Hmstd: Lo Val 144,300 154,100 2,203 2,2316.8 28 1.3 1.53 1.45
Res Hmstd: Avg Val 216,400 231,100 3,594 3,6126.8 18 0.5 1.66 1.56
Res Hmstd: Hi Val 288,400 308,000 4,984 4,9926.8 8 0.2 1.73 1.62
Res Hmstd: Ex-Hi Val 432,700 462,200 7,742 7,6956.8 -47 -0.6 1.79 1.66
Apartment 300,000 323,500 6,540 6,5447.8 5 0.1 2.18 2.02
Comm/Ind: Lo Val 150,000 147,700 5,076 4,771-1.5 -306 -6.0 3.38 3.23
Comm/Ind: Med Val 300,000 295,400 11,731 10,994-1.5 -737 -6.3 3.91 3.72
Comm/Ind: Hi Val 1,000,000 984,800 42,789 40,150-1.5 -2,639 -6.2 4.28 4.08
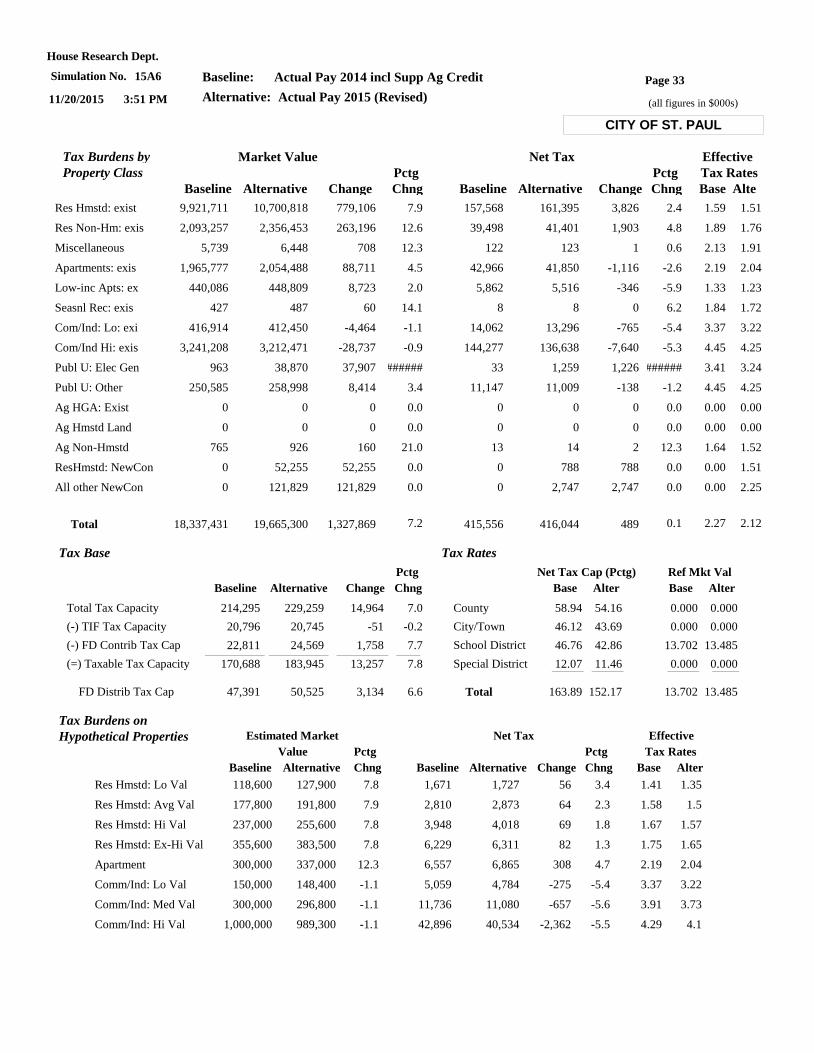
Page 33
(all figures in $000s)
House Research Dept.
11/20/2015 3:51 PM
Simulation No. 15A6 Baseline: Actual Pay 2014 incl Supp Ag Credit
Alternative: Actual Pay 2015 (Revised)
CITY OF ST. PAUL
Tax Base
Total Tax Capacity
(-) TIF Tax Capacity
(-) FD Contrib Tax Cap
(=) Taxable Tax Capacity
20,796
22,811
170,688
214,295
20,745
24,569
183,945
229,259
-51
1,758
13,257
14,964
FD Distrib Tax Cap 47,391 50,525 3,134
7.0
-0.2
7.7
7.8
6.6
Baseline Alternative Change Chng
Pctg
Tax Rates
County
City/Town
School District
Special District
58.94
46.12
46.76
12.07
Total 163.89
54.16
43.69
42.86
11.46
152.17
0.000
0.000
13.702
0.000
13.702
0.000
0.000
13.485
0.000
13.485
Base Alter Base Alter
Net Tax Cap (Pctg) Ref Mkt Val
Baseline Alternative Change Chng Base
Effective
Tax Rates
AlteChngBaseline Alternative Change
Market Value Net TaxTax Burdens by
Pctg PctgProperty Class
Res Hmstd: exist 9,921,711 10,700,818 779,106 7.9 157,568 161,395 3,826 2.4 1.59 1.51
Res Non-Hm: exis 2,093,257 2,356,453 263,196 12.6 39,498 41,401 1,903 4.8 1.89 1.76
Miscellaneous 5,739 6,448 708 12.3 122 123 1 0.6 2.13 1.91
Apartments: exis 1,965,777 2,054,488 88,711 4.5 42,966 41,850 -1,116 -2.6 2.19 2.04
Low-inc Apts: ex 440,086 448,809 8,723 2.0 5,862 5,516 -346 -5.9 1.33 1.23
Seasnl Rec: exis 427 487 60 14.1 8 8 0 6.2 1.84 1.72
Com/Ind: Lo: exi 416,914 412,450 -4,464 -1.1 14,062 13,296 -765 -5.4 3.37 3.22
Com/Ind Hi: exis 3,241,208 3,212,471 -28,737 -0.9 144,277 136,638 -7,640 -5.3 4.45 4.25
Publ U: Elec Gen 963 38,870 37,907 ###### 33 1,259 1,226 ###### 3.41 3.24
Publ U: Other 250,585 258,998 8,414 3.4 11,147 11,009 -138 -1.2 4.45 4.25
Ag HGA: Exist 0 0 0 0.0 0 0 0 0.0 0.00 0.00
Ag Hmstd Land 0 0 0 0.0 0 0 0 0.0 0.00 0.00
Ag Non-Hmstd 765 926 160 21.0 13 14 2 12.3 1.64 1.52
ResHmstd: NewCon 0 52,255 52,255 0.0 0 788 788 0.0 0.00 1.51
All other NewCon 0 121,829 121,829 0.0 0 2,747 2,747 0.0 0.00 2.25
Total 18,337,431 19,665,300 1,327,869 415,556 416,044 4897.2 0.1 2.27 2.12
Baseline Alternative Baseline Alternative
Tax Burdens on
Chng Chng
Pctg Pctg
Change Base Alter
Tax Rates
Effective
Value
Estimated Market Net TaxHypothetical Properties
Res Hmstd: Lo Val 118,600 127,900 1,671 1,7277.8 56 3.4 1.41 1.35
Res Hmstd: Avg Val 177,800 191,800 2,810 2,8737.9 64 2.3 1.58 1.5
Res Hmstd: Hi Val 237,000 255,600 3,948 4,0187.8 69 1.8 1.67 1.57
Res Hmstd: Ex-Hi Val 355,600 383,500 6,229 6,3117.8 82 1.3 1.75 1.65
Apartment 300,000 337,000 6,557 6,86512.3 308 4.7 2.19 2.04
Comm/Ind: Lo Val 150,000 148,400 5,059 4,784-1.1 -275 -5.4 3.37 3.22
Comm/Ind: Med Val 300,000 296,800 11,736 11,080-1.1 -657 -5.6 3.91 3.73
Comm/Ind: Hi Val 1,000,000 989,300 42,896 40,534-1.1 -2,362 -5.5 4.29 4.1
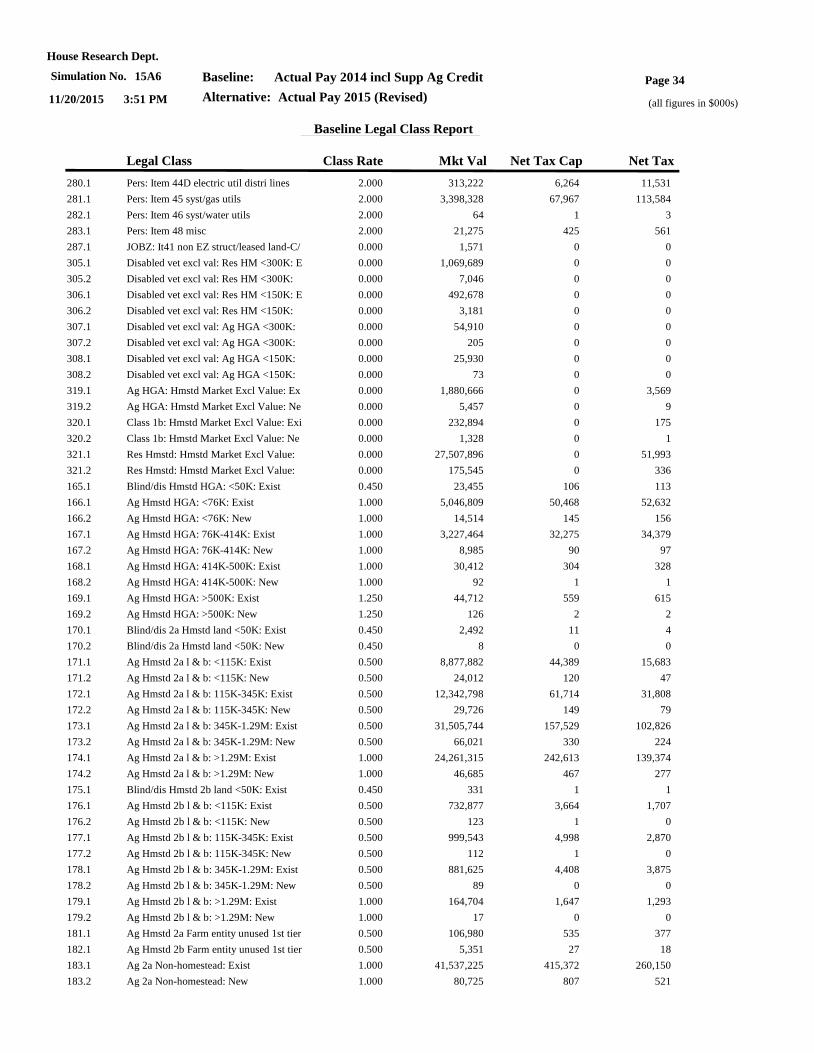
Page 34
(all figures in $000s)
House Research Dept.
11/20/2015 3:51 PM
Simulation No. 15A6 Baseline: Actual Pay 2014 incl Supp Ag Credit
Alternative: Actual Pay 2015 (Revised)
Baseline Legal Class Report
Legal Class Class Rate Mkt Val Net Tax Cap Net Tax
280.1 Pers: Item 44D electric util distri lines 2.000 313,222 6,264 11,531
281.1 Pers: Item 45 syst/gas utils 2.000 3,398,328 67,967 113,584
282.1 Pers: Item 46 syst/water utils 2.000 64 1 3
283.1 Pers: Item 48 misc 2.000 21,275 425 561
287.1 JOBZ: It41 non EZ struct/leased land-C/ 0.000 1,571 0 0
305.1 Disabled vet excl val: Res HM <300K: E 0.000 1,069,689 0 0
305.2 Disabled vet excl val: Res HM <300K: 0.000 7,046 0 0
306.1 Disabled vet excl val: Res HM <150K: E 0.000 492,678 0 0
306.2 Disabled vet excl val: Res HM <150K: 0.000 3,181 0 0
307.1 Disabled vet excl val: Ag HGA <300K: 0.000 54,910 0 0
307.2 Disabled vet excl val: Ag HGA <300K: 0.000 205 0 0
308.1 Disabled vet excl val: Ag HGA <150K: 0.000 25,930 0 0
308.2 Disabled vet excl val: Ag HGA <150K: 0.000 73 0 0
319.1 Ag HGA: Hmstd Market Excl Value: Ex 0.000 1,880,666 0 3,569
319.2 Ag HGA: Hmstd Market Excl Value: Ne 0.000 5,457 0 9
320.1 Class 1b: Hmstd Market Excl Value: Exi 0.000 232,894 0 175
320.2 Class 1b: Hmstd Market Excl Value: Ne 0.000 1,328 0 1
321.1 Res Hmstd: Hmstd Market Excl Value: 0.000 27,507,896 0 51,993
321.2 Res Hmstd: Hmstd Market Excl Value: 0.000 175,545 0 336
165.1 Blind/dis Hmstd HGA: <50K: Exist 0.450 23,455 106 113
166.1 Ag Hmstd HGA: <76K: Exist 1.000 5,046,809 50,468 52,632
166.2 Ag Hmstd HGA: <76K: New 1.000 14,514 145 156
167.1 Ag Hmstd HGA: 76K-414K: Exist 1.000 3,227,464 32,275 34,379
167.2 Ag Hmstd HGA: 76K-414K: New 1.000 8,985 90 97
168.1 Ag Hmstd HGA: 414K-500K: Exist 1.000 30,412 304 328
168.2 Ag Hmstd HGA: 414K-500K: New 1.000 92 1 1
169.1 Ag Hmstd HGA: >500K: Exist 1.250 44,712 559 615
169.2 Ag Hmstd HGA: >500K: New 1.250 126 2 2
170.1 Blind/dis 2a Hmstd land <50K: Exist 0.450 2,492 11 4
170.2 Blind/dis 2a Hmstd land <50K: New 0.450 8 0 0
171.1 Ag Hmstd 2a l & b: <115K: Exist 0.500 8,877,882 44,389 15,683
171.2 Ag Hmstd 2a l & b: <115K: New 0.500 24,012 120 47
172.1 Ag Hmstd 2a l & b: 115K-345K: Exist 0.500 12,342,798 61,714 31,808
172.2 Ag Hmstd 2a l & b: 115K-345K: New 0.500 29,726 149 79
173.1 Ag Hmstd 2a l & b: 345K-1.29M: Exist 0.500 31,505,744 157,529 102,826
173.2 Ag Hmstd 2a l & b: 345K-1.29M: New 0.500 66,021 330 224
174.1 Ag Hmstd 2a l & b: >1.29M: Exist 1.000 24,261,315 242,613 139,374
174.2 Ag Hmstd 2a l & b: >1.29M: New 1.000 46,685 467 277
175.1 Blind/dis Hmstd 2b land <50K: Exist 0.450 331 1 1
176.1 Ag Hmstd 2b l & b: <115K: Exist 0.500 732,877 3,664 1,707
176.2 Ag Hmstd 2b l & b: <115K: New 0.500 123 1 0
177.1 Ag Hmstd 2b l & b: 115K-345K: Exist 0.500 999,543 4,998 2,870
177.2 Ag Hmstd 2b l & b: 115K-345K: New 0.500 112 1 0
178.1 Ag Hmstd 2b l & b: 345K-1.29M: Exist 0.500 881,625 4,408 3,875
178.2 Ag Hmstd 2b l & b: 345K-1.29M: New 0.500 89 0 0
179.1 Ag Hmstd 2b l & b: >1.29M: Exist 1.000 164,704 1,647 1,293
179.2 Ag Hmstd 2b l & b: >1.29M: New 1.000 17 0 0
181.1 Ag Hmstd 2a Farm entity unused 1st tier 0.500 106,980 535 377
182.1 Ag Hmstd 2b Farm entity unused 1st tier 0.500 5,351 27 18
183.1 Ag 2a Non-homestead: Exist 1.000 41,537,225 415,372 260,150
183.2 Ag 2a Non-homestead: New 1.000 80,725 807 521
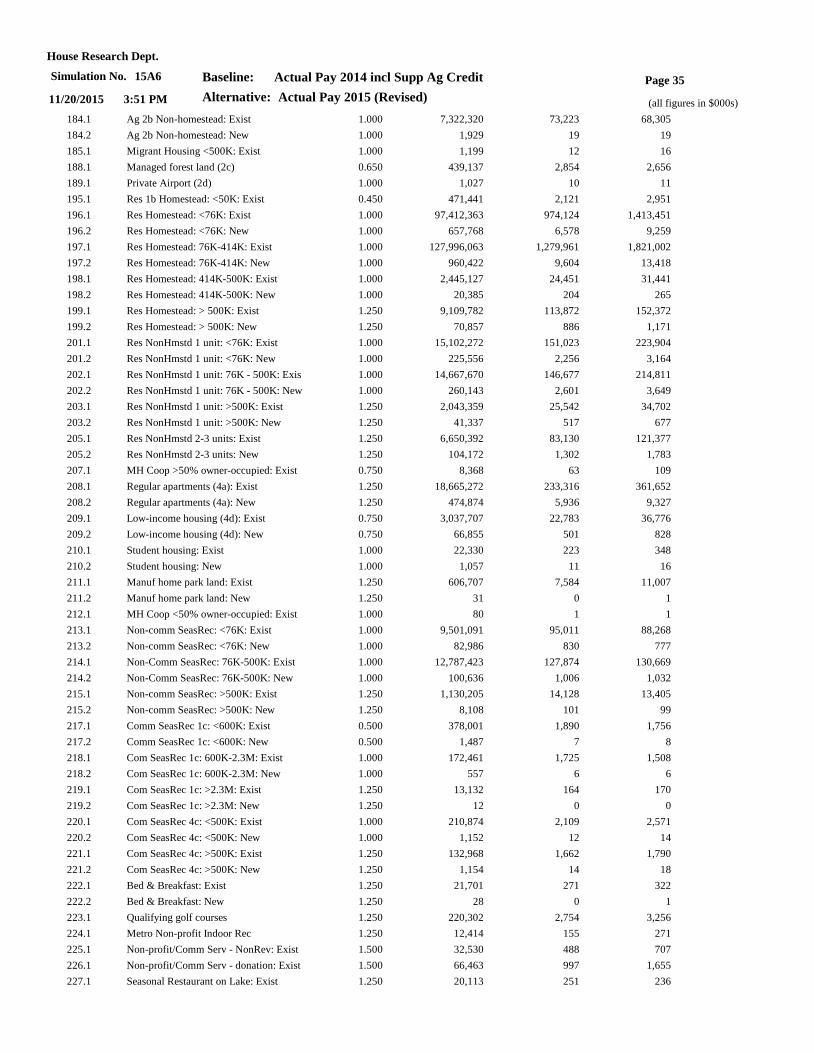
Page 35
(all figures in $000s)
House Research Dept.
11/20/2015 3:51 PM
Simulation No. 15A6 Baseline: Actual Pay 2014 incl Supp Ag Credit
Alternative: Actual Pay 2015 (Revised)
184.1 Ag 2b Non-homestead: Exist 1.000 7,322,320 73,223 68,305
184.2 Ag 2b Non-homestead: New 1.000 1,929 19 19
185.1 Migrant Housing <500K: Exist 1.000 1,199 12 16
188.1 Managed forest land (2c) 0.650 439,137 2,854 2,656
189.1 Private Airport (2d) 1.000 1,027 10 11
195.1 Res 1b Homestead: <50K: Exist 0.450 471,441 2,121 2,951
196.1 Res Homestead: <76K: Exist 1.000 97,412,363 974,124 1,413,451
196.2 Res Homestead: <76K: New 1.000 657,768 6,578 9,259
197.1 Res Homestead: 76K-414K: Exist 1.000 127,996,063 1,279,961 1,821,002
197.2 Res Homestead: 76K-414K: New 1.000 960,422 9,604 13,418
198.1 Res Homestead: 414K-500K: Exist 1.000 2,445,127 24,451 31,441
198.2 Res Homestead: 414K-500K: New 1.000 20,385 204 265
199.1 Res Homestead: > 500K: Exist 1.250 9,109,782 113,872 152,372
199.2 Res Homestead: > 500K: New 1.250 70,857 886 1,171
201.1 Res NonHmstd 1 unit: <76K: Exist 1.000 15,102,272 151,023 223,904
201.2 Res NonHmstd 1 unit: <76K: New 1.000 225,556 2,256 3,164
202.1 Res NonHmstd 1 unit: 76K - 500K: Exis 1.000 14,667,670 146,677 214,811
202.2 Res NonHmstd 1 unit: 76K - 500K: New 1.000 260,143 2,601 3,649
203.1 Res NonHmstd 1 unit: >500K: Exist 1.250 2,043,359 25,542 34,702
203.2 Res NonHmstd 1 unit: >500K: New 1.250 41,337 517 677
205.1 Res NonHmstd 2-3 units: Exist 1.250 6,650,392 83,130 121,377
205.2 Res NonHmstd 2-3 units: New 1.250 104,172 1,302 1,783
207.1 MH Coop >50% owner-occupied: Exist 0.750 8,368 63 109
208.1 Regular apartments (4a): Exist 1.250 18,665,272 233,316 361,652
208.2 Regular apartments (4a): New 1.250 474,874 5,936 9,327
209.1 Low-income housing (4d): Exist 0.750 3,037,707 22,783 36,776
209.2 Low-income housing (4d): New 0.750 66,855 501 828
210.1 Student housing: Exist 1.000 22,330 223 348
210.2 Student housing: New 1.000 1,057 11 16
211.1 Manuf home park land: Exist 1.250 606,707 7,584 11,007
211.2 Manuf home park land: New 1.250 31 0 1
212.1 MH Coop <50% owner-occupied: Exist 1.000 80 1 1
213.1 Non-comm SeasRec: <76K: Exist 1.000 9,501,091 95,011 88,268
213.2 Non-comm SeasRec: <76K: New 1.000 82,986 830 777
214.1 Non-Comm SeasRec: 76K-500K: Exist 1.000 12,787,423 127,874 130,669
214.2 Non-Comm SeasRec: 76K-500K: New 1.000 100,636 1,006 1,032
215.1 Non-comm SeasRec: >500K: Exist 1.250 1,130,205 14,128 13,405
215.2 Non-comm SeasRec: >500K: New 1.250 8,108 101 99
217.1 Comm SeasRec 1c: <600K: Exist 0.500 378,001 1,890 1,756
217.2 Comm SeasRec 1c: <600K: New 0.500 1,487 7 8
218.1 Com SeasRec 1c: 600K-2.3M: Exist 1.000 172,461 1,725 1,508
218.2 Com SeasRec 1c: 600K-2.3M: New 1.000 557 6 6
219.1 Com SeasRec 1c: >2.3M: Exist 1.250 13,132 164 170
219.2 Com SeasRec 1c: >2.3M: New 1.250 12 0 0
220.1 Com SeasRec 4c: <500K: Exist 1.000 210,874 2,109 2,571
220.2 Com SeasRec 4c: <500K: New 1.000 1,152 12 14
221.1 Com SeasRec 4c: >500K: Exist 1.250 132,968 1,662 1,790
221.2 Com SeasRec 4c: >500K: New 1.250 1,154 14 18
222.1 Bed & Breakfast: Exist 1.250 21,701 271 322
222.2 Bed & Breakfast: New 1.250 28 0 1
223.1 Qualifying golf courses 1.250 220,302 2,754 3,256
224.1 Metro Non-profit Indoor Rec 1.250 12,414 155 271
225.1 Non-profit/Comm Serv - NonRev: Exist 1.500 32,530 488 707
226.1 Non-profit/Comm Serv - donation: Exist 1.500 66,463 997 1,655
227.1 Seasonal Restaurant on Lake: Exist 1.250 20,113 251 236
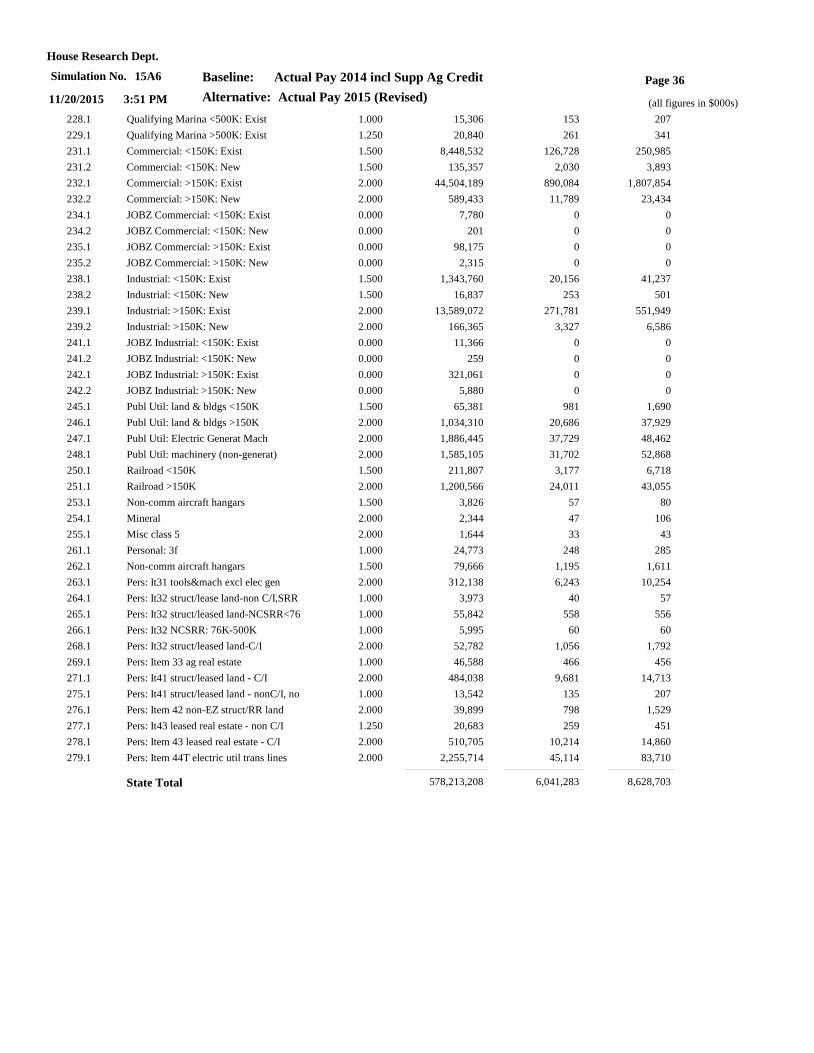
Page 36
(all figures in $000s)
House Research Dept.
11/20/2015 3:51 PM
Simulation No. 15A6 Baseline: Actual Pay 2014 incl Supp Ag Credit
Alternative: Actual Pay 2015 (Revised)
228.1 Qualifying Marina <500K: Exist 1.000 15,306 153 207
229.1 Qualifying Marina >500K: Exist 1.250 20,840 261 341
231.1 Commercial: <150K: Exist 1.500 8,448,532 126,728 250,985
231.2 Commercial: <150K: New 1.500 135,357 2,030 3,893
232.1 Commercial: >150K: Exist 2.000 44,504,189 890,084 1,807,854
232.2 Commercial: >150K: New 2.000 589,433 11,789 23,434
234.1 JOBZ Commercial: <150K: Exist 0.000 7,780 0 0
234.2 JOBZ Commercial: <150K: New 0.000 201 0 0
235.1 JOBZ Commercial: >150K: Exist 0.000 98,175 0 0
235.2 JOBZ Commercial: >150K: New 0.000 2,315 0 0
238.1 Industrial: <150K: Exist 1.500 1,343,760 20,156 41,237
238.2 Industrial: <150K: New 1.500 16,837 253 501
239.1 Industrial: >150K: Exist 2.000 13,589,072 271,781 551,949
239.2 Industrial: >150K: New 2.000 166,365 3,327 6,586
241.1 JOBZ Industrial: <150K: Exist 0.000 11,366 0 0
241.2 JOBZ Industrial: <150K: New 0.000 259 0 0
242.1 JOBZ Industrial: >150K: Exist 0.000 321,061 0 0
242.2 JOBZ Industrial: >150K: New 0.000 5,880 0 0
245.1 Publ Util: land & bldgs <150K 1.500 65,381 981 1,690
246.1 Publ Util: land & bldgs >150K 2.000 1,034,310 20,686 37,929
247.1 Publ Util: Electric Generat Mach 2.000 1,886,445 37,729 48,462
248.1 Publ Util: machinery (non-generat) 2.000 1,585,105 31,702 52,868
250.1 Railroad <150K 1.500 211,807 3,177 6,718
251.1 Railroad >150K 2.000 1,200,566 24,011 43,055
253.1 Non-comm aircraft hangars 1.500 3,826 57 80
254.1 Mineral 2.000 2,344 47 106
255.1 Misc class 5 2.000 1,644 33 43
261.1 Personal: 3f 1.000 24,773 248 285
262.1 Non-comm aircraft hangars 1.500 79,666 1,195 1,611
263.1 Pers: It31 tools&mach excl elec gen 2.000 312,138 6,243 10,254
264.1 Pers: It32 struct/lease land-non C/I,SRR 1.000 3,973 40 57
265.1 Pers: It32 struct/leased land-NCSRR<76 1.000 55,842 558 556
266.1 Pers: It32 NCSRR: 76K-500K 1.000 5,995 60 60
268.1 Pers: It32 struct/leased land-C/I 2.000 52,782 1,056 1,792
269.1 Pers: Item 33 ag real estate 1.000 46,588 466 456
271.1 Pers: It41 struct/leased land - C/I 2.000 484,038 9,681 14,713
275.1 Pers: It41 struct/leased land - nonC/I, no 1.000 13,542 135 207
276.1 Pers: Item 42 non-EZ struct/RR land 2.000 39,899 798 1,529
277.1 Pers: It43 leased real estate - non C/I 1.250 20,683 259 451
278.1 Pers: Item 43 leased real estate - C/I 2.000 510,705 10,214 14,860
279.1 Pers: Item 44T electric util trans lines 2.000 2,255,714 45,114 83,710
State Total 578,213,208 6,041,283 8,628,703
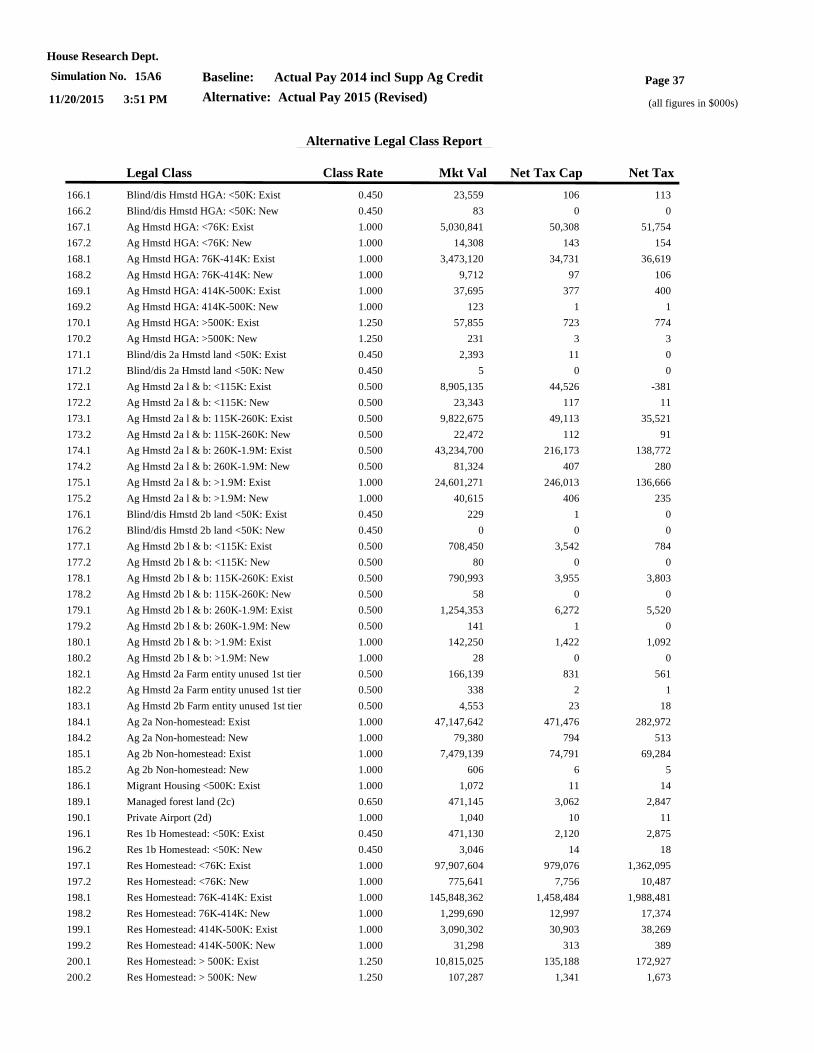
Page 37
(all figures in $000s)
House Research Dept.
11/20/2015 3:51 PM
Simulation No. 15A6 Baseline: Actual Pay 2014 incl Supp Ag Credit
Alternative: Actual Pay 2015 (Revised)
Alternative Legal Class Report
Legal Class Class Rate Mkt Val Net Tax Cap Net Tax
166.1 Blind/dis Hmstd HGA: <50K: Exist 0.450 23,559 106 113
166.2 Blind/dis Hmstd HGA: <50K: New 0.450 83 0 0
167.1 Ag Hmstd HGA: <76K: Exist 1.000 5,030,841 50,308 51,754
167.2 Ag Hmstd HGA: <76K: New 1.000 14,308 143 154
168.1 Ag Hmstd HGA: 76K-414K: Exist 1.000 3,473,120 34,731 36,619
168.2 Ag Hmstd HGA: 76K-414K: New 1.000 9,712 97 106
169.1 Ag Hmstd HGA: 414K-500K: Exist 1.000 37,695 377 400
169.2 Ag Hmstd HGA: 414K-500K: New 1.000 123 1 1
170.1 Ag Hmstd HGA: >500K: Exist 1.250 57,855 723 774
170.2 Ag Hmstd HGA: >500K: New 1.250 231 3 3
171.1 Blind/dis 2a Hmstd land <50K: Exist 0.450 2,393 11 0
171.2 Blind/dis 2a Hmstd land <50K: New 0.450 5 0 0
172.1 Ag Hmstd 2a l & b: <115K: Exist 0.500 8,905,135 44,526 -381
172.2 Ag Hmstd 2a l & b: <115K: New 0.500 23,343 117 11
173.1 Ag Hmstd 2a l & b: 115K-260K: Exist 0.500 9,822,675 49,113 35,521
173.2 Ag Hmstd 2a l & b: 115K-260K: New 0.500 22,472 112 91
174.1 Ag Hmstd 2a l & b: 260K-1.9M: Exist 0.500 43,234,700 216,173 138,772
174.2 Ag Hmstd 2a l & b: 260K-1.9M: New 0.500 81,324 407 280
175.1 Ag Hmstd 2a l & b: >1.9M: Exist 1.000 24,601,271 246,013 136,666
175.2 Ag Hmstd 2a l & b: >1.9M: New 1.000 40,615 406 235
176.1 Blind/dis Hmstd 2b land <50K: Exist 0.450 229 1 0
176.2 Blind/dis Hmstd 2b land <50K: New 0.450 0 0 0
177.1 Ag Hmstd 2b l & b: <115K: Exist 0.500 708,450 3,542 784
177.2 Ag Hmstd 2b l & b: <115K: New 0.500 80 0 0
178.1 Ag Hmstd 2b l & b: 115K-260K: Exist 0.500 790,993 3,955 3,803
178.2 Ag Hmstd 2b l & b: 115K-260K: New 0.500 58 0 0
179.1 Ag Hmstd 2b l & b: 260K-1.9M: Exist 0.500 1,254,353 6,272 5,520
179.2 Ag Hmstd 2b l & b: 260K-1.9M: New 0.500 141 1 0
180.1 Ag Hmstd 2b l & b: >1.9M: Exist 1.000 142,250 1,422 1,092
180.2 Ag Hmstd 2b l & b: >1.9M: New 1.000 28 0 0
182.1 Ag Hmstd 2a Farm entity unused 1st tier 0.500 166,139 831 561
182.2 Ag Hmstd 2a Farm entity unused 1st tier 0.500 338 2 1
183.1 Ag Hmstd 2b Farm entity unused 1st tier 0.500 4,553 23 18
184.1 Ag 2a Non-homestead: Exist 1.000 47,147,642 471,476 282,972
184.2 Ag 2a Non-homestead: New 1.000 79,380 794 513
185.1 Ag 2b Non-homestead: Exist 1.000 7,479,139 74,791 69,284
185.2 Ag 2b Non-homestead: New 1.000 606 6 5
186.1 Migrant Housing <500K: Exist 1.000 1,072 11 14
189.1 Managed forest land (2c) 0.650 471,145 3,062 2,847
190.1 Private Airport (2d) 1.000 1,040 10 11
196.1 Res 1b Homestead: <50K: Exist 0.450 471,130 2,120 2,875
196.2 Res 1b Homestead: <50K: New 0.450 3,046 14 18
197.1 Res Homestead: <76K: Exist 1.000 97,907,604 979,076 1,362,095
197.2 Res Homestead: <76K: New 1.000 775,641 7,756 10,487
198.1 Res Homestead: 76K-414K: Exist 1.000 145,848,362 1,458,484 1,988,481
198.2 Res Homestead: 76K-414K: New 1.000 1,299,690 12,997 17,374
199.1 Res Homestead: 414K-500K: Exist 1.000 3,090,302 30,903 38,269
199.2 Res Homestead: 414K-500K: New 1.000 31,298 313 389
200.1 Res Homestead: > 500K: Exist 1.250 10,815,025 135,188 172,927
200.2 Res Homestead: > 500K: New 1.250 107,287 1,341 1,673
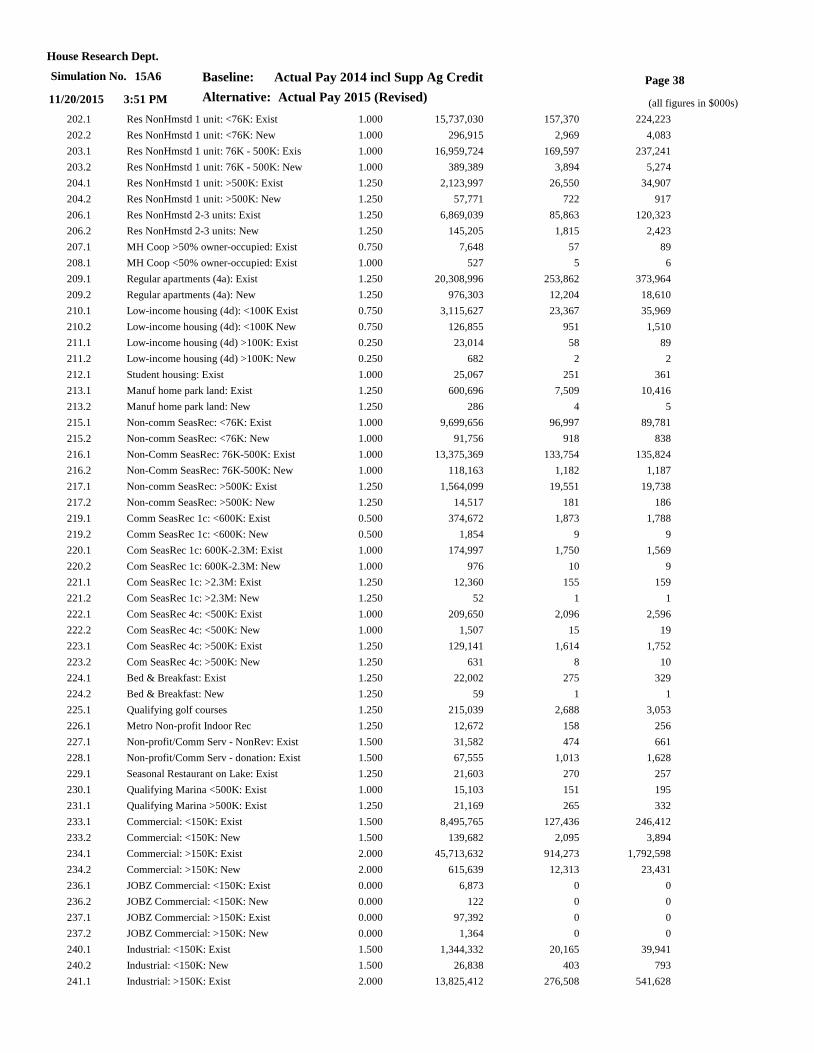
Page 38
(all figures in $000s)
House Research Dept.
11/20/2015 3:51 PM
Simulation No. 15A6 Baseline: Actual Pay 2014 incl Supp Ag Credit
Alternative: Actual Pay 2015 (Revised)
202.1 Res NonHmstd 1 unit: <76K: Exist 1.000 15,737,030 157,370 224,223
202.2 Res NonHmstd 1 unit: <76K: New 1.000 296,915 2,969 4,083
203.1 Res NonHmstd 1 unit: 76K - 500K: Exis 1.000 16,959,724 169,597 237,241
203.2 Res NonHmstd 1 unit: 76K - 500K: New 1.000 389,389 3,894 5,274
204.1 Res NonHmstd 1 unit: >500K: Exist 1.250 2,123,997 26,550 34,907
204.2 Res NonHmstd 1 unit: >500K: New 1.250 57,771 722 917
206.1 Res NonHmstd 2-3 units: Exist 1.250 6,869,039 85,863 120,323
206.2 Res NonHmstd 2-3 units: New 1.250 145,205 1,815 2,423
207.1 MH Coop >50% owner-occupied: Exist 0.750 7,648 57 89
208.1 MH Coop <50% owner-occupied: Exist 1.000 527 5 6
209.1 Regular apartments (4a): Exist 1.250 20,308,996 253,862 373,964
209.2 Regular apartments (4a): New 1.250 976,303 12,204 18,610
210.1 Low-income housing (4d): <100K Exist 0.750 3,115,627 23,367 35,969
210.2 Low-income housing (4d): <100K New 0.750 126,855 951 1,510
211.1 Low-income housing (4d) >100K: Exist 0.250 23,014 58 89
211.2 Low-income housing (4d) >100K: New 0.250 682 2 2
212.1 Student housing: Exist 1.000 25,067 251 361
213.1 Manuf home park land: Exist 1.250 600,696 7,509 10,416
213.2 Manuf home park land: New 1.250 286 4 5
215.1 Non-comm SeasRec: <76K: Exist 1.000 9,699,656 96,997 89,781
215.2 Non-comm SeasRec: <76K: New 1.000 91,756 918 838
216.1 Non-Comm SeasRec: 76K-500K: Exist 1.000 13,375,369 133,754 135,824
216.2 Non-Comm SeasRec: 76K-500K: New 1.000 118,163 1,182 1,187
217.1 Non-comm SeasRec: >500K: Exist 1.250 1,564,099 19,551 19,738
217.2 Non-comm SeasRec: >500K: New 1.250 14,517 181 186
219.1 Comm SeasRec 1c: <600K: Exist 0.500 374,672 1,873 1,788
219.2 Comm SeasRec 1c: <600K: New 0.500 1,854 9 9
220.1 Com SeasRec 1c: 600K-2.3M: Exist 1.000 174,997 1,750 1,569
220.2 Com SeasRec 1c: 600K-2.3M: New 1.000 976 10 9
221.1 Com SeasRec 1c: >2.3M: Exist 1.250 12,360 155 159
221.2 Com SeasRec 1c: >2.3M: New 1.250 52 1 1
222.1 Com SeasRec 4c: <500K: Exist 1.000 209,650 2,096 2,596
222.2 Com SeasRec 4c: <500K: New 1.000 1,507 15 19
223.1 Com SeasRec 4c: >500K: Exist 1.250 129,141 1,614 1,752
223.2 Com SeasRec 4c: >500K: New 1.250 631 8 10
224.1 Bed & Breakfast: Exist 1.250 22,002 275 329
224.2 Bed & Breakfast: New 1.250 59 1 1
225.1 Qualifying golf courses 1.250 215,039 2,688 3,053
226.1 Metro Non-profit Indoor Rec 1.250 12,672 158 256
227.1 Non-profit/Comm Serv - NonRev: Exist 1.500 31,582 474 661
228.1 Non-profit/Comm Serv - donation: Exist 1.500 67,555 1,013 1,628
229.1 Seasonal Restaurant on Lake: Exist 1.250 21,603 270 257
230.1 Qualifying Marina <500K: Exist 1.000 15,103 151 195
231.1 Qualifying Marina >500K: Exist 1.250 21,169 265 332
233.1 Commercial: <150K: Exist 1.500 8,495,765 127,436 246,412
233.2 Commercial: <150K: New 1.500 139,682 2,095 3,894
234.1 Commercial: >150K: Exist 2.000 45,713,632 914,273 1,792,598
234.2 Commercial: >150K: New 2.000 615,639 12,313 23,431
236.1 JOBZ Commercial: <150K: Exist 0.000 6,873 0 0
236.2 JOBZ Commercial: <150K: New 0.000 122 0 0
237.1 JOBZ Commercial: >150K: Exist 0.000 97,392 0 0
237.2 JOBZ Commercial: >150K: New 0.000 1,364 0 0
240.1 Industrial: <150K: Exist 1.500 1,344,332 20,165 39,941
240.2 Industrial: <150K: New 1.500 26,838 403 793
241.1 Industrial: >150K: Exist 2.000 13,825,412 276,508 541,628
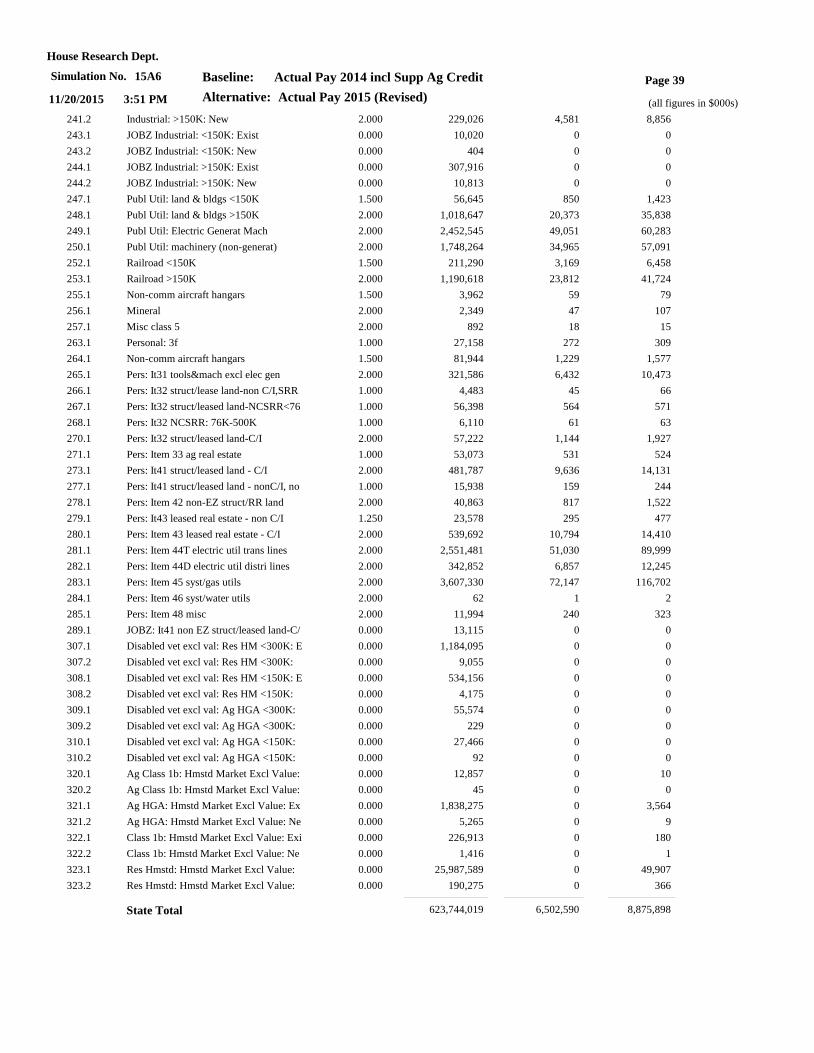
Page 39
(all figures in $000s)
House Research Dept.
11/20/2015 3:51 PM
Simulation No. 15A6 Baseline: Actual Pay 2014 incl Supp Ag Credit
Alternative: Actual Pay 2015 (Revised)
241.2 Industrial: >150K: New 2.000 229,026 4,581 8,856
243.1 JOBZ Industrial: <150K: Exist 0.000 10,020 0 0
243.2 JOBZ Industrial: <150K: New 0.000 404 0 0
244.1 JOBZ Industrial: >150K: Exist 0.000 307,916 0 0
244.2 JOBZ Industrial: >150K: New 0.000 10,813 0 0
247.1 Publ Util: land & bldgs <150K 1.500 56,645 850 1,423
248.1 Publ Util: land & bldgs >150K 2.000 1,018,647 20,373 35,838
249.1 Publ Util: Electric Generat Mach 2.000 2,452,545 49,051 60,283
250.1 Publ Util: machinery (non-generat) 2.000 1,748,264 34,965 57,091
252.1 Railroad <150K 1.500 211,290 3,169 6,458
253.1 Railroad >150K 2.000 1,190,618 23,812 41,724
255.1 Non-comm aircraft hangars 1.500 3,962 59 79
256.1 Mineral 2.000 2,349 47 107
257.1 Misc class 5 2.000 892 18 15
263.1 Personal: 3f 1.000 27,158 272 309
264.1 Non-comm aircraft hangars 1.500 81,944 1,229 1,577
265.1 Pers: It31 tools&mach excl elec gen 2.000 321,586 6,432 10,473
266.1 Pers: It32 struct/lease land-non C/I,SRR 1.000 4,483 45 66
267.1 Pers: It32 struct/leased land-NCSRR<76 1.000 56,398 564 571
268.1 Pers: It32 NCSRR: 76K-500K 1.000 6,110 61 63
270.1 Pers: It32 struct/leased land-C/I 2.000 57,222 1,144 1,927
271.1 Pers: Item 33 ag real estate 1.000 53,073 531 524
273.1 Pers: It41 struct/leased land - C/I 2.000 481,787 9,636 14,131
277.1 Pers: It41 struct/leased land - nonC/I, no 1.000 15,938 159 244
278.1 Pers: Item 42 non-EZ struct/RR land 2.000 40,863 817 1,522
279.1 Pers: It43 leased real estate - non C/I 1.250 23,578 295 477
280.1 Pers: Item 43 leased real estate - C/I 2.000 539,692 10,794 14,410
281.1 Pers: Item 44T electric util trans lines 2.000 2,551,481 51,030 89,999
282.1 Pers: Item 44D electric util distri lines 2.000 342,852 6,857 12,245
283.1 Pers: Item 45 syst/gas utils 2.000 3,607,330 72,147 116,702
284.1 Pers: Item 46 syst/water utils 2.000 62 1 2
285.1 Pers: Item 48 misc 2.000 11,994 240 323
289.1 JOBZ: It41 non EZ struct/leased land-C/ 0.000 13,115 0 0
307.1 Disabled vet excl val: Res HM <300K: E 0.000 1,184,095 0 0
307.2 Disabled vet excl val: Res HM <300K: 0.000 9,055 0 0
308.1 Disabled vet excl val: Res HM <150K: E 0.000 534,156 0 0
308.2 Disabled vet excl val: Res HM <150K: 0.000 4,175 0 0
309.1 Disabled vet excl val: Ag HGA <300K: 0.000 55,574 0 0
309.2 Disabled vet excl val: Ag HGA <300K: 0.000 229 0 0
310.1 Disabled vet excl val: Ag HGA <150K: 0.000 27,466 0 0
310.2 Disabled vet excl val: Ag HGA <150K: 0.000 92 0 0
320.1 Ag Class 1b: Hmstd Market Excl Value: 0.000 12,857 0 10
320.2 Ag Class 1b: Hmstd Market Excl Value: 0.000 45 0 0
321.1 Ag HGA: Hmstd Market Excl Value: Ex 0.000 1,838,275 0 3,564
321.2 Ag HGA: Hmstd Market Excl Value: Ne 0.000 5,265 0 9
322.1 Class 1b: Hmstd Market Excl Value: Exi 0.000 226,913 0 180
322.2 Class 1b: Hmstd Market Excl Value: Ne 0.000 1,416 0 1
323.1 Res Hmstd: Hmstd Market Excl Value: 0.000 25,987,589 0 49,907
323.2 Res Hmstd: Hmstd Market Excl Value: 0.000 190,275 0 366
State Total 623,744,019 6,502,590 8,875,898
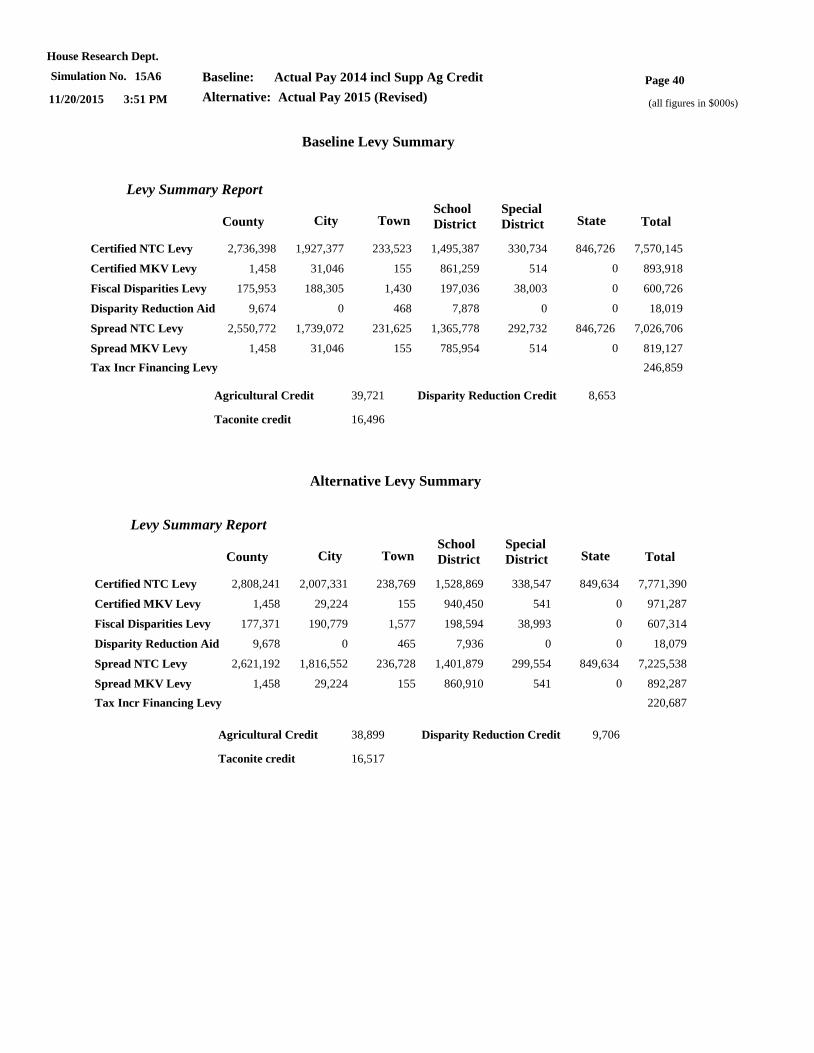
Page 40
(all figures in $000s)
House Research Dept.
11/20/2015 3:51 PM
Simulation No. 15A6 Baseline: Actual Pay 2014 incl Supp Ag Credit
Alternative: Actual Pay 2015 (Revised)
Baseline Levy Summary
Alternative Levy Summary
2,550,772 1,739,072 231,625 1,365,778 292,732 846,726
1,458 31,046 155 785,954 514
175,953 188,305 1,430 197,036 38,003
9,674 0 468 7,878 0
39,721
16,496
8,653
Spread NTC Levy
Spread MKV Levy
Fiscal Disparities Levy
Disparity Reduction Aid
County City TownSchool
District
Special
District State Total
7,026,706
819,127
600,726
18,019
1,458 31,046 155 861,259 514Certified MKV Levy 893,918
Certified NTC Levy 2,736,398 1,927,377 233,523 1,495,387 330,734 846,726 7,570,145
0
0
0
0
Agricultural Credit
Taconite credit
Disparity Reduction Credit
Levy Summary Report
Tax Incr Financing Levy 246,859
2,621,192 1,816,552 236,728 1,401,879 299,554 849,634
1,458 29,224 155 860,910 541
177,371 190,779 1,577 198,594 38,993
9,678 0 465 7,936 0
38,899
16,517
9,706
Spread NTC Levy
Spread MKV Levy
Fiscal Disparities Levy
Disparity Reduction Aid
County City TownSchool
District
Special
District State Total
7,225,538
892,287
607,314
18,079
1,458 29,224 155 940,450 541Certified MKV Levy 971,287
Certified NTC Levy 2,808,241 2,007,331 238,769 1,528,869 338,547 849,634 7,771,390
0
0
0
0
Agricultural Credit
Taconite credit
Disparity Reduction Credit
Levy Summary Report
Tax Incr Financing Levy 220,687