Embed Size (px)
Citation preview

1
Gradual Climate Change or Gradual Climate Change or ““Tipping PointsTipping Points”” in in the System?the System?
Carlos A NobreChair, International Geosphere-Biosphere Programme (IGBP)
and National Institute for Space Research (INPE) of Brazil
Hotspots for GEC research: aprimary focus of IGBP research

2
The global conveyor beltThe global conveyor belt
Source: Roger Braithwaite, University of Manchester (UK)
Surface Melt on Greenland happening Surface Melt on Greenland happening much faster than expectedmuch faster than expected
70 meters thinning in 5 years
Satellite-era record melt of 2002 was exceeded in 2005.Source: Waleed Abdalati, Goddard Space Flight Center
Increasing concern about ice-sheet stability and a substantially larger rise in sea level• Surface melting
For sustained warmings above 4.5±0.9 C in Greenland (3.1±0.8 C in global average), it is likely that the ice sheet would eventually be eliminated. [Gregory and Huybrechts, accepted]
• Dynamic instability

3
Focus on Amazonia
Environmental Changes in Amazonia and the Environmental Changes in Amazonia and the Hypothesis of Hypothesis of ‘‘SavannizationSavannization’’
“Climate Change and the Fate of the Amazon”Oxford University, UK – 20-22 March 2007
Carlos A Nobre, Marcos Oyama, Manoel Cardoso, Gilvan Sampaio, Luis Salazar, David Lapola, and Marcos Costa
Slide courtesy: IPAM
4
Is vegetation distribution a fingerprint of climate ?or
Does vegetation distribution influenceand participate to climate (state and changes) ?
Does vegetation matter for the Earth System ?
Does vegetation matter for the Earth System ?
• The impacts of human activity on the Amazon rainforest could result in the collapse of large portions of the rainforest and significant loss of biodiversity within 30 to 50 years.
• A comparison is made with similar events in the Saharan ecosystem, which was once a region of richer vegetation, before its abrupt collapse about 6000 years ago

5
Kleidon et al. (2000)
Remove vegetation from the continents
large changes will happen in the water cycle
Land=desert Land=forest
ATMOSPHERE
OCEANS CONTINENTS37 000 km3
421 000 km3 464 000 km3 71 000 km3 31 000 km3
28 000 km3
137 000 km3 108 000 km3410 000 km3 443 000 km3
(figure taken from Kabat et al.: Vegetation, Water, Humans, and the Climate, IGBP BAHC)
Vegetation partitions net radiation into more latent and less sensible heat

6
The ecosystems of Amazonia are subjected to a suite of environmental drivers of change
LUCC
FireClimateChange
ClimateExtremes
The Hypothesis of ‘Savannization’
• Nobre et al. (1991) proposed that a post-deforestation climate in Southern Amazonia would be warmer, drier and with longer dry season, typical of the climate envelope of the tropical savanna (Cerrado) domain of Central South America.
• ‘Savannization’ in this context is a statement on regional climate change and not intended to describe complex ecological processes of vegetation replacement.

7
Biomes of tropical south America and precipitation seasonality
Sombroek 2001, Ambio
Number of consecutive months with less than 50 mm rainfall
Annual Rainfall
Biomes of Brazil
The importance of rainfall seasonality
(short dry season) for maintaining tropical
forests all over Amazonia
Tropical Forest Shrubland
Savanna
Tropical Forest-SavannaBoundary
Evapotranspirationseasonality in the Amazon tropical forest and savannaSource: Rocha (2004)
Cerrado s.s. SP
Floresta trop RO
Floresta trop Manaus
Floresta trop Santarém
Forest
Savanna
Forest
Savanna
Late
ntH
eatf
lux
(W m
-2)
Net
Rad
iatio
n(W
m-2
)
mm
day-1
8
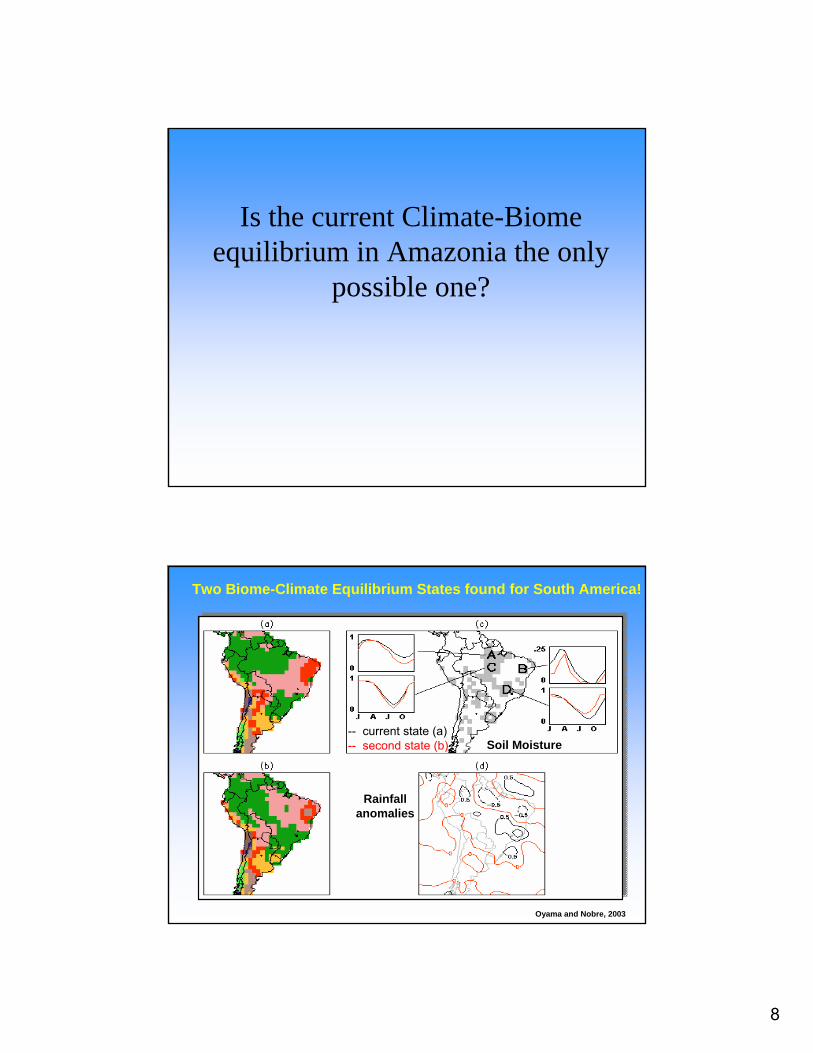
Is the current Climate-Biome equilibrium in Amazonia the only
possible one?
Oyama and Nobre, 2003
Two Biome-Climate Equilibrium States found for South America!
Soil Moisture
Rainfallanomalies
-- current state (a)-- second state (b)
9
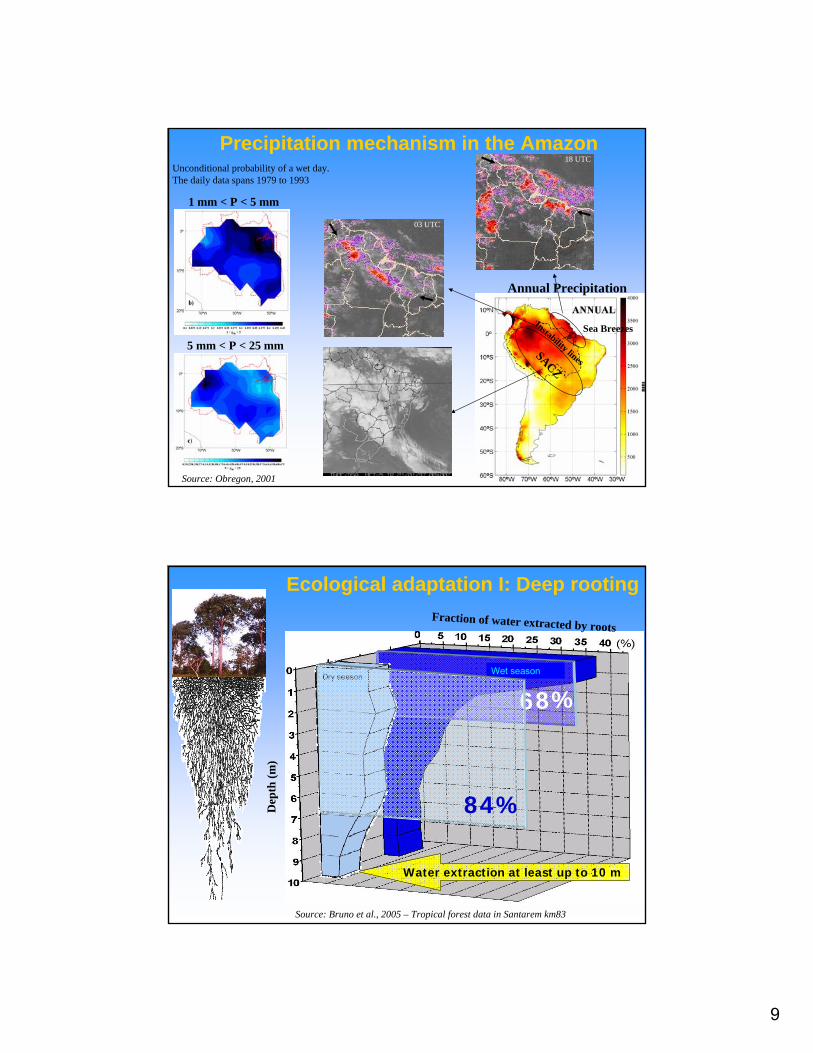
Source: Obregon, 2001
1 mm < P < 5 mm
SACZ
Sea BreezesInstability lines
Annual Precipitation
Unconditional probability of a wet day. The daily data spans 1979 to 1993
5 mm < P < 25 mm
Precipitation mechanism in the Amazon18 UTC
03 UTC
Water extraction at least up to 10 m
68%
Source: Bruno et al., 2005 – Tropical forest data in Santarem km83
Ecological adaptation I: Deep rooting
Wet seasonDry season
84%
Fraction of water extracted by roots
Dep
th (m
)

10
+: water flow to the plant-: water flow away from the plant
a
b
bb c
c
a
Sap
-flow
vel
ocity
a
Before rain
rain
c
After rain
b
Daytime
Source: R. Oliveira
Source: Oliveira et al., 2005
Ecological adaptation II: Hydraulic redistribution
Externally driven equilibrium change

11
Does climate variability (severe droughts) play the key role linking together climate change, edaphic factors, and human use factors?
In 2006, total deforested area (clear-cutting) is 650,000 km2 in Brazilian Amazonia (17%)
Source: Greenpeace/Daniel Beltra
Resilience Stochastic Perturbations Gradual Perturbationsaffect Resilience(e.g., deforestation, fire, Fragmentation, global warming, etc.)
I - LAND COVER CHANGE
DEFORESTATION AND BURNING AROUND THE XINGU INDIGENOUS PARK, MATO GROSSO STATE, BRAZIL, 2004.Source: Tropical deforestation and climate change / edited by Paulo Moutinho and Stephan
Schwartzman. -- IPAM - Instituto de Pesquisa Ambiental da Amazônia, 2005.
12
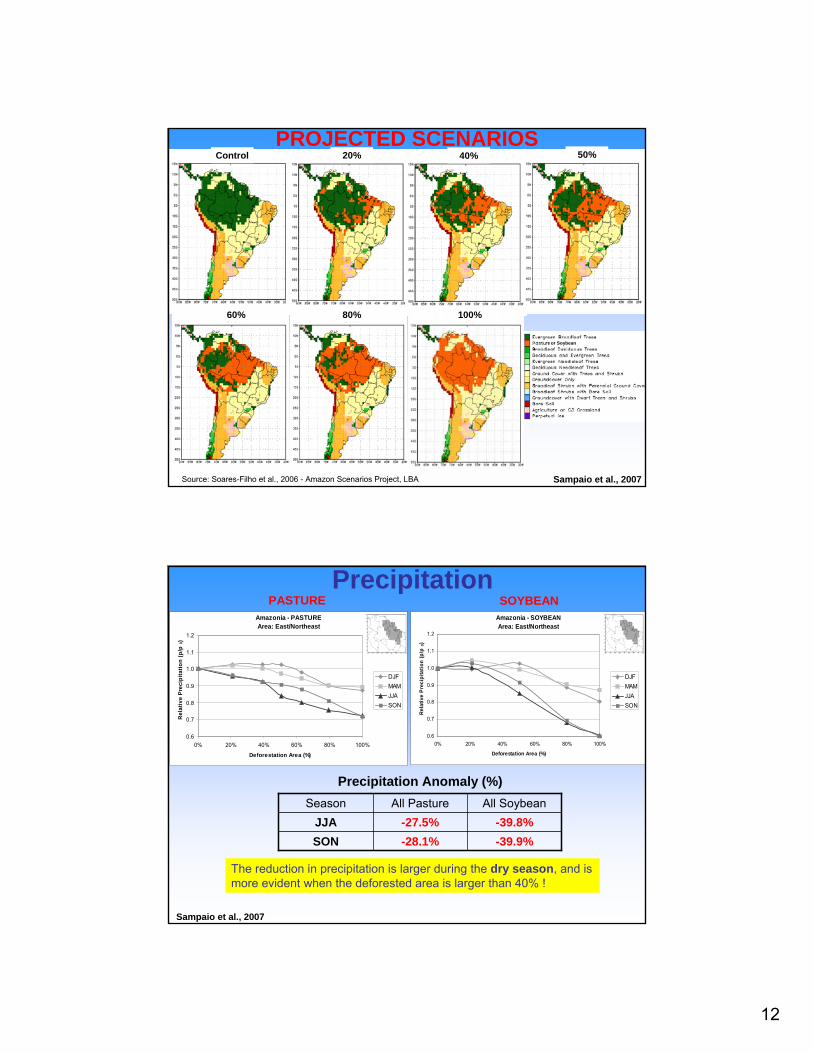
PROJECTED SCENARIOSControl 20% 40% 50%
60% 80% 100%
or Soybean
Source: Soares-Filho et al., 2006 - Amazon Scenarios Project, LBA Sampaio et al., 2007
-28.1%-27.5%
All Pasture-39.8%JJA-39.9%SON
All SoybeanSeason
PrecipitationAmazonia - PASTUREArea: East/Northeast
0.6
0.7
0.8
0.9
1.0
1.1
1.2
0% 20% 40% 60% 80% 100%
Deforestation Area (%)
Rel
ativ
e Pr
ecip
itatio
n (p
/p0)
DJFMAMJJASON
Amazonia - SOYBEANArea: East/Northeast
0.6
0.7
0.8
0.9
1.0
1.1
1.2
0% 20% 40% 60% 80% 100%
Deforestation Area (%)
Rela
tive
Prec
ipita
tion
(p/p
0)
DJFMAMJJASON
PASTURE SOYBEAN
Precipitation Anomaly (%)
Sampaio et al., 2007
The reduction in precipitation is larger during the dry season, and is more evident when the deforested area is larger than 40% !
13
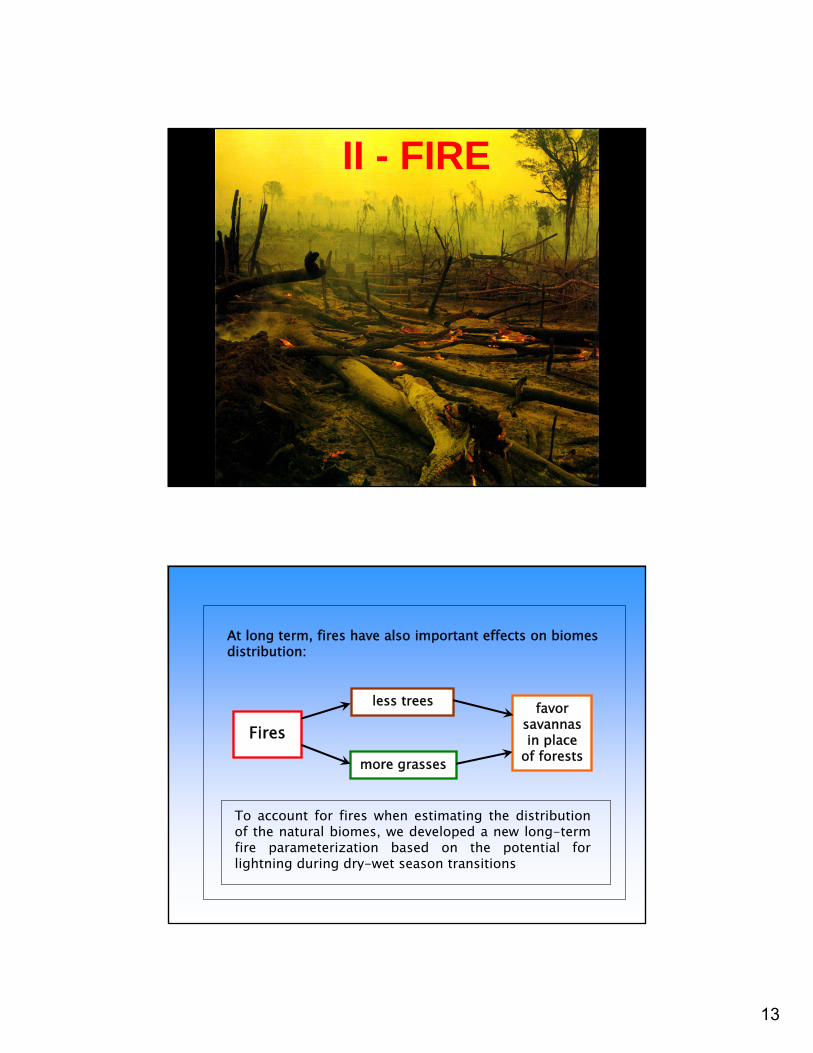
II - FIRE
Fires
less trees
more grasses
favor savannas in place
of forests
At long term, fires have also important effects on biomes distribution:
To account for fires when estimating the distribution of the natural biomes, we developed a new long-term fire parameterization based on the potential for lightning during dry-wet season transitions

14
Cardoso et al. (2007), in review
The new long-term natural fires parameterization is based on major circulation patterns:
Average Intra-annual varianceLong-term characteristics of the zonal wind
The potential for lightning/fires in the tropics is higher were combined long-term average and intra-annual variance of the zonal wind is lower than 3.5 m3/s3 (in grey):
↓light./fire pot.↑ light./fire pot.
Cardoso et al. (2007), in review
Impact of using the new fire parameterization in the biome estimates of the CPTEC Potential Vegetation Model:
Accounting for fires corrected important differences between previous model estimates and reference data for the position of natural savannas in the tropics. In specific, large areas in India and SE Asia that were initially estimated as savannas are now corrected to dry forests.
Major vegetation types:(1) broadleaf-evergreen trees (tropical forest), (2) broadleaf-deciduous trees (temperate forest)(3) broadleaf and needleleaf trees (mixed forest)(4) needleleaf-evergreen trees (boreal forest)(5) needleleaf-deciduous trees (larch), (6) broadleaf trees with groundcover (savanna)(7) groundcover only (prairie, steppes)(8) broadleaf shrubs with perennial groundcover (caatinga)(9) broadleaf shrubs with bare soil (semi-desert)(10) dwarf trees and shrubs with groundcover (tundra)(11) bare soil (desert)(13) ice.

15
Car
valh
o et
al.
(200
1)
Land use
Dry season
At year-decade time scales, the majority of fires in Amazonia occur during the dry season as a result of land use
Total prec. index
Dist. main roads index
Prob
. fire
Model
Data
Using remote-sensing fire data, we found new statistical relations between precipitation and distance to main roads, which are the major drivers for yearly-decade fire activity in the region:
Satellite fire data
Precipitation observations
Road maps
Cardoso et al. (2003, 2007)

16
III - CLIMATE EXTREMES
The impact of droughts
(A) Observed drought frequency (% years); (B) distribution of savanna, transitional vegetation, andforest across the legal Brazilian Amazon; (C) Land area (1000 km2) of vegetation types for pixelswith given drought frequency (%), forest land area is multiplied by 0.1 for scaling; (D) percentattainment of the Nix [1983] criteria for savanna vegetation in the last 100 years.
ClimateClimate conditionsconditions for tropical for tropical savannassavannas ((NixNix 1983)1983)
Tmean > 24 C13 C < Tcoldest month < 18 CP(3 driest months) < 50 mmP(6 wettest months) > 600 mm1000 mm < Pannual < 1500 mm
Source: Hutyara et al, 2005
Vegetation vulnerabilityto droughts
Percent attainment of the Nix criteria [1983] forsavanna in the last 100 years

17
The Drought of Amazonia in 2005
Source: Dr. Virgílio Viana
Marengo et al. 2007

18
IV – GLOBAL WARMING
What are the likely biome changes in Tropical South America due to
Global Warming scenarios of climate change?
19
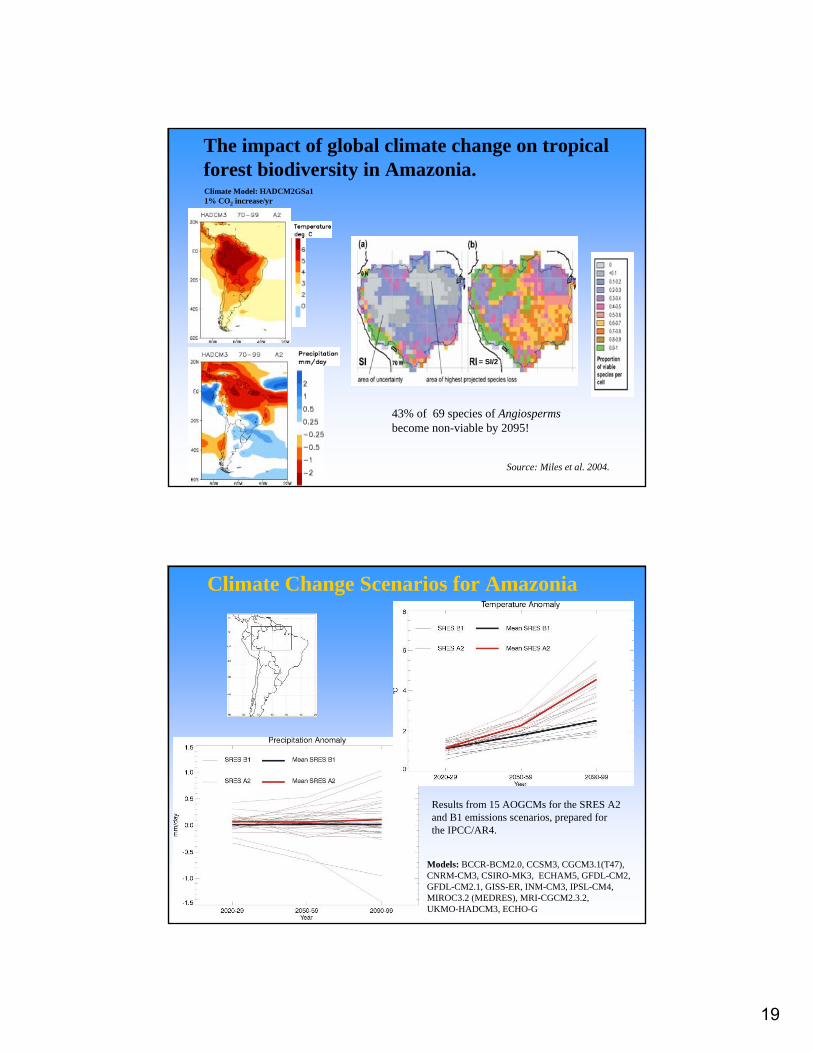
Source: Miles et al. 2004.
43% of 69 species of Angiospermsbecome non-viable by 2095!
Climate Model: HADCM2GSa11% CO2 increase/yr
The impact of global climate change on tropical forest biodiversity in Amazonia.
= SI/2
Climate Change Scenarios for Amazonia
Results from 15 AOGCMs for the SRES A2 and B1 emissions scenarios, prepared for the IPCC/AR4.
Models: BCCR-BCM2.0, CCSM3, CGCM3.1(T47), CNRM-CM3, CSIRO-MK3, ECHAM5, GFDL-CM2, GFDL-CM2.1, GISS-ER, INM-CM3, IPSL-CM4, MIROC3.2 (MEDRES), MRI-CGCM2.3.2, UKMO-HADCM3, ECHO-G
20
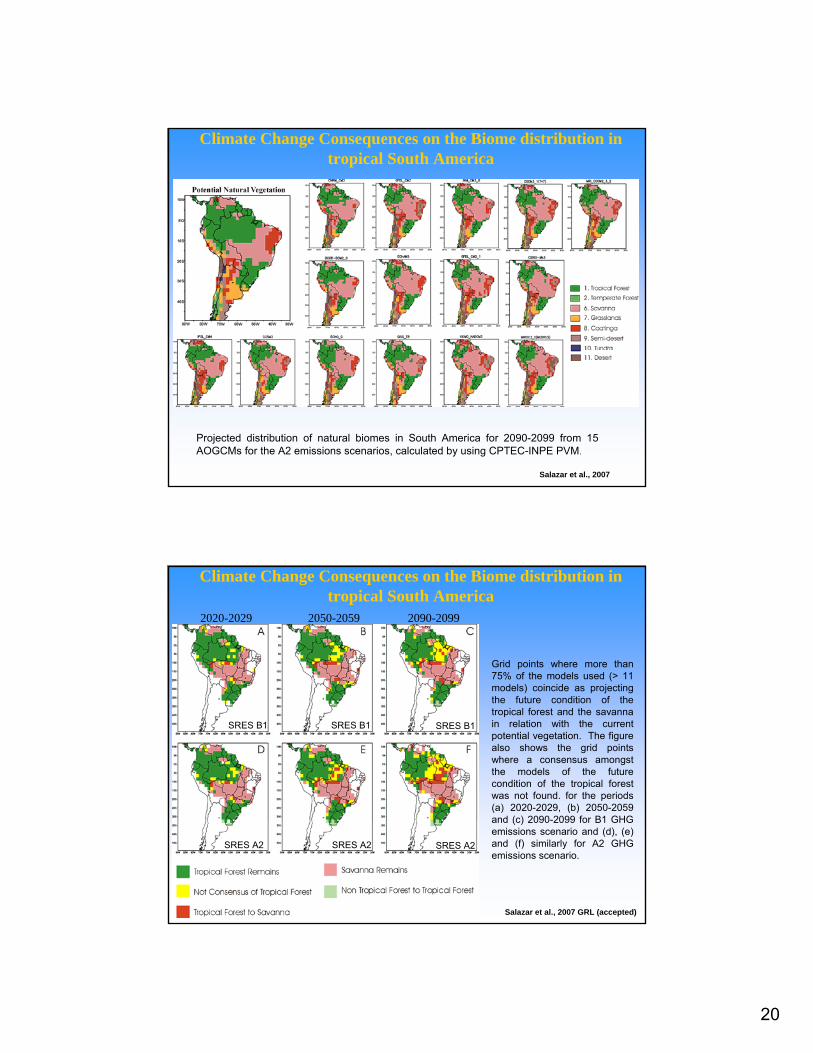
Projected distribution of natural biomes in South America for 2090-2099 from 15 AOGCMs for the A2 emissions scenarios, calculated by using CPTEC-INPE PVM.
Climate Change Consequences on the Biome distribution in tropical South America
Salazar et al., 2007
Grid points where more than 75% of the models used (> 11 models) coincide as projecting the future condition of the tropical forest and the savanna in relation with the current potential vegetation. The figure also shows the grid points where a consensus amongst the models of the future condition of the tropical forest was not found. for the periods (a) 2020-2029, (b) 2050-2059 and (c) 2090-2099 for B1 GHG emissions scenario and (d), (e) and (f) similarly for A2 GHG emissions scenario.
2050-2059 2090-20992020-2029
Salazar et al., 2007 GRL (accepted)
Climate Change Consequences on the Biome distribution in tropical South America
SRES B1 SRES B1 SRES B1
SRES A2 SRES A2 SRES A2

21
Percentage of the area where more than 75% of the experiments for the A2 GHG scenarios, coincide as projecting the permanence or disappearance of the current potential tropical forest, and where there is not a conclusive consensus amongst models
Salazar et al., 2007 GRL (accepted)
Climate Change Consequences on the Biome distribution in tropical South America
250 ppmv 180 ppmv 140 ppmv
450 ppmv 600 ppmv 850 ppmv
Currentpot veg
CPTEC-INPE PVM 2
Vegetation distribution underdifferent CO2 concentration scenarios
Lapola, 2007 MSc Thesis at INPE

22
Projected distribution of natural biomes in South America for 2090-2099 from 14 AOGCMsfor the A2 emissions scenarios, calculated by the CPTEC-INPE PVM with Carbon Cycle
Lapola, 2007, MSc Thesis at INPE
Conclusions The future of biome distribution in Amazonia in face
of land cover and climate changes
• Natural ecosystems in Amazonia have been under increasingland use change pressure.
• Tropical deforestation, global warming, increased forest fires and intense/more frequent droughts all act to reduce the resilience of the tropical forest.
• The synergistic combination of regional climate changescaused by both global warming and land cover change over the next several decades, exacerbated by increased drought and forest fire frequency, could tip the biome-climate state to a new stable equilibrium with ‘savannization’ of parts of Amazonia and catastrophic species losses.

23
The ethical dimensions of Global Environmental Change
There is an issue of ethics and justice: the people [and other forms of life] most likely to bear the brunt of Global Environmental Change are those who have contributed least to it
Historical contributions to CO2 emissions:
Europe 30%USA 28%China 8%
Amazonia 1% - 1.5%
THANK YOU!

24
-2°C -4°C -6°C
+2°C +4°C +6°C
Currentpot veg
CPTEC PVM 2
Vegetation distribution underdifferent annual mean temperature scenarios
Lapola et al., 2007
-0.2 -1.0 -3.0
+0.2 +1.0 +3.0
Currentpot veg
CPTEC PVM 2
Vegetation distribution underdifferent annual mean precipitation scenarios
(mm/day)
Lapola et al., 2007

25
Source: Oyama and Nobre, 2003
Two Biome-Climate Equilibrium States found for South America
Soil Moisture
Rainfallanomalies
-- current state (a)-- second state (b)
Current potential vegetation
Second StateResults of CPTEC-DBM Initial Conditions : desert
Savanna
Forest
Amazonia - PASTURE
0.6
0.7
0.8
0.9
1
1.1
1.2
0.0% 20.0% 40.0% 50.0% 60.0% 80.0% 100.0%
Deforestation Area (%)
Rel
ativ
e Pr
ecip
itatio
n
DJFMAMJJA
SON
Precipitation – all AmazoniaAmazonia - SOYBEAN
0.6
0.7
0.8
0.9
1.0
1.1
1.2
0.00% 20.00% 40.00% 60.00% 80.00% 100.00%
Deforestation Area (%)
Rel
ativ
e Pr
ecip
itatio
n
DJF
MAM
JJASON
-24.0%-15.7%JJA-13.7%
All Pasture
-22.0%JJAS
All SoybeanSeason
Precipitation Anomaly (%)
Sampaio et al., 2007

26
0.0
1.0
2.0
3.0
4.0
5.0
6.0
1990 19
9119
9219
9319
9419
9519
9619
9719
9819
9920
0020
0120
0220
03
met
ric to
ns o
f car
bon
per c
apita Brazil
ChinaFranceGermanyIndiaIndonesiaJapanRussian FederationUnited KingdomUnited States
CDIAC, 2006
Average per capitaGlobal CO2 emissions:1980 0.93 t C1999 1.04 t C
Per Capita Carbon Dioxide Emissions (1990-2003)
Is an equitable and sustainable ‘ecological footprint’ achievable?
Sampaio et al., 2007
Amazonia - PASTUREAmazonia - Pasture
Area: East/Northeast
y = -0.1451x2 - 0.0577x + 1.0084R2 = 0.9711
0.70
0.75
0.80
0.85
0.90
0.95
1.00
1.05
0% 10% 20% 30% 40% 50% 60% 70% 80% 90% 100%Deforested Area (%)
Rel
ativ
e pr
ecip
itatio
n (p
/p0)
member 1
member 2
member 3
member 4
member 5
average
Polynom(average)

27
Amazonia - SOYBEANArea: East/Northeast
y = -0.3149x2 + 0.0315x + 1.0102R2 = 0.9771
0.70
0.75
0.80
0.85
0.90
0.95
1.00
1.05
0% 20% 40% 60% 80% 100%
Deforested Area (%)
Rel
ativ
e Pr
ecip
itatio
n (p
/p0)
member 1
member 2
member 3
member 4
member 5
average
Polynom(average)
Amazonia - SOYBEAN
Sampaio et al., 2007