Embed Size (px)
Citation preview
Hotspot Detection of SPEC CPU 2006
Benchmarks with Performance Event Counters⋆
Qiang Wu, Oskar Mencer, Carlos Tavares, and Kubilay Atasu
Department of Computing, Imperial College London,South Kensington, London SW7 2AZ, UK
{qiangwu,oskar,ctavares,atasu}@doc.ic.ac.uk
http://comparch.doc.ic.ac.uk
Abstract. Hotspot is the part of a program where most execution timeis spent. Detecting the hotspot enables the optimization of the program.The performance event counters embedded in modern processors providethe hardware support for the hotspot detection. By sampling the instruc-tion addresses of the running program with performance event counters,hotspot of the program can be statistically detected. This technical re-port describes our tool to find the sections of the code that are detectedas the hotspot of the program with performance event counters. SPECCPU 2006 benchmarks are tested with our tool and the results show thehotspot sections and overhead of the hotspot detection tool.
Key words: hotspot detection, performance event counters, performanceengineering
1 Introduction
Performance engineering of software programs has been an active research topicfor years. The goal of performance engineering is to adapt the program to thearchitecture on which the program is executed in order to satisfy the performancerequirement at an acceptable cost[1]. To achieve the performance engineeringgoal, an insightful understanding of the dynamic characteristics of the originalprogram is needed. One of the dynamic characteristics is the hotspot of theprogram in execution, which is always the first thing one wants to know abouta program, since the hotspot is the part of the program where most of theexecution time is spent.
With the progress of the integrated circuits technology, most modern proces-sors are equipped with performance event counters which provide a low overheadfacility to investigate running programs[2][3][4][5][6]. The basic functionality pro-vided by the performance event counters is to count the events occured in thehardware microarchitecture, and if configured appropriately, they can issue aninterrupt when the count reaches some preset value or in another word, over-flow. In the interrupt handler of the performance event counter overflow, one can
⋆ This work is supported by EPSRC grant - Liquid Circuits: Automated DynamicHardware Acceleration of Compute-Intensive Applications
2 Qiang Wu, Oskar Mencer, Carlos Tavares and Kubilay Atasu
record the microarchitecture information available at the moment, such as theInstruction Pointer (IP) address, and other register or performance counter val-ues interested. With the information recorded in the performance event counteroverflow interrupts, we can get a statistical profile of the program’s execution be-havior. For instance, if we let the performance event counters count the unhaltedCPU clock cycles and issue an interrupt every ten million cycles, by analyzingthe collected IP addresses in the interrupts we can figure out which part in theprogram is most time-consuming, in a statistical manner. Nowadays most toolsutilizing the performance event couters support the IP recording or samplingfunctionality and are able to aggregate the counts of different IP addresses orto attribute the number of recorded IP addresses to the corresponding functionsand modules, resulting in a histogram of the IP addresses distributed among theprogram constructs[7][8][9][10][11].
The IP address histogram gives the performance engineers a hint to thehotspot of the program. However, relating the recorded IP addresses to the orig-inal program is a tedious work. Aggregating the counts of recorded IP addressesto corresponding functions or modules does help, but requires more processingand sometimes is not easy to carry out if the executalbe was built with littlesource information, which is the common case of operational programs. Sincethe hotspot of the program includes sequences of instructions instead of solitaryinstructions, it is not necessary to record each IP address in the statistical sam-pling. In this technical report, we propose to record the sections of the addressspace while smapling the IP addresses of the program. That is to say, we at-tribute the number of sampled IP addresses to the sections of the code in theprogram rather than split the number among different IP addresses or functionsand modules. By counting the number of IP addresses hitting in each section,we need not save all the IP addresses encountered in the sampling process as inthe IP address histogram case, nor we need demangle the function or moduleaddress regions as in the function or module histogram case, which we believewould be helpful to ease the workload of hotspot detection of the program. Maincontributions of our work are outlined as follows:
1. A method to record IP address sections when sampling the IP addresses ofthe running program.
2. A tool implementing the proposed method for Linux on X86-64 architecture.3. Preliminary experiments of the tool on SPEC CPU 2006 benchmarks.
The rest of the paper is organized to four sections. The next section describesthe method. Section 3 introduces the tool and its design, as well as a brief ofthe related framework for dynamic software acceleration. Section 4 shows theresults of the experiments on SPEC CPU 2006 benchmarks. Section 5 concludesthe paper with the brief of future plan.
2 Method
Our idea is to start from relative large sections of instruction addresses. If the hitcount of IP addresses in one section reaches some preset threshold in sampling
Hotspot Detection of SPEC CPU 2006 Benchmarks 3
process, we split the section into smaller ones and continue the process recursivelyuntil the size of the section is small enough for post-processing.
2.1 Section Tree
The splitting operation mentioned in above generates a tree of sections. Eachsection is a node in the tree. If a section is to be splitted, the resultant smallersections are regarded as the children of the original section, hence forming a tree.
Since the entire range of the possible address space is too big to begin with,especially for the AMD 64-bit platforms where the virtual address space canspan to 256 tera bytes, we start the splitting from a certain size smaller thanthe entire address space. From the orignal section, a tree will be built duringthe sampling process. These original sections are collected in a list as the rootsof the section trees. Each time an IP address is sampled, the section trees inthe list are searched to locate the section in which the IP address hits. Thenthe corresponding section tree will be updated to increase the hit count of thesection or split the section further if the hit count is over preset limit. After that,the updated section tree will be swapped to the beginning of the section treelist, hoping that the next sampled IP address will hit in this section tree again,hence reducing the search time.
2.2 Splitting Mechnism
Splitting is controlled by a preset threshold of the count that the sampled IP ad-dresses hit in the given section. If the hit count of a section exceeds the threshold,the section will be splitted. Each child section will have the same threshold of thesplitted section. But the hit count of the original section is divided evenly amongthe child sections, meaning that the hits are treated distributing uniformly inthe whole section.
Since the threshold is the same for the section and its child sections, thehit density of the splitting section increases with the growth of the section tree.Suppose the threshold is T , the size of the section is S, and the section will bespltted to m child sections if the hit count exceeds T . So S/m is the size of eachchild section. Obviously, the maximal density of the section before splitting isdsection = T/S . Similarly the maximal density of one child section before thehit count saturates is dchildsection = T/(S/m) = m ∗ (T/S) = m ∗ dsection .
This gives a zoom-in effect when we follow the hits to the hotspot sectionsof the program. The denser the hits are, the smaller the size of the section is.Generally, the section that recieves more hits is more likely the hotspot. At thesame time, this section may have a small size resulting from a series of splitting,hence is easier for us to locate where the hotspot is. In addition, to locate thehotspot more accurately, the minimal and maximal IP addresses hitting in thegiven section are also reocrded, giving a possibility to narrow down the focuseven below the smallest section size.
As mentioned before, the section will be splitted until small enough for anal-ysis. The minimal size is determined at a balance of accuracy and performance.
4 Qiang Wu, Oskar Mencer, Carlos Tavares and Kubilay Atasu
Similarly, the starting size of the original section is determined at a balance ofperformance and memory space efficiency. These parameters are chosen withsome tests.
3 Tool
We developed a tool to detect the hotspot of the program based on the methoddescribed in section 2.
3.1 Design
The tool utilizes the infratructure of pfmon[11] from HP for the manipulationof performance event counters. A kernel module, a user module and a wrapperscript are developed and integrated with other tools in our dynamic softwareacceleration framework. The kernel module is in charge of handling the interruptsgenerated by the performance event counters during the sampling process. Itstores the IP addresses and if instructed, the return addresses in the stack, in akernel buffer. When the buffer is about to be full, the kernel module notifies theuser module to read and process the IP addresses saved in the buffer.
The user module is in charge of building the section tree with the IP addressespassed from the kernel buffer. It checks each address, finds which section theaddress falls in, then increases the hit count of that section. If the section’s hitcount exceeds the threshold, the section will be splitted and child sections areinserted into the section tree.
If instructed by the user, the user module can print out the current hotspotsection list at a specified period during the sampling. The hotspot section listis generated from the leaf sections in the section tree which have the minimalsection size and a hit count above the given threshold. The period is specifiedin terms of second. The minimum is one second, allowing enough time for themodule to process the IP addresses.
At the end of the execution, the user module will print out the resultanthotspot section list by order of hit count. Each section is printed with its startingaddress and size. The minimal and maximal addresses ever encountered in eachsection are also printed, in order to give a starting point in post-processing.
The kernel and user modules are programmed in C and built within thepfmon infrastructure. They can be used as the other smapling modules providedin pfmon. However, to ease the user’s experience, a wrapper script by Pythonis also developed. It encapsulates the usage of pfmon with our custom samplingmodule. The user can specify the options in command line supported by thekernel and user modules we developed. Other options and commands requiredto launch the pfmon are coded in the script without the need of user intervention.With the wrapper script, the user can specify the program he wants to monitor,and the options such as the period of section tree print-out. The script parsesthe input information, find the program and its arguments, then lauches thepfmon to monitor and sample the program’s execution, printing out the hotspotsection list detected during the execution.
Hotspot Detection of SPEC CPU 2006 Benchmarks 5
3.2 Framework
The hotspot detection tool is part of our dynamic software acceleration frame-work. After detecting the hotspot of the program, the post-processing tools willanalyze the hotspot section, figure out the control and data flow of the code,extract acceleratable sequences of instructions, and convert them to appropri-ate form for acceleration. The details of the post-processing tools are beyondthe scope of this paper. We will report the design and implementation of thesepost-processing tools in future publications.
4 Experiment
We perform some experiments on SPEC CPU 2006[12] benchmarks with the toolwe developed. All the benchmarks in SPEC CPU 2006 has been tested. Runtimesare recorded and compared with those of SPEC CPU 2006 benchmarks withoutsampling. Memory size occupied by the section trees are caculated also to figureout the memory consumption of the tool.
4.1 Test Platform
The test platform is a desktop computer with 2 AMD opteron dual core proces-sors running at 2210 MHz. The CPU family number is 15, model number is 33,stepping is 2. The processor cache size is 1024 KB. The size of the system RAMis 2 GB.
Operating system is Ubuntu Linux 7.10 with kernel 2.6.24.3, configured torun in 64-bit mode. The kernel is patched with perfmon[11] interface to theperformance event counters. The version of perfmon kernel patch is 2.8 which isrequired for pfmlib[11] and pfmon[11] tool version 3.3.
SPEC CPU 2006 benchmarks are installed on the system, and are built withGCC and GFortran 4.1.2. Optimization switch for the GCC and GFortran is-O2, and the debug information switch is -gdwarf-2. It should be noted thedebug information is embedded for the post-processing tools, not for the hotspotdetection tool. The hotspot detection tool does not use the debug informationin the experiments.
4.2 Test Parameters
The starting and stopping section sizes are set to be 1M bytes and 1K bytesrespectively. The preliminary tests reveal that most programs occupy a memoryspace ranging from dozens of kilobytes to several megabytes. So we choose thestarting and stopping section sizes as one megabytes and one kilobytes.
The hit count threshold is selected to be 128. The reason is as follows. Weexpect the hotspot section to be hit once at each word in average during theexecution. Since the stopping section size is chosen as 1 kilobytes, or 128 wordsfor a 64-bit platform, the number 128 means each word in the section will get one
6 Qiang Wu, Oskar Mencer, Carlos Tavares and Kubilay Atasu
hit in average. Higher thresholds can assure more hits per word in the section,but may lead to slower splitting, hence are not selected.
The number of child sections split from the original section is set to be 4. Thismeans the section tree is a four-ary tree. Before choosing 4 as the splitting num-ber, we initially used the binary tree to hold the sections. However, the binarytree needs up to 10 splittings from the original section size of one megabytes tothe stopping section size of one kilobytes. So we changed to four-ary tree, whichhas less hierarchies when split from 1M bytes section to 1K bytes section thanthe binary tree does. Higher child section numbers are not selected because wefind in practice, splitting by 4 is efficient both in execution speed and memoryspace. A higher child section number requires a larger node size of the sectiontree. Therefore it is preferrable to use a fair child section number rather than alarge one.
4.3 Test Results
We set the period of printing out the intermediate hotspot sections detectedduring the execution to be 10 seconds, then we launch the SPEC CPU 2006benchmarks with our hotspot detection tool. The graphs depicting the hotspotsections of the SPEC CPU 2006 benchmarks in the test can be found in theAppendix.
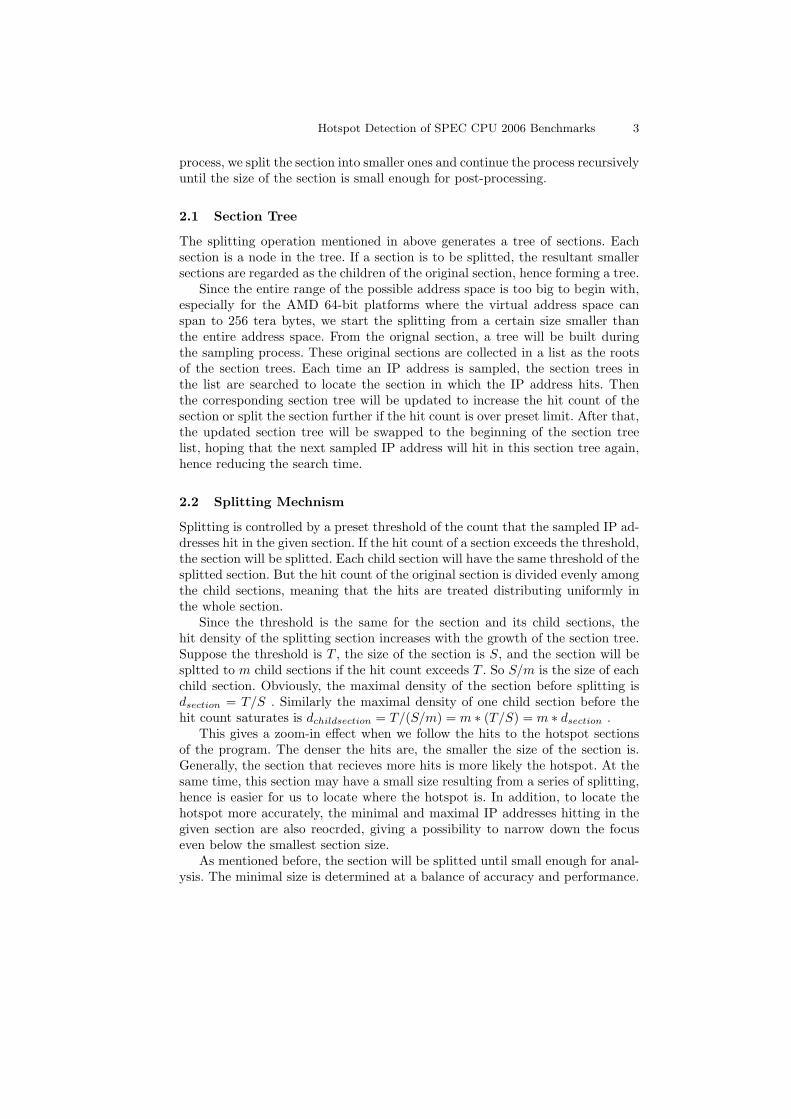
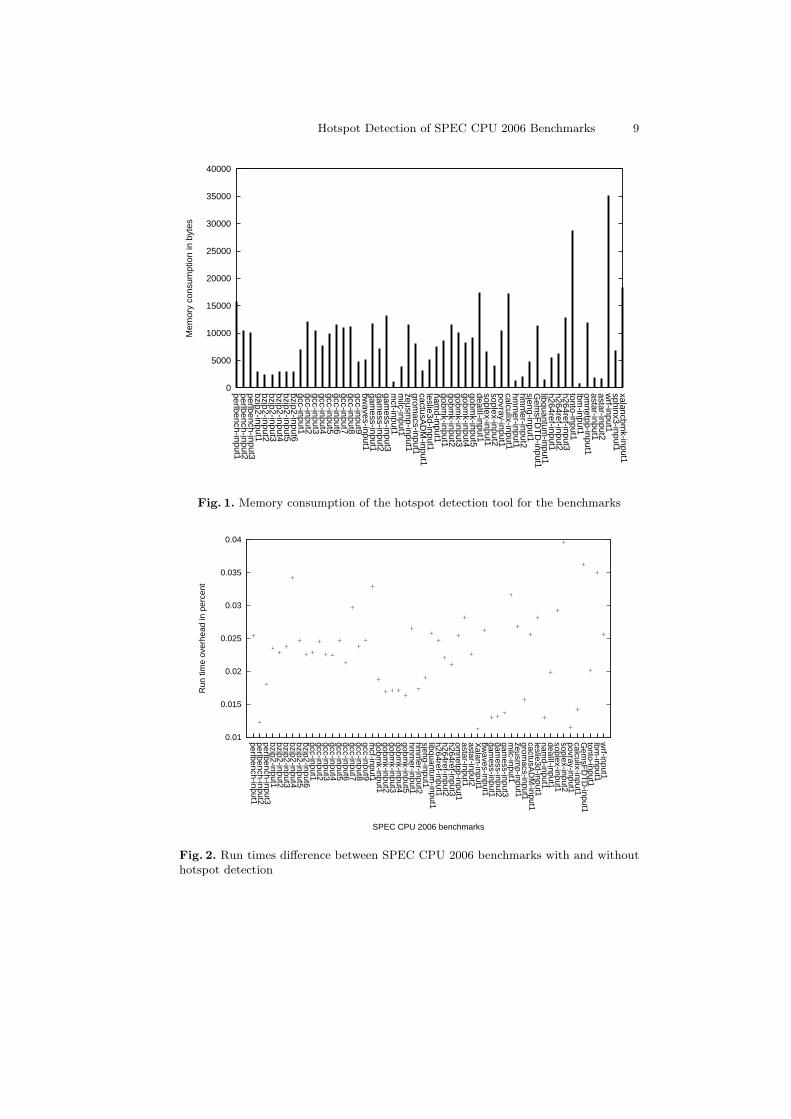
Fig. 1 shows the maximal memory ever occupied by the section tree of eachbenchmark during the execution. The X axis lines the name of the benchmarks.Since each SPEC CPU 2006 may have several different input data sets, a inputnumber is attached to each benchmark name. The Y axis gives the size of themaximal memory space occupied in bytes. It can be seen in the Fig. 1, that themaximal memory overhead is around 35 KB. For most benchmarks, the hotspotsection tree consumes about 5 to 15 KB memory, some of them occupy only lessthan 5 KB of the memory.
To find out the runtime overhead introduced by the hotspot detection, we addintructions to read time stamp counter values at the start and end of the hotspotdetection procedure. The additional run time for hotspot detection is calculatedwith Tdetection = (tsend − tsstart)/cpu clock rate. The original run times of theSPEC CPU 2006 benchmarks are obtained by the time command. We run eachbenchmark without hotspot detection 5 times repeatedly. For each execution weuse time command to get the User mode run time, System mode run time andWall clock real time. Since the wall clock real time may be influenced much bythe dynamic environment of the system, we choose the sum of the User modeand System mode run time as final run time of each execution.
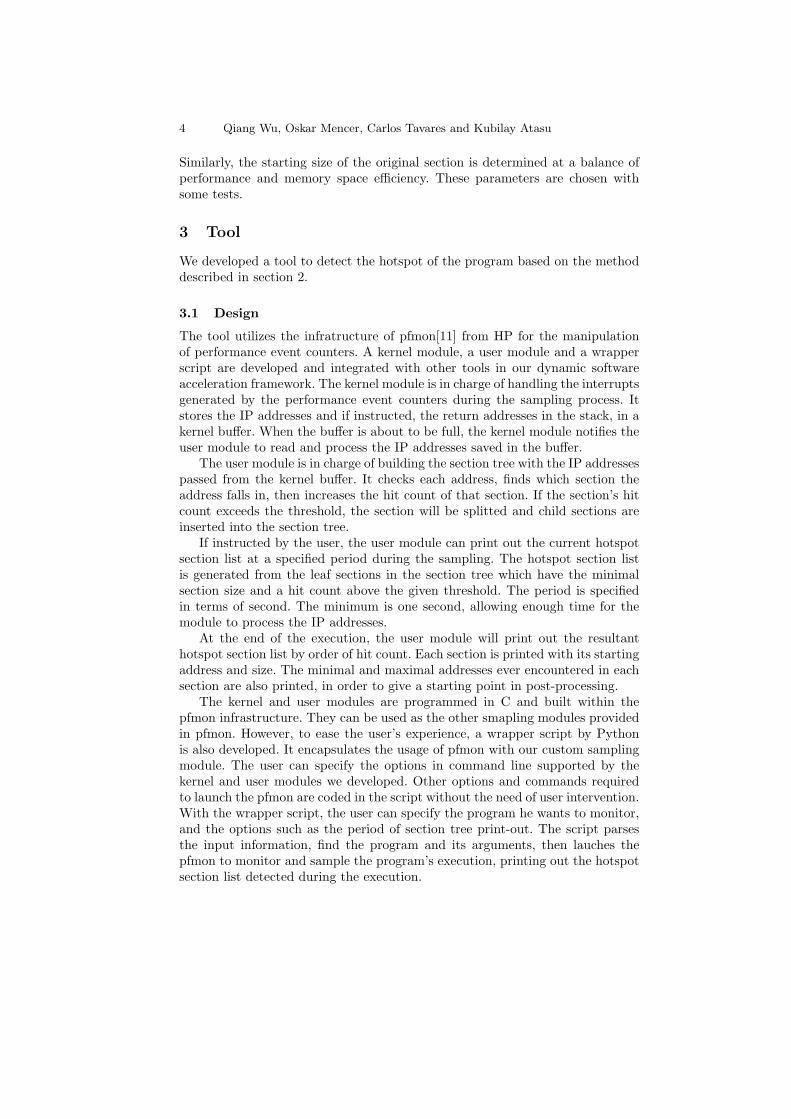
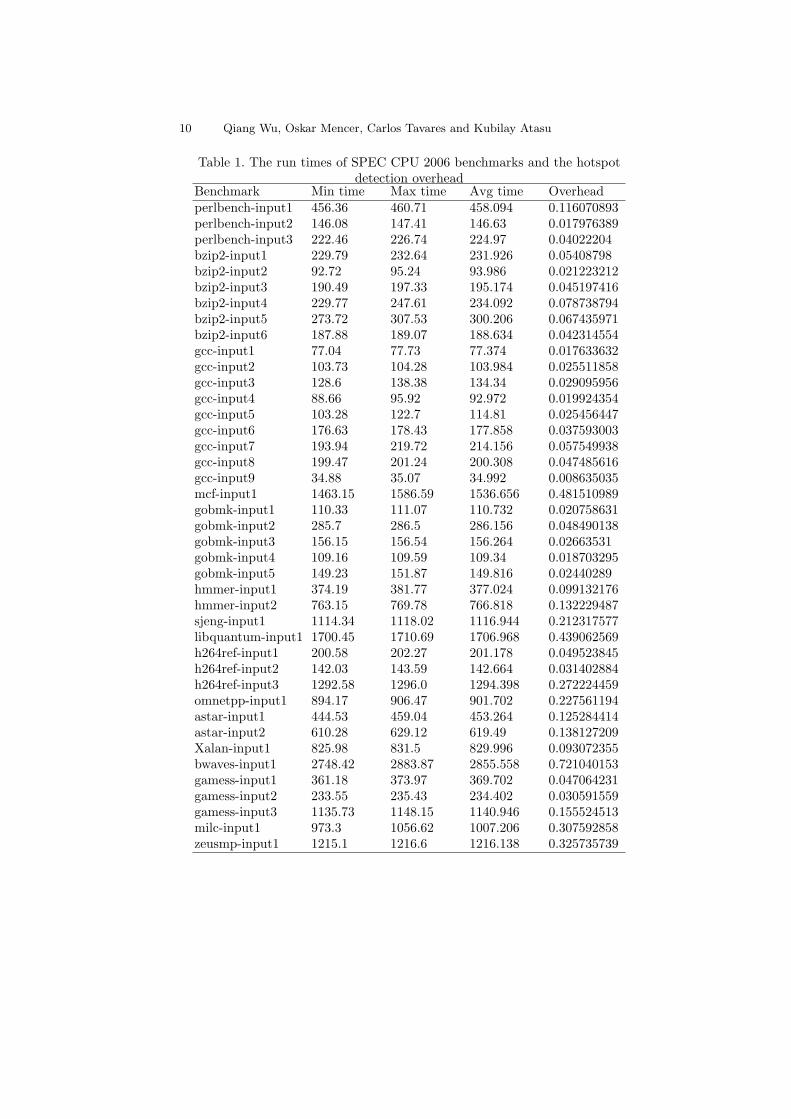
Table 1 lists the minimal, maximal and average runtimes of SPEC CPU2006 benchmarks without hotspot detection, as well as the hotspot detectiontime of each benchmark. Fig. 2 shows the runtime overhead percentage of thehotspot detecion on the SPEC CPU 2006 benchmarks. The X axis lines thename and input number of each benchmark. The Y axis represents the run-time overhead in percent of the benchmark. The percentage is calculated byPoverhead = Tdetection/MinT imebenchmark ∗ 100. We choose the minimal run
Hotspot Detection of SPEC CPU 2006 Benchmarks 7
time of each execution in consideration that the minimal run time should haveleast influence from the dynamic environment of the system. From the figure,we can find that the runtime overheads are less than 0.04%, with some of themare close to 0.01%.
5 Conclusion
In this technical report, we introduce a hotspot detection tool to record hotspotsections instead of each IP addresses. One advantage of recording hotspot sec-tions rather than IP addresses is to save memory space required for storingthe different IP addresses encountered during the execution. Another advantageis that by collecting the IP addresses in sections, we obtain some informationabout the relations among the encountered IP addresses, such as concurrenciesof different IP addresses, which is believed to be helpful in post-process of theperformance monitoring data. We have seen from the periodical hotspot sec-tion graphs in Appendix that different sections of the program can be active atdifferent times during the execution. Thus the hotspot sections with periodicalsampling reveal the program’s dynamic characteristics statistically in both theIP space and the time frame.
Meanwhile, the memory cost of the hotspot section storage is relatively low.In our experiments with SPEC CPU 2006 benchmarks, the maximal memoryever consumed by the hotspot section is about 35 KB, while for most bench-marks this consumption is around 5 to 15 KB. So we can have the hotspotsections resident in the main memory and reference the hotspot section infor-mation during the execution. In our future work, we plan to utilize the hotspotsection information for dynamic acceleration of the program.
From the experiments, we also find that the run time overheads of the hotspotsection detection are not high. Run time overheads of the SPEC CPU 2006benchmarks with hotspot detection are within 0.04% of the minimal run timeever recorded for the original programs. For some benchmarks, the run timeoverheads are close to 0.01% of the original run time.
In a word, the preliminary experiments so far show that the hotspot detectionbased on IP sections is a promising approach to study the dynamic characteristicsof the program. Our next step is to extend it with post-processing and analysistechniques, such as binary code extraction and transformation for the dynamicaccleration of the programs.
References
1. Reiner R. Dumke, Claus Rautenstrauch, Andreas Schmietendorf, Andre Scholz(Eds.): Performance Engineering, State of the Art and Current Trends. LecturNotes in Computer Science vol. 2047, Springer (2001)
2. Jennifer M. Anderson, Lance M. Berc, Jeffrey Dean, et al. Continuous profiling:where have all the cycles gone? ACM Transactions on Computer Systems (TOCS).Vol. 15, Iss. 4, pp. 357-390. 1997.
8 Qiang Wu, Oskar Mencer, Carlos Tavares and Kubilay Atasu
3. Glenn Ammons, Thomas Ball, James R. Larus. Exploiting Hardware PerformanceCounters with Flow and Context Sensitive Profiling. In: Proceedings of ACM SIG-PLAN Conference on Programming Language Design and Implementation (PLDI),pp. 85-96. 1997.
4. Reza Azimi, Michael Stumm, Robert W. Wisniewski. Online performance analysisby statistical sampling of microprocessor performance counters. In: Proceedings ofthe 19th annual international conference on Supercomputing (ICS), pp. 101-110.2005.
5. John L. Henning. Performance counters and development of SPEC CPU2006. ACMSIGARCH Computer Architecture News. Vol. 35, Iss. 1, pp. 118-121. 2007.
6. Stephane Eranian. What can performance counters do for memory subsystem anal-ysis? In: Proceedings of the ACM SIGPLAN workshop on Memory systems per-formance and correctness held in conjunction with the 13th International Confer-ence on Architectural Support for Programming Languages and Operating Systems(ASPLOS), pp. 26-30. 2008.
7. Innovative Computing Laboratory (ICL), College of Engineering at the Universityof Tennessee. Performance Application Programming Interface (PAPI). http://icl.cs.utk.edu/papi/index.html
8. Intel Corporation. Intel VTune Performance Analyzer. http://www.intel.com/
cd/software/products/asmo-na/eng/239144.htm
9. AMD Inc. AMD CodeAnalyst Performance Analyzer. http://developer.amd.
com/CPU/Pages/default.aspx
10. OProfile - A System Profiler for Linux. http://oprofile.sourceforge.net11. perfmon project, http://perfmon2.sourceforge.net12. Standard Performance Evaluation Corporation, http://www.spec.org
Hotspot Detection of SPEC CPU 2006 Benchmarks 9
0
5000
10000
15000
20000
25000
30000
35000
40000
perlbench-input1perlbench-input2perlbench-input3bzip2-input1bzip2-input2bzip2-input3bzip2-input4bzip2-input5bzip2-input6gcc-input1gcc-input2gcc-input3gcc-input4gcc-input5gcc-input6gcc-input7gcc-input8gcc-input9bw
aves-input1gam
ess-input1gam
ess-input2gam
ess-input3m
cf-input1m
ilc-input1zeusm
p-input1grom
acs-input1cactusA
DM
-input1leslie3d-input1nam
d-input1gobm
k-input1gobm
k-input2gobm
k-input3gobm
k-input4gobm
k-input5dealII-input1soplex-input1soplex-input2povray-input1calculix-input1hm
mer-input1
hmm
er-input2sjeng-input1G
emsF
DT
D-input1
libquantum-input1
h264ref-input1h264ref-input2h264ref-input3tonto-input1lbm
-input1om
netpp-input1astar-input1astar-input2w
rf-input1sphinx3-input1xalancbm
k-input1
Mem
ory
cons
umpt
ion
in b
ytes
Fig. 1. Memory consumption of the hotspot detection tool for the benchmarks
0.01
0.015
0.02
0.025
0.03
0.035
0.04perlbench-input1perlbench-input2perlbench-input3bzip2-input1bzip2-input2bzip2-input3bzip2-input4bzip2-input5bzip2-input6gcc-input1gcc-input2gcc-input3gcc-input4gcc-input5gcc-input6gcc-input7gcc-input8gcc-input9m
cf-input1gobm
k-input1gobm
k-input2gobm
k-input3gobm
k-input4gobm
k-input5hm
mer-input1
hmm
er-input2sjeng-input1libquantum
-input1h264ref-input1h264ref-input2h264ref-input3om
netpp-input1astar-input1astar-input2X
alan-input1bw
aves-input1gam
ess-input1gam
ess-input2gam
ess-input3m
ilc-input1zeusm
p-input1grom
acs-input1cactusA
DM
-input1leslie3d-input1nam
d-input1dealII-input1soplex-input1soplex-input2povray-input1calculix-input1G
emsF
DT
D-input1
tonto-input1lbm
-input1w
rf-input1
Run
tim
e ov
erhe
ad in
per
cent
SPEC CPU 2006 benchmarks
Fig. 2. Run times difference between SPEC CPU 2006 benchmarks with and withouthotspot detection
10 Qiang Wu, Oskar Mencer, Carlos Tavares and Kubilay Atasu
Table 1. The run times of SPEC CPU 2006 benchmarks and the hotspotdetection overhead
Benchmark Min time Max time Avg time Overheadperlbench-input1 456.36 460.71 458.094 0.116070893perlbench-input2 146.08 147.41 146.63 0.017976389perlbench-input3 222.46 226.74 224.97 0.04022204bzip2-input1 229.79 232.64 231.926 0.05408798bzip2-input2 92.72 95.24 93.986 0.021223212bzip2-input3 190.49 197.33 195.174 0.045197416bzip2-input4 229.77 247.61 234.092 0.078738794bzip2-input5 273.72 307.53 300.206 0.067435971bzip2-input6 187.88 189.07 188.634 0.042314554gcc-input1 77.04 77.73 77.374 0.017633632gcc-input2 103.73 104.28 103.984 0.025511858gcc-input3 128.6 138.38 134.34 0.029095956gcc-input4 88.66 95.92 92.972 0.019924354gcc-input5 103.28 122.7 114.81 0.025456447gcc-input6 176.63 178.43 177.858 0.037593003gcc-input7 193.94 219.72 214.156 0.057549938gcc-input8 199.47 201.24 200.308 0.047485616gcc-input9 34.88 35.07 34.992 0.008635035mcf-input1 1463.15 1586.59 1536.656 0.481510989gobmk-input1 110.33 111.07 110.732 0.020758631gobmk-input2 285.7 286.5 286.156 0.048490138gobmk-input3 156.15 156.54 156.264 0.02663531gobmk-input4 109.16 109.59 109.34 0.018703295gobmk-input5 149.23 151.87 149.816 0.02440289hmmer-input1 374.19 381.77 377.024 0.099132176hmmer-input2 763.15 769.78 766.818 0.132229487sjeng-input1 1114.34 1118.02 1116.944 0.212317577libquantum-input1 1700.45 1710.69 1706.968 0.439062569h264ref-input1 200.58 202.27 201.178 0.049523845h264ref-input2 142.03 143.59 142.664 0.031402884h264ref-input3 1292.58 1296.0 1294.398 0.272224459omnetpp-input1 894.17 906.47 901.702 0.227561194astar-input1 444.53 459.04 453.264 0.125284414astar-input2 610.28 629.12 619.49 0.138127209Xalan-input1 825.98 831.5 829.996 0.093072355bwaves-input1 2748.42 2883.87 2855.558 0.721040153gamess-input1 361.18 373.97 369.702 0.047064231gamess-input2 233.55 235.43 234.402 0.030591559gamess-input3 1135.73 1148.15 1140.946 0.155524513milc-input1 973.3 1056.62 1007.206 0.307592858zeusmp-input1 1215.1 1216.6 1216.138 0.325735739
Hotspot Detection of SPEC CPU 2006 Benchmarks 11
Table 1. The run times of SPEC CPU 2006 benchmarks and the hotspotdetection overhead (continue)
Benchmark Min time Max time Avg time Overheadgromacs-input1 1005.35 1006.01 1005.518 0.158280145cactusADM-input1 2054.36 2272.86 2152.436 0.526251359leslie3d-input1 1236.48 1244.11 1240.926 0.348669861namd-input1 817.66 819.18 818.288 0.106409637dealII-input1 968.15 1014.94 984.902 0.192005753soplex-input1 507.06 513.27 509.828 0.148307147soplex-input2 469.7 598.06 521.178 0.185700659povray-input1 430.51 436.39 434.136 0.04940989calculix-input1 3063.97 3085.22 3080.148 0.435295182GemsFDTD-input1 1424.7 1696.13 1585.128 0.516489503tonto-input1 1209.26 1221.78 1215.696 0.243500487lbm-input1 1522.18 1766.4 1668.792 0.533738552wrf-input1 1600.49 1690.94 1636.66 0.409940721sphinx-input1 1641.51 1872.27 1734.18 0.588052983
12 Qiang Wu, Oskar Mencer, Carlos Tavares and Kubilay Atasu
Appendix: Graphs of Hotspot Sections Detected in SPEC
CPU 2006 Benchmarks
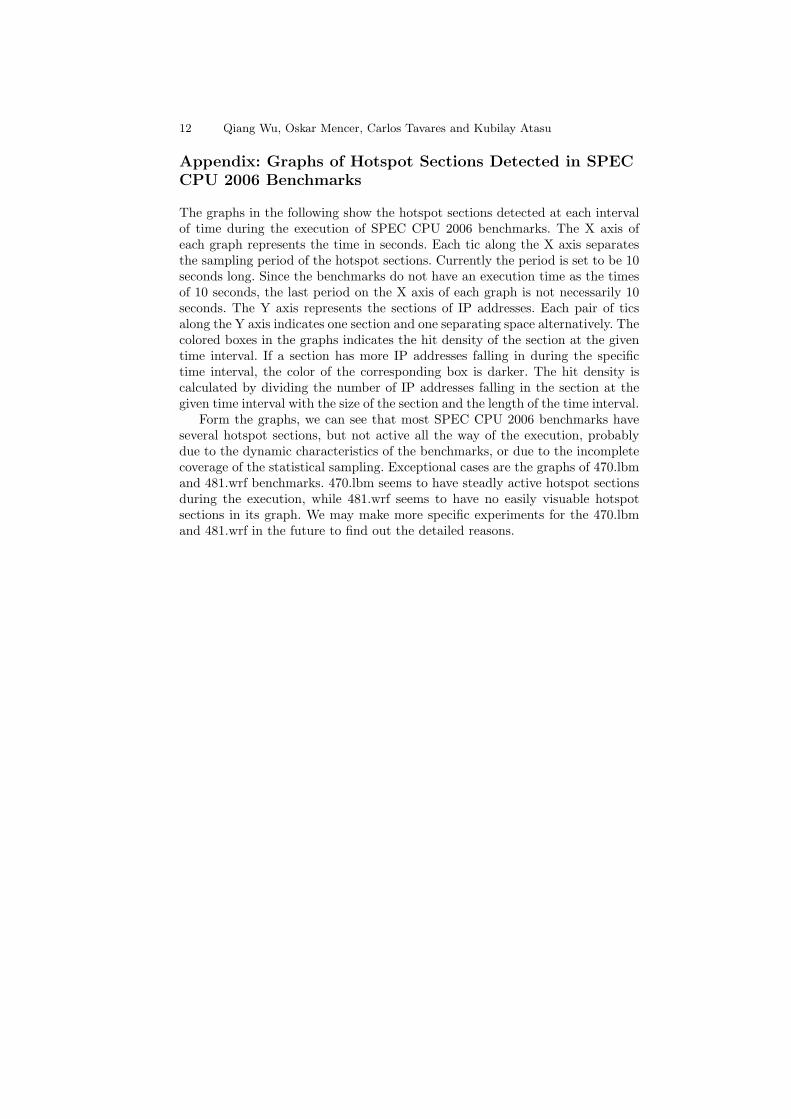
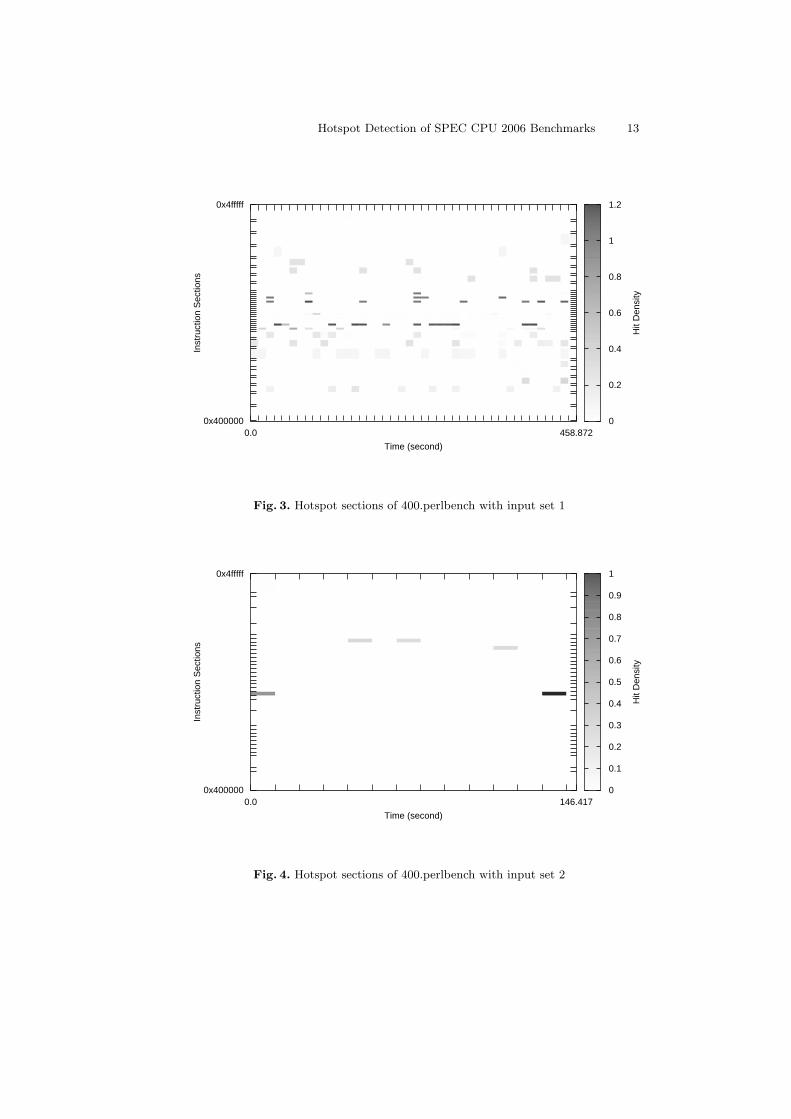
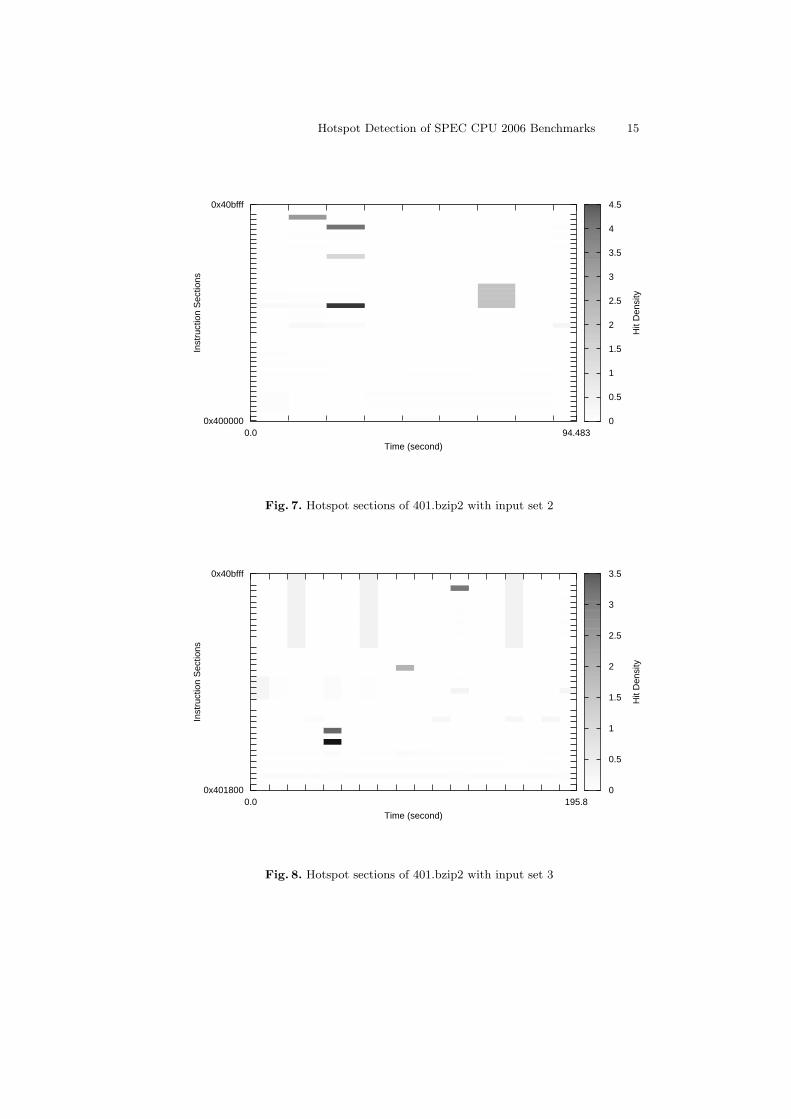
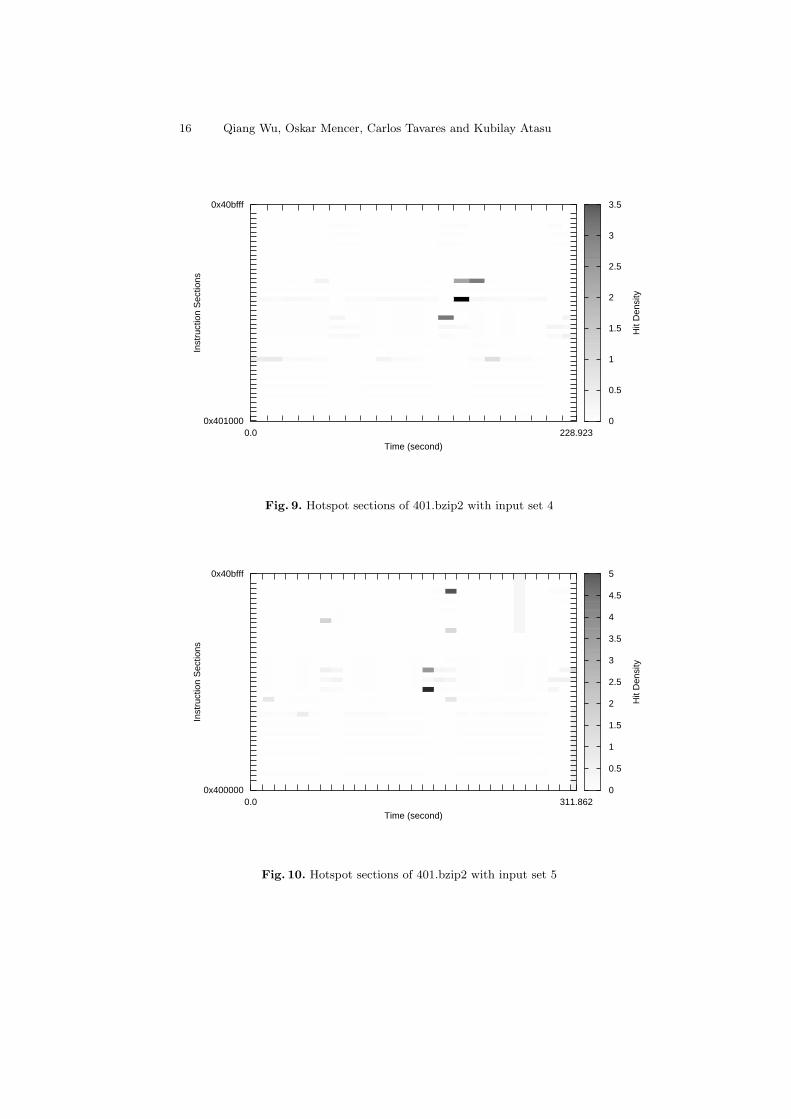
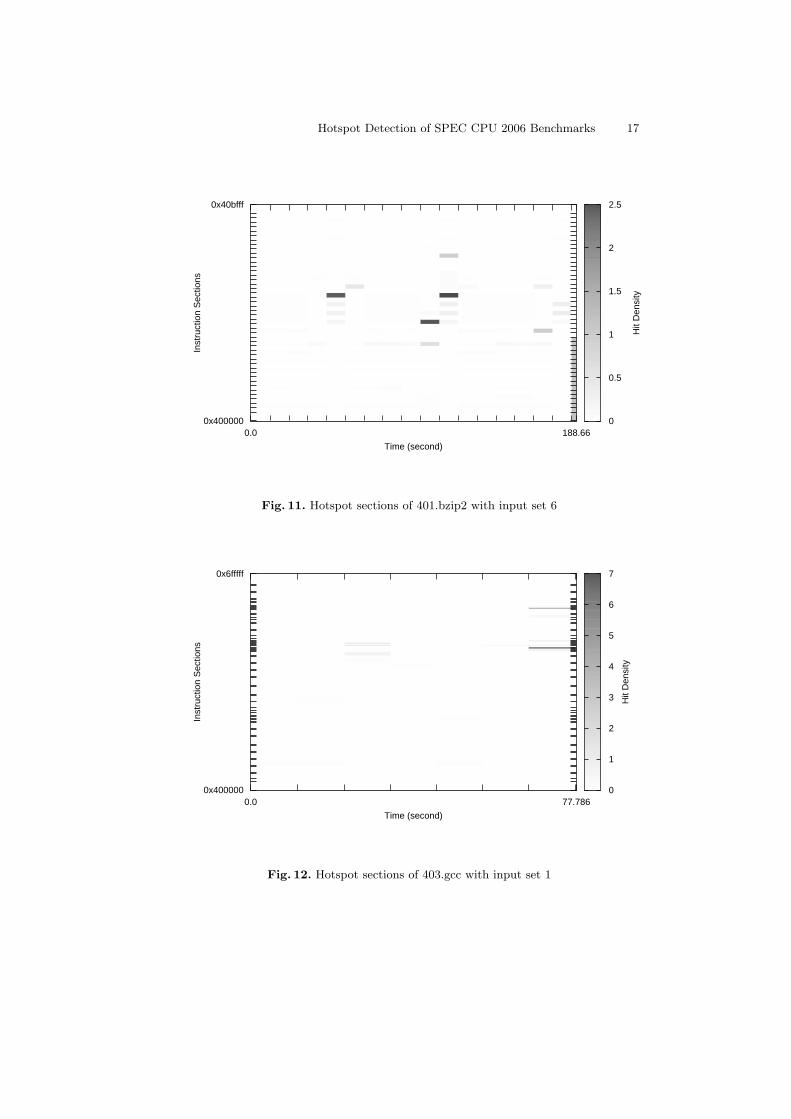
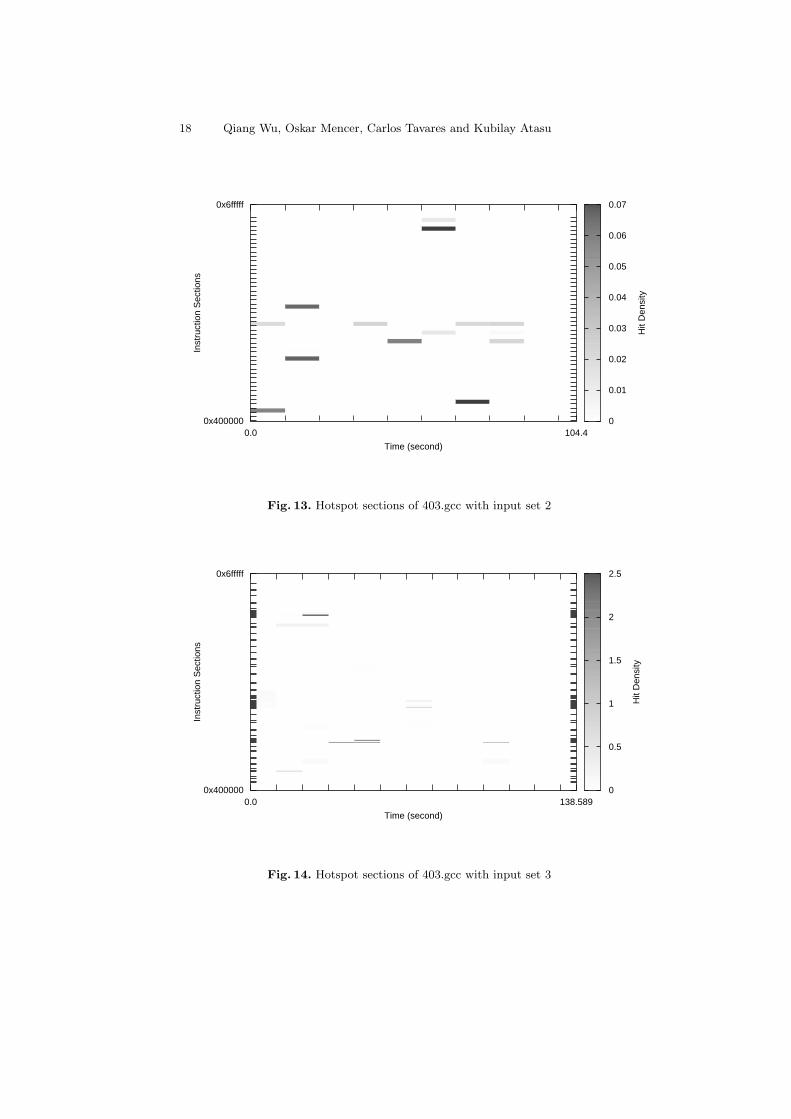
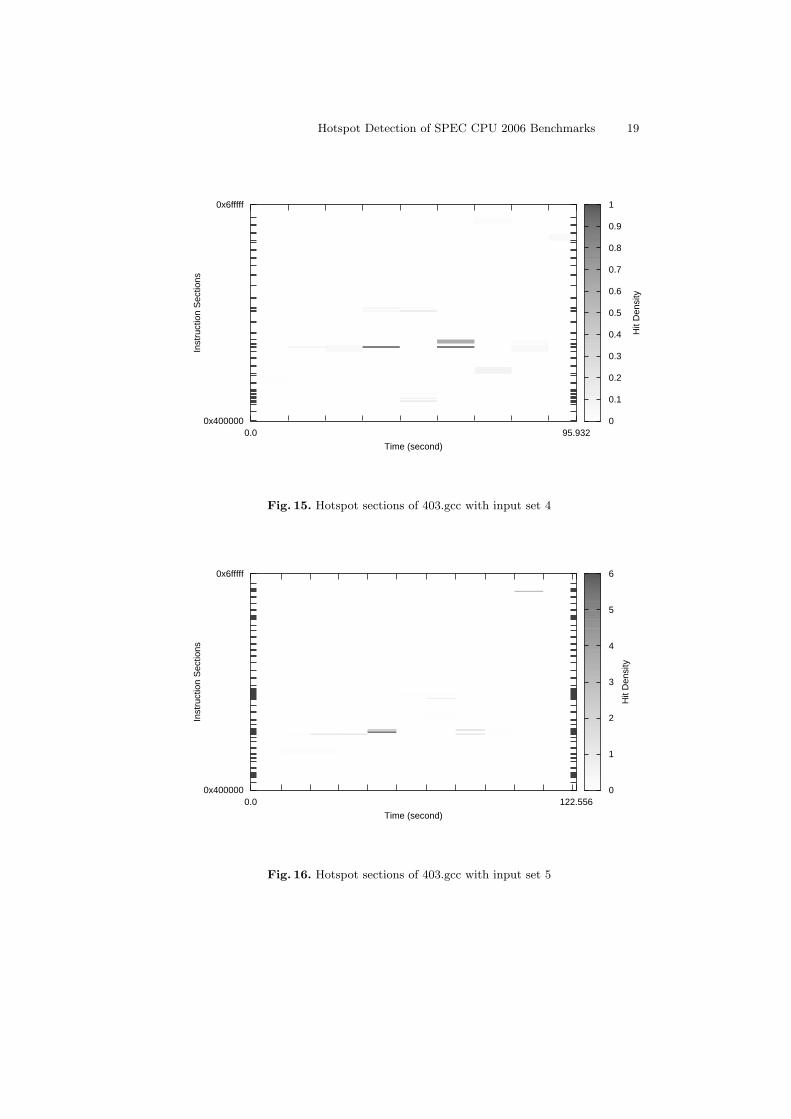
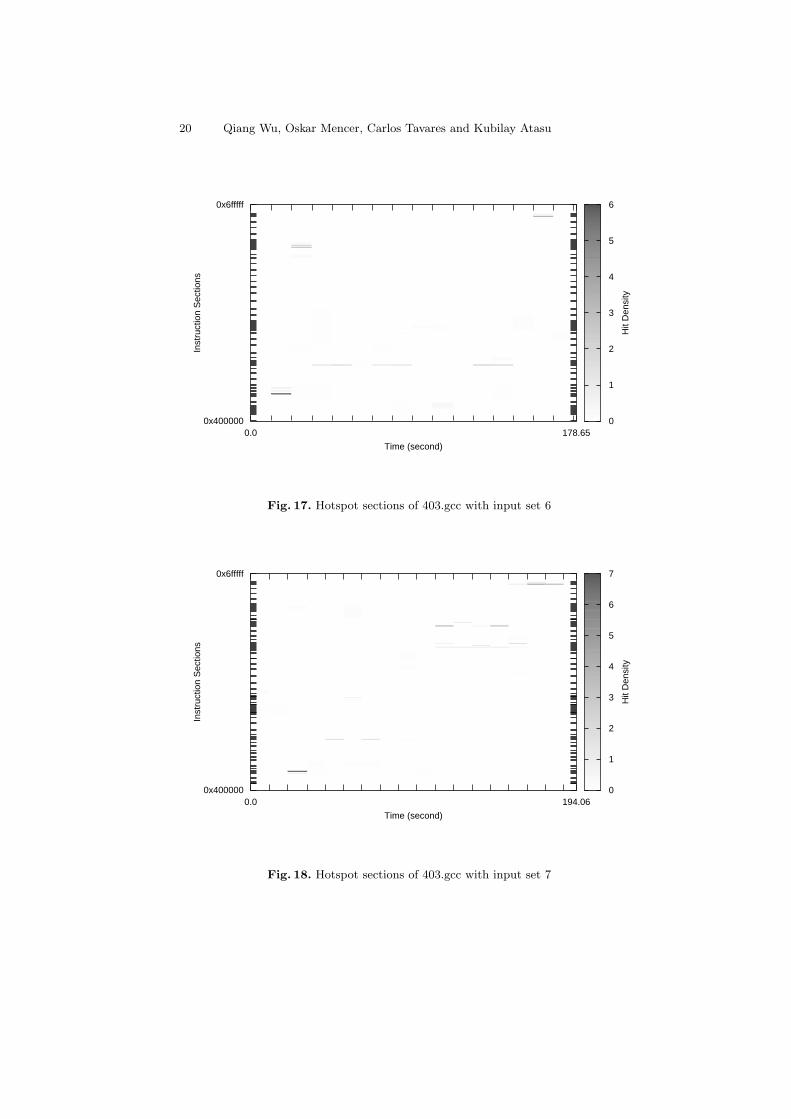
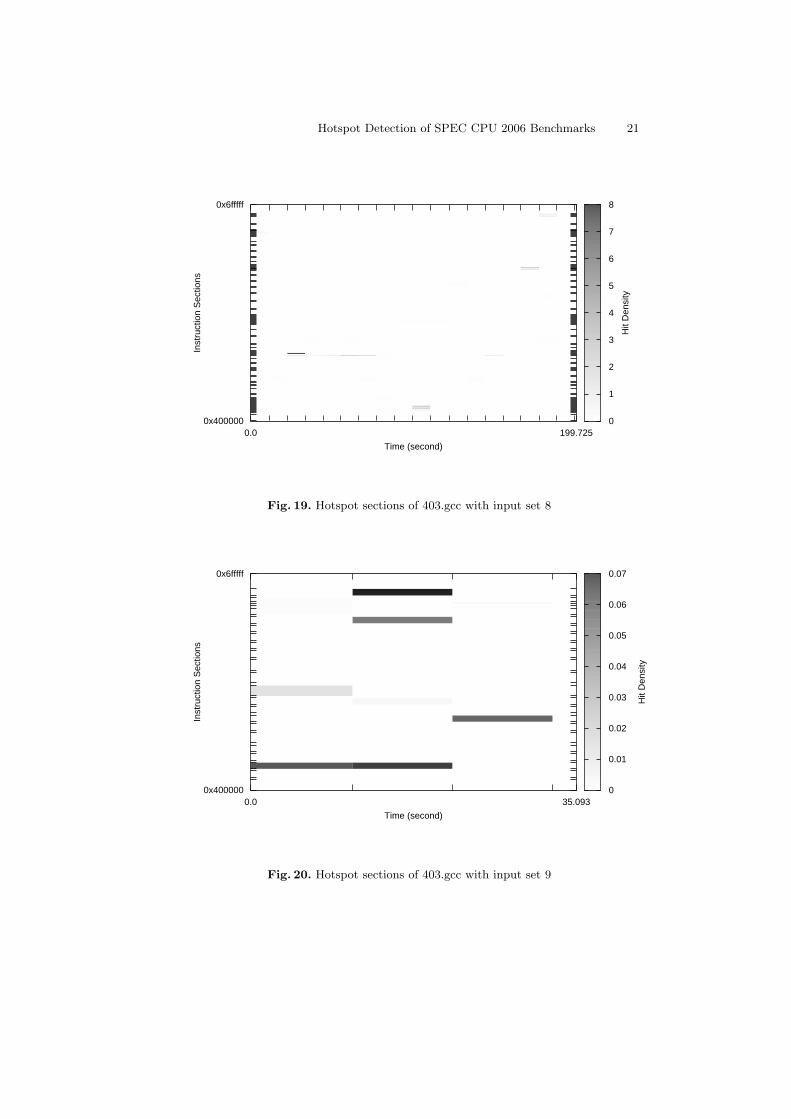
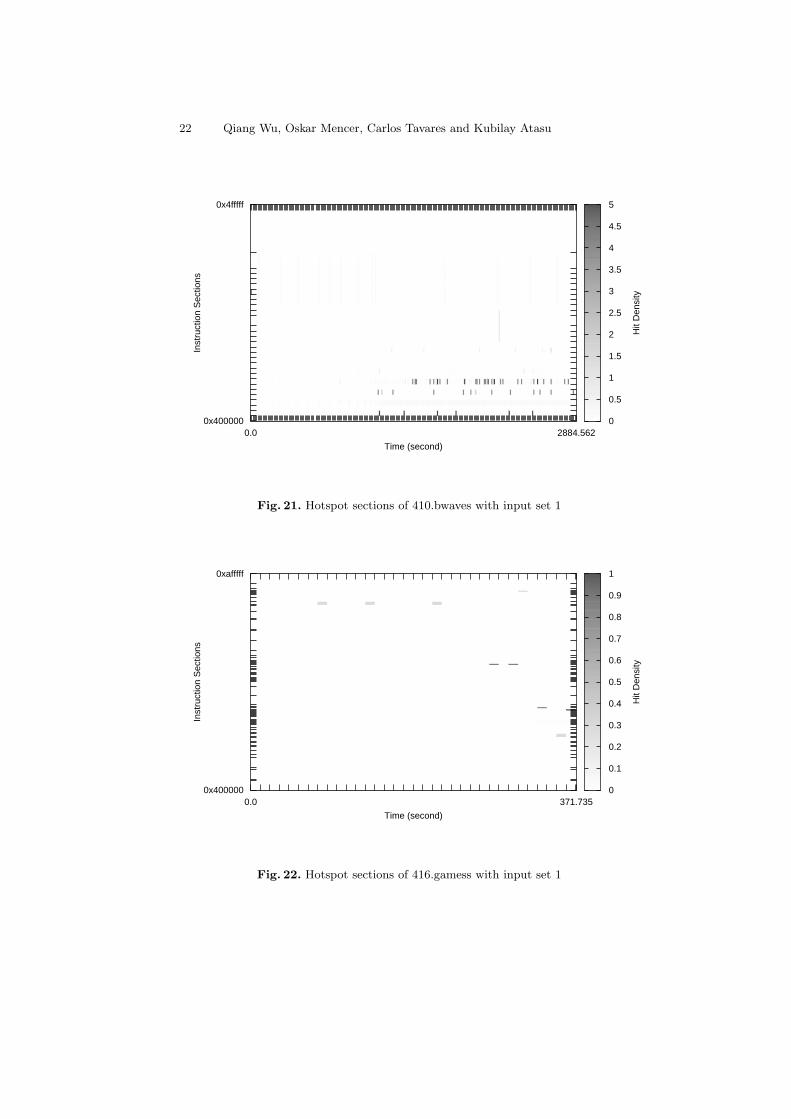
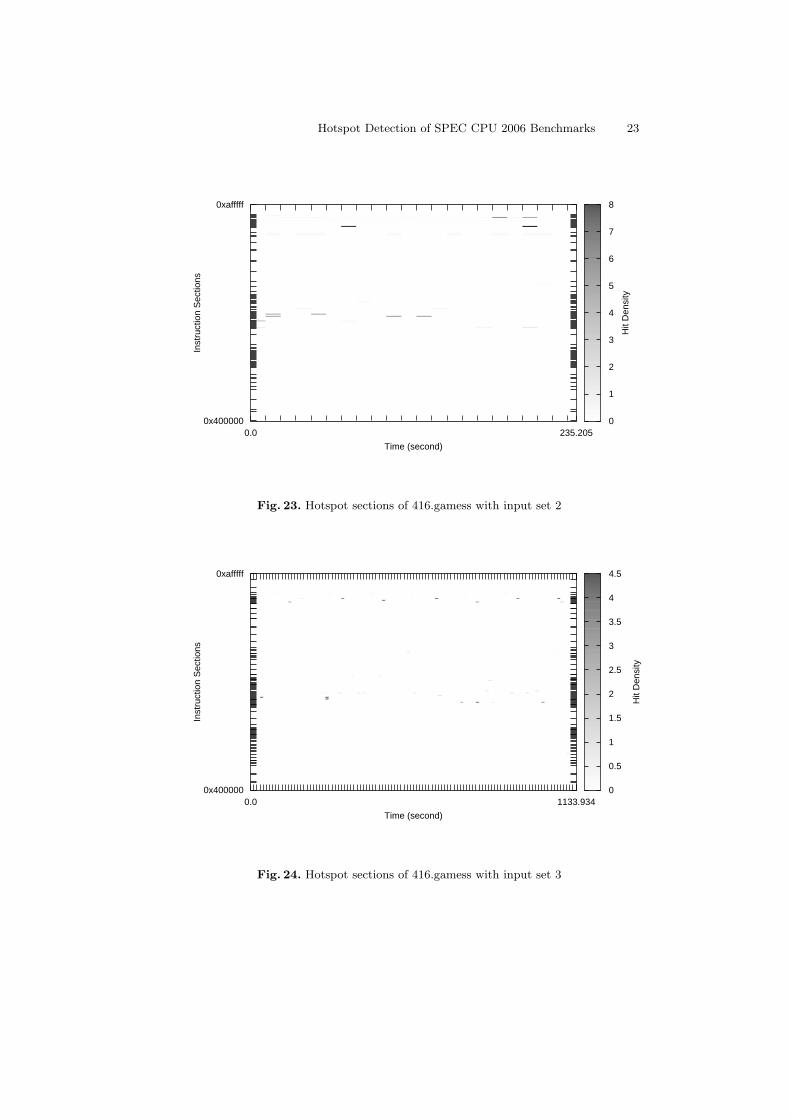
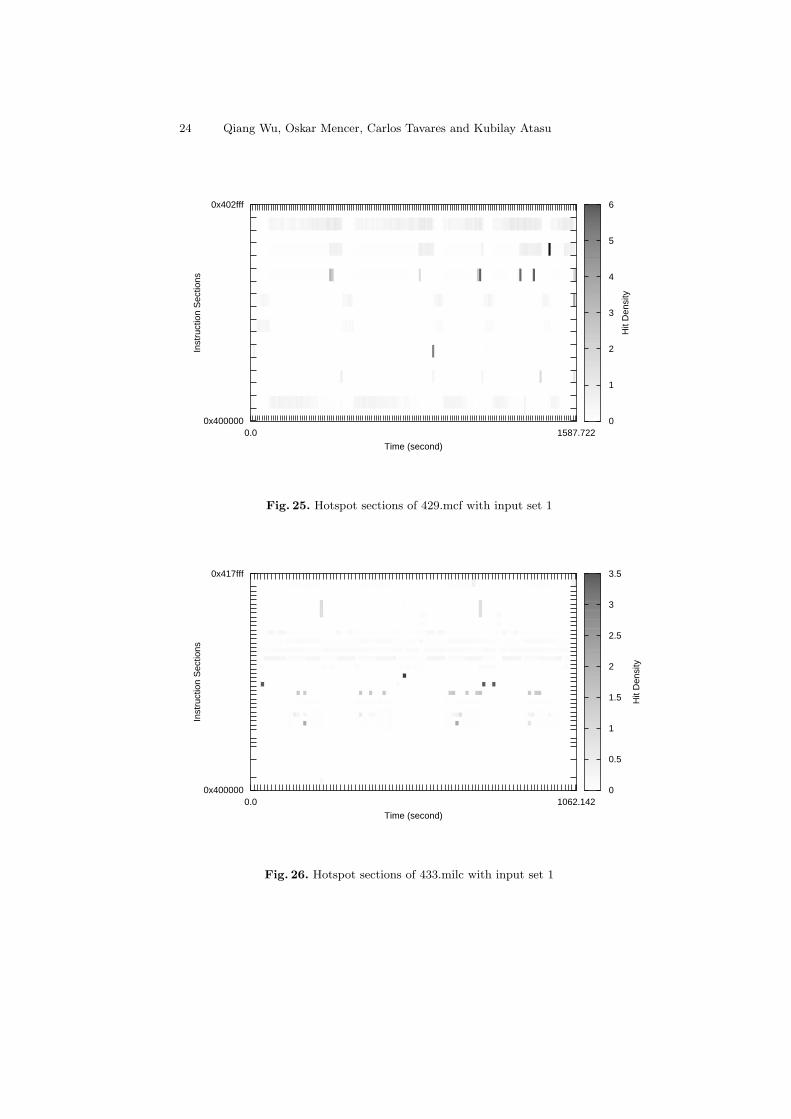
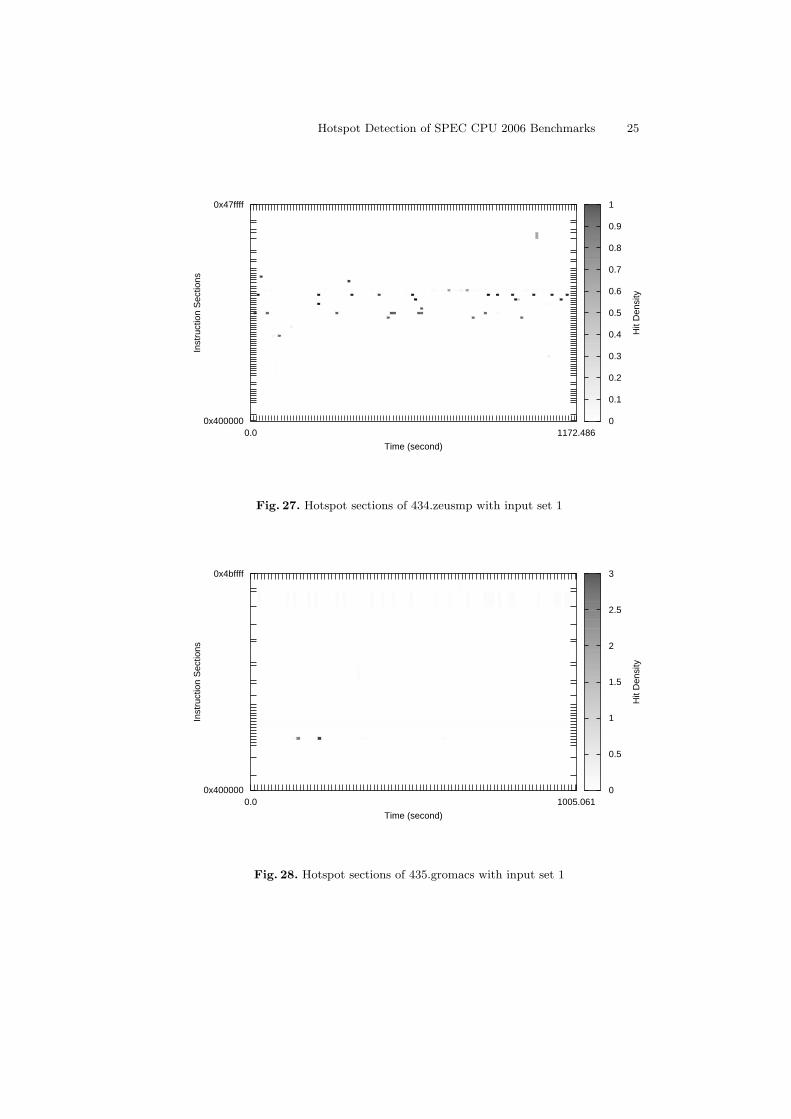
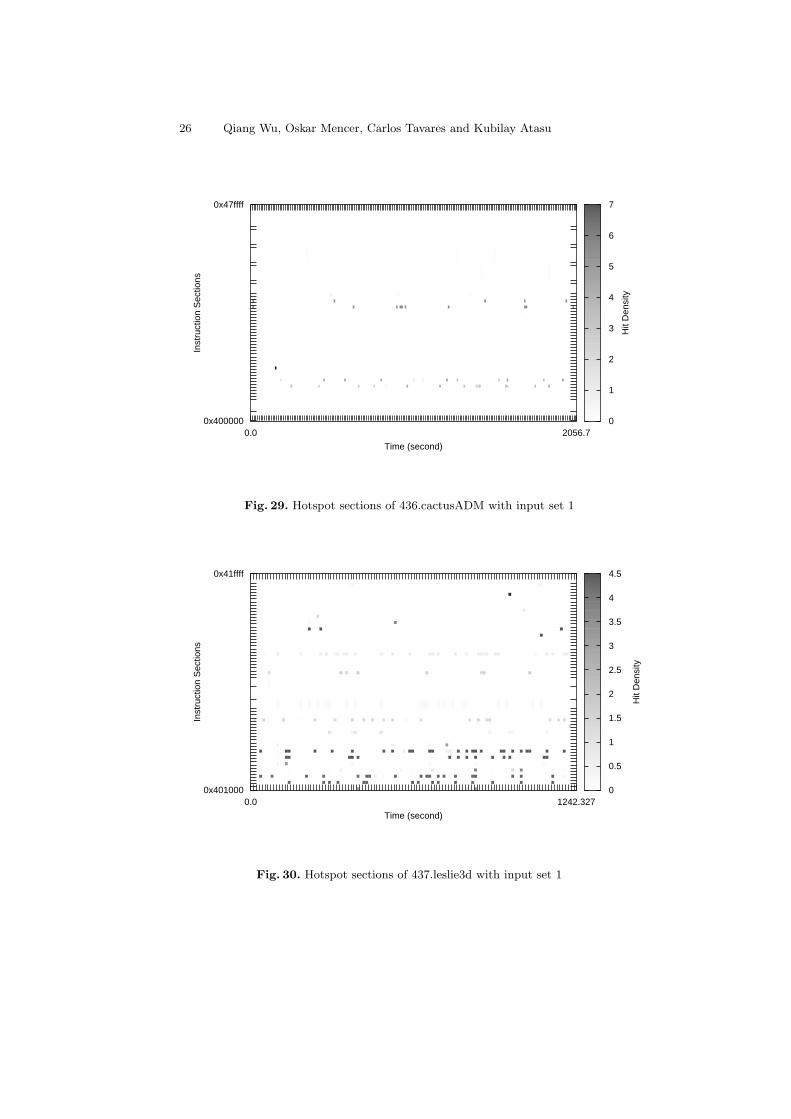
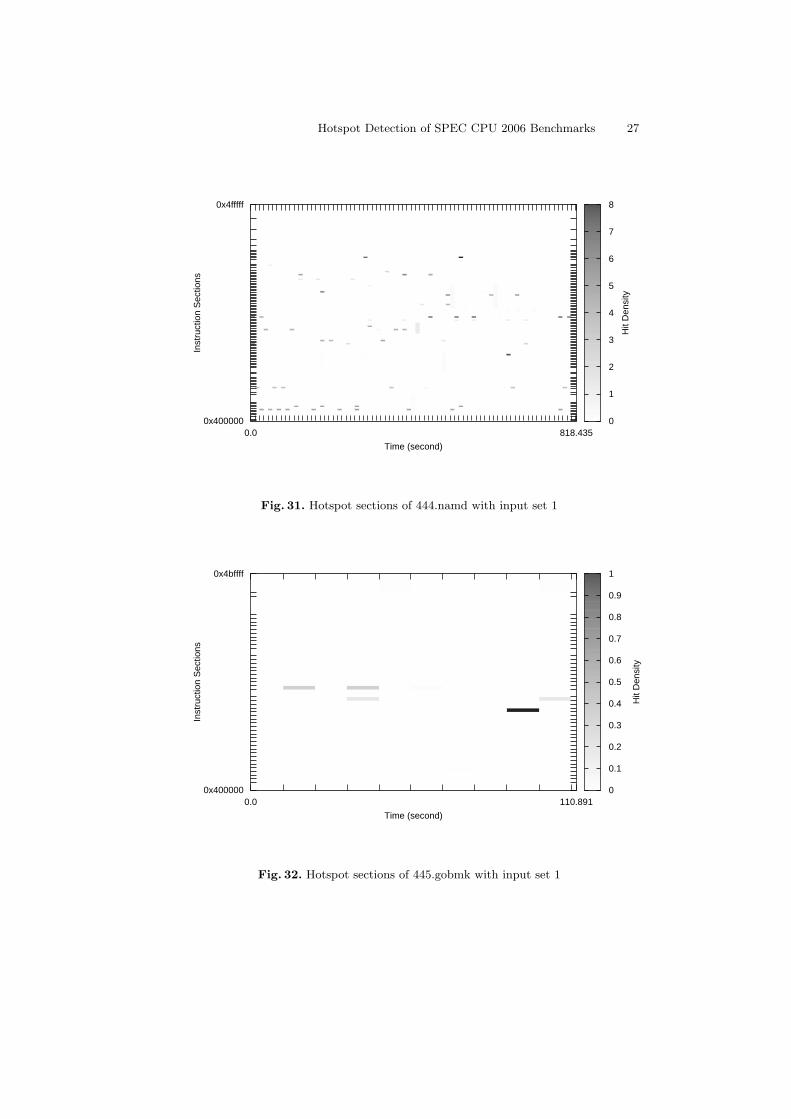
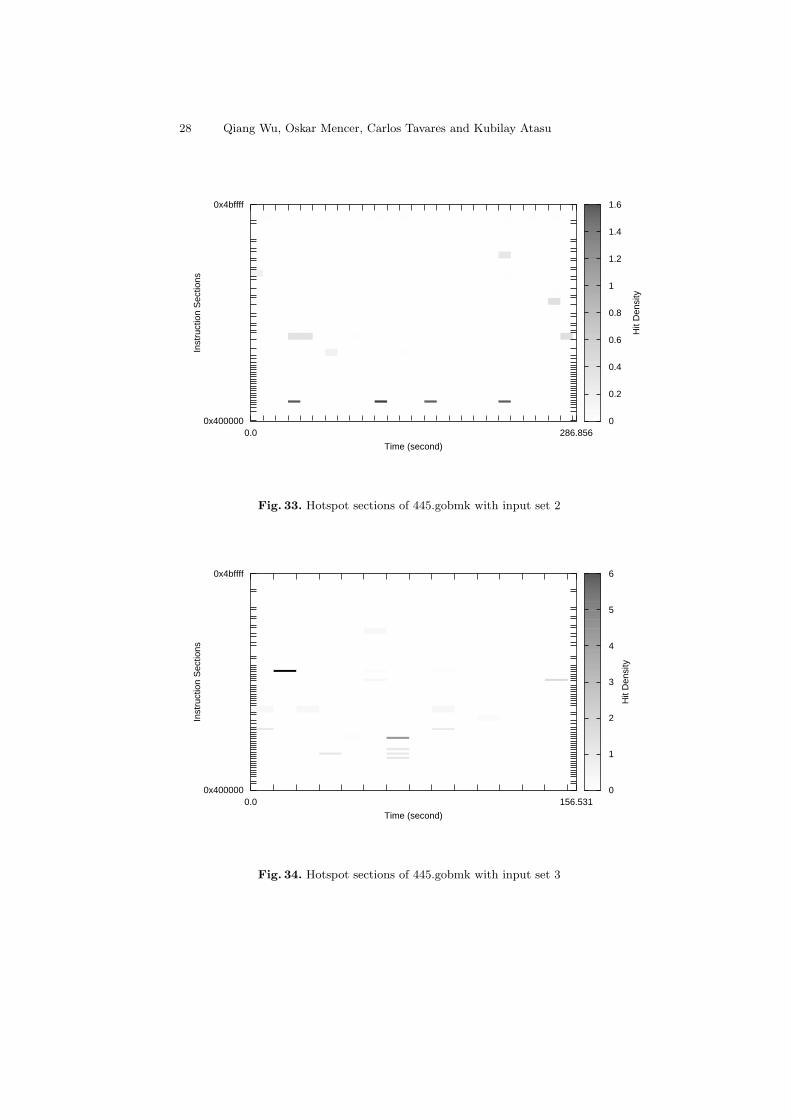
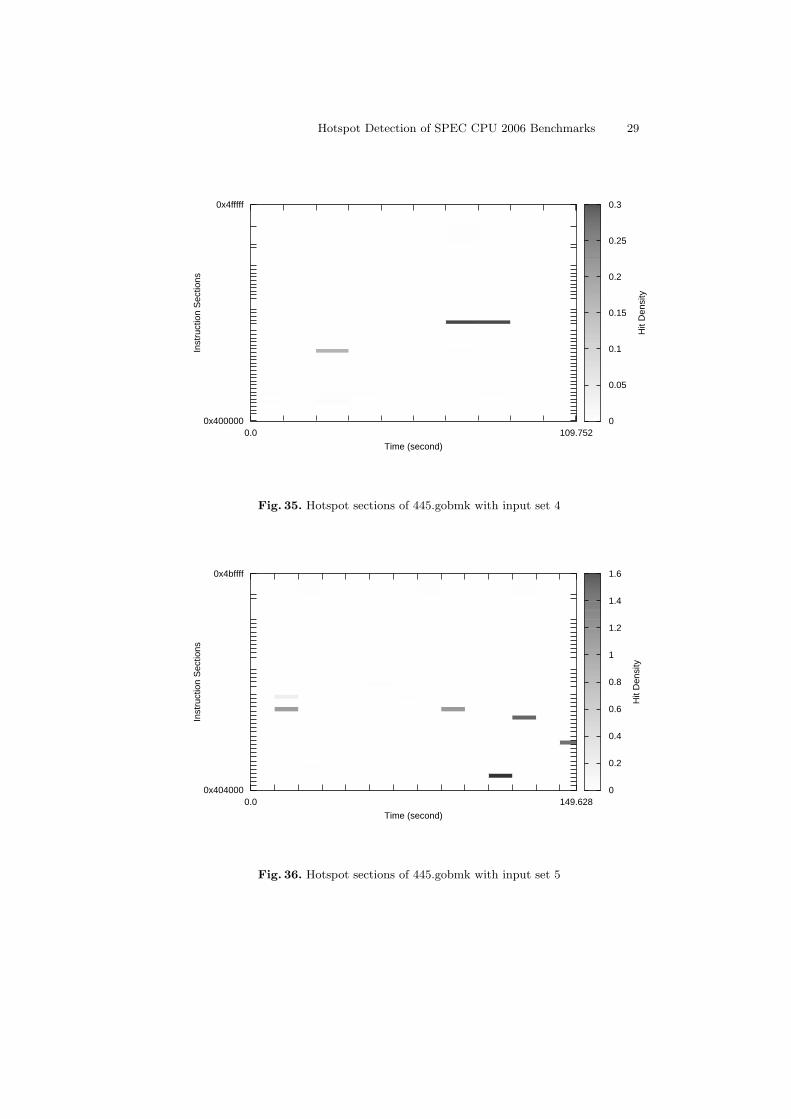
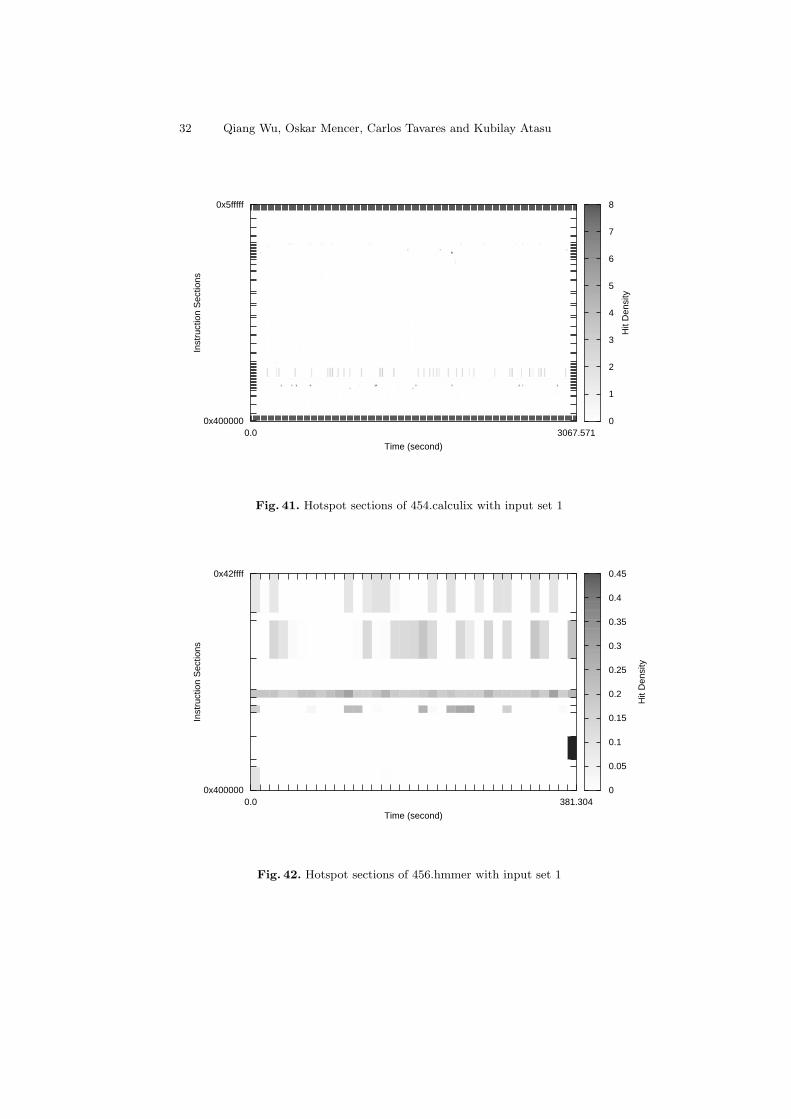
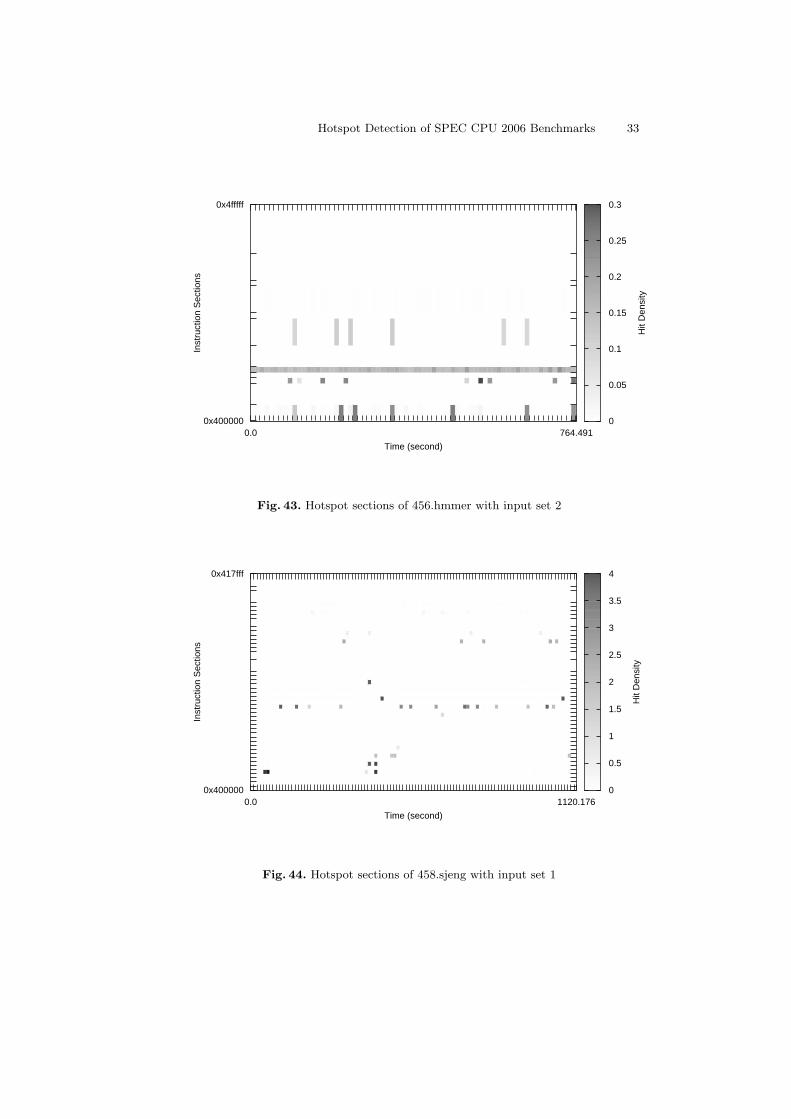
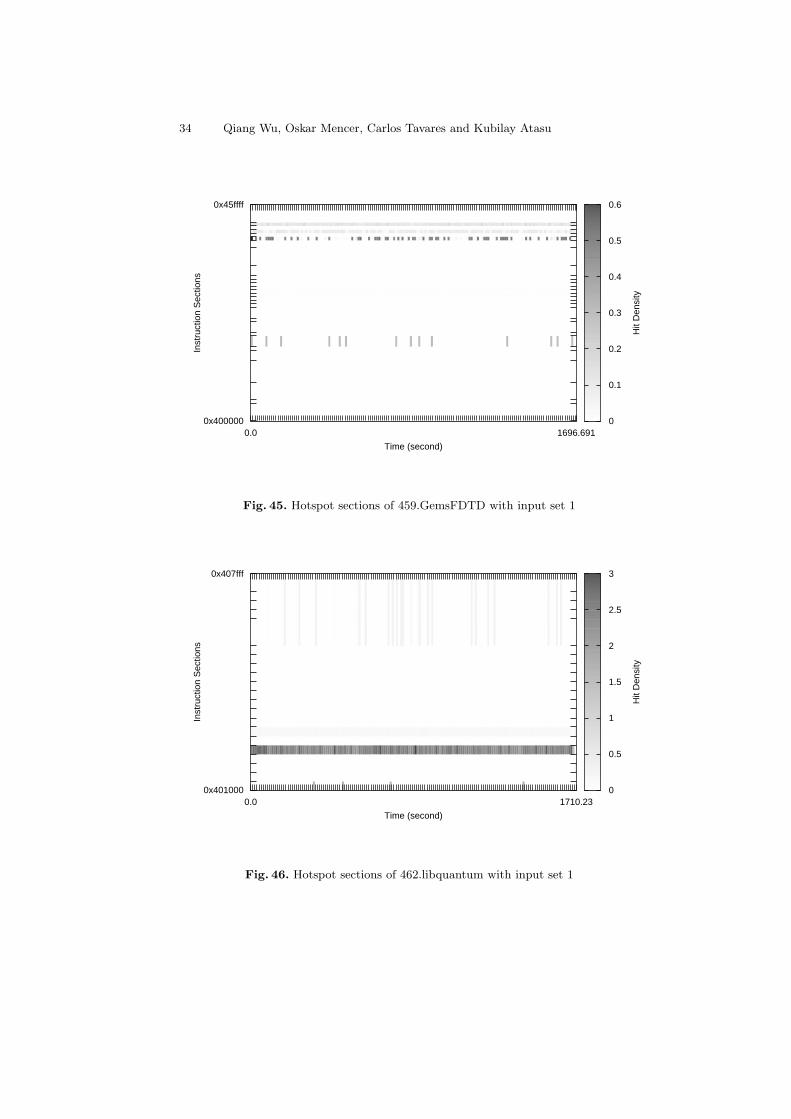
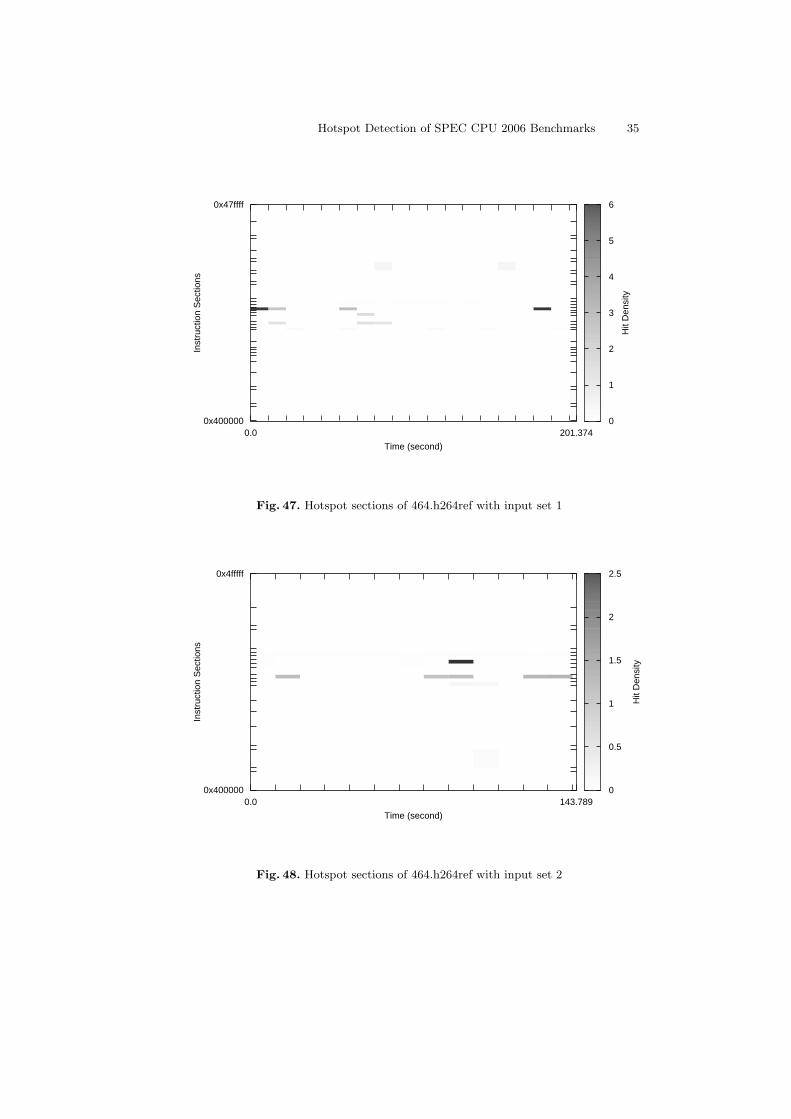
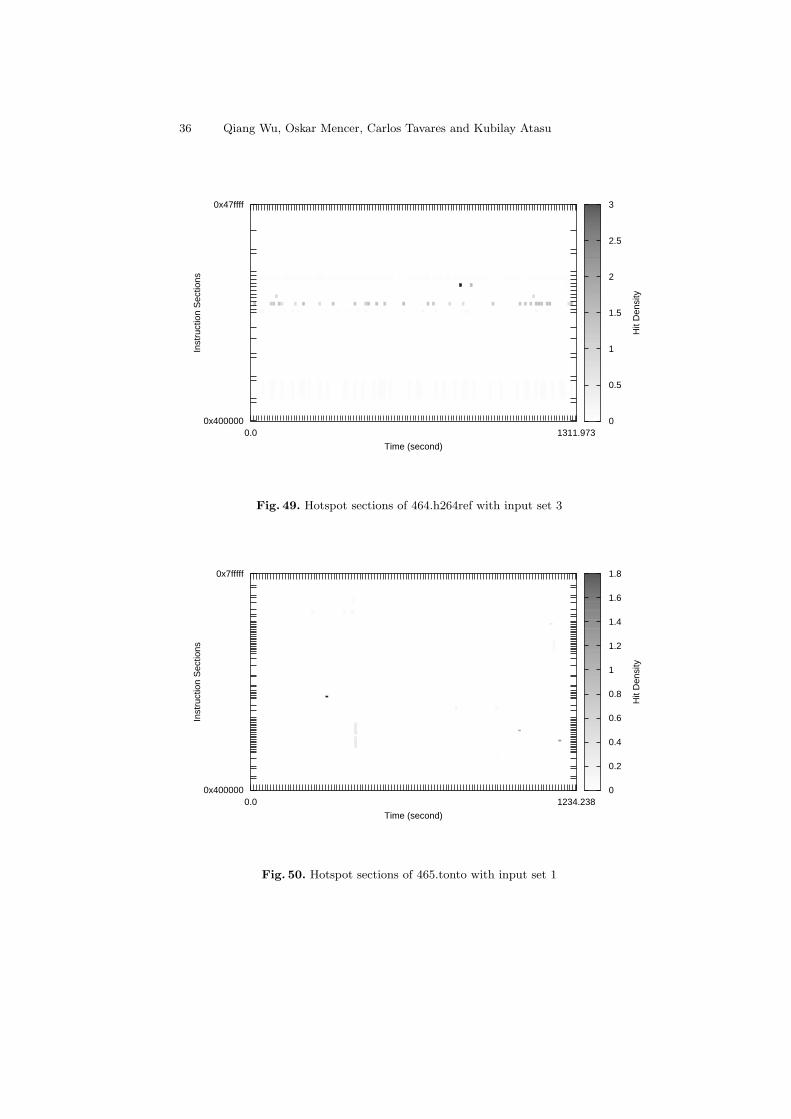
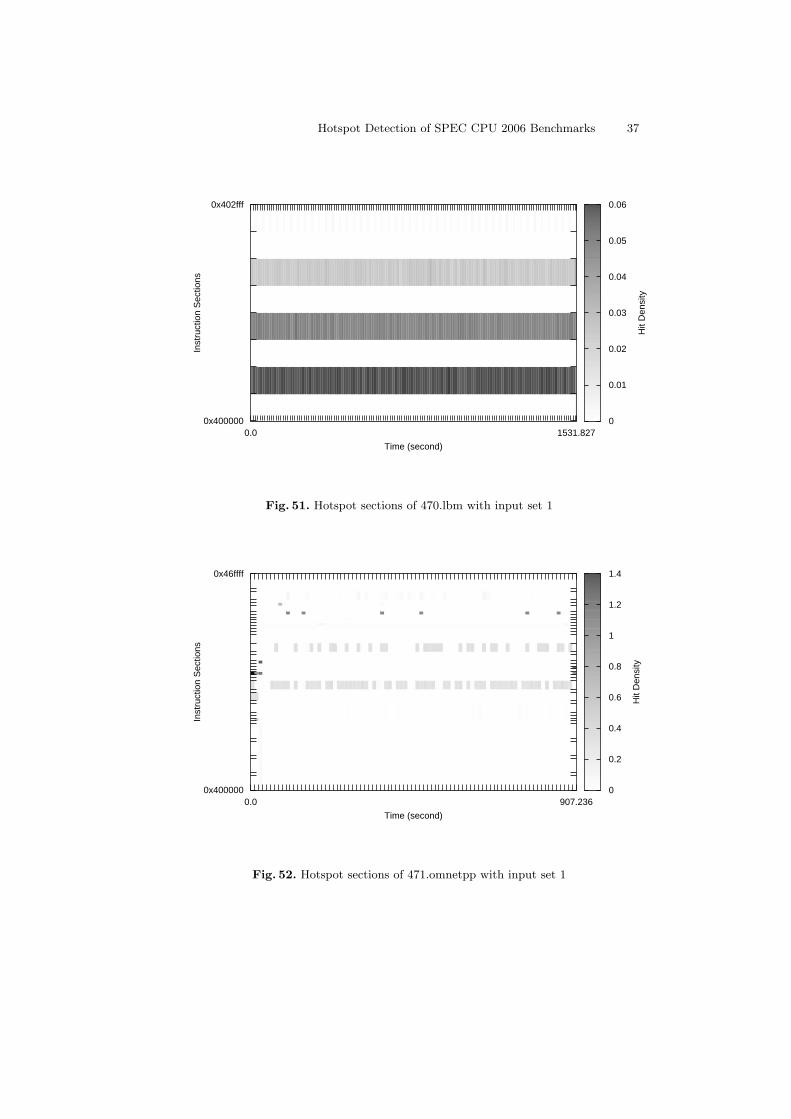
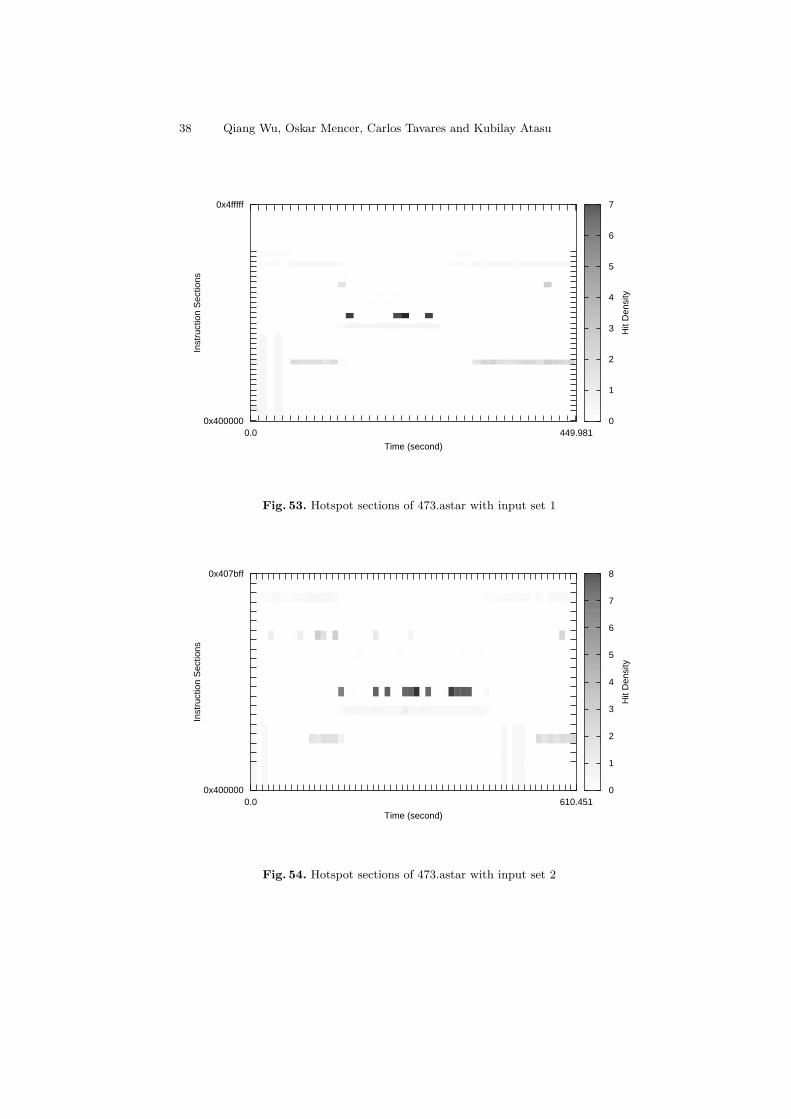
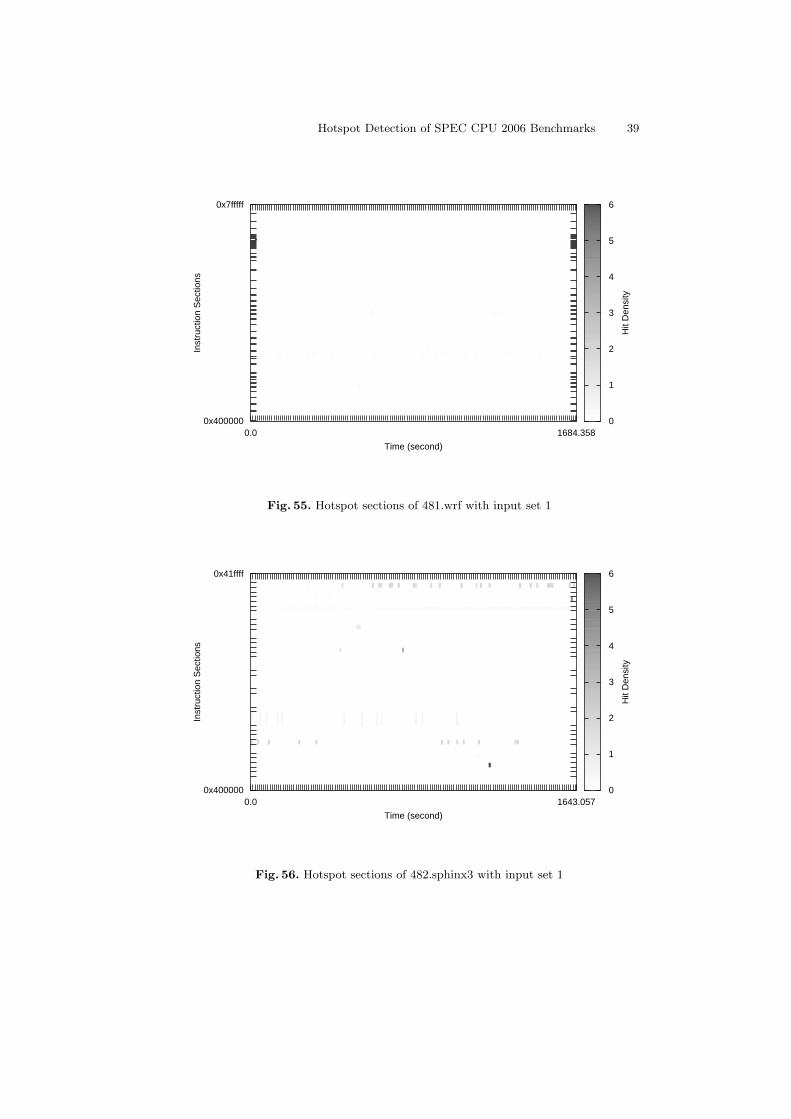
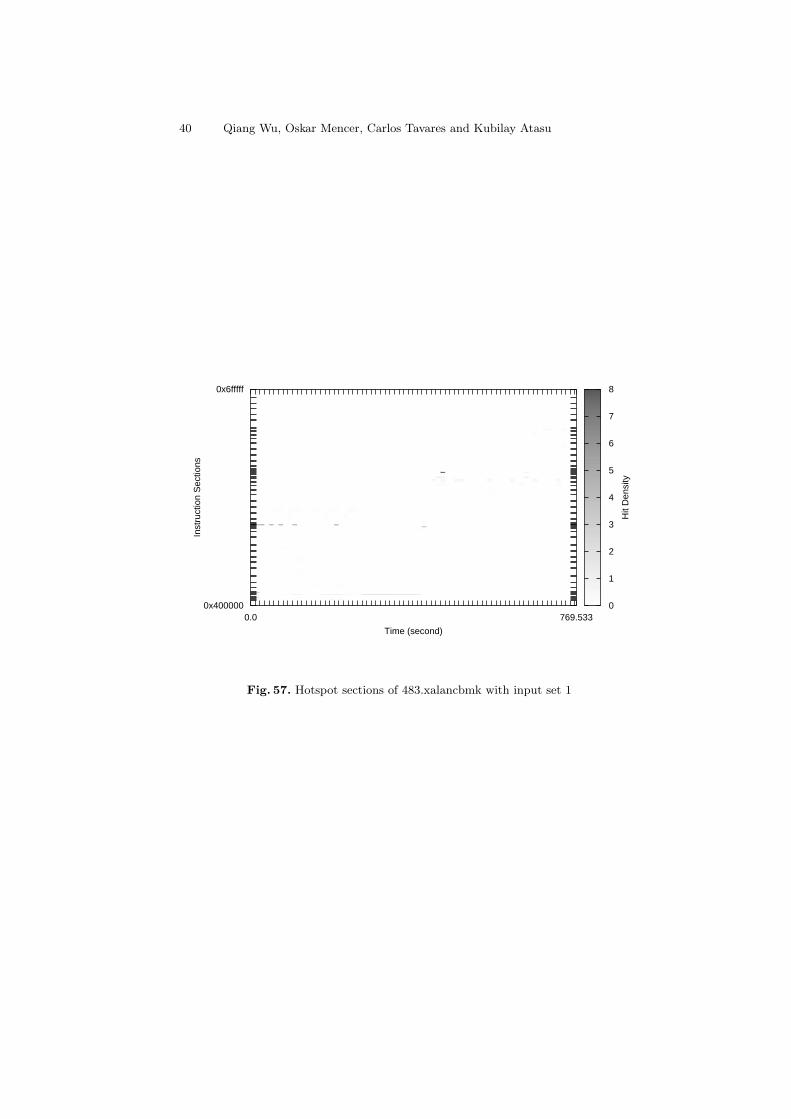
The graphs in the following show the hotspot sections detected at each intervalof time during the execution of SPEC CPU 2006 benchmarks. The X axis ofeach graph represents the time in seconds. Each tic along the X axis separatesthe sampling period of the hotspot sections. Currently the period is set to be 10seconds long. Since the benchmarks do not have an execution time as the timesof 10 seconds, the last period on the X axis of each graph is not necessarily 10seconds. The Y axis represents the sections of IP addresses. Each pair of ticsalong the Y axis indicates one section and one separating space alternatively. Thecolored boxes in the graphs indicates the hit density of the section at the giventime interval. If a section has more IP addresses falling in during the specifictime interval, the color of the corresponding box is darker. The hit density iscalculated by dividing the number of IP addresses falling in the section at thegiven time interval with the size of the section and the length of the time interval.
Form the graphs, we can see that most SPEC CPU 2006 benchmarks haveseveral hotspot sections, but not active all the way of the execution, probablydue to the dynamic characteristics of the benchmarks, or due to the incompletecoverage of the statistical sampling. Exceptional cases are the graphs of 470.lbmand 481.wrf benchmarks. 470.lbm seems to have steadly active hotspot sectionsduring the execution, while 481.wrf seems to have no easily visuable hotspotsections in its graph. We may make more specific experiments for the 470.lbmand 481.wrf in the future to find out the detailed reasons.
Hotspot Detection of SPEC CPU 2006 Benchmarks 13
0
0.2
0.4
0.6
0.8
1
1.2
Hit
Den
sity
0.0 458.872
Time (second)
0x400000
0x4fffffIn
stru
ctio
n S
ectio
ns
Fig. 3. Hotspot sections of 400.perlbench with input set 1
0
0.1
0.2
0.3
0.4
0.5
0.6
0.7
0.8
0.9
1
Hit
Den
sity
0.0 146.417
Time (second)
0x400000
0x4fffff
Inst
ruct
ion
Sec
tions
Fig. 4. Hotspot sections of 400.perlbench with input set 2
14 Qiang Wu, Oskar Mencer, Carlos Tavares and Kubilay Atasu
0
0.5
1
1.5
2
2.5
3
3.5
Hit
Den
sity
0.0 224.475
Time (second)
0x400000
0x4fffffIn
stru
ctio
n S
ectio
ns
Fig. 5. Hotspot sections of 400.perlbench with input set 3
0
1
2
3
4
5
6
Hit
Den
sity
0.0 232.667
Time (second)
0x400000
0x40bfff
Inst
ruct
ion
Sec
tions
Fig. 6. Hotspot sections of 401.bzip2 with input set 1
Hotspot Detection of SPEC CPU 2006 Benchmarks 15
0
0.5
1
1.5
2
2.5
3
3.5
4
4.5
Hit
Den
sity
0.0 94.483
Time (second)
0x400000
0x40bfffIn
stru
ctio
n S
ectio
ns
Fig. 7. Hotspot sections of 401.bzip2 with input set 2
0
0.5
1
1.5
2
2.5
3
3.5
Hit
Den
sity
0.0 195.8
Time (second)
0x401800
0x40bfff
Inst
ruct
ion
Sec
tions
Fig. 8. Hotspot sections of 401.bzip2 with input set 3
16 Qiang Wu, Oskar Mencer, Carlos Tavares and Kubilay Atasu
0
0.5
1
1.5
2
2.5
3
3.5
Hit
Den
sity
0.0 228.923
Time (second)
0x401000
0x40bfffIn
stru
ctio
n S
ectio
ns
Fig. 9. Hotspot sections of 401.bzip2 with input set 4
0
0.5
1
1.5
2
2.5
3
3.5
4
4.5
5
Hit
Den
sity
0.0 311.862
Time (second)
0x400000
0x40bfff
Inst
ruct
ion
Sec
tions
Fig. 10. Hotspot sections of 401.bzip2 with input set 5
Hotspot Detection of SPEC CPU 2006 Benchmarks 17
0
0.5
1
1.5
2
2.5
Hit
Den
sity
0.0 188.66
Time (second)
0x400000
0x40bfffIn
stru
ctio
n S
ectio
ns
Fig. 11. Hotspot sections of 401.bzip2 with input set 6
0
1
2
3
4
5
6
7
Hit
Den
sity
0.0 77.786
Time (second)
0x400000
0x6fffff
Inst
ruct
ion
Sec
tions
Fig. 12. Hotspot sections of 403.gcc with input set 1
18 Qiang Wu, Oskar Mencer, Carlos Tavares and Kubilay Atasu
0
0.01
0.02
0.03
0.04
0.05
0.06
0.07
Hit
Den
sity
0.0 104.4
Time (second)
0x400000
0x6fffffIn
stru
ctio
n S
ectio
ns
Fig. 13. Hotspot sections of 403.gcc with input set 2
0
0.5
1
1.5
2
2.5
Hit
Den
sity
0.0 138.589
Time (second)
0x400000
0x6fffff
Inst
ruct
ion
Sec
tions
Fig. 14. Hotspot sections of 403.gcc with input set 3
Hotspot Detection of SPEC CPU 2006 Benchmarks 19
0
0.1
0.2
0.3
0.4
0.5
0.6
0.7
0.8
0.9
1
Hit
Den
sity
0.0 95.932
Time (second)
0x400000
0x6fffffIn
stru
ctio
n S
ectio
ns
Fig. 15. Hotspot sections of 403.gcc with input set 4
0
1
2
3
4
5
6
Hit
Den
sity
0.0 122.556
Time (second)
0x400000
0x6fffff
Inst
ruct
ion
Sec
tions
Fig. 16. Hotspot sections of 403.gcc with input set 5
20 Qiang Wu, Oskar Mencer, Carlos Tavares and Kubilay Atasu
0
1
2
3
4
5
6
Hit
Den
sity
0.0 178.65
Time (second)
0x400000
0x6fffffIn
stru
ctio
n S
ectio
ns
Fig. 17. Hotspot sections of 403.gcc with input set 6
0
1
2
3
4
5
6
7
Hit
Den
sity
0.0 194.06
Time (second)
0x400000
0x6fffff
Inst
ruct
ion
Sec
tions
Fig. 18. Hotspot sections of 403.gcc with input set 7
Hotspot Detection of SPEC CPU 2006 Benchmarks 21
0
1
2
3
4
5
6
7
8
Hit
Den
sity
0.0 199.725
Time (second)
0x400000
0x6fffffIn
stru
ctio
n S
ectio
ns
Fig. 19. Hotspot sections of 403.gcc with input set 8
0
0.01
0.02
0.03
0.04
0.05
0.06
0.07
Hit
Den
sity
0.0 35.093
Time (second)
0x400000
0x6fffff
Inst
ruct
ion
Sec
tions
Fig. 20. Hotspot sections of 403.gcc with input set 9
22 Qiang Wu, Oskar Mencer, Carlos Tavares and Kubilay Atasu
0
0.5
1
1.5
2
2.5
3
3.5
4
4.5
5
Hit
Den
sity
0.0 2884.562
Time (second)
0x400000
0x4fffffIn
stru
ctio
n S
ectio
ns
Fig. 21. Hotspot sections of 410.bwaves with input set 1
0
0.1
0.2
0.3
0.4
0.5
0.6
0.7
0.8
0.9
1
Hit
Den
sity
0.0 371.735
Time (second)
0x400000
0xafffff
Inst
ruct
ion
Sec
tions
Fig. 22. Hotspot sections of 416.gamess with input set 1
Hotspot Detection of SPEC CPU 2006 Benchmarks 23
0
1
2
3
4
5
6
7
8
Hit
Den
sity
0.0 235.205
Time (second)
0x400000
0xafffffIn
stru
ctio
n S
ectio
ns
Fig. 23. Hotspot sections of 416.gamess with input set 2
0
0.5
1
1.5
2
2.5
3
3.5
4
4.5
Hit
Den
sity
0.0 1133.934
Time (second)
0x400000
0xafffff
Inst
ruct
ion
Sec
tions
Fig. 24. Hotspot sections of 416.gamess with input set 3
24 Qiang Wu, Oskar Mencer, Carlos Tavares and Kubilay Atasu
0
1
2
3
4
5
6
Hit
Den
sity
0.0 1587.722
Time (second)
0x400000
0x402fffIn
stru
ctio
n S
ectio
ns
Fig. 25. Hotspot sections of 429.mcf with input set 1
0
0.5
1
1.5
2
2.5
3
3.5
Hit
Den
sity
0.0 1062.142
Time (second)
0x400000
0x417fff
Inst
ruct
ion
Sec
tions
Fig. 26. Hotspot sections of 433.milc with input set 1
Hotspot Detection of SPEC CPU 2006 Benchmarks 25
0
0.1
0.2
0.3
0.4
0.5
0.6
0.7
0.8
0.9
1
Hit
Den
sity
0.0 1172.486
Time (second)
0x400000
0x47ffffIn
stru
ctio
n S
ectio
ns
Fig. 27. Hotspot sections of 434.zeusmp with input set 1
0
0.5
1
1.5
2
2.5
3
Hit
Den
sity
0.0 1005.061
Time (second)
0x400000
0x4bffff
Inst
ruct
ion
Sec
tions
Fig. 28. Hotspot sections of 435.gromacs with input set 1
26 Qiang Wu, Oskar Mencer, Carlos Tavares and Kubilay Atasu
0
1
2
3
4
5
6
7
Hit
Den
sity
0.0 2056.7
Time (second)
0x400000
0x47ffffIn
stru
ctio
n S
ectio
ns
Fig. 29. Hotspot sections of 436.cactusADM with input set 1
0
0.5
1
1.5
2
2.5
3
3.5
4
4.5
Hit
Den
sity
0.0 1242.327
Time (second)
0x401000
0x41ffff
Inst
ruct
ion
Sec
tions
Fig. 30. Hotspot sections of 437.leslie3d with input set 1
Hotspot Detection of SPEC CPU 2006 Benchmarks 27
0
1
2
3
4
5
6
7
8
Hit
Den
sity
0.0 818.435
Time (second)
0x400000
0x4fffffIn
stru
ctio
n S
ectio
ns
Fig. 31. Hotspot sections of 444.namd with input set 1
0
0.1
0.2
0.3
0.4
0.5
0.6
0.7
0.8
0.9
1
Hit
Den
sity
0.0 110.891
Time (second)
0x400000
0x4bffff
Inst
ruct
ion
Sec
tions
Fig. 32. Hotspot sections of 445.gobmk with input set 1
28 Qiang Wu, Oskar Mencer, Carlos Tavares and Kubilay Atasu
0
0.2
0.4
0.6
0.8
1
1.2
1.4
1.6
Hit
Den
sity
0.0 286.856
Time (second)
0x400000
0x4bffffIn
stru
ctio
n S
ectio
ns
Fig. 33. Hotspot sections of 445.gobmk with input set 2
0
1
2
3
4
5
6
Hit
Den
sity
0.0 156.531
Time (second)
0x400000
0x4bffff
Inst
ruct
ion
Sec
tions
Fig. 34. Hotspot sections of 445.gobmk with input set 3
Hotspot Detection of SPEC CPU 2006 Benchmarks 29
0
0.05
0.1
0.15
0.2
0.25
0.3
Hit
Den
sity
0.0 109.752
Time (second)
0x400000
0x4fffffIn
stru
ctio
n S
ectio
ns
Fig. 35. Hotspot sections of 445.gobmk with input set 4
0
0.2
0.4
0.6
0.8
1
1.2
1.4
1.6
Hit
Den
sity
0.0 149.628
Time (second)
0x404000
0x4bffff
Inst
ruct
ion
Sec
tions
Fig. 36. Hotspot sections of 445.gobmk with input set 5

30 Qiang Wu, Oskar Mencer, Carlos Tavares and Kubilay Atasu
0
1
2
3
4
5
6
7
Hit
Den
sity
0.0 1069.75
Time (second)
0x400000
0x6fffffIn
stru
ctio
n S
ectio
ns
Fig. 37. Hotspot sections of 447.dealII with input set 1
0
1
2
3
4
5
6
7
Hit
Den
sity
0.0 508.335
Time (second)
0x400000
0x47ffff
Inst
ruct
ion
Sec
tions
Fig. 38. Hotspot sections of 450.soplex with input set 1

Hotspot Detection of SPEC CPU 2006 Benchmarks 31
0
0.2
0.4
0.6
0.8
1
1.2
1.4
1.6
1.8
Hit
Den
sity
0.0 469.694
Time (second)
0x400000
0x47ffffIn
stru
ctio
n S
ectio
ns
Fig. 39. Hotspot sections of 450.soplex with input set 2
0
0.1
0.2
0.3
0.4
0.5
0.6
Hit
Den
sity
0.0 433.771
Time (second)
0x400000
0x4fffff
Inst
ruct
ion
Sec
tions
Fig. 40. Hotspot sections of 453.povray with input set 1
32 Qiang Wu, Oskar Mencer, Carlos Tavares and Kubilay Atasu
0
1
2
3
4
5
6
7
8
Hit
Den
sity
0.0 3067.571
Time (second)
0x400000
0x5fffffIn
stru
ctio
n S
ectio
ns
Fig. 41. Hotspot sections of 454.calculix with input set 1
0
0.05
0.1
0.15
0.2
0.25
0.3
0.35
0.4
0.45
Hit
Den
sity
0.0 381.304
Time (second)
0x400000
0x42ffff
Inst
ruct
ion
Sec
tions
Fig. 42. Hotspot sections of 456.hmmer with input set 1
Hotspot Detection of SPEC CPU 2006 Benchmarks 33
0
0.05
0.1
0.15
0.2
0.25
0.3
Hit
Den
sity
0.0 764.491
Time (second)
0x400000
0x4fffffIn
stru
ctio
n S
ectio
ns
Fig. 43. Hotspot sections of 456.hmmer with input set 2
0
0.5
1
1.5
2
2.5
3
3.5
4
Hit
Den
sity
0.0 1120.176
Time (second)
0x400000
0x417fff
Inst
ruct
ion
Sec
tions
Fig. 44. Hotspot sections of 458.sjeng with input set 1
34 Qiang Wu, Oskar Mencer, Carlos Tavares and Kubilay Atasu
0
0.1
0.2
0.3
0.4
0.5
0.6
Hit
Den
sity
0.0 1696.691
Time (second)
0x400000
0x45ffffIn
stru
ctio
n S
ectio
ns
Fig. 45. Hotspot sections of 459.GemsFDTD with input set 1
0
0.5
1
1.5
2
2.5
3
Hit
Den
sity
0.0 1710.23
Time (second)
0x401000
0x407fff
Inst
ruct
ion
Sec
tions
Fig. 46. Hotspot sections of 462.libquantum with input set 1
Hotspot Detection of SPEC CPU 2006 Benchmarks 35
0
1
2
3
4
5
6
Hit
Den
sity
0.0 201.374
Time (second)
0x400000
0x47ffffIn
stru
ctio
n S
ectio
ns
Fig. 47. Hotspot sections of 464.h264ref with input set 1
0
0.5
1
1.5
2
2.5
Hit
Den
sity
0.0 143.789
Time (second)
0x400000
0x4fffff
Inst
ruct
ion
Sec
tions
Fig. 48. Hotspot sections of 464.h264ref with input set 2
36 Qiang Wu, Oskar Mencer, Carlos Tavares and Kubilay Atasu
0
0.5
1
1.5
2
2.5
3
Hit
Den
sity
0.0 1311.973
Time (second)
0x400000
0x47ffffIn
stru
ctio
n S
ectio
ns
Fig. 49. Hotspot sections of 464.h264ref with input set 3
0
0.2
0.4
0.6
0.8
1
1.2
1.4
1.6
1.8
Hit
Den
sity
0.0 1234.238
Time (second)
0x400000
0x7fffff
Inst
ruct
ion
Sec
tions
Fig. 50. Hotspot sections of 465.tonto with input set 1
Hotspot Detection of SPEC CPU 2006 Benchmarks 37
0
0.01
0.02
0.03
0.04
0.05
0.06
Hit
Den
sity
0.0 1531.827
Time (second)
0x400000
0x402fffIn
stru
ctio
n S
ectio
ns
Fig. 51. Hotspot sections of 470.lbm with input set 1
0
0.2
0.4
0.6
0.8
1
1.2
1.4
Hit
Den
sity
0.0 907.236
Time (second)
0x400000
0x46ffff
Inst
ruct
ion
Sec
tions
Fig. 52. Hotspot sections of 471.omnetpp with input set 1
38 Qiang Wu, Oskar Mencer, Carlos Tavares and Kubilay Atasu
0
1
2
3
4
5
6
7
Hit
Den
sity
0.0 449.981
Time (second)
0x400000
0x4fffffIn
stru
ctio
n S
ectio
ns
Fig. 53. Hotspot sections of 473.astar with input set 1
0
1
2
3
4
5
6
7
8
Hit
Den
sity
0.0 610.451
Time (second)
0x400000
0x407bff
Inst
ruct
ion
Sec
tions
Fig. 54. Hotspot sections of 473.astar with input set 2
Hotspot Detection of SPEC CPU 2006 Benchmarks 39
0
1
2
3
4
5
6
Hit
Den
sity
0.0 1684.358
Time (second)
0x400000
0x7fffffIn
stru
ctio
n S
ectio
ns
Fig. 55. Hotspot sections of 481.wrf with input set 1
0
1
2
3
4
5
6
Hit
Den
sity
0.0 1643.057
Time (second)
0x400000
0x41ffff
Inst
ruct
ion
Sec
tions
Fig. 56. Hotspot sections of 482.sphinx3 with input set 1
40 Qiang Wu, Oskar Mencer, Carlos Tavares and Kubilay Atasu
0
1
2
3
4
5
6
7
8
Hit
Den
sity
0.0 769.533
Time (second)
0x400000
0x6fffff
Inst
ruct
ion
Sec
tions
Fig. 57. Hotspot sections of 483.xalancbmk with input set 1


![A Benchmark Proposal for datacenter computing · Application benchmarks PARSEC [72] (bodytrack, streamcluster) CPU, memory, file system offline batch execution time memcached memory,](https://img.pdfslide.us/doc/110x75/60222a8a903c2b62c92db0fa/a-benchmark-proposal-for-datacenter-application-benchmarks-parsec-72-bodytrack.jpg)


![PassMark Intel vs AMD CPU Benchmarks - High End · 2019-08-23 · $0' 5\]hq 7kuhdgulsshu ; 1$,qwho ;hrq ( y # *+] $0' (3](https://img.pdfslide.us/doc/110x75/5f32afa7b832ae3bf8127ab4/passmark-intel-vs-amd-cpu-benchmarks-high-end-2019-08-23-0-5hq-7kuhdgulsshu.jpg)