Embed Size (px)
Citation preview

HVS.com HVS | 2nd Floor, Paras Downtown Centre, Golf Course Road, Sector 53, Gurgaon 122 002, INDIA
NGI 2T 0A R YEB AEL RE SC
India
Achin Khanna, MRICS
Managing Director
Diksha ChopraAnalyst
2016
HOTELS IN INDIATRENDS & OPPORTUNITIES

18
2
18
3
21
4
23
2
21
6
25
5
25
6
27
1
28
9
31
2
33
5
34
8
39
7
42
4
49
5
58
6
69
8
86
1
99
3
1,0
85
1,1
36
12
0
12
2
16
3
18
0
17
4
19
9
19
9
21
5
21
1
23
5
25
2
26
8
31
6
34
9
40
7
46
2
55
1
71
7
81
4
87
2
88
7
151 150
131 129 124 128 129 126137 133 133 130
126 122 122 127 127120
122 124 128
-
20
40
60
80
100
120
140
160
-
200
400
600
800
1,000
1,200
Number of Rooms (00's) Number of Hotels Average Number of Rooms Per Hotel
alterations to the sample set of hotels for the two most recent years. Resultantly, figures reported for 2014/15 in this edition have a minor variance from the numbers published for the same period, last year.
Additionally, as a standard practice, we have weighted the number of room nights in 2015/16 to account for the new supply that was not operational for the entire fiscal in order to compute the overall occupancy and average rate. The weighted room count for 2015/16 is 1,10,293, up from 1,00,390 for 2014/15. Figure 1 illustrates survey participation for the last twenty one years till 2015/16.
The Indian Economy – An Overview
In a volatile global economic environment, India has emerged
as one of the better performing economies of the world, owing to relatively strong investor sentiment, domestic absorption and falling oil prices.
The National Democratic Alliance (NDA) led by BJP completed two years in office in May 2016. In 2014/15, the government set the tone for economic growth with emphasis on infrastructure, simplification of tax structure, and facilitation of entrepreneurship at both rural and urban levels. It further focused on creating an investor-friendly climate by fostering competition and streamlining bureaucracy.
FIGURE 1: SURVEY PARTICIPATION (1995/96 – 2015/16)
Source: HVS Research
For over two decades, HVS has collated data related to the hotel performance of the country through the annual Trends & Opportunities Survey. This report discusses the key hospitality trends as well as our outlook for the future, highlighting 13 major Indian markets. It further presents opportunities in the hospitality industry of specific interest to investors, developers and hotel operators.
Growing consistently since 1995/96 from just 120 hotels with about 18,000 branded/organised rooms to a record 887 hotels with a room count of 1,13,622 in 2015/16, the survey participant base has witnessed an increase of 5,170 rooms since the last survey.
In a bid to maintain strict control on the quality of data analysed and presented herein, we have made slight
At the close of 2015/16, the country saw macroeconomic
stability owing to a decline in inflation, fiscal deficit and
current account deficit. Going forward, the Union Budget
2016-17 has identified nine pillars that will support
economic growth for the country. These include tax reforms,
fiscal discipline, investment in infrastructure, ease of doing
business, agriculture and farmer welfare, rural sector, social
sector, education and job creation.
Inflation dropped dramatically in the past couple of years, from 9.5% in 2013/14 to 4.9% in 2015/16¹. This was largely as a result of decline in crude oil prices and timely management of inflation by the government through buffer stocking and import of select commodities, among other measures.
PAGE 2 | 2016 HOTELS IN INDIA TRENDS & OPPORTUNITIES
Introduction
The season's first rainfall. A child's first words. Your very first pay check. Beginnings are a cherished feeling! Why should it be any different in the world of hotels?
As HVS celebrates the beginning of its third decade of operations in India, the Indian Hospitality Sector raises a toast to the first year of a much awaited up-cycle. This year's Trends & Opportunities report bears witness to an appreciable increase in nationwide occupancy coupled with a nominal growth in average daily rate (ADR). As markets across most Indian cities Trumped (pun unintended) the previous year's performance, particularly noteworthy is the trend that ADRs increased after four years of consecutive decline, albeit marginally. Here we bring to you a detailed analysis of the year gone by, and the hope is that India's hotel industry stakeholders shall draw inspiration from their own recent performance and tread a path that continues to augment their Best Available Rate (BAR) offering, especially in light of the fact that occupancies are more than likely to further strengthen this year. Indeed, it is now time to raise the BAR!
1 Economic Survey of India 2015-16

-
2016 HOTELS IN INDIA TRENDS & OPPORTUNITIES | PAGE 3
Moving forward, a landmark tax reform likely to be implemented by the next fiscal is the Goods and Services Tax (GST), which aims at replacing the indirect taxes on all goods and services, making the tax base wider-ranging, transparent and inclusive. While the bill has been passed by the parliament, it is currently under the process of ratification by individual states. We touched upon this in last year's publication as well; however, progress on this front in recent weeks has finally made the possibility of this bill seeing fruition likely.
With respect to the Indian hospitality sector, the current tax structure comprises various levies such as VAT and Luxury Tax (LT), which can be confounding for the end consumer. Moreover, because taxation is a state subject, the quantum and calculation of taxes differ from state to state. At this stage, while the tax percentage is still under debate (and its impact in terms of increased or decreased expenses for the end consumer cannot be ascertained), the implementation of GST may at least bring uniformity in the tax structure for hotels, dispelling the current confusion.
Lastly, Britain's decision to exit the European Union (Brexit) is likely to have an adverse effect on parts of the global economy, consequently impacting the hospitality industry at large. Although subsequent fluctuation on international outbound travel from the UK is unpredictable, we foresee the impact on the Indian hospitality industry to be only marginal. In fact, in the coming years, we expect the Indian hospitality sector to continue exhibiting growth owing to the increased dependence on domestic demand.
Overall, the country's economic outlook remains positive.
Tourism Overview
The Indian Travel and Tourism Industry has been instrumental to the nation's economic growth. Over the years, it has also emerged as a significant source of foreign exchange and a large employment generator.
The sustained growth of this industry can be attributed to the r is ing m i d d l e c l a s s , i n f ra s t r u c t u ra l re fo r m s , increase in international tourist arrivals and tourism-friendly visa policies such as the extension of e-Tourist Visa to 150 countries. According to the World Travel & Tourism Council's (WTTC's) Economic Impact 2016 - India report, the
total contribution of Travel and Tourism to the GDP was `8,309.4 billion (6.3% of the GDP) in 2015. This is projected to grow by 7.3% to `8,913.6 billion in 2016 and eventually reach 18,362.2 billion (7.2% of the GDP) by 2026.
International Tourist Arrivals (ITA) grew by 4.2% in 2015, registering a compounded annual growth rate (CAGR) of
Additionally, the country's external balances rose from US$287 billion in July 2013 to US$353 billion in July 2016².
As per the revised method of calculating the national accounts with the base year as 2011/12, the Economic Survey of India 2015-16 estimated a GDP growth of 7.6% for the country, last fiscal. The Services sector continued to serve as the main driver of the economy, recording 9.2% growth over the previous year. Within the Services sector, the subsector comprising Trade, Hotels, Transport, Communication and Broadcasting Services is estimated to have grown by 9% in 2015/16 and more specifically, the growth in Hotels and Restaurants segment is estimated at 21.5%³ during the same time period.
2 Reserve Bank of India (RBI)3 Ministry of Statistics and Programme Implementation (MOSPI), Government of India
4Department of Industry Policy and Promotion (DIPP), Government of India
10.0
20.0
30.0
40.0
50.0
60.0
70.0
2011/12 2012/13 2013/14 2014/15** 2015/16*
2.0%
4.0%
6.0%
8.0%
10.0%
12.0%
Exchange Rate (`/USD) GDP Growth Inflation (CPI)***
* Advance Estimates | ** First Revised Estimates*** RBI moved from Wholesale Price Index (WPI) to Consumer Price Index (CPI) in 2014, providing a more accurate indication of inflation
FIGURE 2: GDP GROWTH, INFLATION AND EXCHANGE RATE –A FIVE-YEAR TREND
Figure 2 displays GDP Growth, Inflation and Exchange Rate from 2011/12 to 2015/16.
The last fiscal saw a further deceleration of the rupee against the US dollar, which can be attributed to the latter gaining against all major currencies on account of stronger growth in the US as well as the deterioration in China's growth and currency development. Nonetheless, in comparison to the currencies of most emerging market economies, the rupee withstood the depreciation pressure better. The average exchange rate at the closing of 2015/16 was `65.03/US$. Looking ahead, despite India's healthy macroeconomic fundamentals, the devaluation of emerging market currencies and monetary tightening by the Federal Reserve (US central bank) are likely to cause further depreciation of the rupee to the US dollar.
Advantaging GDP growth, 100% Foreign Direct Investment (FDI) has been introduced in trading, e-commerce, broadcasting carriage services, brown field aviation projects and pharmaceuticals, as per the Union Budget 2016-17. The total FDI inflow for 2015/16 was US$55,457 million⁴, which is 23% higher than the previous year. During the same period, Hotel and Tourism ranked as one of the top ten sectors to attract the highest FDI, contributing 3% of the total inflow.
-
According to the World Travel & Tourism Council's Economic Impact 2016 - India report, the total contribution of Travel and Tourism to the GDP was `8,309.4 billion (6.3% of the GDP) in 2015. This is projected to grow by 7.3% to `8,913.6 billion in 2016 and eventually re a c h ` 1 8 , 3 6 2 . 2 b i l l i o n (7.2% of the GDP) by 2026.

PAGE 4 | 2016 HOTELS IN INDIA TRENDS & OPPORTUNITIES
6.2% during the past five years. The top three source markets for India during the period 2013 to 2015 continued to be the US (15.1%), followed by Bangladesh (14.1%) and the UK (10.8%).
As an initiative to further boost inbound tourism, the Government of India plans to extend the e-Tourist Visa facility to an additional 36 countries after witnessing i n c re m e n t a l g row t h i n
tourist arrivals in the first quarter of 2016. On acceptance of this proposal, the facility will be available to 186 countries. As per the Ministry of Tourism, a total of 5,40,396 tourists arrived on an e-Tourist Visa between January and July this year as compared to 1,47,690 during the same period in 2015 - a whopping 266% increase.
Domestic demand for hotels in the country has historically been higher than inbound demand. A rise in spending capacity along with proliferation of low cost carriers has not only resulted in growth of domestic travel, but has also had a significant impact on the domestic travel spends. In 2015, domestic travel spending generated 82.5% of the direct Travel and Tourism GDP, which is expected to rise by 6.6% in 2016 to `6,284.4 billion⁵. Further, as an initiative to enhance regional connectivity and to make air travel more affordable for the growing middle class, the government capped the fare for one-hour flights at 2,500 in June 2016.
Although, the majority of demand for hotels originates from commercial activity, there is a large portion of Indians travelling for leisure, both within the country and overseas. In 2015, the WTTC estimates that leisure travel spending (inbound and domestic) generated 83.2% of the direct Travel and Tourism GDP (`5,945.5 billion) in comparison to 16.8% from business travel spending (`1,198.9 billion). We touch upon the potential of leisure demand in more detail later in this report.
Thus, acknowledging the vast scope of Travel and Tourism in
India, the government has proposed various initiatives such
as 'Project Mausam' and 'National Mission on Pilgrimage
Rejuvenation and Spiritual Augmentation Drive (PRASAD)'.
Fu r t h e r m o re , t h e U n i o n
Budget 2016-17 allocates
`1,590 million to the tourism
m i n i s t r y t o f o c u s o n
infrastructure development,
promotion and public ity
initiatives – all of which bode
well for the Indian tourism
sector.
Raising the BAR!
On a nationwide basis, new branded and/or organised supply grew by 9.9% last year. Demand outpaced it considerably to increase by almost 16.4% in the same period. The resultant marketwide occupancy of 63.4% in 2015/16 was thus a healthy 6% higher than the preceding year. When broken down by positioning, the improved occupancies are evident across all star-categories. Overall, this is the third consecutive year of occupancy growth. Figure 3, below, presents the nationwide supply and demand trend for a 15-year period.
The average daily rate story deserves a more meticulous review this year. While the absolute increase in ADR may not be something to write home about, the very fact that the weighted average rate for almost 900 branded/organised hotels across varied positioning, geographies and stabilisation statuses showed an enhancement over the preceding year, points to an overall improvement in the health of the hotel sector.
5World Travel & Tourism Council’s (WTTC’s) Economic Impact 2016 - India Report
51.6%
57.2%
64.8%
69.0% 71.5% 71.4%68.8%
59.5% 59.5%60.6% 59.3% 57.8%
58.4% 59.8%
63.4%
10.0%
20.0%
30.0%
40.0%
50.0%
60.0%
70.0%
80.0%
-
10,000
20,000
30,000
40,000
50,000
60,000
70,000
80,000
90,000
1,00,000
1,10,000
Available Room Nights Per Day Room Night Demand Per Day Occupancy
FIGURE 3: ROOM NIGHT DEMAND VS AVAILABLE ROOM NIGHTS (2001/2002 – 2015/16)
Source: HVS Research
PROJECT MAUSAM• Reconnect and re-establish
communications between countries of the Indian Ocean world
• Enhanced understanding of cultural values and concerns
• Understanding nat ional cultures
A total of 5,40,396 tourists arrived on an e-Tourist Visa between January and July this year as compared to 1,47,690 tourists during the same period in 2015 - a whopping 266% increase.

We also analysed year-on-year ADR growth by brand and found that more than 90% of the existing hotel chains (both domestic and international) were able to enrich their net rate across the board. In addition, though a variety of factors can influence a market's ADR growth story, demand outpacing new supply is invariably the first indicator to operators that as occupancy grows, rate can follow – the future addition of supply across most markets is being tracked at sub-10% annually, even as there is no reason to expect a slowdown in the double- digit growth in demand over the next few years. Lastly, all macro-economic factors are pointing squarely toward a general resurgence in the overall environment. Astute hotel operators would take note of these trends and plan their rate strategies accordingly.
While we have given credit where due, it is equally important that we highlight the challenges that have frequently marred the sector when it comes to room rate planning. Most hotel companies make vociferous claims that their global brands are the bee's knees. However, one finds sparse evidence of that in their average rate strategy. A marginal ADR increase in a brawny occupancy environment does not point to an acute understanding of revenue management. Most hotel companies prefer the asset-light, management contract driven path for their growth in India (and the broader Asia Pacific region), and one wonders if they are harnessing the requisite talent that can do justice to the revenue management discipline that is a key influencer in the profitability of hotels. In fact, firms that can offer quality third-party management or hands-on asset management to hotel owners are likely to have an important role in the future.
At the risk of sounding like a broken record, we assert yet again that shying away from a rate-driven strategy is not “being cautious”, it is “being scared”. It may surprise many to note that less than 2.5% of India's existing supply achieved an ADR of more than US$200 this past year. When compared to most maturing hotel markets across the globe, this number is shockingly low. The fact that we are staring at an up-cycle (unforeseen extremities aside) is hardly a matter of debate. This in itself should be ample reason for hotel operators to take a positive, assertive and optimistic view on their ability to increase ADRs consistently over the next several quarters.
As a recurring theme over the last few publications, we present Figure 4 and Figure 5, and analyse the performance of existing
supply vis-a-vis the performance of new/recent supply over the past five years. Figure 4 highlights that while nationwide occupancy for all branded hotels was 63.4% in 2015/16, hotels that have existed since 2011/12, achieved 66.2% occupancy last year. Displaying a similar trend, hotels that have been operating since 2012/13 clocked 65.5% occupancy in 2015/16. On the average rate front, while India's ADR was `5,541 in 2015/16, for hotels in existence since 2011/12 the ADR last year was `5,815 and for hotels that have been around since 2012/13 it was 5,696. Digging deeper, Figure 5 displays performance of only new hotels that have opened over the last five years. While first year occupancy performances of hotels that opened in 2011/12 through 2014/15 were all in the mid-to-late thirties, do note that hotels that opened in 2015/16 averaged 43.1% occupancy in their very first year. Similarly, first year
2016 HOTELS IN INDIA TRENDS & OPPORTUNITIES | PAGE 5
At the risk of sounding like a broken record, we assert yet again that shying away from a rate-driven strategy is not “being cautious”, it is “being scared”.
Source: HVS Research
FIGURE 4: PERFORMANCE OF EXISTING HOTELS (2011/12 – 2015/16)
44.0%
48.0%
52.0%
56.0%
60.0%
64.0%
68.0%
4,000
4,200
4,400
4,600
4,800
5,000
5,200
5,400
5,600
5,800
6,000
6,200
59.7%58.7%
60.4%
63.1%
66.2%
58.2%58.6%
61.3%
65.5%
58.6%
59.9%
64.5%
59.8%
64.0%63.4%
2011/12 2012/13 2013/14 2014/15 2015/16
Average Rate (`) 2011/12
Average Rate (`) 2014/15 Average Rate (`) 2015/16
Exis�ng Supply of 2011/12 Exis�ng Supply of 2012/13
Average Rate (`) 2013/14
Exis�ng Supply of 2013/14
Exis�ng Supply of 2014/15
Average Rate (`) 2012/13
Exis�ng Supply of 2015/16
FIGURE 5: PERFORMANCE OF NEW HOTELS (2011/12 – 2015/16)
Source: HVS Research
36.5%
44.8%
51.9%
58.1%
62.2%
39.7%
44.2%
52.2%
60.2%
38.9%
44.2%
57.1%
35.2%
49.5%
43.1%
32.0%
36.0%
40.0%
44.0%
48.0%
52.0%
56.0%
60.0%
64.0%
68.0%
4,000
4,200
4,400
4,600
4,800
5,000
5,200
5,400
5,600
5,800
6,000
6,200
Average Rate (`) 2013/14Average Rate (`) 2011/12 Average Rate (`) 2012/13
Average Rate (`) 2014/15 Average Rate (`) 2015/16
New Supply in 2011/12 New Supply in 2012/13 New Supply in 2013/14
New Supply in 2014/15 New Supply in 2015/16
2011/12 2012/13 2013/14 2014/15 2015/16

PAGE 6 | 2016 HOTELS IN INDIA TRENDS & OPPORTUNITIES
ADRs were successively lower than respective prior years when one studies data from the previous four fiscals; however, the ADR for hotels that opened in 2015/16 was higher than that of the new hotels that opened in 2014/15 and 2013/14. Relatively strong year one performances are yet another sign that the markets are in the early stages of an upswing.
Finally, we would like to highlight that HVS has been the recipient of several feasibility study requests over the last few months – a clear indication that developers and investors are displaying renewed interest in the sector. Hotel Architects, Interior Design companies, Law Firms, Lending Institutions and Hotel Brands are likely to see the same trend line in the months ahead. Given that we are usually the first point of contact when stakeholders decide to explore investment in the hotel business, the recent spike in queries leads us to further believe that the sector is being seen as an attractive proposition again.
Further analyses of market specific dynamics are rendered later in this report. Overall, we feel fairly certain in asserting that resurgence is evident and hotels that plan their short-to-medium term strategy with an eye at raising the BAR this year, may have much to cheer about.
Survey Results
This report analyses the performance of the branded and organised hotel market in India. The historical information gathered is arranged and interpreted based on star classifications followed by an emphasis on 13 major hotel markets. Moreover, the future supply in each market is analysed based on its positioning, proposed room count and development timeline in order to estimate changes over the next five years.
Industry Performance According to Star Category
Nationwide RevPAR performance was recorded at `3,512 in 2015/16, a significant growth of 6.1% over the preceding fiscal. The nationwide weighted occupancy (63.4%) swelled 6%, corresponding with a marginal increase of 0.1% in average daily rate (`5,541). A concurrent increase in occupancy and ADR was last seen in 2010/11.
Figure 6 illustrates hotel occupancy across the star categories in India between 1996/97 and 2015/16. Figures 7 and 8 show average rate and RevPAR for each of the star categories expressed in Indian rupees, respectively, followed by Figures 9 and 10 that present the corresponding data in US dollars.
FIG
UR
E 6
: K
EY O
PER
ATI
NG
CH
AR
AC
TER
ISTI
CS
BY
HO
TEL
CLA
SSIF
ICA
TIO
N –
OC
CU
PAN
CY
Ove
rall
Ave
rage
Five
-sta
r D
elu
xe
Five
-sta
r
Fou
r-st
ar
Thre
e-s
tar
19
96
/97
62
.9%
67
.6%
65
.7%
60
.5%
49
.2%
19
97
/98
57
.1%
62
.0%
58
.5%
58
.2%
47
.0%
19
98
/99
55
.4%
60
.2%
56
.4%
55
.9%
48
.2%
19
99
/00
53
.9%
58
.3%
55
.7%
53
.2%
47
.7%
20
00
/01
57
.2%
60
.9%
56
.1%
58
.7%
48
.8%
20
01
/02
51
.6%
52
.2%
51
.4%
52
.7%
49
.7%
20
02
/03
57
.2%
59
.3%
57
.0%
56
.4%
53
.6%
20
03
/04
64
.8%
65
.0%
66
.8%
68
.7%
59
.6%
20
04
/05
69
.0%
71
.4%
71
.1%
71
.8%
56
.7%
20
05
/06
71
.5%
73
.8%
70
.4%
72
.7%
65
.9%
20
06
/07
71
.4%
73
.0%
70
.2%
71
.7%
68
.9%
20
07
/08
68
.8%
71
.7%
67
.2%
68
.9%
64
.7%
20
08
/09
59
.5%
62
.5%
58
.5%
58
.5%
56
.2%
20
09
/10
59
.5%
61
.6%
58
.6%
60
.3%
55
.5%
20
10
/11
60
.6%
60
.9%
61
.9%
60
.7%
58
.5%
Two
-sta
r
20
11
/12
59
.3%
59
.8%
59
.1%
60
.0%
56
.9%
64
.8%
20
12
/13
57
.8%
60
.1%
55
.4%
57
.9%
56
.8%
59
.0%
20
13
/14
58
.4%
59
.9%
55
.7%
59
.1%
57
.9%
61
.0%
20
14
/15
*
59
.8%
61
.7%
57
.2%
61
.2%
59
.8%
57
.7%
20
15
/16
63
.4%
64
.7%
61
.1%
64
.8%
64
.3%
60
.2%
12
-Mo
nth
**
Ch
ange
6.0
%
4.8
%
6.8
%
5.9
%
7.6
%
4.3
%
Co
mp
ou
nd
ed
Gro
wth
0.0
%
-0.2
%
-0.4
%
0.4
%
1.4
%
-1.8
%
* Th
e 2
01
4/1
5 d
ata
ha
s b
een
mo
difi
ed t
o e
xclu
de
the
per
form
an
ce o
f ir
rele
vant
su
pp
ly**
Ch
an
ge
in 2
01
5/1
6 e
xpre
ssed
as
per
cent
ag
e o
f th
e fi
gu
re f
or
20
14
/15
Sou
rce:
HV
S R
esea
rch 19
96
/97
3,6
88
4,9
91
3,0
44
1,8
25
1,4
32
1
99
7/9
8
3,9
86
5,6
13
3,3
15
2,5
38
1,5
43
19
98
/99
3,9
03
5,5
72
3,5
16
2,2
96
1,4
57
19
99
/00
3,5
05
4,9
10
3,3
68
2,1
68
1,5
05
20
00
/01
3,7
31
5,1
02
3,4
47
2,3
92
1,6
73
20
01
/02
3,4
67
4,6
68
3,2
77
2,3
68
1,6
96
20
02
/03
3,2
69
4,3
35
3,1
14
2,2
46
1,6
69
20
03
/04
3,5
69
4,6
86
3,3
72
2,5
80
1,6
70
20
04
/05
4,2
99
5,6
06
3,8
97
3,0
88
1,8
30
20
05
/06
5,4
44
7,1
68
4,9
85
3,8
47
2,2
12
20
06
/07
7,0
71
9,7
78
6,5
06
5,1
11
3,0
12
20
07
/08
7,9
89
11
,20
0
7,6
52
5,7
22
3,4
88
20
08
/09
7,7
22
11
,09
6
7,2
68
5,7
45
3,5
30
20
09
/10
6,4
89
9,2
77
6,4
10
4,6
38
3,2
55
20
10
/11
6,5
13
9,3
50
6,3
80
4,9
05
3,3
48
Ove
rall
Ave
rage
Five
-sta
r D
elu
xe
Five
-sta
r
Fou
r-st
ar
Thre
e-s
tar
Two
-sta
r
20
11
/12
6,0
32
9,1
89
6,1
35
4,9
05
3,3
54
1,7
14
20
12
/13
5,7
79
8,9
82
5,8
81
4,6
91
3,2
52
1,8
49
20
13
/14
5,6
11
8,7
27
5,7
20
4,4
74
3,0
83
2,0
63
20
14
/15
*
5,5
32
8,8
15
5,5
59
4,3
61
3,0
39
2,0
63
20
15
/16
5,5
41
8,9
76
5,5
41
4,4
42
3,1
23
2,1
14
12
-Mo
nth
**
Ch
ange
0.1
%
1.8
%
-0.3
%
1.8
%
2.7
%
2.5
%
Co
mp
ou
nd
ed
Gro
wth
2.2
%
3.1
%
3.2
%
4.8
%
4.2
%
5.4
%
Sou
rce:
HV
S R
esea
rch
* Th
e 2
01
4/1
5 d
ata
ha
s b
een
mo
difi
ed t
o e
xclu
de
the
per
form
an
ce o
f ir
rele
vant
su
pp
ly**
Ch
an
ge
in 2
01
5/1
6 e
xpre
ssed
as
per
cent
ag
e o
f th
e fi
gu
re f
or
20
14
/15
FIG
UR
E 7
: K
EY O
PER
ATI
NG
CH
AR
AC
TER
ISTI
CS
BY
HO
TEL
CLA
SSIF
ICA
TIO
N –
AV
ERA
GE
RA
TE (
`)

2016 HOTELS IN INDIA TRENDS & OPPORTUNITIES | PAGE 7
19
96
/97
19
97
/98
19
98
/99
19
99
/00
20
00
/01
20
01
/02
20
02
/03
20
03
/04
20
04
/05
20
05
/06
20
06
/07
20
07
/08
20
08
/09
20
09
/10
20
10
/11
20
11
/12
20
12
/13
20
13
/14
20
14
/15
*2
01
5/1
6
12
-Mo
nth
**
Ch
ange
Co
mp
ou
nd
ed
Gro
wth
2,1
62
1,8
89
2,1
34
1,7
89
1,8
70
2,3
13
2,9
66
3,8
92
5,0
49
5,4
96
4,5
98
3,8
61
3,9
47
3,5
75
3,3
43
3,2
75
3,3
10
3,5
12
6.1
%2
.2%
3,3
54
2,8
63
3,1
07
2,4
37
2,5
71
3,0
46
4,0
03
5,2
90
7,1
38
8,0
30
6,9
33
5,7
15
5,6
94
5,4
91
5,3
98
5,2
31
5,4
38
5,8
03
6.7
%2
.9%
1,9
83
1,8
76
1,9
34
1,6
84
1,7
75
2,2
52
2,7
71
3,5
09
4,5
67
5,1
42
4,2
50
3,7
56
3,9
49
3,6
26
3,2
57
3,1
85
3,1
78
3,3
84
6.5
%2
.8%
1,2
83
1,1
53
1,4
04
1,2
48
1,2
67
1,7
72
2,2
17
2,7
97
3,6
65
3,9
42
3,3
62
2,7
97
2,9
77
2,9
42
2,7
18
2,6
43
2,6
69
2,8
77
7.8
%5
.2%
2,3
20
3,3
74
2,0
00
1,1
04
70
5
2,2
76
3,4
80
1,9
39
1,4
77
72
57
02
71
88
16
84
38
95
99
51
,03
81
,45
82
,07
52
,25
71
,98
51
,80
61
,95
91
,90
91
,84
81
,78
61
,81
72
,00
81
0.5
%5
.7%
Ove
rall
Ave
rage
Five
-sta
r D
elu
xe
Five
-sta
r
Fou
r-st
ar
Thre
e-s
tar
Two
-sta
r1
,11
01
,09
11
,25
81
,19
01
,27
26
.9%
3.5
%
* Th
e 2
01
4/1
5 d
ata
ha
s b
een
mo
difi
ed t
o e
xclu
de
the
per
form
an
ce o
f ir
rele
vant
su
pp
ly**
Ch
an
ge
in 2
01
5/1
6 e
xpre
ssed
as
per
cent
ag
e o
f th
e fi
gu
re f
or
20
14
/15
FIG
UR
E 8
: K
EY O
PER
ATI
NG
CH
AR
AC
TER
ISTI
CS
BY
HO
TEL
CLA
SSIF
ICA
TIO
N –
REV
PAR
(`)
Sou
rce:
HV
S R
esea
rch
19
97
/98
20
08
/09
Ove
rall
Ave
rage
Five
-sta
r D
elu
xe
Five
-sta
r
Fou
r-st
ar
Thre
e-s
tar
Two
-sta
r
12
-Mo
nth
**
Ch
ange
-5.8
%
-4.2
%
-6.3
%
-4.2
%
-3.4
%
-3.6
%
Co
mp
ou
nd
ed
Gro
wth
-1.1
%
-0.1
%
-0.2
%
1.4
%
1.0
%
-2.3
%
Exch
ange
Rat
e
19
96
/97
10
4
14
1 89
52
40
35
.4
11
0
15
5 91
70 43
36
.3
19
98
/99 90
12
8 79
61
37
42
.2
19
99
/00 81
11
3
77
50 35
43
.5
20
00
/01 83
11
4 77 53
37
44
.9
20
01
/02 73
99
69
50
36
47
.2
20
02
/03 68
90 65
47 35
48
.2
20
03
/04 78
10
2 73
56
36
46
.0
20
04
/05 96
12
5
87
69
41
44
.9
20
05
/06
12
2
16
1
11
2
86
50
44
.5
20
06
/07
16
2
22
4
14
9
11
7 69
43
.6
20
07
/08
19
9
27
8
19
0
14
2 87
40
.2
16
8
24
2
15
8
12
5
77
45
.9
20
09
/10
13
6
19
4
13
4 97
68
47
.7
20
10
/11
14
3
20
5
14
0
10
8 73
45
.6
20
11
/12
12
6
19
2
12
8
10
2
70
36
48
.0
20
12
/13
10
6
16
5
10
8 86
60
34
54
.5
20
13
/14 92
14
4 94
74 51
34
60
.7
20
14
/15
* 90
14
4 91
71
50
34
61
.2
20
15
/16 85
13
8 85
68
48 33
65
.0
* Th
e 2
01
4/1
5 d
ata
ha
s b
een
mo
difi
ed t
o e
xclu
de
the
per
form
an
ce o
f ir
rele
vant
su
pp
ly**
Ch
an
ge
in 2
01
5/1
6 e
xpre
ssed
as
per
cent
ag
e o
f th
e fi
gu
re f
or
20
14
/15
FIG
UR
E 9
: K
EY O
PER
ATI
NG
CH
AR
AC
TER
ISTI
CS
BY
HO
TEL
CLA
SSIF
ICA
TIO
N –
AV
ERA
GE
RA
TE (
US$
)
Sou
rce:
HV
S R
esea
rch
12
-Mo
nth
**
Ch
ange
Co
mp
ou
nd
ed
Gro
wth
-0.2
%-1
.0%
0.3
%-0
.3%
0.1
%-0
.6%
1.4
%1
.8%
3.9
%2
.4%
0.5
%-4
.1%
Ove
rall
Ave
rage
Five
-sta
r D
elu
xe
Five
-sta
r
Fou
r-st
ar
Thre
e-s
tar
Two
-sta
r
Exch
ange
Rat
e
19
96
/97 66 95
58 31
20
35
.4
19
97
/98 63
96 53
41
20
36
.3
19
98
/99 50 77
44
34 18
42
.2
19
99
/00 43
66 43
27
16
43
.5
20
00
/01 48 69 43
31
18
44
.9
20
01
/02 38 52
36
26
18
47
.2
20
02
/03 39 53
37
26 19
48
.2
20
03
/04 50
66 49
39
22
46
.0
20
04
/05 66 89
62
49 23
44
.9
20
05
/06 87
11
9 79 63
33
44
.5
20
06
/07
11
6
16
4
10
5
84 48
43
.6
20
07
/08
13
7
20
0
12
8 98
56
40
.2
20
08
/09
10
0
15
1 93
73
43
45
.9
20
09
/10 81
12
0 79
59
38
47
.7
20
10
/11 87
12
5 87 65
43
45
.6
20
11
/12 75
11
4 76 61
40 23
48
.0
20
12
/13 61
99
60
50
34 20
54
.5
20
13
/14 54 87
53
43
29 21
60
.7
20
14
/15
* 54 89
52
44 30 19
61
.2
20
15
/16 54 89
52
44 31
20
65
.0
FIG
UR
E 1
0:
KEY
OP
ERA
TIN
G C
HA
RA
CTE
RIS
TIC
S B
Y H
OTE
L C
LASS
IFIC
ATI
ON
– R
EVPA
R (
US$
)
* Th
e 2
01
4/1
5 d
ata
ha
s b
een
mo
difi
ed t
o e
xclu
de
the
per
form
an
ce o
f ir
rele
vant
su
pp
ly**
Ch
an
ge
in 2
01
5/1
6 e
xpre
ssed
as
per
cent
ag
e o
f th
e fi
gu
re f
or
20
14
/15
Sou
rce:
HV
S R
esea
rch

PAGE 8 | 2016 HOTELS IN INDIA TRENDS & OPPORTUNITIES
Each star category registered a year-on-year increase in
RevPAR in 2015/16, with the three-star category leading the
pack like the year before, recording a 10.5% growth. The
improvement in RevPAR across all star categories can be
attributed to both occupancy and average rate, with the
exception of five-star hotels.
Five-star hotels recorded the second highest growth in
occupancy (6.8%); however, this was the only star category
that logged a miniscule drop of 0.3% in its average rate last
year. In contrast, two-star hotels that had seen a marginal
decline in their overall performance in 2014/15, revived to
achieve a year-on-year increase of 4.3% in occupancy and
2.5% in average rate in 2015/16. This may be attributed to
the gradual escalation of commercial activity in Tier II and
Tier III cities as well as increased domestic travel.
Existing Supply – 2015/16
The existing room supply grew by 5.5% in 2015/16 totaling to 1,13,622 rooms (as of 31 March 2016). This takes into account 5,619 new rooms that entered various markets during the year, and the rest are an expansion of the sample set being tracked by HVS. Furthermore, the change in the total existing supply for 2014/15 is largely because of an intentional cleansing of the reported hotels so as to reflect quality branded/organised supply only.
Looking at the 13 markets analysed in this report, Agra saw the highest increase in supply (16%) in 2015/16, adding to the relatively small base of hotels, followed by Ahmedabad (7.1%) and New Delhi (6.4%).
In absolute terms, New Delhi maintained its top position with the largest number of branded hotel rooms in the
FIGURE 11: EXISTING SUPPLY ACROSS MAJOR CITIES (2006/07 – 2015/16)
* Supply tracked in 2014/15 has been modified due to the removal of irrelevant supply** Change in 2015/16 expressed as percentage of the figure for 2014/15*** Delhi NCR data (Shaded Por�on), rest New Delhi (excluding Gurgaon, NOIDA and Greater NOIDA) data**** Other Ci�es includes all other hotel markets across India
Source: HVS Research
Jaipur
Agra
Ahmedabad
Bengaluru
Chennai
New Delhi ***
Gurgaon
NOIDA
Goa
Hyderabad
Kolkata
Mumbai
Pune
Other Cities****
Total
2006/07
1,336
519
2,414
2,442
7,990
2,450
1,868
1,388
1,354
7,402
777
9,345
39,285
2007/08
1,336
675
3,456
2,826
9,019
2,768
2,554
1,556
1,396
8,454
1,346
11,596
46,982
2008/09
1,419
800
3,889
3,307
8,625
2,795
2,761
1,683
1,373
7,948
1,518
12,357
48,475
2009/10
1,439
1,521
5,597
3,806
8,129
1,980
300
3,288
3,782
2,472
1,520
9,877
2,672
15,412
61,795
2010/11
1,439
1,785
5,947
4,066
9,111
3,246
351
3,375
4,036
2,554
1,588
11,303
4,691
18,039
71,531
2011/12
1,739
1,975
7,713
4,904
10,697
3,782
527
3,885
4,797
3,054
1,787
12,052
5,672
21,729
84,313
2012/13
1,299
2,477
8,536
6,330
11,338
4,559
841
4,406
5,411
4,129
2,163
12,807
5,317
24,642
94,255
2013/14
1,293
2,777
10,162
7,105
12,370
5,190
1,239
4,703
5,734
4,523
2,243
13,022
6,159
24,657
1,01,177
2014/15*
1,755
2,944
11,117
7,444
13,193
5,323
1,322
5,298
5,954
4,822
2,701
12,865
6,137
26,820
1,07,695
2015/16
2,036
3,154
11,799
7,787
14,035
5,323
1,322
5,596
6,262
5,040
2,701
13,054
6,287
29,226
1,13,622
12-Month**Change
16.0%
7.1%
6.1%
4.6%
6.4%
0.0%
0.0%
5.6%
5.2%
4.5%
0.0%
1.5%
2.4%
9.0%
5.5%
CompoundedGrowth
4.8%
22.2%
19.3%
13.8%
6.5%
17.9%
28.0%
9.6%
14.4%
15.4%
8.0%
6.5%
26.2%
13.5%
12.5%
Number of Rooms Source: HVS Research
FIGURE 12: TOP 20 HOTEL BRANDS BY EXISTING INVENTORY (AUGUST 2016)
-
2,000
4,000
6,000
8,000
10,000
12,000
14,000
Taj H
otels, Reso
rts &
Palaces
(includes G
inger)
ITC Hotels (includes F
ortune)
Carlson Rezid
or Hotel G
roup
Marrio� In
terna�onal
Starwood Hotels &
Resorts
AccorHotels
Hya� Hotels Corp
ora�on
InterCon�nental H
otels Group
Sarovar Hotels &
Resorts
Oberoi Hotels &
Resorts
Lemon Tree Hotels
Wyndham World
wide
The Leela Palaces, Hotels &
Resorts
Hilton W
orldwide
Royal Orchid Group
The LaLit
Berggruen Hotels
Concept Hosp
itality
India Touris
m Development
Corpora�on
The Pride Group of H
otels

2016 HOTELS IN INDIA TRENDS & OPPORTUNITIES | PAGE 9
country, closely followed by Mumbai (including Navi Mumbai) and Bengaluru. NOIDA (including Greater NOIDA), continued to be the smallest hotel market among the 13 tracked here in, with an existing base of only 1,322 branded rooms in 2015/16.
Figure 11 shows the existing supply for the 13 major cities from 2006/07 to 2015/16.
Figure 12 presents the total operating inventory for the 20 largest hotel brands in the country as of August 2016.
While Taj Hotels Resorts and Palaces (including Ginger) continued to lead this group with the largest room inventory in the country, 2015/16 witnessed a shuffle among the other top players in the industry. For the first time in five years, Carlson Rezidor moved to the second position surpassing ITC Hotels (including Fortune), even as The Leela Palaces, Hotels & Resorts outpaced Wyndham Worldwide taking the 12�� position. Hilton Worldwide moved up to the 14�� rank displacing Royal Orchid Group, and Concept Hospitality swapped places with Berggruen Hotels at the 17�� position. The new entrant to the list this year is The Pride Group of Hotels, replacing Choice Hotels at the 20�� position.
Moving forward, as part of their expansion plans, the top hotel brands are shifting their focus toward emerging markets in order to target consumers beyond the traditional commercial segments. The smaller Tier II and Tier III Indian cities provide brands with the opportunity to expand their footprint faster with low barriers to entry, and help tap the domestic travel segment while establishing brand recall and loyalty.
Like last year, we also studied the prominent hotel ownership companies in India, presented in Figure 13. It is interesting to note that the owned inventories of the top 15 companies account for almost 34% of the existing branded supply.
Future Supply
The proposed supply landscape is ever-changing and subject to several external forces that can often delay project openings. Thus, HVS adopts a cautious and comprehensive approach to compute the supply probable to enter the market over the next five years. The information conscientiously gathered throughout the year, as well as via the annual Trends & Opportunities Survey, is examined thoroughly by the team. The resultant list of projects omits al l superficial statements made to the media or announcements made by real estate developers or owners to promote their brand and get greater visibility. The next step involves filtering the list based on confirmed tie-ups with an operator, planned number of rooms and anticipated date of opening. Substantial amount of time and effort is employed for assessing the probability of completion of each individual project. Therefore, as an unbiased third party, HVS meticulously analyses the future supply in the market.
Following last year's methodology, we have sliced the proposed supply further, contingent on the status of development. Only the late stage-planned and actively under construction supply have been included in the list. The inactive supply, even if announced or signed, has been removed from the five-year horizon if it's known to be delayed or abandoned.
It is noteworthy that the pipeline for proposed supply totaled 1,14,466 rooms back in 2007/08 – the highest in a decade, whereas in 2015/16 it contracted significantly to 56,912 rooms.
Figure 14 (table and chart) illustrates the branded supply
across the 13 major markets covered in this report.
Source: HVS Research
Total Inventory
FIGURE 13: PROMINENT HOTEL OWNERSHIP COMPANIES BY EXISTING INVENTORY (AUGUST 2016)
-
1,000
2,000
3,000
4,000
5,000
6,000
7,000
8,000
IHCL* ITC Hotels EIH Ltd. Lemon TreeHotels Ltd.
K. RahejaCorp
RootsCorporation
SAMHI InterGlobeHotels
Bharat Hotels HotelLeelaventure
Ltd.
Saraf HotelEnterprises**
Pride HotelsLtd.
ApeejaySurrendra
Group
Duet IndiaHotels
PanchshilHotels Pvt.
Ltd.
* IHCL includes Piem Hotels Ltd., Taj GVK Hotels & Resorts Ltd. and other Joint Venture Companies** Saraf Hotel Enterprises includes Juniper Hotels, Chartered Hotels Pvt. Ltd., Unison Hotels Ltd., Robust Hotels Pvt. Ltd., Asian Hotels (East) Ltd.

PAGE 10 | 2016 HOTELS IN INDIA TRENDS & OPPORTUNITIES
FIGURE 14: PROPOSED BRANDED HOTEL ROOMS ACROSS MAJOR CITIES (2015/16 – 2020/21**)
The “Other Cities” accounts for the rest of the markets
tracked by HVS. Subsequently, we have indicated the
percentage of the pipeline that constitutes Active
Development – rooms that recently opened, are currently
under construction or likely to enter the market within the
next five years. For potential investors, the Active
Development column requires scrupulous consideration,
since it reflects the actual progress of hotel development in
the market.
The overall Active Development ratio has seen an increase from 61% in 2014/15 to 66% in 2015/16.
Various hotel projects which were earlier either inactive or
* Proposed Supply includes 4,286 rooms which have been open for less than six months, and therefore, not included in the exis�ng supply
Existing Supply 2015/16
Proposed Supply*
Increase in Future Supply
Active Development of Supply Luxury Upscale Mid Market Budget Extended Stay
Agra 2,036 622 31% 28% 16.1% 32.2% 0.0% 51.8% 0.0%
Ahmedabad 3,154 1,238 39% 71% 23.7% 33.2% 36.6% 6.5% 0.0%
Bengaluru 11,799 5,209 44% 67% 12.8% 39.0% 28.2% 16.5% 3.5%
Chennai 7,787 2,312 30% 100% 0.0% 0.0% 44.0% 44.4% 11.6%
New Delhi 14,035 2,792 20% 92% 19.6% 48.7% 27.3% 4.4% 0.0%
Gurgaon 5,323 1,959 37% 70% 0.0% 34.8% 30.2% 18.0% 17.0%
NOIDA 1,322 2,561 194% 9% 0.0% 45.6% 31.7% 15.3% 7.4%
Goa 5,596 2,062 37% 90% 0.0% 37.3% 28.6% 34.1% 0.0%
Hyderabad 6,262 2,464 39% 32% 0.0% 14.9% 49.0% 26.5% 9.6%
Jaipur 5,040 960 19% 89% 0.0% 27.4% 64.7% 7.9% 0.0%
Kolkata 2,701 3,209 119% 64% 15.3% 34.1% 26.6% 24.1% 0.0%
Mumbai 13,054 4,166 32% 39% 23.6% 19.9% 32.2% 18.7% 5.6%
Pune 6,287 1,965 31% 73% 25.9% 19.8% 37.2% 17.2% 0.0%
Other Cities 29,226 25,393 87% 71% 0.5% 22.0% 48.7% 25.8% 3.0%
Total 1,13,622 56,912 50% 66% 6.5% 26.6% 40.1% 22.9% 3.9%
Source: HVS Research
** The supply for 2020/21 has been computed by adding the ac�ve future supply to the exis�ng base of rooms in 2015/16
2,036
3,154
11,799
7,787
14,035
5,323
1,322
5,596
6,262
5,040
2,701
13,054
6,287
2,208
4,027
15,265
10,099
16,605
6,691
1,552
7,445 7,059
5,890
4,744
14,686
7,717
-
2,000
4,000
6,000
8,000
10,000
12,000
14,000
16,000
18,000
Agra Ahmedabad Bengaluru Chennai New Delhi Gurgaon NOIDA Goa Hyderabad Jaipur Kolkata Mumbai Pune
2015/16 2020/21

on hold, are now actively under construction, partially
ex p l a i n i n g t h e i n c re a s e .
Moreover, this ratio also
accounts for recently opened
hotels (about 11%) that are too
yo u n g t o b e i n c l u d e d i n
existing supply.
The future supply has further been divided into its
potential positioning mix, consisting of luxury, upscale,
mid market, budget and extended stay segments.
Similar to recent years, the mid market segment has the
highest potential additions to supply, followed by the
upscale and budget segments.
Figure 15 presents the development trend across all
major markets .
Over the next five years, NOIDA (194%) and Kolkata
(119%) are anticipated to have the highest increase in
future supply among the 13 major cities tracked by
HVS. “Other cities” too may have a robust 87% growth
in supply during this period. Do note, however, that the
absolute number of proposed rooms is higher in
Bengaluru and Mumbai owing to them being larger
hotel markets. That being said, the highest percentages of supply actively under development are in Chennai (100%), followed by New Delhi (92%) and Goa (90%).
As stated earlier, the countrywide active development
of supply saw a significant increase in 2015/16 when
FIGURE 16: GROWTH OF ROOM SUPPLY – INDIA (2000/01 – 2020/21)
Source: HVS Research
1,13,622
1,51,324
-
20,000
40,000
60,000
80,000
1,00,000
1,20,000
1,40,000
1,60,000
1,80,000
2,00,000
2000/01 2015/16 2020/21
24,905
Number of Rooms Trendline
2016 HOTELS IN INDIA TRENDS & OPPORTUNITIES | PAGE 11
The highest percentages of supply actively under d e v e l o p m e n t a re i n Chennai (100%), followed by New Delhi (92%) and Goa (90%).
FIG
UR
E 1
5:
DIS
TRIB
UTI
ON
OF
EXIS
TIN
G A
ND
PR
OP
OSE
D B
RA
ND
ED H
OTE
L R
OO
MS
AC
RO
SS M
AJO
R C
ITIE
S (2
00
6/0
7 –
20
15
/16
)
Agr
a1
,33
6
1,3
36
1,4
19
1,4
39
1,4
39
1,7
39
1,2
99
1,2
93
1,7
55
2,0
36
32
%5
5%
75
%4
1%
22
%8
0%
76
%8
2%
43
%2
8%
Ah
me
dab
ad5
19
6
75
80
0
1,5
21
1
,78
5
1,9
75
2,4
77
2
,77
72
,94
43
,15
46
0%
47
%7
1%
69
%7
3%
69
%6
6%
86
%6
4%
71
%
Be
nga
luru
2,4
14
3,4
56
3,8
89
5,5
97
5,9
47
7,7
13
8,5
36
10
,16
21
1,1
17
11
,79
96
1%
60
%5
8%
65
%6
7%
71
%7
5%
66
%5
2%
67
%
2,4
42
2,8
26
3,3
07
3,8
06
4,0
66
4,9
04
6,3
30
7,1
05
7,4
44
7,7
87
Ch
en
nai
68
%7
1%
67
%7
2%
57
%5
8%
65
%8
0%
83
%1
00
%
Ne
w D
elh
i*7
,99
0 9
,01
98
,62
5
8,1
29
9
,11
1
10
,69
71
1,3
38
12
,37
01
3,1
93
14
,03
55
6%
51
%5
3%
75
%7
5%
87
%8
4%
71
%8
7%
92
%
Gu
rgao
n
1,9
80
3,2
46
3,7
82
4,5
59
5,1
90
5,3
23
5,3
23
55
%5
3%
54
%1
0%
70
%
NO
IDA
3
00
3
51
52
7
84
11
,23
91
,32
21
,32
23
7%
28
%7
0%
13
%9
%
Go
a
2
,45
02
,76
8
2,7
95
3,2
88
3
,37
53
,88
5
4,4
06
4,7
03
5,2
98
5,5
96
58
%4
2%
31
%4
1%
53
%5
3%
62
%6
8%
50
%9
0%
Hyd
era
bad
1,8
68
2,5
54
2,7
61
3,7
82
4,0
36
4,7
97
5,4
11
5,7
34
5,9
54
6,2
62
47
%6
4%
73
%6
3%
77
%7
4%
87
%7
8%
61
%3
2%
Jaip
ur
1
,38
81
,55
6
1
,68
3 2
,47
2
2,5
54
3,0
54
4
,12
94
,52
34
,82
25
,04
05
6%
53
%5
3%
77
%4
5%
52
%5
6%
82
%9
2%
89
%
Ko
lkat
a
1,3
54
1,3
96
1,3
73
1,5
20
1
,58
81
,78
7
2,1
63
2,2
43
2,7
01
2,7
01
67
%4
9%
62
%5
1%
58
%7
4%
64
%7
2%
70
%6
4%
Mu
mb
ai7
,40
28
,45
47
,94
89
,87
71
1,3
03
12
,05
21
2,8
07
13
,02
21
2,8
65
13
,05
44
9%
62
%7
3%
60
%3
5%
47
%4
2%
49
%3
3%
39
%
Pu
ne
7
77
1,3
46
1,5
18
2,6
72
4
,69
15
,67
2
5,3
17
6,1
59
6,1
37
6,2
87
77
%6
6%
52
%6
7%
56
%6
9%
67
%7
2%
64
%7
3%
Oth
er
Ci�
es
9
,34
51
1,5
96
12
,35
7 15
,41
2
18
,03
92
1,7
29
2
4,6
42
24
,65
72
6,8
20
29
,22
65
8%
60
%6
0%
65
%5
6%
48
%5
5%
71
%7
0%
71
%
Exis
�n
g Su
pp
lyA
c�ve
De
velo
pm
en
t o
f Su
pp
ly
20
06
/07
20
07
/08
20
08
/09
20
09
/10
2
01
0/1
1
20
11
/12
20
12
/13
2
01
3/1
42
01
4/1
52
01
5/1
62
00
6/0
72
00
7/0
82
00
8/0
92
00
9/1
02
01
0/1
12
01
1/1
22
01
2/1
32
01
3/1
42
01
4/1
52
01
5/1
6
Tota
l
39
,28
54
6,9
82
48
,47
5 61
,79
5
71
,53
18
4,3
13
9
4,2
55
1,01
,177
1,07
,695
1,13
,622
58
%5
8%
60
%6
7%
60
%5
8%
60
%6
9%
61
%6
6%
76
46
70
40
05
10
66
76
50
86
69
90
50
36
22
2,2
30
3,6
64
3,0
58
2,3
39
2,3
19
2,5
50
1,8
57
1,3
72
1,0
26
1,2
38
12
,88
21
5,5
42
10
,78
49
,81
91
2,5
09
9,7
16
10
,73
16
,91
15
,31
75
,20
9
6,2
13
7,1
47
4,9
45
5,9
95
7,8
19
7,5
47
5,3
31
3,8
85
3,3
11
2,3
12
19
,42
32
2,3
60
16
,56
02
0,0
21
18
,60
85
,62
66
,14
45
,35
52
,50
22
,79
2
5,8
18
5,0
33
3,2
68
2,0
84
1,9
59
5,5
22
5,6
15
2,4
06
1,8
73
2,5
61
3,0
58
3,3
53
2,1
78
1,7
36
2,1
54
2,4
22
2,6
22
2,2
91
1,7
43
2,0
62
10
,61
98
,25
05
,88
45
,30
25
,71
35
,26
53
,43
32
,89
32
,47
42
,46
4
4,0
12
2,9
37
3,3
57
2,6
64
4,8
67
3,3
56
2,8
59
1,7
06
1,1
19
96
0
3,6
44
5,9
65
4,0
25
3,4
81
3,6
12
3,1
18
3,5
11
2,5
84
2,8
70
3,2
09
11
,57
81
0,6
13
13
,38
67
,47
71
2,1
21
10
,89
69
,80
27
,89
65
,56
14
,16
6
8,0
72
8,2
43
8,0
54
5,1
96
5,5
45
4,6
45
3,7
05
2,6
20
2,0
05
1,9
65
19
,47
62
5,7
22
21
,48
42
4,9
09
26
,50
42
6,2
24
23
,14
12
3,8
73
23
,88
22
5,3
93
Pro
po
sed
Su
pp
ly
20
06
/07
20
07
/08
20
08
/09
20
09
/10
20
10
/11
20
11
/12
20
12
/13
20
13
/14
20
14
/15
20
15
/16
1,01
,971
1,14
,466
94
,11
58
9,4
49
1,02
,438
93
,35
58
4,6
50
68
,05
05
6,2
70
56
,91
2
Sou
rce:
HV
S R
esea
rch
* D
elh
i NC
R d
ata
(Sh
ad
ed P
or�
on
), r
est
New
Del
hi (
excl
ud
ing
Gu
rga
on
, NO
IDA
an
d G
rea
ter
NO
IDA
) d
ata
PAGE 12 | 2016 HOTELS IN INDIA TRENDS & OPPORTUNITIES
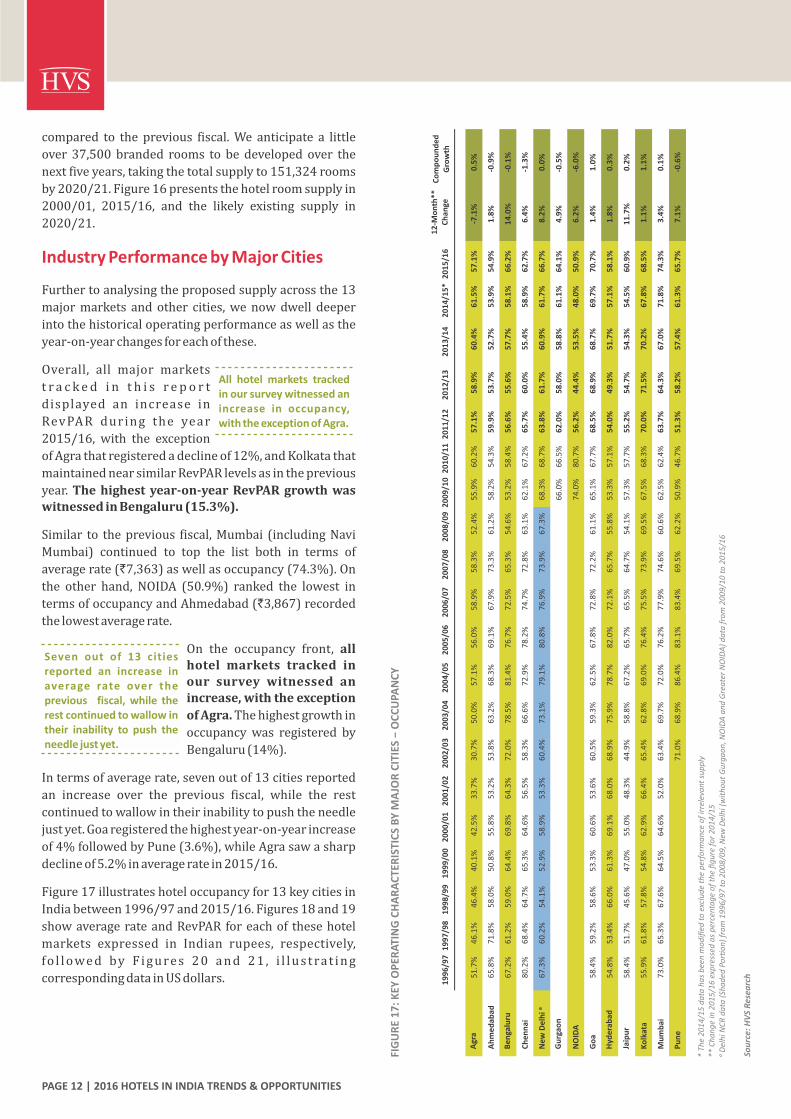
compared to the previous fiscal. We anticipate a little
over 37,500 branded rooms to be developed over the
next five years, taking the total supply to 151,324 rooms
by 2020/21. Figure 16 presents the hotel room supply in
2000/01, 2015/16, and the likely existing supply in
2020/21.
Industry Performance by Major Cities
Further to analysing the proposed supply across the 13
major markets and other cities, we now dwell deeper
into the historical operating performance as well as the
year-on-year changes for each of these.
Overall, all major markets
t r a c k e d i n t h i s r e p o r t
displayed an increase in
RevPAR during the year
2015/16, with the exception
of Agra that registered a decline of 12%, and Kolkata that
maintained near similar RevPAR levels as in the previous
year. The highest year-on-year RevPAR growth was witnessed in Bengaluru (15.3%).
Similar to the previous fiscal, Mumbai (including Navi
Mumbai) continued to top the list both in terms of
average rate (`7,363) as well as occupancy (74.3%). On
the other hand, NOIDA (50.9%) ranked the lowest in
terms of occupancy and Ahmedabad (`3,867) recorded
the lowest average rate.
On the occupancy front, all hotel markets tracked in our survey witnessed an increase, with the exception
of Agra. The highest growth in
occupancy was registered by
Bengaluru (14%).
In terms of average rate, seven out of 13 cities reported
an increase over the previous fiscal, while the rest
continued to wallow in their inability to push the needle
just yet. Goa registered the highest year-on-year increase
of 4% followed by Pune (3.6%), while Agra saw a sharp
decline of 5.2% in average rate in 2015/16.
Figure 17 illustrates hotel occupancy for 13 key cities in
India between 1996/97 and 2015/16. Figures 18 and 19
show average rate and RevPAR for each of these hotel
markets expressed in Indian rupees, respectively,
fo l l o we d by F i g u re s 2 0 a n d 2 1 , i l l u s t ra t i n g
corresponding data in US dollars.
Seven out of 13 cities reported an increase in average rate over the previous fiscal, while the rest continued to wallow in their inability to push the needle just yet.
All hotel markets tracked in our survey witnessed an increase in occupancy, with the exception of Agra.
12
-Mo
nth
**C
han
geC
om
po
un
de
dG
row
th1
99
6/9
71
99
7/9
81
99
8/9
91
99
9/0
02
00
0/0
12
00
1/0
22
00
2/0
32
00
3/0
42
00
4/0
52
00
5/0
62
00
6/0
72
00
7/0
82
00
8/0
92
00
9/1
02
01
0/1
12
01
1/1
22
01
2/1
32
01
3/1
42
01
4/1
5*
20
15
/16
Agr
a5
1.7
%4
6.1
%4
6.4
%4
0.1
%4
2.5
%3
3.7
%3
0.7
%5
0.0
%5
7.1
%5
6.0
%5
8.9
%5
8.3
%5
2.4
%5
5.9
%6
0.2
%5
7.1
%5
8.9
%6
0.4
%6
1.5
%5
7.1
%-7
.1%
0.5
%
Ah
me
dab
ad6
5.8
%7
1.8
%5
8.0
%5
0.8
%5
5.8
%5
3.2
%5
3.8
%6
3.2
%6
8.3
%6
9.1
%6
7.9
%7
3.3
%6
1.2
%5
8.2
%5
4.3
%5
9.9
%5
3.7
%5
2.7
%5
3.9
%5
4.9
%1
.8%
-0.9
%
Be
nga
luru
67
.2%
61
.2%
59
.0%
64
.4%
69
.8%
64
.3%
72
.0%
78
.5%
81
.4%
76
.7%
72
.5%
65
.3%
54
.6%
53
.2%
58
.4%
56
.6%
55
.6%
57
.7%
58
.1%
66
.2%
14
.0%
-0.1
%
Ch
en
nai
80
.2%
68
.4%
64
.7%
65
.3%
64
.6%
56
.5%
58
.3%
66
.6%
72
.9%
78
.2%
74
.7%
72
.8%
63
.1%
62
.1%
67
.2%
65
.7%
60
.0%
55
.4%
58
.9%
62
.7%
6.4
%-1
.3%
Ne
w D
elh
i �6
7.3
%6
0.2
%5
4.1
%5
2.9
%5
8.9
%5
3.3
%6
0.4
%7
3.1
%7
9.1
%8
0.8
%7
6.9
%7
3.9
%6
7.3
%6
8.3
%6
8.7
%6
3.8
%6
1.7
%6
0.9
%6
1.7
%6
6.7
%8
.2%
0.0
%
Gu
rgao
n6
6.0
%6
6.5
%6
2.0
%5
8.0
%5
8.8
%6
1.1
%6
4.1
%4
.9%
-0.5
%
NO
IDA
74
.0%
80
.7%
56
.2%
44
.4%
53
.5%
48
.0%
50
.9%
6.2
%-6
.0%
Go
a5
8.4
%5
9.2
%5
8.6
%5
3.3
%6
0.6
%5
3.6
%6
0.5
%5
9.3
%6
2.5
%6
7.8
%7
2.8
%7
2.2
%6
1.1
%6
5.1
%6
7.7
%6
8.5
%6
8.9
%6
8.7
%6
9.7
%7
0.7
%1
.4%
1.0
%
Hyd
era
bad
54
.8%
53
.4%
66
.0%
61
.3%
69
.1%
68
.0%
68
.9%
75
.9%
78
.7%
82
.0%
72
.1%
65
.7%
55
.8%
53
.3%
57
.1%
54
.0%
49
.3%
51
.7%
57
.1%
58
.1%
1.8
%0
.3%
Jaip
ur
58
.4%
51
.7%
45
.6%
47
.0%
55
.0%
48
.3%
44
.9%
58
.8%
67
.2%
65
.7%
65
.5%
64
.7%
54
.1%
57
.3%
57
.7%
55
.2%
54
.7%
54
.3%
54
.5%
60
.9%
11
.7%
0.2
%
Ko
lkat
a5
5.9
%6
1.8
%5
7.8
%5
4.8
%6
2.9
%6
6.4
%6
5.4
%6
2.8
%6
9.0
%7
6.4
%7
5.5
%7
3.9
%6
9.5
%6
7.5
%6
8.3
%7
0.0
%7
1.5
%7
0.2
%6
7.8
%6
8.5
%1
.1%
1.1
%
Mu
mb
ai7
3.0
%6
5.3
%6
7.6
%6
4.5
%6
4.6
%5
2.0
%6
3.4
%6
9.7
%7
2.0
%7
6.2
%7
7.9
%7
4.6
%6
0.6
%6
2.5
%6
2.4
%6
3.7
%6
4.3
%6
7.0
%7
1.8
%7
4.3
%3
.4%
0.1
%
Pu
ne
71
.0%
68
.9%
86
.4%
83
.1%
83
.4%
69
.5%
62
.2%
50
.9%
46
.7%
51
.3%
58
.2%
57
.4%
61
.3%
65
.7%
7.1
%-0
.6%
FIG
UR
E 1
7:
KEY
OP
ERA
TIN
G C
HA
RA
CTE
RIS
TIC
S B
Y M
AJO
R C
ITIE
S −
OC
CU
PAN
CY
* Th
e 2
01
4/1
5 d
ata
ha
s b
een
mo
difi
ed t
o e
xclu
de
the
per
form
an
ce o
f ir
rele
vant
su
pp
ly**
Ch
an
ge
in 2
01
5/1
6 e
xpre
ssed
as
per
cent
ag
e o
f th
e fi
gu
re f
or
20
14
/15
� D
elh
i NC
R d
ata
(Sh
ad
ed P
or�
on
) fr
om
19
96
/97
to
20
08
/09
, New
Del
hi (
wit
ho
ut
Gu
rga
on
, NO
IDA
an
d G
rea
ter
NO
IDA
) d
ata
fro
m 2
00
9/1
0 t
o 2
01
5/1
6
Sou
rce:
HV
S R
esea
rch

2016 HOTELS IN INDIA TRENDS & OPPORTUNITIES | PAGE 13
FIG
UR
E 1
8:
KEY
OP
ERA
TIN
G C
HA
RA
CTE
RIS
TIC
S B
Y M
AJO
R C
ITIE
S –
AV
ERA
GE
RA
TE (
`)
* Th
e 2
01
4/1
5 d
ata
ha
s b
een
mo
difi
ed t
o e
xclu
de
the
per
form
an
ce o
f ir
rele
vant
su
pp
ly**
Ch
an
ge
in 2
01
5/1
6 e
xpre
ssed
as
per
cent
ag
e o
f th
e fi
gu
re f
or
20
14
/15
� D
elh
i NC
R d
ata
(Sh
ad
ed P
or�
on
) fr
om
19
96
/97
to
20
08
/09
, New
Del
hi (
wit
ho
ut
Gu
rga
on
, NO
IDA
an
d G
rea
ter
NO
IDA
) d
ata
fro
m 2
00
9/1
0 t
o 2
01
5/1
6
Sou
rce:
HV
S R
esea
rch
12-M
on
th**
Ch
ange
Co
mp
ou
nd
edG
row
th19
96/9
719
97/9
819
98/9
919
99/0
020
00/0
120
01/0
220
02/0
320
03/0
420
04/0
520
05/0
620
06/0
720
07/0
820
08/0
920
09/1
020
10/1
120
11/1
220
12/1
320
13/1
420
14/1
5*20
15/1
6
Agr
a1,
826
2,02
71,
906
1,63
81,
586
1,84
01,
954
2,43
13,
012
3,62
24,
715
5,26
25,
322
5,77
36,
243
5,95
86,
126
6,33
86,
488
6,14
8-5
.2%
6.6%
Ah
med
abad
2,67
81,
833
2,22
02,
705
2,73
62,
354
2,16
42,
410
2,78
73,
111
3,52
64,
351
4,75
44,
540
4,28
53,
917
3,90
43,
734
3,75
33,
867
3.1%
2.0%
Ben
galu
ru3,
136
3,45
13,
254
3,02
53,
602
3,73
53,
752
4,83
27,
470
8,76
210
,406
9,82
79,
495
6,59
76,
776
6,29
35,
960
5,37
95,
368
5,43
01.
2%2.
9%
Ch
enn
ai3,
540
3,97
73,
600
3,42
43,
796
3,53
53,
224
3,32
33,
714
4,35
75,
378
6,34
06,
677
5,71
05,
632
5,52
45,
440
5,05
04,
825
4,77
2-1
.1%
1.6%
New
Del
hi �
4,00
74,
913
4,62
64,
115
4,52
64,
338
4,08
94,
269
5,10
36,
909
9,19
210
,429
9,81
18,
834
8,63
48,
174
7,38
76,
941
6,56
86,
266
-4.6
%2.
4%
Gu
rgao
n8,
247
7,55
47,
639
6,83
16,
569
6,24
16,
242
0.0%
-4.5
%
NO
IDA
7,49
67,
752
7,41
66,
724
5,96
45,
429
5,28
0-2
.7%
-5.7
%
Go
a2,
347
2,30
32,
863
2,72
72,
914
2,67
62,
754
3,08
63,
985
4,80
45,
801
6,25
56,
271
5,61
36,
056
6,16
26,
513
6,69
26,
819
7,09
44.
0%6.
0%
Hyd
erab
ad1,
604
1,64
61,
579
1,86
72,
316
2,41
42,
541
2,77
43,
772
4,87
05,
962
6,27
16,
297
5,14
65,
173
5,02
64,
854
4,55
64,
535
4,68
93.
4%5.
8%
Jaip
ur
1,83
62,
473
2,53
32,
514
2,90
22,
949
2,72
82,
980
3,46
14,
407
5,28
55,
664
5,98
24,
539
4,71
84,
727
4,84
34,
743
4,74
34,
873
2.7%
5.3%
Ko
lkat
a3,
556
3,95
13,
888
3,55
73,
698
3,40
92,
917
3,02
13,
240
3,88
75,
288
6,57
56,
686
6,08
76,
408
6,04
96,
093
5,73
95,
734
5,67
6-1
.0%
2.5%
Mu
mb
ai6,
229
6,16
96,
297
5,66
15,
555
4,93
24,
184
4,35
64,
822
6,04
18,
738
10,9
3210
,679
8,42
88,
194
7,92
37,
550
7,15
87,
230
7,36
31.
8%0.
9%
Pu
ne
2,60
32,
805
3,52
14,
915
6,52
37,
946
7,49
35,
810
4,94
94,
163
3,86
13,
908
3,84
63,
985
3.6%
3.3%
FIG
UR
E 1
9:
KEY
OP
ERA
TIN
G C
HA
RA
CTE
RIS
TIC
S B
Y M
AJO
R C
ITIE
S –
REV
PAR
(`
)
* Th
e 2
01
4/1
5 d
ata
ha
s b
een
mo
difi
ed t
o e
xclu
de
the
per
form
an
ce o
f ir
rele
vant
su
pp
ly**
Ch
an
ge
in 2
01
5/1
6 e
xpre
ssed
as
per
cent
ag
e o
f th
e fi
gu
re f
or
20
14
/15
� D
elh
i NC
R d
ata
(Sh
ad
ed P
or�
on
) fr
om
19
96
/97
to
20
08
/09
, New
Del
hi (
wit
ho
ut
Gu
rga
on
, NO
IDA
an
d G
rea
ter
NO
IDA
) d
ata
fro
m 2
00
9/1
0 t
o 2
01
5/1
6
Sou
rce:
HV
S R
esea
rch
12-M
on
th**
Ch
ange
Co
mp
ou
nd
edG
row
th19
96/9
719
97/9
819
98/9
919
99/0
020
00/0
120
01/0
220
02/0
320
03/0
420
04/0
520
05/0
620
06/0
720
07/0
820
08/0
920
09/1
020
10/1
120
11/1
220
12/1
320
13/1
420
14/1
5*20
15/1
6
Agr
a94
493
488
465
767
462
060
01,
216
1,72
02,
028
2,77
73,
068
2,79
03,
227
3,75
83,
400
3,60
53,
827
3,98
83,
508
-12.
0%7.
2%
Ah
med
abad
1,76
21,
316
1,28
81,
374
1,52
71,
252
1,16
41,
523
1,90
42,
150
2,39
43,
189
2,90
82,
642
2,32
72,
347
2,09
81,
967
2,02
42,
123
4.9%
1.0%
Ben
galu
ru2,
107
2,11
21,
920
1,94
82,
514
2,40
22,
701
3,79
36,
081
6,72
07,
544
6,41
75,
181
3,50
93,
957
3,56
23,
314
3,10
43,
117
3,59
415
.3%
2.8%
Ch
enn
ai2,
839
2,72
02,
329
2,23
62,
452
1,99
71,
880
2,21
32,
708
3,40
74,
017
4,61
64,
210
3,54
63,
785
3,62
93,
263
2,79
52,
844
2,99
25.
2%0.
3%
New
Del
hi �
2,69
72,
958
2,50
32,
177
2,66
62,
312
2,47
03,
121
4,03
65,
582
7,06
97,
707
6,60
06,
034
5,93
25,
212
4,56
14,
225
4,05
24,
182
3.2%
2.3%
Gu
rgao
n5,
443
5,02
34,
736
3,95
83,
861
3,81
54,
004
4.9%
-5.0
%
NO
IDA
5,54
76,
256
4,16
42,
985
3,19
32,
604
2,68
83.
2%-1
1.4%
Go
a1,
371
1,36
31,
678
1,45
31,
766
1,43
41,
666
1,83
02,
491
3,25
74,
223
4,51
63,
829
3,65
44,
100
4,22
04,
488
4,60
14,
752
5,01
35.
5%7.
1%
Hyd
erab
ad87
987
91,
042
1,14
41,
600
1,64
21,
751
2,10
52,
969
3,99
34,
299
4,12
03,
515
2,74
32,
954
2,71
42,
394
2,35
42,
589
2,72
55.
3%6.
1%
Jaip
ur
1,07
21,
279
1,15
51,
182
1,59
61,
424
1,22
51,
752
2,32
62,
895
3,46
23,
665
3,23
42,
601
2,72
22,
609
2,64
92,
575
2,58
62,
967
14.8
%5.
5%
Ko
lkat
a1,
988
2,44
22,
247
1,94
92,
326
2,26
41,
908
1,89
72,
236
2,97
03,
992
4,85
94,
648
4,10
84,
377
4,23
24,
356
4,03
13,
889
3,89
00.
0%3.
6%
Mu
mb
ai4,
547
4,02
84,
257
3,65
13,
589
2,56
52,
653
3,03
63,
472
4,60
36,
807
8,15
56,
473
5,26
85,
113
5,05
04,
856
4,79
55,
194
5,47
25.
4%1.
0%
Pu
ne
1,84
81,
933
3,04
24,
084
5,44
05,
522
4,66
12,
957
2,31
12,
135
2,24
82,
243
2,35
92,
618
11.0
%2.
7%

PAGE 14 | 2016 HOTELS IN INDIA TRENDS & OPPORTUNITIES
12
-Mo
nth
**C
han
geC
om
po
un
de
dG
row
th1
99
6/9
71
99
7/9
81
99
8/9
91
99
9/0
02
00
0/0
12
00
1/0
22
00
2/0
32
00
3/0
42
00
4/0
52
00
5/0
62
00
6/0
72
00
7/0
82
00
8/0
92
00
9/1
02
01
0/1
12
01
1/1
22
01
2/1
32
01
3/1
42
01
4/1
5*
20
15
/16
Agr
a5
25
65
03
83
53
94
15
36
78
11
08
13
11
16
12
11
37
12
41
12
10
41
06
95
-10
.9%
3.2
%
Ah
me
dab
ad7
65
05
36
26
15
04
55
26
27
08
11
08
10
49
59
48
27
26
26
15
9-3
.1%
-1.3
%
Be
nga
luru
89
95
81
70
80
79
78
10
51
66
19
72
39
24
42
07
13
81
49
13
11
09
89
88
83
-4.9
%-0
.3%
Ch
en
nai
10
01
10
89
79
85
75
67
72
83
98
12
31
58
14
51
20
12
41
15
10
08
37
97
3-7
.0%
-1.6
%
Ne
w D
elh
i �1
13
13
51
11
95
10
19
28
59
31
14
15
52
11
25
92
14
18
51
89
17
01
36
11
41
07
96
-10
.3%
-0.8
%
Gu
rgao
n1
73
16
61
59
12
51
08
10
29
6-6
.0%
-9.3
%
NO
IDA
15
71
70
15
51
23
98
89
81
-8.6
%-1
0.4
%
Go
a6
66
37
36
36
55
75
76
78
91
08
13
31
55
13
71
18
13
31
28
12
01
10
11
21
09
-2.2
%2
.7%
Hyd
era
bad
45
45
39
43
52
51
53
60
84
10
91
37
15
61
37
10
81
14
10
58
97
57
47
2-2
.8%
2.5
%
Jaip
ur
52
68
62
45
65
62
57
65
77
99
12
11
41
13
09
51
04
99
89
78
78
75
-3.4
%1
.9%
Ko
lkat
a1
00
10
98
88
28
27
26
16
67
28
71
21
16
31
46
12
81
41
12
61
12
95
94
87
-6.9
%-0
.7%
Mu
mb
ai1
76
17
01
38
13
01
24
10
48
79
51
07
13
62
00
27
22
33
17
71
80
16
51
39
11
81
18
11
3-4
.2%
-2.3
%
Pu
ne
54
61
78
11
01
50
19
71
63
12
21
09
87
71
64
63
61
-2.6
%1
.0%
Exch
ange
Rat
e3
5.4
36
.34
2.2
43
.54
4.9
47
.24
8.2
46
.04
4.9
44
.54
3.6
40
.24
5.9
47
.74
5.6
48
.05
4.5
60
.76
1.2
65
.0
FIG
UR
E 2
0:
KEY
OP
ERA
TIN
G C
HA
RA
CTE
RIS
TIC
S B
Y M
AJO
R C
ITIE
S –
AV
ERA
GE
RA
TE (
US$
)
* Th
e 2
01
4/1
5 d
ata
ha
s b
een
mo
difi
ed t
o e
xclu
de
the
per
form
an
ce o
f ir
rele
vant
su
pp
ly**
Ch
an
ge
in 2
01
5/1
6 e
xpre
ssed
as
per
cent
ag
e o
f th
e fi
gu
re f
or
20
14
/15
� D
elh
i NC
R d
ata
(Sh
ad
ed P
or�
on
) fr
om
19
96
/97
to
20
08
/09
, New
Del
hi (
wit
ho
ut
Gu
rga
on
, NO
IDA
an
d G
rea
ter
NO
IDA
) d
ata
fro
m 2
00
9/1
0 t
o 2
01
5/1
6
Sou
rce:
HV
S R
esea
rch
12
-Mo
nth
**C
han
geC
om
po
un
de
dG
row
th1
99
6/9
71
99
7/9
81
99
8/9
91
99
9/0
02
00
0/0
12
00
1/0
22
00
2/0
32
00
3/0
42
00
4/0
52
00
5/0
62
00
6/0
72
00
7/0
82
00
8/0
92
00
9/1
02
01
0/1
12
01
1/1
22
01
2/1
32
01
3/1
42
01
4/1
5*
20
15
/16
Agr
a2
72
62
31
51
51
31
32
73
84
56
47
66
16
88
27
16
66
26
55
4-1
7.3
%3
.7%
Ah
me
dab
ad5
03
63
13
13
42
72
43
34
24
85
57
96
45
55
14
93
93
33
33
3-1
.4%
-2.2
%
Be
nga
luru
60
58
48
45
56
51
56
82
13
51
51
17
31
59
11
37
48
77
46
15
15
15
58
.4%
-0.4
%
Ch
en
nai
80
75
58
52
55
42
39
48
61
77
92
11
59
17
48
37
66
04
64
74
6-1
.1%
-2.9
%
Ne
w D
elh
i �7
68
16
05
05
94
95
16
89
01
25
16
21
92
14
41
26
13
01
09
84
70
66
64
-3.0
%-0
.9%
Gu
rgao
n1
14
11
09
97
36
46
26
2-1
.3%
-9.8
%
NO
IDA
11
61
37
87
55
53
43
41
-2.9
%-1
5.8
%
Go
a3
93
74
33
43
93
13
44
05
67
39
71
12
84
77
90
88
82
76
78
77
-0.8
%3
.7%
Hyd
era
bad
25
24
26
26
36
35
37
46
66
89
99
10
27
65
86
55
74
43
94
24
2-1
.0%
2.8
%
Jaip
ur
30
35
28
21
36
30
26
38
52
65
79
91
70
55
60
54
49
42
42
46
7.9
%2
.2%
Ko
lkat
a5
66
75
14
55
24
84
04
15
06
69
11
21
10
18
69
68
88
06
66
46
0-5
.9%
0.4
%
Mu
mb
ai1
28
11
19
38
48
05
45
56
67
71
04
15
62
03
14
11
10
11
21
05
89
79
85
84
-0.9
%-2
.2%
Pu
ne
38
42
67
91
12
51
37
10
16
25
14
54
13
73
94
04
.4%
0.4
%
Exch
ange
Rat
e3
5.4
36
.34
2.2
43
.54
4.9
47
.24
8.2
46
.04
4.9
44
.54
3.6
40
.24
5.9
47
.74
5.6
48
.05
4.5
60
.76
1.2
65
.0
FIG
UR
E 2
1:
KEY
OP
ERA
TIN
G C
HA
RA
CTE
RIS
TIC
S B
Y M
AJO
R C
ITIE
S –
REV
PAR
(U
S$)
* Th
e 2
01
4/1
5 d
ata
ha
s b
een
mo
difi
ed t
o e
xclu
de
the
per
form
an
ce o
f ir
rele
vant
su
pp
ly**
Ch
an
ge
in 2
01
5/1
6 e
xpre
ssed
as
per
cent
ag
e o
f th
e fi
gu
re f
or
20
14
/15
� D
elh
i NC
R d
ata
(Sh
ad
ed P
or�
on
) fr
om
19
96
/97
to
20
08
/09
, New
Del
hi (
wit
ho
ut
Gu
rga
on
, NO
IDA
an
d G
rea
ter
NO
IDA
) d
ata
fro
m 2
00
9/1
0 t
o 2
01
5/1
6
Sou
rce:
HV
S R
esea
rch

of large corporations has systematically brought down ADRs across our hotel markets over the past few years, making it challenging to push the rate back up. Conversely, leisure hotels focus on FIT business that is more discerning in seeking an experience and not just a room at a discount. Increasing purchasing power of the Indian middle class, fuelling their propensity to take more vacations further bodes well for hotels operating in this segment.
Besides, it is not news to many that India in comparison to other Asian countries is a less expensive destination for foreign travelers, particularly for those arriving from the US and Europe. Even as the Indian media paints a picture of exorbitant hotel pricing, our research reveals that a very small percentage of the occupied rooms in India command an ADR that is commensurate to similar hotel markets globally, making the country extremely competitive for inbound leisure travel. However, the abnormally high taxes on room tariffs somewhat changes this for the end user. Thus, we hope that the state and central governments will take steps to rationalize tax policies, encouraging more visitors to the country.
Yet another takeaway is that over three-fourths of the top 25 ADR leaders discussed above are represented by the pre-eminent domestic Indian brands that have traditionally had a stronghold in this segment. We commend their foresight and commitment in defining Indian hospitality. The Taj Group was instrumental in establishing Goa as the leisure destination of choice almost three decades ago, by opening two seminal properties in Sinquerim. In recent years, their partnerships with hotel developers who have developed Taj properties in Coorg, Bekal and Damdama, displays their continued efforts for the creation and growth of leisure locations. The Oberoi group has repeatedly been recognised for establishing global and unparalleled hospitality standards with their Vilas properties. Also worthy of applause are hotels such as JW Marriott Walnut Grove and Alila Diwa Goa, both of which prove the inherent business sense in building hotels and operating in leisure markets. Their success also challenges the deep-rooted assumption held by many that budget and mid market hotels are the only safe investment bet in India. Instead, numbers prove that experience-led leisure hotels can also qualify as a prudent investment strategy.
In conclusion, it is clear that high ADRs do not mean low occupancies. We are more than convinced that the leisure segment in India holds tremendous potential with diverse destinations waiting to be explored. A paradigm shift is necessary, and the time has come.
Authored by Manav ThadaniChairman - Asia Pacific
The Business of Leisure in India
Given the detailed analyses that goes into this report, one of the key benefits is that we are able to slice and dice information and extract trends that deserve timely attention by the industry's stakeholders. This year we challenge an industry paradigm that has since long held us back in exploring new avenues for revenue growth – leisure lacks the ability to make money!
Fact is that a healthy market for leisure hotels exists in India, and here is why – we took a look at the top 25 ADR leaders in the country, and remarkably, 23 of these operate in leisure markets. With an average inventory of 68 keys, this sub-set secured a RevPAR of about `12,600 last year, which is 3.6 times the national average and 2.2 times that achieved by five-star deluxe hotels. Playing the devil's advocate, some of you may suggest that leisure hotels' ADRs are mostly inclusive of breakfast and a few other charges bundled with the room rate. Even so, we are confident that the gap between this sub-set's performance and the rest would remain wide enough to call attention.
52.9%
64.7%63.4%
-
5,000
10,000
15,000
20,000
25,000
-
10.0%
20.0%
30.0%
40.0%
50.0%
60.0%
70.0%
Top 25 ADR Leaders Five-Star Deluxe Nationwide
Average Rate (`) RevPAR (`) Occupancy %
Source: HVS Research
FIGURE 22: ROOMS PERFORMANCE COMPARISON (2015/16 )
2016 HOTELS IN INDIA TRENDS & OPPORTUNITIES | PAGE 15
Now, although ADR is the primary driver of RevPAR in these 25 hotels, the occupancy of 53% in 2015/16 offers strong evidence of a steady demand for such hotels in India. Previously, domestic leisure locations were associated with only high-weekend demand, but this appears to be altering with meetings and conferences, weddings and social functions, corporate off-sites and group travel contributing to room bookings all through the week. The traditional adage that summer and monsoon months are poor is also being challenged with the reduction of gap between peak and non-peak season occupancies across several leisure markets. Another aspect working in favour of leisure demand is that these hotels do not rely on RFPs per se. Business hotels in India are too dependent on the RFP process to sell their room inventory. This, coupled with inexperienced sales professionals negotiating with the procurement managers

market's growth in the recent past. Looking ahead, this area is likely to continue driving business in the city, albeit at a slower pace, as demand from the region is expected to plateau in the short term. The next major impetus to the growth of the twin cities of Ahmedabad and Gandhinagar in the medium-to-long term is likely to be the expansion of Gujarat International Finance Tec-City (GIFT). With state-of-the-art infrastructure and India's first and only International Financial Services Centre (IFSC), GIFT has already attracted major real estate players for the development of office spaces, residences and hotels.
City Trends
Agra is the only city amongst the major hotel markets being tracked in this survey to have recorded a decline (-12%) in its RevPAR in 2015/16 as compared to 2014/15. While the trend appears to be alarming at first sight, a double-digit (16%) increase in supply was the primary cause of this steep fall. During the same period, Agra witnessed a reasonable growth of 7.7% in demand, which somewhat mitigated the brunt of the huge increase in supply. Demand in the city has consistently grown over the last few years especially in the Domestic and MICE segments, bolstered by infrastructure developments such as the Yamuna Expressway and the recently started Gatimaan Express connecting New Delhi and Agra.
Moving forward, infrastructural developments by the state government such as the Tajganj project, Agra-Lucknow Expressway and development of the inner ring road are expected to be completed in the near future. Additionally, planned projects such as the Agra Street Cafe, Agra Heritage Centre, Mughal Museum, Taj Orientation Centre, and a theme park are likely to commence construction shortly. Resultantly, both connectivity to the city and the destination's appeal are anticipated to improve, and we expect tourism to witness sustained expansion, going forward. On the supply front, of the 622 new hotel rooms planned in the city, only 172 are likely to commence operations over the next few years. Thus, with continual infrastructure development and diminishing supply, we believe that the hotel market will gradually improve in the coming years.
Ahmedabad's evolving hotel market witnessed only a marginal increase in occupancy closing at 54.9% in 2015/16, as supply increased by 7.1% with the opening of the 210-room Hyatt Regency. The average rate increased by 3.1% during the same period, largely owing to the changing nature of the hotel market, with organised upscale international brands building a base in the city.
The rapid expansion of industrial areas on the western periphery of Ahmedabad has contributed to the hotel
Aloft Bengaluru Cessna Business Park
On the supply side, Ahmedabad is expected to witness an increase of 1,238 rooms over the next five years with 71% of the inventory actively under construction. As more quality branded hotels enter the market with supply evenly paced, we expect the marketwide performance to continue improving in the coming years.
Bengaluru's hotel market performance surged in 2015/16 with the city exhibiting a 15.3% growth in RevPAR – the highest amongst all major markets analysed in this publication. With branded hotel supply growing at a modest 6.1%, hotels across most micro-markets were able to significantly ramp up occupancy and moderately increase average rate last year. Having one of the highest densities of Grade-A office stock in the country, Bengaluru over the years has consistently witnessed double-digit growth in demand. Average rate growth, however, has been a challenge over the last four years purely on account of new supply growing in
Ramada Plaza Agra
Hyatt Regency Ahmedabad
Shangri - La Hotel Bengaluru
PAGE 16 | 2016 HOTELS IN INDIA TRENDS & OPPORTUNITIES

tandem with demand during that period. Going forth, focus on average rate growth will likely be the strategy adopted by most hotels in the city.
The past year witnessed the addition of hotels like the Shangri-La, which introduced some fresh F&B concepts to the city. Nonetheless, given the significant corporate base in Bengaluru, its world class international airport, and good airline connectivity, HVS still maintains that Bengaluru requires a truly international-grade convention centre to tap into the burgeoning demand from the MICE segment.
Development activity of new hotels also seems to have picked up pace with approximately 67% of 5,209 new hotel rooms proposed over the next five years being actively constructed. While that might seem to be a significant increase in supply, their entry into the market is anticipated to be in a phased manner allowing them to be successfully absorbed by the growing demand in the city. Overall, HVS remains extremely bullish about Bengaluru's performance with steady increase in RevPAR forecasted over the next three to four years.
Chennai continued on the path to resurgence, recording a 5.2% increase in RevPAR in 2015/16. This increase was driven primarily by a 6.4% growth in occupancy, which was moderated slightly by a marginal decrease in average rate (1.1%). Commercial demand (especially in the IT/ITeS sector) along with the emerging Meeting and Conference segment grew across the city last year, even though the floods adversely impacted hotel revenues in the second half of the fiscal.
downward trend since the last three years continued to decline, albeit at a slower pace (1.7%) in 2015/16.
Chennai is expected to see a supply addition of 2,312 rooms over the next five years, with all the developments under active construction. Going forward, OMR, which accounts for more than half of the proposed supply primarily in the mid market and budget segments, will continue to witness pressure on rooms performance while the overall market is expected to augment average rate driven by hotels in Guindy and CBD, as they leverage on their strengthened occupancy.
Goa, the top leisure destination in the country, continued its growth recording a 1.4% increase in occupancy and a 4% increase in average rate in 2015/16. Goa's key performance metrics, including the RevPAR at `5,013, were second only to Mumbai among the top hotel markets in the country. A change in the nature of demand, with charter movements declining over the past two years, has resulted in a notable alteration in the segmentation and trends in business.
Evaluating the performance of various micro-markets, CBD which accounts for more than half of the city's inventory saw an increase in occupancy (4.4%) while average rate witnessed a marginal decline (1.1%). Guindy, which has established itself as the preferred micro-maket driving MICE business in Chennai, having the highest concentration of upscale/luxury hotels with large inventories, recorded a double-digit growth (14.1%) in occupancy while average rate increased only marginally (0.6%). Old Mahabalipuram Road (OMR) also saw a robust increase in occupancy (13.8%) valiantly absorbing the double-digit increase in supply. However, average rate in OMR, which has witnessed a
Hyatt Place Goa Candolim
InterContinental Chennai Mahabalipuram Resort
North Goa, which has historically been dominated by hotels with a relatively smaller key count focusing largely on the youthful leisure traveller, witnessed a surge in domestic FIT demand replacing the peak season international charter movement. This resulted in an overall increase in occupancy (4.2%) as well as average rate (4.9%) for the micro-market in 2015/16. On the other hand, South Goa, characterized by large upscale/luxury resorts, also witnessed an increase in domestic demand, but the bigger impetus came from the rising Meeting and Conference segment. Consequently, although South Goa hotels witnessed a marginal drop in occupancy (1.9%), the average rate continued to increase (4%) last year. More specifically, the rate increase may be attributed to a relatively good yield from the growing wedding segment and windfall gains from the Defense Exposition held in South Goa toward the end of the fiscal. Some of the other emerging trends resulting from a shift in business that hoteliers must be cognizant of include the shorter lengths of stay, reducing lead time for bookings, and increasing contribution from OTAs to advance reservations.
From a supply and demand perspective, Goa is expected to remain an upbeat market offering a vibrant experience to the evolving Indian traveler. The total proposed supply in Goa
2016 HOTELS IN INDIA TRENDS & OPPORTUNITIES | PAGE 17
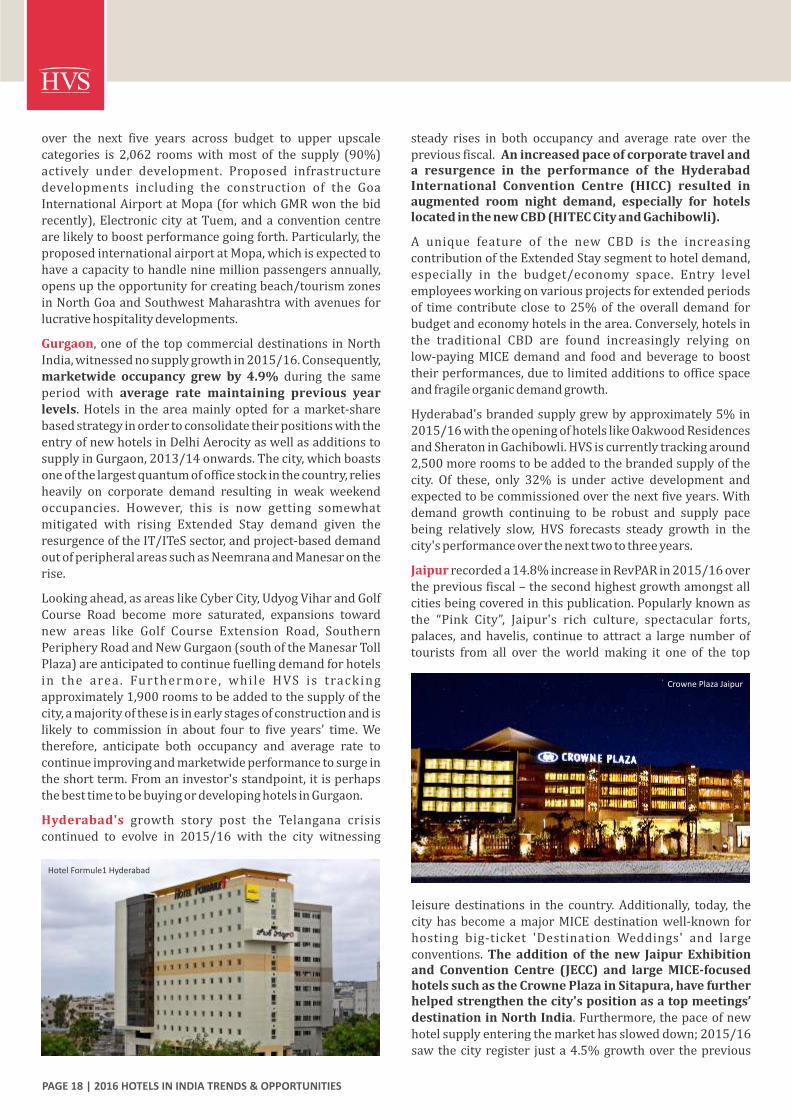
over the next five years across budget to upper upscale categories is 2,062 rooms with most of the supply (90%) actively under development. Proposed infrastructure developments including the construction of the Goa International Airport at Mopa (for which GMR won the bid recently), Electronic city at Tuem, and a convention centre are likely to boost performance going forth. Particularly, the proposed international airport at Mopa, which is expected to have a capacity to handle nine million passengers annually, opens up the opportunity for creating beach/tourism zones in North Goa and Southwest Maharashtra with avenues for lucrative hospitality developments.
Gurgaon, one of the top commercial destinations in North India, witnessed no supply growth in 2015/16. Consequently, marketwide occupancy grew by 4.9% during the same period with average rate maintaining previous year levels. Hotels in the area mainly opted for a market-share based strategy in order to consolidate their positions with the entry of new hotels in Delhi Aerocity as well as additions to supply in Gurgaon, 2013/14 onwards. The city, which boasts one of the largest quantum of office stock in the country, relies heavily on corporate demand resulting in weak weekend occupancies. However, this is now getting somewhat mitigated with rising Extended Stay demand given the resurgence of the IT/ITeS sector, and project-based demand out of peripheral areas such as Neemrana and Manesar on the rise.
Looking ahead, as areas like Cyber City, Udyog Vihar and Golf Course Road become more saturated, expansions toward new areas like Golf Course Extension Road, Southern Periphery Road and New Gurgaon (south of the Manesar Toll Plaza) are anticipated to continue fuelling demand for hotels in the area. Furthermore, while HVS is tracking approximately 1,900 rooms to be added to the supply of the city, a majority of these is in early stages of construction and is likely to commission in about four to five years' time. We therefore, anticipate both occupancy and average rate to continue improving and marketwide performance to surge in the short term. From an investor's standpoint, it is perhaps the best time to be buying or developing hotels in Gurgaon.
Hyderabad's growth story post the Telangana crisis continued to evolve in 2015/16 with the city witnessing
steady rises in both occupancy and average rate over the previous fiscal. An increased pace of corporate travel and a resurgence in the performance of the Hyderabad International Convention Centre (HICC) resulted in augmented room night demand, especially for hotels located in the new CBD (HITEC City and Gachibowli).
A unique feature of the new CBD is the increasing contribution of the Extended Stay segment to hotel demand, especially in the budget/economy space. Entry level employees working on various projects for extended periods of time contribute close to 25% of the overall demand for budget and economy hotels in the area. Conversely, hotels in the traditional CBD are found increasingly relying on low-paying MICE demand and food and beverage to boost their performances, due to limited additions to office space and fragile organic demand growth.
Hyderabad's branded supply grew by approximately 5% in 2015/16 with the opening of hotels like Oakwood Residences and Sheraton in Gachibowli. HVS is currently tracking around 2,500 more rooms to be added to the branded supply of the city. Of these, only 32% is under active development and expected to be commissioned over the next five years. With demand growth continuing to be robust and supply pace being relatively slow, HVS forecasts steady growth in the city's performance over the next two to three years.
Jaipur recorded a 14.8% increase in RevPAR in 2015/16 over the previous fiscal – the second highest growth amongst all cities being covered in this publication. Popularly known as the “Pink City”, Jaipur's rich culture, spectacular forts, palaces, and havelis, continue to attract a large number of tourists from all over the world making it one of the top
Crowne Plaza Jaipur
Hotel Formule1 Hyderabad
leisure destinations in the country. Additionally, today, the city has become a major MICE destination well-known for hosting big-ticket 'Destination Weddings' and large conventions. The addition of the new Jaipur Exhibition and Convention Centre (JECC) and large MICE-focused hotels such as the Crowne Plaza in Sitapura, have further helped strengthen the city's position as a top meetings’ destination in North India. Furthermore, the pace of new hotel supply entering the market has slowed down; 2015/16 saw the city register just a 4.5% growth over the previous
PAGE 18 | 2016 HOTELS IN INDIA TRENDS & OPPORTUNITIES

fiscal - the lowest in five years, leading to an increase in citywide average rate.
With only 960 rooms proposed until 2020/21, of which 89% is currently under active development, HVS anticipates marketwide occupancies and average rate to continue improving over the short-to-medium term. Furthermore, forward looking state initiatives like – “Resurgent Rajasthan” and the addition of new countries to the e-Tourist Visa (e-TV) scheme are anticipated to provide a further fillip to the city's lodging market. Overall, Jaipur seems to have bounced back strongly from its downward spiral over the last few years and the signs are indeed positive for better performances over the next three to five years.
Kolkata's hotels experienced a negligible change in the marketwide average rate (-1%) and occupancy (1.1%) in 2015/16. Successive additions to supply in 2013/14 and 2014/15 have adversely impacted the city's performance; however, the lack of any new entrant in the market in 2015/16 has helped to contain this downward movement.
Historically, supply in the city has remained concentrated in the luxury and upscale space, and going forward as well, we expect this trend to continue. HVS is tracking an estimated 3,200 rooms that are expected to enter the market over the next five years, of which close to 64% is actively under construction.
Demand in the city has steadily expanded over the last few years, and this increment has primarily been noted in the MICE segment. Being India's 'Gateway to the East', Kolkata's connectivity and infrastructure are able to support MICE-driven demand. Events and weddings comprise a large share of demand for the city, and a lucrative opportunity for hotels lies in this segment. Furthermore, upcoming hotels such as the JW Marriott, Westin and ITC Royal Bengal, which are planned to offer extensive meeting and conferencing facilities, are expected to enhance MICE demand in the city by attracting large events and conferences. However, since all these hotels are anticipated to open in the next two-year horizon, it is likely that marketwide performance may come under some duress. On the whole, even as we believe that the hotels in Kolkata are bracing for a rough ride in the short-to-medium term, we expect the city to absorb the additional supply and position itself as a leading destination for MICE in the long term.
In 2015/16, achieved the highest occupancy Mumbai (74.3%) recorded over the past five years amongst the 13 cities tracked in this survey. This continued upward trend in occupancy is testament to the inherent strength and robust nature of demand in the market. Additionally, Mumbai recorded the highest average rate (`7,363) steering it clear as the best performing hotel market in terms of RevPAR too (`5,472). A further dissection of Mumbai's micro-markets, namely South, Central and North Mumbai that have minimal overlap in room night demand, reveals that all three exhibited an increase in occupancy by 7.8%, 9.7% and 0.9%,
Taj Santacruz
respectively in 2015/16, with simultaneous increases in average rate by 2.5%, 8.9%, and 1.3%, respectively. Many factors, such as strong growth in corporate travel, an upswing in MICE demand and the promising growth in Extended Stay segment have favourably impacted the hotel market in India's financial capital.
HVS is currently tracking a proposed addition of approximately 4,200 rooms to the branded supply of the city. Of these only 39% are under active development and expected to be commissioned over the next five years. In the short term, the majority of supply is in the upscale and luxury positioning, which will likely push the citywide ADR up in the coming years.
In the medium-to-long term, we expect the Mumbai International Airport Limited (MIAL) land-side development that includes several new hotels, commercial and retail complexes, and hospitals, to change the face of the city at large. Meanwhile, in the short-to-medium term, we foresee the planned improvements in infrastructure such as the Coastal Road, extension of the Metro and Monorail, coupled with the proposed convention centre in BKC that is expected to augment MICE demand, to assist in improving hotel performances. In fact, the active construction of the Reliance Convention Centre, which is touted to be the largest such space built in India yet, is certain to induce further demand into the market. Notably, HVS has observed that every time Mumbai has done well, most markets across India have followed, and going forward, we forecast steady growth in the city's performance over the next three to five years.
The micro-market continues to be largely Navi Mumbaidependent on budget and mid market hotels. There were approximately 1,000 branded rooms recorded in 2015/16 that achieved an occupancy of 82% at an average rate of `4,034. The healthy increases of 10.7% and 4.6% in occupancy and average rate over the previous fiscal, respectively, were primarily fuelled by demand arising from Reliance Technology Park and commercial developments located in Airoli, Rabale and Mahape.
Increase in supply is expected to be fairly muted in the short-to-medium term, with inventory additions to the city
2016 HOTELS IN INDIA TRENDS & OPPORTUNITIES | PAGE 19

primarily hinging on the development of the new international airport at Panvel, which has already witnessed several delays and is yet to commence construction. Nevertheless, the development of IT parks and commercial offices in areas such as CBD Belapur, and mixed-use developments such as the Seawoods Grand Central are expected to generate some demand for hotels.
Going forward, due to the high dependence of Navi Mumbai's hotels on inconsistent project-related business, as well as easy accessibility to the city from Mumbai and Pune, we anticipate hotels in this market to have little choice but to tap the MICE segment to maintain occupancy levels. Thus, in the short-to-medium term, we expect average rate to come under pressure, even as our long term outlook remains positive.
New Delhi, the largest branded hotel market in the country, witnessed a growth of 8.2% in occupancy in 2015/16 over the last fiscal. This is the highest year-on-year increase recorded in the capital in the last five years. The Aerocity hospitality district has seen an increase in demand in its initial years of operations on account of growth in corporate, transient and MICE demand. Following this trend, we expect these hotels to further add momentum to the growth of room night demand in the city and reach stabilised level of operations within the short term.
The hotel market NOIDA (including Greater NOIDA)remains one of the poorest performing markets amongst the 13 major cities tracked in the survey, displaying a further decline of 2.7% in average rate last year. Hotels in NOIDA witnessed a moderate recovery in occupancy in 2015/16, after the setbacks faced in 2014/15 due to the moving out of large scale events such as the Defense Exposition and PetroTech from the India Expo Centre and Mart (IEM). The positive change in occupancy was primarily on account of commercial demand arising from Sector 18, Sector 62/63 and areas around the NOIDA–Greater NOIDA Expressway, in addition to the large-scale Automobile Exposition (Autoexpo) that was hosted in 2015.
Presently, HVS is tracking 2,561 rooms that are planned to enter the market over the next five years, of which only 9% is actively under construction on account of a majority of hospitality developments either being deferred or put on hold. The hotels currently under construction belong to the budget, mid market and extended stay positioning.
As highlighted in our previous editions of this publication, the future outlook of NOIDA (including Greater NOIDA) continues to remain dim owing to the market’s highly price-sensitive nature along with its dependence on the low-paying MICE segment. Having said that, with the introduction of India's first semi-high-speed train, Gatimaan Express (connecting New Delhi and Agra), the city is expected to witness a favourable impact on overall leisure demand. Looking ahead, even though only limited supply is planned to enter the market, HVS continues to believe occupancy and average rate will remain under pressure considering the increasing demand overlap with neighbouring areas such as Ghaziabad and East Delhi.
The year 2015/16 has been a significant one for the Pune hotel market. The city continued to witness a surge in occupancy (7.1% over 2014/15) and crossed the 65 percent mark. While this provides considerable reason to cheer, a more noteworthy, albeit small change was a year-on-year increase in average rate (3.6% when compared to 2014/15) signaling that the tide has truly turned for the city. Since 2008/09, Pune played host to a staggering growth of around 400% in its room supply, the highest in the country
The drop in average rate of 4.6% for the most part has been on account of Central, South and East Delhi hotels dipping their rate in an attempt to tackle the supply pressure from the Aerocity hotels. Relocation of large scale events such as Defense Exposition and PetroTech, which had a significant impact on demand for hotels in Delhi and NCR to other Indian cities has further had an adverse impact on the average rate.
New Delhi's hotel market is expected to see a supply addition of approximately 2,600 rooms (active supply) over the next two-to-five years, with the majority of supply being in the upscale and mid market positioning. Going forth, the budget and mid market hotels in the Aerocity District will continue to absorb demand from the unbranded/unorganised segment. Robust demand coupled with moderate supply, provides an opportunity to the hotels in the aforementioned micro-markets to concentrate on increasing average rate. Overall, the outlook for the New Delhi market remains positive.
Conrad Pune
PAGE 20 | 2016 HOTELS IN INDIA TRENDS & OPPORTUNITIES
Pullman New Delhi Aerocity

offering various specialty cuisines. However, many of these cities have now seen the proliferation of several standalone setups that are increasingly luring away diners, and therefore, impacting revenues and viabilities of hotel restaurants. Furthermore, with an increasing reliance on MICE, hotels are better suited utilising the extra space consumed by restaurants as meeting venues enabling developers to benefit from better yields per square foot of construction. Conversely, food and beverage outlets at hotels in Tier II and Tier III cities face less competition, as non-hotel F&B offerings in these cities are not as developed and offer limited options to diners.
Closely related to Food and Beverage and the ever growing dependence on MICE at hotels, weddings are grand affairs in India and hotels seem to be cashing in big time from these large-ticket size events. While the concept of Destination Weddings is not new, its evolvement over the years is an interesting trend. The Exotic Wedding Planning Conference 2016 held in Goa recently points to the growing demand for Wedding destinations in the country. The Wedding Planning Industry – a little known business concept in the past, has now gained immense popularity, wherein planners not only benefit from fees earned through their clients, but also commissions from hotels and other vendors. 'Big Fat Indian Weddings' are especially common among dollar paying non-resident Indians (NRI) who book luxury resorts in cities like Udaipur, Goa, and Jaipur for these larger than life affairs. There is reason for developers and brands to consider providing space for such concepts centred around weddings, especially in certain locations in North India. For the most part, these events are recession-proof and also help cushion softer shoulder periods during the year.
amongst major hotel markets, resulting in a successive annual downward spiral in both occupancy and average rate performance. During this period, the country underwent an economic downturn weakening the expansion in the city's Manufacturing sector, a key source of demand for Pune's hotels. Due to these reasons, in the last few years, many referred to Pune as a “tough” hotel market. However, contrary to common belief, the city’s hotels have witnessed a sturdy double-digit growth in demand every year. In fact, the manner in which Pune has persevered relentlessly, is not only a testament to its strength and resilience, but also indicates its potential going forth. Furthermore, along with serving as a major manufacturing and IT/ITeS hub in the country, Pune has come to be known as an attractive MICE destination.
Going forward, we are tracking 1,965 new rooms of which 1,430 (including the recently opened Conrad) are actively under development. Considering the deceleration in new supply, coupled with the anticipated sustained growth in demand, we believe that the city's hotel market is geared to move full steam ahead in the coming years.
Future Trends & Opportunities
The competitive landscape within the hospitality industry across the world and especially in India has never been as dynamic as it is today. Below we touch upon some key trends and opportunities that are setting the tone for the future of our industry.
Mergers and acquisitions have been part and parcel of business the world over and usually driven by a necessity to consolidate. However, historically, there have been few such activities that have substantially impacted the hospitality industry as a whole, until Marriott International recently announced the acquisition of Starwood Hotels and Resorts Worldwide. This will make Marriott the biggest hotel company in the world, with over 1.1 million rooms under its umbrella. For India, after over a century, Taj Hotels Resorts and Palaces' preeminent position as the largest hotel chain in the country will be surpassed. Other deals of note that were signed or are in the process of being finalised include AccorHotels acquir ing Fairmont Raf f les Hotels International (FRHI), and two Chinese conglomerates HNA and Jin Jiang acquiring Carlson Rezidor and Louvre Hotels Group, respectively. Mergers are intended to put hotel brands in a stronger position to negotiate management agreements, gain access to a significantly higher base of loyalty members, flex a stronger distribution muscle, capitalise on a larger marketing footprint and mitigate operating costs across geographies.
Another emerging trend is the reduced focus on Food and Beverage (specifically restaurants) offerings in newly constructed upscale and upper-upscale hotels . Traditionally, full-service hotels, especially in larger Tier I cities, have been embellished with multiple restaurants
As some Tier I markets reach moderate levels of supply-saturation, hotel brands are increasingly employing the conversion route as a means of expansion. Interestingly, this may present an opportunity for both hotel developers and hotel brands to expand their footprint in Tier II and Tier III cities. With land costs being relatively more affordable, and connectivity improvements (both by land and air), these locations are becoming more desirable for
2016 HOTELS IN INDIA TRENDS & OPPORTUNITIES | PAGE 21
Fairmont Jaipur

of their contribution to the overall development of the
company are some of the models brands are employing to
retain talent at their hotels. A testament to these changing
times is the repeated inclusion of major hotel brands in the
'Top 100 places to Work' surveys in the past few years.
Another notable trend is the surge of hotel aggregators
that is beginning to have an effect on the branded hotels in
the budget and economy space, fuelled primarily by the
pricing strategy being employed by the former. OYO Rooms
and Airbnb, coupled with a few other players who are also
ramping up, it is likely that over 1,00,000 rooms exist in this
new lodging dimension already. The cascading effects of
their almost drastic average rate strategy further catalyses
the rate problem. However, the bigger predicament is the
insistence of hotel brands to not see them as a competition
and the resulting vacuum in strategy to tackle the price war.
While traditional hotel brands certainly offer a higher
standard in consistency and quality of product, ignoring
this set of competition can cost some hotels in particular
and impact their bottom lines.
Lastly, as the hotel transactions environment has started
to pick up pace in recent months, it is timely that we call
attention to the fact that over US$200 million worth of
assets traded hands last year. Rationalisation in sell-side
asks coupled with infusion of institutional equity on the
buy-side are both signs of a maturing deal-making universe.
We do not harbour any false pretence that India will see
hundreds of trades in the future, and are simply asserting
that fairly priced transactions are on the cards now, more
than ever before. HVS is taking this opportunity seriously
and we have now built a team around Investment Advisory
in India with the focused purpose of offering solutions to
active players in the hotel transaction space.
In addition to the various trends and opportunities
discussed above, a small note reminding all of us of the
ongoing threat of violence, terrorism and its immediate
impact on our sector is in order. Keeping our hotels safe and
secure is already top-priority for all the brands and we view
their efforts on this front as a necessity that must continue
to stay a primary focus at all times.
hotel development. Demand is indeed growing in smaller markets and the first mover's advantage may be sought with the right advice.
PAGE 22 | 2016 HOTELS IN INDIA TRENDS & OPPORTUNITIES
In Closing
India's hotel sector has now unequivocally entered the next
up-cycle. Prudent, measured, yet assertive decision making
by the industry's stakeholders is now required. The only
thing worse than a bad decision is taking no decision! We
conclude this year's report with the hope that hotel owners,
operators, lenders and advisors will all jointly appreciate
the opportunity ahead and make decisive plans to capitalise
on it.
Hotels, like any other sector, are increasingly influenced by
the needs and wants of the 'Gen Y' demographic. Both guests
as well as hotel employees of this young generation are very
different from previous generations. Indeed, they form a
part of an ever-growing digital community, constantly
driven by technology and social media. The smart phone is
integral to everyone's lives and decisions are frequently
online content driven, seeking advice and opinions from
online websites and applications. While we have focused on
Social Media as an emerging trend in our previous
publications, this medium is constantly evolving and it is
important for the hotel industry to regularly update itself.
Google Adwords, Facebook, and Twitter – all powerful tools
– all already passe. New platforms such as Snapchat,
Instagram and YouTube are making digital content more
interactive and innovative, and consequently far easier and
quicker for users to react and discuss their experiences in
large online forums. It is therefore, very crucial for hotel
chains to adapt quickly and effectively manage their online
presence and brand image.
The ‘Gen Y’ employee forms an influential portion of the
hotel’s workforce today. This generation is more impatient,
quick to lose focus and easily distracted, largely due to the
sheer number of opportunities that present themselves to
this audience in the hyper-connected global environment.
Employee Retention is thus a challenge; however,
development and implementation of effective recruitment
and retention plans can help brands embrace the strengths
of new age employees. Long work hours and minimal work-
life balance (traditional characteristics of the hotel
operations) are one of the primary reasons for diminishing
interest of the new generation in the hotel industry. Several
hotel brands are, therefore, offering shorter work-weeks,
controlled/compulsory leave plans, and significantly better
benefits and pay packages. Furthermore, realistic
promotion goals, well-defined career paths and recognition
Le Méridien Nagpur

2017
For participation, please write to [email protected] OR log on to www.HICSAconference.com
BLOCK YOUR DATES | 5-6 April, 2017
2016 SPONSORS
2017 NOTABLE SPEAKERS
Ashish Jakhanwala, Chief Executive Officer, SAMHI
Chris Nassetta, President & CEO, Hilton Worldwide
President & CEO, World Travel & Tourism CouncilDavid Scowsill,
President, The Oberoi GroupKapil Chopra,
Mark Hoplamazian, President & CEO, Hyatt Hotels Corporation
Chairman & CEO - APAC, AccorHotelsMichael Issenberg,
Managing Director & CEO, Taj Hotels Resorts & PalacesRakesh Sarna,
Founder, HVSSteve Rushmore,
13 HOTEL INVESTMENT CONFERENCE - SOUTH ASIA (HICSA) 2017TH
GRAND HYATT MUMBAI
OFFICIAL STATE PARTNER
HOSTED BY
IndiaIndia

HVS.com HVS | 2nd Floor, Paras Downtown Centre, Golf Course Road, Sector 53, Gurgaon 122 002, INDIA
About HVSHVS, the world's leading consulting and services organisation focused on the hotel, mixed-use, shared ownership, gaming, and leisure industries, celebrated its 35�� anniversary last year. Established in 1980, the company performs 4,500+ assignments each year for hotel and real estate owners, operators, and developers worldwide. HVS principals are regarded as the leading experts in their respective regions of the globe. Through a network of more than 40 offices and more than 350 professionals, HVS provides an unparalleled range of complementary services for the hospitality industry. HVS.com
Superior Results through Unrivalled Hospitality Intelligence.
Everywhere.
Over the last decade, division has HVS South Asia’s Consulting and Valuationestablished itself as the market leader, expanding its services to include a wide range of consulting activities, all geared to enhance economic returns and asset value for our clients.
The Consulting and Valuation team comprises of highly experienced industry professionals offering the utmost level of expertise and credibility. Our consultants understand the hotel business and have received qualifications from leading hospitality schools across the world, while also possessing actual hotel operating experience.
As part of our Consulting and Valuation services, we offer the following:
• Valuations (Single Asset and Portfolio)
• Market Studies
• Feasibility Studies and Return-on-Investment Analyses
• Operator Selection and Management Contract Negotiations
• Market Entry Strategy Studies
• Operating Budget Reviews
• Asset Management
HVS South Asia plays host to the annual Hotel Investment Conference - South Asia (HICSA), the leading hotel investment conference in the region and Hotel Operations Summit India (HOSI), the only dedicated forum for hotel operational leaders of today and tomorrow. HVS South Asia also hosted its inaugural Tourism, Hotel Investment & Networking Conference (THINC) Sri Lanka in February 2016.
About the Authors
Diksha Chopra joined HVS in 2015 as an Analyst in the Consulting and Valuation d i v i s i o n . S h e h o l d s a Bachelor of Arts (Hons.) in Hospitality Management
from the Institute of Hotel Management, Aurangabad (University of Huddersfield, UK). Prior to joining HVS, she gained h o t e l o p e r a t i o n s a n d R e v e n u e Management experience by working with The Oberoi Hotels & Resorts.
For further information please contact [email protected] [email protected] or
A c h i n K h a n n a i s t h e M a n a g i n g D i r e c t o r o f Consulting and Valuation at HVS South Asia . He is a M e m b e r o f t h e R o y a l Inst i tut ion of Chartered Surveyors (MRICS). Over the
past nine years at HVS, Achin has directed a large number of assignments, performed economic feasibility analyses and large scale portfolio valuations, successfully conducted operator searches and management contract negotiations. He has extensive experience in conducting hotel valuations, both in India and internationally. Prior to joining HVS, Achin spent ten years in the United States working across various roles in hotel operations, revenue management, franchise relations and business development. Achin holds a Bachelor of Science in Hospitality Management from Widener University, Chester, PA, and a MBA from the University of Phoenix, Arizona, USA.
Notable contributions were made by Anirudh Katre, Pooja Goel, Karan Sahani, Rishabh Thapar, Hemangi Bhandari, Shunit Roy and Sanaya Jijina of the Consulting and Valuation team.
Editing support was provided by Juie S. Mobar and overall guidance and direction was offered by Manav Thadani.